Starting on January 19, 2025 Facebook’s internal policy makers
decided that Linux is malware and labeled groups associated with
Linux as being “cybersecurity threats”. Any posts mentioning
DistroWatch and multiple groups associated with Linux and Linux
discussions have either been shut down or had many of their posts
removed.
We’ve been hearing all week from readers who say they can no longer
post about Linux on Facebook or share links to DistroWatch. Some
people have reported their accounts have been locked or limited for
posting about Linux.
One can only hope that this is a mistake that will be resolved soon.
The Go language is designed to make it
easy for developers to import other
Go packages and compile everything into a static binary
for simple distribution. Unfortunately, this complicates things for
those who package Go programs for Linux distributions, such as Fedora,
that have guidelines which require dependencies to be packaged
separately. Fedora’s Go special interest
group (SIG) is asking for relief and a loosening of the bundling
guidelines to allow Go packagers to bundle dependencies into the
packages that need them, otherwise known as vendoring. So far, the
participants in the discussion have seemed largely in favor of the
idea.
Cloudflare’s network provides an enormous array of services to our customers. We collect and deliver associated data to customers in the form of event logs and aggregated analytics. As of December 2024, our data pipeline is ingesting up to 706M events per second generated by Cloudflare’s services, and that represents 100x growth since our 2018 data pipeline blog post.
At peak, we are moving 107 GiB/s of compressed data, either pushing it directly to customers or subjecting it to additional queueing and batching.
All of these data streams power things like Logs, Analytics, and billing, as well as other products, such as training machine learning models for bot detection. This blog post is focused on techniques we use to efficiently and accurately deal with the high volume of data we ingest for our Analytics products. A previous blog post provides a deeper dive into the data pipeline for Logs.
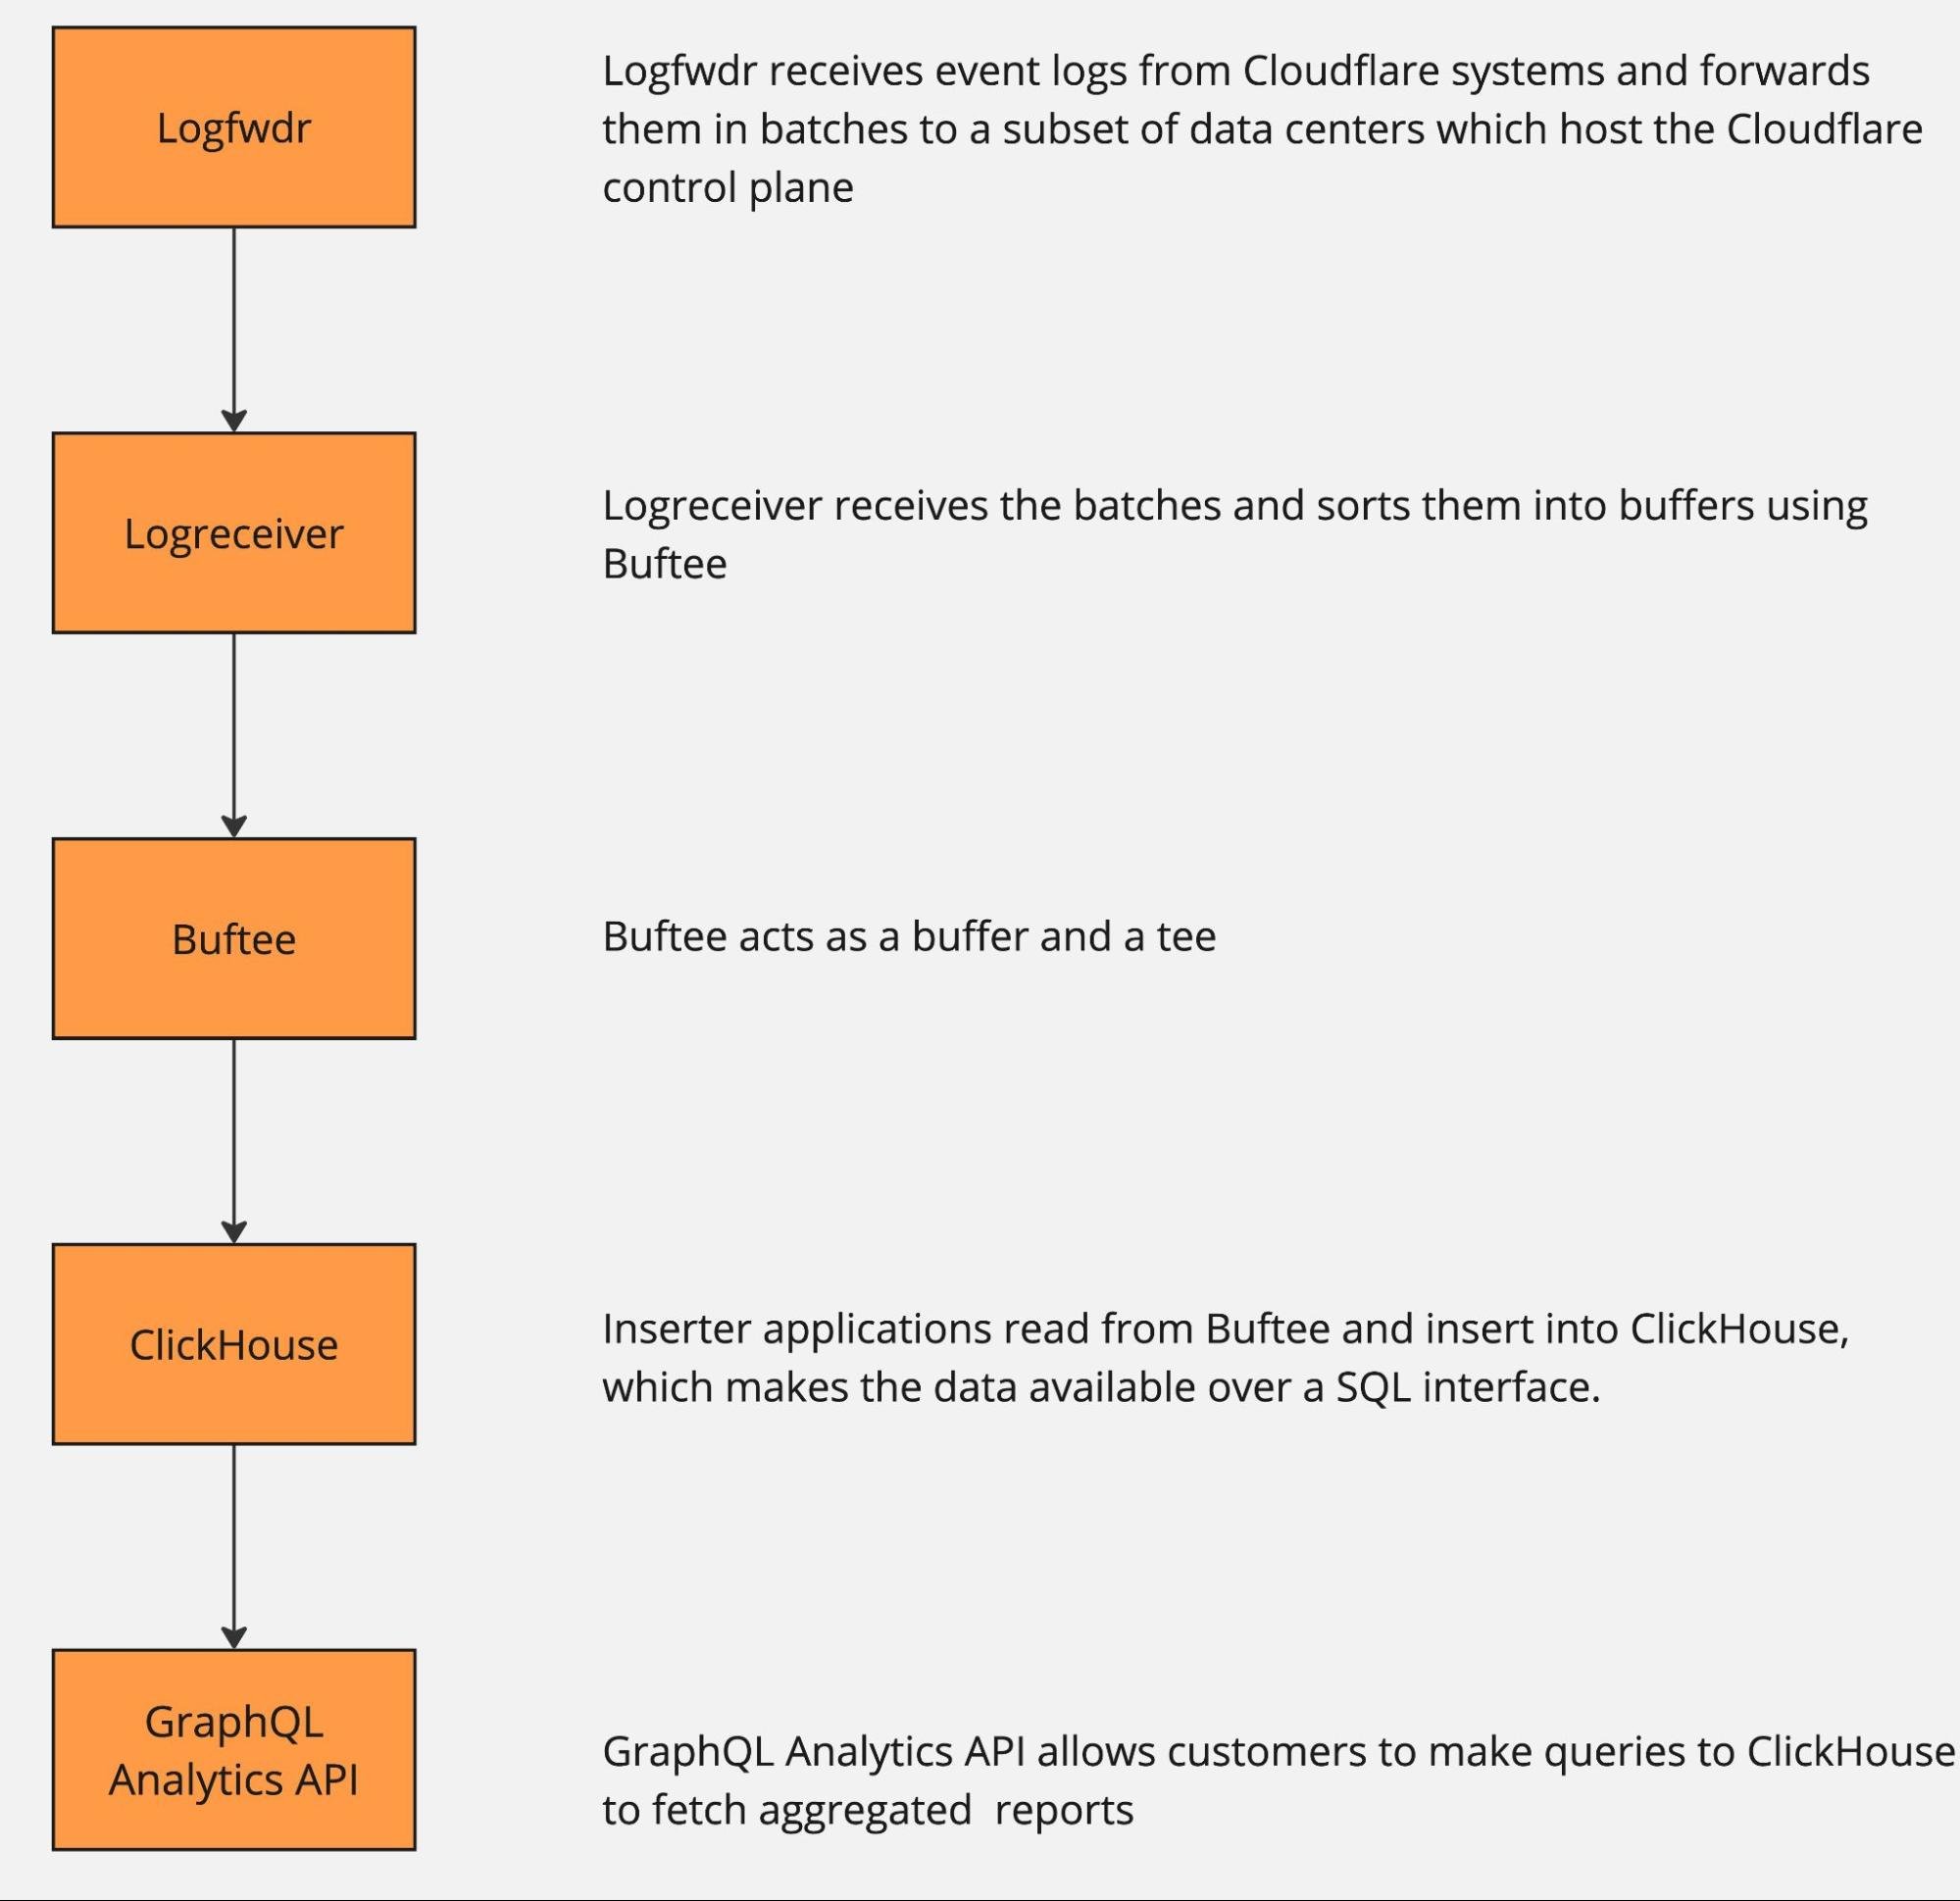
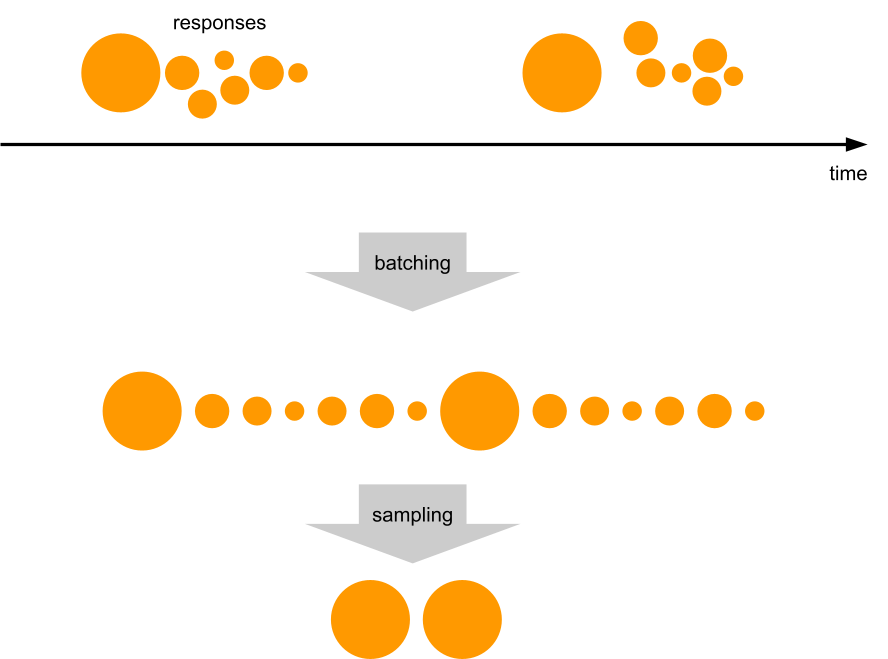
The pipeline can be roughly described by the following diagram.
The data pipeline has multiple stages, and each can and will naturally break or slow down because of hardware failures or misconfiguration. And when that happens, there is just too much data to be able to buffer it all for very long. Eventually some will get dropped, causing gaps in analytics and a degraded product experience unless proper mitigations are in place.
Dropping data to retain information
How does one retain valuable information from more than half a billion events per second, when some must be dropped? Drop it in a controlled way, by downsampling.
Here is a visual analogy showing the difference between uncontrolled data loss and downsampling. In both cases the same number of pixels were delivered. One is a higher resolution view of just a small portion of a popular painting, while the other shows the full painting, albeit blurry and highly pixelated.
As we noted above, any point in the pipeline can fail, so we want the ability to downsample at any point as needed. Some services proactively downsample data at the source before it even hits Logfwdr. This makes the information extracted from that data a little bit blurry, but much more useful than what otherwise would be delivered: random chunks of the original with gaps in between, or even nothing at all. The amount of “blur” is outside our control (we make our best effort to deliver full data), but there is a robust way to estimate it, as discussed in the next section.
Logfwdr can decide to downsample data sitting in the buffer when it overflows. Logfwdr handles many data streams at once, so we need to prioritize them by assigning each data stream a weight and then applying max-min fairness to better utilize the buffer. It allows each data stream to store as much as it needs, as long as the whole buffer is not saturated. Once it is saturated, streams divide it fairly according to their weighted size.
In our implementation (Go), each data stream is driven by a goroutine, and they cooperate via channels. They consult a single tracker object every time they allocate and deallocate memory. The tracker uses a max-heap to always know who the heaviest participant is and what the total usage is. Whenever the total usage goes over the limit, the tracker repeatedly sends the “please shed some load” signal to the heaviest participant, until the usage is again under the limit.
The effect of this is that healthy streams, which buffer a tiny amount, allocate whatever they need without losses. But any lagging streams split the remaining memory allowance fairly.
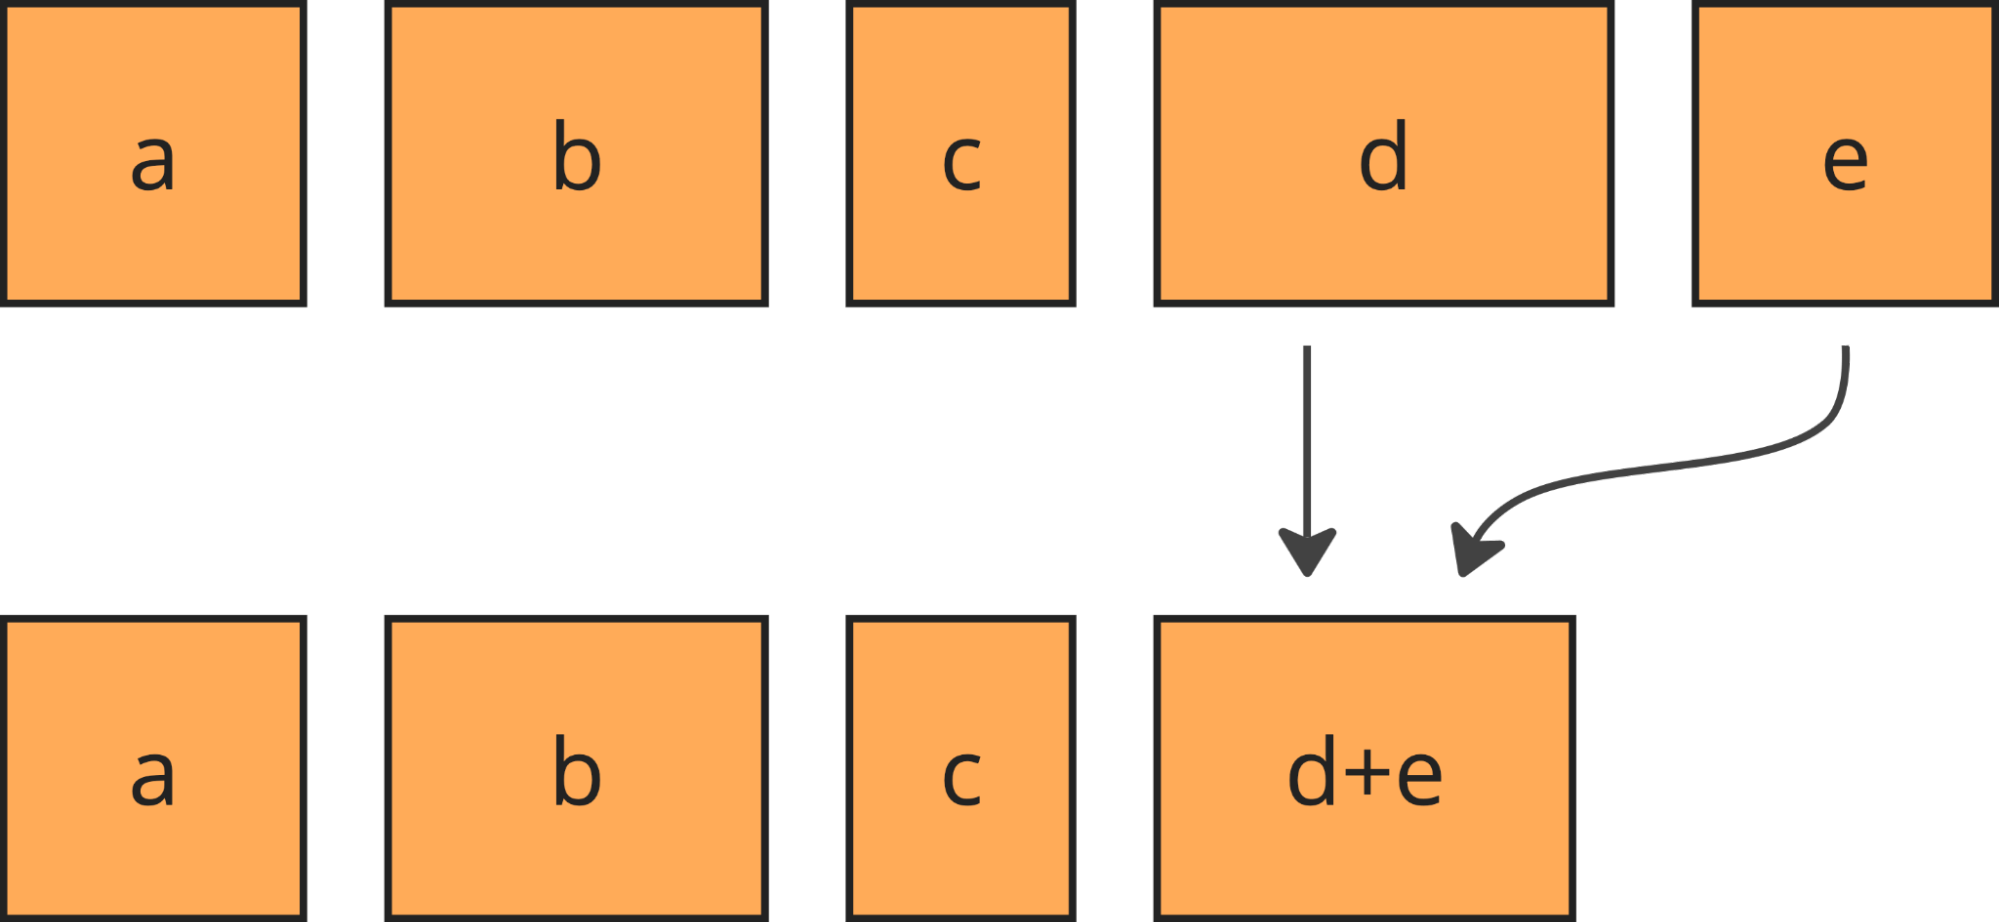
We downsample more or less uniformly, by always taking some of the least downsampled batches from the buffer (using min-heap to find those) and merging them together upon downsampling.
Merging keeps the batches roughly the same size and their number under control.
Downsampling is cheap, but since data in the buffer is compressed, it causes recompression, which is the single most expensive thing we do to the data. But using extra CPU time is the last thing you want to do when the system is under heavy load! We compensate for the recompression costs by starting to downsample the fresh data as well (before it gets compressed for the first time) whenever the stream is in the “shed the load” state.
We called this approach “bottomless buffers”, because you can squeeze effectively infinite amounts of data in there, and it will just automatically be thinned out. Bottomless buffers resemble reservoir sampling, where the buffer is the reservoir and the population comes as the input stream. But there are some differences. First is that in our pipeline the input stream of data never ends, while reservoir sampling assumes it ends to finalize the sample. Secondly, the resulting sample also never ends.
Let’s look at the next stage in the pipeline: Logreceiver. It sits in front of a distributed queue. The purpose of logreceiver is to partition each stream of data by a key that makes it easier for Logpush, Analytics inserters, or some other process to consume.
Logreceiver proactively performs adaptive sampling of analytics. This improves the accuracy of analytics for small customers (receiving on the order of 10 events per day), while more aggressively downsampling large customers (millions of events per second). Logreceiver then pushes the same data at multiple resolutions (100%, 10%, 1%, etc.) into different topics in the distributed queue. This allows it to keep pushing something rather than nothing when the queue is overloaded, by just skipping writing the high-resolution samples of data.
The same goes for Inserters: they can skip reading or writing high-resolution data. The Analytics APIs can skip reading high resolution data. The analytical database might be unable to read high resolution data because of overload or degraded cluster state or because there is just too much to read (very wide time range or very large customer). Adaptively dropping to lower resolutions allows the APIs to return some results in all of those cases.
Extracting value from downsampled data
Okay, we have some downsampled data in the analytical database. It looks like the original data, but with some rows missing. How do we make sense of it? How do we know if the results can be trusted?
Let’s look at the math.
Since the amount of sampling can vary over time and between nodes in the distributed system, we need to store this information along with the data. With each event $x_i$ we store its sample interval, which is the reciprocal to its inclusion probability $\pi_i = \frac{1}{\text{sample interval}}$. For example, if we sample 1 in every 1,000 events, each of the events included in the resulting sample will have its $\pi_i = 0.001$, so the sample interval will be 1,000. When we further downsample that batch of data, the inclusion probabilities (and the sample intervals) multiply together: a 1 in 1,000 sample from a 1 in 1,000 sample is a 1 in 1,000,000 sample of the original population. The sample interval of an event can also be interpreted roughly as the number of original events that this event represents, so in the literature it is known as weight $w_i = \frac{1}{\pi_i}$.
We rely on the Horvitz-Thompson estimator (HT, paper) in order to derive analytics about $x_i$. It gives two estimates: the analytical estimate (e.g. the population total or size) and the estimate of the variance of that estimate. The latter enables us to figure out how accurate the results are by building confidence intervals. They define ranges that cover the true value with a given probability (confidence level). A typical confidence level is 0.95, at which a confidence interval (a, b) tells that you can be 95% sure the true SUM or COUNT is between a and b.
So far, we know how to use the HT estimator for doing SUM, COUNT, and AVG.
Given a sample of size $n$, consisting of values $x_i$ and their inclusion probabilities $\pi_i$, the HT estimator for the population total (i.e. SUM) would be
where $\pi_{ij}$ is the probability of both $i$-th and $j$-th events being sampled together.
We use Poisson sampling, where each event is subjected to an independent Bernoulli trial (“coin toss”) which determines whether the event becomes part of the sample. Since each trial is independent, we can equate $\pi_{ij} = \pi_i \pi_j$, which when plugged in the variance estimator above turns the right-hand sum to zero:
if we could, but the original population size $N$ is not known, it is not stored anywhere, and it is not even possible to store because of custom filtering at query time. Plugging $\widehat{C}$ instead of $N$ only partially works. It gives a valid estimator for the mean itself, but not for its variance, so the constructed confidence intervals are unusable.
In all cases the corresponding pair of estimates are used as the $\mu$ and $\sigma^2$ of the normal distribution (because of the central limit theorem), and then the bounds for the confidence interval (of confidence level ) are:
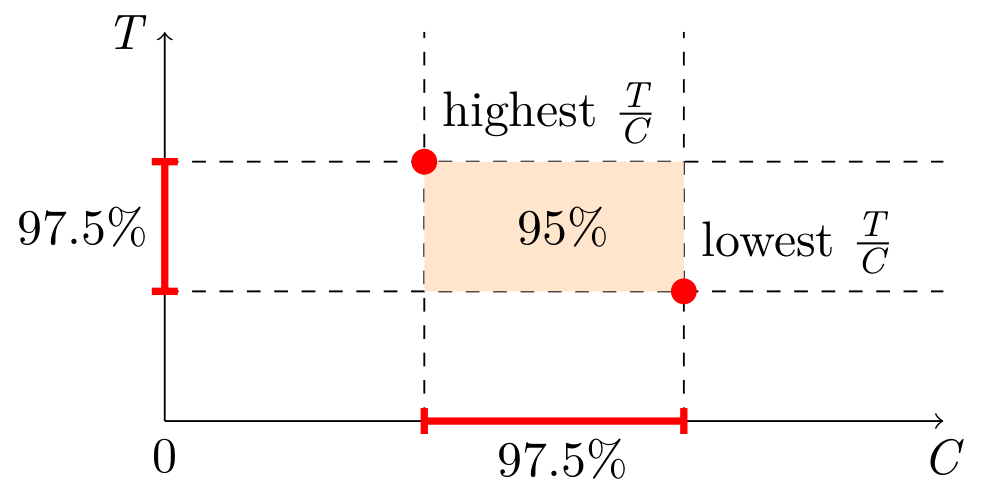
We do not know the N, but there is a workaround: simultaneous confidence intervals. Construct confidence intervals for SUM and COUNT independently, and then combine them into a confidence interval for AVG. This is known as the Bonferroni method. It requires generating wider (half the “inconfidence”) intervals for SUM and COUNT. Here is a simplified visual representation, but the actual estimator will have to take into account the possibility of the orange area going below zero.
In SQL, the estimators and confidence intervals look like this:
WITH sum(x * _sample_interval)                              AS t,
     sum(x * x * _sample_interval * (_sample_interval - 1)) AS vt,
     sum(_sample_interval)                                  AS c,
     sum(_sample_interval * (_sample_interval - 1))         AS vc,
     -- ClickHouse does not expose the erf⁻¹ function, so we precompute some magic numbers,
     -- (only for 95% confidence, will be different otherwise):
     --   1.959963984540054 = Φ⁻¹((1+0.950)/2) = √2 * erf⁻¹(0.950)
     --   2.241402727604945 = Φ⁻¹((1+0.975)/2) = √2 * erf⁻¹(0.975)
     1.959963984540054 * sqrt(vt) AS err950_t,
     1.959963984540054 * sqrt(vc) AS err950_c,
     2.241402727604945 * sqrt(vt) AS err975_t,
     2.241402727604945 * sqrt(vc) AS err975_c
SELECT t - err950_t AS lo_total,
       t            AS est_total,
       t + err950_t AS hi_total,
       c - err950_c AS lo_count,
       c            AS est_count,
       c + err950_c AS hi_count,
       (t - err975_t) / (c + err975_c) AS lo_average,
       t / c                           AS est_average,
       (t + err975_t) / (c - err975_c) AS hi_average
FROM ...
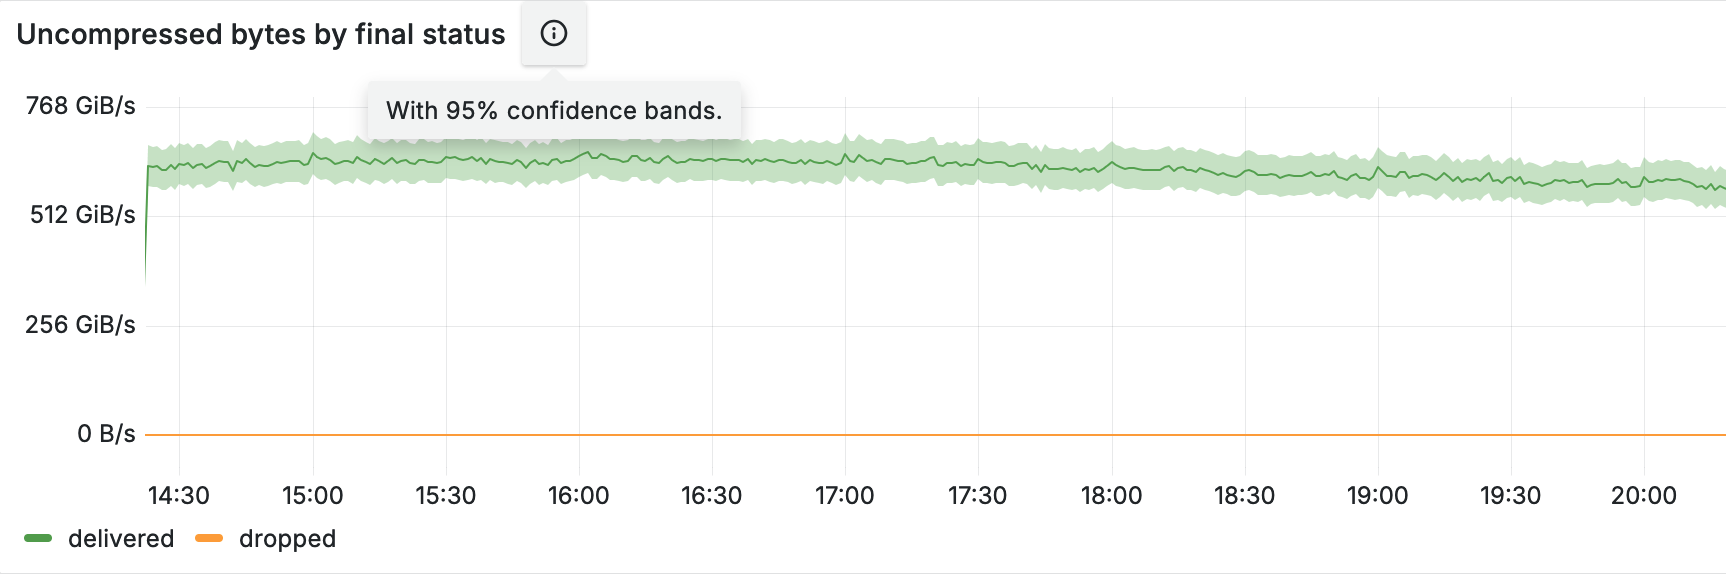
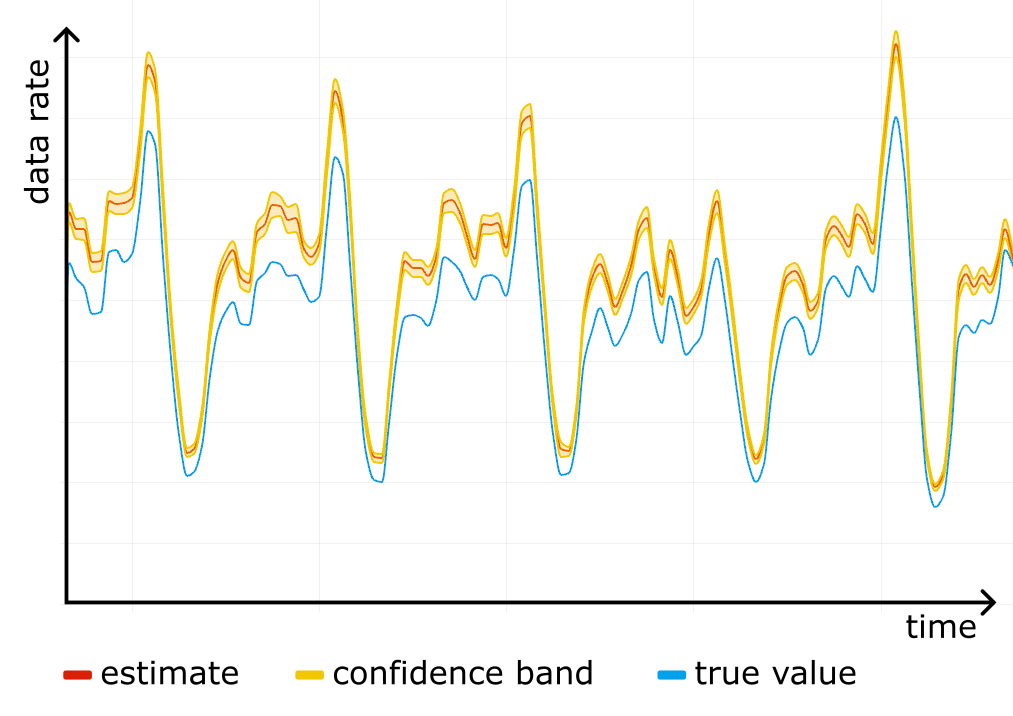
Construct a confidence interval for each timeslot on the timeseries, and you get a confidence band, clearly showing the accuracy of the analytics. The figure below shows an example of such a band in shading around the line.
Sampling is easy to screw up
We started using confidence bands on our internal dashboards, and after a while noticed something scary: a systematic error! For one particular website the “total bytes served” estimate was higher than the true control value obtained from rollups, and the confidence bands were way off. See the figure below, where the true value (blue line) is outside the yellow confidence band at all times.
We checked the stored data for corruption, it was fine. We checked the math in the queries, it was fine. It was only after reading through the source code for all of the systems responsible for sampling that we found a candidate for the root cause.
We used simple random sampling everywhere, basically “tossing a coin” for each event, but in Logreceiver sampling was done differently. Instead of sampling randomly it would perform systematic sampling by picking events at equal intervals starting from the first one in the batch.
Why would that be a problem?
There are two reasons. The first is that we can no longer claim $\pi_{ij} = \pi_i \pi_j$, so the simplified variance estimator stops working and confidence intervals cannot be trusted. But even worse, the estimator for the total becomes biased. To understand why exactly, we wrote a short repro code in Python:
import itertools

def take_every(src, period):
    for i, x in enumerate(src):
    if i % period == 0:
        yield x

pattern = [10, 1, 1, 1, 1, 1]
sample_interval = 10 # bad if it has common factors with len(pattern)
true_mean = sum(pattern) / len(pattern)

orig = itertools.cycle(pattern)
sample_size = 10000
sample = itertools.islice(take_every(orig, sample_interval), sample_size)

sample_mean = sum(sample) / sample_size

print(f"{true_mean=} {sample_mean=}")
After playing with different values for pattern and sample_interval in the code above, we realized where the bias was coming from.
Imagine a person opening a huge generated HTML page with many small/cached resources, such as icons. The first response will be big, immediately followed by a burst of small responses. If the website is not visited that much, responses will tend to end up all together at the start of a batch in Logfwdr. Logreceiver does not cut batches, only concatenates them. The first response remains first, so it always gets picked and skews the estimate up.
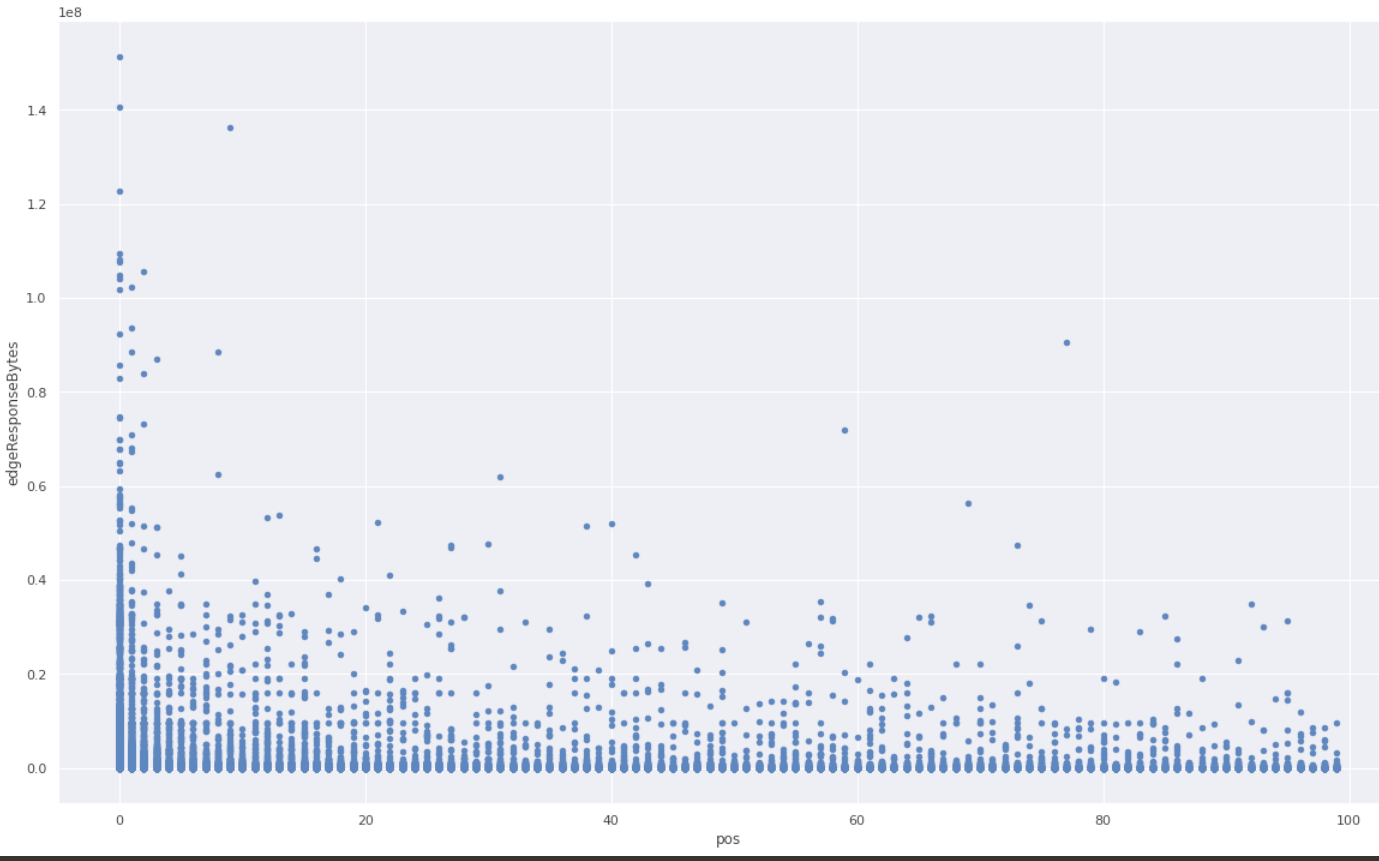
We checked the hypothesis against the raw unsampled data that we happened to have because that particular website was also using one of the Logs products. We took all events in a given time range, and grouped them by cutting at gaps of at least one minute. In each group, we ranked all events by time and looked at the variable of interest (response size in bytes), and put it on a scatter plot against the rank inside the group.
A clear pattern! The first response is much more likely to be larger than average.
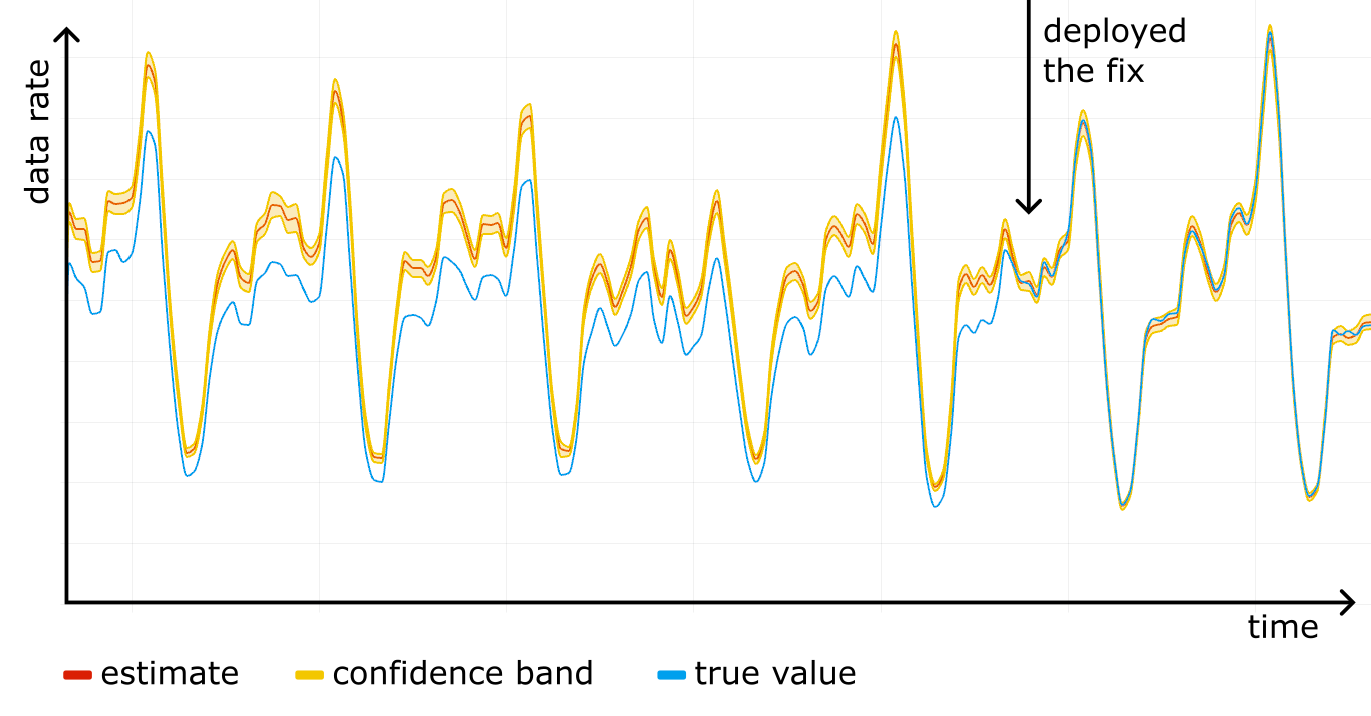
We fixed the issue by making Logreceiver shuffle the data before sampling. As we rolled out the fix, the estimation and the true value converged.
Now, after battle testing it for a while, we are confident the HT estimator is implemented properly and we are using the correct sampling process.
Using Cloudflare’s analytics APIs to query sampled data
We already power most of our analytics datasets with sampled data. For example, the Workers Analytics Engine exposes the sample interval in SQL, allowing our customers to build their own dashboards with confidence bands. In the GraphQL API, all of the data nodes that have “Adaptive” in their name are based on sampled data, and the sample interval is exposed as a field there as well, though it is not possible to build confidence intervals from that alone. We are working on exposing confidence intervals in the GraphQL API, and as an experiment have added them to the count and edgeResponseBytes (sum) fields on the httpRequestsAdaptiveGroups nodes. This is available under confidence(level: X).
The query above asks for the estimates and the 95% confidence intervals for SUM(edgeResponseBytes) and COUNT. The results will also show the sample size, which is good to know, as we rely on the central limit theorem to build the confidence intervals, thus small samples don’t work very well.
The response shows the estimated count is 96947, and we are 95% confident that the true count lies in the range 96874.24 to 97019.76. Similarly, the estimate and range for the sum of response bytes are provided.
The estimates are based on a sample size of 96294 rows, which is plenty of samples to calculate good confidence intervals.
Conclusion
We have discussed what kept our data pipeline scalable and resilient despite doubling in size every 1.5 years, how the math works, and how it is easy to mess up. We are constantly working on better ways to keep the data pipeline, and the products based on it, useful to our customers. If you are interested in doing things like that and want to help us build a better Internet, check out our careers page.
The ransomware landscape in 2024 continued to evolve at a rapid pace, outgrowing many of the trends we saw in 2023. Threat actors remained relentless and innovative, targeting organizations of all sizes and sectors. In this post, we’ll examine the latest data points, discuss notable groups, and estimate the potential impact on victims — helping security teams plan their defenses for the months ahead.
2024 by the Numbers
Mid last year, Rapid7 Labs released our Ransomware Radar Report highlighting key stats for the first half of 2024. Here is how 2024 played out as a whole:
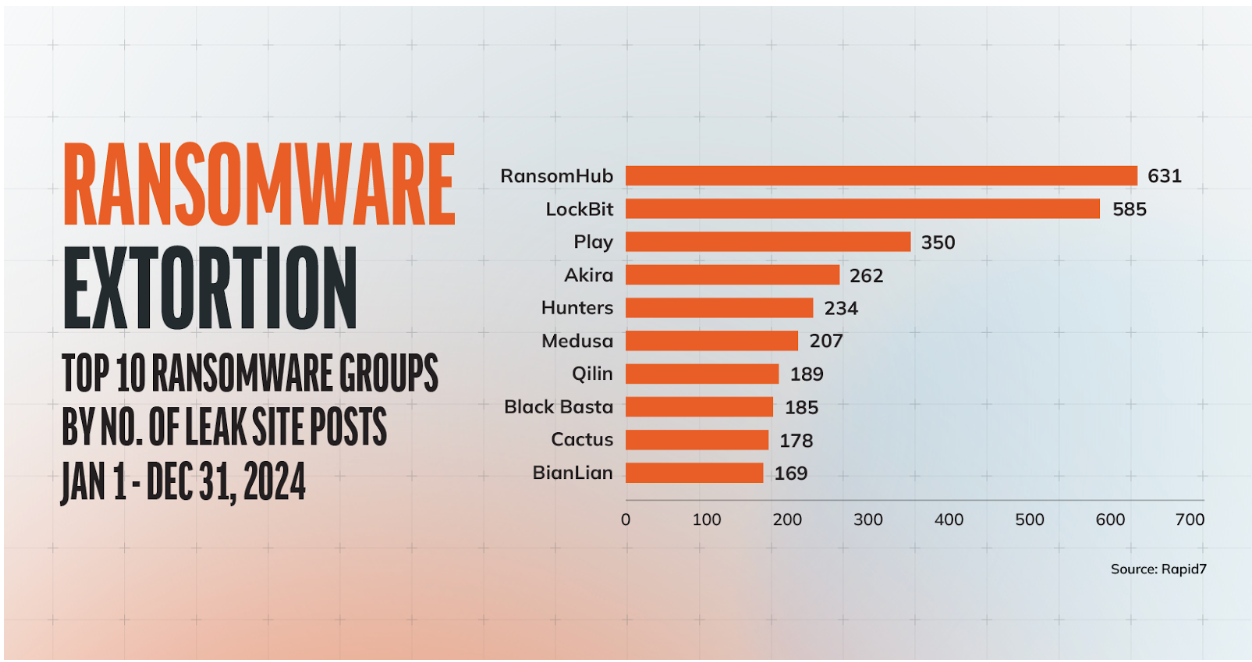
Total number of leak site posts: 5,939
Number of active ransomware groups: 75
Average number of active groups per month: 45
Average ransom payment in Q3 2024: $479,237 (Source: Coveware)
Median ransom payment in Q3 2024: $200,000 (Source: Coveware)
Median percentage of companies that pay: 32% (Source: Coveware)
These numbers offer insight into just how expansive ransomware activity has become. While the overall figures are alarming, it’s the variety of actors and their ability to adapt that pose the greatest challenge for defenders.
Top 10 Ransomware Groups
Below are the 10 most prolific ransomware groups in 2024, ranked by the number of posts on leak sites:
While these numbers reflect public disclosures, many victims choose to negotiate privately, meaning the true scope could be significantly higher.
The Cl0p group recently disclosed exploiting a vulnerability in Cleo file transfer software, further illustrating how threat actors pivot between high-profile platform vulnerabilities with minimal downtime. While the group avoids using conventional ransomware payloads, they still rely on a leak site to extort payment from victims. Because Cl0p’s business model isn’t driven by fully encrypting victims’ data, the ransom amounts they demand — and ultimately receive — remain opaque, making it difficult to quantify their financial impact within the broader ransomware ecosystem.
Estimated Financial Impact
Based on the median payment amount of $200,000 cited above and the stat that about 32% of companies choose to pay, we can make **rough** estimates of total potential revenue generated by these groups.
Note that this calculation assumes:
Each post represents one victim.
32% of those victims pay.
Ransom is always $200,000.
These assumptions likely understate the actual impact, as some victims pay more (the average is $479,237). Even so, the total in 2024 could easily exceed $380 million in ransom paid.
Group
Posts
32% of Posts (Paying Victims)
Hypothetical Revenue (USD)
RansomHub
631
201.92
$40,384,000
LockBit
585
187.20
$37,440,000
Play
350
112
$22,400,000
Akira
262
83.84
$16,768,000
Hunters
234
74.88
$14,976,000
Medusa
207
66.24
$13,248,000
Qilin
189
60.48
$12,096,000
Black Basta
185
59.20
$11,840,000
Cactus
178
56.96
$11,392,000
BianLian
169
54.08
$10,816,000
Table Note: These calculations are illustrative only; actual outcomes will differ.
Trends and Observations
Following are four trends we’re seeing in Rapid7 Labs, based on the global threat intelligence we gather as well as input from our internal research and open source communities.
1. Proliferation of Groups: With over 75 active groups, it’s clear that the barrier to entry for launching ransomware campaigns remains relatively low. In addition, fragmented groups are splintering and rebranding, making it more difficult to track and mitigate.
2. Persistent Dominance: Teams like RansomHub, Akira, and Fog continue to reign at the top, demonstrating sophisticated extortion strategies and steady affiliate growth.
3. Increased Transparency on the Victim Side: More organizations are disclosing breaches to comply with emerging regulations as well as to maintain customer trust. These self-reports, combined with the data ransomware actors post as a form of extortion, can give us a view of the threat. Still, not all attacks become public, obfuscating the true scale of the ransomware problem.
4. Rise of Double and Triple Extortion: Threat actors often demand multiple payments for data release, encryption keys, and in some cases, to prevent DDoS attacks or direct contact with partners and clients.
An additional observation: LockBit remained active throughout 2024, even as it became the focus of significant law enforcement attention. In a recent case, a dual Russian-Israeli national was charged for allegedly serving as a LockBit developer — an accusation that centers on crafting malicious code, overseeing affiliate activities, and orchestrating ransomware attacks worldwide. The indictments underscore intensified global cooperation, with agencies from the United States and the United Kingdom coordinating to disrupt LockBit’s infrastructure and hold key figures accountable. While LockBit continues to operate, these collective enforcement actions have highlighted the value of cross-border partnerships in mitigating ransomware threats
Building Resilience
Now that we’ve looked at some numbers and trends, let’s examine how we can use these learnings to inform decision-making and enable conversations at the executive level:
– Prepare for Multiple Vectors: Ransomware attacks often begin with credential compromise, phishing campaigns, or exploitation of unpatched vulnerabilities. Build layered security defenses accordingly.
– Secure Collaborations: Ensure robust security protocols with third parties, given the reliance on supply chains and outsourced IT services.
– Incident Response Readiness: Create clear IR plans that include legal and public relations strategies. In addition, we highly recommend that companies hold twice-annual tabletop exercises to test the efficacy of their ransomware IR plans. Rapid containment and a well-managed response can help minimize financial and reputational damage.
– Ongoing Risk Assessment: Regularly revisit threat models, especially as top-tier groups (like RansomHub or Cl0p) adopt new tactics and expand their affiliate networks.
Planning Ahead
Looking at the big picture, the financial incentives for cybercriminals are undeniable. Even if only one-third of victims pay a median of $200,000, the potential revenue surpasses $380 million — and that’s likely just the tip of the iceberg. This underscores three critical points for defenders:
1. Defense in Depth: Organizations must invest in proactive measures, from user awareness training and robust patching to strict access control and secure backups.
2. Threat Intelligence: Regularly monitor emerging ransomware groups and tactics to tailor defenses. Knowing who is targeting your industry and their methods is essential.
3. Commanding Your Attack Surface:
In line with Rapid7’s emphasis on complete visibility and proactive security, it’s essential that organizations maintain a continuous view of their external footprint. This includes:
– Regular Scanning: With automated tools that identify internet-facing assets and highlight newly exposed services or vulnerabilities.
– Real-time Monitoring: For detecting changes in cloud environments, development pipelines, and system deployments.
– Holistic Patch Management: To prioritize fixes based on known exploits and potential impact to reduce windows of opportunity for attackers.
By commanding your attack surface, you can reduce the likelihood of unpatched systems and publicly exposed services becoming easy entry points for ransomware groups.
Conclusion
The 2024 ransomware landscape signals an ongoing escalation in the volume, variety, and financial impact of attacks. Groups like RansomHub, Akira, and Cl0p demonstrate how quickly affiliates can scale, while many new entrants take advantage of commoditized ransomware-as-a-service models. For organizations of all sizes, building resilience, staying informed, and preparing a strong response plan are critical steps in countering this persistent and evolving threat.
Disclaimer: The statistics and financial estimates shared in this blog are based on public data and should be considered general indicators rather than exact figures. Real-world incidents often involve factors that deviate from these simplified calculations.
A newly discovered VPN backdoor uses some interesting tactics to avoid detection:
When threat actors use backdoor malware to gain access to a network, they want to make sure all their hard work can’t be leveraged by competing groups or detected by defenders. One countermeasure is to equip the backdoor with a passive agent that remains dormant until it receives what’s known in the business as a “magic packet.” On Thursday, researchers revealed that a never-before-seen backdoor that quietly took hold of dozens of enterprise VPNs running Juniper Network’s Junos OS has been doing just that.
J-Magic, the tracking name for the backdoor, goes one step further to prevent unauthorized access. After receiving a magic packet hidden in the normal flow of TCP traffic, it relays a challenge to the device that sent it. The challenge comes in the form of a string of text that’s encrypted using the public portion of an RSA key. The initiating party must then respond with the corresponding plaintext, proving it has access to the secret key.
The lightweight backdoor is also notable because it resided only in memory, a trait that makes detection harder for defenders. The combination prompted researchers at Lumin Technology’s Black Lotus Lab to sit up and take notice.
[…]
The researchers found J-Magic on VirusTotal and determined that it had run inside the networks of 36 organizations. They still don’t know how the backdoor got installed.
На 8 януари 2020 г. в Истанбул българският премиер Бойко Борисов се подрежда до президентите на Турция, Русия и Сърбия. Той е до Владимир Путин и не крие задоволството си…
Fast forward to 2025:Amazon Simple Email Service (Amazon SES) processes over a trillion email each year for customers worldwide across various industries, from small startups to large enterprises for their transactional and marketing email workloads, including the emails for Amazon retail’s Prime Day events. Today, we take the celebration of SES’s 14th birthday to introduce some of the recently launched features and enhancements to SES features.
Email is a critical communication channel for businesses. With email marketing potentially delivering a $42 ROI for every dollar spent, businesses are eager to send and ensure their emails land in the inbox (called as deliverability). However, Email Service Providers (ESPs) have become more vigilant, implementing advanced filters to block unwanted or suspicious messages. ESPs now require long-standing best practices and bulk-sender requirements that all email senders must adhere to in order to achieve good deliverability and reputation with mailbox providers. Our reputation management systems analyze millions of data points daily (such as IPs, domains, bounces, complaints, and delivery notifications) to help your emails reach their intended inboxes.
SES started as a simple email sending service and as the years passed (since 2011), we became increasingly passionate about email and our vision grew more exciting and innovative. Today, we are not only sending emails; we expanded into email relay and infrastructure features like Mail Manager, we added a secure, managed business email and calendar solution (Amazon WorkMail) to the SES portfolio and released features that help you analyze, monitor and optimize your email deliverability such as Virtual Deliverability Manager (VDM), and introduced Managed Dedicated IP (M-DIP) to help manage and improve your sender reputation. We’ll explore each of these features in more detail later in the post. Industry leaders like Spamhaus recognize SES’s four pillar framework of Prevention, Monitoring, Analysis and Response efforts and effectiveness in maintaining high email deliverability and reputation standards. You can read more about the framework on the official Spamhaus blog post here.
Ensuring Email Resilience & Reliability with Global Endpoints: An email that is not delivered or an email that is delivered late could be a lost opportunity. Therefore, ensuring your email messages keep flowing is important. Global Endpoints (launched in Dec 2024) is a feature for resilient sending through two commercial AWS Regions. Global Endpoints allows customers to choose a primary and secondary region which accommodate email sending workloads in an equal split under normal circumstances. If either region suffers an impairment, traffic shifts away from the affected Region towards the other, ensuring that email sending continues.
Unlike manual multi-region setups, Global Endpoints synchronizes critical parameters between your two chosen Regions, and highlights remaining differences you must resolve. Once active, the load-balanced sending ensures both Regions have warmed-up IP addresses ready for your workloads, and no manual effort is required to respond to outages.
You can learn more about Global Endpoints by reading this blog here.
Modernizing Email Infrastructure with Amazon SES Mail Manager: Mail Manager (launched in May 2024) is a set of Amazon SES email relay and gateway features designed to help you with governance, risk management, and compliance goals around all your corporate email workloads. At its core, Mail Manager acts as a routing and delivery relay, effectively managing email traffic and ensuring compliance. It’s like having a digital traffic controller for your emails, efficiently processing rules while seamlessly integrating with your existing email infrastructure whether they are self-hosted or already at AWS. Mail Manager permits standard inspection and enforcement of routing, tracking, archiving, security and compliance rules whether messages are incoming, outgoing, or internal-to-internal. Mail Manager allows simple, cost-effective, and usage-based monitoring and enforcement of corporate policies while creating an easy migration path for application modernization and the wind-down of shadow IT mail servers throughout your organization.
You can learn more about Mail Manager in this blog post.
Engagement, Deliverability and Maximizing Email Success with Virtual Deliverability Manager (VDM): Email deliverability is a complex and multifaceted challenge. Businesses need tools to monitor and optimize their email delivery success rates to make every email count. Virtual Deliverability Manager (VDM) (launched in Sep 2022), is an Amazon SES feature that helps you enhance email deliverability, like increasing inbox deliverability and email conversions, by providing insights into your sending and delivery data, and giving advice on how to fix the issues that are negatively affecting your delivery success rate and reputation. Recently, we enhanced VDM with an adaptive setup, added complaint rate and delivery improvement recommendations.
VDM tracks every email’s journey, uncovering opportunities to improve delivery and engagement rates. Customers can dig deep into deliverability metrics such as bounce, complaint, open, click-through, and successful delivery rates in their accounts at multiple levels such as by sending email address, by email provider, or by SES configuration set. This makes it easy to quickly check the status and trend of sending health.
VDM also analyzes sending configurations and provides automatic recommendations about how to increase sending success. This helps customers make changes such as DKIM configuration (Domain Keys Identified Mail) to increase the likelihood of successful delivery.
Advanced features like BIMI gap detection ensure your emails aren’t just sent, but strategically positioned for maximum impact. The automated complaint rate insights act as an early warning system, helping businesses proactively protect their sender reputation.
If you’d like to learn more, you can check out the blog posts by my colleagues Samuel Koppes (post) and Vinay Ujjini (post).
When customers sign up for Amazon SES, their email sending is automatically handled through shared IP addresses. While this shared IP approach is cost-effective and safe, it also means customers don’t have full control over their own sending reputation. The reputation of the IP they send from is determined by the quality and engagement levels of all emails sent from that IP. Some organizations can achieve exceptionally high reputation, and have turned to leasing dedicated IP addresses, where they are the sole sender on that IP. This helps them grow and maintain a positive sending reputation, building trust with ISPs and mailbox providers. Customers estimate how many dedicated IPs they need and request them before use. Dedicated IPs also require a careful “warm-up” process, where senders gradually increase their email volume to avoid triggering spam filters.
Dedicated IPs (Managed) makes it easier to manage dedicated IPs, by automating process of provisioning, leasing, warming up, and managing dedicated IP addresses. Customers can create a managed dedicated IP pool through the API, CLI, or Console and start using it for dedicated sending without having to open support cases. The IP pool automatically scales in and out based on usage, taking into account the specific policies of each ISP. SES tracks the warmup level for each IP in the pool individually for each ISP, ensuring a gradual ramp-up of email volume. The warmup percentage calculation adapts to actual sending patterns, optimizing the warmup schedule. Excess sending is deferred and retried, with early-stage traffic leveraging the shared IP infrastructure.
By automating the management of dedicated IPs, Dedicated IPs (Managed) helps SES customers focus on their email content and strategy, while AWS handles the underlying infrastructure and reputation management. This allows senders to improve their deliverability and ensure more of their emails reach the intended inboxes.
You can learn more about dedicated IPs (managed) by reading the blog post here.
Elevating the Email Experience: Understanding the evolving needs of our customers, we’ve released a number of new features to make email sending more seamless, secure, and transparent. SES now offers inline email templates that allow developers to seamlessly provide template content directly within their API requests, eliminating the process of managing template resources. We’ve also enhanced tracking capabilities with HTTPS support for custom domains and introduced options to set maximum deliverability times for time-sensitive messages. Our AutoTag enhancements now include insights into TLS version for outgoing messages and customers now have the ability to set custom values in feedback headers, providing better transparency and control. In addition to these improvements, we’ve also expanded Amazon SES to 24 regions, including AWS Govcloud (US-East).
As we celebrate Amazon SES’s 14th birthday, we’re not just looking back – we’re looking forward. The future of email is here, and we’re proud to be leading the way.
To provide the best experiences, we use technologies like cookies to store and/or access device information. Consenting to these technologies will allow us to process data such as browsing behavior or unique IDs on this site. Not consenting or withdrawing consent, may adversely affect certain features and functions.
Functional
Always active
The technical storage or access is strictly necessary for the legitimate purpose of enabling the use of a specific service explicitly requested by the subscriber or user, or for the sole purpose of carrying out the transmission of a communication over an electronic communications network.
Preferences
The technical storage or access is necessary for the legitimate purpose of storing preferences that are not requested by the subscriber or user.
Statistics
The technical storage or access that is used exclusively for statistical purposes.The technical storage or access that is used exclusively for anonymous statistical purposes. Without a subpoena, voluntary compliance on the part of your Internet Service Provider, or additional records from a third party, information stored or retrieved for this purpose alone cannot usually be used to identify you.
Marketing
The technical storage or access is required to create user profiles to send advertising, or to track the user on a website or across several websites for similar marketing purposes.