Post Syndicated from Explosm.net original https://explosm.net/comics/pac-man
New Cyanide and Happiness Comic
Post Syndicated from Explosm.net original https://explosm.net/comics/pac-man
New Cyanide and Happiness Comic
Post Syndicated from Oglaf! -- Comics. Often dirty. original https://www.oglaf.com/graphite/


Post Syndicated from Екип на Биволъ original https://bivol.bg/varna-portnih-kocev-offshores.html

В третия по големина и икономическо значение град в България, Варна все повече се налага общественото мнение, че общината е обречена да бъде вечен заложник на управляващата Сглобка между ГЕРБ…
Post Syndicated from Geographics original https://www.youtube.com/watch?v=gzyovUdqdk8
Post Syndicated from Will Taillac original https://www.servethehome.com/lexar-nm790-4tb-ssd-review/
In our Lexar NM790 review, we see how this 4TB PCIe Gen4 NVMe SSD with YMTC 232-Layer NAND performs compared to others we have tested
The post Lexar NM790 4TB SSD Review appeared first on ServeTheHome.
Post Syndicated from Bozho original https://blog.bozho.net/blog/4159
Малко понятия за анализаторите, които днес ще коментират темата:
Накратко – всичко, което е видимо на екран, е публично или частично публично (за регистрираните партии) по закон. Всичко, което трябва да е тайно – ключът+паролите, не се показва на екран, а повторно генериране не дава достъп до машините.
Тези разяснения вероятно са излишни, защото въпросът беше превърнат в политически. Но тъй като днес е ден за размисъл и по студията няма да има политици, се надявам анализаторите да са по-прецизни.
Материалът Хеш, код, ключ – обяснение на понятия е публикуван за пръв път на БЛОГодаря.
Post Syndicated from Светла Енчева original https://www.toest.bg/sedmitsata-23-28-oktomvri/

Обзалагам се, че тази седмица сте на предизборна вълна. Защото знам, че читателите на „Тоест“ са граждански активни и вярват, че да живеят в една по-добра среда зависи в голяма степен и от тях. Ако сте очаквали обаче тази седмица статии предимно на предизборна тема в „Тоест“, може би сте останали изненадани. Но ни познавате – ние харесваме бавната журналистика. Няма да ви затрупаме с „анализи“ по актуалната тема, за която прогнози почти липсват, а наличните са противоречиви.
Междувременно бяхме вкарани в поредното предизборно ченгеджийско активно мероприятие. Този път службите (в случая ДАНС) дори не крият, че подобни неща стават с тяхно участие. В известен смисъл последствията са дори по-сериозни, отколкото от т.нар. афера „Костинброд“ отпреди десет години, защото се стигна до отмяна на машинното гласуване. Друг въпрос е доколко скандалът ще повлияе на изборните резултати. Но едно е сигурно: без машини тежестта на купения вот ще се увеличи. Очаквайте анализ на Емилия Милчева по темата в началото на следващата седмица.
Но животът продължава и извън нашите тукашни „балони“. Освен живот има и много смърт. Израел, Палестина, Украйна и останалите места по света, в които нашенските предизборни драми изглеждат недостижим лукс за хората.
Затова седмицата започва с четвъртата публикация от поредицата репортажи на Николета Атанасова – „Откъси от Украйна: Всички заедно“. Във фокуса на вниманието ѝ този път са доброволците и неправителствените организации, които помагат на фронта. Рискувайки живота си, те осигуряват хуманитарна и психологическа помощ, лекарства, военно оборудване, дрехи, оръжия, автомобили. Разговорите на Николета с някои от тях (между които 70-годишна доброволка и българин) ни пренасят в тамошната атмосфера. И ни карат да потръпнем.
Връщаме се към новата война. Какво става в Израел? На тази тема е разговорът на Боряна Телбис с експерта по противодействие на тероризма и международна сигурност доц. Искрен Иванов от Софийския университет. Според него международната общност е проспала тенденцията, че светът става двуполюсен. От едната страна са ЕС и САЩ, от другата – Русия и Китай. Същевременно има държави, които се опитват да балансират между двата лагера. Ала докато първият лагер се е опитвал най-вече да сдържа Русия в Украйна, терористичните мрежи са се възползвали от ситуацията, от което пък може да спечели Русия. Трета световна война обаче не бива да има и поради тази причина трябва да се намери трайна формула за консенсус между двата полюса.
Продължаваме арабската тема, но от съвсем друг ракурс, с втората част от статията на Атанас Шиников „Машаллах и „Банкси не се е появил в арабския свят“: Непознатите графити“. Второто графити преживяване – този път във Фес и Йерусалим – е напълно различно от първото. Там вече няма големи комерсиални изображения, каквито привличат туристите, а можем да усетим нетуристическата „тънка кожа на града“. С калиграфия, много „Аллах“, малко християнство, но и с някои бунтарски светски послания.
Трябва да призная: много се радвам, че Надежда Цекулова отново пише за „Тоест“. Тази седмица тя ни среща с психоложката в областта на невронауките Женя Лазарова в интервю, озаглавено „Човешката роля на учителя ще е незаменима в бъдещето“. Специалистката обръща внимание, че мозъкът учи най-добре чрез преживяване, предимно в детска възраст. Затова абстрактните дефиниции и сухата фактология, особено без контекст, се забравят лесно. За съжаление, за разлика от други сфери, образованието още не може да преодолее наследството на килийните училища, в които най-важно е да си дисциплиниран и да зубриш. Потребностите на съвременните деца обаче са коренно различни. Затова е необходимо образование, подкрепящо цялостното развитие и съобразено с възрастта, а също така да се цени обратната връзка от учениците.
„Всички гледат към местните избори“, казва Емилия Милчева в тазседмичния си политически анализ. И така си е, би потвърдил Мечо Пух. Резултатите от изборите са важни, обяснява Емилия, защото ще променят баланса на силите в управляващия съюз, а оттам – и дизайна на правителството при ротацията през март. Да не забравяме, че предстоят и избори за Европейски парламент, за които „Възраждане“ вече загрява, за да използва резултатите от местния вот като трамплин. С поглед от дрон изглежда, че ПП–ДБ се концентрира в София, а ГЕРБ засилва позициите си в страната. Ваня Григорова пък увлича повече гласоподаватели, отколкото успява БСП, с микс от соцносталгия и синдикално бодрячество. А ДПС печели позиции в Северозапада.
След политиката рязко минаваме на научна вълна. „Създадоха синтетичен човешки ембрион. Сега какво?“, пита Анастасия Орманджиева. Учили сме, че ембрионалното развитие на човека започва с оплождането, за което са нужни яйцеклетка и сперматозоид. Стволовите клетки обаче са уникални със свойството си да се превръщат в различни видове специализирани клетки, а всички клетки в тялото ни водят началото си от ембрионалните стволови клетки. Именно от тях е създаден първият човешки синтетичен ембрион. Без яйцеклетки и сперматозоиди. Научните изследвания с такива ембриони обаче пораждат куп етични въпроси, затова учените тепърва разработват правила как да се действа в тази област.
След науката се потапяме в поезията със стихотворението на месеца „Какво посяхме в дланите си, цвете да поникне“ от Никола Петров. Поезията не подлежи на резюмиране, затова и не бих се наела да ви преразкажа това прекрасно произведение.
Накрая и препоръка от мен. Социологията не е проценти, а е в онова, което се крие зад тях. Защо преди тези избори почти нямаше социологически проучвания? Отговорността за това само на агенциите ли е, или и на партиите, медиите и цялото общество? Защо прогнозните проценти не са сигурни и кои са тенденциите, които са по-важни от тях? Защо има нужда от промяна в начина, по който се правят социологически изследвания? По тези и други интересни теми говори създателката и управляваща партньорка на „Алфа Рисърч“ Боряна Димитрова във видеоинтервю за „Дневник“.
Не ви препоръчвам да гласувате, защото знам, че и вие сте убедени колко важно е да го направите, и нямате нужда от подканяне да идете до урните, ако сте в България.
Приятно четене, гледане и гласуване!
Post Syndicated from Explosm.net original https://explosm.net/comics/line-up
New Cyanide and Happiness Comic
Post Syndicated from Kartikay Khator original https://aws.amazon.com/blogs/big-data/unlock-scalable-analytics-with-aws-glue-and-google-bigquery/
Data integration is the foundation of robust data analytics. It encompasses the discovery, preparation, and composition of data from diverse sources. In the modern data landscape, accessing, integrating, and transforming data from diverse sources is a vital process for data-driven decision-making. AWS Glue, a serverless data integration and extract, transform, and load (ETL) service, has revolutionized this process, making it more accessible and efficient. AWS Glue eliminates complexities and costs, allowing organizations to perform data integration tasks in minutes, boosting efficiency.
This blog post explores the newly announced managed connector for Google BigQuery and demonstrates how to build a modern ETL pipeline with AWS Glue Studio without writing code.
AWS Glue is a serverless data integration service that makes it easier to discover, prepare, and combine data for analytics, machine learning (ML), and application development. AWS Glue provides all the capabilities needed for data integration, so you can start analyzing your data and putting it to use in minutes instead of months. AWS Glue provides both visual and code-based interfaces to make data integration easier. Users can more easily find and access data using the AWS Glue Data Catalog. Data engineers and ETL (extract, transform, and load) developers can visually create, run, and monitor ETL workflows in a few steps in AWS Glue Studio. Data analysts and data scientists can use AWS Glue DataBrew to visually enrich, clean, and normalize data without writing code.
To meet the demands of diverse data integration use cases, AWS Glue now offers a native spark connector for Google BigQuery. Customers can now use AWS Glue 4.0 for Spark to read from and write to tables in Google BigQuery. Additionally, you can read an entire table or run a custom query and write your data using direct and indirect writing methods. You connect to BigQuery using service account credentials stored securely in AWS Secrets Manager.
In this example, you create two ETL jobs using AWS Glue with the native Google BigQuery connector.

The dataset used in this solution is the NCEI/WDS Global Significant Earthquake Database, with a global listing of over 5,700 earthquakes from 2150 BC to the present. Copy this public data into your Google BigQuery project or use your existing dataset.
To connect to Google BigQuery from AWS Glue, see Configuring BigQuery connections. You must create and store your Google Cloud Platform credentials in a Secrets Manager secret, then associate that secret with a Google BigQuery AWS Glue connection.
Every object in Amazon S3 is stored in a bucket. Before you can store data in Amazon S3, you must create an S3 bucket to store the results.
To create an S3 bucket:
awsglue-demo.When you create the AWS Glue ETL job, you specify an AWS Identity and Access Management (IAM) role for the job to use. The role must grant access to all resources used by the job, including Amazon S3 (for any sources, targets, scripts, driver files, and temporary directories), and Secrets Manager.
For instructions, see Configure an IAM role for your ETL job.
bq-s3-dataflow.noaa_significant_earthquakes.bq-connection.bigquery-public-datasources.noaa_significant_earthquakes.earthquakes.
s3://<YourBucketName>/noaa_significant_earthquakes/earthquakes/.<YourBucketName> with the name of your bucket.
AWSGlueRole.


You’ve successfully configured an AWS Glue ETL job to transfer data from Google BigQuery to Amazon S3. Next, you create the ETL job to aggregate this data and transfer it to Google BigQuery.
s3-bq-dataflow.s3://<YourBucketName>/noaa_significant_earthquakes/earthquakes/.<YourBucketName> with the name of your bucket.
earthquakes as Node parents.id, eq_primary, and country.
Aggregate.Select Fields as Node parents.eq_primary and country as the group by columns.id as the aggregate column and count as the aggregation function.
Rename eq_primary.Aggregate as Node parents.eq_primary as the Current field name and enter earthquake_magnitude as the New field name.
Rename count(id).Rename eq_primary as Node parents.count(id) as the Current field name and enter number_of_earthquakes as the New field name.
most_powerful_earthquakes.bq-connection.bigquery-public-datasources.noaa_significant_earthquakes.most_powerful_earthquakes.
AWSGlueRole.


That’s it! You’ve successfully set up an AWS Glue ETL job to transfer data from Amazon S3 to Google BigQuery. You can use this integration to automate the process of data extraction, transformation, and loading between these two platforms, making your data readily available for analysis and other applications.
To avoid incurring charges, clean up the resources used in this blog post from your AWS account by completing the following steps:
bq-s3-data-flow and delete it.s3-bq-data-flow and delete it.The integration of AWS Glue with Google BigQuery simplifies the analytics pipeline, reduces time-to-insight, and facilitates data-driven decision-making. It empowers organizations to streamline data integration and analytics. The serverless nature of AWS Glue means no infrastructure management, and you pay only for the resources consumed while your jobs are running. As organizations increasingly rely on data for decision-making, this native spark connector provides an efficient, cost-effective, and agile solution to swiftly meet data analytics needs.
If you’re interested to see how to read from and write to tables in Google BigQuery in AWS Glue, take a look at step-by-step video tutorial. In this tutorial, we walk through the entire process, from setting up the connection to running the data transfer flow. For more information on AWS Glue, visit AWS Glue.
If you are looking to implement this example, using code instead of the AWS Glue console, use the following code snippets.
 Kartikay Khator is a Solutions Architect in Global Life Sciences at Amazon Web Services (AWS). He is passionate about building innovative and scalable solutions to meet the needs of customers, focusing on AWS Analytics services. Beyond the tech world, he is an avid runner and enjoys hiking.
 Kamen Sharlandjiev is a Sr. Big Data and ETL Solutions Architect and Amazon AppFlow expert. He’s on a mission to make life easier for customers who are facing complex data integration challenges. His secret weapon? Fully managed, low-code AWS services that can get the job done with minimal effort and no coding.
 Anshul Sharma is a Software Development Engineer in AWS Glue Team. He is driving the connectivity charter which provide Glue customer native way of connecting any Data source (Data-warehouse, Data-lakes, NoSQL etc) to Glue ETL Jobs. Beyond the tech world, he is a cricket and soccer lover.
Post Syndicated from Bruce Schneier original https://www.schneier.com/blog/archives/2023/10/friday-squid-blogging-on-the-ugliness-of-squid-fishing.html
And seafood in general:
A squid ship is a bustling, bright, messy place. The scene on deck looks like a mechanic’s garage where an oil change has gone terribly wrong. Scores of fishing lines extend into the water, each bearing specialized hooks operated by automated reels. When they pull a squid on board, it squirts warm, viscous ink, which coats the walls and floors. Deep-sea squid have high levels of ammonia, which they use for buoyancy, and a smell hangs in the air. The hardest labor generally happens at night, from 5 P.M. until 7 A.M. Hundreds of bowling-ball-size light bulbs hang on racks on both sides of the vessel, enticing the squid up from the depths. The blinding glow of the bulbs, visible more than a hundred miles away, makes the surrounding blackness feel otherworldly.
As usual, you can also use this squid post to talk about the security stories in the news that I haven’t covered.
Read my blog posting guidelines here.
Post Syndicated from Christopher Granleese original https://blog.rapid7.com/2023/10/27/metasploit-weekly-wrap-up-33/

Authors: Emir Polat and Unknown
Type: Auxiliary
Pull request: #18447 contributed by emirpolatt
Path: admin/http/atlassian_confluence_auth_bypass
AttackerKB reference: CVE-2023-22515
Description: This adds an exploit for CVE-2023-22515, which is an authentication bypass within Atlassian Confluence that enables a remote attacker to create a new administrator account.
Authors: Harsh Jaiswal ( <Harsh Jaiswal (@rootxharsh)>, Rahul Maini ( <Rahul Maini (@iamnoooob)>, SinSinology, and h00die
Type: Exploit
Pull request: #18460 contributed by h00die
Path: linux/ssh/vmware_vrni_known_privkey
Description: This adds a new exploit module that leverages the fact that SSH keys on VMWare Aria Operations for Networks (vRealize Network Insight) versions 6.0.0 through 6.10.0 are not randomized on initialization. It tries all the default SSH keys until one succeeds and gains unauthorized remote access as the "support" (root) user.
Authors: Heyder Andrade, Mr Hack (try_to_hack) Santiago Lopez, and Redway Security <redwaysecurity.com>
Type: Exploit
Pull request: #18348 contributed by heyder
Path: multi/http/splunk_privilege_escalation_cve_2023_32707
Description: This module exploits an authorization vulnerability in Splunk, targeting CVE-2023-32707, that allows a low privilege user with the capability edit_user to take over the admin account and log in to upload a malicious app, achieving remote code execution.
Author: Nick Cottrell [email protected]
Type: Post
Pull request: #18194 contributed by rad10
Path: linux/manage/adduser
Description: This adds a post module that creates a new user on the target OS. It tries to use standard tools already available on the system, but it’s also able to directly update the plaintext database files (/etc/passwd and /etc/shadow). This module requires root privileges.
kerberos_login brute force module.getent instead of grep when detecting user/group details.db_stats command which gives the user information about how much data is in their database/workspace.You can always find more documentation on our docsite at docs.metasploit.com.
As always, you can update to the latest Metasploit Framework with msfupdate
and you can get more details on the changes since the last blog post from
GitHub:
If you are a git user, you can clone the Metasploit Framework repo (master branch) for the latest.
To install fresh without using git, you can use the open-source-only Nightly Installers or the
binary installers (which also include the commercial edition).
Post Syndicated from Benjamin Smith original https://aws.amazon.com/blogs/compute/archiving-and-replaying-messages-with-amazon-sns-fifo/
This post is written by A Mohammed Atiq, Solutions Architect and Mithun Mallick, Principal Solutions Architect, Serverless
Amazon Simple Notification Service (SNS) offers a flexible, fully managed messaging service, allowing applications to send and receive messages. SNS acts as a channel, delivering events from publishers to subscribers.
Today, AWS is announcing a new capability that enables you to archive and replay messages published to SNS FIFO (first-in first-Out) topics. Now, when enabled with an archive policy, SNS FIFO topics automatically:
This feature can be useful in failure recovery and state replication scenarios.
In failure recovery scenarios, developers can use this to reprocess a subset of messages and recover from a downstream application failure or a dependency issue.
Consider a situation where a search application needs to reprocess messages because the search engine’s index has been erased. To initiate recovery, the search application would update the ReplayPolicy attribute in its existing subscription using the SetSubscriptionAttributes API action, to start receiving messages from a specific point in time, rather than from when the Archive policy was applied to the topic.
For state replication scenarios, this feature enables new applications to duplicate the state of previously subscribed applications.
Consider an internal data warehouse application that must replicate the state of an external search application to make the data indexed in the search engine available to product managers and other internal staff. The data warehouse application subscribes its newly created endpoint (for example, an Amazon SQS FIFO queue) to the topic using the Subscribe API action and sets the ReplayPolicy subscription attribute.
If it opts to replicate the full state of the search engine, it might set the timestamp in its ReplayPolicy to coincide with the search engine’s subscription’s creation date and time, ensuring all data ever delivered to the search engine is also delivered to the data warehouse tool.
When creating a new SNS FIFO topic, you see an option for the archive policy. This policy determines how long SNS stores your messages, making them available for potential resending to a subscription if necessary. The Archive policy does not activate by default – you must enable it for each topic manually or automate the operation.

For instance, the retention period for this FIFO topic is set at 30 days. However, you can adjust this duration anywhere from 1 to 365 days. Once you activate the archive policy, messages sent to this topic are archived for the defined period.
To confirm that the archive policy is in effect after creating the topic, check the topic details. Next to the retention policy, and its status is displayed as Active.

By subscribing an SQS FIFO queue to an SNS FIFO topic, you can replay messages, and the Replay status shows Not running. You can subscribe both FIFO and standard SQS queues to their SNS FIFO topics, providing flexibility for various use-case requirements. To initiate a replay, navigate to the SNS console, choose Replay, and then choose Start replay.

When you initiate a replay, a window appears, allowing you to specify the start and end dates, as well as the exact time from which messages are archived. This feature affords the flexibility to replay only messages of interest, instead of every archived message, by allowing you to set on a specific schedule. When you choose Start replay, the service begins sending messages to the subscriber.

You can also define settings for the SNS FIFO archive and replay features with both AWS CloudFormation and the AWS Serverless Application Model (AWS SAM).
In a scenario where an insurance application uses multiple microservices, consider one claims processing microservice encounters an error and drops a claim. Such an oversight can cause the workload to be out of sync.
With the archive and replay feature, you can revisit and replay events from the time the error was detected. This allows the microservice to recognize the missed event and complete the necessary actions, ensuring the system remains updated and accurate.

In situations where an application spans multiple Regions, and a microservice encounters difficulties in its primary Region, you can replicate the infrastructure to another Region using an active/standby setup.
You can reroute traffic to the standby microservice in the secondary Region, maintaining synchronization through event replays. You can set an end time in the SNS replay policy but if this isn’t defined, replaying continues until all the most recent messages are sent.
After, the SNS subscription resumes normal functioning, capturing all new messages. This approach is suitable for many state replication scenarios, such as cross-Region backup strategies, as it helps minimize downtime and prevent message loss.

Managing auto insurance claims requires timely coordination. This walkthrough shows the combined benefits of SNS FIFO and SQS FIFO to process claims in the correct sequence.
Both SQS FIFO and SQS standard queues can be subscribed to the SNS FIFO topic, offering versatility in handling claims. The archive and replay functionality of SNS FIFO is paramount; disruptions in downstream microservices don’t compromise claim integrity due to the replay capability.
This walkthrough guides you through deploying an auto insurance claims processing example using the AWS CLI. You create an SNS FIFO topic for claim submissions and two SQS FIFO queues. The first queue is for primary processing of the claims, while the second is specifically for message replays to support application state replication across various system instances.
Run the following commands in the terminal.
REGION=$(aws configure get region)

# Create an SNS FIFO topic for auto insurance claims
AUTO_INSURANCE_TOPIC_ARN=$(aws sns create-topic --name "AutoInsuranceClaimsTopic.fifo" --attributes "FifoTopic=true,ContentBasedDeduplication=true,DisplayName=Auto Insurance Claims Topic" --region $REGION | jq -r '.TopicArn')

# Create primary and replay SQS FIFO queues
AUTO_INSURANCE_QUEUE_URL=$(aws sqs create-queue --queue-name "AutoInsuranceClaimsQueue.fifo" --attributes "FifoQueue=true" --region $REGION | jq -r '.QueueUrl')
AUTO_INSURANCE_REPLAY_QUEUE_URL=$(aws sqs create-queue --queue-name "AutoInsuranceReplayQueue.fifo" --attributes "FifoQueue=true" --region $REGION | jq -r '.QueueUrl')

# Get ARNs for both SQS queues
AUTO_INSURANCE_QUEUE_ARN=$(aws sqs get-queue-attributes --queue-url $AUTO_INSURANCE_QUEUE_URL --attribute-names QueueArn --output text --query 'Attributes.QueueArn')
AUTO_INSURANCE_REPLAY_QUEUE_ARN=$(aws sqs get-queue-attributes --queue-url $AUTO_INSURANCE_REPLAY_QUEUE_URL --attribute-names QueueArn --region $REGION | jq -r '.Attributes.QueueArn')

# Define a policy allowing the topic to publish to both queues
SQS_POLICY_TEMPLATE="{\"Policy\" : \"{ \\\"Version\\\": \\\"2012-10-17\\\", \\\"Statement\\\": [ { \\\"Sid\\\": \\\"1\\\", \\\"Effect\\\": \\\"Allow\\\", \\\"Principal\\\": { \\\"Service\\\": \\\"sns.amazonaws.com\\\" }, \\\"Action\\\": [\\\"sqs:SendMessage\\\"], \\\"Resource\\\": [\\\"$AUTO_INSURANCE_QUEUE_ARN\\\", \\\"$AUTO_INSURANCE_REPLAY_QUEUE_ARN\\\"], \\\"Condition\\\": { \\\"ArnLike\\\": { \\\"aws:SourceArn\\\": [\\\"$AUTO_INSURANCE_TOPIC_ARN\\\"] } } } ]}\"}"

# Apply the access policy to the queues
aws sqs set-queue-attributes --queue-url $AUTO_INSURANCE_QUEUE_URL --attributes file://<(echo $SQS_POLICY_TEMPLATE)
aws sqs set-queue-attributes --queue-url $AUTO_INSURANCE_REPLAY_QUEUE_URL --attributes file://<(echo $SQS_POLICY_TEMPLATE)

# Subscribe the primary queue to the created SNS FIFO topic
aws sns subscribe --topic-arn $AUTO_INSURANCE_TOPIC_ARN --protocol sqs --notification-endpoint $AUTO_INSURANCE_QUEUE_ARN --region $REGION
Modify the attributes of the SNS FIFO topic to set a retention period. This determines how long a message is retained in the topic archive. This example uses 30 days.
# Set a 30-day retention period for the SNS FIFO topic

aws sns set-topic-attributes --region $REGION --topic-arn $AUTO_INSURANCE_TOPIC_ARN --attribute-name ArchivePolicy --attribute-value "{\"MessageRetentionPeriod\":\"30\"}"Publish a sample claim to the SNS FIFO topic. This step mimics a real-world scenario where an insurance claim must be processed by subscribers of the topic.
# Get the current timestamp and publish a sample insurance claim
TIMESTAMP_START=$(date -u +%FT%T.000Z)
aws sns publish --region $REGION --topic-arn $AUTO_INSURANCE_TOPIC_ARN --message "{ \"claim_type\": \"collision\", \"registration\": \"AB123CDE\" }" --message-group-id "group1"Retrieve the insurance claim details from the primary SQS FIFO queue. This simulates a process reading the insurance claim to take action. After reading the message, the claim is deleted from the queue to avoid reprocessing.
# Fetch the claim details from the primary queue, then delete to avoid redundancy
MESSAGE=$(aws sqs receive-message --region $REGION --queue-url $AUTO_INSURANCE_QUEUE_URL --output json)
MESSAGE_TEXT=$(echo "$MESSAGE" | jq -r '.Messages[0].Body')
MESSAGE_RECEIPT=$(echo "$MESSAGE" | jq -r '.Messages[0].ReceiptHandle')
aws sqs delete-message --region $REGION --queue-url $AUTO_INSURANCE_QUEUE_URL --receipt-handle $MESSAGE_RECEIPT
echo "Received claim details: ${MESSAGE_TEXT}"To ensure no claims are lost, configure a replay policy for your SQS FIFO queue subscription. This policy sets the schedule from which messages are replayed to the SQS FIFO queue. Here, you subscribe a replay queue with a replay policy and then monitor the status of the replay queue. Once complete, read the replayed claim details from the secondary SQS FIFO queue. If any processing issues occurred initially, there is a second chance to process the claim.
# Subscribe the replay queue to the topic and define its replay policy
NEW_SUBSCRIPTION_ARN=$(aws sns subscribe --region $REGION --topic-arn $AUTO_INSURANCE_TOPIC_ARN --protocol sqs --return-subscription-arn --notification-endpoint $AUTO_INSURANCE_REPLAY_QUEUE_ARN --attributes "{\"ReplayPolicy\":\"{\\\"PointType\\\":\\\"Timestamp\\\",\\\"StartingPoint\\\":\\\"$TIMESTAMP_START\\\"}\"}" --output json | jq -r '.SubscriptionArn')
To monitor the replay status:
# Wait for the replay to complete
while [[ $(aws sns get-subscription-attributes --region $REGION --subscription-arn $NEW_SUBSCRIPTION_ARN --output text | awk 'END{print $9}') != 'Completed' ]]; do printf "."; sleep 5; done; echo "Replay complete";
To read the replayed message and delete the message from the queue:
# Fetch the replayed message and then remove it from the queue
REPLAYED_MESSAGE=$(aws sqs receive-message --region $REGION --queue-url $AUTO_INSURANCE_REPLAY_QUEUE_URL --output json)
REPLAYED_MESSAGE_TEXT=$(echo "$REPLAYED_MESSAGE" | jq -r '.Messages[0].Body')
REPLAYED_MESSAGE_RECEIPT=$(echo "$REPLAYED_MESSAGE" | jq -r '.Messages[0].ReceiptHandle')
aws sqs delete-message --region $REGION --queue-url $AUTO_INSURANCE_REPLAY_QUEUE_URL --receipt-handle $REPLAYED_MESSAGE_RECEIPT
echo "Received replayed claim details: ${REPLAYED_MESSAGE_TEXT}"To avoid incurring unnecessary costs, clean up the resources created in this walkthrough:
# Delete the primary SQS FIFO queue
aws sqs delete-queue --queue-url $AUTO_INSURANCE_QUEUE_URL --region $REGION

# Delete the replay SQS FIFO queue
aws sqs delete-queue --queue-url $AUTO_INSURANCE_REPLAY_QUEUE_URL --region $REGION

# Unset the 'ArchivePolicy' attribute
aws sns set-topic-attributes --region $REGION --topic-arn $AUTO_INSURANCE_TOPIC_ARN --attribute-name ArchivePolicy --attribute-value "{}"

# Delete the SNS FIFO topic
aws sns delete-topic --topic-arn $AUTO_INSURANCE_TOPIC_ARN --region $REGIONThe new SNS FIFO archive and replay feature provides a substantial foundation for event-driven applications, emphasizing failure recovery and application state replication. These features allow developers to efficiently manage and recover from disruptions, and ensure state replication across different application instances or environments.
Get started with this new SNS FIFO capability by using the AWS Management Console, AWS CLI, AWS Software Development Kit (SDK), or AWS CloudFormation. For information on cost, see SNS pricing and SQS pricing.
For more serverless learning resources, visit Serverless Land.
Post Syndicated from Abdul Javid original https://aws.amazon.com/blogs/security/a-phased-approach-towards-a-complex-hitrust-r2-validated-assessment/
Health Information Trust Alliance (HITRUST) offers healthcare organizations a comprehensive and standardized approach to information security, privacy, and compliance. HITRUST Common Security Framework (HITRUST CSF) can be used by organizations to establish a robust security program, ensure patient data privacy, and assist with compliance with industry regulations. HITRUST CSF enhances security, streamlines compliance efforts, reduces risk, and contributes to overall security resiliency and the trustworthiness of healthcare entities in an increasingly challenging cybersecurity landscape.
While HITRUST primarily focuses on the healthcare industry, its framework and certification program are adaptable and applicable to other industries. The HITRUST CSF is a set of controls and requirements that organizations must comply with to achieve HITRUST certification. The HITRUST R2 assessment is the process by which organizations are evaluated against the requirements of the HITRUST CSF. During the assessment, an independent third party assessor examines the organization’s technical security controls, operational policies and procedures, and the implementation of all controls to determine if they meet the specified HITRUST requirements.
HITRUST r2 validated assessment certification is a comprehensive process that involves meeting numerous assessment requirements. The number of requirements can vary significantly, ranging from 500 to 2,000 depending on your environment’s risk factors and regulatory requirements. Attempting to address all of these requirements simultaneously especially when migrating systems to Amazon Web Services (AWS) can be overwhelming. By using a strategy of separating your compliance journey into environments and applications, you can streamline the process and achieve HITRUST compliance more efficiently and within a realistic timeframe.
In this blog post, we start by exploring the HITRUST domain structure, highlighting the security objective of each domain. We then show how you can use AWS configurable services to help meet these objectives.
Lastly, we present a simple and practical reference architecture with an AWS multi-account implementation that you can use as the foundation for hosting your AWS application, highlighting the phased approach for HITRUST compliance. Please note that this blog is intended to assist with using AWS services in a manner that supports an organization’s HITRUST compliance, but a HITRUST assessment is at an organizational level and involves controls that extend beyond the organization’s use of AWS.
The HITRUST controls needed for certification are structured within 19 HITRUST domains, covering a wide range of technical and administrative control requirements. To efficiently manage the scope of your certification assessment, start by focusing on the AWS landing zone, which serves as a critical foundational infrastructure component for running applications. When establishing the AWS landing zone, verify that it aligns with the AWS HITRUST security control requirements that are dependent on the scope of your assessment. Note that these 19 domains are a combination of technical controls and foundational administrative controls.
After you’ve set up a HITRUST compliant landing zone, you can begin evaluating your applications for HITRUST compliance as you migrate them to AWS. When you expand and migrate applications to the HITRUST-certified AWS landing zone assessed by your third party assessor, you can inherit the HITRUST controls required for application assessment directly from the landing zone. This simplifies and narrows the scope of your assessment activities.
Figure 1 that follows shows the two key phases and how a bottom-up phased approach can be structured with related HITRUST controls.

Figure 1: HITRUST Phase 1 and Phase 2 high-level components
The diagram illustrates:
The HITRUST CSF based certification consists of 19 domains, which are broad categories that encompass various aspects of information security and privacy controls. These domains serve as a framework for your organization to assess and enhance its security posture. These domains cover a wide range of controls and practices related to information security, privacy, risk management, and compliance. Each domain consists of a set of control objectives and requirements that your organization must meet to achieve HITRUST certification.
The following table lists each domain, the key security objectives expected, and the AWS configurable services relevant to the security objectives. These are listed as a reference to give you an idea of the scope of each domain; the actual services and tools to meet specific HITRUST requirements will vary depending upon your scope and its HITRUST requirements.
Note: The information in this post is a general guideline and recommendation based on a phased approach for HITRUST r2 validated assessment. The examples are based on the information available at the time of publication and are not a full solution.
HITRUST domains, security objectives, and related AWS services |
||
| HITRUST domain | Summary of key security objectives expected in HITRUST domains | Related AWS configurable services |
| 1. Information Protection Program |
|
AWS Artifact AWS Service Catalog AWS Config Amazon Cybersecurity Awareness Training |
| 2. Endpoint Protection |
|
AWS Systems Manager AWS Config Amazon Inspector AWS Shield AWS WAF |
| 3. Portable Media Security |
|
AWS Identity and Access Management (IAM) Amazon Simple Storage Service (Amazon S3) AWS Key Management Service (AWS KMS) AWS CloudTrail Amazon Macie Amazon Cognito Amazon Workspaces Family |
| 4. Mobile Device Security |
|
AWS Database Migration Service (AWS DMS) AWS IoT Device Defender AWS Snowball AWS Config |
| 5. Wireless Security |
|
AWS Certificate Manager (ACM) |
| 6. Configuration Management |
|
AWS Config AWS Trusted Advisor Amazon CloudWatch AWS Security Hub Systems Manager |
| 7. Vulnerability Management |
|
Amazon Inspector CloudWatch Security Hub |
| 8. Network Protection |
|
Amazon Route 53 AWS Control Tower Amazon Virtual Private Cloud (Amazon VPC) AWS Transit Gateway Network Load Balancer AWS Direct Connect AWS Site-to-Site VPN AWS CloudFormation AWS WAF ACM |
| 9. Transmission Protection |
|
Systems Manager ACM |
| 10. Password Management |
|
AWS Secrets Manager, Systems Manager Parameter Store, AWS KMS |
| 11. Access Control |
|
IAM AWS Resource Access Manager (AWS RAM) Amazon GuardDuty AWS Identity Center |
| 12. Audit Logging & Monitoring |
|
AWS Control Tower Amazon S3 CloudTrail GuardDuty AWS Config CloudWatch Amazon VPC Flow logs Amazon OpenSearch Service |
| 13. Education, Training and Awareness |
|
Security Hub Amazon Cybersecurity Awareness Training Trusted Advisor |
| 14. Third-Party Assurance |
|
AWS Artifact AWS Service Organization Controls (SOC) Reports ISO27001 reports |
| 15. Incident Management |
|
AWS Incident Detection and Response Security Hub Amazon Inspector CloudTrail AWS Config Amazon Simple Notification Service (Amazon SNS) GuardDuty AWS WAF Shield CloudFormation |
| 16. Business Continuity & Disaster Recovery |
|
AWS Backup & Restore CloudFormation Amazon Aurora CrossRegion replication AWS Backup Disaster Recovery: Pilot Light, Warm Standby, Multi Site Active-Active |
| 17. Risk Management |
|
Trusted Advisor AWS Config Rules |
| 18. Physical & Environmental Security |
|
AWS Data Centers Amazon CloudFront AWS Regions and Global Infrastructure |
| 19. Data Protection & Privacy |
|
Amazon S3 AWS KMS Aurora OpenSearch Service AWS Artifact Macie |
Note: You can use AWS HITRUST-certified services to support your HITRUST compliance requirements. Use of these services in their default state doesn’t automatically ensure HITRUST certifiability. You must demonstrate compliance through formal formulation of policies, procedures, and implementation tailored to your scope, which involves configuring and customizing AWS HITRUST certified services to align precisely with HITRUST requirements within your scope and involves implementation of controls outside of the scope of the use of AWS services (such as appropriate organization-wide policies and procedures).
Figure 2 shows the recommended HITRUST Phase 1 and Phase 2 accounts and components within a landing zone.

Figure 2: HITRUST Phases 1 and 2 architecture including accounts and components
The reference architecture shown in Figure 2 illustrates:
The account group for HITRUST Phase 2 includes:
In this phase you define the scope of assessment, including the specific AWS landing zone components and configurations that must be HITRUST compliant. The primary focus here is to evaluate the foundational infrastructure’s compliance with HITRUST controls. This involves a comprehensive review of policies and procedures, and implementation of all requirements within the landing zone scope. Assessing this phase separately enables you to verify that your foundational infrastructure adheres to HITRUST controls. Some of the policies, procedures, and configurations that are HITRUST assessed in this phase can be inherited across multiple applications’ assessments in later phases. Assessing this infrastructure once and then inheriting these controls for applications can be more efficient than assessing each application individually.
By establishing a secure and compliant foundation at the start, you can plan application assessments in later phases, making it simpler for subsequent applications to adhere to HITRUST requirements. This can streamline the compliance process and reduce the overall time and effort required. By assessing the landing zone separately, you can identify and address compliance gaps or issues in your foundational infrastructure, reducing the risk of non-compliance for the applications built upon it. Use the following high-level technical approach for this phase of assessment.
During this phase, you examine your AWS workload application accounts to conduct HITRUST assessments for application systems that are running within the AWS landing zone. You have the option to inherit environment-related controls that have been certified as HITRUST compliant within the landing zone in the previous phase.
The following key steps are recommended in this phase:
By breaking the compliance process into distinct phases, you can concentrate your resources on specific areas and prioritize essential assets accordingly. This approach supports a focused strategy, systematically addressing critical controls, and helping you to fulfill compliance requirements in a scalable manner. Obtaining the initial certification for the infrastructure and platform layers establishes a robust foundational architecture for subsequent phases, which involve application systems.
Earning certification at each phase provides tangible evidence of progress in your compliance journey. This achievement instills confidence in both internal and external stakeholders, affirming your organization’s commitment to security and compliance.
For guidance on achieving, maintaining, and automating compliance in the cloud, reach out to AWS Security Assurance Services (AWS SAS) or your account team. AWS SAS is a PCI QSAC and HITRUST External Assessor that can help by tying together applicable audit standards to AWS service-specific features and functionality. They can help you build on frameworks such as PCI DSS, HITRUST CSF, NIST, SOC 2, HIPAA, ISO 27001, GDPR, and CCPA.
If you have feedback about this post, submit comments in the Comments section below. If you have questions about this post, start a new thread on the AWS Security, Identity, & Compliance re:Post or contact AWS Support.
Want more AWS Security news? Follow us on Twitter.
Post Syndicated from Eric Smith original https://www.servethehome.com/massive-intel-lga7529-socket-for-sierra-forest-at-ocp-summit-2023/
We get hands-on with the massive Intel LGA7529 socket at OCP Summit 2023. This is the 12-channel DDR5 socket for Intel’s 2024 generation CPUs
The post Massive Intel LGA7529 Socket for Sierra Forest at OCP Summit 2023 appeared first on ServeTheHome.
Post Syndicated from Jeimy Ruiz original https://github.blog/2023-10-27-demystifying-llms-how-they-can-do-things-they-werent-trained-to-do/
Large language models (LLMs) are revolutionizing the way we interact with software by combining deep learning techniques with powerful computational resources.
While this technology is exciting, many are also concerned about how LLMs can generate false, outdated, or problematic information, and how they sometimes even hallucinate (generating information that doesn’t exist) so convincingly. Thankfully, we can immediately put one rumor to rest. According to Alireza Goudarzi, senior researcher of machine learning (ML) for GitHub Copilot: “LLMs are not trained to reason. They’re not trying to understand science, literature, code, or anything else. They’re simply trained to predict the next token in the text.”
Let’s dive into how LLMs come to do the unexpected, and why. This blog post will provide comprehensive insights into LLMs, including their training methods and ethical considerations. Our goal is to help you gain a better understanding of LLM capabilities and how they’ve learned to master language, seemingly, without reasoning.
LLMs are AI systems that are trained on massive amounts of text data, allowing them to generate human-like responses and understand natural language in a way that traditional ML models can’t.
“These models use advanced techniques from the field of deep learning, which involves training deep neural networks with many layers to learn complex patterns and relationships,” explains John Berryman, a senior researcher of ML on the GitHub Copilot team.
What sets LLMs apart is their proficiency at generalizing and understanding context. They’re not limited to pre-defined rules or patterns, but instead learn from large amounts of data to develop their own understanding of language. This allows them to generate coherent and contextually appropriate responses to a wide range of prompts and queries.
And while LLMs can be incredibly powerful and flexible tools because of this, the ML methods used to train them, and the quality—or limitations—of their training data, can also lead to occasional lapses in generating accurate, useful, and trustworthy information.
The advent of modern ML practices, such as deep learning, has been a game-changer when it comes to unlocking the potential of LLMs. Unlike the earliest language models that relied on predefined rules and patterns, deep learning allows these models to create natural language outputs in a more human-like way.
“The entire discipline of deep learning and neural networks—which underlies all of this—is ‘how simple can we make the rule and get as close to the behavior of a human brain as possible?’” says Goudarzi.
By using neural networks with many layers, deep learning enables LLMs to analyze and learn complex patterns and relationships in language data. This means that these models can generate coherent and contextually appropriate responses, even in the face of complex sentence structures, idiomatic expressions, and subtle nuances in language.
While the initial pre-training equips LLMs with a broad language understanding, fine-tuning is where they become versatile and adaptable. “When developers want these models to perform specific tasks, they provide task descriptions and examples (few-shot learning) or task descriptions alone (zero-shot learning). The model then fine-tunes its pre-trained weights based on this information,” says Goudarzi. This process helps it adapt to the specific task while retaining the knowledge it gained from its extensive pre-training.
But even with deep learning’s multiple layers and attention mechanisms enabling LLMs to generate human-like text, it can also lead to overgeneralization, where the model produces responses that may not be contextually accurate or up to date.
There are several factors that shed light on why tools built on LLMs may be inaccurate at times, even while sounding quite convincing.
LLMs often lack an understanding of the external world or real-time context. They rely solely on the text they’ve been trained on, and they don’t possess an inherent awareness of the world’s current state. “Typically this whole training process takes a long time, and it’s not uncommon for the training data to be two years out of date for any given LLM,” says Albert Ziegler, principal researcher and member of the GitHub Next research and development team.
This limitation means they may generate inaccurate information based on outdated assumptions, since they can’t verify facts or events in real-time. If there have been developments or changes in a particular field or topic after they have been trained, LLMs may not be aware of them and may provide outdated information. This is why it’s still important to fact check any responses you receive from an LLM, regardless of how fact-based it may seem.
One of the primary reasons LLMs sometimes provide incorrect information is the lack of context. These models rely heavily on the information given in the input text, and if the input is ambiguous or lacks detail, the model may make assumptions that can lead to inaccurate responses.
LLMs are exposed to massive unlabelled data sets of text during pre-training that are diverse and representative of the language the model should understand. Common sources of data include books, articles, websites—even social media posts!
Because of this, they may inadvertently produce responses that reflect these biases or incorrect information present in their training data. This is especially concerning when it comes to sensitive or controversial topics.
“Their biases tend to be worse. And that holds true for machine learning in general, not just for LLMs. What machine learning does is identify patterns, and things like stereotypes can turn into extremely convenient shorthands. They might be patterns that really exist, or in the case of LLMs, patterns that are based on human prejudices that are talked about or implicitly used,” says Ziegler.
If a model is trained on a dataset that contains biased or discriminatory language, it may generate responses that are also biased or discriminatory. This can have real-world implications, such as reinforcing harmful stereotypes or discriminatory practices.
LLMs don’t have the ability to assess the correctness of the information they generate. Given their deep learning, they often provide responses with a high degree of confidence, prioritizing generating text that appears sensible and flows smoothly—even when the information is incorrect!
LLMs can sometimes “hallucinate” information due to the way they generate text (via patterns and associations). Sometimes, when they’re faced with incomplete or ambiguous queries, they try to complete them by drawing on these patterns, sometimes generating information that isn’t accurate or factual. Ultimately, hallucinations are not supported by evidence or real-world data.
For example, imagine that you ask ChatGPT about a historical issue in the 20th century. Instead, it describes a meeting between two famous historical figures who never actually met!
In the context of GitHub Copilot, Ziegler explains that “the typical hallucinations we encounter are when GitHub Copilot starts talking about code that’s not even there. Our mitigation is to make it give enough context to every piece of code it talks about that we can check and verify that it actually exists.”
But the GitHub Copilot team is already thinking about how to use hallucinations to their advantage in a “top-down” approach to coding. Imagine that you’re tackling a backlog issue, and you’re looking for GitHub Copilot to give you suggestions. As Johan Rosenkilde, principal researcher for GitHub Next, explains, “ideally, you’d want it to come up with a sub-division of your complex problem delegated to nicely delineated helper functions, and come up with good names for those helpers. And after suggesting code that calls the (still non-existent) helpers, you’d want it to suggest the implementation of them too!”
This approach to hallucination would be like getting the blueprint and the building blocks to solve your coding challenges.
It’s important to be aware of the ethical considerations that come along with using LLMs. That being said, while LLMs have the potential to generate false information, they’re not intentionally fabricating or deceiving. Instead, these arise from the model’s attempts to generate coherent and contextually relevant text based on the patterns and information it has learned from its training data.
The GitHub Copilot team has developed a few tools to help detect harmful content. Goudarzi says “First, we have a duplicate detection filter, which helps us detect matches between generated code and all open source code that we have access to, filtering such suggestions out. Another tool we use is called Responsible AI (RAI), and it’s a classifier that can filter out abusive words. Finally, we also separately filter out known unsafe patterns.”
Understanding the deep learning processes behind LLMs can help users grasp their limitations—as well as their positive impact. To navigate these effectively, it’s crucial to verify information from reliable sources, provide clear and specific input, and exercise critical thinking when interpreting LLM-generated responses.
As Berryman reminds us, “the engines themselves are amoral. Users can do whatever they want with them and that can run the gamut of moral to immoral, for sure. But by being conscious of these issues and actively working towards ethical practices, we can ensure that LLMs are used in a responsible and beneficial manner.”
Developers, researchers, and scientists continuously work to improve the accuracy and reliability of these models, making them increasingly valuable tools for the future. All of us can advocate for the responsible and ethical use of LLMs. That includes promoting transparency and accountability in the development and deployment of these models, as well as taking steps to mitigate biases and stereotypes in our own corners of the internet.
The post Demystifying LLMs: How they can do things they weren’t trained to do appeared first on The GitHub Blog.
Post Syndicated from Julian Wood original https://aws.amazon.com/blogs/compute/enhancing-runtime-security-and-governance-with-the-aws-lambda-runtime-api-proxy-extension/
This post is written by Anton Aleksandrov, Principal Serverless Solutions Architect, and Shridhar Pandey, Senior AWS Lambda Product Manager.
AWS Lambda runtimes use the Lambda Runtime API to communicate with the Lambda service. Runtimes use it to retrieve inbound events to be processed by the function handler, return successful handler responses to the Lambda service, and report failures. This post shows how to intercept inbound events and outbound responses without changing function code, using the Runtime API proxy pattern.
This approach enables security vendors and engineering teams to provide enhanced, non-invasive security and governance tools for Lambda functions. Use cases include sanitizing event payload, blocking malicious events, and auditing and augmenting payloads.
The Lambda Runtime API is an HTTP endpoint available within the Lambda execution environment. It allows the Lambda runtime that executes the function code to communicate with the Lambda service. It is used by managed Lambda runtimes, such as Node.js or Python, as well as custom runtime, which enables developers to create their own Lambda runtime in any programming language of their choice.
Lambda runtimes use the Runtime API to retrieve the next incoming event to be processed by the function handler and return the handler response to the Lambda service.
Lambda Extensions enable you to integrate Lambda functions with your organization’s preferred tools for monitoring, observability, security, and governance. You can use extensions from AWS, AWS Lambda Ready partners, and open-source projects for a wide range of use cases. Extensions allow adding functionality, such as pre-fetching configurations or dispatching telemetry, without making intrusive changes to function code. Lambda Extensions are packaged as Lambda layers and run as a separate process in the execution environment.
This is how runtimes and extensions communicate with the Lambda service via the Runtime API and Extensions API endpoints:

AWS Lambda Runtime API and Extensions API endpoints
When you register your extension with the Lambda service, you can specify you want to receive the INVOKE event. The Lambda service sends this event to the extension asynchronously when a function is invoked.
The information supplied contains the function invocation metadata, but not the event payload. This makes the event useful for observability, but limited for application security and governance use cases, such as inspecting payloads for vulnerabilities, sanitizing inputs, and blocking malicious events.
The Lambda Runtime API proxy is a pattern that enables you to hook into the function invocation request and response lifecycle. It allows you to use extensions to implement advanced security, compliance, governance, and observability scenarios without changes to function code. You can add runtime security mechanisms, implement audit procedures for data flowing in and out of the function, enhance observability by auto-injecting tracing headers, and many more.
This is how the Lambda Runtime consumes the Lambda Runtime API:

How the Lambda Runtime consumes the Lambda Runtime API
Lambda runtimes use the value of the AWS_LAMBDA_RUNTIME_API environment variable to make Runtime API requests. The two primary endpoints are /next, which is used to retrieve the next event to process, and /response, which is used to return event processing results to the Lambda service. In addition, the Runtime API also provides endpoints for reporting failures. See the full protocol and schema definitions of the Runtime API.
The Runtime API proxy is a component that you can build to hook into the invocation workflow. It proxies requests and responses, allowing you to augment them, and control the workflow:

Runtime API proxy hooks
When the Lambda service creates a new execution environment, it starts by initializing the extensions attached to the function. The execution environment waits for all extensions to register with the Lambda service by calling the Extensions API /register endpoint, then proceeds to initialize the runtime. This allows you to start the Runtime API proxy HTTP listener during extension initialization, making it ready to serve the runtime requests.

Runtime API proxy flow
By default, the value of the AWS_LAMBDA_RUNTIME_API environment variable in the runtime process points to the Lambda Runtime API endpoint 127.0.0.1:9001. You can use a wrapper script to change that value to point to the Runtime API proxy endpoint instead.
A wrapper script enables you to customize the runtime startup behavior of your Lambda function by letting you set configuration parameters that cannot be set through language-specific environment variables. You can add a wrapper script to your function by setting the AWS_LAMBDA_EXEC_WRAPPER environment variable. The following wrapper script assumes that the Runtime API Proxy is listening on port 9009.
#!/bin/bash
export AWS_LAMBDA_RUNTIME_API="127.0.0.1:9009"
exec "$@"
You can either add this export line to an existing wrapper script or create a new one.

Runtime API proxy example
The Runtime API Proxy is bootstrapped by the Lambda service when a new execution environment is created and it’s ready to proxy requests from the Lambda runtime to the Runtime API before first invocation.
AWS recommends you implement extensions using a programming language that compiles to a binary executable, such as Golang or Rust. This allows you to use the extension with any Lambda runtime. Extensions implemented in interpreted languages, such as JavaScript and Python, or languages that require additional virtual machines, such as Java and C#, can only be used with that specific runtime.
This diagram shows a scenario where both incoming events and outbound responses are processed by the extension. You can use this workflow for auditing event or response payloads, sanitizing them, or injecting additional properties. You can use it for scenarios like masking account numbers, stripping personally identifiable information (PII), or injecting observability headers.

Runtime API proxy logic
This diagram demonstrates an advanced scenario, where the first inbound event is identified as malicious, and rejected by the Runtime API proxy. The function handler is not invoked. The second event is not flagged as malicious, and is therefore forwarded to the handler for processing. You can use this workflow for security scenarios like runtime application protection.

Runtime API proxy security scenario
“Using Lambda Runtime API proxy solution is a game-changing approach for us. It enables us to support multiple Lambda runtimes with a single implementation, provides comprehensive visibility into Lambda execution, and allows to detect attackers targeting serverless applications,” says Julio Guerra, Engineering Manager, Application Security Management, Datadog.
“Lambda Runtime API proxy is a simple solution that gives us a pluggable way to protect Lambda Function URLs. We can implement request authorization and enrichment with no changes to function code,” says Ilya Zilber, Senior Manager, Solutions Engineering, Okta Inc.
Extensions run within the same execution environment as the function, so they have the same level of access to resources such as file system, networking, and environment variables. IAM permissions assigned to the function are shared with extensions. Our guidance is to assign the least required privileges to your functions.
Always install extensions from a trusted source only. Use Infrastructure as Code (IaC) tools, such as AWS CloudFormation, to simplify the task of attaching the same extension configuration, including AWS Identity and Access Management (IAM) permissions, to multiple functions. Additionally, IaC tools allow you to have an audit record of extensions and versions you’ve used previously.
When building extensions, do not log sensitive data. Sanitize payloads and metadata before logging or persisting them for audit purposes.
The Runtime API proxy approach allows you to hook into the Lambda request/response workflow, enabling new security and observability use cases. There are several important considerations:
You can find sample extensions implementing the Runtime API Proxy at https://github.com/aws-samples/aws-lambda-extensions/. See Golang, Rust, and Node.js samples.
Follow the instructions described in README.md for a step-by-step tutorial on running the extension.
This post introduces and illustrates the Lambda Runtime API proxy pattern. You can use this pattern to hook into the Lambda function request and response workflow to intercept, process, audit, modify, and block inbound events and handler responses.
You can use this pattern to implement enhanced runtime security and governance scenarios, as well as scenarios from other domains.. AWS customers and partners can use this advanced solution approach to add enhanced security and observability to Lambda functions without requiring code changes.
For more serverless learning resources, visit Serverless Land.
Post Syndicated from Netflix Technology Blog original https://netflixtechblog.com/kubernetes-and-kernel-panics-ed620b9c6225
How Netflix’s Container Platform Connects Linux Kernel Panics to Kubernetes Pods
By Kyle Anderson
With a recent effort to reduce customer (engineers, not end users) pain on our container platform Titus, I started investigating “orphaned” pods. There are pods that never got to finish and had to be garbage collected with no real satisfactory final status. Our Service job (think ReplicatSet) owners don’t care too much, but our Batch users care a lot. Without a real return code, how can they know if it is safe to retry or not?
These orphaned pods represent real pain for our users, even if they are a small percentage of the total pods in the system. Where are they going, exactly? Why did they go away?
This blog post shows how to connect the dots from the worst case scenario (a kernel panic) through to Kubernetes (k8s) and eventually up to us operators so that we can track how and why our k8s nodes are going away.
Orphaned pods get lost because the underlying k8s node object goes away. Once that happens a GC process deletes the pod. On Titus we run a custom controller to store the history of Pod and Node objects, so that we can save some explanation and show it to our users. This failure mode looks like this in our UI:
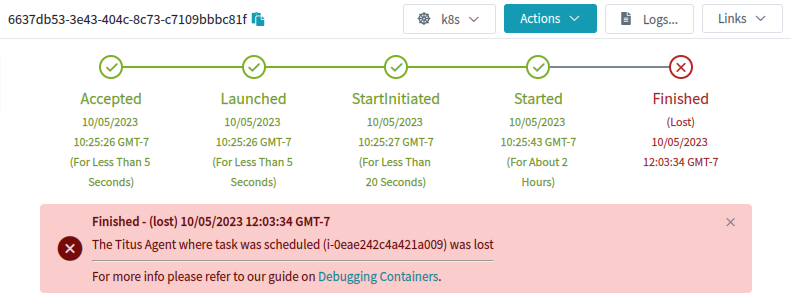
This is an explanation, but it wasn’t very satisfying to me or to our users. Why was the agent lost?
Nodes can go away for any reason, especially in “the cloud”. When this happens, usually a k8s cloud-controller provided by the cloud vendor will detect that the actual server, in our case an EC2 Instance, has actually gone away, and will in turn delete the k8s node object. That still doesn’t really answer the question of why.
How can we make sure that every instance that goes away has a reason, account for that reason, and bubble it up all the way to the pod? It all starts with an annotation:
{
     "apiVersion": "v1",
     "kind": "Pod",
     "metadata": {
          "annotations": {
               "pod.titus.netflix.com/pod-termination-reason": "Something really bad happened!",
...
Just making a place to put this data is a great start. Now all we have to do is make our GC controllers aware of this annotation, and then sprinkle it into any process that could potentially make a pod or node go away unexpectedly. Adding an annotation (as opposed to patching the status) preserves the rest of the pod as-is for historical purposes. (We also add annotations for what did the terminating, and a short reason-code for tagging)
The pod-termination-reason annotation is useful to populate human readable messages like:
But wait, how are we going to annotate a pod for a node that kernel panicked?
When the Linux kernel panics, there is just not much you can do. But what if you could send out some sort of “with my final breath, I curse Kubernetes!” UDP packet?
Inspired by this Google Spanner paper, where Spanner nodes send out a “last gasp” UDP packet to release leases & locks, you too can configure your servers to do the same upon kernel panic using a stock Linux module: netconsole.
The fact that the Linux kernel can even send out UDP packets with the string ‘kernel panic’, while it is panicking, is kind of amazing. This works because netconsole needs to be configured with almost the entire IP header filled out already beforehand. That is right, you have to tell Linux exactly what your source MAC, IP, and UDP Port are, as well as the destination MAC, IP, and UDP ports. You are practically constructing the UDP packet for the kernel. But, with that prework, when the time comes, the kernel can easily construct the packet and get it out the (preconfigured) network interface as things come crashing down. Luckily the netconsole-setup command makes the setup pretty easy. All the configuration options can be set dynamically as well, so that when the endpoint changes one can point to the new IP.
Once this is setup, kernel messages will start flowing right after modprobe. Imagine the whole thing operating like a dmesg | netcat -u $destination 6666, but in kernel space.
With netconsole setup, the last gasp from a crashing kernel looks like a set of UDP packets exactly like one might expect, where the data of the UDP packet is simply the text of the kernel message. In the case of a kernel panic, it will look something like this (one UDP packet per line):
Kernel panic - not syncing: buffer overrun at 0x4ba4c73e73acce54
[ 8374.456345] CPU: 1 PID: 139616 Comm: insmod Kdump: loaded Tainted: G OE
[ 8374.458506] Hardware name: Amazon EC2 r5.2xlarge/, BIOS 1.0 10/16/2017
[ 8374.555629] Call Trace:
[ 8374.556147] <TASK>
[ 8374.556601] dump_stack_lvl+0x45/0x5b
[ 8374.557361] panic+0x103/0x2db
[ 8374.558166] ? __cond_resched+0x15/0x20
[ 8374.559019] ? do_init_module+0x22/0x20a
[ 8374.655123] ? 0xffffffffc0f56000
[ 8374.655810] init_module+0x11/0x1000 [kpanic]
[ 8374.656939] do_one_initcall+0x41/0x1e0
[ 8374.657724] ? __cond_resched+0x15/0x20
[ 8374.658505] ? kmem_cache_alloc_trace+0x3d/0x3c0
[ 8374.754906] do_init_module+0x4b/0x20a
[ 8374.755703] load_module+0x2a7a/0x3030
[ 8374.756557] ? __do_sys_finit_module+0xaa/0x110
[ 8374.757480] __do_sys_finit_module+0xaa/0x110
[ 8374.758537] do_syscall_64+0x3a/0xc0
[ 8374.759331] entry_SYSCALL_64_after_hwframe+0x62/0xcc
[ 8374.855671] RIP: 0033:0x7f2869e8ee69
...
The last piece is to connect is Kubernetes (k8s). We need a k8s controller to do the following:
Parts 1&2 might look like this:
for {
    n, addr, err := serverConn.ReadFromUDP(buf)
    if err != nil {
        klog.Errorf("Error ReadFromUDP: %s", err)
    } else {
        line := santizeNetConsoleBuffer(buf[0:n])
        if isKernelPanic(line) {
            panicCounter = 20
            go handleKernelPanicOnNode(ctx, addr, nodeInformer, podInformer, kubeClient, line)
        }
    }
    if panicCounter > 0 {
        klog.Infof("KernelPanic context from %s: %s", addr.IP, line)
        panicCounter++
    }
}
And then parts 3&4 might look like this:
func handleKernelPanicOnNode(ctx context.Context, addr *net.UDPAddr, nodeInformer cache.SharedIndexInformer, podInformer cache.SharedIndexInformer, kubeClient kubernetes.Interface, line string) {
    node := getNodeFromAddr(addr.IP.String(), nodeInformer)
    if node == nil {
        klog.Errorf("Got a kernel panic from %s, but couldn't find a k8s node object for it?", addr.IP.String())
    } else {
        pods := getPodsFromNode(node, podInformer)
        klog.Infof("Got a kernel panic from node %s, annotating and deleting all %d pods and that node.", node.Name, len(pods))
        annotateAndDeletePodsWithReason(ctx, kubeClient, pods, line)
        err := deleteNode(ctx, kubeClient, node.Name)
        if err != nil {
            klog.Errorf("Error deleting node %s: %s", node.Name, err)
        } else {
            klog.Infof("Deleted panicked node %s", node.Name)
        }
    }
}
With that code in place, as soon as a kernel panic is detected, the pods and nodes immediately go away. No need to wait for any GC process. The annotations help document what happened to the node & pod:
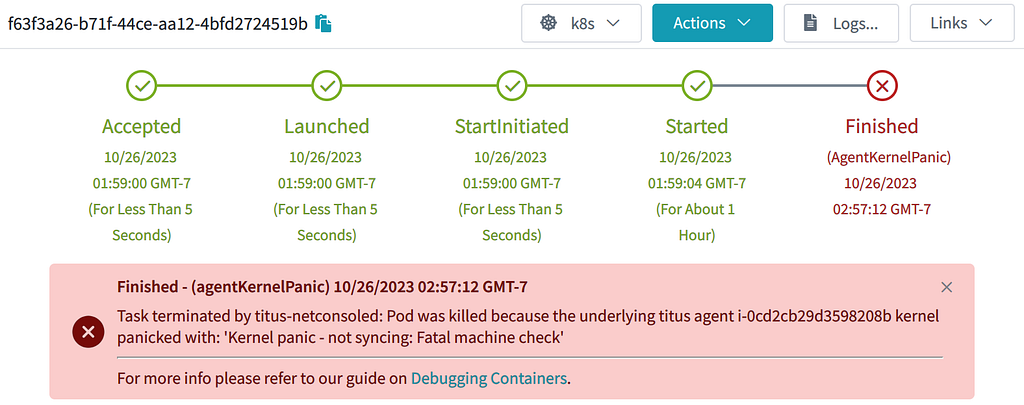
Marking that a job failed because of a kernel panic may not be that satisfactory to our customers. But they can take satisfaction in knowing that we now have the required observability tools to start fixing those kernel panics!
Do you also enjoy really getting to the bottom of why things fail in your systems or think kernel panics are cool? Join us on the Compute Team where we are building a world-class container platform for our engineers.
![]()
Kubernetes And Kernel Panics was originally published in Netflix TechBlog on Medium, where people are continuing the conversation by highlighting and responding to this story.
Post Syndicated from Talks at Google original https://www.youtube.com/watch?v=61ZC_2qhT4Y
Post Syndicated from corbet original https://lwn.net/Articles/948870/
User-space developers working with highly threaded applications would often
like to be able to use spinlocks to protect shared data structures from
concurrent access. There is a fundamental problem with user-space
spinlocks, though: there is no way to prevent a thread from being
preempted. Various ways of working around this problem have been explored,
but this
patch from Steven Rostedt questions the premise on which much of that
work is based: what if it were possible to prevent preemption, for a
short period at least?
Post Syndicated from corbet original https://lwn.net/Articles/949078/
For a view into the OpenBSD approach to security, see this message from
Theo de Raadt, where he describes a plan to remove the syscall() system call
(which allows the invocation of any available system call by providing its
number) from the kernel. The purpose, of course, is to make it harder for
an attacker to invoke an arbitrary system call, even if they are able to
run some code on the target system.
I hope I am forcing attack coders into using increasingly more
complicated methods. Same time, it means fewer methods are
available. Other methods make exploitation more fragile. This is
pushing success rates into “low-percent statistical” success. If
we teach more software stacks to “fail hard, don’t try to
recover”, that is an improvement in security.