Tag Archives: Architecture

Field Notes: Stopping an Automatically Started Database Instance with Amazon RDS

Post Syndicated from Islam Ghanim original https://aws.amazon.com/blogs/architecture/field-notes-stopping-an-automatically-started-database-instance-with-amazon-rds/

Customers needing to keep an Amazon Relational Database Service (Amazon RDS) instance stopped for more than 7 days, look for ways to efficiently re-stop the database after being automatically started by Amazon RDS. If the database is started and there is no mechanism to stop it; customers start to pay for the instance’s hourly cost. Moreover, customers with database licensing agreements could incur penalties for running beyond their licensed cores/users.

Stopping and starting a DB instance is faster than creating a DB snapshot, and then restoring the snapshot. However, if you plan to keep the Amazon RDS instance stopped for an extended period of time, it is advised to terminate your Amazon RDS instance and recreate it from a snapshot when needed.

This blog provides a step-by-step approach to automatically stop an RDS instance once the auto-restart activity is complete. This saves any costs incurred once the instance is turned on. The proposed architecture is fully serverless and requires no management overhead. It relies on AWS Step Functions and a set of Lambda functions to monitor RDS instance state and stop the instance when required.

Architecture overview

Given the autonomous nature of the architecture and to avoid management overhead, the architecture leverages serverless components.

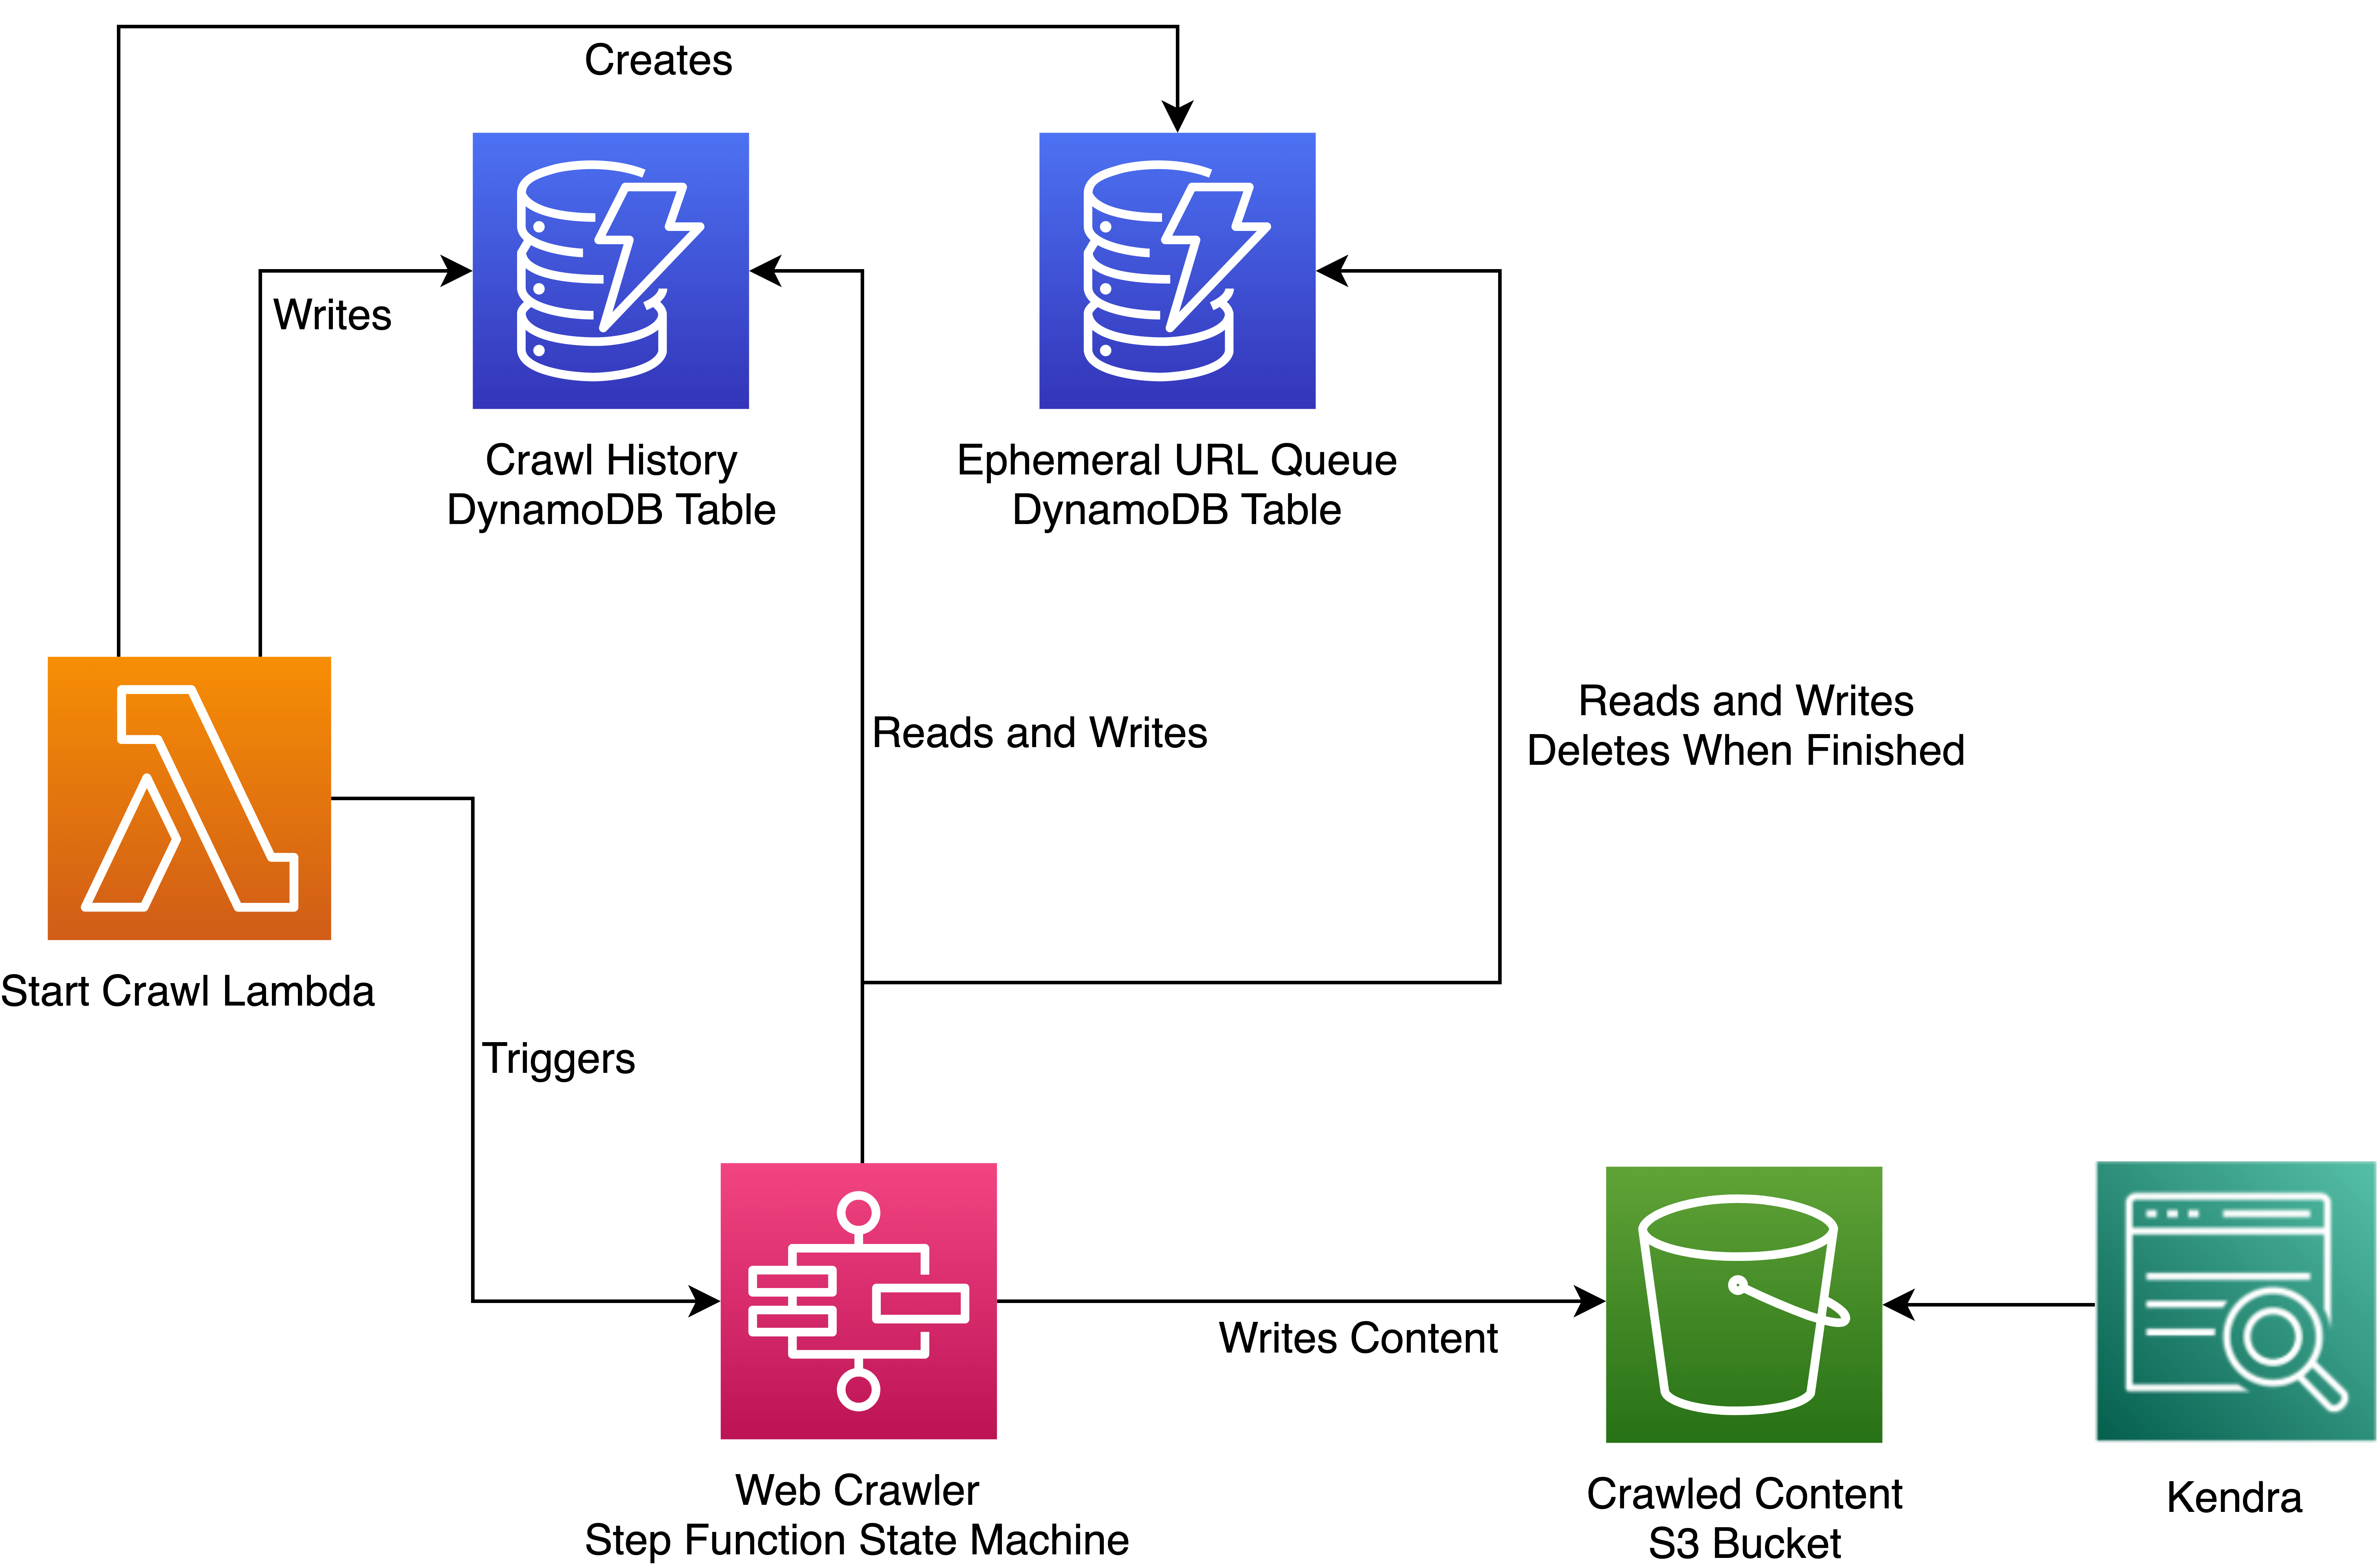
  • The architecture relies on RDS event notifications. Once a stopped RDS instance is started by AWS due to exceeding the maximum time in the stopped state; an event (RDS-EVENT-0154) is generated by RDS.
  • The RDS event is pushed to a dedicated SNS topic rds-event-notifications-topic.
  • The Lambda function start-statemachine-execution-lambda is subscribed to the SNS topic rds-event-notifications-topic.
    • The function filters messages with event code: RDS-EVENT-0154. In order to restrict the ‘force shutdown’ activity further, the function validates that the RDS instance is tagged with auto-restart-protection and that the tag value is set to ‘yes’.
    • Once all conditions are met, the Lambda function starts the AWS Step Functions state machine execution.
  • The AWS Step Functions state machine integrates with two Lambda functions in order to retrieve the instance state, as well as attempt to stop the RDS instance.
    • In case the instance state is not ‘available’, the state machine waits for 5 minutes and then re-checks the state.
    • Finally, when the Amazon RDS instance state is ‘available’; the state machine will attempt to stop the Amazon RDS instance.

Prerequisites

In order to implement the steps in this post, you need an AWS account as well as an IAM user with permissions to provision and delete resources of the following AWS services:

  • Amazon RDS
  • AWS Lambda
  • AWS Step Functions
  • AWS CloudFormation
  • AWS SNS
  • AWS IAM

Architecture implementation

You can implement the architecture using the AWS Management Console or AWS CLI.  For faster deployment, the architecture is available on GitHub. For more information on the repo, visit GitHub.

The steps below explain how to build the end-to-end architecture from within the AWS Management Console:

Create an SNS topic

  • Open the Amazon SNS console.
  • On the Amazon SNS dashboard, under Common actions, choose Create Topic.
  • In the Create new topic dialog box, for Topic name, enter a name for the topic (rds-event-notifications-topic).
  • Choose Create topic.
  • Note the Topic ARN for the next task (for example, arn:aws:sns:us-east-1:111122223333:my-topic).

Configure RDS event notifications

Amazon RDS uses Amazon Simple Notification Service (Amazon SNS) to provide notification when an Amazon RDS event occurs. These notifications can be in any notification form supported by Amazon SNS for an AWS Region, such as an email, a text message, or a call to an HTTP endpoint.

For this architecture, RDS generates an event indicating that instance has automatically restarted because it exceed the maximum duration to remain stopped. This specific RDS event (RDS-EVENT-0154) belongs to ‘notification’ category. For more information, visit Using Amazon RDS Event Notification.

To subscribe to an RDS event notification

  • Sign in to the AWS Management Console and open the Amazon RDS console.
  • In the navigation pane, choose Event subscriptions.
  • In the Event subscriptions pane, choose Create event subscription.
  • In the Create event subscription dialog box, do the following:
    • For Name, enter a name for the event notification subscription (RdsAutoRestartEventSubscription).
    • For Send notifications to, choose the SNS topic created in the previous step (rds-event-notifications-topic).
    • For Source type, choose ‘Instances’. Since our source will be RDS instances.
    • For Instances to include, choose ‘All instances’. Instances are included or excluded based on the tag, auto-restart-protection. This is to keep the architecture generic and to avoid regular configurations moving forward.
    • For Event categories to include, choose ‘Select specific event categories’.
    • For Specific event, choose ‘notification’. This is the category under which the RDS event of interest falls. For more information, review Using Amazon RDS Event Notification.
    •  Choose Create.
    • The Amazon RDS console indicates that the subscription is being created.

Create Lambda functions

Following are the three Lambda functions required for the architecture to work:

  1. start-statemachine-execution-lambda, the function will subscribe to the newly created SNS topic (rds-event-notifications-topic) and starts the AWS Step Functions state machine execution.
  2. retrieve-rds-instance-state-lambda, the function is triggered by AWS Step Functions state machine to retrieve an RDS instance state (example, available or stopped)
  3. stop-rds-instance-lambda, the function is triggered by AWS Step Functions state machine in order to attempt to stop an RDS instance.

First, create the Lambda functions’ execution role.

To create an execution role

  • Open the roles page in the IAM console.
  • Choose Create role.
  • Create a role with the following properties.
    • Trusted entity – Lambda.
    • Permissions – AWSLambdaBasicExecutionRole.
    • Role namerds-auto-restart-lambda-role.
    • The AWSLambdaBasicExecutionRole policy has the permissions that the function needs to write logs to CloudWatch Logs.

Now, create a new policy and attach to the role in order to allow the Lambda function to: start an AWS StepFunctions state machine execution, stop an Amazon RDS instance, retrieve RDS instance status, list tags and add tags.

Use the JSON policy editor to create a policy

  • Sign in to the AWS Management Console and open the IAM console.
  • In the navigation pane on the left, choose Policies.
  • Choose Create policy.
  • Choose the JSON tab.
  • Paste the following JSON policy document:
{
    "Version": "2012-10-17",
    "Statement": [
        {
            "Sid": "VisualEditor0",
            "Effect": "Allow",
            "Action": [
                "rds:AddTagsToResource",
                "rds:ListTagsForResource",
                "rds:DescribeDBInstances",
                "states:StartExecution",
                "rds:StopDBInstance"
            ],
            "Resource": "*"
        }
    ]
}
  • When you are finished, choose Review policy. The Policy Validator reports any syntax errors.
  • On the Review policy page, type a Name (rds-auto-restart-lambda-policy) and a Description (optional) for the policy that you are creating. Review the policy Summary to see the permissions that are granted by your policy. Then choose Create policy to save your work.

To link the new policy to the AWS Lambda execution role

  • Sign in to the AWS Management Console and open the IAM console.
  • In the navigation pane, choose Policies.
  • In the list of policies, select the check box next to the name of the policy to attach. You can use the Filter menu and the search box to filter the list of policies.
  • Choose Policy actions, and then choose Attach.
  • Select the IAM role created for the three Lambda functions. After selecting the identities, choose Attach policy.

Given the principle of least privilege, it is recommended to create 3 different roles restricting a function’s access to the needed resources only. 

Repeat the following step 3 times to create 3 new Lambda functions. Differences between the 3 Lambda functions are: (1) code and (2) triggers:

  • Open the Lambda console.
  • Choose Create function.
  • Configure the following settings:
    • Name
      • start-statemachine-execution-lambda
      • retrieve-rds-instance-state-lambda
      • stop-rds-instance-lambda
    • Runtime – Python 3.8.
    • Role – Choose an existing role.
    • Existing role – rds-auto-restart-lambda-role.
    • Choose Create function.
    • To configure a test event, choose Test.
    • For Event name, enter test.
  • Choose Create.
  • For the Lambda function —  start-statemachine-execution-lambda, use the following Python 3.8 sample code:
import json
import boto3
import logging
import os

#Logging
LOGGER = logging.getLogger()
LOGGER.setLevel(logging.INFO)

#Initialise Boto3 for RDS
rdsClient = boto3.client('rds')

def lambda_handler(event, context):

    #log input event
    LOGGER.info("RdsAutoRestart Event Received, now checking if event is eligible. Event Details ==> ", event)

    #Input event from the SNS topic originated from RDS event notifications
    snsMessage = json.loads(event['Records'][0]['Sns']['Message'])
    rdsInstanceId = snsMessage['Source ID']
    stepFunctionInput = {"rdsInstanceId": rdsInstanceId}
    rdsEventId = snsMessage['Event ID']

    #Retrieve RDS instance ARN
    db_instances = rdsClient.describe_db_instances(DBInstanceIdentifier=rdsInstanceId)['DBInstances']
    db_instance = db_instances[0]
    rdsInstanceArn = db_instance['DBInstanceArn']

    # Filter on the Auto Restart RDS Event. Event code: RDS-EVENT-0154. 

    if 'RDS-EVENT-0154' in rdsEventId:

        #log input event
        LOGGER.info("RdsAutoRestart Event detected, now verifying that instance was tagged with auto-restart-protection == yes")

        #Verify that instance is tagged with auto-restart-protection tag. The tag is used to classify instances that are required to be terminated once started. 

        tagCheckPass = 'false'
        rdsInstanceTags = rdsClient.list_tags_for_resource(ResourceName=rdsInstanceArn)
        for rdsInstanceTag in rdsInstanceTags["TagList"]:
            if 'auto-restart-protection' in rdsInstanceTag["Key"]:
                if 'yes' in rdsInstanceTag["Value"]:
                    tagCheckPass = 'true'
                    #log instance tags
                    LOGGER.info("RdsAutoRestart verified that the instance is tagged auto-restart-protection = yes, now starting the Step Functions Flow")
                else:
                    tagCheckPass = 'false'


        #log instance tags
        LOGGER.info("RdsAutoRestart Event detected, now verifying that instance was tagged with auto-restart-protection == yes")

        if 'true' in tagCheckPass:

            #Initialise StepFunctions Client
            stepFunctionsClient = boto3.client('stepfunctions')

            # Start StepFunctions WorkFlow
            # StepFunctionsArn is stored in an environment variable
            stepFunctionsArn = os.environ['STEPFUNCTION_ARN']
            stepFunctionsResponse = stepFunctionsClient.start_execution(
            stateMachineArn= stepFunctionsArn,
            name=event['Records'][0]['Sns']['MessageId'],
            input= json.dumps(stepFunctionInput)

        )

    else:

        LOGGER.info("RdsAutoRestart Event detected, and event is not eligible")

    return {
            'statusCode': 200
        }

And then, configure an SNS source trigger for the function start-statemachine-execution-lambda. RDS event notifications will be published to this SNS topic:

  • In the Designer pane, choose Add trigger.
  • In the Trigger configurations pane, select SNS as a trigger.
  • For SNS topic, choose the SNS topic previously created (rds-event-notifications-topic)
  • For Enable trigger, keep it checked.
  • Choose Add.
  • Choose Save.

For the Lambda function — retrieve-rds-instance-state-lambda, use the following Python 3.8 sample code:

import json
import logging
import boto3

#Logging
LOGGER = logging.getLogger()
LOGGER.setLevel(logging.INFO)

#Initialise Boto3 for RDS
rdsClient = boto3.client('rds')


def lambda_handler(event, context):
    

    #log input event
    LOGGER.info(event)
    
    #rdsInstanceId is passed as input to the lambda function from the AWS StepFunctions state machine.  
    rdsInstanceId = event['rdsInstanceId']
    db_instances = rdsClient.describe_db_instances(DBInstanceIdentifier=rdsInstanceId)['DBInstances']
    db_instance = db_instances[0]
    rdsInstanceState = db_instance['DBInstanceStatus']
    return {
        'statusCode': 200,
        'rdsInstanceState': rdsInstanceState,
        'rdsInstanceId': rdsInstanceId
    }

Choose Save.

For the Lambda function, stop-rds-instance-lambda, use the following Python 3.8 sample code:

import json
import logging
import boto3

#Logging
LOGGER = logging.getLogger()
LOGGER.setLevel(logging.INFO)

#Initialise Boto3 for RDS
rdsClient = boto3.client('rds')


def lambda_handler(event, context):
    
    #log input event
    LOGGER.info(event)
    
    rdsInstanceId = event['rdsInstanceId']
    
    #Stop RDS instance
    rdsClient.stop_db_instance(DBInstanceIdentifier=rdsInstanceId)
    
    #Tagging
    
    
    return {
        'statusCode': 200,
        'rdsInstanceId': rdsInstanceId
    }

Choose Save.

Create a Step Function

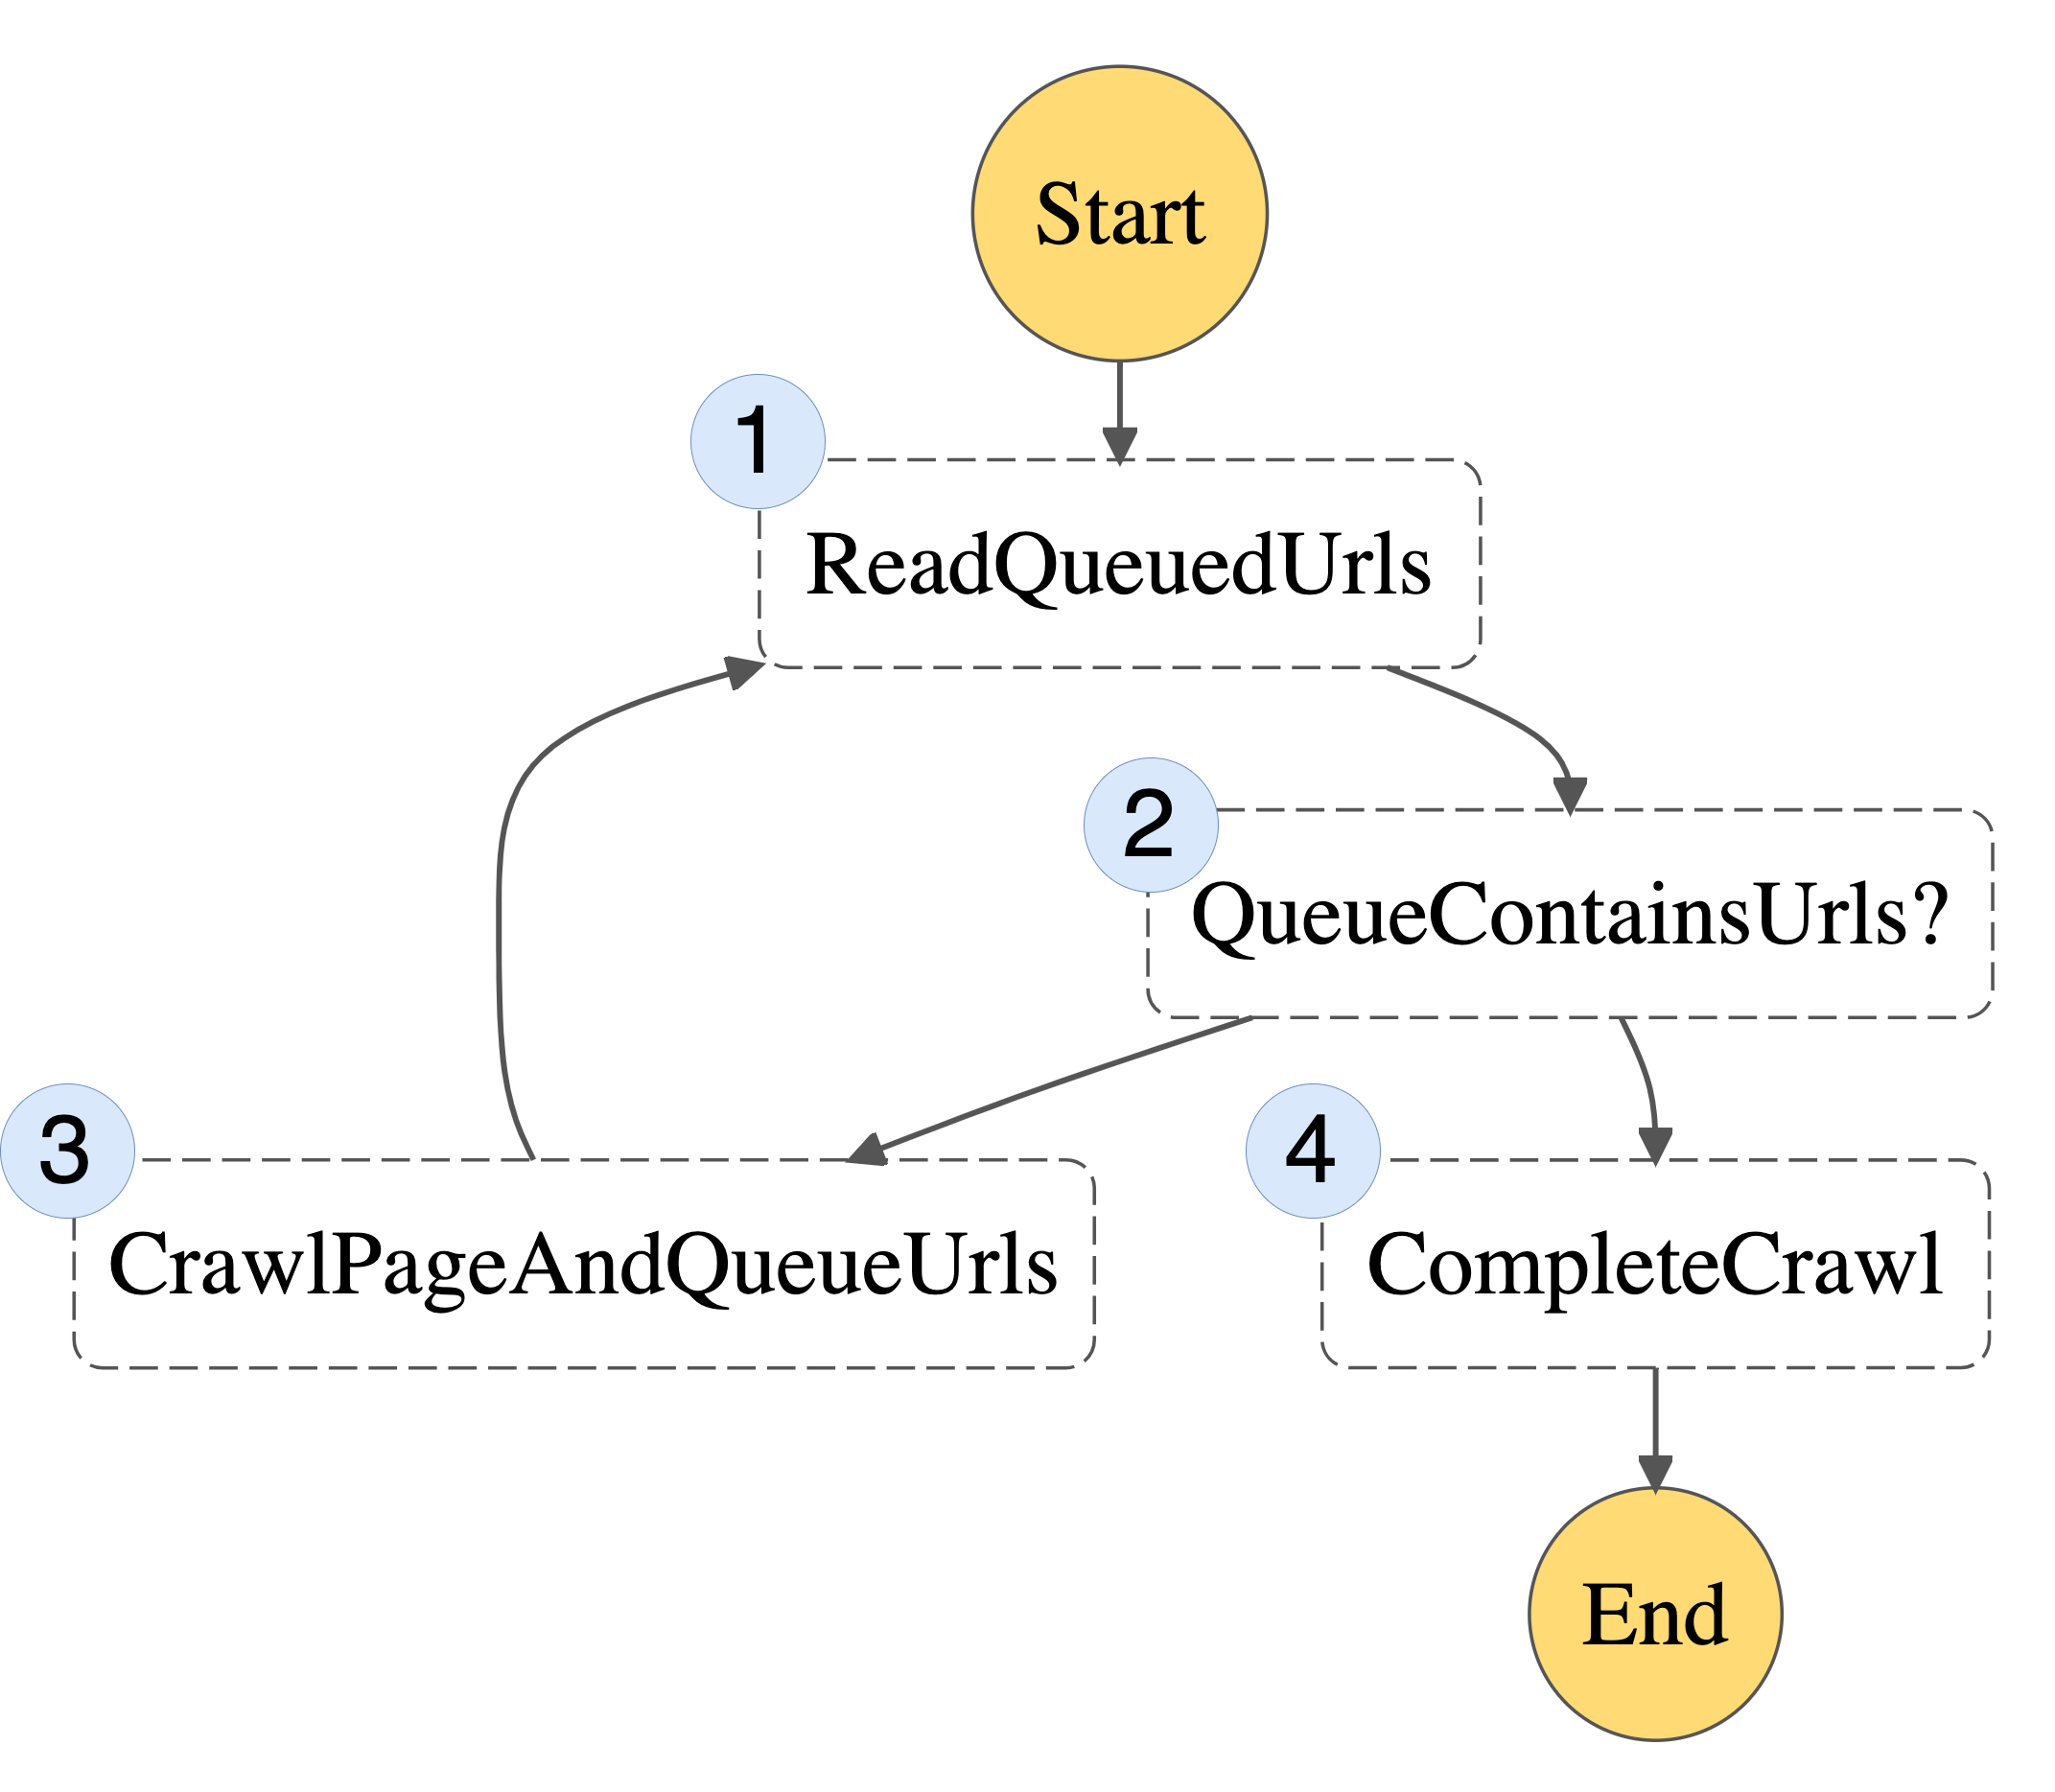
AWS Step Functions will execute the following service logic:

  1. Retrieve RDS instance state by calling Lambda function, retrieve-rds-instance-state-lambda. The Lambda function then returns the parameter, rdsInstanceState.
  2. If the rdsInstanceState parameter value is ‘available’, then the state machine will step into the next action calling the Lambda function, stop-rds-instance-lambda. If the rdsInstanceState is not ‘available’, the state machine will then wait for 5 minutes and then re-check the RDS instance state again.
  3. Stopping an RDS instance is an asynchronous operation and accordingly the state machine will keep polling the instance state once every 5 minutes until the rdsInstanceState parameter value becomes ‘stopped’. Only then, the state machine execution will complete successfully.

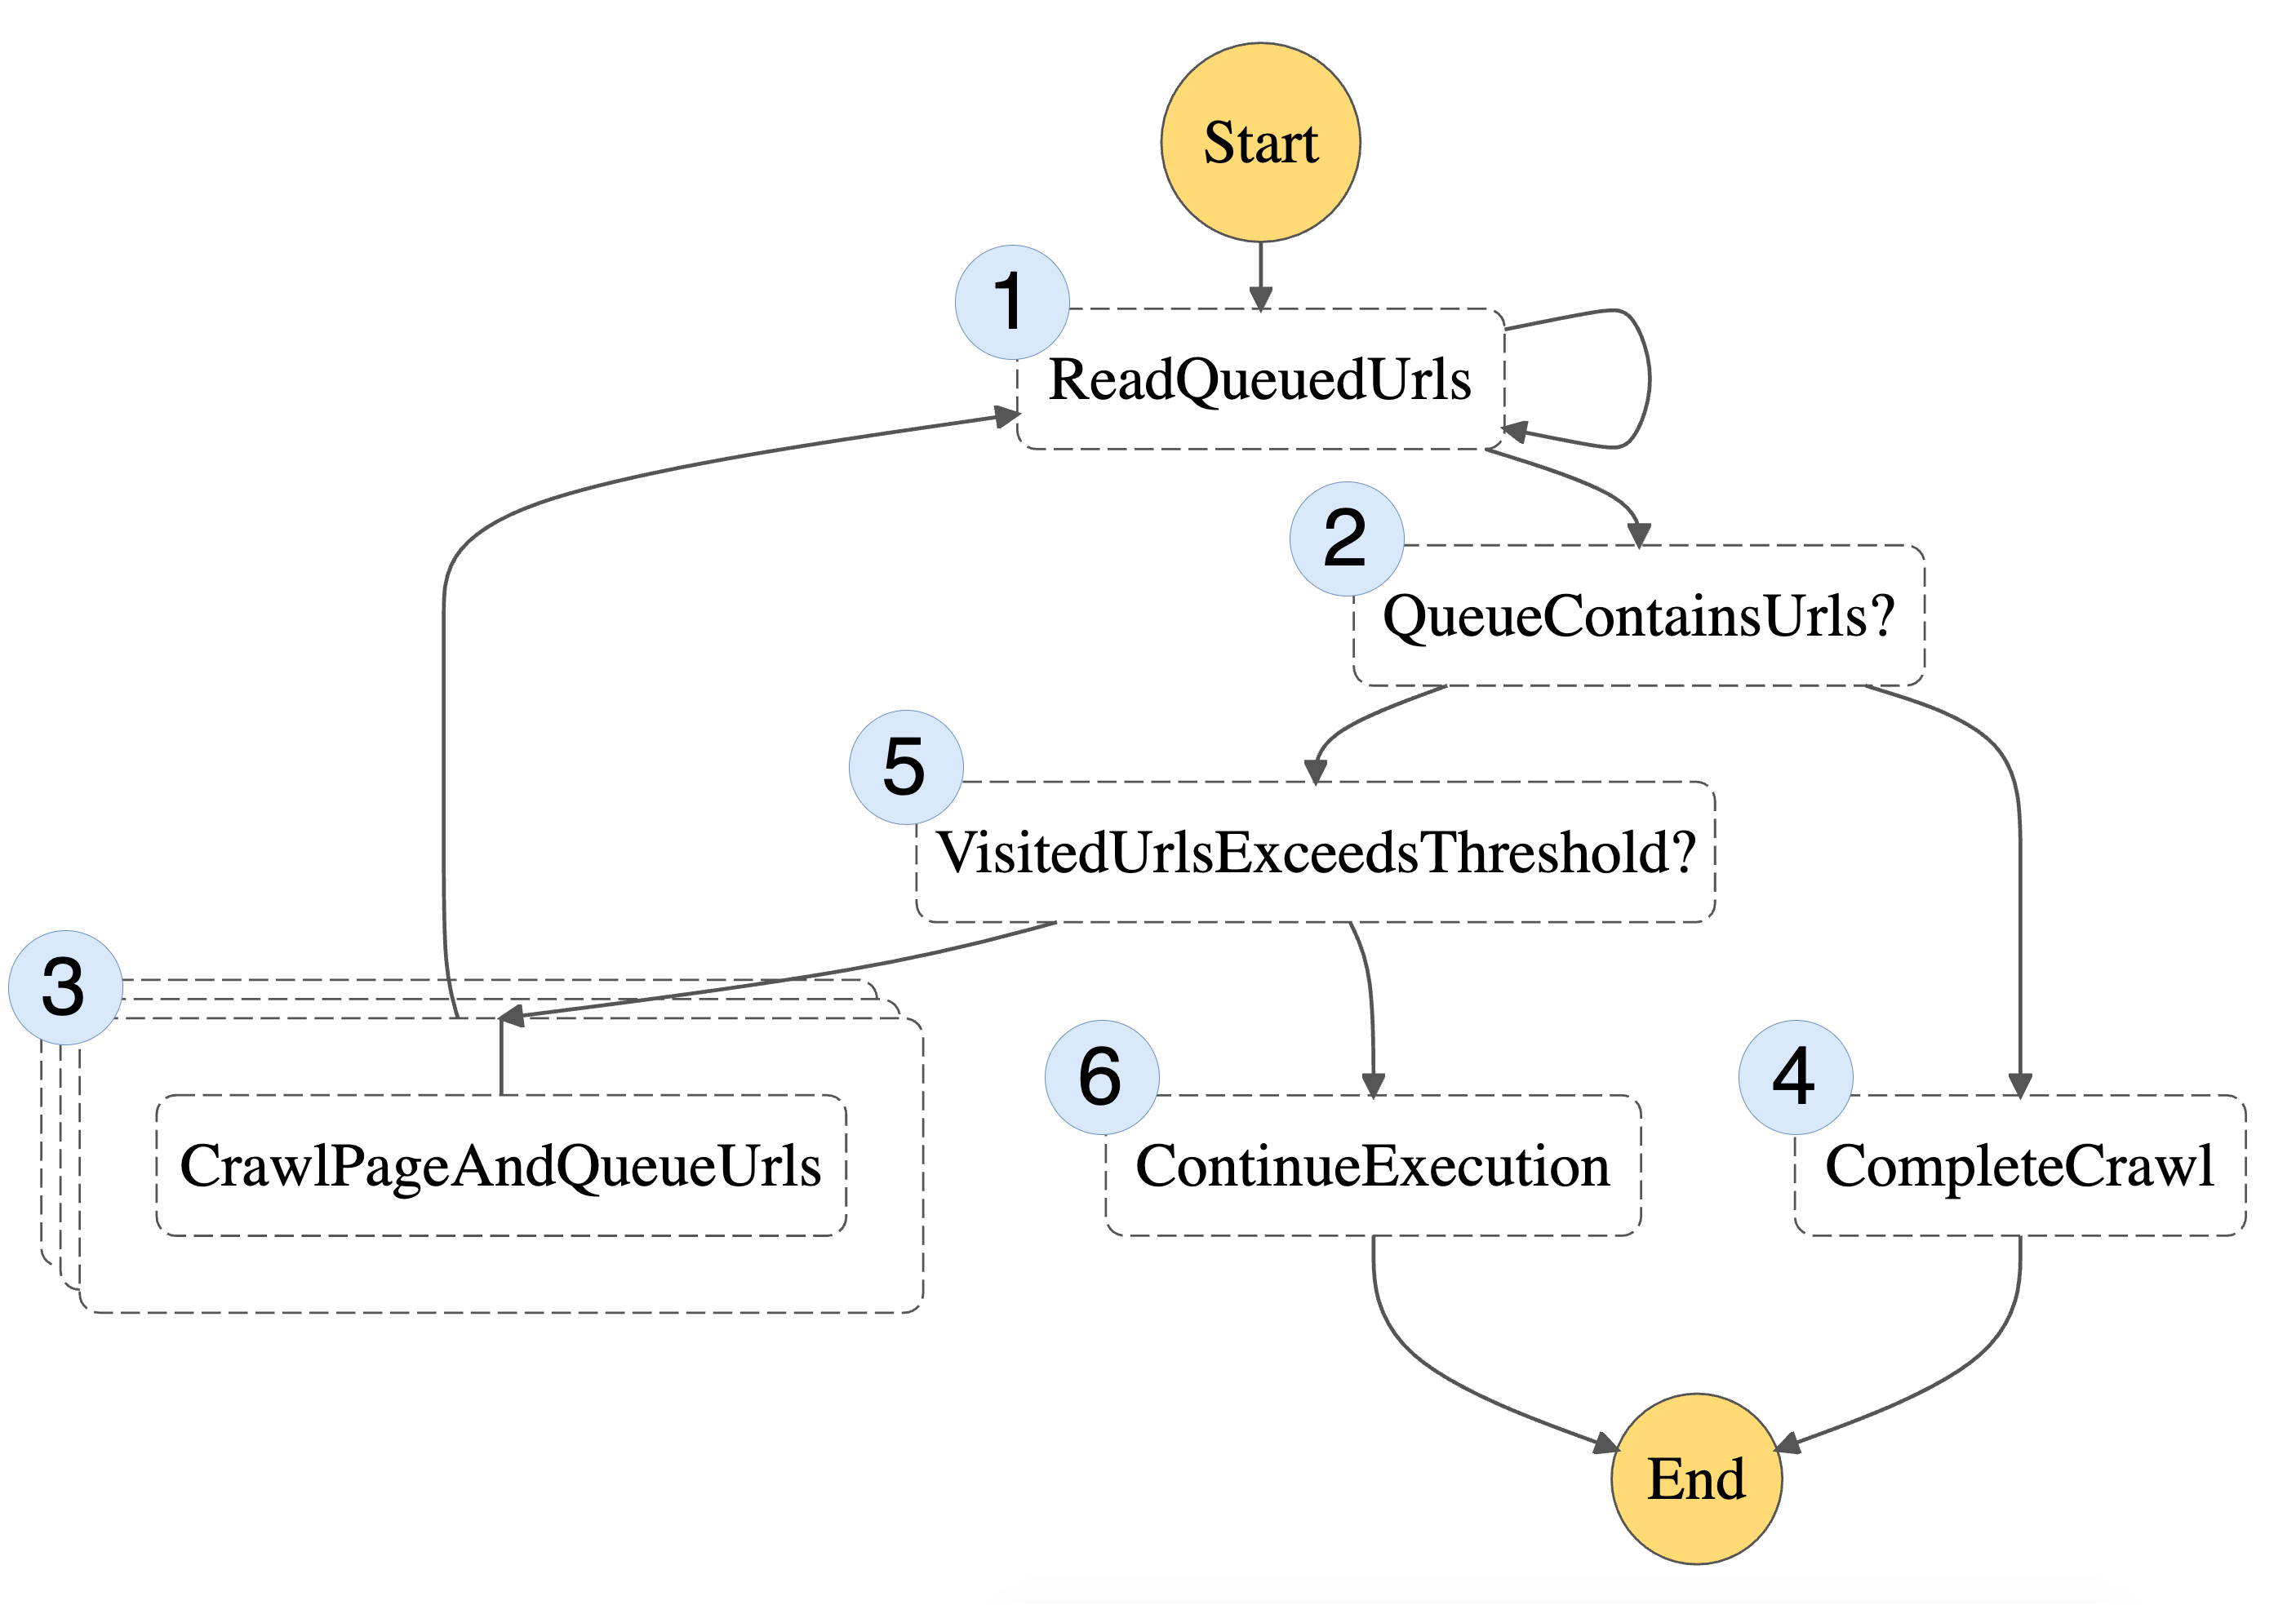
  • An RDS instance path to ‘available’ state may vary depending on the various maintenance activities scheduled for the instance.
  • Once the RDS notification event is generated, the instance will go through multiple states till it becomes ‘available’.
  • The use of the 5 minutes timer is to make sure that the automation flow will keep attempting to stop the instance once it becomes available.
  • The second part will make sure that the flow doesn’t end till the instance status is changed to ‘stopped’ and hence notifying the system administrator.

To create an AWS Step Functions state machine

  • Sign in to the AWS Management Console and open the Amazon RDS console.
  • In the navigation pane, choose State machines.
  • In the State machines pane, choose Create state machine.
  • On the Define state machine page, choose Author with code snippets. For Type, choose Standard.
  • Enter a Name for your state machine, stop-rds-instance-statemachine.
  • In the State machine definition pane, add the following state machine definition using the ARNs of the two Lambda function created earlier, as shown in the following code sample:
{
  "Comment": "stop-rds-instance-statemachine: Automatically shutting down RDS instance after a forced Auto-Restart",
  "StartAt": "retrieveRdsInstanceState",
  "States": {
    "retrieveRdsInstanceState": {
      "Type": "Task",
      "Resource": "retrieve-rds-instance-state-lambda Arn",
      "Next": "isInstanceAvailable"
    },
    "isInstanceAvailable": {
      "Type": "Choice",
      "Choices": [
        {
          "Variable": "$.rdsInstanceState",
          "StringEquals": "available",
          "Next": "stopRdsInstance"
        }
      ],
      "Default": "waitFiveMinutes"
    },
    "waitFiveMinutes": {
      "Type": "Wait",
      "Seconds": 300,
      "Next": "retrieveRdsInstanceState"
    },
    "stopRdsInstance": {
      "Type": "Task",
      "Resource": "stop-rds-instance-lambda Arn",
      "Next": "retrieveRDSInstanceStateStopping"
    },
    "retrieveRDSInstanceStateStopping": {
      "Type": "Task",
      "Resource": "retrieve-rds-instance-state-lambda Arn",
      "Next": "isInstanceStopped"
    },
    "isInstanceStopped": {
      "Type": "Choice",
      "Choices": [
        {
          "Variable": "$.rdsInstanceState",
          "StringEquals": "stopped",
          "Next": "notifyDatabaseAdmin"
        }
      ],
      "Default": "waitFiveMinutesStopping"
    },
    "waitFiveMinutesStopping": {
      "Type": "Wait",
      "Seconds": 300,
      "Next": "retrieveRDSInstanceStateStopping"
    },
    "notifyDatabaseAdmin": {
      "Type": "Pass",
      "Result": "World",
      "End": true
    }
  }
}

This is a definition of the state machine written in Amazon States Language which is used to describe the execution flow of an AWS Step Function.

Choose Next.

  • In the Name pane, enter a name for your state machine, stop-rds-instance-statemachine.
  • In the Permissions pane, choose Create new role. Take note of the the new role’s name displayed at the bottom of the page (example, StepFunctions-stop-rds-instance-statemachine-role-231ffecd).
  • Choose Create state machine
  • By default, the created role only grants the state machine access to CloudWatch logs. Since the state machine will have to make Lambda calls, then another IAM policy has to be associated with the new role.

Use the JSON policy editor to create a policy

  • Sign in to the AWS Management Console and open the IAM console.
  • In the navigation pane on the left, choose Policies.
  • Choose Create policy.
  • Choose the JSON tab.
  • Paste the following JSON policy document:
{
"Version": "2012-10-17",
"Statement": [
{
"Sid": "VisualEditor0",
"Effect": "Allow",
"Action": "lambda:InvokeFunction",
"Resource": "*"
}
]
}
  • When you are finished, choose Review policy. The Policy Validator reports any syntax errors.
  • On the Review policy page, type a Name rds-auto-restart-stepfunctions-policy and a Description (optional) for the policy that you are creating. Review the policy Summary to see the permissions that are granted by your policy.
  • Choose Create policy to save your work.

To link the new policy to the AWS Step Functions execution role

  • Sign in to the AWS Management Console and open the IAM console.
  • In the navigation pane, choose Policies.
  • In the list of policies, select the check box next to the name of the policy to attach. You can use the Filter menu and the search box to filter the list of policies.
  • Choose Policy actions, and then choose Attach.
  • Select the IAM role create for the state machine (example, StepFunctions-stop-rds-instance-statemachine-role-231ffecd). After selecting the identities, choose Attach policy.


Testing the architecture

In order to test the architecture, create a test RDS instance, tag it with auto-restart-protection tag and set the tag value to yes. While the RDS instance is still in creation process, test the Lambda function —  start-statemachine-execution-lambda with a sample event that simulates that the instance was started as it exceeded the maximum time to remain stopped (RDS-EVENT-0154).

To invoke a function

  • Sign in to the AWS Management Console and open the Lambda console.
  • In navigation pane, choose Functions.
  • In Functions pane, choose start-statemachine-execution-lambda.
  • In the upper right corner, choose Test.
  • In the Configure test event page, choose Create new test event and in Event template, leave the default Hello World option.
    {
    "Records": [
        {
        "EventSource": "aws:sns",
        "EventVersion": "1.0",
        "EventSubscriptionArn": "<RDS Event Subscription Arn>",
        "Sns": {
            "Type": "Notification",
            "MessageId": "10001-2d55da-9a73-5e42d46748c0",
            "TopicArn": "<SNS Topic Arn>",
            "Subject": "RDS Notification Message",
            "Message": "{\"Event Source\":\"db-instance\",\"Event Time\":\"2020-07-09 15:15:03.031\",\"Identifier Link\":\"https://console.aws.amazon.com/rds/home?region=<region>#dbinstance:id=<RDS instance id>\",\"Source ID\":\"<RDS instance id>\",\"Event ID\":\"http://docs.amazonwebservices.com/AmazonRDS/latest/UserGuide/USER_Events.html#RDS-EVENT-0154\",\"Event Message\":\"DB instance started\"}",
            "Timestamp": "2020-07-09T15:15:03.991Z",
            "SignatureVersion": "1",
            "Signature": "YsuM+L6N8rk+pBPBWoWeRcSuYqo/BN5v9D2lyoSg0B0uS46Q8NZZSoZWaIQi25TXfHY3RYXCXF9WbVGXiWa4dJs2Mjg46anM+2j6z9R7BDz0vt25qCrCyWhmWtc7yeETrlwa0jCtR/wxXFFexRwynqlZeDfvQpf/x+KNLrnJlT61WZ2FMTHYs124RwWU8NY3pm1Os0XOIvm8rfv3ywm1ccZfP4rF7Lfn+2EK6a0635Z/5aiyIlldNZxbgRYTODJYroO9INTlF7NPzVV1Y/K0E9aaL/wQgLZNquXQGCAxPFWy5lxJKeyUocOWcG48KJGIBUC36JJaqVdIilbZ9HvxTg==",
            "SigningCertUrl": "https://sns.<region>.amazonaws.com/SimpleNotificationService-a86cb10b4e1f29c941702d737128f7b6.pem",
            "UnsubscribeUrl": "https://sns.<region>.amazonaws.com/?Action=Unsubscribe&SubscriptionArn=<arn>",
            "MessageAttributes": {}
        }
        }
    ]
    }
start-statemachine-execution-lambda uses the SNS MessageId parameter as name for the AWS Step Functions execution. The name field is unique for a certain period of time, accordingly, with every test run the MessageId parameter value must be changed. 
  • Choose Create and then choose Test. Each user can create up to 10 test events per function. Those test events are not available to other users.
  • AWS Lambda executes your function on your behalf. The handler in your Lambda function receives and then processes the sample event.
  • Upon successful execution, view results in the console.
  • The Execution result section shows the execution status as succeeded and also shows the function execution results, returned by the return statement. Following is a sample response of the test execution:

Now, verify the execution of the AWS Step Functions state machine:

  • Sign in to the AWS Management Console and open the Amazon RDS console.
  • In navigation pane, choose State machines.
  • In the State machine pane, choose stop-rds-instance-statemachine.
  • In the Executions pane, choose the execution with the Name value passed in the test event MessageId parameter.
  • In the Visual workflow pane, the real-time execution status is displayed:

  • Under the Step details tab, all details related to inputs, outputs and exceptions are displayed:

Monitoring

It is recommended to use Amazon CloudWatch to monitor all the components in this architecture. You can use AWS Step Functions to log the state of the execution, inputs and outputs of each step in the flow. So when things go wrong, you can diagnose and debug problems quickly.

Cost

When you build the architecture using serverless components, you pay for what you use with no upfront infrastructure costs. Cost will depend on the number of RDS instances tagged to be protected against an automatic start.

Architectural considerations

This architecture has to be deployed per AWS Account per Region.

Conclusion

The blog post demonstrated how to build a fully serverless architecture that monitors and stops RDS instances restarted by AWS. This helps to avoid falling behind on any required maintenance updates. This architecture helps you save cost incurred by started instances’ running hours and licensing implications.  Feel free to submit enhancements to the GitHub repository or provide feedback in the comments.

Field Notes provides hands-on technical guidance from AWS Solutions Architects, consultants, and technical account managers, based on their experiences in the field solving real-world business problems for customers

Field Notes: Running a Stateful Java Service on Amazon EKS

Post Syndicated from Tom Cheung original https://aws.amazon.com/blogs/architecture/field-notes-running-a-stateful-java-service-on-amazon-eks/

This post was co-authored  by Tom Cheung, Cloud Infrastructure Architect, AWS Professional Services and Bastian Klein, Solutions Architect at AWS.

Containerization helps to create secure and reproducible runtime environments for applications. Container orchestrators help to run containerized applications by providing extended deployment and scaling capabilities, among others. Because of this, many organizations are installing such systems as a platform to run their applications on. Organizations often start their container adaption with new workloads that are well suited for the way how orchestrators manage containers.

After they gained their first experiences with containers, organizations start migrating their existing applications to the same container platform to simplify the infrastructure landscape and unify their deployment mechanisms.  Migrations come with some challenges, as the applications were not designed to run in a container environment. Many of the existing applications work in a stateful manner. They are persisting files to the local storage and make use of stateful sessions. Both requirements need to be met for the application to properly work in the container environment.

This blog post shows how to run a stateful Java service on Amazon EKS with the focus on how to handle stateful sessions You will learn how to deploy the service to Amazon EKS and how to save the session state in an Amazon ElastiCache Redis database. There is a GitHub Repository that provides all sources that are mentioned in this article. It contains AWS CloudFormation templates that will setup the required infrastructure, as well as the Java application code along with the Kubernetes resource templates.

The Java code used in this blog post and the GitHub Repository are based on a Blog Post from Java In Use: Spring Boot + Session Management Example Using Redis. Our thanks for this content contributed under the MIT-0 license to the Java In Use author.

Overview of architecture

Kubernetes is a popular Open Source container orchestrator that is widely used. Amazon EKS is the managed Kubernetes offering by AWS and used in this example to run the Java application. Amazon EKS manages the Control Plane for you and gives you the freedom to choose between self-managed nodes, managed nodes or AWS Fargate to run your compute.

The following architecture diagram shows the setup that is used for this article.

Container reference architecture


  • There is a VPC composed of three public subnets, three subnets used for the application and three subnets reserved for the database.
  • For this application, there is an Amazon ElastiCache Redis database that stores the user sessions and state.
  • The Amazon EKS Cluster is created with a Managed Node Group containing three t3.micro instances per default. Those instances run the three Java containers.
  • To be able to access the website that is running inside the containers, Elastic Load Balancing is set up inside the public subnets.
  • The Elastic Load Balancing (Classic Load Balancer) is not part of the CloudFormation templates, but will automatically be created by Amazon EKS, when the application is deployed.

Walkthrough

Here are the high-level steps in this post:

  • Deploy the infrastructure to your AWS Account
  • Inspect Java application code
  • Inspect Kubernetes resource templates
  • Containerization of the Java application
  • Deploy containers to the Amazon EKS Cluster
  • Testing and verification

Prerequisites

If you do not want to set this up on your local machine, you can use AWS Cloud9.

Deploying the infrastructure

To deploy the infrastructure, you first need to clone the Github repository.

git clone https://github.com/aws-samples/amazon-eks-example-for-stateful-java-service.git

This repository contains a set of CloudFormation Templates that set up the required infrastructure outlined in the architecture diagram. This repository also contains a deployment script deploy.sh that issues all the necessary CLI commands. The script has one required argument -p that reflects the aws cli profile that should be used. Review the Named Profiles documentation to set up a profile before continuing.

If the profile is already present, the deployment can be started using the following command:

./deploy.sh -p <profile name>

The creation of the infrastructure will roughly take 30 minutes.

The below table shows all configurable parameters of the CloudFormation template:

parameter name table

This template is initiating several steps to deploy the infrastructure. First, it validates all CloudFormation templates. If the validation was successful, an Amazon S3 Bucket is created and the CloudFormation Templates are uploaded there. This is necessary because nested stacks are used. Afterwards the deployment of the main stack is initiated. This will automatically trigger the creation of all nested stacks.

Java application code

The following code is a Java web application implemented using Spring Boot. The application will persist session data at Amazon ElastiCache Redis, which enables the app to become stateless. This is a crucial part of the migration, because it allows you to use Kubernetes horizontal scaling features with Kubernetes resources like Deployments, without the need to use sticky load balancer sessions.

This is the Java ElastiCache Redis implementation by Spring Data Redis and Spring Boot. It allows you to configure the host and port of the deployed Redis instance. Because this is environment-specific information, it is not configured in the properties file It is injected as environment variables during runtime.

/java-microservice-on-eks/src/main/java/com/amazon/aws/Config.java

@Configuration
@ConfigurationProperties("spring.redis")
public class Config {

    private String host;
    private Integer port;


    public String getHost() {
        return host;
    }

    public void setHost(String host) {
        this.host = host;
    }

    public Integer getPort() {
        return port;
    }

    public void setPort(Integer port) {
        this.port = port;
    }

    @Bean
    public LettuceConnectionFactory redisConnectionFactory() {

        return new LettuceConnectionFactory(new RedisStandaloneConfiguration(this.host, this.port));
    }

}


Containerization of Java application

/java-microservice-on-eks/Dockerfile

FROM openjdk:8-jdk-alpine

MAINTAINER Tom Cheung <email address>, Bastian Klein<email address>
VOLUME /tmp
VOLUME /target

RUN addgroup -S spring && adduser -S spring -G spring
USER spring:spring
ARG DEPENDENCY=target/dependency
COPY ${DEPENDENCY}/BOOT-INF/lib /app/lib
COPY ${DEPENDENCY}/META-INF /app/META-INF
COPY ${DEPENDENCY}/BOOT-INF/classes /app
COPY ${DEPENDENCY}/org /app/org

ENTRYPOINT ["java","-Djava.security.egd=file:/dev/./urandom","-cp","app:app/lib/*", "com/amazon/aws/SpringBootSessionApplication"]


This is the Dockerfile to build the container image for the Java application. OpenJDK 8 is used as the base container image. Because of the way Docker images are built, this sample explicitly does not use a so-called ‘fat jar’. Therefore, you have separate image layers for the dependencies and the application code. By leveraging the Docker caching mechanism, optimized build and deploy times can be achieved.

Kubernetes Resources

After reviewing the application specifics, we will now see which Kubernetes Resources are required to run the application.

Kubernetes uses the concept of config maps to store configurations as a resource within the cluster. This allows you to define key value pairs that will be stored within the cluster and which are accessible from other resources.

/java-microservice-on-eks/k8s-resources/config-map.yaml

apiVersion: v1
kind: ConfigMap
metadata:
  name: java-ms
  namespace: default
data:
  host: "***.***.0001.euc1.cache.amazonaws.com"
  port: "6379"

In this case, the config map is used to store the connection information for the created Redis database.

To be able to run the application, Kubernetes Deployments are used in this example. Deployments take care to maintain the state of the application (e.g. number of replicas) with additional deployment capabilities (e.g. rolling deployments).

/java-microservice-on-eks/k8s-resources/deployment.yaml

apiVersion: apps/v1
kind: Deployment
metadata:
  name: java-ms
  # labels so that we can bind a Service to this Pod
  labels:
    app: java-ms
spec:
  replicas: 3
  selector:
    matchLabels:
      app: java-ms
  template:
    metadata:
      labels:
        app: java-ms
    spec:
      containers:
      - name: java-ms
        image: bastianklein/java-ms:1.2
        imagePullPolicy: Always
        resources:
          requests:
            cpu: "500m" #half the CPU free: 0.5 Core
            memory: "256Mi"
          limits:
            cpu: "1000m" #max 1.0 Core
            memory: "512Mi"
        env:
          - name: SPRING_REDIS_HOST
            valueFrom:
              configMapKeyRef:
                name: java-ms
                key: host
          - name: SPRING_REDIS_PORT
            valueFrom:
              configMapKeyRef:
                name: java-ms
                key: port
        ports:
        - containerPort: 8080
          name: http
          protocol: TCP

Deployments are also the place for you to use the configurations stored in config maps and map them to environment variables. The respective configuration can be found under “env”. This setup relies on the Spring Boot feature that is able to read environment variables and write them into the according system properties.

Now that the containers are running, you need to be able to access those containers as a whole from within the cluster, but also from the internet. To be able to route traffic cluster internally Kubernetes has a resource called Service. Kubernetes Services get a Cluster internal IP and DNS name assigned that can be used to access all containers that belong to that Service. Traffic will, by default, be distributed evenly across all replicas.

/java-microservice-on-eks/k8s-resources/service.yaml

apiVersion: v1
kind: Service
metadata:
  name: java-ms
spec:
  type: LoadBalancer
  ports:
    - protocol: TCP
      port: 80 # Port for LB, AWS ELB allow port 80 only  
      targetPort: 8080 # Port for Target Endpoint
  selector:
    app: java-ms
    

The “selector“ defines which Pods belong to the services. It has to match the labels assigned to the pods. The labels are assigned in the “metadata” section in the deployment.

Deploy the Java service to Amazon EKS

Before the deployment can start, there are some steps required to initialize your local environment:

  1. Update the local kubeconfig to configure the kubectl with the created cluster
  2. Update the k8s-resources/config-map.yaml to the created Redis Database Address
  3. Build and package the Java Service
  4. Build and push the Docker image
  5. Update the k8s-resources/deployment.yaml to use the newly created image

These steps can be automatically executed using the init.sh script located in the repository. The script needs following parameter:

  1.  -u – Docker Hub User Name
  2.  -r – Repository Name
  3.  -t – Docker image version tag

A sample invocation looks like this: ./init.sh -u bastianklein -r java-ms -t 1.2

This information is used to concatenate the full docker repository string. In the preceding example this would resolve to bastianklein/java-ms:1.2, which will automatically be pushed to your Docker Hub repository. If you are not yet logged in to docker on the command line execute docker login and follow the displayed steps before executing the init.sh script.

As everything is set up, it is time to deploy the Java service. The below list of commands first deploys all Kubernetes resources and then lists pods and services.

kubectl apply -f k8s-resources/

This will output:

configmap/java-ms created
deployment.apps/java-ms created
service/java-ms created


Now, list the freshly created pods by issuing kubectl get pods.

NAME                                                READY       STATUS                             RESTARTS   AGE

java-ms-69664cc654-7xzkh   0/1     ContainerCreating   0          1s

java-ms-69664cc654-b9lxb   0/1     ContainerCreating   0          1s


Let’s also review the created service kubectl get svc.

NAME            TYPE                   CLUSTER-IP         EXTERNAL-IP                                                        PORT(S)                   AGE            SELECTOR

java-ms          LoadBalancer    172.20.83.176         ***-***.eu-central-1.elb.amazonaws.com         80:32300/TCP       33s               app=java-ms

kubernetes     ClusterIP            172.20.0.1               <none>                                                                      443/TCP                 2d1h            <none>


What we can see here is that the Service with name java-ms has an External-IP assigned to it. This is the DNS Name of the Classic Loadbalancer that is created behind the scenes. If you open that URL, you should see the Website (this might take a few minutes for the ELB to be provisioned).

Testing and verification

The webpage that opens should look similar to the following screenshot. In the text field you can enter text that is saved on clicking the “Save Message” button. This text will be listed in the “Messages” as shown in the following screenshot. These messages are saved as session data and now persists at Amazon ElastiCache Redis.

screenboot session example

By destroying the session, you will lose the saved messages.

Cleaning up

To avoid incurring future charges, you should delete all created resources after you are finished with testing. The repository contains a destroy.sh script. This script takes care to delete all deployed resources.

The script requires one parameter -p that requires the aws cli profile name that should be used: ./destroy.sh -p <profile name>

Conclusion

This post showed you the end-to-end setup of a stateful Java service running on Amazon EKS. The service is made scalable by saving the user sessions and the according session data in a Redis database. This solution requires changing the application code, and there are situations where this is not an option. By using StatefulSets as Kubernetes Resource in combination with an Application Load Balancer and sticky sessions, the goal of replicating the service can still be achieved.

We chose to use a Kubernetes Service in combination with a Classic Load Balancer. For a production workload, managing incoming traffic with a Kubernetes Ingress and an Application Load Balancer might be the better option. If you want to know more about Kubernetes Ingress with Amazon EKS, visit our Application Load Balancing on Amazon EKS documentation.

Field Notes provides hands-on technical guidance from AWS Solutions Architects, consultants, and technical account managers, based on their experiences in the field solving real-world business problems for customers.

Amazon MSK backup for Archival, Replay, or Analytics

Post Syndicated from Rohit Yadav original https://aws.amazon.com/blogs/architecture/amazon-msk-backup-for-archival-replay-or-analytics/

Amazon MSK is a fully managed service that helps you build and run applications that use Apache Kafka to process streaming data. Apache Kafka is an open-source platform for building real-time streaming data pipelines and applications. With Amazon MSK, you can use native Apache Kafka APIs to populate data lakes. You can also stream changes to and from databases, and power machine learning and analytics applications.

Amazon MSK simplifies the setup, scaling, and management of clusters running Apache Kafka. MSK manages the provisioning, configuration, and maintenance of resources for a highly available Kafka clusters. It is fully compatible with Apache Kafka and supports familiar community-build tools such as MirrorMaker 2.0, Kafka Connect and Kafka streams.

Introduction

In the past few years, the volume of data that companies must ingest has increased significantly. Information comes from various sources, like transactional databases, system logs, SaaS platforms, mobile, and IoT devices. Businesses want to act as soon as the data arrives. This has resulted in increased adoption of scalable real-time streaming solutions. These solutions scale horizontally to provide the needed throughput to process data in real time, with milliseconds of latency. Customers have adopted Amazon MSK as a top choice of streaming platforms. Amazon MSK gives you the flexibility to retain topic data for longer term (default 7 days). This supports replay, analytics, and machine learning based use cases. When IT and business systems are producing and processing terabytes of data per hour, it can become expensive to store, manage, and retrieve data. This has led to legacy data archival processes moving towards cheaper, reliable, and long-term storage solutions like Amazon Simple Storage Service (S3).

Following are some of the benefits of archiving Amazon MSK topic data to Amazon S3:

  1. Reduced Cost – You only must retain the data in the cluster based on your Recovery Point Objective (RPO). Any historical data can be archived in Amazon S3 and replayed if necessary.
  2. Integration with Enterprise Data Lake – Since your data is available in S3, you can now integrate with other data analytics services like Amazon EMR, AWS Glue, Amazon Athena, to run data aggregation and analytics. For example, you can build reports to visualize month over month changes.
  3. Optimize Machine Learning Workloads – Machine learning applications will be able to train new models and improve predictions using historical streams of data available in Amazon S3. This also enables better integration with Amazon Machine Learning services.
  4. Compliance – Long-term data archival for regulatory and security compliance.
  5. Backloading data to other systems – Ability to rebuild data into other application environments such as pre-prod, testing, and more.

There are many benefits to using Amazon S3 as long-term storage for Amazon MSK topics. Let’s dive deeper into the recommended architecture for this pattern. We will present an architecture to back up Amazon MSK topics to Amazon S3 in real time. In addition, we’ll demonstrate some of the use cases previously mentioned.

Architecture

The diagram following illustrates the architecture for building a real-time archival pipeline to archive Amazon MSK topics to S3. This architecture uses an AWS Lambda function to process records from your Amazon MSK cluster when the cluster is configured as an event source. As a consumer, you don’t need to worry about infrastructure management or scaling with Lambda. You only pay for what you consume, so you don’t pay for over-provisioned infrastructure.

To create an event source mapping, you can add your Amazon MSK cluster in a Lambda function trigger. The Lambda service internally polls for new records or messages from the event source, and then synchronously invokes the target Lambda function. Lambda reads the messages in batches from one or more partitions and provides these to your function as an event payload. The function then processes records, and sends the payload to an Amazon Kinesis Data Firehose delivery stream. We use Kinesis Data Firehose delivery stream because it can natively batch, compress, transform, and encrypt your events before loading to S3.

In this architecture, Kinesis Data Firehose delivers the records received from Lambda in Gzip file to Amazon S3. These files are partitioned in hive style format by Kinesis Data Firehose:

data/year = yyyy/month = MM/day = dd/hour = HH

Figure 1. Archival Architecture

Figure 1. Archival Architecture

Let’s review some of the possible solutions that can be built on this archived data.

Integration with Enterprise Data Lake

The architecture diagram following shows how you can integrate the archived data in Amazon S3 with your Enterprise Data Lake. Since the data files are prefixed in hive style format, you can partition and store the Data Catalog in AWS Glue. With partitioning in place, you can perform optimizations like partition pruning, which enables predicate pushdown for improved performance of your analytics queries. You can also use AWS Data Analytics services like Amazon EMR and AWS Glue for batch analytics. Amazon Athena can be used to run serverless SQL-like interactive queries on visualization and data.

Data currently gets stored in JSON files. Following are some of the services/tools that can be integrated with your archive for reporting, analytics, visualization, and machine learning requirements.

Figure 2. Analytics Architecture

Figure 2. Analytics Architecture

Cloning data into other application environments

There are use cases where you would want to use this data to clone other application environments using this archive.

These clusters could be used for testing or debugging purposes. You could decide to use only a subset of your data from the archive. Let’s say you want to debug an issue beyond the configured retention period, but not replicate all the data to your testing environment. With archived data in S3, you can build downstream jobs to filter data that can be loaded into a new Amazon MSK cluster. The following diagram highlights this pattern:

Figure 3. Replay Architecture

Figure 3. Replay Architecture

Ready for a Test Drive

To help you get started, we would like to introduce an AWS Solution: AWS Streaming Data Solution for Amazon MSK (scroll down and see Option 3 tab). There is a single-click AWS CloudFormation template, which can assist you in quickly provisioning resources. This will get your real-time archival pipeline for Amazon MSK up and running quickly. This solution shortens your development time by removing or reducing the need for you to:

  • Model and provision resources using AWS CloudFormation
  • Set up Amazon CloudWatch alarms, dashboards, and logging
  • Manually implement streaming data best practices in AWS

This solution is data and logic agnostic, enabling you to start with boilerplate code and start customizing quickly. After deployment, use this solution’s monitoring capabilities to transition easily to production.

Conclusion

In this post, we explained the architecture to build a scalable, highly available real-time archival of Amazon MSK topics to long term storage in Amazon S3. The architecture was built using Amazon MSK, AWS Lambda, Amazon Kinesis Data Firehose, and Amazon S3. The architecture also illustrates how you can integrate your Amazon MSK streaming data in S3 with your Enterprise Data Lake.

Field Notes: Protecting Domain-Joined Workloads with CloudEndure Disaster Recovery

Post Syndicated from Daniel Covey original https://aws.amazon.com/blogs/architecture/field-notes-protecting-domain-joined-workloads-with-cloudendure-disaster-recovery/

Co-authored by Daniel Covey, Solutions Architect, at CloudEndure, an AWS Company and Luis Molina, Senior Cloud Architect at AWS. 

When designing a Disaster Recovery plan, one of the main questions we are asked is how Microsoft Active Directory will be handled during a test or failover scenario. In this blog, we go through some of the options for IT professionals who are using the CloudEndure Disaster Recovery (DR) tool, and how to best architect it in certain scenarios.

Overview of architecture

In the following architecture, we show how you can protect domain-joined workloads in the case of a disaster. You can instruct CloudEndure Disaster Recovery to automatically launch thousands of your machines in their fully provisioned state in minutes.

CloudEndure DR Architecture diagram

Scenario 1: Full Replication Failover

Walkthrough

In this scenario, we are performing a full stack Region to Region recovery including Microsoft Active Directory services.

Using CloudEndure Disaster Recovery  to protect Active Directory in Amazon EC2.

This will be a lift-and-shift style implementation. You take the on-premises Active Directory, and failover to another Region. Although not shown in this blog, this can be done from either on-premises, Cross-Region, or Cross-Cloud during DR or Testing.

Prerequisites

For this walkthrough, you should have the following:

  • An AWS account
  • A CloudEndure Account
  • A CloudEndure project configured, with agents installed and replicating in ‘Continuous Data Replication’ Mode
  • A CloudEndure Recovery Plan configured to boot the Active Directory Domain controller first, followed by remaining servers
  • An understanding of Active Directory
  • Two separate VPCs, with matching CIDR ranges, and no connection to the source infrastructure.

Configuration and Launch of Recovery Plan

1. Log in to the CloudEndure Console
2. Ensure the blueprint settings for each machine are configured to boot either in the Test VPC or Failover VPC, depending on the reason for booting,
a. These changes can be done either through the console, or by using the CloudEndure API operations.
b. To change blueprints on a mass scale, use the mass blueprint setter scripts (Zip file with instructions).
3. Open “Recovery Plans” section for the project
a. Create a new Recovery Plan following these steps
b. Tip: Add in a delay between the launch of the Active Directory server, and the following servers, to allow Active Directory services to come up before the rest of the infrastructure.
4. Once you have created the Recovery Plan, you can either launch it from the CloudEndure console, or use the CloudEndure API Operations.

*Note: there is full CloudEndure failover and failback documentation.

There are different ways to clean up resources, depending on whether this was a test launch, or true failover.

  • Test Launch – You can choose the “Delete x target machines” under the “Machines” tab.
    • This will delete all machines created by CloudEndure in the VPC they were launched into.
  • True failover – At this time, you can choose to failback as needed.
    • Once failback is completed, you can use the same preceding steps as to delete the infrastructure spun up by CloudEndure.

Scenario 2: Warm Site Recovery

Walkthrough

In this scenario, we perform a failover/recovery into a Region with a fully writeable and online Active Directory domain controller. This domain controller is running as an EC2 instance and is an extension of the on-premises, or cross cloud/region Active Directory infrastructure.

Prerequisites

For this walkthrough, you should have the following:

  • An AWS account
  • A CloudEndure Account
  • A CloudEndure project configured, with agents installed and replicating in Continuous Data Replication Mode
  • An understanding of Active Directory
  • A deployment of Active Directory with online writeable domain controller(s)

Preparing AWS and Active Directory:

For our example us-west-1 (California) will be the  source environment CloudEndure is protecting. We have specified us-east-1 (N.Virginia) as the target recovery Region aka “warm site”.

  • The source Region will consist of a VPC configured with public and private (AD domain) subnets and security groups
  • AD Domain Controllers are deployed in the source environment (DC1 and DC2)

Procedure:

1.     Set up a target recovery site/VPC in a Region of your choice. We refer to this as the warm site.

2.     Configure connectivity between the source environment you are protecting, and the warm site.

a.     This can be accomplished in multiple ways depending on whether your source environment is on-premises (VPN or Direct connect), an alternate cloud provider (VPN tunnel), or a different AWS Region (VPC peering). For our example the source environment we are protecting is in us-west-1, and the warm recovery site is in us-east-1, both regions VPCs are connected via VPC peering.

3.     Establish connectivity between the source environment and the warm site. This ensures that the appropriate routes, subnets and ACLs are configured to allow AD authentication and replication traffic to flow between the source and warm recovery site.

4.     Extend your Active Directory into the warm recovery site by deploying a domain controller (DC3) into the warm site. This domain controller will handle Active Directory authentication and DNS for machines that get recovered into the warm site.

5.     Next, create a new Active Directory site. Use the Active Directory Sites and Services MMC for the warm recovery site prepared in us-east-1, and DC3 will be its associated domain controller.

a.     Once the site is created, associate the warm recovery site VPC networks to it. This will enforce local Active Directory client affinity to DC3 so that any machines recovered into the warm site use DC3 rather than the source environment domain controllers.  Otherwise, this could introduce recovery delays if the source environment domain controllers are unreachable.

Screenshot of Active Directory sites

6.     Now, you set DHCP options for the warm site recovery VPC. This sets the warm site domain controller (DC3) as the primary DNS server for any machines that get recovered into the warm site, allowing for a seamless recovery/failover.

Screenshot of DHCP options

Test or Failover procedure:

Review the “Configuration and Launch of Recovery Plan” as provided earlier in this blog post.

Cleaning up

To avoid incurring future charges, delete all resources used in both scenarios.

Conclusion

In this blog, we have provided you a few ways to successfully configure and test domain-joined servers, with their Active Directory counterpart. Going forward, you can test and fine tune the CloudEndure Recovery Plans to limit the down time needed for failover. Further blog posts will go into other ways to failover domain-joined servers.

Field Notes provides hands-on technical guidance from AWS Solutions Architects, consultants, and technical account managers, based on their experiences in the field solving real-world business problems for customers.

Mergers and Acquisitions readiness with the Well-Architected Framework

Post Syndicated from Sushanth Mangalore original https://aws.amazon.com/blogs/architecture/mergers-and-acquisitions-readiness-with-the-well-architected-framework/

Introduction

Companies looking for an acquisition or a successful exit through a merger, undergo a technical assessment as part of the due diligence process. While being a profitable business by itself can attract interest, running a disciplined IT department within your organization can make the acquisition more valuable. As an entity operating cloud workloads on AWS, you can use the AWS Well-Architected Framework. This will demonstrate that your workloads are architected with industry best practices in mind. The Well-Architected Framework explains the pros and cons of decisions you make while building systems on AWS. It consistently measures architectures against best practices observed in customer workloads across several industries. These workloads have achieved continued success on AWS through architectures that are secure, high-performing, resilient, scalable, and efficient. The Well-Architected Framework evaluates your cloud workloads based on five pillars:

  • Operational Excellence: The ability to support development and run workloads effectively, gain insights into your operations, and continuously improve supporting processes and procedures to deliver business value.
  • Security: The ability to protect data, systems, and assets to take advantage of cloud technologies to improve your security.
  • Reliability: The ability of the workload to perform its intended function correctly and consistently. This includes the ability to operate and test the workload through its complete lifecycle.
  • Performance Efficiency: The ability to use computing resources efficiently to meet system requirements, and to maintain that efficiency as demand changes and technologies evolve.
  • Cost Optimization: The ability to run cost-aware workloads that achieve business outcomes while minimizing costs.

The Well-Architected Framework Value Proposition in Mergers & Acquisitions (M&A)

Continuously assess the pre-M&A state of cloud workloads – The Well-Architected state for a workload must be treated as a moving target. New cloud patterns and best practices emerge every day. The Well-Architected Framework constantly evolves to incorporate them. Your workloads can continuously grow, shrink, become more complex, or simpler. Mergers and acquisitions can be a long, drawn-out process, which can take can take months to complete. Well-Architected reviews are recommended for workloads every 6 months to 1 year, or with every major development milestone. This helps guard against IT inertia and allows emerging best practices to be accounted for in your continuously evolving workload architecture. The technical currency can be maintained throughout the M&A process by continuously assessing your workloads against the Well-Architected Framework. The accompanying AWS Well-Architected Tool (AWS WA Tool) helps you track milestones as you make improvements to and measure your progress.

Well-Architected Continuous Improvement Cycle

Standardize through a common framework – One of the biggest challenges in M&As is the standardization of the Enterprise IT post-merger. The IT departments of organizations can operate differently, and have vastly different IT assets, skill sets, and processes. According to a McKinsey article on the Strategic Value of IT in M&A, more than half the synergies available in a merger are related to IT. If the acquirer is also an AWS customer, this can enable the significant synergies in M&As. The Well-Architected Framework can be a foundation on which the two IT departments can find common ground. Even if the acquirer does not have a cloud-based environment like AWS, inheriting a Well-Architected AWS setup can help the post-merger IT landscape evolve.

Integrate seamlessly through Well-Architected landing zones – AWS Control Tower service or AWS Landing Zone solution are options that can provision Well-Architected multi-account AWS environments. Together with AWS Organizations, this makes the IT integration a lot smoother for the AWS environments across enterprises. AWS accounts can detach from one AWS Organization and attach to another seamlessly. The latter can enroll with an existing Control Tower setup to benefit from the security and governance guardrails. In a Well-Architected landing zone, your management account will not have any workloads. As shown in the following diagram, you may move member accounts from your AWS Organization to your acquirer’s AWS Organization under the right Organizational Unit (OU). You can later decommission your AWS Organization and close your management AWS account.

Sample pre-merger AWS environments

Sample post-merger AWS environment

Benefit from faster migration to AWS – using the Well-Architected Framework, you can achieve faster migration to AWS. Workload risks can be mitigated beforehand by using best practices from AWS before the migration. Post migration, the workloads benefit from AWS offerings that already have many of the Well-Architected best practices built into them. The improvement plans from the Well-Architected tool include the recommended AWS services that can address identified risks. Physical IT assets are heavily depreciated during an acquisition and do not fetch valuations close to their original purchase price. AWS workloads that are Well-Architected should be evaluated by the actual business value they provide. By consolidating your IT needs on AWS, you are also decreasing the overhead of vendor consolidation for the acquirer. This can be challenging when multiple active contracts must transfer hands.

Overcome the innovation barrier – At the onset of an M&A, companies may be focusing too much on keeping the lights on through the process. Businesses that do not move forward may fall behind on continuous innovation. Not only can innovation open more business opportunities, but it can also influence the acquisition valuation. Well-Architected reviews can optimize costs. This can result in diverse benefits such as better agility and an increased use of advanced technologies. This can facilitate rapid innovation. Improvements gained in the security posture, reliability, and performance of the workload make it more valuable to the acquirer.

Demonstrate depth in your area of expertise – Well-Architected lenses help evaluate workloads for specific technology or business domains. Lenses dive deeper into the domain-specific best practices for the workload. If your business specializes in a domain for which a Well-Architected lens is available, doing a review with the specific lens will provide more value for your workload. Today, AWS has lenses for serverless, SaaS, High Performance Computing (HPC), the financial services industry, machine learning, IoT workloads and more. We recently announced a new Management and Governance Lens.

Build workloads using AWS vetted constructs – AWS Solutions Library provides you a repository of Well-Architected solutions across a range of technologies and industry verticals. The library includes reference architectures, implementations of reusable patterns, and fully baked end-to-end solution implementations. Use these building blocks to assemble your workloads. Include the AWS recommended best practices into them, and create an attractive proposition to an acquirer.

Conclusion

You can start taking advantage of the Well-Architected Framework today to improve your technical readiness for an acquisition. The Well-Architected Tool in the AWS Management Console allows you to review your workload at no cost. Engage with your AWS account team early, and we can provide the right guidance for your specific M&A, and plan your Well-Architected technical readiness. Using the Well-Architected Framework as the cornerstone, the AWS Solutions Architects and APN partners have guided thousands of customers through this journey. We are looking forward to helping you succeed.

Field Notes: Streaming VR to Wireless Headsets Using NVIDIA CloudXR

Post Syndicated from William Cannady original https://aws.amazon.com/blogs/architecture/field-notes-streaming-vr-to-wireless-headsets-using-nvidia-cloudxr/

It’s exciting to see many consumer-grade virtual reality (VR) hardware options, but setting up hardware can be cumbersome, expensive and complicated. Wired headsets require high-powered graphics workstations, and a solution to prevent you from tripping over the wires. Many room-scale headsets require two external peripherals (or ‘light towers’) to be installed so the headset can position itself in a room. These setups can take days to tune, and need resetting if the light towers are moved.

With the release of the Oculus Quest, users of virtual reality were delighted with a wireless, room-scale headset with dual hand tracking. They could enjoy VR without worrying about light towers or a high-powered graphics workstation. However, because the Quest was battery powered, it used an inherently low-powered central processing unit (CPU) and graphics processing unit (GPU). As a result, VR content had to be simplified to run on the Quest. This prevented customers from using the Quest for the most demanding graphics experiences, such as Computer Aided Design (CAD) review, or playing games such as Half-Life: Alyx.

Customers were faced with a difficult choice: expensive, complicated setups, or reduced-fidelity experiences.

In this blog post, we show you how to stream a full-fidelity VR experience from a computer on AWS to a wireless headset such as the Quest.

Overview of architecture

NVIDIA CloudXR takes NVIDIA’s experience in GPU encoding and decoding, and streams pixels to a remotely connected VR headset. By doing this, the rendering and compute requirements of visually intensive applications take place on a remote server instead of a local headset. This makes mobile headsets work with any application, regardless of their visual complexity and density.


Figure 1: architecture for streaming VR experiences from the AWS Cloud to a VR headset using NVIDIA’s CloudXR server running on EC2.

Figure 1: architecture for streaming VR experiences from the AWS Cloud to a VR headset

To provide global scalability,  NVIDIA announced the CloudXR platform will be available on G4 and P3 EC2 instances. It provides the following benefits:

  • At a global scale, customers can stream remote AR/VR experiences from Regions that are close them.
  • It enables centrally managed and deployed software experiences on Amazon Elastic Compute Cloud (Amazon EC2) instances. Previously these required physical transportation and implementation of devices and server hardware.
  • Lastly, IT administrators can now centrally manage content that may be sensitive or require frequent changes.

Walkthrough

Using CloudXR on AWS requires EC2 instances with NVIDIA GPUs (that is, the P3 or G4 instance types) running within your virtual private cloud (VPC). The instance must be network accessible to a remote CloudXR client running on a VR headset. Connections are 1:1, meaning that each CloudXR client is connected to a dedicated EC2 instance. If needs require multiple CloudXR clients, you can deploy multiple EC2 instances.

Note that the process outlined is accurate as of January 2021. CloudXR, and X Reality (XR) overall, is rapidly changing. Consult the latest information about CloudXR from NVIDIA. Using CloudXR within your AWS account requires you setup P3 or G4 EC2 instances, as you would within an Amazon VPC. You must also add a security group that allows the ports required for CloudXR communication. These specific ports can be found in the CloudXR documentation, available from NVIDIA.

We have created a CloudFormation template that deploys an EC2 instance with CloudXR configured for reference, linked in the prerequisites. Because it makes reference to a private AMI, it must be shared with your account in order to deploy successfully. If you’re interested in using this template, contact your AWS Account team.

Prerequisites

The following steps describe how to configure the EC2 instance manually. CloudXR streaming requires using a connection other than Windows RDP to connect to the remote EC2 instance. We use NICE DCV, which is provided at no cost to EC2 instances for remote connectivity.

For this walkthrough, you should have the following prerequisites:

Deploy CloudXR Server onto Amazon EC2

It’s important to note the steps outlined are for configuring a G4 instance. If you’d prefer to use a P3 instance, manually deploy your P3 instance and install NICE DCV as described in the documentation.

  1. Log into your AWS Account and navigate to the AWS Marketplace to install an EC2 instance with NICE DCV configured.
  2. Create a new security group during deployment that matches the CloudXR port settings and apply it to your instance. Consult the CloudXR documentation for the latest port settings.
  3. Wait 5 minutes for everything to initialize properly. Make note of the issues public IP address (or attach an Elastic IP address to the instance).
  4. Navigate to https://<IP-OF-INSTANCE>:8443 to connect to NICE DCV web-browser client. b.Use the credentials created during EC2 initialization to Log in

NICE DCV login screen

NICE DCV login screen on Web Browser Client

5. Once logged into your EC2 instance, install SteamVR and CloudXR onto the remote EC2 instance. SteamVR is used as an OpenVR/XR proxy between your VR application and CloudXR. CloudXR is used to stream the SteamVR experience to a remote CloudXR Client.

6. Verify installation of the CloudXR plugin into SteamVR by navigating to the Manage Add-ons page within the Advanced Settings option. Make sure it lists CloudXRRemoteHMD as an addon and is set to ON.

Verification of CloudXR Installation

Verification of CloudXR Installation

7. Add an allow entry to the Windows Firewall Entry for VRServer.exe. This allows SteamVR to use the CloudXR to stream properly. By default this file is located at %ProgramFiles% (x86)\Steam\steamapps\common\SteamVR\bin\win64\vrserver.exe\

Enabling the VRSERVER.EXE application through the Windows Application Firewall.


8. Install a CloudXR client onto your VR headset. If using an android-powered headset (that is, the Oculus Quest), you can use the sample APK within the CloudXR SDK

9. Select Finish.

Connect to your CloudXR Server and start streaming

1. Launch SteamVR on your remote EC2 instance by logging into your Steam account or configuring a no-login link following the Installation/use of SteamVR in an environment without internet access instructions.

2. When loaded, it will report a headset cannot be detected. This is OK.

SteamVR will display Headset not Detected—this is OK

SteamVR will display Headset not Detected—this is OK.

3. Within your Client headset, load the CloudXR Client application you recently installed.

4. Once connected, the headset will start display the SteamVR “void”. You also should see a view of your headset if SteamVR mirroring is enabled. The status box on the SteamVR server application will show a headset and 2 controllers attached as well.

SteamVR “Void” and Headset Connected icons

SteamVR “Void” and Headset Connected icons

5. Congratulations. You’re now connected to an AWS EC2 instance using NVIDIA CloudXR! Any VR application you now run on the EC2 server that uses OpenVR will be streamed to your VR headset!

Cleaning up

EC2 instances are billed only when they’re being used. You’ll want to make sure to stop your instance or shut it down when you are finished with your session. Terminating your instance is not necessary.

Conclusion

In this blog post, we showed how to stream a full-fidelity VR experience from a computer on AWS to a wireless headset. Having the ability to remotely connect to GPU-powered servers to run graphic workloads is not necessarily new, but connecting to a remote server with a VR headset and having full interactivity certainly is. With this architecture, you realize the benefits of CloudXR combined with the agility and scalability available on AWS. It becomes less challenging to manage content played on VR headsets because content doesn’t reside on the VR headset—it lives on the EC2 server.

Deploying to any AWS region where GPU instances are available allows you to offer CloudXR to your users at global scale.  As networks get faster and closer through services like AWS Outposts and AWS Wavelength, remote VR work will become possible for more customers. We’re excited to see what new workloads come next as this way of working grows.

Field Notes provides hands-on technical guidance from AWS Solutions Architects, consultants, and technical account managers, based on their experiences in the field solving real-world business problems for customers.


Leo Chan

Leo Chan

Leo Chan is the Worldwide Tech Lead for Spatial Computing at AWS. He loves working at the intersection of Art and Technology and lives with his family in a rain forest just off the coast of Vancouver, Canada.

Scaling up a Serverless Web Crawler and Search Engine

Post Syndicated from Jack Stevenson original https://aws.amazon.com/blogs/architecture/scaling-up-a-serverless-web-crawler-and-search-engine/

Introduction

Building a search engine can be a daunting undertaking. You must continually scrape the web and index its content so it can be retrieved quickly in response to a user’s query. The goal is to implement this in a way that avoids infrastructure complexity while remaining elastic. However, the architecture that achieves this is not necessarily obvious. In this blog post, we will describe a serverless search engine that can scale to crawl and index large web pages.

A simple search engine is composed of two main components:

  • A web crawler (or web scraper) to extract and store content from the web
  • An index to answer search queries

Web Crawler

You may have already read “Serverless Architecture for a Web Scraping Solution.” In this post, Dzidas reviews two different serverless architectures for a web scraper on AWS. Using AWS Lambda provides a simple and cost-effective option for crawling a website. However, it comes with a caveat: the Lambda timeout capped crawling time at 15 minutes. You can tackle this limitation and build a serverless web crawler that can scale to crawl larger portions of the web.

A typical web crawler algorithm uses a queue of URLs to visit. It performs the following:

  • It takes a URL off the queue
  • It visits the page at that URL
  • It scrapes any URLs it can find on the page
  • It pushes the ones that it hasn’t visited yet onto the queue
  • It repeats the preceding steps until the URL queue is empty

Even if we parallelize visiting URLs, we may still exceed the 15-minute limit for larger websites.

Breaking Down the Web Crawler Algorithm

AWS Step Functions is a serverless function orchestrator. It enables you to sequence one or more AWS Lambda functions to create a longer running workflow. It’s possible to break down this web crawler algorithm into steps that can be run in individual Lambda functions. The individual steps can then be composed into a state machine, orchestrated by AWS Step Functions.

Here is a possible state machine you can use to implement this web crawler algorithm:

Figure 1: Basic State Machine

Figure 1: Basic State Machine

1. ReadQueuedUrls – reads any non-visited URLs from our queue
2. QueueContainsUrls? – checks whether there are non-visited URLs remaining
3. CrawlPageAndQueueUrls – takes one URL off the queue, visits it, and writes any newly discovered URLs to the queue
4. CompleteCrawl – when there are no URLs in the queue, we’re done!

Each part of the algorithm can now be implemented as a separate Lambda function. Instead of the entire process being bound by the 15-minute timeout, this limit will now only apply to each individual step.

Where you might have previously used an in-memory queue, you now need a URL queue that will persist between steps. One option is to pass the queue around as an input and output of each step. However, you may be bound by the maximum I/O sizes for Step Functions. Instead, you can represent the queue as an Amazon DynamoDB table, which each Lambda function may read from or write to. The queue is only required for the duration of the crawl. So you can create the DynamoDB table at the start of the execution, and delete it once the crawler has finished.

Scaling up

Crawling one page at a time is going to be a bit slow. You can use the Step Functions “Map state” to run the CrawlPageAndQueueUrls to scrape multiple URLs at once. You should be careful not to bombard a website with thousands of parallel requests. Instead, you can take a fixed-size batch of URLs from the queue in the ReadQueuedUrls step.

An important limit to consider when working with Step Functions is the maximum execution history size. You can protect against hitting this limit by following the recommended approach of splitting work across multiple workflow executions. You can do this by checking the total number of URLs visited on each iteration. If this exceeds a threshold, you can spawn a new Step Functions execution to continue crawling.

Step Functions has native support for error handling and retries. You can take advantage of this to make the web crawler more robust to failures.

With these scaling improvements, here’s our final state machine:

Figure 2: Final State Machine

Figure 2: Final State Machine

This includes the same steps as before (1-4), but also two additional steps (5 and 6) responsible for breaking the workflow into multiple state machine executions.

Search Index

Deploying a scalable, efficient, and full-text search engine that provides relevant results can be complex and involve operational overheads. Amazon Kendra is a fully managed service, so there are no servers to provision. This makes it an ideal choice for our use case. Amazon Kendra supports HTML documents. This means you can store the raw HTML from the crawled web pages in Amazon Simple Storage Service (S3). Amazon Kendra will provide a machine learning powered search capability on top, which gives users fast and relevant results for their search queries.

Amazon Kendra does have limits on the number of documents stored and daily queries. However, additional capacity can be added to meet demand through query or document storage bundles.

The CrawlPageAndQueueUrls step writes the content of the web page it visits to S3. It also writes some metadata to help Amazon Kendra rank or present results. After crawling is complete, it can then trigger a data source sync job to ensure that the index stays up to date.

One aspect to be mindful of while employing Amazon Kendra in your solution is its cost model. It is priced per index/hour, which is more favorable for large-scale enterprise usage, than for smaller personal projects. We recommend you take note of the free tier of Amazon Kendra’s Developer Edition before getting started.

Overall Architecture

You can add in one more DynamoDB table to monitor your web crawl history. Here is the architecture for our solution:

Figure 3: Overall Architecture

Figure 3: Overall Architecture

A sample Node.js implementation of this architecture can be found on GitHub.

In this sample, a Lambda layer provides a Chromium binary (via chrome-aws-lambda). It uses Puppeteer to extract content and URLs from visited web pages. Infrastructure is defined using the AWS Cloud Development Kit (CDK), which automates the provisioning of cloud applications through AWS CloudFormation.

The Amazon Kendra component of the example is optional. You can deploy just the serverless web crawler if preferred.

Conclusion

If you use fully managed AWS services, then building a serverless web crawler and search engine isn’t as daunting as it might first seem. We’ve explored ways to run crawler jobs in parallel and scale a web crawler using AWS Step Functions. We’ve utilized Amazon Kendra to return meaningful results for queries of our unstructured crawled content. We achieve all this without the operational overheads of building a search index from scratch. Review the sample code for a deeper dive into how to implement this architecture.

Architecture Monthly Magazine: Manufacturing

Post Syndicated from Jane Scolieri original https://aws.amazon.com/blogs/architecture/architecture-monthly-magazine-manufacturing/

Architecture Monthly Magazine - Manufacturing

How is operational data being used to transform manufacturing? Steve Blackwell, AWS Worldwide Tech Leader for manufacturing, speaks about considerations for architecting for manufacturing, considerations for Industry 4.0 applications and data, and AWS for Industrial.

We hope you’ll find this edition of Architecture Monthly useful. My team would like your feedback, so please give us a rating and include your comments on the Amazon Kindle page. You can view past issues and reach out to [email protected] anytime with your questions and comments.

In this month’s Manufacturing issue:

  • Ask an Expert: Steve Blackwell, Tech Leader, Manufacturing, AWS
  • Case Study: Amazon Prime Air’s Drone Takes Flight with AWS and Siemens
  • Reference Architecture: PTC Windchill Product Lifecycle Management on AWS
  • Blog: How Genie® (a Terex® brand) improved paint quality using AWS IoT SiteWise
  • Solution: Amazon Virtual Andon
  • Whitepaper: Achieve Production Optimization with AWS Machine Learning
  • Reference Architecture: OSIsoft PI System Enterprise Data Infrastructure on AWS
  • Blog: AWS for Industrial – Making it easy for customers to scale their industrial
    workloads on AWS
  • Case Study: Arneg Predicts Customer Maintenance Needs Worldwide Using Amazon
    Forecast and Amazon SageMaker
  • Related Videos: Driving Predictive Quality with Machine Connectivity, AWS Knows
    Industrial Operations

Download the Magazine

How to access the magazine

View and download past issues as PDFs on the AWS Architecture Monthly webpage.
Readers in the US, UK, Germany, and France can subscribe to the Kindle version of the magazine at Kindle Newsstand.
Visit Flipboard, a personalized mobile magazine app that you can also read on your computer.
We hope you’re enjoying Architecture Monthly, and we’d like to hear from you—leave us star rating and comment on the Amazon Kindle Newsstand page or contact us anytime at [email protected].

Scaling Neuroscience Research on AWS

Post Syndicated from Konrad Rokicki original https://aws.amazon.com/blogs/architecture/scaling-neuroscience-research-on-aws/

HHMI’s Janelia Research Campus in Ashburn, Virginia has an integrated team of lab scientists and tool-builders who pursue a small number of scientific questions with potential for transformative impact. To drive science forward, we share our methods, results, and tools with the scientific community.

Introduction

Our neuroscience research application involves image searches that are computationally intensive but have unpredictable and sporadic usage patterns. The conventional on-premises approach is to purchase a powerful and expensive workstation, install and configure specialized software, and download the entire dataset to local storage. With 16 cores, a typical search of 50,000 images takes 30 seconds. A serverless architecture using AWS Lambda allows us to do this job in seconds for a few cents per search, and is capable of scaling to larger datasets.

Parallel Computation in Neuroscience Research

Basic research in neuroscience is often conducted on fruit flies. This is because their brains are small enough to study in a meaningful way with current tools, but complex enough to produce sophisticated behaviors. Conducting such research nonetheless requires an immense amount of data and computational power. Janelia Research Campus developed the NeuronBridge tool on AWS to accelerate scientific discovery by scaling computation in the cloud.

Color Depth Search Example fly brains

Figure 1: A “mask image” (on the left) is compared to many different fly brains (on the right) to find matching neurons. (Janella Research Campus)

The fruit fly (Drosophila melanogaster) has about 100,000 neurons and its brain is highly stereotyped. This means that the brain of one fruit fly is similar to the next one. Using electron microscopy (EM), the FlyEM project has reconstructed a wiring diagram of a fruit fly brain. This connectome includes the structure of the neurons and the connectivity between them. But EM is only half of the picture. Once scientists know the structure and connectivity, they must perform experiments to find what purpose the neurons serve.

Flies can be genetically modified to reproducibly express a fluorescent protein in certain neurons, causing those neurons to glow under a light microscope (LM). By iterating through many modifications, the FlyLight project has created a vast genetic driver library. This allows scientists to target individual neurons for experiments. For example, blocking a particular neuron of a fly from functioning, and then observing its behavior, allows a scientist to understand the function of that neuron. Through the course of many such experiments, scientists are currently uncovering the function of entire neuronal circuits.

We developed NeuronBridge, a tool available for use by neuroscience researchers around the world, to bridge the gap between the EM and LM data. Scientists can start with EM structure and find matching fly lines in LM. Or they may start with a fly line and find the corresponding neuronal circuits in the EM connectome.

Both EM and LM produce petabytes of 3D images. Image processing and machine learning algorithms are then applied to discern neuron structure. We also developed a computational shortcut called color depth MIP to represent depth as color. This technique compresses large 3D image stacks into smaller 2D images that can be searched efficiently.

Image search is an embarrassingly parallel problem ideally suited to parallelization with simple functions. In a typical search, the scientist will create a “mask image,” which is a color depth image featuring only the neuron they want to find. The search algorithm must then compare this image to hundreds of thousands of other images. The paradigm of launching many short-lived cloud workers, termed burst-parallel compute, was originally suggested by a group at UCSD. To scale NeuronBridge, we decided to build a serverless AWS-native implementation of burst-parallel image search.

The Architecture

Our main reason for using a serverless approach was that our usage patterns are unpredictable and sporadic. The total number of researchers who are likely to use our tool is not large, and only a small fraction of them will need the tool at any given time. Furthermore, our tool could go unused for weeks at a time, only to get a flood of requests after a new dataset is published. A serverless architecture allows us to cope with this unpredictable load. We can keep costs low by only paying for the compute time we actually use.

One challenge of implementing a burst-parallel architecture is that each Lambda invocation requires a network call, with the ensuing network latency. Spawning several thousands of functions from a single manager function can take many seconds. The trick to minimizing this latency is to parallelize these calls by recursively spawning concurrent managers in a tree structure. Each leaf in this tree spawns a set of worker functions to do the work of searching the imagery. Each worker reads a small batch of images from Amazon Simple Storage Service (S3). They are then compared to the mask image, and the intermediate results are written to Amazon DynamoDB, a serverless NoSQL database.

Serverless architecture for burst-parallel search

Figure 2: Serverless architecture for burst-parallel search

Search state is monitored by an AWS Step Functions state machine, which checks DynamoDB once per second. When all the results are ready, the Step Functions state machine runs another Lambda function to combine and sort the results. The state machine addresses error conditions and timeouts, and updates the browser when the asynchronous search is complete. We opted to use AWS AppSync to notify a React web client, providing an interactive user experience while remaining entirely serverless.

As we scaled to 3,000 concurrent Lambda functions reading from our data bucket, we reached Amazon S3’s limit of 5,500 GETs per second per prefix. The fix was to create numbered prefix folders and then randomize our key list. Each worker could then search a random list of images across many prefixes. This change distributed the load from our highly parallel functions across a number of S3 shards, and allowed us to run with much higher parallelism.

We also addressed cold-start latency. Infrequently used Lambda functions take longer to start than recently used ones, and our unpredictable usage patterns meant that we were experiencing many cold starts. In our Java functions, we found that most of the cold-start time was attributed to JVM initialization and class loading. Although many mitigations for this exist, our worker logic was small enough that rewriting the code to use Node.js was the obvious choice. This immediately yielded a huge improvement, reducing cold starts from 8-10 seconds down to 200 ms.

With all of these insights, we developed a general-purpose parallel computation framework called burst-compute. This AWS-native framework runs as a serverless application to implement this architecture. It allows you to massively scale your own custom worker functions and combiner functions. We used this new framework to implement our image search.

Conclusion

The burst-parallel architecture is a powerful new computation paradigm for scientific computing. It takes advantage of the enormous scale and technical innovation of the AWS Cloud to provide near-interactive on-demand compute without expensive hardware maintenance costs. As scientific computing capability matures for the cloud, we expect this kind of large-scale parallel computation to continue becoming more accessible. In the future, the cloud could open doors to entirely new types of scientific applications, visualizations, and analysis tools.

We would like to express our thanks to AWS Solutions Architects Scott Glasser and Ray Chang, for their assistance with design and prototyping, and to Geoffrey Meissner for reviewing drafts of this write-up. 

Source Code

All of the application code described in this article is open source and licensed for reuse:

The data and imagery are shared publicly on the Registry of Open Data on AWS.

Zurich Spain: Managing millions of documents with AWS

Post Syndicated from Miguel Guillot original https://aws.amazon.com/blogs/architecture/zurich-spain-managing-millions-of-documents-with-aws/

This post was cowritten with Oscar Gali, Head of Technology and Architecture for GI in Zurich, Spain

About Zurich Spain

Zurich Spain is part of Zurich Insurance Group (Zurich), known for its financial soundness and solvency. With more than 135 years of history and over 2,000 employees, it is a leading company in the Spanish insurance market.

Introduction

Enterprise Content Management (ECM) is a key capability for business operations in Insurance, due to the number of documents that must be managed every day. In our digital world, managing and storing business documents and images (such as policies or claims) in a secure, available, scalable, and performant platform is critical.

Zurich Spain decided to use AWS to streamline management of their underlying infrastructure, in addition to the pay-as-you-go pricing model and advanced analytics services. All of these service features create a huge advantage for the company.

The challenge

Zurich Spain was managing all documents for non-life insurance on an on-premises proprietary solution. This was based on an ECM market standard product and specific storage infrastructure. That solution over time had several pain points: cost, scalability, and flexibility. This platform has become obsolete and was an obstacle for covering future analytical needs.

After considering different alternatives, Zurich Spain decided to base their new ECM platform on AWS, leveraging many of the managed services. AWS Managed Services helps to reduce your operational overhead and risk. AWS Managed Services automates common activities, such as change requests, monitoring, patch management, security, and backup services. It provides full lifecycle services to provision, run, and support your infrastructure.

Although the architecture design was clear, the challenge was huge. Zurich Spain had to integrate all the existing business applications with the new ECM platform. Concurrently, the company needed to migrate up to 150 million documents including metadata, in less than 6 months.

The Platform

Functionally, features provided by ECM are:

ECM Features

ECM Features

  • Authentication: every request must come from an authenticated user (OpenID Connect JWT).
  • Authorization: on every request, appropriate user permissions are validated.
  • Documentation Services: exposed API that allows interaction with documents (CRUD). For example:
    • The ability to Ingest a document either synchronously (attaching the document to the request) or asynchronously (providing a link to the requester that can be used to attach a document when required).
    • Upload operation stores documents onto Amazon Simple Storage Service (S3) and its metadata, which is saved using Amazon DocumentDB.
    • Documents Retrieve, similarly to the upload operation, can be obtained either synchronously or asynchronously. The latter provides a link to be used to download the document within a time range.
    • ECM has been developed to give the users the ability to search among all the documents uploaded into it.
  • Metadata: every document has technical and business metadata. This gives Zurich Spain the ability to enrich every single document with all the information that is relevant for their business, for example: Customers, Author, Date of creation.
  • Record Management: policies to manage documents lifecycle.
  • Audit: every transaction is logged into the system.
  • Observability: capabilities to monitor and operate all services involved: logging, performance metrics and transactions traceability.

The Architecture

The ECM platform uses AWS services such as Amazon S3 to store documents. In addition, it uses Amazon DocumentDB to store document metadata and audit trail.

The rationale for choosing these services was:

  • Amazon S3 delivers strong read-after-write consistency automatically for all applications, without changes to performance or availability. With strong consistency, Amazon S3 simplifies the migration of on-premises analytics workloads by removing the need to update applications. This reduces costs by removing the need for extra infrastructure to provide strong consistency.
  • Amazon DocumentDB is a NoSQL document-oriented database where its schema flexibility accommodates the different metadata needs. It was key to design the index strategy in advance to ensure the right query performance, considering the volume of data.

A microservices layer has been built on top to provide the right services for the business applications. These include access control, storing or retrieving documents, metadata, and more.

These microservices are built using Thunder, the internal framework and technology stack for digital applications of Zurich Spain. Thunder leverages AWS and provides a K8s environment based on Amazon Elastic Kubernetes Service (Amazon EKS) for microservice deployment.

Zurich Spain Architecture

Figure 2 – Zurich Spain Architecture

Zurich Spain uses AWS Direct Connect to connect from their data center to AWS. With AWS Direct Connect, Zurich Spain can connect to all their AWS resources in an AWS Region. They can transfer their business-critical data directly from their data center into and from AWS. This enables them to bypass their internet service provider and remove network congestion.

Amazon EKS gives Zurich Spain the flexibility to start, run, and scale Kubernetes applications in the AWS Cloud or on-premises. Amazon EKS is helping Zurich Spain to provide highly available and secure clusters while automating key tasks such as patching, node provisioning, and updates. Zurich Spain is also using Amazon Elastic Container Registry (Amazon ECR) to store, manage, share, and deploy container images and artifacts across their environment.

Some interesting metrics of the migration and platform:

  • Volume: 150+ millions (25 TB) of documents migrated
  • Duration: migration took 4 months due to the limited extraction throughput of the old platform
  • Activity: 50,000+ documents are ingested and 25,000+ retrieved daily
  • Average response time:
    • 550 ms to upload a document
    • 300 ms for retrieving a document hosted in the platform

Conclusion

Zurich Spain successfully replaced a market standard ECM product with a new flexible, highly available, and scalable ECM. This resulted in a 65% run cost reduction, improved performance, and enablement of AWS analytical services.

In addition, Zurich Spain has taken advantage of many benefits that AWS brings to their customers. They’ve demonstrated that Thunder, the new internal framework developed using AWS technology, provides fast application development with secure and frequent deployments.

Building Multi-partner integration on AWS using Event-Driven Architecture

Post Syndicated from Vivek Kant original https://aws.amazon.com/blogs/architecture/building-multi-partner-integration-on-aws-using-event-driven-architecture/

Summary

Finserv MARKETS enables customers to buy financial services products such as credit cards, loans, insurance, and investments from various partners. Finserv integrates with a large number of partners in real time to provide services to customers.

Each partner has their own semantic APIs which can pose a challenge. There are also issues of latency and failures. We’ll show how our solution based on Event Driven Architecture (EDA) on AWS with Reactive design offers a solution to address these challenges.

Challenges with multi-partner integration

  • Latency – Making API calls to multiple partners increases latency of a service even in the scenario in which the calls are made in parallel.
  • Timeouts – If a partner’s APIs time out, this could impact overall service performance and availability.
  • Failures – A partner API failure could lead to the failure or major performance degradation of the overall service.
  • Customer Experience – Preserving the customer experience when depending on partner integration is a challenge, considering these technical issues.

Conceptual solution

In order to build this multi-partner platform, we discussed using traditional command-driven synchronous architecture. We also considered adopting an Event-Driven Architecture (EDA). Building our solution on EDA enabled us to deliver consistent customer experience while addressing failures and performance issues from partner APIs.

The diagram following shows a conceptual view of the solution:

Event Driven Conceptual view

Figure 1 – Conceptual View of Our Solution

The key components of the solution are:

1. User Interface: It is the single page application running on the user’s browser. For example, the UI makes an API call to business services to calculate insurance premiums with required parameters and receives a unique identifier. This enables the UI to be reactive and display the responses from the partner as they arrive.

2. Business Service: A microservice which provides APIs for:

• The user interface to submit and generate events for request for partner offer

• A callback to submit the response from the partner integration service in a reactive manner

3. Event Bus: The event bus infrastructure enables transportation, routing, and delivery of events to the right services. The business service raises a set of events to the event bus for a quote request. There is one event for each partner that is listened to by the reactive services.

4. Reactive Services: Services that consume events and call partner integration services for the calling partner API. On receiving the partner response, it calls the callback API on the business service. These services are organized by product domain (for example Motor Insurance).

5. Partner Integration Service: This service is responsible for integration with partners. The service translates the canonical request to partner-specific API calls. The service implements partner-specific security and error handling. There is one partner integration service per partner.

Realizing this solution on AWS

Amazon Web Services (AWS) offers cloud-native services enabling us to realize this solution.

Event Driven Architecture

Figure 2 – Realizing our solution on AWS

We used the following services to implement this architecture:

User Interface
We built the load balancing interface in Angular and host it on Apache Web Servers running Amazon Elastic Container Service (Amazon ECS). Elastic Load Balancing (ELB) distributes traffic evenly across the containers. Running a container gives us the required flexibility and scalability needed.

Business Service
The business service is a microservice built using Spring Boot and running on Amazon ECS containers. It uses an ELB used for service load balancing. The choice of Spring Boot and Amazon ECS gives flexibility and scalability through cluster auto scaling.

Data Store
We use polyglot architecture for data storage. For different product journeys and depending on data lifecycle, we choose either Amazon Aurora Postgres or Amazon ElastiCache for Redis. This gives us the right mix of performance and required durability for each business use case.

Event Bus
We evaluated Amazon Kinesis and Amazon Simple Notification Service (Amazon SNS) and came to the conclusion that for our volume and use cases, Amazon SNS offers the right capability. We implemented this by defining topics, for example, a four-wheeler insurance quote. This topic is subscribed by reactive services for each partner integration, where the partner service is called and a quote is generated. For downstream functionality where the API is to be called of the selected partner (for example, insurance policy issuance or credit card application submission), we chose Amazon Simple Queue Service (SQS). Amazon SQS provides simple queuing for asynchronous processing.

Reactive Services
These services are built using two different technologies. Spring Boot microservice running in an Amazon ECS container and AWS Lambda functions. Spring Boot is chosen due to our team’s familiarity of this technology; however, our plan is to move completely towards usage of Lambda functions for all asynchronous reactive services.

Partner Integration Service
Partner integration services provides the abstraction layer between partner API and canonical API, and is called by reactive services synchronously. In some cases, the error is passed back to reactive service to decide on retry. In other cases, for example, a policy issuance API retry is built into this service using exponential backoff strategy.

Partner API tracking
Partner API tracking gives us the right way of tracking the partner request and proactively address failures. We use Amazon Elasticsearch Service and Kibana for tracking. We can implement a circuit breaker pattern to shut down any partner for a period of time should failures reach a given threshold.

How this solution addresses multi-partner integration

This solution is built on the foundation of Event Driven Architecture with reactive design and is able to address the following challenges:

Latency
Since the user interface asynchronously polls for the response, it receives the partner response as soon as it arrives. This makes the response latency on the fastest partner API rather than slowest.

Timeout
Timeouts are set in the UI for polling, so if a partner API doesn’t respond, we time it out without any degradation. These timeouts are set based on the established user experience benchmarks. For example, how long do we let a user wait to see all insurance quotes before degrading their experience?

Failures
In case of an API failure, the UI will time out. Our API tracking can also enable a circuit breaker pattern to take a partner offline in the event of persistent failures.

Customer Experience
The solution gives a consistent experience to the user. Users can make their choice from the partner quotes/offers in a reactive way as received, rather than waiting for all offers to be shown. This design meets our customer requirements, derived from our Voice of Customer (VoC) study sessions.

Conclusion

In the digital space, APIs are the most common mechanism for system integration. Building a solution that is scalable, resilient, and provides the best customer experience is challenging. Event Driven Architecture with Reactive design offers a solution to address these issues. We process over 5000+ requests every day in Insurance and Credit domains. We’ve been able to achieve required availability of over 99.9%, while maintaining a positive customer experience on this platform.

Top 15 Architecture Blog Posts of 2020

Post Syndicated from Jane Scolieri original https://aws.amazon.com/blogs/architecture/top-15-architecture-blog-posts-of-2020/

The goal of the AWS Architecture Blog is to highlight best practices and provide architectural guidance. We publish thought leadership pieces that encourage readers to discover other technical documentation, such as solutions and managed solutions, other AWS blogs, videos, reference architectures, whitepapers, and guides, Training & Certification, case studies, and the AWS Architecture Monthly Magazine. We welcome your contributions!

Field Notes is a series of posts within the Architecture blog channel which provide hands-on technical guidance from AWS Solutions Architects, consultants, and technical account managers, based on their experiences in the field solving real-world business problems for customers.

We would like to thank you, our readers, for spending time on our blog this last year. Much appreciation also goes to our hard-working AWS Solutions Architects and other blog post writers. Below are the top 15 Architecture & Field Notes blog posts written in 2020.

#15: Field Notes: Choosing a Rehost Migration Tool – CloudEndure or AWS SMS

by Ebrahim (EB) Khiyami

In this post, Ebrahim provides some considerations and patterns where it’s recommended based on your migration requirements to choose one tool over the other.

Read Ebrahim’s post.

#14: Architecting for Reliable Scalability

by Marwan Al Shawi

In this post, Marwan explains how to architect your solution or application to reliably scale, when to scale and how to avoid complexity. He discusses several principles including modularity, horizontal scaling, automation, filtering and security.

Read Marwan’s post.

#13: Field Notes: Building an Autonomous Driving and ADAS Data Lake on AWS

by Junjie Tang and Dean Phillips

In this post, Junjie and Dean explain how to build an Autonomous Driving Data Lake using this Reference Architecture. They cover all steps in the workflow from how to ingest the data, to moving it into an organized data lake construct.

Read Junjie’s and Dean’s post.

#12: Building a Self-Service, Secure, & Continually Compliant Environment on AWS

by Japjot Walia and Jonathan Shapiro-Ward

In this post, Jopjot and Jonathan provide a reference architecture for highly regulated Enterprise organizations to help them maintain their security and compliance posture. This blog post provides an overview of a solution in which AWS Professional Services engaged with a major Global systemically important bank (G-SIB) customer to help develop ML capabilities and implement a Defense in Depth (DiD) security strategy.

Read Jopjot’s and Jonathan’s post.

#11: Introduction to Messaging for Modern Cloud Architecture

by Sam Dengler

In this post, Sam focuses on best practices when introducing messaging patterns into your applications. He reviews some core messaging concepts and shows how they can be used to address challenges when designing modern cloud architectures.

Read Sam’s post.

#10: Building a Scalable Document Pre-Processing Pipeline

by Joel Knight

In this post, Joel presents an overview of an architecture built for Quantiphi Inc. This pipeline performs pre-processing of documents, and is reusable for a wide array of document processing workloads.

Read Joel’s post.

#9: Introducing the Well-Architected Framework for Machine Learning

by by Shelbee Eigenbrode, Bardia Nikpourian, Sireesha Muppala, and Christian Williams

In the Machine Learning Lens whitepaper, the authors focus on how to design, deploy, and architect your machine learning workloads in the AWS Cloud. The whitepaper describes the general design principles and the five pillars of the Framework as they relate to ML workloads.

Read the post.

#8: BBVA: Helping Global Remote Working with Amazon AppStream 2.0

by Jose Luis Prieto

In this post, Jose explains why BBVA chose Amazon AppStream 2.0 to accommodate the remote work experience. BBVA built a global solution reducing implementation time by 90% compared to on-premises projects, and is meeting its operational and security requirements.

Read Jose’s post.

#7: Field Notes: Serverless Container-based APIs with Amazon ECS and Amazon API Gateway

by Simone Pomata

In this post, Simone guides you through the details of the option based on Amazon API Gateway and AWS Cloud Map, and how to implement it. First you learn how the different components (Amazon ECS, AWS Cloud Map, API Gateway, etc.) work together, then you launch and test a sample container-based API.

Read Simone’s post.

#6: Mercado Libre: How to Block Malicious Traffic in a Dynamic Environment

by Gaston Ansaldo and Matias Ezequiel De Santi

In this post, readers will learn how to architect a solution that can ingest, store, analyze, detect and block malicious traffic in an environment that is dynamic and distributed in nature by leveraging various AWS services like Amazon CloudFront, Amazon Athena and AWS WAF.

Read Gaston’s and Matias’ post.

#5: Announcing the New Version of the Well-Architected Framework

by Rodney Lester

In this post, Rodney announces the availability of a new version of the AWS Well-Architected Framework, and focuses on such issues as removing perceived repetition, adding content areas to explicitly call out previously implied best practices, and revising best practices to provide clarity.

Read Rodney’s post.

#4: Serverless Stream-Based Processing for Real-Time Insights

by Justin Pirtle

In this post, Justin provides an overview of streaming messaging services and AWS Serverless stream processing capabilities. He shows how it helps you achieve low-latency, near real-time data processing in your applications.

Read Justin’s post.

#3: Field Notes: Working with Route Tables in AWS Transit Gateway

by Prabhakaran Thirumeni

In this post, Prabhakaran explains the packet flow if both source and destination network are associated to the same or different AWS Transit Gateway Route Table. He outlines a scenario with a substantial number of VPCs, and how to make it easier for your network team to manage access for a growing environment.

Read Prabhakaran’s post.

#2: Using VPC Sharing for a Cost-Effective Multi-Account Microservice Architecture

by Anandprasanna Gaitonde and Mohit Malik

Anand and Mohit present a cost-effective approach for microservices that require a high degree of interconnectivity and are within the same trust boundaries. This approach requires less VPC management while still using separate accounts for billing and access control, and does not sacrifice scalability, high availability, fault tolerance, and security.

Read Anand’s and Mohit’s post.

#1: Serverless Architecture for a Web Scraping Solution

by Dzidas Martinaitis

You may wonder whether serverless architectures are cost-effective or expensive. In this post, Dzidas analyzes a web scraping solution. The project can be considered as a standard extract, transform, load process without a user interface and can be packed into a self-containing function or a library.

Read Dzidas’ post.

Thank You

Thanks again to all our readers and blog post writers! We look forward to learning and building amazing things together in 2021.

Field Notes: Speed Up Redaction of Connected Car Data by Multiprocessing Video Footage with Amazon Rekognition

Post Syndicated from Sandeep Kulkarni original https://aws.amazon.com/blogs/architecture/field-notes-speed-up-redaction-of-connected-car-data-by-multiprocessing-video-footage-with-amazon-rekognition/

In the blog, Redacting Personal Data from Connected Cars Using Amazon Rekognition, we demonstrated how you can redact personal data such as human faces using Amazon Rekognition. Traversing the video, frame by frame, and identifying personal information in each frame takes time. This solution is great for small video clips, where you do not need a near real-time response. However, in some use cases like object detection, real time traffic monitoring, you may need to process this information in near real-time and keep up with the input video stream.

In this blog post, we introduce how to leverage “multiprocessing” to speed up the redaction process and provide a response in near real time. We also compare the process run times using a variety of Amazon SageMaker instances to give users various options to process video using Amazon Rekognition.

For example, the ml.c5.4xlarge instance has 16 vCPUs, so we could theoretically have 16 processes, working in parallel, to process the video stream, which will significantly reduce the processing time. Our test against the sample video shows that we reduce the process run time by a factor of 11x, using the ml.c5.4xlarge instance.

Architecture Overview

Video Redaction - Multiprocessing

Walkthrough: 6 Steps

1. We will assume that the video data from the car was ingested and is stored in a “Raw” Amazon S3 bucket. (For real time analytics, video data will likely be ingested from the connected vehicles into an Amazon Kinesis Video Stream)

2.  In this architecture we will use an Amazon SageMaker notebook instance, which is a machine learning (ML) compute instance running the Jupyter Notebook App.

3. Additionally an AWS Identity and Access Management (IAM) role created with appropriate permissions is leveraged to provide temporary security credentials required for this program.

4. The individual frames are analyzed by calling the “DetectFaces” Amazon Rekognition API, which analyzes and provides metadata about the frame. If a face is detected in the frame, then Amazon Rekognition returns a bounding box per face.

5.  We write a function multi_process_video to blur the detected face for each frame and distribute the processing job equally among all available CPUs in the SageMaker instance

6. We run the multi_process function for the input video and write the output video to S3 bucket for further analysis.

Detailed Steps

For the 5 steps mentioned previously, we provide the input video, code samples and the corresponding output video.

Step 1: Login to the AWS console with your user credentials.

  • Upload the sample video to your S3 bucket.
    Name it face1.mp4. I’ve included the following example of the video input.

Step 2: In this block, we will create a SageMaker notebook.

Notebook instance:

  • Notebook instance name: VideoRedaction
    Notebook instance class: choose “ml.t3.large” from drop down
    Elastic inference: None

Permissions:

  • IAM role: Select Create a new role from the drop-down menu. This will open a new screen, click next and the new role will be created. The role name will start with AmazonSageMaker-ExecutionRole-xxxxxxxx.
  • Root access: Select Enable
  • Assume defaults for the rest, and select the orange “Create notebook instance” button at the bottom.

This will take you to the next screen, which shows that your notebook instance is being created. It will take a few minutes and you can monitor the status, which will show a green “InService” state, when the notebook is ready.

Step 3:  Next, we need to provide additional permissions to the new role that you created in Step 2.

  • Select the VideoRedaction notebook.
    This will open a new screen. Scroll down to the 3 block – “Permissions and encryption” and click on the IAM role ARN link.

This will open a screen where you can attach additional policies. It will already be populated with “AmazonSageMakerFullAccess”

  • Select the blue Attach policies button.
  • This will open a new screen, which will allow you to add permissions to your execution role.
    • Under “Filter policies” search for S3full. AmazonS3FullAccess. Check the box next to it.
    • Under “Filter policies” search for Rekognition. Check the box next to AmazonRekognitionFullAccess and AmazonRekognitionServiceRole.
    • Click blue Attach Policies button at the bottom. This will populate a screen which will show you the five policies attached as follows:

Permissions policies

  • Click on the Add inline policy link on the right and then click on the JSON tab on the next screen. Paste the following policy replacing the <account number> with your AWS account number:
{
    "Version": "2012-10-17",
    "Statement": [
        {
            "Sid": "MySid",
            "Effect": "Allow",
            "Action": "iam:PassRole",
            "Resource": "arn:aws:iam::<accountnumber>:role/serviceRekognition"
        }
    ]
}

On the next screen enter VideoInlinePolicy for the name and select the blue Create Policy button at the bottom.

Permissions Policies - 6 Policies Applied

Step 3a:  Navigate to SageMaker in the console:

  • Select “Notebook instances” in the menu on left. This will show your VideoRedaction notebook.
  • Select Open Jupyter blue link under Actions. This will open a new tab titled, Jupyter.

Step 3b: In the upper right corner, click on drop down arrow next to “New” and choose conda_tensorflow_p36 as the kernel for your notebook.

Your screen will look at follows:

Jupyter

Install ffmpeg

First, we need to install ffmpeg for multiprocessing video. It’s a free and open-source software project consisting of a large suite of libraries and programs for handling video, audio, and other multimedia files and streams. We use it to concatenate all the subset videos processed by each vCPU and generate the final output.

Install ffmpeg using the following command:

!conda install x264=='1!152.20180717' ffmpeg=4.0.2 -c conda-forge --yes  

Import libraries – We import additional libraries to help with multi-processing capability.

import cv2  
import os  
from PIL import ImageFilter  
import boto3  
import io  
from PIL import Image, ImageDraw, ExifTags, ImageColor  
import numpy as np  
from os.path import isfile, join  
import time  
import sys  
import time  
import subprocess as sp  
import multiprocessing as mp  
from os import remove  

Step 4: Identify personal data (faces) in the individual frames

Amazon Rekognition “Detect_Faces” detects the 100 largest faces in the image. For each face detected, the operation returns face details. These details include a bounding box of the face, a confidence value (that the bounding box contains a face), and a fixed set of attributes such as facial landmarks (for example, coordinates of eye and mouth), presence of beard, sunglasses, and so on.

You pass the input image either as base64-encoded image bytes or as a reference to an image in an Amazon S3 bucket. In this code, we pass the image as jpg to Amazon Rekognition since we want to see each frame of this video. We also show how you can expand the bounding boxes returned by Amazon Rekognition, if required, to blur an enlarged portion of the face.

	def detect_blur_face_local_file(photo,blurriness):      
	      
	    client=boto3.client('rekognition')      
	          
	    # Call DetectFaces      
	    with open(photo, 'rb') as image:      
	        response = client.detect_faces(Image={'Bytes': image.read()})      
	          
	    image=Image.open(photo)      
	    imgWidth, imgHeight = image.size        
	    draw = ImageDraw.Draw(image)         
	              
	    # Calculate and display bounding boxes for each detected face             
	    for faceDetail in response['FaceDetails']:      
	              
	        box = faceDetail['BoundingBox']      
	        left = imgWidth * box['Left']      
	        top = imgHeight * box['Top']      
	        width = imgWidth * box['Width']      
	        height = imgHeight * box['Height']      
	              
	        #blur faces inside the enlarged bounding boxes
	        #you can also keep the original bounding boxes    
	        x1=left-0.1*width  
	        y1=top-0.1*height  
	        x2=left+width+0.1*width  
	        y2=top+height+0.1*height  
	              
	        mask = Image.new('L', image.size, 0)      
	        draw = ImageDraw.Draw(mask)      
	        draw.rectangle([ (x1,y1), (x2,y2) ], fill=255)      
	        blurred = image.filter(ImageFilter.GaussianBlur(blurriness))      
	        image.paste(blurred, mask=mask)      
	        image.save      
	       
	          
	    return image      

Step 5: Redact the face bounding box and distribute the processing among all CPUs

By passing the group_number of the multi_process_video function, you can distribute the video processing job among all available CPUs of the instance equally and therefore largely reduce the process time.

	def multi_process_video(group_number):  
	    cap = cv2.VideoCapture(input_file)  
	    cap.set(cv2.CAP_PROP_POS_FRAMES, frame_jump_unit * group_number)  
	    proc_frames = 0  
	    width = int(cap.get(cv2.CAP_PROP_FRAME_WIDTH))  
	    height = int(cap.get(cv2.CAP_PROP_FRAME_HEIGHT))  
	    fps = cap.get(cv2.CAP_PROP_FPS)  
	    out = cv2.VideoWriter(  
	        "{}.{}".format(group_number, 'mp4'),  
	        cv2.VideoWriter_fourcc(*'MP4V'),  
	        fps,  
	        (width, height),  
	    )  
	  
	    while proc_frames < frame_jump_unit:  
	        ret, frame = cap.read()  
	        if ret == False:  
	            break  
	          
	        f=str(group_number)+'_'+str(proc_frames)+'.jpg'  
	        cv2.imwrite(f,frame)  
	        #Define the blurriness  
	        blurriness=20  
	        blurred_img=detect_blur_face_local_file(f,blurriness)  
	        blurred_frame=cv2.cvtColor(np.array(blurred_img), cv2.COLOR_BGR2RGB)    
	          
	        out.write(blurred_frame)  
	        proc_frames += 1  
	    else:  
	        print('Group '+str(group_number)+' finished processing!')  
	          
	    cap.release()  
	    cap.release()  
	    out.release()  
	    return None  

Step 6: Run multi-processing video function and write the redacted video to the output bucket

  • Then we multi-process the video and generate the output using multiprocessing function and ffmpeg in python.
  • We take a record of each video processed by a CPU in the format of ‘1.mp4’, ‘2.mp4’ … in a file called multiproc_files and then use subprocess to call ffmpeg to concatenate these videos based on these videos’ order in multiproc_files.
  • After the final video is generated, we remove all the intermediate results and upload the face-blurred result to a S3 bucket.
	start_time = time.time()  
	# Connect to S3  
	s3_client = boto3.client('s3')  
	      
	# Download S3 video to local. Enter your bucketname and file name below
	bucket='yourbucketname'  
	file='face1.mp4'    
	s3_client.download_file(bucket, file, './'+file)  
	      
	input_file='face1.mp4'    
	num_processes = mp.cpu_count()  
	cap = cv2.VideoCapture(input_file)  
	frame_jump_unit = cap.get(cv2.CAP_PROP_FRAME_COUNT) // num_processes  
	  
	# Multiprocessing video across all vCPUs    
	p = mp.Pool(num_processes)  
	p.map(multi_process_video, range(num_processes))  
	  
	# Generate multiproc_files to record the subset videos in the right order    
	multiproc_files = ["{}.{}".format(i, 'mp4') for i in range(num_processes)]  
	with open("multiproc_files.txt", "w") as f:  
	    for t in multiproc_files:  
	        f.write("file {} \n".format(t))  
	  
	# Use ffmpeg to concatenate all the subset videos according to multiproc_files   
	local_filename='blurface_multiproc_827.mp4'  
	  
	ffmpeg_command="ffmpeg -f concat -safe 0 -i multiproc_files.txt -c copy "  
	ffmpeg_command += local_filename  
	  
	cmd = sp.Popen(ffmpeg_command, stdout=sp.PIPE, stderr=sp.PIPE, shell=True)  
	cmd.communicate()  
	  
	# Remove all the intermediate results    
	for f in multiproc_files:  
	    remove(f)  
	remove("multiproc_files.txt")  
	  
	mydir=os.getcwd()  
	filelist = [ f for f in os.listdir(mydir) if f.endswith(".jpg") ]  
	for f in filelist:  
	    os.remove(os.path.join(mydir, f))  
	  
	# Upload face-blurred video to s3  
	s3_filename='blurface_multiproc_827.mp4'  
	response = s3_client.upload_file(local_filename, bucket, s3_filename)   
	  
	finish_time = time.time()  
	print( "Total Process Time:",finish_time-start_time,'s')  

Output:

Group 13 finished processing!

Group 15 finished processing!

Group 14 finished processing!

Group 12 finished processing!

Group 11 finished processing!

Group 9 finished processing!

Group 10 finished processing!

Group 1 finished processing!

Group 3 finished processing!

Group 4 finished processing!

Group 8 finished processing!

Group 5 finished processing!

Group 2 finished processing!

Group 7 finished processing!

Group 6 finished processing!

Group 0 finished processing!

Total Process Time: 15.709482431411743 s

Using the same instance, we reduce the process time from 168s to 15.7s. As we mentioned, ml.c5.4xlarge has 16 vCPUs and you can even further reduce the process time if you have an instance that has 32 or 64 CPUs.

Note: Choosing the right instance will depend on your requirement for process time and cost. As this result demonstrates, multiprocessing video using Amazon Rekognition is an efficient way to leverage the benefits of Amazon Rekognition state-of-the-art ML model and powerful multi-core Amazon SageMaker instances.

Comparison of Amazon SageMaker Instances in Terms of Process Time and Cost

Here is the comparison table generated when processing a 6.5 seconds video with multiple faces on different SageMaker instances. Following is a video screenshot:

Video screenshot with faces of 5 people blurred

Based on the following table, you learn that instances with 16 vCPU (4xlarge) are better options in terms of faster processing capability, while optimized for cost.

Table with SageMaker Instance Types

Depending on the size of your input video file and the requirements for real-time processing, you can break the input video file into smaller chunks and then scale instances to process those chunks in parallel. While this example is focused on blurring faces, you can also use AWS Rekognition for other use cases like someone wielding a gun, smoking a cigarette, suggestive content and the like.  These and many other moderation activities are all supported by Rekognition content moderation APIs.

Conclusion

In this blog post, we showed how you can leverage multiple cores in large machine learning instances, along with Amazon Rekognition. Doing this can significantly speed up the process of redacting personally identifiable information from videos collected by connected vehicles. The ability to provide near-real-time information unlocks additional value from the video that is ingested. For example, in smart cities, information is collected about the environment, such as road traffic and weather. This data can be visualized in near-real-time to help city management make decisions that can optimize traffic and improve residents’ quality of life.

Field Notes provides hands-on technical guidance from AWS Solutions Architects, consultants, and technical account managers, based on their experiences in the field solving real-world business problems for customers.

Building end-to-end AWS DevSecOps CI/CD pipeline with open source SCA, SAST and DAST tools

Post Syndicated from Srinivas Manepalli original https://aws.amazon.com/blogs/devops/building-end-to-end-aws-devsecops-ci-cd-pipeline-with-open-source-sca-sast-and-dast-tools/

DevOps is a combination of cultural philosophies, practices, and tools that combine software development with information technology operations. These combined practices enable companies to deliver new application features and improved services to customers at a higher velocity. DevSecOps takes this a step further, integrating security into DevOps. With DevSecOps, you can deliver secure and compliant application changes rapidly while running operations consistently with automation.

Having a complete DevSecOps pipeline is critical to building a successful software factory, which includes continuous integration (CI), continuous delivery and deployment (CD), continuous testing, continuous logging and monitoring, auditing and governance, and operations. Identifying the vulnerabilities during the initial stages of the software development process can significantly help reduce the overall cost of developing application changes, but doing it in an automated fashion can accelerate the delivery of these changes as well.

To identify security vulnerabilities at various stages, organizations can integrate various tools and services (cloud and third-party) into their DevSecOps pipelines. Integrating various tools and aggregating the vulnerability findings can be a challenge to do from scratch. AWS has the services and tools necessary to accelerate this objective and provides the flexibility to build DevSecOps pipelines with easy integrations of AWS cloud native and third-party tools. AWS also provides services to aggregate security findings.

In this post, we provide a DevSecOps pipeline reference architecture on AWS that covers the afore-mentioned practices, including SCA (Software Composite Analysis), SAST (Static Application Security Testing), DAST (Dynamic Application Security Testing), and aggregation of vulnerability findings into a single pane of glass. Additionally, this post addresses the concepts of security of the pipeline and security in the pipeline.

You can deploy this pipeline in either the AWS GovCloud Region (US) or standard AWS Regions. As of this writing, all listed AWS services are available in AWS GovCloud (US) and authorized for FedRAMP High workloads within the Region, with the exception of AWS CodePipeline and AWS Security Hub, which are in the Region and currently under the JAB Review to be authorized shortly for FedRAMP High as well.

Services and tools

In this section, we discuss the various AWS services and third-party tools used in this solution.

CI/CD services

For CI/CD, we use the following AWS services:

  • AWS CodeBuild – A fully managed continuous integration service that compiles source code, runs tests, and produces software packages that are ready to deploy.
  • AWS CodeCommit – A fully managed source control service that hosts secure Git-based repositories.
  • AWS CodeDeploy – A fully managed deployment service that automates software deployments to a variety of compute services such as Amazon Elastic Compute Cloud (Amazon EC2), AWS Fargate, AWS Lambda, and your on-premises servers.
  • AWS CodePipeline – A fully managed continuous delivery service that helps you automate your release pipelines for fast and reliable application and infrastructure updates.
  • AWS Lambda – A service that lets you run code without provisioning or managing servers. You pay only for the compute time you consume.
  • Amazon Simple Notification Service – Amazon SNS is a fully managed messaging service for both application-to-application (A2A) and application-to-person (A2P) communication.
  • Amazon Simple Storage Service – Amazon S3 is storage for the internet. You can use Amazon S3 to store and retrieve any amount of data at any time, from anywhere on the web.
  • AWS Systems Manager Parameter Store – Parameter Store gives you visibility and control of your infrastructure on AWS.

Continuous testing tools

The following are open-source scanning tools that are integrated in the pipeline for the purposes of this post, but you could integrate other tools that meet your specific requirements. You can use the static code review tool Amazon CodeGuru for static analysis, but at the time of this writing, it’s not yet available in GovCloud and currently supports Java and Python (available in preview).

  • OWASP Dependency-Check – A Software Composition Analysis (SCA) tool that attempts to detect publicly disclosed vulnerabilities contained within a project’s dependencies.
  • SonarQube (SAST) – Catches bugs and vulnerabilities in your app, with thousands of automated Static Code Analysis rules.
  • PHPStan (SAST) – Focuses on finding errors in your code without actually running it. It catches whole classes of bugs even before you write tests for the code.
  • OWASP Zap (DAST) – Helps you automatically find security vulnerabilities in your web applications while you’re developing and testing your applications.

Continuous logging and monitoring services

The following are AWS services for continuous logging and monitoring:

Auditing and governance services

The following are AWS auditing and governance services:

  • AWS CloudTrail – Enables governance, compliance, operational auditing, and risk auditing of your AWS account.
  • AWS Identity and Access Management – Enables you to manage access to AWS services and resources securely. With IAM, you can create and manage AWS users and groups, and use permissions to allow and deny their access to AWS resources.
  • AWS Config – Allows you to assess, audit, and evaluate the configurations of your AWS resources.

Operations services

The following are AWS operations services:

  • AWS Security Hub – Gives you a comprehensive view of your security alerts and security posture across your AWS accounts. This post uses Security Hub to aggregate all the vulnerability findings as a single pane of glass.
  • AWS CloudFormation – Gives you an easy way to model a collection of related AWS and third-party resources, provision them quickly and consistently, and manage them throughout their lifecycles, by treating infrastructure as code.
  • AWS Systems Manager Parameter Store – Provides secure, hierarchical storage for configuration data management and secrets management. You can store data such as passwords, database strings, Amazon Machine Image (AMI) IDs, and license codes as parameter values.
  • AWS Elastic Beanstalk – An easy-to-use service for deploying and scaling web applications and services developed with Java, .NET, PHP, Node.js, Python, Ruby, Go, and Docker on familiar servers such as Apache, Nginx, Passenger, and IIS. This post uses Elastic Beanstalk to deploy LAMP stack with WordPress and Amazon Aurora MySQL. Although we use Elastic Beanstalk for this post, you could configure the pipeline to deploy to various other environments on AWS or elsewhere as needed.

Pipeline architecture

The following diagram shows the architecture of the solution.

AWS DevSecOps CICD pipeline architecture

AWS DevSecOps CICD pipeline architecture


The main steps are as follows:

  1. When a user commits the code to a CodeCommit repository, a CloudWatch event is generated which, triggers CodePipeline.
  2. CodeBuild packages the build and uploads the artifacts to an S3 bucket. CodeBuild retrieves the authentication information (for example, scanning tool tokens) from Parameter Store to initiate the scanning. As a best practice, it is recommended to utilize Artifact repositories like AWS CodeArtifact to store the artifacts, instead of S3. For simplicity of the workshop, we will continue to use S3.
  3. CodeBuild scans the code with an SCA tool (OWASP Dependency-Check) and SAST tool (SonarQube or PHPStan; in the provided CloudFormation template, you can pick one of these tools during the deployment, but CodeBuild is fully enabled for a bring your own tool approach).
  4. If there are any vulnerabilities either from SCA analysis or SAST analysis, CodeBuild invokes the Lambda function. The function parses the results into AWS Security Finding Format (ASFF) and posts it to Security Hub. Security Hub helps aggregate and view all the vulnerability findings in one place as a single pane of glass. The Lambda function also uploads the scanning results to an S3 bucket.
  5. If there are no vulnerabilities, CodeDeploy deploys the code to the staging Elastic Beanstalk environment.
  6. After the deployment succeeds, CodeBuild triggers the DAST scanning with the OWASP ZAP tool (again, this is fully enabled for a bring your own tool approach).
  7. If there are any vulnerabilities, CodeBuild invokes the Lambda function, which parses the results into ASFF and posts it to Security Hub. The function also uploads the scanning results to an S3 bucket (similar to step 4).
  8. If there are no vulnerabilities, the approval stage is triggered, and an email is sent to the approver for action.
  9. After approval, CodeDeploy deploys the code to the production Elastic Beanstalk environment.
  10. During the pipeline run, CloudWatch Events captures the build state changes and sends email notifications to subscribed users through SNS notifications.
  11. CloudTrail tracks the API calls and send notifications on critical events on the pipeline and CodeBuild projects, such as UpdatePipeline, DeletePipeline, CreateProject, and DeleteProject, for auditing purposes.
  12. AWS Config tracks all the configuration changes of AWS services. The following AWS Config rules are added in this pipeline as security best practices:
  13. CODEBUILD_PROJECT_ENVVAR_AWSCRED_CHECK – Checks whether the project contains environment variables AWS_ACCESS_KEY_ID and AWS_SECRET_ACCESS_KEY. The rule is NON_COMPLIANT when the project environment variables contains plaintext credentials.
  14. CLOUD_TRAIL_LOG_FILE_VALIDATION_ENABLED – Checks whether CloudTrail creates a signed digest file with logs. AWS recommends that the file validation be enabled on all trails. The rule is noncompliant if the validation is not enabled.

Security of the pipeline is implemented by using IAM roles and S3 bucket policies to restrict access to pipeline resources. Pipeline data at rest and in transit is protected using encryption and SSL secure transport. We use Parameter Store to store sensitive information such as API tokens and passwords. To be fully compliant with frameworks such as FedRAMP, other things may be required, such as MFA.

Security in the pipeline is implemented by performing the SCA, SAST and DAST security checks. Alternatively, the pipeline can utilize IAST (Interactive Application Security Testing) techniques that would combine SAST and DAST stages.

As a best practice, encryption should be enabled for the code and artifacts, whether at rest or transit.

In the next section, we explain how to deploy and run the pipeline CloudFormation template used for this example. Refer to the provided service links to learn more about each of the services in the pipeline. If utilizing CloudFormation templates to deploy infrastructure using pipelines, we recommend using linting tools like cfn-nag to scan CloudFormation templates for security vulnerabilities.

Prerequisites

Before getting started, make sure you have the following prerequisites:

Deploying the pipeline

To deploy the pipeline, complete the following steps: Download the CloudFormation template and pipeline code from GitHub repo.

  1. Log in to your AWS account if you have not done so already.
  2. On the CloudFormation console, choose Create Stack.
  3. Choose the CloudFormation pipeline template.
  4. Choose Next.
  5. Provide the stack parameters:
    • Under Code, provide code details, such as repository name and the branch to trigger the pipeline.
    • Under SAST, choose the SAST tool (SonarQube or PHPStan) for code analysis, enter the API token and the SAST tool URL. You can skip SonarQube details if using PHPStan as the SAST tool.
    • Under DAST, choose the DAST tool (OWASP Zap) for dynamic testing and enter the API token, DAST tool URL, and the application URL to run the scan.
    • Under Lambda functions, enter the Lambda function S3 bucket name, filename, and the handler name.
    • Under STG Elastic Beanstalk Environment and PRD Elastic Beanstalk Environment, enter the Elastic Beanstalk environment and application details for staging and production to which this pipeline deploys the application code.
    • Under General, enter the email addresses to receive notifications for approvals and pipeline status changes.

CF Deploymenet - Passing parameter values

CloudFormation deployment - Passing parameter values

CloudFormation template deployment

After the pipeline is deployed, confirm the subscription by choosing the provided link in the email to receive the notifications.

The provided CloudFormation template in this post is formatted for AWS GovCloud. If you’re setting this up in a standard Region, you have to adjust the partition name in the CloudFormation template. For example, change ARN values from arn:aws-us-gov to arn:aws.

Running the pipeline

To trigger the pipeline, commit changes to your application repository files. That generates a CloudWatch event and triggers the pipeline. CodeBuild scans the code and if there are any vulnerabilities, it invokes the Lambda function to parse and post the results to Security Hub.

When posting the vulnerability finding information to Security Hub, we need to provide a vulnerability severity level. Based on the provided severity value, Security Hub assigns the label as follows. Adjust the severity levels in your code based on your organization’s requirements.

  • 0 – INFORMATIONAL
  • 1–39 – LOW
  • 40– 69 – MEDIUM
  • 70–89 – HIGH
  • 90–100 – CRITICAL

The following screenshot shows the progression of your pipeline.

CodePipeline stages

CodePipeline stages

SCA and SAST scanning

In our architecture, CodeBuild trigger the SCA and SAST scanning in parallel. In this section, we discuss scanning with OWASP Dependency-Check, SonarQube, and PHPStan. 

Scanning with OWASP Dependency-Check (SCA)

The following is the code snippet from the Lambda function, where the SCA analysis results are parsed and posted to Security Hub. Based on the results, the equivalent Security Hub severity level (normalized_severity) is assigned.

Lambda code snippet for OWASP Dependency-check

Lambda code snippet for OWASP Dependency-check

You can see the results in Security Hub, as in the following screenshot.

SecurityHub report from OWASP Dependency-check scanning

SecurityHub report from OWASP Dependency-check scanning

Scanning with SonarQube (SAST)

The following is the code snippet from the Lambda function, where the SonarQube code analysis results are parsed and posted to Security Hub. Based on SonarQube results, the equivalent Security Hub severity level (normalized_severity) is assigned.

Lambda code snippet for SonarQube

Lambda code snippet for SonarQube

The following screenshot shows the results in Security Hub.

SecurityHub report from SonarQube scanning

SecurityHub report from SonarQube scanning

Scanning with PHPStan (SAST)

The following is the code snippet from the Lambda function, where the PHPStan code analysis results are parsed and posted to Security Hub.

Lambda code snippet for PHPStan

Lambda code snippet for PHPStan

The following screenshot shows the results in Security Hub.

SecurityHub report from PHPStan scanning

SecurityHub report from PHPStan scanning

DAST scanning

In our architecture, CodeBuild triggers DAST scanning and the DAST tool.

If there are no vulnerabilities in the SAST scan, the pipeline proceeds to the manual approval stage and an email is sent to the approver. The approver can review and approve or reject the deployment. If approved, the pipeline moves to next stage and deploys the application to the provided Elastic Beanstalk environment.

Scanning with OWASP Zap

After deployment is successful, CodeBuild initiates the DAST scanning. When scanning is complete, if there are any vulnerabilities, it invokes the Lambda function similar to SAST analysis. The function parses and posts the results to Security Hub. The following is the code snippet of the Lambda function.

Lambda code snippet for OWASP-Zap

Lambda code snippet for OWASP-Zap

The following screenshot shows the results in Security Hub.

SecurityHub report from OWASP-Zap scanning

SecurityHub report from OWASP-Zap scanning

Aggregation of vulnerability findings in Security Hub provides opportunities to automate the remediation. For example, based on the vulnerability finding, you can trigger a Lambda function to take the needed remediation action. This also reduces the burden on operations and security teams because they can now address the vulnerabilities from a single pane of glass instead of logging into multiple tool dashboards.

Conclusion

In this post, I presented a DevSecOps pipeline that includes CI/CD, continuous testing, continuous logging and monitoring, auditing and governance, and operations. I demonstrated how to integrate various open-source scanning tools, such as SonarQube, PHPStan, and OWASP Zap for SAST and DAST analysis. I explained how to aggregate vulnerability findings in Security Hub as a single pane of glass. This post also talked about how to implement security of the pipeline and in the pipeline using AWS cloud native services. Finally, I provided the DevSecOps pipeline as code using AWS CloudFormation. For additional information on AWS DevOps services and to get started, see AWS DevOps and DevOps Blog.


Srinivas Manepalli is a DevSecOps Solutions Architect in the U.S. Fed SI SA team at Amazon Web Services (AWS). He is passionate about helping customers, building and architecting DevSecOps and highly available software systems. Outside of work, he enjoys spending time with family, nature and good food.

Field Notes: How FactSet Uses ‘microAccounts’ to Reduce Developer Friction and Maintain Security at Scale

Post Syndicated from Tarik Makota original https://aws.amazon.com/blogs/architecture/field-notes-how-factset-uses-microaccounts-to-reduce-developer-friction-and-maintain-security-at-scale/

This is post was co-written by FactSet’s Cloud Infrastructure team, Gaurav Jain, Nathan Goodman, Geoff Wang, Daniel Cordes, Sunu Joseph and AWS Solution Architects, Amit Borulkar and Tarik Makota.

FactSet considers developer self-service and DevOps essential for realizing cloud benefits.  As part of their cloud adoption journey, they wanted developers to have a frictionless infrastructure provisioning experience while maintaining standardization and security of their cloud environment.  To achieve their objectives, they use what they refer to as a ‘microAccounts approach’. In their microAccount approach, each AWS account is allocated for one project and is owned by a single team.

In this blog, we describe how FactSet manages 1000+ AWS accounts at scale using the microAccounts approach. First, we cover the core concepts of their approach. Then we outline how they manage access and permissions. Finally, we show how they manage their networking implementation and how they use automation to manage their AWS Cloud infrastructure.

How FactSet started with AWS

They started their cloud adoption journey with what they now call a ‘macroAccounts’ approach. In the early days they would set up a handful of AWS accounts. These macroAccounts were then shared across several different application teams and projects.   They have hundreds of application teams along with thousands of developers and they quickly experienced the challenges of a macroAccounts approach. These include the following:

  1. AWS Identity and Access Management (IAM) policies and resource tagging were complex to design in order to maintain least privilege. For example, if a developer desired the ability to start/stop Amazon EC2 instances, they would need to ensure that they are limited to starting/stopping only their own instances.  This complexity kept increasing as developers wanted to automate their workflows using constructs such as AWS Lambda functions, and containers.
  2. They had difficulty in properly attributing cloud costs across departments.  More importantly they kept going back and forth on: how do we establish accountability and transparency around spends by groups, projects, or teams?
  3. It was difficult to track and manage impact of infrastructure change to FactSet applications. For example, how is maintenance off underlying security group or IAM policy affecting FactSet applications?
  4. Significant effort was required in managing service quotas and limits across various applications being under single AWS account.

FactSet’s solution – microAccounts

Recognizing the issues, they decided to take a different approach to AWS account management. Instead of creating a few shared macro-accounts, they decided to create one AWS account per project (microAccounts) with clearly defined ownership and product allocation.  An analogy might be that macro-accounts were like leaving the main door of a house open but locking individual closets and rooms to limit access. This is opposed to safeguarding the entry to the house but largely leaving individual closets and rooms open for the tenant to manage.

Benefits of microAccounts

They have been operating their AWS Cloud infrastructure using microAccounts for about two years now. Benefits of the microAccount approach include:

1.      Access & Permissions: By associating an account with a project they simplified which services are allowed, which resources that development team can access, and are able to ensure that those permissions cascade properly to underlying resources.  The following diagram shows their microAccount strategy.


Tagging versus microAccount strategy

Figure 1 – Tagging versus microAccount strategy

2.      Service Quotas & Limits: Given most service quotas are account specific, microAccounts allow their developers to plan limits based on their application needs.  In a shared account configuration, there was no mechanism to limit separate teams from using up a larger portion of the service quota, leaving other teams with less.  These limits extend beyond infrastructure provisioning to run time tasks like Lambda concurrency, API throttling limits on parameter store and more.

3.      AWS Service Permissions: microAccounts allowed FactSet to easily implement least privilege across services. By using IAM service control policies (SCPs) they limit what AWS services an account can access.  They start with a default set of services and based on business need we can grant a specific account access to other non-common services without having to worry about those services creeping into other use cases.  For example, they disable storage gateway by default, but can allow access for a specific account if needed.

4.      Blast Radius Containment:  microAccounts provides the ability to create safety boundaries. This is in the event of any stability and security issues, they stay isolated within that specific application (AWS account) and they don’t affect operations of other applications.

5.     Cost Attributions:  Clearly defined account ownership provides a simple and straightforward way to attribute costs to a specific team, project, or product.  They don’t have to enforce the tagging individual resources for cost purposes. AWS account acts like an application resource group so all resources in the account are implicitly tagged.

6.      Account Notifications & Operations:  Single threaded account ownership allows FactSet to automatically relay any required notification to right developers.  Moreover, given that account ownership is fundamental in defining who is allowed access to the account, there is a high level of confidence in the validity of this mapping as opposed to relying on just tagging.

7.      Account Standards & Extensions: we manage microAccounts through a CI/CD pipeline which allows us to standardize and extend without interruptions.  For example, all their microAccounts are provisioned with a standard AWS Key Management Service (AWS KMS) key, an AWS Backup Vault & policy, private Amazon Route 53 zone, AWS Systems Manager Parameter Store with network information for Terraform or AWS CloudFormation templates.

8.      Developer Experience: microAccount automation and guardrails allow developers to get started quickly instead of spending time debugging things like correct SCP/IAM permissions and more. Developers tend to work across multiple applications and their experience has improved as they have a standard set of expectations for their AWS environment. This is particularly useful as they move from application to application.

Access and permissions for microAccounts

FactSet creates every AWS account with a standard set of IAM roles and permissions. Furthermore, each account has its own SCP which defines the list of services allowed in the account.  Based on application needs, they can extend the permissions.  Interactive roles are mapped to an ActiveDirectory (AD) group, and membership of the AD group is managed by the development teams themselves.  Standard roles are:

  • DevOps Role – Interactive role used to provision and manage infrastructure.
  • Developer Role – Interactive role used to read/write data (and some infrastructure)
  • ReadOnly Role – Interactive role with read-only access to the account.  This can be granted to account supervisors, product developers, and other similar roles.
  • Support Roles – Interactive roles for certain admin teams to assist account owners if needed
  • ServiceExecutionRole – Role that can be attached to entities such as Lambda functions, CodeBuild, EC2 instances, and has similar permissions to a developer role.
IAM Role Privileges

Figure 2 – IAM Role Privileges

Networking for microAccounts

  • FactSet leverages AWS Resource Access Manager (RAM) to share appropriate subnets with each account.  Each microAccount provisioned has access to subnets by sing AWS Shared VPCs.  They create a single VPC per business unit per environment (Dev, Prod, UAT, and Shared Services) in each region.  RAM enabled them to easily and securely share AWS resources with any AWS account within their AWS Organization.  When an account is created they allocate appropriate subnets to that account.
  • They use AWS Transit Gateway to manage inter-VPC routing and communication across multiple VPCs in a region.  They didn’t want to limit our ability to scale up quickly.  AWS Transit Gateway is a single place to land their AWS Direct Connect circuits in each Region.  It provides them with a consolidated place to manage routing tables that propagated to each VPC when they are attached.


VPC Sharing for microAccounts

Figure 3 – VPC Sharing for microAccounts

Automation & Config Management for microAccounts

To create frictionless self-service cloud infrastructure early on, FactSet realized that automation is a must.  Their infrastructure automation uses source-control as a source of truth for defining each microAccount. This helps them ensure repeatable and standardized account provisioning process, as well as flexibility to adjust specific settings and permissions on per account needs.

Account provisioning flow

Figure 4 – Account provisioning flow

By default, their accounts are only enabled in a small set of Regions.  They control it via the following policy block.  If they add new Region(s), they would implement that change in source-control and automated enforcement checks would add it to SCP.

{
    "Sid": "DenyOtherRegions",
    "Effect": "Deny",
    "Action": "*",
    "Resource": "*",
    "Condition": {
        "StringNotEquals": {
            "aws:RequestedRegion": ["us-east-1","eu-west-2"]
        },
        "ForAllValues:StringNotLike": {
            "aws:PrincipalArn": [
                "arn:aws:iam::*:role/cloud-admin-role"
    }
}

Lessons Learned

During their journey to adopt microAccounts, FactSet came across some new challenges that are worth highlighting:

  1. IAM role creation: Their DevOps Role can create new IAM roles within the account.  To ensure that newly created role complies with least-privilege principles, they attach a standard permission boundary which limits its permissions to not extend beyond DevOps level.
  2. Account Deletion: While AWS provides APIs for account creation, currently there is no API to delete or rename an account.  This is not an issue since only a small percentage of accounts had to be deleted because of a cancelled project for example.
  3. Account Creation / Service Activation: Although automation is used to provision accounts it can still take time for all services in account to be fully activated.  Some services like Amazon EC2 have asynchronous processes to be activated in a new account.
  4. Account Email, Root Password, and MFA: Upon account creation, they don’t set up a root password or MFA.  That is only setup on the primary (master) account.  Given each account requires a unique email address, they leverage Amazon Simple Email Service (Amazon SES) to create a new email address with cloud administrator team as the recipients.  When they need to log in as root (very unusual), they go through the process of password reset before logging in.
  5. Service Control Policies: There were two primary challenges related to SCPs:
    • SCP is a property in the primary (master) account that is attached to a child microAccount.  However, they also wanted to manage SCP like any other account config and store it in source-control along with other account configuration.  This required IAM role used by our automation to have special permissions to be able to create/attach/detach SCPs in the primary (master) account.
    • There is a hard limit of 1000 SCPs in the primary (master) account.  If you have a SCP per account, this would limit you to 1000 microAccounts.  They solved this by re-using SCPs across accounts with same policies.  Content of a policy is hashed to create a unique SCP identifier, and accounts with same hashes are attached to same SCP.
  6. Sharing data (typically S3) across microAccounts: they leverage a concept of “trusted-accounts” to allow other accounts access to an account’s resources including S3 and KMS keys.
  7. It may feel like an anti-pattern to have resources with static costs like Application Load Balancers (ALB) and KMS for individual projects as opposed to a shared pool.  The list of resources with a base cost is small as most of the services are largely priced based on usage.  For FactSet, resource isolation is a key benefit of microAccounts, and therefore outweighs some of these added costs.
  8. Central Inventory & Logging: With 100s of accounts, it is worth investing in a more centralized inventory and AWS CloudTrail logs collection system.
  9. Costs, Reserved Instances (RI), and Savings Plans: FactSet found AWS Cost Explorer at the level of your primary (master) account to be a great tool for cost-transparency.  They leverage AWS Cost Explorer’s API to import that data into their internal cost transparency tools.  RIs and Savings Plans are managed centrally and leverage automatic sharing between accounts within the same master (primary) organization.

Conclusion

The microAccounts approach provides FactSet with the agility to operate according to specific needs of different teams and projects in the enterprise. They are currently deploying in twelve AWS Regions with automated AWS account provisioning happening in minutes and drift checks executing multiple times throughout the day. This frees up their developers to focus on solving business problems to maximize the benefits of cloud computing, so that their business can innovate and accelerate their clients’ digital transformations.

Their experience operating regulated infrastructure in the cloud demonstrated that microAccounts are pivotal for managing cloud at scale. With microAccounts they were able to accelerate projects onboarded to cloud by 5X, reduce number of IAM permission tickets by 10X, and experienced 3X fewer stability issues. We hope that this blog post provided useful insights to help determine if the microAccount strategy is a good fit for you.

In their own words, FactSet creates flexible, open data and software solutions for tens of thousands of investment professionals around the world, which provides instant access to financial data and analytics that investors use to make crucial decisions. At FactSet, we are always working to improve the value that our products provide.

Recommended Reading:

Defining an AWS Multi-Account Strategy for telecommunications companies

Why should I set up a multi-account AWS environment?

Field Notes provides hands-on technical guidance from AWS Solutions Architects, consultants, and technical account managers, based on their experiences in the field solving real-world business problems for customers.


Using Route 53 Private Hosted Zones for Cross-account Multi-region Architectures

Post Syndicated from Anandprasanna Gaitonde original https://aws.amazon.com/blogs/architecture/using-route-53-private-hosted-zones-for-cross-account-multi-region-architectures/

This post was co-written by Anandprasanna Gaitonde, AWS Solutions Architect and John Bickle, Senior Technical Account Manager, AWS Enterprise Support

Introduction

Many AWS customers have internal business applications spread over multiple AWS accounts and on-premises to support different business units. In such environments, you may find a consistent view of DNS records and domain names between on-premises and different AWS accounts useful. Route 53 Private Hosted Zones (PHZs) and Resolver endpoints on AWS create an architecture best practice for centralized DNS in hybrid cloud environment. Your business units can use flexibility and autonomy to manage the hosted zones for their applications and support multi-region application environments for disaster recovery (DR) purposes.

This blog presents an architecture that provides a unified view of the DNS while allowing different AWS accounts to manage subdomains. It utilizes PHZs with overlapping namespaces and cross-account multi-region VPC association for PHZs to create an efficient, scalable, and highly available architecture for DNS.

Architecture Overview

You can set up a multi-account environment using services such as AWS Control Tower to host applications and workloads from different business units in separate AWS accounts. However, these applications have to conform to a naming scheme based on organization policies and simpler management of DNS hierarchy. As a best practice, the integration with on-premises DNS is done by configuring Amazon Route 53 Resolver endpoints in a shared networking account. Following is an example of this architecture.

Route 53 PHZs and Resolver Endpoints

Figure 1 – Architecture Diagram

The customer in this example has on-premises applications under the customer.local domain. Applications hosted in AWS use subdomain delegation to aws.customer.local. The example here shows three applications that belong to three different teams, and those environments are located in their separate AWS accounts to allow for autonomy and flexibility. This architecture pattern follows the option of the “Multi-Account Decentralized” model as described in the whitepaper Hybrid Cloud DNS options for Amazon VPC.

This architecture involves three key components:

1. PHZ configuration: PHZ for the subdomain aws.customer.local is created in the shared Networking account. This is to support centralized management of PHZ for ancillary applications where teams don’t want individual control (Item 1a in Figure). However, for the key business applications, each of the teams or business units creates its own PHZ. For example, app1.aws.customer.local – Application1 in Account A, app2.aws.customer.local – Application2 in Account B, app3.aws.customer.local – Application3 in Account C (Items 1b in Figure). Application1 is a critical business application and has stringent DR requirements. A DR environment of this application is also created in us-west-2.

For a consistent view of DNS and efficient DNS query routing between the AWS accounts and on-premises, best practice is to associate all the PHZs to the Networking Account. PHZs created in Account A, B and C are associated with VPC in Networking Account by using cross-account association of Private Hosted Zones with VPCs. This creates overlapping domains from multiple PHZs for the VPCs of the networking account. It also overlaps with the parent sub-domain PHZ (aws.customer.local) in the Networking account. In such cases where there is two or more PHZ with overlapping namespaces, Route 53 resolver routes traffic based on most specific match as described in the Developer Guide.

2. Route 53 Resolver endpoints for on-premises integration (Item 2 in Figure): The networking account is used to set up the integration with on-premises DNS using Route 53 Resolver endpoints as shown in Resolving DNS queries between VPC and your network. Inbound and Outbound Route 53 Resolver endpoints are created in the VPC in us-east-1 to serve as the integration between on-premises DNS and AWS. The DNS traffic between on-premises to AWS requires an AWS Site2Site VPN connection or AWS Direct Connect connection to carry DNS and application traffic. For each Resolver endpoint, two or more IP addresses can be specified to map to different Availability Zones (AZs). This helps create a highly available architecture.

3. Route 53 Resolver rules (Item 3 in Figure): Forwarding rules are created only in the networking account to route DNS queries for on-premises domains (customer.local) to the on-premises DNS server. AWS Resource Access Manager (RAM) is used to share the rules to accounts A, B and C as mentioned in the section “Sharing forwarding rules with other AWS accounts and using shared rules” in the documentation. Account owners can now associate these shared rules with their VPCs the same way that they associate rules created in their own AWS accounts. If you share the rule with another AWS account, you also indirectly share the outbound endpoint that you specify in the rule as described in the section “Considerations when creating inbound and outbound endpoints” in the documentation. This implies that you use one outbound endpoint in a region to forward DNS queries to your on-premises network from multiple VPCs, even if the VPCs were created in different AWS accounts. Resolver starts to forward DNS queries for the domain name that’s specified in the rule to the outbound endpoint and forward to the on-premises DNS servers. The rules are created in both regions in this architecture.

This architecture provides the following benefits:

  1. Resilient and scalable
  2. Uses the VPC+2 endpoint, local caching and Availability Zone (AZ) isolation
  3. Minimal forwarding hops
  4. Lower cost: optimal use of Resolver endpoints and forwarding rules

In order to handle the DR, here are some other considerations:

  • For app1.aws.customer.local, the same PHZ is associated with VPC in us-west-2 region. While VPCs are regional, the PHZ is a global construct. The same PHZ is accessible from VPCs in different regions.
  • Failover routing policy is set up in the PHZ and failover records are created. However, Route 53 health checkers (being outside of the VPC) require a public IP for your applications. As these business applications are internal to the organization, a metric-based health check with Amazon CloudWatch can be configured as mentioned in Configuring failover in a private hosted zone.
  • Resolver endpoints are created in VPC in another region (us-west-2) in the networking account. This allows on-premises servers to failover to these secondary Resolver inbound endpoints in case the region goes down.
  • A second set of forwarding rules is created in the networking account, which uses the outbound endpoint in us-west-2. These are shared with Account A and then associated with VPC in us-west-2.
  • In addition, to have DR across multiple on-premises locations, the on-premises servers should have a secondary backup DNS on-premises as well (not shown in the diagram).
    This ensures a simple DNS architecture for the DR setup, and seamless failover for applications in case of a region failure.

Considerations

  • If Application 1 needs to communicate to Application 2, then the PHZ from Account A must be shared with Account B. DNS queries can then be routed efficiently for those VPCs in different accounts.
  • Create additional IP addresses in a single AZ/subnet for the resolver endpoints, to handle large volumes of DNS traffic.
  • Look at Considerations while using Private Hosted Zones before implementing such architectures in your AWS environment.

Summary

Hybrid cloud environments can utilize the features of Route 53 Private Hosted Zones such as overlapping namespaces and the ability to perform cross-account and multi-region VPC association. This creates a unified DNS view for your application environments. The architecture allows for scalability and high availability for business applications.

Field Notes: Improving Call Center Experiences with Iterative Bot Training Using Amazon Connect and Amazon Lex

Post Syndicated from Marius Cealera original https://aws.amazon.com/blogs/architecture/field-notes-improving-call-center-experiences-with-iterative-bot-training-using-amazon-connect-and-amazon-lex/

This post was co-written by Abdullah Sahin, senior technology architect at Accenture, and Muhammad Qasim, software engineer at Accenture. 

Organizations deploying call-center chat bots are interested in evolving their solutions continuously, in response to changing customer demands. When developing a smart chat bot, some requests can be predicted (for example following a new product launch or a new marketing campaign). There are however instances where this is not possible (following market shifts, natural disasters, etc.)

While voice and chat bots are becoming more and more ubiquitous, keeping the bots up-to-date with the ever-changing demands remains a challenge.  It is clear that a build>deploy>forget approach quickly leads to outdated AI that lacks the ability to adapt to dynamic customer requirements.

Call-center solutions which create ongoing feedback mechanisms between incoming calls or chat messages and the chatbot’s AI, allow for a programmatic approach to predicting and catering to a customer’s intent.

This is achieved by doing the following:

  • applying natural language processing (NLP) on conversation data
  • extracting relevant missed intents,
  • automating the bot update process
  • inserting human feedback at key stages in the process.

This post provides a technical overview of one of Accenture’s Advanced Customer Engagement (ACE+) solutions, explaining how it integrates multiple AWS services to continuously and quickly improve chatbots and stay ahead of customer demands.

Call center solution architects and administrators can use this architecture as a starting point for an iterative bot improvement solution. The goal is to lead to an increase in call deflection and drive better customer experiences.

Overview of Solution

The goal of the solution is to extract missed intents and utterances from a conversation and present them to the call center agent at the end of a conversation, as part of the after-work flow. A simple UI interface was designed for the agent to select the most relevant missed phrases and forward them to an Analytics/Operations Team for final approval.

Figure 1 – Architecture Diagram

Amazon Connect serves as the contact center platform and handles incoming calls, manages the IVR flows and the escalations to the human agent. Amazon Connect is also used to gather call metadata, call analytics and handle call center user management. It is the platform from which other AWS services are called: Amazon Lex, Amazon DynamoDB and AWS Lambda.

Lex is the AI service used to build the bot. Lambda serves as the main integration tool and is used to push bot transcripts to DynamoDB, deploy updates to Lex and to populate the agent dashboard which is used to flag relevant intents missed by the bot. A generic CRM app is used to integrate the agent client and provide a single, integrated, dashboard. For example, this addition to the agent’s UI, used to review intents, could be implemented as a custom page in Salesforce (Figure 2).

Figure 2 – Agent feedback dashboard in Salesforce. The section allows the agent to select parts of the conversation that should be captured as intents by the bot.

A separate, stand-alone, dashboard is used by an Analytics and Operations Team to approve the new intents, which triggers the bot update process.

Walkthrough

The typical use case for this solution (Figure 4) shows how missing intents in the bot configuration are captured from customer conversations. These intents are then validated and used to automatically build and deploy an updated version of a chatbot. During the process, the following steps are performed:

  1. Customer intents that were missed by the chatbot are automatically highlighted in the conversation
  2. The agent performs a review of the transcript and selects the missed intents that are relevant.
  3. The selected intents are sent to an Analytics/Ops Team for final approval.
  4. The operations team validates the new intents and starts the chatbot rebuild process.

Figure 3 – Use case: the bot is unable to resolve the first call (bottom flow). Post-call analysis results in a new version of the bot being built and deployed. The new bot is able to handle the issue in subsequent calls (top flow)

During the first call (bottom flow) the bot fails to fulfil the request and the customer is escalated to a Live Agent. The agent resolves the query and, post call, analyzes the transcript between the chatbot and the customer, identifies conversation parts that the chatbot should have understood and sends a ‘missed intent/utterance’ report to the Analytics/Ops Team. The team approves and triggers the process that updates the bot.

For the second call, the customer asks the same question. This time, the (trained) bot is able to answer the query and end the conversation.

Ideally, the post-call analysis should be performed, at least in part, by the agent handling the call. Involving the agent in the process is critical for delivering quality results. Any given conversation can have multiple missed intents, some of them irrelevant when looking to generalize a customer’s question.

A call center agent is in the best position to judge what is or is not useful and mark the missed intents to be used for bot training. This is the important logical triage step. Of course, this will result in the occasional increase in the average handling time (AHT). This should be seen as a time investment with the potential to reduce future call times and increase deflection rates.

One alternative to this setup would be to have a dedicated analytics team review the conversations, offloading this work from the agent. This approach avoids the increase in AHT, but also introduces delay and, possibly, inaccuracies in the feedback loop.

The approval from the Analytics/Ops Team is a sign off on the agent’s work and trigger for the bot building process.

Prerequisites

The following section focuses on the sequence required to programmatically update intents in existing Lex bots. It assumes a Connect instance is configured and a Lex bot is already integrated with it. Navigate to this page for more information on adding Lex to your Connect flows.

It also does not cover the CRM application, where the conversation transcript is displayed and presented to the agent for intent selection.  The implementation details can vary significantly depending on the CRM solution used. Conceptually, most solutions will follow the architecture presented in Figure1: store the conversation data in a database (DynamoDB here) and expose it through an (API Gateway here) to be consumed by the CRM application.

Lex bot update sequence

The core logic for updating the bot is contained in a Lambda function that triggers the Lex update. This adds new utterances to an existing bot, builds it and then publishes a new version of the bot. The Lambda function is associated with an API Gateway endpoint which is called with the following body:

{
	“intent”: “INTENT_NAME”,
	“utterances”: [“UTTERANCE_TO_ADD_1”, “UTTERANCE_TO_ADD_2” …]
}

Steps to follow:

  1. The intent information is fetched from Lex using the getIntent API
  2. The existing utterances are combined with the new utterances and deduplicated.
  3. The intent information is updated with the new utterances
  4. The updated intent information is passed to the putIntent API to update the Lex Intent
  5. The bot information is fetched from Lex using the getBot API
  6. The intent version present within the bot information is updated with the new intent

Figure 4 – Representation of Lex Update Sequence


7. The update bot information is passed to the putBot API to update Lex and the processBehavior is set to “BUILD” to trigger a build. The following code snippet shows how this would be done in JavaScript:

const updateBot = await lexModel
    .putBot({
        ...bot,
        processBehavior: "BUILD"
    })
    .promise()

9. The last step is to publish the bot, for this we fetch the bot alias information and then call the putBotAlias API.

const oldBotAlias = await lexModel
    .getBotAlias({
        name: config.botAlias,
        botName: updatedBot.name
    })
    .promise()

return lexModel
    .putBotAlias({
        name: config.botAlias,
        botName: updatedBot.name,
        botVersion: updatedBot.version,
        checksum: oldBotAlias.checksum,
}) 

Conclusion

In this post, we showed how a programmatic bot improvement process can be implemented around Amazon Lex and Amazon Connect.  Continuously improving call center bots is a fundamental requirement for increased customer satisfaction. The feedback loop, agent validation and automated bot deployment pipeline should be considered integral parts to any a chatbot implementation.

Finally, the concept of a feedback-loop is not specific to call-center chatbots. The idea of adding an iterative improvement process in the bot lifecycle can also be applied in other areas where chatbots are used.

Accelerating Innovation with the Accenture AWS Business Group (AABG)

By working with the Accenture AWS Business Group (AABG), you can learn from the resources, technical expertise, and industry knowledge of two leading innovators, helping you accelerate the pace of innovation to deliver disruptive products and services. The AABG helps customers ideate and innovate cloud solutions with customers through rapid prototype development.

Connect with our team at [email protected] to learn and accelerate how to use machine learning in your products and services.


Field Notes provides hands-on technical guidance from AWS Solutions Architects, consultants, and technical account managers, based on their experiences in the field solving real-world business problems for customers.


Abdullah Sahin

Abdullah Sahin

Abdullah Sahin is a senior technology architect at Accenture. He is leading a rapid prototyping team bringing the power of innovation on AWS to Accenture customers. He is a fan of CI/CD, containerization technologies and IoT.

Muhammad Qasim

Muhammad Qasin

Muhammad Qasim is a software engineer at Accenture and excels in development of voice bots using services such as Amazon Connect. In his spare time, he plays badminton and loves to go for a run.

Automating Recommendation Engine Training with Amazon Personalize and AWS Glue

Post Syndicated from Alexander Spivak original https://aws.amazon.com/blogs/architecture/automating-recommendation-engine-training-with-amazon-personalize-and-aws-glue/

Customers from startups to enterprises observe increased revenue when personalizing customer interactions. Still, many companies are not yet leveraging the power of personalization, or, are relying solely on rule-based strategies. Those strategies are effort-intensive to maintain and not effective. Common reasons for not launching machine learning (ML) based personalization projects include: the complexity of aggregating and preparing the datasets, gaps in data science expertise and the lack of trust regarding the quality of ML recommendations.

This blog post demonstrates an approach for product recommendations to mitigate those concerns using historical datasets. To get started with your personalization journey, you don’t need ML expertise or a data lake. The following serverless end-to-end architecture involves aggregating and transforming the required data, as well as automatically training an ML-based recommendation engine.

I will outline the architectural production-ready setup for personalized product recommendations based on historical datasets. This is of interest to data analysts who look for ways to bring an existing recommendation engine to production, as well as solutions architects new to ML.

Solution Overview

The two core elements to create a proof-of-concept for ML-based product recommendations are:

  1. the recommendation engine and,
  2. the data set to train the recommendation engine.

Let’s start with the recommendation engine first, and work backwards to the corresponding data needs.

Product recommendation engine

To create the product recommendation engine, we use Amazon Personalize. Amazon Personalize differentiates three types of input data:

  1. user events called interactions (user events like views, signups or likes),
  2. item metadata (description of your items: category, genre or availability), and
  3. user metadata (age, gender, or loyalty membership).

An interactions dataset is typically the minimal requirement to build a recommendation system. Providing user and item metadata datasets improves recommendation accuracy, and enables cold starts, item discovery and dynamic recommendation filtering.

Most companies already have existing historical datasets to populate all three input types. In the case of retail companies, the product order history is a good fit for interactions. In the case of the media and entertainment industry, the customer’s consumption history maps to the interaction dataset. The product and media catalogs map to the items dataset and the customer profiles to the user dataset.

Amazon Personalize: from datasets to a recommendation API

Amazon Personalize: from datasets to a recommendation API

The Amazon Personalize Deep Dive Series provides a great introduction into the service and explores the topics of training, inference and operations. There are also multiple blog posts available explaining how to create a recommendation engine with Amazon Personalize and how to select the right metadata for the engine training. Additionally, the Amazon Personalize samples repository in GitHub showcases a variety of topics: from getting started with Amazon Personalize, up to performing a POC in a Box using existing datasets, and, finally, automating the recommendation engine with MLOps. In this post, we focus on getting the data from the historical data sources into the structure required by Amazon Personalize.

Creating the dataset

While manual data exports are a quick way to get started with one-time datasets for experiments, we use AWS Glue to automate this process. The automated approach with AWS Glue speeds up the proof of concept (POC) phase and simplifies the process to production by:

  • easily reproducing dataset exports from various data sources. This are used to iterate with other feature sets for recommendation engine training.
  • adding additional data sources and using those to enrich existing datasets
  • efficiently performing transformation logic like column renaming and fuzzy matching out of the box with code generation support.

AWS Glue is a serverless data integration service that is scalable and simple to use. It provides all of the capabilities needed for data integration and supports a wide variety of data sources: Amazon S3 buckets, JDBC connectors, MongoDB databases, Kafka, and Amazon Redshift, the AWS data warehouse. You can even make use of data sources living outside of your AWS environment, e.g. on-premises data centers or other services outside of your VPC. This enables you to perform a data-driven POC even when the data is not yet in AWS.

Modern application environments usually combine multiple heterogeneous database systems, like operational relational and NoSQL databases, in addition to, the BI-powering data warehouses. With AWS Glue, we orchestrate the ETL (extract, transform, and load) jobs to fetch the relevant data from the corresponding data sources. We then bring it into a format that Amazon Personalize understands: CSV files with pre-defined column names hosted in an Amazon S3 bucket.

Each dataset consists of one or multiple CSV files, which can be uniquely identified by an Amazon S3 prefix. Additionally, each dataset must have an associated schema describing the structure of your data. Depending on the dataset type, there are required and pre-defined fields:

  • USER_ID (string) and one additional metadata field for the users dataset
  • ITEM_ID (string) and one additional metadata field for the items dataset
  • USER_ID (string), ITEM_ID (string), TIMESTAMP (long; as Epoch time) for the interactions dataset

The following graph presents a high-level architecture for a retail customer, who has a heterogeneous data store landscape.

Using AWS Glue to export datasets from heterogeneous data sources to Amazon S3

Using AWS Glue to export datasets from heterogeneous data sources to Amazon S3

To understand how AWS Glue connects to the variety of data sources and allows transforming the data into the required format, we need to drill down into the AWS Glue concepts and components.

One of the key components of AWS Glue is the AWS Glue Data Catalog: a persistent metadata store containing table definitions, connection information, as well as, the ETL job definitions.
The tables are metadata definitions representing the structure of the data in the defined data sources. They do not contain any data entries from the sources but solely the structure definition. You can create a table either manually or automatically by using AWS Glue Crawlers.

AWS Glue Crawlers scan the data in the data sources, extract the schema information from it, and store the metadata as tables in the AWS Glue Data Catalog. This is the preferred approach for defining tables. The crawlers use AWS Glue Connections to connect to the data sources. Each connection contains the properties that are required to connect to a particular data store. The connections will be also used later by the ETL jobs to fetch the data from the data sources.

AWS Glue Crawlers also help to overcome a challenge frequently appearing in microservice environments. Microservice architectures are frequently operated by fully independent and autonomous teams. This means that keeping track of changes to the data source format becomes a challenge. Based on a schedule, the crawlers can be triggered to update the metadata for the relevant data sources in the AWS Glue Data Catalog automatically. To detect cases when a schema change would break the ETL job logic, you can combine the CloudWatch Events emitted by AWS Glue on updating the Data Catalog tables with an AWS Lambda function or a notification send via the Amazon Simple Notification Service (SNS).

The AWS Glue ETL jobs use the defined connections and the table information from the Data Catalog to extract the data from the described sources, apply the user-defined transformation logic and write the results into a data sink. AWS Glue can automatically generate code for ETL jobs to help perform a variety of useful data transformation tasks. AWS Glue Studio makes the ETL development even simpler by providing an easy-to-use graphical interface that accelerates the development and allows designing jobs without writing any code. If required, the generated code can be fully customized.

AWS Glue supports Apache Spark jobs, written either in Python or in Scala, and Python Shell jobs. Apache Spark jobs are optimized to run in a highly scalable, distributed way dealing with any amount of data and are a perfect fit for data transformation jobs. The Python Shell jobs provide access to the raw Python execution environment, which is less scalable but provides a cost-optimized option for orchestrating AWS SDK calls.

The following diagram visualizes the interaction between the components described.

The basic concepts of populating your Data Catalog and processing ETL dataflow in AWS Glue

The basic concepts of populating your Data Catalog and processing ETL dataflow in AWS Glue

For each Amazon Personalize dataset type, we create a separate ETL job. Since those jobs are independent, they also can run in parallel. After all jobs have successfully finished, we can start the recommendation engine training. AWS Glue Workflows allow simplifying data pipelines by visualizing and monitoring complex ETL activities involving multiple crawlers, jobs, and triggers, as a single entity.

The following graph visualizes a typical dataset export workflow for training a recommendation engine, which consists of:

  • a workflow trigger being either manual or scheduled
  • a Python Shell job to remove the results of the previous export workflow from S3
  • a trigger firing when the removal job is finished and initiating the parallel execution of the dataset ETL jobs
  • the three Apache Spark ETL jobs, one per dataset type
  • a trigger firing when all three ETL jobs are finished and initiating the training notification job
  • a Python Shell job to initiate a new dataset import or a full training cycle in Amazon Personalize (e.g. by triggering the MLOps pipeline using the AWS SDK)


AWS Glue workflow for extracting the three datasets and triggering the training workflow of the recommendation engine

AWS Glue workflow for extracting the three datasets and triggering the training workflow of the recommendation engine

Combining the data export and the recommendation engine

In the previous sections, we discussed how to create an ML-based recommendation engine and how to create the datasets for the training of the engine. In this section, we combine both parts of the solution leveraging an adjusted version of the MLOps pipeline solution available on GitHub to speed up the iterations on new solution versions by avoiding manual steps. Moreover, automation means new items can be put faster into production.

The MLOps pipeline uses a JSON file hosted in an S3 bucket to describe the training parameters for Amazon Personalize. The creation of a new parameter file version triggers a new training workflow orchestrated in a serverless manner using AWS Step Functions and AWS Lambda.

To integrate the Glue data export workflow described in the previous section, we also enable the Glue workflow to trigger the training pipeline. Additionally, we manipulate the pipeline to read the parameter file as the first pipeline step. The resulting architecture enables an automated end-to-end set up from dataset export up to the recommendation engine creation.

End-to-end architecture combining the data export with AWS Glue, the MLOps training workflow and Amazon Personalize

End-to-end architecture combining the data export with AWS Glue, the MLOps training workflow, and Amazon Personalize

The architecture for the end-to-end data export and recommendation engine creation solution is completely serverless. This makes it highly scalable, reliable, easy to maintain, and cost-efficient. You pay only for what you consume. For example, in the case of the data export, you pay only for the duration of the AWS Glue crawler executions and ETL jobs. These are only need to run to iterate with a new dataset.

The solution is also flexible in terms of the connected data sources. This architecture is also recommended for use cases with a single data source. You can also start with a single data store and enrich the datasets on-demand with additional data sources in future iterations.

Testing the quality of the solution

A common approach to validate the quality of the solution is the A/B testing technique, which is widely used to measure the efficacy of generated recommendations. Based on the testing results, you can iterate on the recommendation engine by optimizing the underlying datasets and models. The high degree of automation increases the speed of iterations and the resiliency of the end-to-end process.

Conclusion

In this post, I presented a typical serverless architecture for a fully automated, end-to-end ML-based recommendation engine leveraging available historical datasets. As you begin to experiment with ML-based personalization, you will unlock value currently hidden in the data. This helps mitigate potential concerns like the lack of trust in machine learning and you can put the resulting engine into production.

Start your personalization journey today with the Amazon Personalize code samples and bring the engine to production with the architecture outlined in this blog. As a next step, you can involve recording real-time events to update the generated recommendations automatically based on the event data.


Field Notes: Applying Machine Learning to Vegetation Management using Amazon SageMaker

Post Syndicated from Sameer Goel original https://aws.amazon.com/blogs/architecture/field-notes-applying-machine-learning-to-vegetation-management-using-amazon-sagemaker/

This post was co-written by Soheil Moosavi, a data scientist consultant in Accenture Applied Intelligence (AAI) team, and Louis Lim, a manager in Accenture AWS Business Group. 

Virtually every electric customer in the US and Canada has, at one time or another, experienced a sustained electric outage as a direct result of a tree and power line contact. According to the report from Federal Energy Regulatory Commission (FERC.gov), Electric utility companies actively work to mitigate these threats.

Vegetation Management (VM) programs represent one of the largest recurring maintenance expenses for electric utility companies in North America. Utilities and regulators generally agree that keeping trees and vegetation from conflicting with overhead conductors. It is a critical and expensive responsibility of all utility companies concerned about electric service reliability.

Vegetation management such as tree trimming and removal is essential for electricity providers to reduce unwanted outages and be rated with a low System Average Interruption Duration Index (SAIDI) score. Electricity providers are increasingly interested in identifying innovative practices and technologies to mitigate outages, streamline vegetation management activities, and maintain acceptable SAIDI scores. With the recent democratization of machine learning leveraging the power of cloud, utility companies are identifying unique ways to solve complex business problems on top of AWS. The Accenture AWS Business Group, a strategic collaboration by Accenture and AWS, helps customers accelerate their pace of innovation to deliver disruptive products and services. Learning how to machine learn helps enterprises innovate and disrupt unlocking business value.

In this blog post, you learn how Accenture and AWS collaborated to develop a machine learning solution for an electricity provider using Amazon SageMaker.  The goal was to improve vegetation management and optimize program cost.

Overview of solution 

VM is generally performed on a cyclical basis, prioritizing circuits solely based on the number of outages in the previous years. A more sophisticated approach is to use Light Detection and Ranging (LIDAR) and imagery from aircraft and low earth orbit (LEO) satellites with Machine Learning  models, to determine where VM is needed. This provides the information for precise VM plans, but is more expensive due to cost to acquire the LIDAR and imagery data.

In this blog, we show how a machine learning (ML) solution can prioritize circuits based on the impacts of tree-related outages on the coming year’s SAIDI without using imagery data.

We demonstrate how to implement a solution that cross-references, cleans, and transforms time series data from multiple resources. This then creates features and models that predict the number of outages in the coming year, and sorts and prioritizes circuits based on their impact on the coming year’s SAIDI. We show how you use an interactive dashboard designed to browse circuits and the impact of performing VM on SAIDI reduction based on your budget.

Walkthrough

  • Source data is first transferred into an Amazon Simple Storage Service (Amazon S3) bucket from the client’s data center.
  • Next, AWS Glue Crawlers are used to crawl the data from the  source bucket. Glue Jobs were used to cross-reference data files to create features for modeling and data for the dashboards.
  • We used Jupyter Notebooks on Amazon SageMaker to train and evaluate models. The best performing model was saved as a pickle file on Amazon S3 and Glue was used to add the predicted number of outages for each circuit to the data prepared for the dashboards.
  • Lastly, Operations users were granted access to Amazon QuickSight dashboards, sourced data from Athena, to browse the data and graphs, while VM users were additionally granted access to directly edit the data prepared for dashboards, such as the latest VM cost for each circuit.
  • We used Amazon QuickSight to create interactive dashboards for the VM team members to visualize analytics and predictions. These predictions are a list of circuits prioritized based on their impact on SAIDI in the coming year. The solution allows our team to analyze the data and experiment with different models in a rapid cycle.

Modeling

We were provided with 6 years worth of data across 127 circuits. Data included VM (VM work start and end date, number of trees trimmed and removed, costs), asset (pole count, height, and materials, wire count, length, and materials, and meter count and voltage), terrain (elevation, landcover, flooding frequency, wind erodibility, soil erodibility, slope, soil water absorption, and soil loss tolerance from GIS ESRI layers), and outages (outage coordinated, dates, duration, total customer minutes, total customers affected). In addition, we collected weather data from NOAA and DarkSky datasets, including wind, gust, precipitation, temperature.

Starting with 762 records (6 years * 127 circuits) and 226 features, we performed a series of data cleaning and feature engineering tasks including:

  • Dropped sparse, non-variant, and non-relevant features
  • Capped selected outliers based on features’ distributions and percentiles
  • Normalized imbalanced features
  • Imputed missing values
    • Used “0” where missing value meant zero (for example, number of trees removed)
    • Used 3650 (equivalent to 10 years) where missing values are days for VM work (for example, days since previous tree trimming job)
    • Used average of values for each circuit when applicable, and average of values across all circuits for circuits with no existing values (for example, pole mean height)
  • Merged conceptually relevant features
  • Created new features such as ratios (for example, tree trim cost per trim) and combinations(for example, % of land cover for low and medium intensity areas combined)

After further dropping highly correlated features to remove multi-collinearity for our models, we were left with 72 features for model development. The following diagram shows a high-level overview data partitioning and number of outages prediction.

Our best performing model out of Gradient Boosting Trees, Random Forest, and Feed Forward Neural Networks was Elastic Net, with Mean Absolute Error of 6.02 when using a combination of only 10 features. Elastic Net is appropriate for smaller sample for this dataset, good at feature selection, likely to generalize on a new dataset, and consistently showed a lower error rate. Exponential expansion of features showed small improvements in predictions, but we kept the non-expanded version due to better interpretability.

When analyzing the model performance, predictions were more accurate for circuits with lower outage count, and models suffered from under-predicting when the number of outages was high. This is due to having few circuits with a high number of outages for the model to learn from.

The following chart below shows the importance of each feature used in the model. An error of 6.02 means on average we over or under predict six outages for each circuit.

Dashboard

We designed two types of interactive dashboards for the VM team to browse results and predictions. The first set of dashboards show historical or predicted outage counts for each circuit on a geospatial map. Users can further filter circuits based on criteria such as the number of days since VM, as shown in the following screenshot.

The second type of dashboard shows predicted post-VM SAIDI on the y-axis and VM cost on the x-axis. This dashboard is used by the client to determine the reduction in SAIDI based on available VM budget for the year and dispatch the VM crew accordingly. Clients can also upload a list of update VM cost for each circuit, and the graph will automatically readjust.

Conclusion

This solution for Vegetation management demonstrates how we used Amazon SageMaker to train and evaluate machine learning models. Using this solution an Electric Utility can save time and cost, and scale easily to include more circuits within a set VM budget. We demonstrated how a utility can leverage machine learning to predict unwanted outages and also maintain vegetation, without incurring the cost of high-resolution imagery.

Further, to improve these predictions we recommend:

  1. A yearly collection of asset and terrain data (if data is only available for the most recent year, it is impossible for models to learn from each years’ changes),
  2. Collection of VM data per month per location (if current data is collected only at the end of each VM cycle and only per circuit, monthly, and subcircuit modeling is impossible), and
  3. Purchasing LiDAR imagery or tree inventory data to include features such as tree density, height, distance to wires, and more.

Accelerating Innovation with the Accenture AWS Business Group (AABG)

By working with the Accenture AWS Business Group (AABG), you can learn from the resources, technical expertise, and industry knowledge of two leading innovators, helping you accelerate the pace of innovation to deliver disruptive products and services. The AABG helps customers ideate and innovate cloud solutions with customers through rapid prototype development.

Connect with our team at [email protected] to learn and accelerate how to use machine learning in your products and services.


Field Notes provides hands-on technical guidance from AWS Solutions Architects, consultants, and technical account managers, based on their experiences in the field solving real-world business problems for customers.
Soheil

Soheil Moosavi

Soheil Moosavi is a data scientist consultant and part of Accenture Applied Intelligence (AAI) team. He comes with vast experience in Machine Learning and architecting analytical solutions to solve and improve business problems.

Soheil

Soheil Moosavi

Louis Lim is a manager in Accenture AWS Business Group, his team focus on helping enterprises to explore the art of possible through rapid prototyping and cloud-native solution.


Field Notes: Comparing Algorithm Performance Using MLOps and the AWS Cloud Development Kit

Post Syndicated from Moataz Gaber original https://aws.amazon.com/blogs/architecture/field-notes-comparing-algorithm-performance-using-mlops-and-the-aws-cloud-development-kit/

Comparing machine learning algorithm performance is fundamental for machine learning practitioners, and data scientists. The goal is to evaluate the appropriate algorithm to implement for a known business problem.

Machine learning performance is often correlated to the usefulness of the model deployed. Improving the performance of the model typically results in an increased accuracy of the prediction. Model accuracy is a key performance indicator (KPI) for businesses when evaluating production readiness and identifying the appropriate algorithm to select earlier in model development. Organizations benefit from reduced project expenses, accelerated project timelines and improved customer experience. Nevertheless, some organizations have not introduced a model comparison process into their workflow which negatively impacts cost and productivity.

In this blog post, I describe how you can compare machine learning algorithms using Machine Learning Operations (MLOps). You will learn how to create an MLOps pipeline for comparing machine learning algorithms performance using AWS Step Functions, AWS Cloud Development Kit (CDK) and Amazon SageMaker.

First, I explain the use case that will be addressed through this post. Then, I explain the design considerations for the solution. Finally, I provide access to a GitHub repository which includes all the necessary steps for you to replicate the solution I have described, in your own AWS account.

Understanding the Use Case

Machine learning has many potential uses and quite often the same use case is being addressed by different machine learning algorithms. Let’s take Amazon Sagemaker built-in algorithms. As an example, if you are having a “Regression” use case, it can be addressed using (Linear Learner, XGBoost and KNN) algorithms. Another example for a “Classification” use case you can use algorithm such as (XGBoost, KNN, Factorization Machines and Linear Learner). Similarly for “Anomaly Detection” there are (Random Cut Forests and IP Insights).

In this post, it is a “Regression” use case to identify the age of the abalone which can be calculated based on the number of rings on its shell (age equals to number of rings plus 1.5). Usually the number of rings are counted through microscopes examinations.

I use the abalone dataset in libsvm format which contains 9 fields [‘Rings’, ‘Sex’, ‘Length’,’ Diameter’, ‘Height’,’ Whole Weight’,’ Shucked Weight’,’ Viscera Weight’ and ‘Shell Weight’] respectively.

The features starting from Sex to Shell Weight are physical measurements that can be measured using the correct tools. Therefore, using the machine learning algorithms (Linear Learner and XGBoost) to address this use case, the complexity of having to examine the abalone under microscopes to understand its age can be improved.

Benefits of the AWS Cloud Development Kit (AWS CDK)

The AWS Cloud Development Kit (AWS CDK) is an open source software development framework to define your cloud application resources.

The AWS CDK uses the jsii which is an interface developed by AWS that allows code in any language to naturally interact with JavaScript classes. It is the technology that enables the AWS Cloud Development Kit to deliver polyglot libraries from a single codebase.

This means that you can use the CDK and define your cloud application resources in typescript language for example. Then by compiling your source module using jsii, you can package it as modules in one of the supported target languages (e.g: Javascript, python, Java and .Net). So if your developers or customers prefer any of those languages, you can easily package and export the code to their preferred choice.

Also, the cdk tf provides constructs for defining Terraform HCL state files and the cdk8s enables you to use constructs for defining kubernetes configuration in TypeScript, Python, and Java. So by using the CDK you have a faster development process and easier cloud onboarding. It makes your cloud resources more flexible for sharing.

Prerequisites

Overview of solution

This architecture serves as an example of how you can build a MLOps pipeline that orchestrates the comparison of results between the predictions of two algorithms.

The solution uses a completely serverless environment so you don’t have to worry about managing the infrastructure. It also deletes resources not needed after collecting the predictions results, so as not to incur any additional costs.

Figure 1: Solution Architecture

Walkthrough

In the preceding diagram, the serverless MLOps pipeline is deployed using AWS Step Functions workflow. The architecture contains the following steps:

  1. The dataset is uploaded to the Amazon S3 cloud storage under the /Inputs directory (prefix).
  2. The uploaded file triggers AWS Lambda using an Amazon S3 notification event.
  3. The Lambda function then will initiate the MLOps pipeline built using a Step Functions state machine.
  4. The starting lambda will start by collecting the region corresponding training images URIs for both Linear Learner and XGBoost algorithms. These are used in training both algorithms over the dataset. It will also get the Amazon SageMaker Spark Container Image which is used for running the SageMaker processing Job.
  5. The dataset is in libsvm format which is accepted by the XGBoost algorithm as per the Input/Output Interface for the XGBoost Algorithm. However, this is not supported by the Linear Learner Algorithm as per Input/Output interface for the linear learner algorithm. So we need to run a processing job using Amazon SageMaker Data Processing with Apache Spark. The processing job will transform the data from libsvm to csv and will divide the dataset into train, validation and test datasets. The output of the processing job will be stored under /Xgboost and /Linear directories (prefixes).

Figure 2: Train, validation and test samples extracted from dataset

6. Then the workflow of Step Functions will perform the following steps in parallel:

    • Train both algorithms.
    • Create models out of trained algorithms.
    • Create endpoints configurations and deploy predictions endpoints for both models.
    • Invoke lambda function to describe the status of the deployed endpoints and wait until the endpoints become in “InService”.
    • Invoke lambda function to perform 3 live predictions using boto3 and the “test” samples taken from the dataset to calculate the average accuracy of each model.
    • Invoke lambda function to delete deployed endpoints not to incur any additional charges.

7. Finally, a Lambda function will be invoked to determine which model has better accuracy in predicting the values.

The following shows a diagram of the workflow of the Step Functions:

Figure 3: AWS Step Functions workflow graph

The code to provision this solution along with step by step instructions can be found at this GitHub repo.

Results and Next Steps

After waiting for the complete execution of step functions workflow, the results are depicted in the following diagram:

Figure 4: Comparison results

This doesn’t necessarily mean that the XGBoost algorithm will always be the better performing algorithm. It just means that the performance was the result of these factors:

  • the hyperparameters configured for each algorithm
  • the number of epochs performed
  • the amount of dataset samples used for training

To make sure that you are getting better results from the models, you can run hyperparameters tuning jobs which will run many training jobs on your dataset using the algorithms and ranges of hyperparameters that you specify. This helps you allocate which set of hyperparameters which are giving better results.

Finally, you can use this comparison to determine which algorithm is best suited for your production environment. Then you can configure your step functions workflow to update the configuration of the production endpoint with the better performing algorithm.

Figure 5: Update production endpoint workflow

Conclusion

This post showed you how to create a repeatable, automated pipeline to deliver the better performing algorithm to your production predictions endpoint. This helps increase the productivity and reduce the time of manual comparison.  You also learned to provision the solution using AWS CDK and to perform regular cleaning of deployed resources to drive down business costs. If this post helps you or inspires you to solve a problem, share your thoughts and questions in the comments. You can use and extend the code on the GitHub repo.

Field Notes provides hands-on technical guidance from AWS Solutions Architects, consultants, and technical account managers, based on their experiences in the field solving real-world business problems for customers