Tag Archives: AWS Compute Optimizer

AWS Week in Review – AWS Notifications, Serverless event, and More – May 8, 2023

Post Syndicated from Marcia Villalba original https://aws.amazon.com/blogs/aws/aws-week-in-review-aws-notifications-serverless-event-and-more-may-8-2023/

At the end of this week, I’m flying to Seattle to take part in the AWS Serverless Innovation Day. Along with many customers and colleagues from AWS, we are going to be live on May 17 at a virtual free event. During the AWS Serverless Innovation Day we will share best practices related to building event-driven applications and using serverless functions and containers. Get a calendar reminder and check the full agenda at the event site.

Serverless innovation day

Last Week’s Launches
Here are some launches that got my attention during the previous week.

New Local Zones in Auckland – AWS Local Zones allow you to deliver applications that require single-digit millisecond latency or local data processing. Starting last week, AWS Local Zones is available in Auckland, New Zealand.

All AWS Local Zones

AWS Notifications Channy wrote an article explaining how you can view and configure notifications for your AWS account. In addition to the AWS Management Console notifications, the AWS Console Mobile Application now allows you to create and receive actionable push notifications when a resource requires your attention.

AWS SimSpace Weaver Last reInvent, we launched AWS SimSpace Weaver, a fully managed compute service that helps you deploy large spatial simulations in the cloud. Starting last week, AWS SimSpace Weaver allows you to save the state of the simulations at a specific point in time.

AWS Security Hub Added four new integration partners to help customers with their cloud security posture monitoring, and now it provides detailed tracking of finding changes with the finding history feature. This last feature provides an immutable trail of changes to get more visibility into the changes made to your findings.

AWS Compute Optimizer – AWS Compute Optimizer supports inferred workload type filtering on Amazon EC2 instance recommendations and automatically detects the applications that might run on your AWS resources. Now AWS Compute Optimizer supports filtering your rightsizing recommendation by tags and identifies and filters Microsoft SQL Server workloads as an inferred workload type.

AWS AppSyncNow AWS AppSync GraphQL APIs support Private API. With Private APIs, you can now create GraphQL APIs that can only be accessed from your Amazon Virtual Private Cloud (Amazon VPC).

For a full list of AWS announcements, be sure to keep an eye on the What’s New at AWS page.

Other AWS News
Some other updates and news that you may have missed:

  • Responsible AI in the Generative EraAmazon Science published a very interesting blog post this week about the special challenges raised by building a responsible generative AI and the different things builders of applications can do in order to solve these challenges.
  • Patterns for Building an API to Upload Files to Amazon S3 – Amazon S3 is one of the most used services by our customers, and applications often require a way for users to upload files. In this article, Thomas Moore shows different ways to do this in a secure way.
  • The Official AWS Podcast – Listen each week for updates on the latest AWS news and deep dives into exciting use cases. There are also official AWS podcasts in your local languages. Check out the ones in FrenchGermanItalian, and Spanish.
  • AWS Open-Source News and Updates – This is a newsletter curated by my colleague Ricardo to bring you the latest open-source projects, posts, events, and more.

Upcoming AWS Events
Check your calendars and sign up for these AWS events:

  • AWS Serverless Innovation DayJoin us on May 17 for a virtual and free event about AWS Serverless. We will have talks and fireside chats with customers related to AWS Lambda, Amazon ECS with Fargate, AWS Step Functions, and Amazon EventBridge.
  • AWS re:Inforce 2023You can now register for AWS re:Inforce, happening in Anaheim, California, on June 13–14.
  • AWS Global Summits – There are many summits going on right now around the world: Stockholm (May 11), Hong Kong (May 23), India (May 25), Amsterdam (June 1), London (June 7), Washington, DC (June 7–8), Toronto (June 14), Madrid (June 15), and Milano (June 22).
  • AWS Community Day – Join a community-led conference run by AWS user group leaders in your region: Warsaw (June 1), Chicago (June 15), Manila (June 29–30), and Munich (September 14).
  • AWS User Group Peru Conference – The local AWS User Group announced a one-day cloud event in Spanish and English in Lima on September 23. Seb, Jeff, and I will be attending the event from the AWS News blog team. Register today!

That’s all for this week. Check back next Monday for another Week in Review!

— Marcia

This post is part of our Week in Review series. Check back each week for a quick roundup of interesting news and announcements from AWS!

AWS Week in Review – October 3, 2022

Post Syndicated from Danilo Poccia original https://aws.amazon.com/blogs/aws/aws-week-in-review-october-3-2022/

This post is part of our Week in Review series. Check back each week for a quick roundup of interesting news and announcements from AWS!

A new week and a new month just started. Curious which were the most significant AWS news from the previous seven days? I got you covered with this post.

Last Week’s Launches
Here are the launches that got my attention last week:

Amazon File Cache – A high performance cache on AWS that accelerates and simplifies demanding cloud bursting and hybrid workflows by giving access to files using a fast and familiar POSIX interface, no matter if the original files live on premises on any file system that can be accessed through NFS v3 or on S3.

Amazon Data Lifecycle Manager – You can now automatically archive Amazon EBS snapshots to save up to 75 percent on storage costs for those EBS snapshots that you intend to retain for more than 90 days and rarely access.

AWS App Runner – You can now build and run web applications and APIs from source code using the new Node.js 16 managed runtime.

AWS Copilot – The CLI for containerized apps adds IAM permission boundaries, support for FIFO SNS/SQS for the Copilot worker-service pattern, and using Amazon CloudFront for low-latency content delivery and fast TLS-termination for public load-balanced web services.

Bottlerocket – The Linux-based operating system purpose-built to run container workloads is now supported by Amazon Inspector. Amazon Inspector can now recommend an update of Bottlerocket if it finds a vulnerability.

Amazon SageMaker Canvas – Now supports mathematical functions and operators for richer data exploration and to understand the relationships between variables in your data.

AWS Compute Optimizer – Now provides cost and performance optimization recommendations for 37 new EC2 instance types, including bare metal instances (m6g.metal) and compute optimized instances (c7g.2xlarge, hpc6a.48xlarge), and new memory metrics for Windows instances.

AWS Budgets – Use a simplified 1-click workflow for common budgeting scenarios with step-by-step tutorials on how to use each template.

Amazon Connect – Now provides an updated flow designer UI that makes it easier and faster to build personalized and automated end-customer experiences, as well as a queue dashboard to view and compare real-time queue performance through time series graphs.

Amazon WorkSpaces – You can now provision Ubuntu desktops and use virtual desktops for new categories of workloads, such as for your developers, engineers, and data scientists.

Amazon WorkSpaces Core – A fully managed infrastructure-only solution for third-party Virtual Desktop Infrastructure (VDI) management software that simplifies VDI migration and combines your current VDI software with the security and reliability of AWS. Read more about it in this Desktop and Application Streaming blog post.

For a full list of AWS announcements, be sure to keep an eye on the What’s New at AWS page.

Other AWS News
A few more blog posts you might have missed:

Introducing new language extensions in AWS CloudFormation – In this Cloud Operations & Migrations blog post, we introduce the new language transform that enhances CloudFormation core language with intrinsic functions that simplify handling JSON strings (Fn::ToJsonString), array lengths (Fn::Length), and update and deletion policies.

Building a GraphQL API with Java and AWS Lambda – This blog shows different options for resolving GraphQL queries using serverless technologies on AWS.

For AWS open-source news and updates, here’s the latest newsletter curated by Ricardo to bring you the most recent updates on open-source projects, posts, events, and more.

Upcoming AWS Events
As usual, there are many opportunities to meet:

AWS Summits– Connect, collaborate, and learn about AWS at these free in-person events: Bogotá (October 4), and Singapore (October 6).

AWS Community DaysAWS Community Day events are community-led conferences to share and learn together. Join us in Amersfoort, Netherlands (on October 3, today), Warsaw, Poland (October 14), and Dresden, Germany (October 19).

That’s all from me for this week. Come back next Monday for another Week in Review!

Danilo

Journey to Cloud-Native Architecture Series #6: Improve cost visibility and re-architect for cost optimization

Post Syndicated from Anuj Gupta original https://aws.amazon.com/blogs/architecture/journey-to-cloud-native-architecture-series-6-improve-cost-visibility-and-re-architect-for-cost-optimization/

After we improved our security posture in the 5th blog of the series, we discovered that operational costs are growing disproportionately higher than revenue. This is because the number of users grew more than 10 times on our e-commerce platform.

To address this, we created a plan to better understand our AWS spend and identify cost savings. In this post, Part 6, we’ll show you how we improved cost visibility, rearchitected for cost optimization, and applied cost control measures to encourage innovation while ensuring improved return on investment.

Identifying areas to improve costs with Cost Explorer

Using AWS Cost Explorer, we identified the following areas for improvement:

  • Improve cost visibility and establish FinOps culture:
    • Provide visibility and cost insights for untagged resources
    • Provide cost visibility into shared AWS resources
    • Better understand gross margin
  • Use Service Control Policies (SCPs) for cost control
  • Optimize costs for data transfer
  • Reduce storage costs:
  • Optimize compute costs:
    • Adjust idle resources and under-utilized resources
    • Migrate to latest generation Graviton2 instances

The following sections provide more information on the methods we used to improve these areas.

Improve cost visibility and establish FinOps culture

Provide visibility and cost insights for untagged resources

To improve our organization’s FinOps culture and help teams better understand their costs, we needed a tool to provide visibility into untagged resources and enable engineering teams to take actions on cost optimization.

We used CloudZero to automate the categorization of our spend across all AWS accounts and provide our teams the ability to see cost insights. It imports metadata from AWS resources along with AWS tags, which makes it easier to allocate cost to different categories.

Provide cost visibility into shared AWS resources

We created Dimensions such as Development, Test, and Production in CloudZero to easily group cost by environment. We also defined rules in CostFormation to help us understand the cost of running a new feature by splitting cost using rules.

Understand gross margin

To better understand how our AWS bills going up is related to delivering more value for our customers, we used the guidance in Unit Metric – The Touchstone of your IT Planning and Evaluation to identify a demand driver (in our case, number of orders). By evaluating the number of orders against AWS spend, we gained valuable insights into cost KPIs, such as cost per order, which helped us better understand gross margin for our business.

Use Service Control Policies for cost control

Following the guidance in the Control developer account costs with AWS budgets blog post, we applied SCPs to control costs and control which AWS services, resources, and individual API actions users and roles in each member account of an OU can access.

As shown in Figure 1, we applied the following cost control SCPs:

  • SCP-3 on Sandbox OU prevents modification of billing settings and limits the allowable EC2 instance types to only general purpose instances up to 4xl.
  • SCP-2 on Workload SDLC OU denies access to EC2 instances larger than 4xl. AWS Budgets sends alerts to a Slack channel when spend reaches beyond a defined threshold.
  • SCP-1 on Workload PROD OU denies access to any operations outside of the specified AWS Regions and prevents member accounts from leaving the organization.
Figure 1. Applying SCPs on different environments for cost control

Figure 1. Applying SCPs on different environments for cost control

Optimize costs for data transfer

Data transfer represented one major category of overall AWS cost in our Cost Explorer report, so we used CloudZero’s Networking Sub-category Dimension to get insights into AWS outbound, Intra-Region (Availability Zone (AZ) to AZ), NAT gateway, and S3 outbound costs.

To get more insights, we also set up a temporary Data Transfer dashboard with Amazon QuickSight using the guidance in the AWS Well-Architected Cost Optimization lab. It showed us PublicIP charges for applications, NAT gateway charges for traffic between Amazon EC2 and Amazon S3 within the same Region, inter-AZ data transfer for Development and Test environments, and cross AZ data transfer for NAT gateway.

Figure 2 shows how we used Amazon S3 Gateway endpoints (continuous line) instead of an S3 public endpoint (dotted line) to reduce NAT gateway charges. For our Development and Test environments, we created application-database partitions to reduce inter-AZ data transfer.

Data transfer charges across AZs and AWS services

Figure 2. Data transfer charges across AZs and AWS services

Reduce storage costs

Update objects to use cost appropriate S3 storage class

In our review of the Cost Explorer report, we noticed that all objects were stored using the Standard storage class in Amazon S3. To update this, we used guidance from the Amazon S3 cost optimization for predictable and dynamic access patterns blog post to identify predictable data access patterns using Amazon S3 Storage Lens.

The number of GET requests, download bytes, and retrieval rate for Amazon S3 prefixes informed us how often datasets are accessed over a period of time and when a dataset is infrequently accessed. 40% of our objects on Amazon S3 have a dynamic data access pattern. Storing this data in S3 Standard-Infrequent Access could lead to unnecessary retrieval fees, so we transitioned dynamic data access pattern objects to Amazon S3 Intelligent-Tiering and updated applications to select S3 Intelligent-Tier when uploading such objects. For infrequently accessed objects, we created Amazon S3 lifecycle policies to automatically transition objects to Amazon S3 Standard-Infrequent Access, Amazon S3 One Zone-Infrequent Access, and/or Amazon S3 Glacier storage classes.

Adopt Amazon EBS gp3

Using guidance from a re:Invent talk on Optimizing resource efficiency with AWS Compute Optimizer, we identified EBS volumes that were over-provisioned by more than 30%. AWS Compute Optimizer automatically analyzed utilization patterns and metrics such as VolumeReadBytes VolumeWriteBytes, VolumeReadOps, and VolumeWriteOps for all EBS volumes in our AWS account to provide recommendations on migrating from gp2 to gp3 volumes.

The migrate your Amazon EBS volumes from gp2 to gp3 blog post helped us identify baseline throughput and IOPS requirements for our workload, calculate cost savings using the cost savings calculator, and provided steps to migrate to gp3.

Optimize compute costs

Adjust idle resources and under-utilized resources

Deploying Instance Scheduler on AWS helped us further cost optimize Amazon EC2 and Amazon Relational Database Service (Amazon RDS) resources in Development, Test, and Pre-production environments. This way, we only pay for the 40-60 hours per week instead of the full 168 hours in a week, providing 64-76% cost savings.

Migrate to latest generation Graviton2 instances

As user traffic grew, application throughput requirements changed significantly, which led to more compute cost. We migrated to the newest generation of Graviton2 instances with similar memory and CPU, achieving higher performance for reduced cost. We updated Amazon RDS on Graviton 2Amazon ElasticCache to Graviton2, and Amazon OpenSearch on Graviton2 for low-effort cost savings. The following table shows the comparison in cost after we migrated to Graviton instances.

Service Previous Instance Cost for on-demand (per hour) in us-east-1 New Instance Cost for on-demand (per hour) in us-east-1 Cost Savings
Amazon RDS (PostgreSQL) r5.4xlarge 1.008 r6g.4xlarge 0.8064 20.00%
Amazon ElasticCache cache.r5.2xlarge 0.862 cache.r6g.xlarge 0.411 52.32%
Amazon OpenSearch (data nodes) r5.xlarge.search 0.372 r6g.xlarge.search 0.335 9.95%

After that, we tested our Java-based applications to run on an arm64 processor using the guidance on the Graviton GitHub and AWS Graviton2 for Independent Software Vendors whitepaper. We conducted functional and non-functional tests on the application to ensure that it provides the same experience for users with improved performance.

Load testing for cost optimization

We included load testing in CI/CD pipeline to avoid over-provisioning and to identify resource bottlenecks before our application goes into production. To do this, we used Serverless Artillery workshop to set up a load testing environment in a separate AWS account. As a part of that load testing, we were able to simulate production traffic at required scale with much reduced cost than using EC2 instances.

Conclusion

In this blog post, we discussed how observations in Cost Explorer helped us identify improvements for cost management and optimization. We talked about how you get better cost visibility using CloudZero and apply cost control measures using SCPs. We also talked about how you can save data transfer cost, storage cost and compute cost with low effort.

Other blogs in this series

AWS Compute Optimizer supports AWS Graviton migration guidance

Post Syndicated from Pranaya Anshu original https://aws.amazon.com/blogs/compute/aws-compute-optimizer-supports-aws-graviton-migration-guidance/

This post is written by Letian Feng, Principal Product Manager for AWS Compute Optimizer, and Steve Cole, Senior EC2 Spot Specialist Solutions Architect.

Today, AWS Compute Optimizer is launching a new capability that makes it easier for you to optimize your EC2 instances by leveraging multiple CPU architectures, including x86-based and AWS Graviton-based instances. Compute Optimizer is an opt-in service that recommends optimal AWS resources for your workloads to reduce costs and improve performance by analyzing historical utilization metrics. AWS Graviton processors are custom-built by Amazon Web Services using 64-bit Arm cores to deliver the best price performance for your cloud workloads running in Amazon EC2, with the potential to realize up to 40% better price performance over comparable current generation x86-based instances. As a result, customers interested in Graviton have been asking for a scalable way to understand which EC2 instances they should prioritize in their Graviton migration journey. Starting today, you can use Compute Optimizer to find the workloads that will deliver the biggest return for the smallest migration effort.

How it works

Compute Optimizer helps you find the workloads with the biggest return for the smallest migration effort by providing a migration effort rating. The migration effort rating, ranging from very low to high, reflects the level of effort that might be required to migrate from the current instance type to the recommended instance type, based on the differences in instance architecture and whether the workloads are compatible with the recommended instance type.

Clues about the type of workload running are useful for estimating the migration effort to Graviton. For some workloads, transitioning to Graviton is as simple as updating the instance types and associated Amazon Machine Images (AMIs) directly or in various launch or CloudFormation templates. For other workloads, you might need to use different software versions or change source codes. The quickest and easiest workloads to transition are Linux-based open-source applications. Many open source projects already support Arm64, and by extension Graviton. Therefore, many customers start their Graviton migration journey by checking whether their workloads are among the list of Graviton-compatible applications. They then combine this information with estimated savings from Compute Optimizer to build a list of Graviton migration opportunities.

Because Compute Optimizer cannot see into an instance, it looks to instance attributes for clues about the workload type running on the EC2 instance. The clues Compute Optimizer uses are based on the instance attributes customers provide, such as instance tags, AWS Marketplace product names, AMI names, and CloudFormation templates names. For example, when an instance is tagged with “key:application-type” and “value:hadoop”, Compute Optimizer will identify the application –Apache Hadoop in this example. Then, because we know that major frameworks, such as Apache Hadoop, Apache Spark, and many others, run on Graviton, Compute Optimizer will indicate that there is low migration effort to Graviton, and point customers to documentation that outlines the required steps for migrating a Hadoop application to Graviton.

As another example, when Compute Optimizer sees an instance is using a Microsoft Windows SQL Server AMI, Compute Optimizer will infer that SQL Server is running. Then, because it takes a lot of effort to modernize and migrate a SQL Server workload to Arm, Compute Optimizer will indicate that there is a high migration effort to Graviton. The most effective way to give Compute Optimizer clues about what application is running is by putting an “application-type” tag onto each instance. If Compute Optimizer doesn’t have enough clues, it will indicate that it doesn’t have enough information to offer migration guidance.

The following shows the different levels of migration effort:

  • Very Low – The recommended instance type has the same CPU architecture as the current instance type. Often, customers can just modify instance types directly, or do a simple re-deployment onto the new instance type. So, this is just an optimization, not a migration.
  • Low – The recommended instance type has different CPU architecture from the current instance type, but there’s a low-effort migration path. For example, migrating Apache Hadoop or Redis from x86 to Graviton falls under this category as both Hadoop and Redis have Graviton-compatible versions.
  • Medium – The recommended instance type has different CPU architecture from the current instance type, but Compute Optimizer doesn’t have enough information to offer migration guidance.
  • High – The recommended instance type has different CPU architecture from the current instance type, and the workload has no known compatible version on the recommended CPU architecture. Therefore, customers may need to re-compile their applications or re-platform their workloads (like moving from SQL Server to MySQL).

More and more applications support Graviton every day. If you’re running an application that you know has low migration effort, but Compute Optimizer isn’t yet aware, please tell us! Shoot us an email at [email protected] with the application type, and we’ll update our migration guidance mappings as quickly as we can. You can also put an “application-type” tag on your instances so that Compute Optimizer can infer your application type with high confidence.

Customers who have already opted into Compute Optimizer recommendations will have immediate access to this new capability. Customers who haven’t can opt-in with a single console click or API, enabling all Compute Optimizer features.

Walk through

Now, let’s take a look at how to get started with Graviton recommendation on Compute Optimizer. When you open the Compute Optimizer console, you will see the dashboard page that provides you with a summary of all optimization opportunities in your account. Graviton recommendation is available for EC2 instances and Auto Scaling groups.

Screenshot of Compute Optimizer dashboard page, which shows the number of EC2 instance and Auto Scaling group recommendations by findings in your AWS account.

After you click on View recommendations for EC2 instances, you will come to the EC2 recommendation list view. Here is where you can see a list of your EC2 instances, their current instance type, our finding (over-provisioned, under-provisioned, or optimized), the recommended optimal instance type, and the estimated savings if there is a downsizing opportunity. By default, we will show you the best-fit instance type for the price regardless of CPU architecture. In many cases this means that Graviton will be recommended because EC2 offers a wide selection of Graviton instances with comparatively high price/performance ratio. If you’d like to only look at recommendations with your current architecture, you can use the CPU architecture preference dropdown to tell Compute Optimizer to show recommendations with only the current CPU architecture.

Compute Optimizer EC2 Recommendation List Page. Here you can select both current and Graviton as the preferred CPU architectures. The recommendation list contains two new columns -- migration effort, and inferred workload types.

Here you can see two new columns — Migration effort and Inferred workload types. The Inferred workload types field shows the type of workload Compute Optimizer has inferred your instance is running. The Migration effort field shows how much effort you might need to spend if you migrate from your current instance type to recommended instance type based on the inferred workload type. When there is no change in CPU architecture (i.e. moving from an x86-instance type to another x86-instance type, like in the third row), the migration effort will be Very low. For x86-instances that are running Graviton-compatible applications, such as Apache Hadoop, NGINX, Memcached, etc., when you migrate the instance to Graviton, the effort will be Low. If Compute Optimizer cannot identify the applications, the migration effort from x86 to Graviton will be Medium, and you can provide application type data by putting an application-type tag key onto the instance. You can click on each row to see more detailed recommendation. Let’s click on the first row.

Compute Optimizer EC2 Recommendation Detail Page. The current instance type is r5.large. Recommended option 1 is r6g.large, with low migration effort. Recommended option 2 is t4g.xlarge, with low migration effort. Recommended option 3 is m6g.xlarge, with low migration effort.

Compute Optimizer identifies this instance to be running Apache Hadoop workloads because there’s Amazon EMR system tag associated with it. It shows a banner that details why Compute Optimizer considers this as a low-effort Graviton migration candidate, and offers a migration guide when you click on Learn more.

Github screenshot of AWS Graviton migration guide. The migration guide details steps to transition workloads from x86-based instances to Graviton-based instances.

The same Graviton recommendation can also be retrieved through Compute Optimizer API or CLI. Here’s a sample CLI that retrieves the same recommendation as discussed above:

aws compute-optimizer get-ec2-instance-recommendations --instance-arns arn:aws:ec2:us-west-2:020796573343:instance/i-0b5ec1bb9daabf0f3 --recommendation-preferences "{\"cpuVendorArchitectures\": [\"CURRENT\" , \"AWS_ARM64\"]}"
{
    "instanceRecommendations": [
        {
            "instanceArn": "arn:aws:ec2:us-west-2:000000000000:instance/i-0b5ec1bb9daabf0f3",
            "accountId": "000000000000",
            "instanceName": "Compute Intensive",
            "currentInstanceType": "r5.large",
            "finding": "UNDER_PROVISIONED",
            "findingReasonCodes": [
                "CPUUnderprovisioned",
                "EBSIOPSOverprovisioned"
            ],
            "inferredWorkloadTypes": [
                "ApacheHadoop"
            ],
            "utilizationMetrics": [
                {
                    "name": "CPU",
                    "statistic": "MAXIMUM",
                    "value": 100.0
                },
                {
                    "name": "EBS_READ_OPS_PER_SECOND",
                    "statistic": "MAXIMUM",
                    "value": 0.0
                },
                {
                    "name": "EBS_WRITE_OPS_PER_SECOND",
                    "statistic": "MAXIMUM",
                    "value": 4.943333333333333
                },
                {
                    "name": "EBS_READ_BYTES_PER_SECOND",
                    "statistic": "MAXIMUM",
                    "value": 0.0
                },
                {
                    "name": "EBS_WRITE_BYTES_PER_SECOND",
                    "statistic": "MAXIMUM",
                    "value": 880541.9921875
                },
                {
                    "name": "NETWORK_IN_BYTES_PER_SECOND",
                    "statistic": "MAXIMUM",
                    "value": 18113.96638888889
                },
                {
                    "name": "NETWORK_OUT_BYTES_PER_SECOND",
                    "statistic": "MAXIMUM",
                    "value": 90.37638888888888
                },
                {
                    "name": "NETWORK_PACKETS_IN_PER_SECOND",
                    "statistic": "MAXIMUM",
                    "value": 2.484055555555556
                },
                {
                    "name": "NETWORK_PACKETS_OUT_PER_SECOND",
                    "statistic": "MAXIMUM",
                    "value": 0.3302777777777778
                }
            ],
            "lookBackPeriodInDays": 14.0,
            "recommendationOptions": [
                {
                    "instanceType": "r6g.large",
                    "projectedUtilizationMetrics": [
                        {
                            "name": "CPU",
                            "statistic": "MAXIMUM",
                            "value": 70.76923076923076
                        }
                    ],
                    "platformDifferences": [
                        "Architecture"
                    ],
                    "migrationEffort": "Low",
                    "performanceRisk": 1.0,
                    "rank": 1
                },
                {
                    "instanceType": "t4g.xlarge",
                    "projectedUtilizationMetrics": [
                        {
                            "name": "CPU",
                            "statistic": "MAXIMUM",
                            "value": 33.33333333333333
                        }
                    ],
                    "platformDifferences": [
                        "Hypervisor",
                        "Architecture"
                    ],
                    "migrationEffort": "Low",
                    "performanceRisk": 3.0,
                    "rank": 2
                },
                {
                    "instanceType": "m6g.xlarge",
                    "projectedUtilizationMetrics": [
                        {
                            "name": "CPU",
                            "statistic": "MAXIMUM",
                            "value": 33.33333333333333
                        }
                    ],
                    "platformDifferences": [
                        "Architecture"
                    ],
                    "migrationEffort": "Low",
                    "performanceRisk": 1.0,
                    "rank": 3
                }
            ],
            "recommendationSources": [
                {
                    "recommendationSourceArn": "arn:aws:ec2:us-west-2:000000000000:instance/i-0b5ec1bb9daabf0f3",
                    "recommendationSourceType": "Ec2Instance"
                }
            ],
            "lastRefreshTimestamp": "2021-12-28T11:00:03.576000-08:00",
            "currentPerformanceRisk": "High",
            "effectiveRecommendationPreferences": {
                "cpuVendorArchitectures": [
                    "CURRENT", 
                    "AWS_ARM64"
                ],
                "enhancedInfrastructureMetrics": "Inactive"
            }
        }
    ],
    "errors": []
}

Conclusion

Compute Optimizer Graviton recommendations are available in in US East (Ohio), US East (N. Virginia), US West (N. California), US West (Oregon), Asia Pacific (Mumbai), Asia Pacific (Seoul), Asia Pacific (Singapore), Asia Pacific (Sydney), Asia Pacific (Tokyo), Canada (Central), Europe (Frankfurt), Europe (Ireland), Europe (London), Europe (Paris), Europe (Stockholm), and South America (São Paulo) Regions at no additional charge. To get started with Compute Optimizer, visit the Compute Optimizer webpage.

New for AWS Compute Optimizer – Resource Efficiency Metrics to Estimate Savings Opportunities and Performance Risks

Post Syndicated from Danilo Poccia original https://aws.amazon.com/blogs/aws/new-for-aws-compute-optimizer-resource-efficiency-metrics-to-estimate-savings-opportunities-and-performance-risks/

By applying the knowledge drawn from Amazon’s experience running diverse workloads in the cloud, AWS Compute Optimizer identifies workload patterns and recommends optimal AWS resources.

Today, I am happy to share that AWS Compute Optimizer now delivers resource efficiency metrics alongside its recommendations to help you assess how efficiently you are using AWS resources:

  • A dashboard shows you savings and performance improvement opportunities at the account level. You can dive into resource types and individual resources from the dashboard.
  • The Estimated monthly savings (On-Demand) and Savings opportunity (%) columns estimate the possible savings for over-provisioned resources. You can sort your recommendations using these two columns to quickly find the resources on which to focus your optimization efforts.
  • The Current performance risk column estimates the bottleneck risk with the current configuration for under-provisioned resources.

These efficiency metrics are available for Amazon Elastic Compute Cloud (Amazon EC2), AWS Lambda, and Amazon Elastic Block Store (EBS) at the resource and AWS account levels.

For multi-account environments, Compute Optimizer continuously calculates resource efficiency metrics at individual account level in an AWS organization to help identify teams with low cost-efficiency or possible performance risks. This lets you to create goals and track progress over time. You can quickly understand just how resource-efficient teams and applications are, easily prioritize recommendation evaluation and adoption by engineering team, and establish a mechanism that drives a cost-aware culture and accountability across engineering teams.

Using Resource Efficiency Metrics in AWS Compute Optimizer
You can opt in using the AWS Management Console or the AWS Command Line Interface (CLI) to start using Compute Optimizer. You can enroll the account that you’re currently signed in to or all of the accounts within your organization. Depending on your choice, Compute Optimizer analyzes resources that are in your individual account or for each account in your organization, and then generates optimization recommendations for those resources.

To see your savings opportunity in Compute Optimizer, you should also opt in to AWS Cost Explorer and enable the rightsizing recommendations in the AWS Cost Explorer preferences page. For more details, see Getting started with rightsizing recommendations.

I already enrolled some time ago, and in the Compute Optimizer console I see the overall savings opportunity for my account.

Console screenshot.

Below that, I have a recap of the performance improvement opportunity. This includes an overview of the under-provisioned resources, as well as the performance risks that they pose by resource type.

Console screenshot.

Let’s dive into some of those savings. In the EC2 instances section, Compute Optimizer found 37 over-provisioned instances.

Console screenshot.

I follow the 37 instances link to get recommendations for those resources, and then sort the table by Estimated monthly savings (On-Demand) descending.

Console screenshot.

On the right, in the same table, I see which is the current instance type, the recommended instance type based on Computer Optimizer estimates, the difference in pricing, and if there are platform differences between the current and recommended instance types.

Console screenshot.

I can select each instance to further drill down into the metrics collected, as well as the other possible instance types suggested by Computer Optimizer.

Back to the Compute Optimizer Dashboard, in the Lambda functions section, I see that eight functions have under-provisioned memory.

Console screenshot.

Again, I follow the 8 functions link to get recommendations for those resources, and then sort the table by Current performance risk. In my case, the risk is always low, but different values can help prioritize your activities.

Console screenshot.

Here, I see the current and recommended configured memory for those Lambda functions. I can select each function to get a view of the metrics collected. Choosing the memory allocated to Lambda functions is an optimization process that balances speed (duration) and cost. See Profiling functions with AWS Lambda Power Tuning in the documentation for more information.

Availability and Pricing
You can use resource efficiency metrics with AWS Compute Optimizer in any AWS Region where it is offered. For more information, see the AWS Regional Services List. There is no additional charge for this new capability. See the AWS Compute Optimizer pricing page for more information.

This new feature lets you implement a periodic workflow to optimize your costs:

  • You can start by reviewing savings opportunities for all of your accounts to identify which accounts have the highest savings opportunity.
  • Then, you can drill into those accounts with the highest savings opportunity. You can refer to the estimated monthly savings to see which recommendations can drive the largest absolute cost impact.
  • Finally, you can communicate optimization opportunities and priority order to the teams using those accounts.

Start using AWS Compute Optimizer today to find and prioritize savings opportunities in your AWS account or organization.

Danilo

New for AWS Compute Optimizer – Enhanced Infrastructure Metrics to Extend the Look-Back Period to Three Months

Post Syndicated from Danilo Poccia original https://aws.amazon.com/blogs/aws/new-for-aws-compute-optimizer-enhanced-infrastructure-metrics-to-extend-the-look-back-period-to-three-months/

By using machine learning to analyze historical utilization metrics, AWS Compute Optimizer recommends optimal AWS resources for your workloads to reduce costs and improve performance. Over-provisioning resources can lead to unnecessary infrastructure costs, and under-provisioning resources can lead to poor application performance. Compute Optimizer helps you choose optimal configurations for three types of AWS resources: Amazon Elastic Compute Cloud (Amazon EC2) instances, Amazon Elastic Block Store (EBS) volumes, and AWS Lambda functions, based on your utilization data. Today, I am happy to share that AWS Compute Optimizer now supports recommendation preferences where you can opt in or out of features that enhance resource-specific recommendations.

For EC2 instances, AWS Compute Optimizer analyzes Amazon CloudWatch metrics from the past 14 days to generate recommendations. For this reason, recommendations weren’t relevant for a subset of workloads that had monthly or quarterly patterns. For those workloads, you had to look for unoptimized resources and determine the right resource configurations over a longer period of time. This can be time-consuming and requires deep cloud expertise, especially for large organizations.

With the launch of recommendation preferences, Compute Optimizer now offers enhanced infrastructure metrics, a new paid recommendation preference feature that enhances recommendation quality for EC2 instances and Auto Scaling groups. Activating it extends the metrics look-back period to three months. You can activate enhanced infrastructure metrics for individual resources or at the AWS account or AWS organization level.

Let’s see how that works in practice.

Using Enhanced Infrastructure Metrics with AWS Compute Optimizer
Here, I am using the management account of my AWS organization to see organization-level preferences. In the left pane of the Compute Optimizer console, I choose Accounts. Here, there is a new section to set up Organization level preferences for enhanced infrastructure metrics. The console warns me that this is a paid feature.

I want to activate enhanced infrastructure metrics for EC2 instances running in the US East (N. Virginia) Region for all accounts in my organization. I choose the Edit button. For Resource type, I select EC2 instances. For Region, I select US East (N. Virginia). I check that the flag is active and save.

Console screenshot.

If I select one of the AWS accounts on this page, I can choose View preferences and override the setting for that specific account. For example, I can disable accounts that I use for testing because EC2 instances there are created automatically by a CI/CD pipeline and are usually terminated within a few hours.

Console screenshot.

In the console Dashboard, I look at the overall recommendations for EC2 instances and Auto Scaling groups.

Console screenshot.

In the EC2 instances box, I choose View recommendations and then one of the instances. With the Edit button, I can activate or inactivate enhanced infrastructure metrics for this specific resource. Here, I can also see if, considering all settings at organization, account, and resource level, enhanced infrastructure metrics is actually active or not for this specific EC2 instance. I see Active (pending) here because I’ve just changed the setting and it may take a few hours for Compute Optimizer to consider my updated preferences in its recommendations.

Console screenshot.

Below, I see the recommended options for the instance. Considering the current workload, I should change instance type and size from c3.2xlarge to r5d.large and save some money.

Console screenshot.

In a few hours, Compute Optimizer updates its recommendations based on the latest three months of CloudWatch metrics. In this way, I get better suggestions for workloads that have monthly or quarterly activities.

Availability and Pricing
You can activate enhanced infrastructure metrics in the AWS Compute Optimizer account preferences page for all the accounts in your organization or for individual accounts. If you need more granular controls, you can activate (or deactivate) for an individual resource (Auto Scaling group or EC2 instance) in the resource detail page. You can also activate enhanced infrastructure metrics using the AWS Command Line Interface (CLI) or AWS SDKs.

Default preferences in Compute Optimizer (with 14-day look-back) are free. Enabling enhanced infrastructure metrics costs $0.0003360215 per resource per hour and is charged based on the number of hours per month the resource is running. For a resource running a full 31-day month, that’s $0.25. For more information, see the Compute Optimizer pricing page.

Use enhanced infrastructure metrics to generate recommendations with Compute Optimizer based on metrics from the past three months.

Danilo

Optimizing AWS Lambda cost and performance using AWS Compute Optimizer

Post Syndicated from Chad Schmutzer original https://aws.amazon.com/blogs/compute/optimizing-aws-lambda-cost-and-performance-using-aws-compute-optimizer/

This post is authored by Brooke Chen, Senior Product Manager for AWS Compute Optimizer, Letian Feng, Principal Product Manager for AWS Compute Optimizer, and Chad Schmutzer, Principal Developer Advocate for Amazon EC2

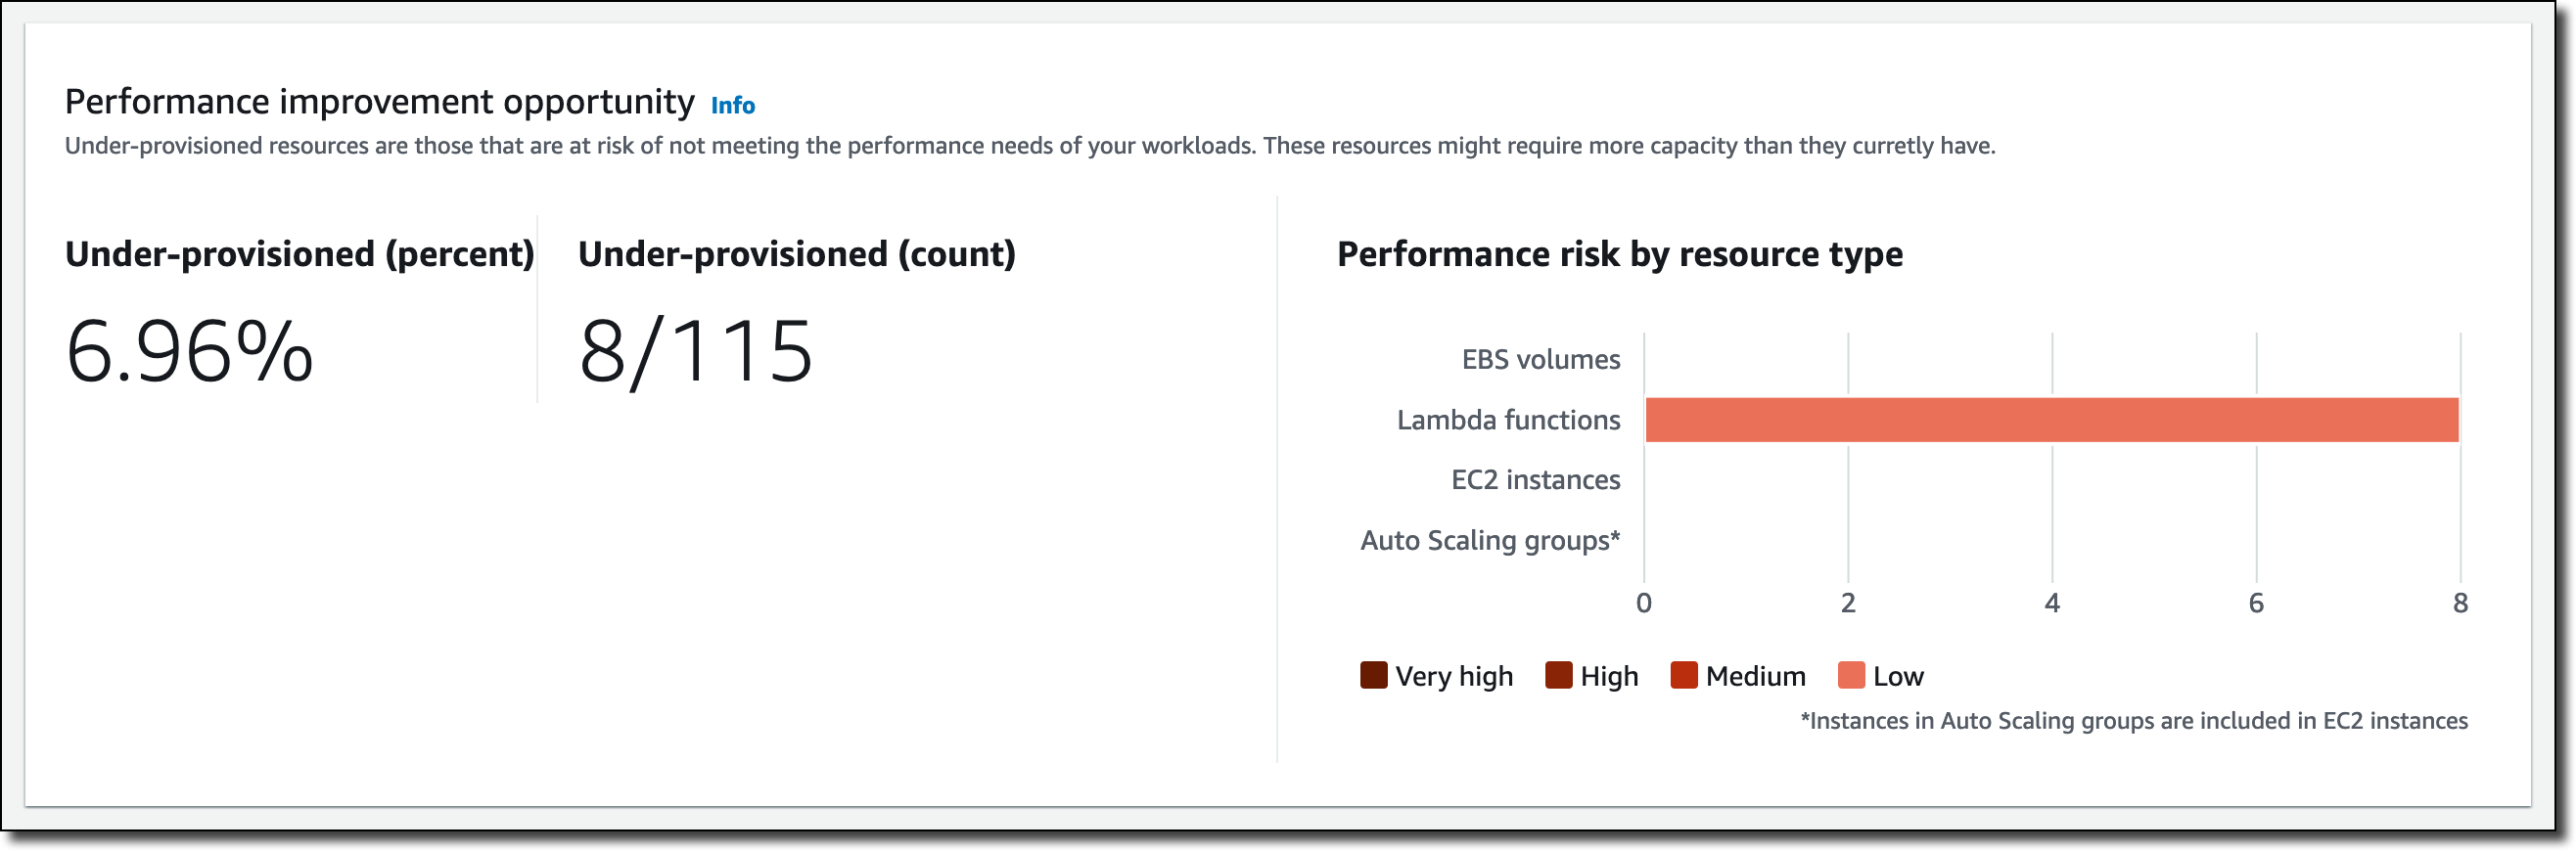
Optimizing compute resources is a critical component of any application architecture. Over-provisioning compute can lead to unnecessary infrastructure costs, while under-provisioning compute can lead to poor application performance.

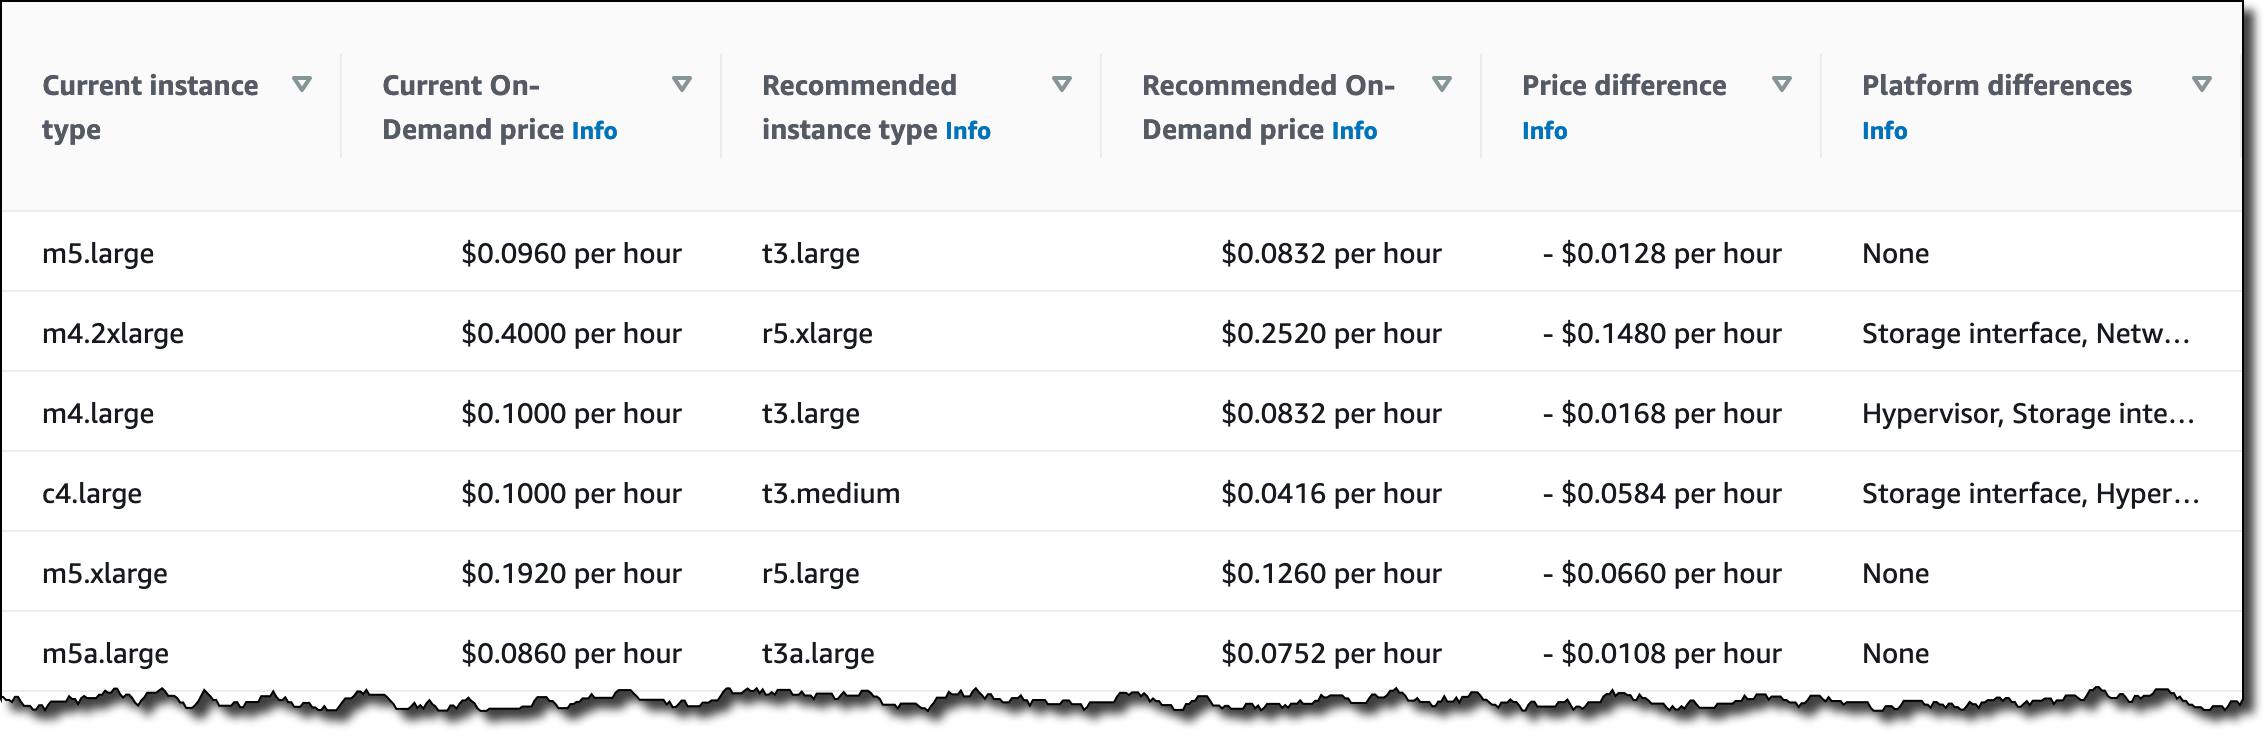
Launched in December 2019, AWS Compute Optimizer is a recommendation service for optimizing the cost and performance of AWS compute resources. It generates actionable optimization recommendations tailored to your specific workloads. Over the last year, thousands of AWS customers reduced compute costs up to 25% by using Compute Optimizer to help choose the optimal Amazon EC2 instance types for their workloads.

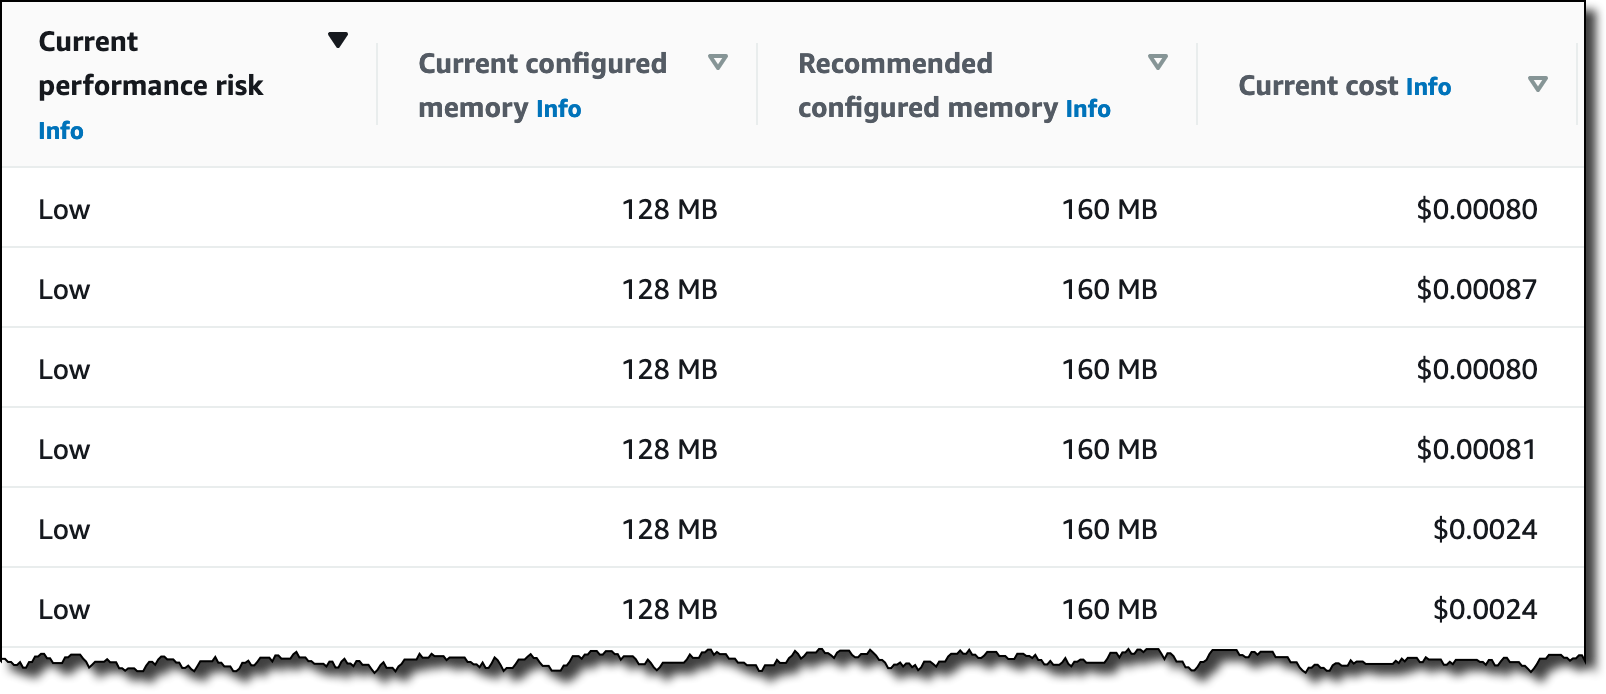
One of the most frequent requests from customers is for AWS Lambda recommendations in Compute Optimizer. Today, we announce that Compute Optimizer now supports memory size recommendations for Lambda functions. This allows you to reduce costs and increase performance for your Lambda-based serverless workloads. To get started, opt in for Compute Optimizer to start finding recommendations.

Overview

With Lambda, there are no servers to manage, it scales automatically, and you only pay for what you use. However, choosing the right memory size settings for a Lambda function is still an important task. Computer Optimizer uses machine-learning based memory recommendations to help with this task.

These recommendations are available through the Compute Optimizer console, AWS CLI, AWS SDK, and the Lambda console. Compute Optimizer continuously monitors Lambda functions, using historical performance metrics to improve recommendations over time. In this blog post, we walk through an example to show how to use this feature.

Using Compute Optimizer for Lambda

This tutorial uses the AWS CLI v2 and the AWS Management Console.

In this tutorial, we setup two compute jobs that run every minute in AWS Region US East (N. Virginia). One job is more CPU intensive than the other. Initial tests show that the invocation times for both jobs typically last for less than 60 seconds. The goal is to either reduce cost without much increase in duration, or reduce the duration in a cost-efficient manner.

Based on these requirements, a serverless solution can help with this task. Amazon EventBridge can schedule the Lambda functions using rules. To ensure that the functions are optimized for cost and performance, you can use the memory recommendation support in Compute Optimizer.

In your AWS account, opt in to Compute Optimizer to start analyzing AWS resources. Ensure you have the appropriate IAM permissions configured – follow these steps for guidance. If you prefer to use the console to opt in, follow these steps. To opt in, enter the following command in a terminal window:

$ aws compute-optimizer update-enrollment-status --status Active

Once you enable Compute Optimizer, it starts to scan for functions that have been invoked for at least 50 times over the trailing 14 days. The next section shows two example scheduled Lambda functions for analysis.

Example Lambda functions

The code for the non-CPU intensive job is below. A Lambda function named lambda-recommendation-test-sleep is created with memory size configured as 1024 MB. An EventBridge rule is created to trigger the function on a recurring 1-minute schedule:

import json
import time

def lambda_handler(event, context):
  time.sleep(30)
  x=[0]*100000000
  return {
    'statusCode': 200,
    'body': json.dumps('Hello World!')
  }

The code for the CPU intensive job is below. A Lambda function named lambda-recommendation-test-busy is created with memory size configured as 128 MB. An EventBridge rule is created to trigger the function on a recurring 1-minute schedule:

import json
import random

def lambda_handler(event, context):
  random.seed(1)
  x=0
  for i in range(0, 20000000):
    x+=random.random()

  return {
    'statusCode': 200,
    'body': json.dumps('Sum:' + str(x))
  }

Understanding the Compute Optimizer recommendations

Compute Optimizer needs a history of at least 50 invocations of a Lambda function over the trailing 14 days to deliver recommendations. Recommendations are created by analyzing function metadata such as memory size, timeout, and runtime, in addition to CloudWatch metrics such as number of invocations, duration, error count, and success rate.

Compute Optimizer will gather the necessary information to provide memory recommendations for Lambda functions, and make them available within 48 hours. Afterwards, these recommendations will be refreshed daily.

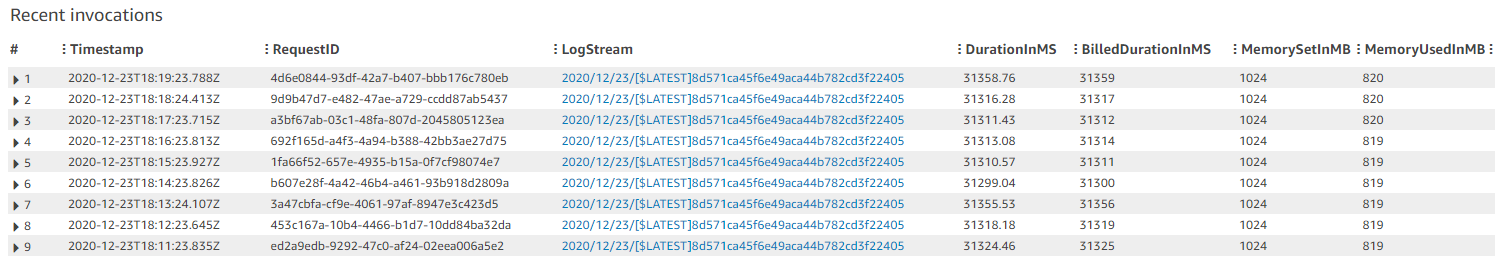
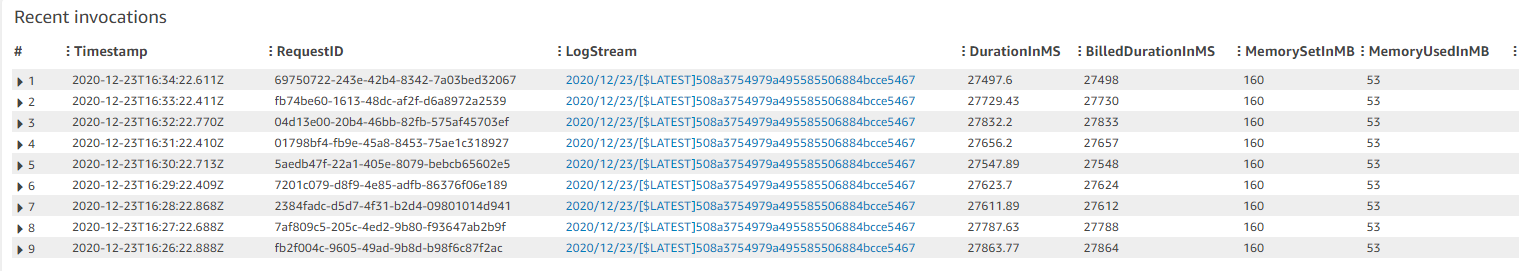
These are recent invocations for the non-CPU intensive function:

Recent invocations for the non-CPU intensive function

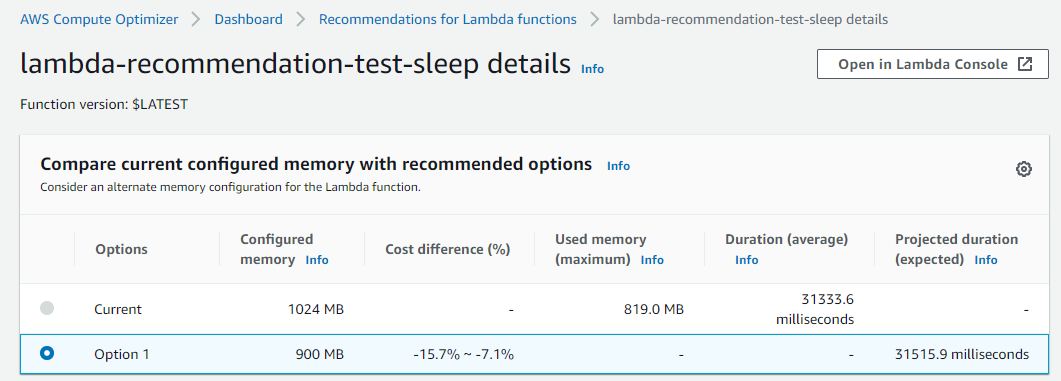
Function duration is approximately 31.3 seconds with a memory setting of 1024 MB, resulting in a duration cost of about $0.00052 per invocation. Here are the recommendations for this function in the Compute Optimizer console:

Recommendations for this function in the Compute Optimizer console

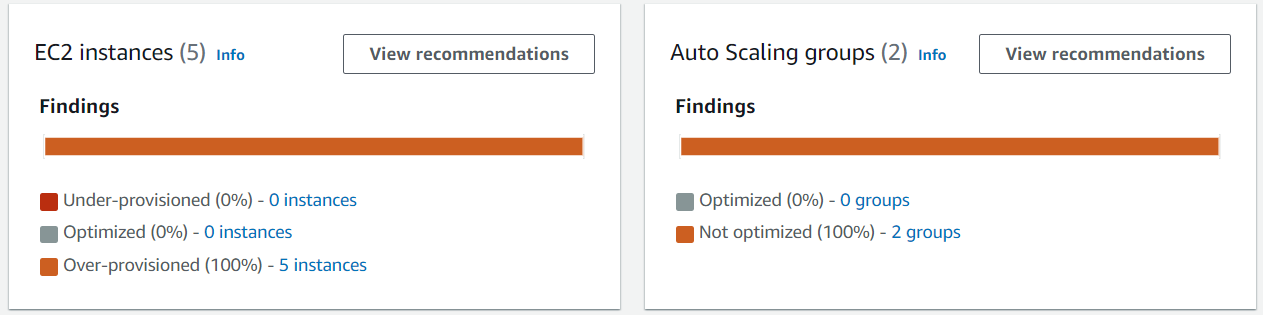
The function is Not optimized with a reason of Memory over-provisioned. You can also fetch the same recommendation information via the CLI:

$ aws compute-optimizer \
  get-lambda-function-recommendations \
  --function-arns arn:aws:lambda:us-east-1:123456789012:function:lambda-recommendation-test-sleep
{
    "lambdaFunctionRecommendations": [
        {
            "utilizationMetrics": [
                {
                    "name": "Duration",
                    "value": 31333.63587049883,
                    "statistic": "Average"
                },
                {
                    "name": "Duration",
                    "value": 32522.04,
                    "statistic": "Maximum"
                },
                {
                    "name": "Memory",
                    "value": 817.67049838188,
                    "statistic": "Average"
                },
                {
                    "name": "Memory",
                    "value": 819.0,
                    "statistic": "Maximum"
                }
            ],
            "currentMemorySize": 1024,
            "lastRefreshTimestamp": 1608735952.385,
            "numberOfInvocations": 3090,
            "functionArn": "arn:aws:lambda:us-east-1:123456789012:function:lambda-recommendation-test-sleep:$LATEST",
            "memorySizeRecommendationOptions": [
                {
                    "projectedUtilizationMetrics": [
                        {
                            "name": "Duration",
                            "value": 30015.113193697029,
                            "statistic": "LowerBound"
                        },
                        {
                            "name": "Duration",
                            "value": 31515.86878891883,
                            "statistic": "Expected"
                        },
                        {
                            "name": "Duration",
                            "value": 33091.662123300975,
                            "statistic": "UpperBound"
                        }
                    ],
                    "memorySize": 900,
                    "rank": 1
                }
            ],
            "functionVersion": "$LATEST",
            "finding": "NotOptimized",
            "findingReasonCodes": [
                "MemoryOverprovisioned"
            ],
            "lookbackPeriodInDays": 14.0,
            "accountId": "123456789012"
        }
    ]
}

The Compute Optimizer recommendation contains useful information about the function. Most importantly, it has determined that the function is over-provisioned for memory. The attribute findingReasonCodes shows the value MemoryOverprovisioned. In memorySizeRecommendationOptions, Compute Optimizer has found that using a memory size of 900 MB results in an expected invocation duration of approximately 31.5 seconds.

For non-CPU intensive jobs, reducing the memory setting of the function often doesn’t have a negative impact on function duration. The recommendation confirms that you can reduce the memory size from 1024 MB to 900 MB, saving cost without significantly impacting duration. The new duration cost per invocation saves approximately 12%.

The Compute Optimizer console validates these calculations:

Compute Optimizer console validates these calculations

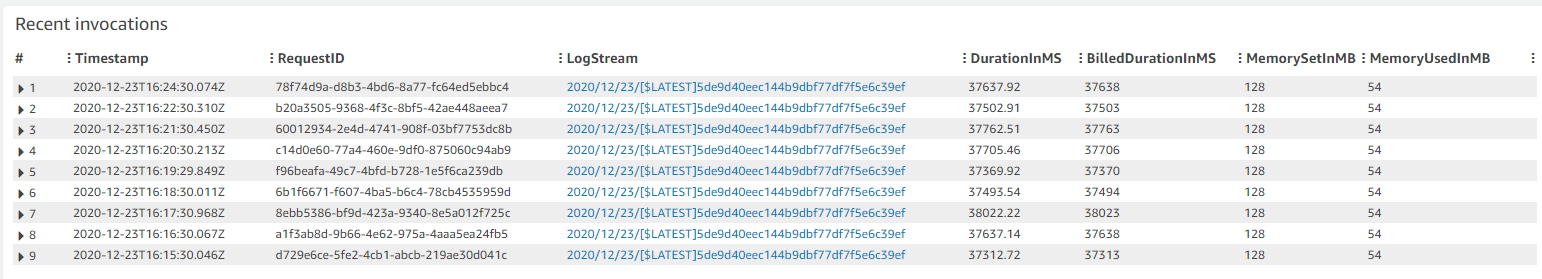
These are recent invocations for the second function which is CPU-intensive:

Recent invocations for the second function which is CPU-intensive

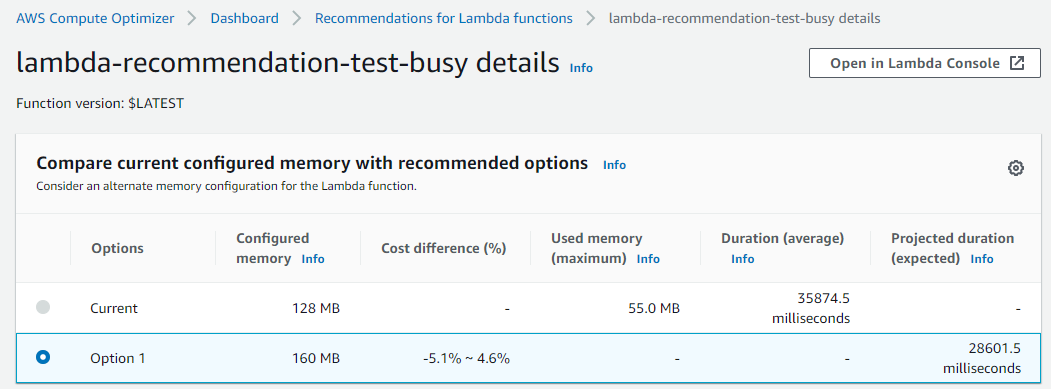
The function duration is about 37.5 seconds with a memory setting of 128 MB, resulting in a duration cost of about $0.000078 per invocation. The recommendations for this function appear in the Compute Optimizer console:

recommendations for this function appear in the Compute Optimizer console

The function is also Not optimized with a reason of Memory under-provisioned. The same recommendation information is available via the CLI:

$ aws compute-optimizer \
  get-lambda-function-recommendations \
  --function-arns arn:aws:lambda:us-east-1:123456789012:function:lambda-recommendation-test-busy
{
    "lambdaFunctionRecommendations": [
        {
            "utilizationMetrics": [
                {
                    "name": "Duration",
                    "value": 36006.85851551957,
                    "statistic": "Average"
                },
                {
                    "name": "Duration",
                    "value": 38540.43,
                    "statistic": "Maximum"
                },
                {
                    "name": "Memory",
                    "value": 53.75978407557355,
                    "statistic": "Average"
                },
                {
                    "name": "Memory",
                    "value": 55.0,
                    "statistic": "Maximum"
                }
            ],
            "currentMemorySize": 128,
            "lastRefreshTimestamp": 1608725151.752,
            "numberOfInvocations": 741,
            "functionArn": "arn:aws:lambda:us-east-1:123456789012:function:lambda-recommendation-test-busy:$LATEST",
            "memorySizeRecommendationOptions": [
                {
                    "projectedUtilizationMetrics": [
                        {
                            "name": "Duration",
                            "value": 27340.37604781184,
                            "statistic": "LowerBound"
                        },
                        {
                            "name": "Duration",
                            "value": 28707.394850202432,
                            "statistic": "Expected"
                        },
                        {
                            "name": "Duration",
                            "value": 30142.764592712556,
                            "statistic": "UpperBound"
                        }
                    ],
                    "memorySize": 160,
                    "rank": 1
                }
            ],
            "functionVersion": "$LATEST",
            "finding": "NotOptimized",
            "findingReasonCodes": [
                "MemoryUnderprovisioned"
            ],
            "lookbackPeriodInDays": 14.0,
            "accountId": "123456789012"
        }
    ]
}

For this function, Compute Optimizer has determined that the function’s memory is under-provisioned. The value of findingReasonCodes is MemoryUnderprovisioned. The recommendation is to increase the memory from 128 MB to 160 MB.

This recommendation may seem counter-intuitive, since the function only uses 55 MB of memory per invocation. However, Lambda allocates CPU and other resources linearly in proportion to the amount of memory configured. This means that increasing the memory allocation to 160 MB also reduces the expected duration to around 28.7 seconds. This is because a CPU-intensive task also benefits from the increased CPU performance that comes with the additional memory.

After applying this recommendation, the new expected duration cost per invocation is approximately $0.000075. This means that for almost no change in duration cost, the job latency is reduced from 37.5 seconds to 28.7 seconds.

The Compute Optimizer console validates these calculations:

Compute Optimizer console validates these calculations

Applying the Compute Optimizer recommendations

To optimize the Lambda functions using Compute Optimizer recommendations, use the following CLI command:

$ aws lambda update-function-configuration \
  --function-name lambda-recommendation-test-sleep \
  --memory-size 900

After invoking the function multiple times, we can see metrics of these invocations in the console. This shows that the function duration has not changed significantly after reducing the memory size from 1024 MB to 900 MB. The Lambda function has been successfully cost-optimized without increasing job duration:

Console shows the metrics from recent invocations

To apply the recommendation to the CPU-intensive function, use the following CLI command:

$ aws lambda update-function-configuration \
  --function-name lambda-recommendation-test-busy \
  --memory-size 160

After invoking the function multiple times, the console shows that the invocation duration is reduced to about 28 seconds. This matches the recommendation’s expected duration. This shows that the function is now performance-optimized without a significant cost increase:

Console shows that the invocation duration is reduced to about 28 seconds

Final notes

A couple of final notes:

  • Not every function will receive a recommendation. Compute optimizer only delivers recommendations when it has high confidence that these recommendations may help reduce cost or reduce execution duration.
  • As with any changes you make to an environment, we strongly advise that you test recommended memory size configurations before applying them into production.

Conclusion

You can now use Compute Optimizer for serverless workloads using Lambda functions. This can help identify the optimal Lambda function configuration options for your workloads. Compute Optimizer supports memory size recommendations for Lambda functions in all AWS Regions where Compute Optimizer is available. These recommendations are available to you at no additional cost. You can get started with Compute Optimizer from the console.

To learn more visit Getting started with AWS Compute Optimizer.