Tag Archives: AWS re:Invent

AWS Lambda functions now scale 12 times faster when handling high-volume requests

Post Syndicated from Marcia Villalba original https://aws.amazon.com/blogs/aws/aws-lambda-functions-now-scale-12-times-faster-when-handling-high-volume-requests/

Now AWS Lambda scales up to 12 times faster. Each synchronously invoked Lambda function now scales by 1,000 concurrent executions every 10 seconds until the aggregate concurrency across all functions reaches the account’s concurrency limit. In addition, each function within an account now scales independently from each other, no matter how the functions are invoked. These improvements come at no additional cost, and you don’t need to do any configuration in your existing functions.

Building scalable and high-performing applications can be challenging with traditional architectures, often requiring over-provisioning of compute resources or complex caching solutions for peak demands and unpredictable traffic. Many developers choose Lambda because it scales on-demand when applications face unpredictable traffic.

Before this update, Lambda functions could initially scale at the account level by 500–3,000 concurrent executions (depending on the Region) in the first minute, followed by 500 concurrent executions every minute until the account’s concurrency limit is reached. Because this scaling limit was shared between all the functions in the same account and Region, if one function experienced an influx of traffic, it could affect the throughput of other functions in the same account. This increased engineering efforts to monitor a few functions that could burst beyond the account limits, causing a noisy neighbor scenario and reducing the overall concurrency of other functions in the same account.

Now, with these scaling improvements, customers with highly variable traffic can reach concurrency targets faster than before. For instance, a news site publishing a breaking news story or an online store running a flash sale would experience a significant influx of visitors. Thanks to these improvements, they can now scale 12 times faster than before.

In addition, customers that use services such as Amazon Athena and Amazon Redshift with scalar Lambda-based UDFs to perform data enrichment or data transformations will see benefits from these improvements. These services rely on batching data and passing it in chunks to Lambda, simultaneously invoking multiple parallel functions. The enhanced concurrency scaling behavior ensures Lambda can rapidly scale and service level agreement (SLA) requirements are met.

How does this work in practice?
The following graph shows a function receiving requests and processing them every 10 seconds. The account concurrency limit is set to 7,000 concurrent requests and is shared between all the functions in the same account. Each function scaling-up rate is fixed to 1,000 concurrent executions every 10 seconds. This rate is independent from other functions in the same account, making it easier for you to predict how this function will scale and throttle the requests if needed.

  • 09:00:00 – The function has been running for a while, and there are already 1,000 concurrent executions that are being processed.
  • 09:00:10 – Ten seconds later, there is a new burst of 1,000 new requests. This function can process them with no problem because the function can scale up to 1,000 concurrent executions every 10 seconds.
  • 09:00:20 – The same happens here: a thousand new requests.
  • 09:00:30 – The function now receives 1,500 new requests. Because the maximum scale-up capacity for a function is 1,000 requests per 10 seconds, 500 of those requests will get throttled.
  • 09:01:00 – At this time, the function is already processing 4,500 concurrent requests. But there is a burst of 3,000 new requests. Lambda processes 1,000 of the new requests and throttles 2,000 because the function can scale up to 1,000 requests every 10 seconds.
  • 09:01:10 – After 10 seconds, there is another burst of 2,000 requests, and the function can now process 1,000 more requests. However, the remaining 1,000 requests get throttled because the function can scale to 1,000 requests every 10 seconds.
  • 09:01:20 – Now the function is processing 6,500 concurrent requests, and there are 1,000 incoming requests. The first 500 of those requests get processed, but the other 500 get throttled because the function reached the account concurrency limit of 7,000 requests. It’s important to remember that you can raise the account concurrency limit by creating a support ticket in the AWS Management Console.

Example of a function scaling

In the case of having more than one function in your account, the functions scale independently until the total account concurrency limit is reached. After that, all new invocations will be throttled.

Availability
These scaling improvements will be enabled by default for all functions. Starting on November 26 through mid-December, AWS is gradually rolling out these scaling improvements to all AWS Regions except China and GovCloud Regions.

If you want to learn more about Lambda’s new scaling behavior, read the Lambda scaling behavior documentation page.

Marcia

IAM Access Analyzer updates: Find unused access, check policies before deployment

Post Syndicated from Jeff Barr original https://aws.amazon.com/blogs/aws/iam-access-analyzer-updates-find-unused-access-check-policies-before-deployment/

We are launching two new features for AWS Identity and Access Management (IAM) Access Analyzer today:

Unused Access Analyzer – A new analyzer that continuously monitors roles and users looking for permissions that are granted but not actually used. Central security teams can take advantage of a dashboard view that will help them to find the accounts that can most benefit from a review of unused permissions, roles, and IAM users.

Custom Policy Checks – Validation that newly authored policies do not grant additional (and perhaps unintended) permissions. You can exercise tighter control over your IAM policies and accelerate the process of moving AWS applications from development to production by adding automated policy reviews to your CI/CD pipelines and custom policy tools.

Let’s take a look at today’s launches!

Unused Access Analyzer
You can already create an analyzer that monitors for external access. With today’s launch you can create one that looks for access permissions that are either overly generous or that have fallen into disuse. This includes unused IAM roles, unused access keys for IAM users, unused passwords for IAM users, and unused services and actions for active IAM roles and users.

After reviewing the findings generated by an organization-wide or account-specific analyzer, you can take action by removing permissions that you don’t need. You can create analyzers and analyze findings from the AWS Management Console, CLI, or API. Let’s start with the IAM Console. I click Analyzers and settings in the left-side navigation:

I can see my current analyzers (none, in this case). I click Create analyzer to proceed:

I specify Unused access analysis, leave the default tracking period of 90 days as-is, and opt to check my account rather than my Organization, then I click Create analyzer:

My analyzer is created, and I check back a little while later to see what it finds. My findings were available within a minute, but this will vary. Here are some of the findings:

As you can see, I have lots of unused IAM roles and permissions (clearly I am a bad Role model). I can click on a Finding to learn more:

If this is a role that I need, I can click Archive to remove it from the list of active findings. I can also create archive rules that will do the same for similar findings:

The external access analyzer works in a similar way, and is a perfect place to start when you are new to Access Analyzer and are ready to find and remove extra permissions:

The dashboard gives me an overview of all active findings:

If I create an analyzer and specify my Organization as the Zone of trust, I can also view a list that shows the accounts that have the largest number of active findings:

This feature is also available from the command line. I can create a new analyzer like this:

$ aws access-analyzer create-analyzer --type ACCOUNT_UNUSED_ACCESS \
  --analyzer-name OneWeek \
  --configuration '{"unusedAccess" : {"unusedAccessAge" : 90}}'
----------------------------------------------------------------------------
|                              CreateAnalyzer                              |
+-----+--------------------------------------------------------------------+
|  arn|  arn:aws:access-analyzer:us-east-1:348414629041:analyzer/OneWeek   |
+-----+--------------------------------------------------------------------+

I can list the findings, perhaps all I want is the actual resource Ids to start:

$  aws access-analyzer list-findings-v2 \
  --analyzer-arn  arn:aws:access-analyzer:us-east-1:123456789012:analyzer/OneWeek 
  --output json |
 jq -r '.findings[] | .resource'

arn:aws:iam::123456789012:role/MobileHub_Service_Role
arn:aws:iam::123456789012:role/EKSClusterRole
arn:aws:iam::123456789012:role/service-role/AWSDataSyncS3BucketAccess-jbarr-data
arn:aws:iam::123456789012:role/rds-monitoring-role
arn:aws:iam::123456789012:role/IsengardRoleForDependencyAssuranceIamAnalyzer
arn:aws:iam::123456789012:role/service-role/s3crr_role_for_rep-src_to_rep-dest
arn:aws:iam::123456789012:role/service-role/AWSDeepRacerServiceRole
...

I can archive findings by Id:

$ aws access-analyzer update-findings  \
  --analyzer-arn arn:aws:access-analyzer:us-east-1:123456789012:analyzer/OneWeek 
  --status ARCHIVED --ids "f0492061-8638-48ac-b91a-f0583cc839bf"

And I can perform the same operations using the IAM Access Analyzer API.

This feature is priced based on the number of IAM roles analyzed each month and is available in all AWS Regions where IAM is available.

Custom Policy Checks
You can now validate that IAM policies adhere to your security standards ahead of deployments and proactively detect non-conformant updates to policies. This will help you to innovate more quickly, move apps from development to production more efficiently, and to have confidence that any changes you make represent your intent.

Let’s start with my allow-all-ssm policy:

For illustrative purposes, I edit it to add S3 access:

Then I click Check for new access, confirm that I understand that a charge will be made, and click Check policy:

The automated reasoning verifies the policy and tells me that I did enable new access. If that was my intent I click Next to proceed, otherwise I rethink my changes to the policy:

This is a very simple and contrived example, but I am confident that you can see how useful and valuable this can be to your security efforts. You can also access this from the CLI (check-no-new-access) and API (CheckNoNewAccess).

There’s also another command and function that is designed to be used in your CI/CD pipelines, AWS CloudFormation hooks, and custom policy tools. check-access-not-granted and CheckAccessNotGranted accept a policy document and a permission such as s3:Get*, and check to make sure that the policy does not grant the permission. You could use this, for example, to make sure that a policy which specifies that Security Hub should be disabled cannot be deployed. This will help you to move from development to production with the confidence that your policies adhere to your organization’s security standards.

This feature is priced based on the number of checks that are performed each month and is available in all AWS commercial and AWS GovCloud Regions.

Learn more
AWS Identity and Access Management (IAM) Access Analyzer

Jeff;

External endpoints and testing of task states now available in AWS Step Functions

Post Syndicated from Marcia Villalba original https://aws.amazon.com/blogs/aws/external-endpoints-and-testing-of-task-states-now-available-in-aws-step-functions/

Now AWS Step Functions HTTPS endpoints let you integrate third-party APIs and external services to your workflows. HTTPS endpoints provide a simpler way of making calls to external APIs and integrating with existing SaaS providers, like Stripe for handling payments, GitHub for code collaboration and repository management, and Salesforce for sales and marketing insights. Before this launch, customers needed to use an AWS Lambda function to call the external endpoint, handling authentication and errors directly from the code.

Also, we are announcing a new capability to test your task states individually without the need to deploy or execute the state machine.

AWS Step Functions is a visual workflow service that makes it easy for developers to build distributed applications, automate processes, orchestrate microservices, and create data and machine learning (ML) pipelines. Step Functions integrates with over 220 AWS services and provides features that help developers build, such as built-in error handling, real-time and auditable workflow execution history, and large-scale parallel processing.

HTTPS endpoints
HTTPS endpoints are a new resource for your task states that allow you to connect to third-party HTTP targets outside AWS. Step Functions invokes the HTTP endpoint, deliver a request body, headers, and parameters, and get a response from the third-party services. You can use any preferred HTTP method, such as GET or POST.

HTTPS endpoints use Amazon EventBridge connections to manage the authentication credentials for the target. This defines the authorization type used, which can be a basic authentication with a username and password, an API key, or OAuth. EventBridge connections use AWS Secrets Manager to store the secret. This keeps the secrets out of the state machine, reducing the risks of accidentally exposing your secrets in logs or in the state machine definition.

Getting started with HTTPS endpoints
To get started with HTTPS endpoints, first you need to create an EventBridge connection. Then you need to create a new AWS Identity and Access Management (IAM) role and give permissions so your state machine can access the connection resource, get the secret from Secrets Manager, and get permissions to invoke an HTTP endpoint.

Here are the policies that you need to include in your state machine execution role:

{
    "Version": "2012-10-17",
    "Statement": [
        {
            "Effect": "Allow",
            "Action": [
                "secretsmanager:GetSecretValue",
                "secretsmanager:DescribeSecret"
            ],
            "Resource": "arn:aws:secretsmanager:*:*:secret:events!connection/*"
        }
    ]
}
{
    "Version": "2012-10-17",
    "Statement": [
        {
            "Sid": "RetrieveConnectionCredentials",
            "Effect": "Allow",
            "Action": [
                "events:RetrieveConnectionCredentials"
            ],
            "Resource": [
                "arn:aws:events:us-east-2:123456789012:connection/oauth_connection/aeabd89e-d39c-4181-9486-9fe03e6f286a"
            ]
        }
    ]
}
{
    "Version": "2012-10-17",
    "Statement": [
        {
            "Sid": "InvokeHTTPEndpoint",
            "Effect": "Allow",
            "Action": [
                "states:InvokeHTTPEndpoint"
            ],
            "Resource": [
                "arn:aws:states:us-east-2:123456789012:stateMachine:myStateMachine"
            ]
        }
    ]
}

After you have everything ready, you can create your state machine. In your state machine, add a new task state to call a third-party API. You can configure the API endpoint to point to the third-party URL you need, set the correct HTTP method, pick the connection Amazon Resource Name (ARN) for the connection you created previously as the authentication for that endpoint, and provide a request body if needed. In addition, all these parameters can be set dynamically at runtime from the state JSON input.

Call a third party API

Now, making external requests with Step Functions is easy, and you can take advantage of all the configurations that Step Functions provides to handle errors, such as retries for transient errors or momentary service unavailability, and redrive for errors that require longer investigation or resolution time.

Test state
To accelerate feedback cycles, we are also announcing a new capability to test individual states. This new feature allows you to test states independently from the execution of your workflow. This is particularly useful for testing endpoints configuration. You can change the input and test the different scenarios without the need to deploy your workflow or execute the whole state machine. This new feature is available in all task, choice, and pass states.

You will see the testing capability in the Step Functions Workflow Studio when you select a task.

Test state button

When you choose the Test state, you will be redirected to a different view where you can test the task state. You can test that the state machine role has the right permissions, the endpoint you want to call is correctly configured, and verify that the data manipulations work as expected.

How to test a state

Availability
Now, with all the features that Step Functions provides, it’s never been easier to build state machines that can solve a wide variety of problems, like payment flows, workflows with manual inputs, and integration to legacy systems. Using Step Functions HTTPS endpoints, you can directly integrate with popular payment platforms while ensuring that your users’ credit cards are only charged once and errors are handled automatically. In addition, you can test this new integration even before you deploy the state machine using the new test state feature.

These new features are available in all AWS Regions except Asia Pacific (Hyderabad), Asia Pacific (Melbourne), AWS Israel (Tel Aviv), China, and GovCloud Regions.

To get started you can try the “Generate Invoices using Stripe” sample project from Step Functions in the AWS Managment Console or check out the AWS Step Functions Developer Guide to learn more.

Marcia

Amazon EKS Pod Identity simplifies IAM permissions for applications on Amazon EKS clusters

Post Syndicated from Donnie Prakoso original https://aws.amazon.com/blogs/aws/amazon-eks-pod-identity-simplifies-iam-permissions-for-applications-on-amazon-eks-clusters/

Starting today, you can use Amazon EKS Pod Identity to simplify your applications that access AWS services. This enhancement provides you with a seamless and easy to configure experience that lets you define required IAM permissions for your applications in Amazon Elastic Kubernetes Service (Amazon EKS) clusters so you can connect with AWS services outside the cluster.

Amazon EKS Pod Identity helps you solve growing challenges for managing permissions across many of your EKS clusters.

Simplifying experience with Amazon EKS Pod Identity
In 2019, we introduced IAM roles for service accounts (IRSA). IRSA lets you associate an IAM role with a Kubernetes service account. This helps you to implement the principle of least privilege by giving pods only the permissions they need. This approach prioritizes pods in IAM and helps developers configure applications with fine-grained permissions that enable the least privileged access to AWS services.

Now, with Amazon EKS Pod Identity, it’s even easier to configure and automate granting AWS permissions to Kubernetes identities. As the cluster administrator, you no longer need to switch between Amazon EKS and IAM services to authenticate your applications to all AWS resources.

The overall workflow to start using Amazon EKS Pod Identity can be summarized in a few simple steps:

  • Step 1: Create an IAM role with required permissions for your application and specify pods.eks.amazonaws.com as the service principal in its trust policy.
  • Step 2: Install Amazon EKS Pod Identity Agent add-on using the Amazon EKS console or AWS Command Line Interface (AWS CLI).
  • Step 3: Map the role to a service account directly in the Amazon EKS console, APIs, or AWS CLI.

Once it’s done, any new pods that use that service account will automatically be configured to receive IAM credentials.

Let’s get started
Let me show you how you can get started with EKS Pod Identity. For the demo in this post, I need to configure permission for a simple API running in my Amazon EKS cluster, which will return the list of files in my Amazon Simple Storage Service (Amazon S3) bucket.

First, I need to create an IAM role to provide the required permissions so my applications can run properly. In my case, I need to configure permissions to access my S3 bucket.

Next, on the same IAM role, I need to configure its trust policy and configure the principal to pods.eks.amazonaws.com. The following is the IAM template that I use:

{
    "Version": "2012-10-17",
    "Statement": [
        {
            "Effect": "Allow",
            "Principal": {
                "Service": "pods.eks.amazonaws.com"
            },
            "Action": [
                "sts:AssumeRole",
                "sts:TagSession"
            ]
        }
    ]
}

At this stage, my IAM role is ready, and now we need to configure the Amazon EKS Pod Identity Agent in my cluster. For this article, I’m using my existing EKS cluster. If you want to learn how to do that, visit Getting started with Amazon EKS.

Moving on, I navigate to the Amazon EKS dashboard and then select my EKS cluster.

In my EKS cluster page, I need to select the Add-ons tab and then choose Get more add-ons.

Then, I need to add the Amazon EKS Pod Identity Agent add-on.

On the next page, I can add additional configuration if needed. In this case, I leave the default configuration and choose Next.

Then, I just need to review my add-on configuration and choose Create.

After a few minutes, the Amazon EKS Pod Identity Agent add-on is active for my cluster.

Once I have Amazon EKS Pod Identity in my cluster, I need to associate the IAM role to my Kubernetes pods.

I need to navigate to the Access tab in my EKS cluster. On the Pod Identity associations section, I select Create Pod Identity association to map my IAM role to Kubernetes pods.

Here, I use the IAM role that I created in the beginning. I also need to define my Kubernetes namespace and service account. If they don’t exist yet, I can type in the name of the namespace and service account. If they already exist, I can select them from the dropdown. Then, I choose Create.

Those are all the steps I need to do to configure IAM permissions for my applications running on Amazon EKS with EKS Pod Identity. Now, I can see my IAM role is listed in Pod Identity associations.

When I test my API running on Amazon EKS, it runs as expected and returns the list of files in my S3 bucket.

curl -X https://<API-URL> -H "Accept: application/json" 

{
   "files": [
         "test-file-1.md",
         "test-file-2.md"
    ]        
}

I found that Amazon EKS Pod Identity simplifies the experience of managing IAM roles for my applications running on Amazon EKS. I can easily reuse IAM roles across multiple EKS clusters without needing to update the role trust policy each time a new cluster is created.

New AWS APIs to configure EKS Pod Identity
You also have the flexibility to configure Amazon EKS Pod Identity for your cluster using AWS CLI. Amazon EKS Pod Identity provides a new set of APIs that you can use.

For example, I can use aws eks create-addon to install the Amazon EKS Pod Identity Agent add-on into my cluster. Here’s the AWS CLI command:

$ aws eks create-addon \
--cluster-name <CLUSTER_NAME> \
--addon-name eks-pod-identity-agent \
--addon-version v1.0.0-eksbuild.1

{
    "addon": {
    "addonName": "eks-pod-identity-agent",
    "clusterName": "<CLUSTER_NAME>",
    "status": "CREATING",
    "addonVersion": "v1.0.0-eksbuild.1",
    "health": {
        "issues": []
        },
    "addonArn": "<ARN>",
    "createdAt": 1697734297.597,
    "modifiedAt": 1697734297.612,
    "tags": {}
    }
}

Another example of what you can do with AWS APIs is to map the IAM role into your Kubernetes pods.

$ aws eks create-pod-identity-association \
  --cluster-name <CLUSTER_NAME> \
  --namespace <NAMESPACE> \
  --service-account <SERVICE_ACCOUNT_NAME> \
  --role-arn <IAM_ROLE_ARN>

Things to know

Availability – Amazon EKS Pod Identity is available in all AWS Regions supported by Amazon EKS, except the AWS GovCloud (US-East), AWS GovCloud (US-West), China (Beijing, operated by Sinnet), and China (Ningxia, operated by NWCD).

Pricing – Amazon EKS Pod Identity is available at no charge.

Supported Amazon EKS cluster  – Amazon EKS Pod Identity supports Kubernetes running version 1.24 and above in Amazon EKS. You can see EKS Pod Identity cluster versions for more information.

Supported AWS SDK versions – You need to update your application to use the latest AWS SDK versions. Check out AWS developer tools to find out how to install and update your AWS SDK.

Get started today and visit EKS Pod Identities documentation page to learn more about how to simplify IAM management for your applications.

Happy building!
Donnie

New Amazon WorkSpaces Thin Client provides cost-effective, secure access to virtual desktops

Post Syndicated from Jeff Barr original https://aws.amazon.com/blogs/aws/new-amazon-workspaces-thin-client/

The new Amazon WorkSpaces Thin Client improves end-user and IT staff productivity with cost-effective, secure, easy-to-manage access to virtual desktops. The devices are preconfigured and shipped directly to the end user, ready to deploy, connect, and use.

Here’s my testing setup:

The Thin Client is a small cube that connects directly to a monitor, keyboard, mouse, and other USB peripherals such as headsets, microphones, and cameras. With the optional hub it can also drive a second monitor. The administrator can create environments that give users access to Amazon WorkSpaces, Amazon WorkSpaces Web, or Amazon AppStream 2.0, with multiple options for managing user identities and credentials using Active Directory.

Thin Clients in action
As a very long-time user of Amazon WorkSpaces via a thin client, I am thrilled to be able to tell you about this device and the administrative service behind it. While my priority is the ease with which I can switch from client to client while maintaining my working context (running apps, browser tabs, and so forth), administrators will find it attractive for other reasons. For example:

Cost – The device itself is low cost ($195 in the United States), far less expensive than a laptop and the associated operating system. Because the working environments are centrally configured and administered, there’s less work to be done in the field, leading to further cost savings. Further, the devices are far simpler than laptops, with less parts to break, wear out, or replace.

Security – The devices are shipped with a secure “secret” that is used to establish a trust relationship with the administrative service. There’s no data storage on the device, and it cannot host rogue apps that could attempt to exfiltrate data. It also helps to reduce risk of data leakage should a worker leave their job without returning their employer-supplied laptop.

Ease of Management – Administrators can easily create new environments for users or groups of users, distribute activation codes to them, and manage the environment via the AWS Management Console. They can set schedules for software updates and patches, verify compliance, and manage users over time.

Ease of Use – Users can unpack and connect the devices in minutes, enter their activation codes, log in to their virtual desktop environment, and start to work right away. They don’t have to take responsibility for installing software patches or updates, and can focus on their jobs.

There are lots of great use cases for these devices! First, there are situations where there’s a long-term need for regular access: call centers, task workers, training centers, and so forth. Second, there are other situations, where there’s a transient or short-term need for access: registration systems at large events, call centers stood up on a temporary basis for a special event or an emergency, disaster response, and the like. Given that some employees do not return laptops to their employers when they leave their job, providing them with inexpensive devices that do not have local storage makes a lot of sense.

Let’s walk through the process of getting set up, first as an administrator and then as a user.

Getting started as an administrator
The first step is to order some devices and have them shipped to my users, along with any desired peripherals.

Next, in my position as administrator, I open the Amazon WorkSpaces Thin Client Console, and click Get started:

Each Amazon WorkSpaces Thin Client environment provides access to a specific virtual desktop service (WorkSpaces, WorkSpaces Web, or Amazon AppStream 2.0). I click Create environment to move ahead:

I give my environment a name, indicate that I want patches applied automatically, and select WorkSpaces Web:

Next, I click Create WorkSpaces Web portal and go through those steps (not shown, basically choosing a VPC and two or more subnets, a security group, and an optional Private Certificate Authority):

I refresh, and my new portal is visible. I select it, enter a tag for tracking, and click Create environment:

My environment is ready right away. I keep a copy of the activation code (aci3a5yj) at hand to use later in the post:

I am using AWS Identity Center as my identity provider. I already set up my first user, and assigned myself to the MyWebPortal app (the precise steps that you take to do this will vary depending on your choice of identity provider):

Finally, as my last step in this process in my role as administrator, I share the activation code with my users (that would be me, in this case).

Getting started as a user
In my role as a user I return to my testing setup, power-on, go through a couple of quick steps to select my keyboard and connect to my home Wi-Fi, and enter my activation code:

Then I sign in using my AWS Identity Center user name and password:

And my WorkSpace is ready to use:

Administrator tools
As an administrator, I can manage environments, devices, and device software updates from the Thin Client Console. For example, I can review the list of devices that I manage:

Things to know
Here are a couple of things that are important to know:

Regions – The Thin Client Console is available in the US East (N. Virginia), US West (Oregon), Asia Pacific (Mumbai), Canada (Central), and Europe (Frankfurt, Ireland, Ireland, London) Regions.

Device Sales – The Amazon WorkSpaces Thin Clients are available in the United States now, with availability in other countries in early 2024.

Pricing – Devices are priced at $195, or $280 with an optional hub that allows you to use a second monitor. There’s a $6 per month fee to manage, maintain, and monitor each device, and you also pay for the underlying virtual desktop service.

Learn more
Visit the WorkSpaces Thin Client web page and Amazon Business Marketplace to learn more.

Jeff;

Detect runtime security threats in Amazon ECS and AWS Fargate, new in Amazon GuardDuty

Post Syndicated from Sébastien Stormacq original https://aws.amazon.com/blogs/aws/introducing-amazon-guardduty-ecs-runtime-monitoring-including-aws-fargate/

Today, we’re announcing Amazon GuardDuty ECS Runtime Monitoring to help detect potential runtime security issues in Amazon Elastic Container Service (Amazon ECS) clusters running on both AWS Fargate and Amazon Elastic Compute Cloud (Amazon EC2).

GuardDuty combines machine learning (ML), anomaly detection, network monitoring, and malicious file discovery against various AWS data sources. When threats are detected, GuardDuty generates security findings and automatically sends them to AWS Security Hub, Amazon EventBridge, and Amazon Detective. These integrations help centralize monitoring for AWS and partner services, initiate automated responses, and launch security investigations.

GuardDuty ECS Runtime Monitoring helps detect runtime events such as file access, process execution, and network connections that might indicate runtime threats. It checks hundreds of threat vectors and indicators and can produce over 30 different finding types. For example, it can detect attempts of privilege escalation, activity generated by crypto miners or malware, or activity suggesting reconnaissance by an attacker. This is in addition to GuardDuty‘s primary detection categories.

GuardDuty ECS Runtime Monitoring uses a managed and lightweight security agent that adds visibility into individual container runtime behaviors. When using AWS Fargate, there is no need for you to install, configure, manage, or update the agent. We take care of that for you. This simplifies the management of your clusters and reduces the risk of leaving some tasks without monitoring. It also helps to improve your security posture and pass regulatory compliance and certification for runtime threats.

GuardDuty ECS Runtime Monitoring findings are visible directly in the console. You can configure GuardDuty to also send its findings to multiple AWS services or to third-party monitoring systems connected to your security operations center (SOC).

With this launch, Amazon Detective now receives security findings from GuardDuty ECS Runtime Monitoring and includes them in its collection of data for analysis and investigations. Detective helps to analyze, investigate, and quickly identify the root cause of potential security issues or suspicious activities. It collects log data from AWS resources and uses machine learning, statistical analysis, and graph theory to build a linked set of data that enables you to easily conduct security investigations.

Configure GuardDuty ECS Runtime Monitoring on AWS Fargate
For this demo, I choose to show the experience provided for AWS Fargate. When using Amazon ECS, you must ensure your EC2 instances have the GuardDuty agent installed. You can install the agent manually, bake it into your AMI, or use GuardDuty‘s provided AWS Systems Manager document to install it (go to Systems Manager in the console, select Documents, and then search for GuardDuty). The documentation has more details about installing the agent on EC2 instances.

When operating from a GuardDuty administrator account, I can enable GuardDuty ECS Runtime Monitoring at the organization level to monitor all ECS clusters in all organizations’ AWS accounts.

In this demo, I use the AWS Management Console to enable Runtime Monitoring. Enabling GuardDuty ECS Runtime Monitoring in the console has an effect on all your clusters.

When I want GuardDuty to automatically deploy the GuardDuty ECS Runtime Monitoring agent on Fargate, I enable GuardDuty agent management. To exclude individual clusters from automatic management, I can tag them with GuardDutyManaged=false. I make sure I tag my clusters before enabling ECS Runtime Monitoring in the console. When I don’t want to use the automatic management option, I can leave the option disabled and selectively choose the clusters to monitor with the tag GuardDutyManaged=true.

The Amazon ECS or AWS Fargate cluster administrator must have authorization to manage tags on the clusters.

The IAM TaskExecutionRole you attach to tasks must have permissions to download the GuardDuty agent from a private ECR repository. This is done automatically when you use the AmazonECSTaskExecutionRolePolicy managed IAM policy.

Here is my view of the console when the Runtime Monitoring and agent management are enabled.

guardduty ecs enbale monitoring

I can track the deployment of the security agent by assessing the Coverage statistics across all the ECS clusters.

guardduty ecs cluster coverage

Once monitoring is enabled, there is nothing else to do. Let’s see what findings it detects on my simple demo cluster.

Check out GuardDuty ECS runtime security findings
When GuardDuty ECS Runtime Monitoring detects potential threats, they appear in a list like this one.

ECS Runtime Monitoring - finding list

I select a specific finding to view more details about it.

ECS Runtime Monitoring - finding details

Things to know
By default, a Fargate task is immutable. GuardDuty won’t deploy the agent to monitor containers on existing tasks. If you want to monitor containers for already running tasks, you must stop and start the tasks after enabling GuardDuty ECS Runtime Monitoring. Similarly, when using Amazon ECS services, you must force a new deployment to ensure tasks are restarted with the agent. As I mentioned already, be sure the tasks have IAM permissions to download the GuardDuty monitoring agent from Amazon ECR.

We designed the GuardDuty agent to have little impact on performance, but you should plan for it in your Fargate task sizing calculations.

When you choose automatic agent management, GuardDuty also creates a VPC endpoint to allow the agent to communicate with GuardDuty APIs. When—just like me—you create your cluster with a CDK or CloudFormation script with the intention to delete the cluster after a period of time (for example, in a continuous integration scenario), bear in mind that the VPC endpoint must be deleted manually to allow CloudFormation to delete your stack.

Pricing and availability
You can now use GuardDuty ECS Runtime Monitoring on AWS Fargate and Amazon EC2 instances. For a full list of Regions where GuardDuty ECS Runtime Monitoring is available, visit our Region-specific feature availability page.

You can try GuardDuty ECS Runtime Monitoring for free for 30 days. When you enable GuardDuty for the first time, you have to explicitly enable GuardDuty ECS Runtime Monitoring. At the end of the trial period, we charge you per vCPU per hour of the monitoring agents. The GuardDuty pricing page has all the details.

Get insights about the threats to your container and enable GuardDuty ECS Runtime Monitoring today.

— seb

Introducing Amazon EC2 high memory U7i Instances for large in-memory databases (preview)

Post Syndicated from Jeff Barr original https://aws.amazon.com/blogs/aws/introducing-amazon-ec2-high-memory-u7i-instances-for-large-in-memory-databases-preview/

The new U7i instances are designed to support large, in-memory databases including SAP HANA, Oracle, and SQL Server. Powered by custom fourth generation Intel Xeon Scalable Processors (Sapphire Rapids), the instances are now available in multiple AWS regions in preview form, in the US West (Oregon), Asia Pacific (Seoul), and Europe (Frankfurt) AWS Regions, as follows:

Instance Name vCPUs
Memory (DDR5)
EBS Bandwidth
Network Bandwidth
u7in-16tb.224xlarge 896 16,384 GiB 100 Gbps 100 Gbps
u7in-24tb.224xlarge 896 24,576 GiB 100 Gbps 100 Gbps
u7in-32tb.224xlarge 896 32,768 GiB 100 Gbps 100 Gbps

We are also working on a smaller instance:

Instance Name vCPUs
Memory (DDR5)
EBS Bandwidth
Network Bandwidth
u7i-12tb.224xlarge 896 12,288 GiB 60 Gbps 100 Gbps

Here’s what 32 TiB of memory looks like:

And here are the 896 vCPUs (and lots of other info):

When compared to the first generation of High Memory instances, the U7i instances offer up to 125% more compute performance and up to 120% more memory performance. They also provide 2.5x as much EBS bandwidth, giving you the ability to hydrate in-memory databases at a rate of up to 44 terabytes per hour.

Each U7i instance supports attachment of up to 128 General Purpose (gp2 and gp3) or Provisioned IOPS (io1 and io2 Block Express) EBS volumes. Each io2 Block Express volume can be as big as 64 TiB and can deliver up to 256K IOPS at up to 32 Gbps, making them a great match for the U7i instance.

On the network side, the instances support ENA Express and deliver up to 25 Gbps of bandwidth per network flow.

Supported operating systems include Red Hat Enterprise Linux and SUSE Enterprise Linux Server.

Join the Preview
If you are ready to put the U7i instances to the test in your environment, join the preview.

Jeff;

Amazon Detective adds new capabilities to accelerate and improve your cloud security investigations

Post Syndicated from Sébastien Stormacq original https://aws.amazon.com/blogs/aws/amazon-detective-adds-investigations-and-finding-group-summaries-to-help-you-investigate-security-findings/

Today, Amazon Detective adds four new capabilities to help you save time and strengthen your security operations.

First, Detective investigations for IAM help security analysts investigate AWS Identity and Access Management (IAM) objects, such as users and roles, for indicators of compromise (IoCs) to determine potential involvement in known tactics from the MITRE ATT&CK framework. These automatic investigations are available in the Detective section of the AWS Management Console and through a new API to automate your analysis or incident response or to send these findings to other systems, such as AWS Security Hub or your SIEM.

Second, Detective finding group summaries uses generative artificial intelligence (AI) to enrich its investigations. It automatically analyzes finding groups and provides insights in natural language to accelerate security investigations. It provides a plain language title based on the analysis of the finding group with relevant summarized insights, such as describing the activity that initiated the event and its impact, if any. Finding group summaries handles the heavy lifting of analyzing the finding group built across multiple AWS data sources, making it easier and faster to investigate unusual or suspicious activity.

In addition to these two new capabilities that I describe in this post, Detective adds another two capabilities not covered here:

  • Detective now supports security investigations for threats detected by Amazon GuardDuty ECS Runtime Monitoring.
  • Detective now integrates with Amazon Security Lake, enabling security analysts to query and retrieve logs stored in Security Lake.

Amazon Detective makes it easier to analyze, investigate, and quickly identify the root cause of security findings or suspicious activities. Detective uses machine learning (ML), statistical analysis, and graph theory to help you visualize and conduct faster and more efficient security investigations. Detective automatically collects logs data and events from sources like AWS CloudTrail logs, Amazon Virtual Private Cloud (Amazon VPC) Flow Logs, Amazon GuardDuty findings, Amazon Elastic Kubernetes Service (Amazon EKS) audit logs, and AWS security findings. Detective maintains up to a year of aggregated data for analysis and investigations.

Cloud security professionals often find threat hunting and incident investigations to be resource-intensive and time-consuming. They must manually gather and analyze data from various sources to identify potential IAM-related threats. IAM investigations are particularly challenging due to dynamic cloud permissions and credentials. Analysts need to piece together data from different systems, including audit logs, entitlement reports, and CloudTrail events, which can be dispersed. Cloud permissions are often granted on-demand or through automation scripts, making authorization changes hard to track. Reconstructing activity timelines and identifying irregular entitlements can take hours or days, depending on complexity. Limited visibility into legacy systems and incomplete logs further complicates IAM investigations, making it difficult to obtain a definitive understanding of unauthorized access.

Detective investigations for IAM triage findings and surface only the most critical, suspicious issues, allowing security analysts to focus on high-level investigations. It automatically analyzes resources in your AWS environment to identify potential indicators of compromise or suspicious activity using machine learning and threat intelligence. This allows analysts to identify patterns and comprehend which resources are impacted by security events, offering a proactive approach to threat identification and mitigation.

The investigations are not only available in the console; you can use the new StartInvestigation API to automate a remediation workflow or collect information about all IP involved or AWS resources compromised. You can also use the API to feed the data to other systems to build a consolidated view of your security posture.

Finding group summaries evaluates the connections between security events across an environment and provides insights in natural language that link related threats, compromised resources, and malicious actor behavior. This narrative offers security analysts a comprehensive overview of security incidents that goes beyond individual service reports. By grouping and contextualizing data from multiple sources, finding group summaries identifies threats that might go unnoticed when insights are isolated. This approach improve the speed and efficiency of investigations and responses. Security analysts can utilize finding group summaries to gain a holistic understanding of security events and their interrelationships, helping them make informed decisions regarding containment and remediation.

Let’s see these two capabilities in action
In this demo, I start with Detective investigations for IAM in the Detective section of the console. The Detective dashboard shows me the number of investigations done and the number of IAM roles and users involved in suspicious activities.

Detective Automated Investifation - dashboard

From there, I drill down the list of investigations.

Detective Automated Investifation - list

And I select one specific investigation to get the details. There is a summary first.

Detective Automated Investifation - dashb

I scroll down the page to see what IP addresses are involved and for what type of activities. This example shows me a physical impossibility: the same IP was used in a short time from two different places, Australia and Japan.

Detective Automated Investifation - ip addresses

The most interesting section of the page, in my opinion, is the mappings to tactics, techniques, and procedures (TTP). All TTPs are classified according to their severity. The console shows the techniques and actions used. When selecting a specific TTP, I can see the details in the right pane. In this example, the suspicious IP address has been involved in more than 2,000 failed attempts to change the trusted policy of an IAM role.

Detective Automated Investifation - ttps

Finally, I navigate to the Indicators tab to see the list of indicators.

Detective Automated Investifation - indicators

On the other side, finding group summaries is available under Finding groups. I select a finding group to receive a natural language explanation of the findings and risks involved.

Detective Gen AI Findings

Pricing and availability
These two new capabilities are now available to all AWS customers.

Detective investigations for IAM is available in all AWS Regions where Detective is available. Finding group summaries is available in five AWS Regions: US East (N. Virginia), US West (Oregon), Asia Pacific (Singapore, Tokyo), and Europe (Frankfurt).

Learn all the details about Amazon Detective and get started today.

— seb

Top announcements of AWS re:Invent 2023

Post Syndicated from AWS Editorial Team original https://aws.amazon.com/blogs/aws/top-announcements-of-aws-reinvent-2023/

Welcome to Las Vegas, where excitement fills the air for the premier AWS event of the year – re:Invent 2023! Happening Nov. 27 – Dec. 1, re:Invent 2023 offers keynotes, training, Innovation Talks, AWS Builder Labs, and much more to inspire you on your cloud journey.

Can’t make it in person? Tune in to the live streams of the keynotes, and check back here as we provide daily updates on the most exciting product launches.

If you don’t want to miss a thing, here are a few more ways to keep in touch:

(This post was last updated: 5:05 p.m. PST, Nov. 26, 2023.)


Use natural language to query Amazon CloudWatch logs and metrics (preview)
To make it easy to interact with your operational data, Amazon CloudWatch is introducing natural language query generation for Logs and Metrics Insights.

Increase collaboration and securely share cloud knowledge with AWS re:Post Private
re:Post Private includes content tailored specifically for your organization’s use cases, along with private discussion and collaboration forums for the members of your organization and your AWS account team.

Use anomaly detection with AWS Glue to improve data quality (preview)
This new feature will help to improve your data quality by using machine learning to detect statistical anomalies and unusual patterns.

Mutual authentication for Application Load Balancer reliably verifies certificate-based client identities
With this new feature, you can now offload client authentication to Application Load Balancer, ensuring only trusted clients communicate with backend applications.

Check your AWS Free Tier usage programmatically with a new API
You can use the API directly with the AWS Command Line Interface or integrate it into an application with the AWS SDKs.

Use Amazon CloudWatch to consolidate hybrid, multicloud, and on-premises metrics
You can now consolidate metrics from your hybrid, multicloud, and on-premises data sources using Amazon CloudWatch and process them in a consistent, unified fashion.

Announcing cross-region data replication for Amazon WorkSpaces
Snapshots are taken every 12 hours, replicated to the desired destination region, and are used to provide a recovery point objective of 12-24 hours.

Amazon Transcribe Call Analytics adds new generative AI-powered call summaries (preview)
Powered by Amazon Bedrock, this feature helps businesses improve customer experience, and agent and supervisor productivity by automatically summarizing customer service calls.

Build generative AI apps using AWS Step Functions and Amazon Bedrock
Step Functions provides two new optimized API actions for Amazon Bedrock: InvokeModel and CreateModelCustomizationJob.

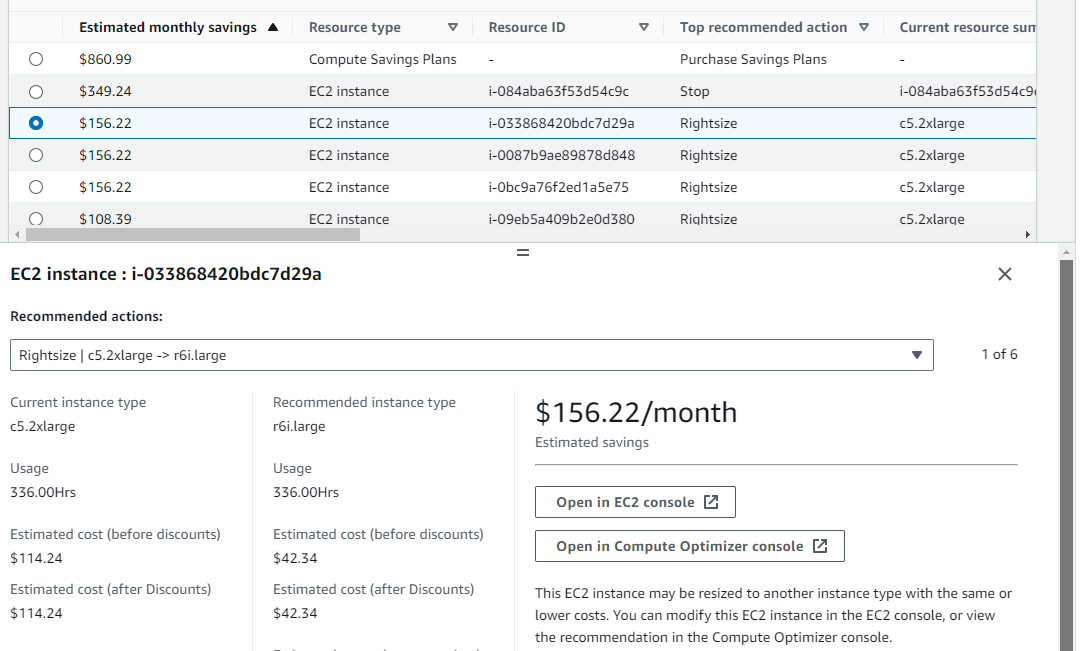
New Cost Optimization Hub centralizes recommended actions to save you money
This new AWS Billing and Cost Management feature makes it easy for you to identify, filter, aggregate, and quantify savings for AWS cost optimization recommendations.

Amazon CloudWatch Logs now offers automated pattern analytics and anomaly detection
Amazon CloudWatch can now automatically recognize and cluster patterns among log records, extract noteworthy content and trends, and notify you of anomalies using advanced machine learning algorithms.

Amazon Managed Service for Prometheus collector provides agentless metric collection for Amazon EKS
This new capability discovers and collects Prometheus metrics from Amazon Elastic Kubernetes Service (Amazon EKS) automatically and without an agent.

Optimize your storage costs for rarely-accessed files with Amazon EFS Archive
We’ve added a new storage class for Amazon Elastic File System optimized for long-lived data that is rarely accessed.

New Amazon CloudWatch log class for infrequent access logs at a reduced price
This new log class offers a tailored set of capabilities at a lower cost for infrequently accessed logs, enabling customers to consolidate all their logs in one place in a cost-effective manner.

Use natural language to query Amazon CloudWatch logs and metrics (preview)

Post Syndicated from Danilo Poccia original https://aws.amazon.com/blogs/aws/use-natural-language-to-query-amazon-cloudwatch-logs-and-metrics-preview/

To make it easy to interact with your operational data, Amazon CloudWatch is introducing today natural language query generation for Logs and Metrics Insights. With this capability, powered by generative artificial intelligence (AI), you can describe in English the insights you are looking for, and a Logs or Metrics Insights query will be automatically generated.

This feature provides three main capabilities for CloudWatch Logs and Metrics Insights:

  • Generate new queries from a description or a question to help you get started easily.
  • Query explanation to help you learn the language including more advanced features.
  • Refine existing queries using guided iterations.

Let’s see how these work in practice with a few examples. I’ll cover logs first and then metrics.

Generate CloudWatch Logs Insights queries with natural language
In the CloudWatch console, I select Log Insights in the Logs section. I then select the log group of an AWS Lambda function that I want to investigate.

I choose the Query generator button to open a new Prompt field where I enter what I need using natural language:

Tell me the duration of the 10 slowest invocations

Then, I choose Generate new query. The following Log Insights query is automatically generated:

fields @timestamp, @requestId, @message, @logStream, @duration 
| filter @type = "REPORT" and @duration > 1000
| sort @duration desc
| limit 10

Console screenshot.

I choose Run query to see the results.

Console screenshot.

I find that now there’s too much information in the output. I prefer to see only the data I need, so I enter the following sentence in the Prompt and choose Update query.

Show only timestamps and latency

The query is updated based on my input and only the timestamp and duration are returned:

fields @timestamp, @duration 
| filter @type = "REPORT" and @duration > 1000
| sort @duration desc
| limit 10

I run the updated query and get a result that is easier for me to read.

Console screenshot.

Now, I want to know if there are any errors in the log. I enter this sentence in the Prompt and generate a new query:

Count the number of ERROR messages

As requested, the generated query is counting the messages that contain the ERROR string:

fields @message
| filter @message like /ERROR/
| stats count()

I run the query and find out that there are more errors than I expected. I need more information.

Console screenshot.

I use this prompt to update the query and get a better distribution of the errors:

Show the errors per hour

The updated query uses the bin() function to group the result in one hour intervals.

fields @timestamp, @message
| filter @message like /ERROR/
| stats count(*) by bin(1h)

Let’s see a more advanced query about memory usage. I select the log groups of a few Lambda functions and type:

Show invocations with the most over-provisioned memory grouped by log stream

Before generating the query, I choose the gear icon to toggle the options to include my prompt and an explanation as comment. Here’s the result (I split the explanation over multiple lines for readability):

# Show invocations with the most over-provisioned memory grouped by log stream

fields @logStream, @memorySize/1000/1000 as memoryMB, @maxMemoryUsed/1000/1000 as maxMemoryUsedMB, (@memorySize/1000/1000 - @maxMemoryUsed/1000/1000) as overProvisionedMB 
| stats max(overProvisionedMB) as maxOverProvisionedMB by @logStream 
| sort maxOverProvisionedMB desc

# This query finds the amount of over-provisioned memory for each log stream by
# calculating the difference between the provisioned and maximum memory used.
# It then groups the results by log stream and calculates the maximum
# over-provisioned memory for each log stream. Finally, it sorts the results
# in descending order by the maximum over-provisioned memory to show
# the log streams with the most over-provisioned memory.

Now, I have the information I need to understand these errors. On the other side, I also have EC2 workloads. How are those instances running? Let’s look at some metrics.

Generate CloudWatch Metrics Insights queries with natural language
In the CloudWatch console, I select All metrics in the Metrics section. Then, in the Query tab, I use the Editor. If you prefer, the Query generator is available also in the Builder.

I choose Query generator like before. Then, I enter what I need using plain English:

Which 10 EC2 instances have the highest CPU utilization?

I choose Generate new query and get a result using the Metrics Insights syntax.

SELECT AVG("CPUUtilization")
FROM SCHEMA("AWS/EC2", InstanceId)
GROUP BY InstanceId
ORDER BY AVG() DESC
LIMIT 10

To see the graph, I choose Run.

Console screenshot.

Well, it looks like my EC2 instances are not doing much. This result shows how those instances are using the CPU, but what about storage? I enter this in the prompt and choose Update query:

How about the most EBS writes?

The updated query replaces the average CPU utilization with the sum of bytes written to all EBS volumes attached to the instance. It keeps the limit to only show the top 10 results.

SELECT SUM("EBSWriteBytes")
FROM SCHEMA("AWS/EC2", InstanceId)
GROUP BY InstanceId
ORDER BY SUM() DESC
LIMIT 10

I run the query and, by looking at the result, I have a better understanding of how storage is being used by my EC2 instances.

Try entering some requests and run the generated queries over your logs and metrics to see how this works with your data.

Things to know
Amazon CloudWatch natural language query generation for logs and metrics is available in preview in the US East (N. Virginia) and US West (Oregon) AWS Regions.

There is no additional cost for using natural language query generation during the preview. You only pay for the cost of running the queries according to CloudWatch pricing.

Generated queries are produced by generative AI and dependent on factors including the data selected and available in your account. For these reasons, your results may vary.

When generating a query, you can include your original request and an explanation of the query as comments. To do so, choose the gear icon in the bottom right corner of the query edit window and toggle those options.

This new capability can help you generate and update queries for logs and metrics, saving you time and effort. This approach allows engineering teams to scale their operations without worrying about specific data knowledge or query expertise.

Use natural language to analyze your logs and metrics with Amazon CloudWatch.

Danilo

Increase collaboration and securely share cloud knowledge with AWS re:Post Private

Post Syndicated from Sébastien Stormacq original https://aws.amazon.com/blogs/aws/increase-collaboration-and-securely-share-cloud-knowledge-with-aws-repost-private/

Today we’re launching AWS re:Post Private, a fully managed knowledge service to accelerate cloud adoption, improve productivity, and drive innovation. re:Post Private allows organizations to increase collaboration and access knowledge resources built for your cloud community. It includes curated collections of technical content and training materials from AWS. The content is tailored specifically for your organization’s use cases, along with private discussion and collaboration forums for the members of your organization and your AWS account team.

As its name implies, you can think of it as a private version of AWS re:Post, with private content and access limited to people that belong to your organization and your AWS Account team.

Organizations of all sizes and verticals are increasingly moving their operations to the cloud. To ensure cloud adoption success, organizations must have the right skills and structure in place. The optimal way to achieve this is by setting up a centralized cloud center of excellence (CCOE). A CCOE is a centralized governance function for the organization and acts in a consultative role for central IT, business-unit IT, and cloud service consumers in the business. According to Gartner, a CCOE has three pillars: governance, brokerage, and community. The community pillar establishes the cloud community of practice (COP) that brings together stakeholders and facilitates cloud collaboration. It helps organizations adapt themselves for cloud adoption by promoting COP member interaction and facilitating cloud-related training and skills development.

AWS re:Post Private facilitates the creation, structure, and management of an internal cloud community of practice. It allows you to build a custom knowledge base that is searchable, reusable, and scalable. It allows community members to post private questions and answers and publish articles. It combines the benefits of traditional forums, such as community discussion and collaboration, with the benefits of an integrated information experience.

AWS re:Post Private is a fully managed service: there is no need to operate complex knowledge management and collaboration technologies or to develop custom solutions.

AWS re:Post Private also facilitates your interactions with AWS Support. You can create a support case directly from your private re:Post, and you can convert case resolution to reusable knowledge visible to all in your organization.

You choose in which AWS Region re:Post Private stores your data and who has access. All data at rest and in transit is encrypted using industry-standard algorithms. Your administrator chooses between using AWS-managed encryption keys or keys you manage and control.

Your organization’s Technical Account Managers are automatically added to your private re:Post. You can select other persons to invite among your organization and AWS teams, such as your AWS Solutions Architect. Only your private re:Post administrators need an AWS account. All other users can federate from your organization’s identity provider, such as Microsoft Active Directory.

Let’s see how to create a re:Post Private
To get started with AWS re:Post Private, as an administrator, I point my browser to the re:Post section of the AWS Management Console. I select Create private re:Post and enter the information needed to create a private re:Post for my organization, my team, or my project.

AWS re:Post Private - create 1

I can choose the Data encryption parameters and whether or not I enable Service access for Support case integration. When I’m ready, I select Create this re:Post.

AWS re:Post Private - create 2

Once the private re:Post is created, I can grant access to users and groups. User and group information comes from AWS IAM Identity Center and your identity provider. Invited users receive an email inviting them to connect to the private re:Post and create their profile.

That’s pretty much it for the administrator part. Once the private re:Post is created, I receive an endpoint name that I can share with the rest of my organization.

Let’s see how to use re:Post Private
As a member of the organization, I navigate to re:Post Private using the link I received from the administrator. I authenticate with the usual identity service of my organization, and I am redirected to the re:Post Private landing page.

On the top menu, I can select a tab to view the contents for Questions, Community Articles, Selections, Tags, Topics, Community Groups, or My Dashboard. This should be familiar if you already use the public knowledge service AWS re:Post that adopted a similar structure.

AWS re:Post Private - Landing page 1

Further down on the page, I see the popular topics and the top contributors in my organization.I also have access to Questions and Community Groups. I can search the available content by keyword, tags, author, and so on.

AWS re:Post Private - Landing page 2

AWS re:Post Private - Landing page 3

Pricing and availability
You can create your organization’s AWS re:Post Private in the following AWS Regions: US West (Oregon) and Europe (Frankfurt).

AWS re:Post Private is available to customers having an AWS Enterprise or Enterprise On-Ramp support plan. re:Post Private offers a free tier that allows you to explore and try out standard capabilities for six months. There is no limit on the number of users in the free tier, and content storage is limited to 10 GB. When you reach the free storage limit, the plan is converted to the paid standard tier.

With AWS re:Post Private Standard tier, you only pay for what you use. We charge based on the number of users per month. Please visit the re:Post Private pricing page for more information.

Get started today and activate AWS re:Post Private for your organization.

— seb

Use anomaly detection with AWS Glue to improve data quality (preview)

Post Syndicated from Jeff Barr original https://aws.amazon.com/blogs/aws/use-anomaly-detection-with-aws-glue-to-improve-data-quality-preview/

We are launching a preview of a new AWS Glue Data Quality feature that will help to improve your data quality by using machine learning to detect statistical anomalies and unusual patterns. You get deep insights into data quality issues, data quality scores, and recommendations for rules that you can use to continuously monitor for anomalies, all without having to write any code.

Data quality counts
AWS customers already build data integration pipelines to extract and transform data. They set up data quality rules to ensure that the resulting data is of high quality and can be used to make accurate business decisions. In many cases, these rules assess the data based on criteria that were chosen and locked in at a specific point in time, reflecting the current state of the business. However, as the business environment changes and the properties of the data shift, the rules are not always reviewed and updated.

For example, a rule could be set to verify that daily sales are at least ten thousand dollars for an early-stage business. As the business succeeds and grows, the rule should be checked and updated from time to time, but in practice this rarely happens. As a result, if there’s an unexpected drop in sales, the outdated rule does not activate, and no one is happy.

Anomaly detection in action
To detect unusual patterns and to gain deeper insights into data, organizations try to create their own adaptive systems or turn to costly commercial solutions that require specific technical skills and specialized business knowledge.

To address this widespread challenge, Glue Data Quality now makes use of machine learning (ML).

Once activated, this cool new addition to Glue Data Quality gathers statistics as fresh data arrives, using ML and dynamic thresholds to learn from past patterns while looking outliers and unusual data patterns. This process produces observations and also visualizes trends so that you can quickly gain a better understanding of the anomaly.

You will also get rule recommendations as part of the Observations, and you can easily and progressively add them to your data pipelines. Rules can enforce an action such as stopping your data pipelines. In the past, you could only write static rules. Now, you can write Dynamic rules that have auto-adjusting thresholds and AnomalyDetection Rules that grasp recurring patterns and spot deviations. When you use rules as part of data pipelines, they can stop the data flow so that a data engineer can review, fix and resume.

To use anomaly detection, I add an Evaluate Data Quality node to my job:

I select the node and click Add analyzer to choose a statistic and the columns:

Glue Data Quality learns from the data to recognize patterns and then generates observations that will be shown in the Data quality tab:

And a visualization:

After I review the observations I add new rules. The first one sets adaptive thresholds that check the row count is between the smallest of the last 10 runs and the largest of the last 20 runs. The second one looks for unusual patters, for example RowCount being abnormally high on weekends:

Join the preview
This new capability is available in preview in the following AWS Regions: US East (Ohio), US East (N. Virginia), US West (Oregon), Asia Pacific (Tokyo), and Europe (Ireland). To learn more, read Data Quality Anomaly Detection]].

Stay tuned for a detailed blog post when this feature launches!

Learn more

Data Quality Anomaly Detection

Jeff;

Mutual authentication for Application Load Balancer reliably verifies certificate-based client identities

Post Syndicated from Channy Yun original https://aws.amazon.com/blogs/aws/mutual-authentication-for-application-load-balancer-to-reliably-verify-certificate-based-client-identities/

Today, we are announcing support for mutually authenticating clients that present X509 certificates to Application Load Balancer. With this new feature, you can now offload client authentication to the load balancer, ensuring only trusted clients communicate with their backend applications. This new capability is built on S2N, AWS’s open source Transport Layer Security (TLS) implementation that provides strong encryption and protections against zero-day vulnerabilities, which developers can trust.

Mutual authentication (mTLS) is commonly used for business-to-business (B2B) applications such as online banking, automobile, or gaming devices to authenticate devices using digital certificates. Companies typically use it with a private certificate authority (CA) to authenticate their clients before granting access to data and services.

Customers have implemented mutual authentication using self-created or third-party solutions that require additional time and management overhead. These customers spend their engineering resources to build the functionality into their backend, update their code to keep up with the latest security patches, and invest heavily in infrastructure to create and rotate certificates.

With mutual authentication on Application Load Balancer, you have a fully managed, scalable, and cost-effective solution that enables you to use your developer resources to focus on other critical projects. Your ALB will authenticate clients with revocation checks and pass client certificate information to the target, which can be used for authorization by applications.

Getting started with mutual authentication on ALB
To enable mutual authentication on ALB, choose Create Application Load Balancer by the ALB wizard on Amazon EC2 console. When you select HTTPS in the Listeners and routing section, you can see more settings such as security policy, default server certificate, and a new client certificate handling option to support mutual authentication.

With Mutual authentication (mTLS) enabled, you can configure how listeners handle requests that present client certificates. This includes how your Application Load Balancer authenticates certificates and the amount of certificate metadata that is sent to your backend targets.

Mutual authentication has two options. The Passthrough option sends all the client certificate chains received from the client to your backend application using HTTP headers. The mTLS-enabled Application Load Balancer gets the client certificate in the handshake, establishes a TLS connection, and then sends whatever it gets in HTTPS headers to the target application. The application will need to verify the client certificate chain to authenticate the client.

With the Verify with trust store option, Application Load Balancer and client verify each other’s identity and establish a TLS connection to encrypt communication between them. We introduce a new trust store feature, and you can upload any CA bundle with roots and/or intermediate certificates generated by AWS Private Certificate Authority or any other third party CA as the source of trust to validate your client certificates.

It requires selecting an existing trust store or creating a new one. Trust stores contain your CAs, trusted certificates, and, optionally, certificate revocation lists (CRLs). The load balancer uses a trust store to perform mutual authentication with clients.

To use this option and create a new trust store, choose Trust Stores in the left menu of the Amazon EC2 console and choose Create trust store.

You can choose a CA certificate bundle in PEM format and, optionally, CRLs from your Amazon Simple Storage Service (Amazon S3) bucket. A CA certificate bundle is a group of CA certificates (root or intermediate) used by a trust store. CRLs can be used when a CA revokes client certificates that have been compromised, and you need to reject those revoked certificates. You can replace a CA bundle, and add or remove CRLs from the trust store after creation.

You can use the AWS Command Line Interface (AWS CLI) with new APIs such as create-trust-store to upload CA information, configure the mutual-authentication-mode on the Application Load Balancer listener, and send user certificate information to targets.

$ aws elbv2 create-trust-store --name my-tls-name \
    --ca-certificates-bundle-s3-bucket channy-certs \
    --ca-certificates-bundle-s3-key Certificates.pem \
    --ca-certificates-bundle-s3-object-version <version>
>> arn:aws:elasticloadbalancing:root:file1
$ aws elbv2 create-listener --load balancer-arn <value> \
    --protocol HTTPS \
    --port 443 \
    --mutual-authentication Mode=verify,
      TrustStoreArn=<arn:aws:elasticloadbalancing:root:file1>

If you already have your own private CA, such as AWS Private CA, third-party CA, or self-signed CA, you can upload their CA bundle or CRLs to the Application Load Balancer trust store to enable mutual authentication.

To test the mutual authentication on Application Load Balancer, follow the step-by-step instructions to make a self-signed CA bundle and client certificate using OpenSSL, upload them to the Amazon S3 bucket, and use them with an ELB trust store.

You can use curl with the --key and --cert parameters to send the client certificate as part of the request:

$ curl --key my_client.key --cert my_client.pem https://api.yourdomain.com

Mutual authentication can fail if a client presents an invalid or expired certificate, fails to present a certificate, cannot find a trust chain, or if any links in the trust chain have expired, or the certificate is on the revocation list.

Application Load Balancer will close the connections whenever it fails to authenticate a client and will record new connection logs that capture detailed information about requests sent to your load balancer. Each log contains information such as the client’s IP address, handshake latency, TLS cipher used, and client certificate details. You can use these connection logs to analyze request patterns and troubleshoot issues.

To learn more, see Mutual authentication on Application Load Balancer in the AWS documentation.

Now available
Mutual authentication on Application Load Balancer is now available in all commercial AWS Regions where Application Load Balancer is available, except China. With no upfront costs or commitments required, you only pay for what you use. To learn more, see the Elastic Load Balancing pricing page.

Give it a try now and send feedback to AWS re:Post for Amazon EC2 or through your usual AWS Support contacts.

Learn more:
Application Load Balancer product page

Channy

Use Amazon CloudWatch to consolidate hybrid, multicloud, and on-premises metrics

Post Syndicated from Jeff Barr original https://aws.amazon.com/blogs/aws/new-use-amazon-cloudwatch-to-consolidate-hybrid-multi-cloud-and-on-premises-metrics/

You can now consolidate metrics from your hybrid, multicloud, and on-premises data sources using Amazon CloudWatch and process them in a consistent, unified fashion. You can query, visualize, and alarm on any and all of the metrics, regardless of their source. In addition to giving you a unified view, this new feature will help you to identify trends and issues that span multiple parts and aspects of your infrastructure.

When I first heard about this new feature, I thought, “Wait, I can do that with PutMetricData, what’s the big deal?” Quite a bit, as it turns out. PutMetricData stores the metrics in CloudWatch, but this cool new feature fetches them on demand, directly from the source.

Instead of storing data, you select and configure connectors that pull data from Amazon Managed Service for Prometheus, generic Prometheus, Amazon OpenSearch Service, Amazon RDS for MySQL, Amazon RDS for PostgreSQL, CSV files stored in Amazon Simple Storage Service (Amazon S3), and Microsoft Azure Monitor. Each connector is a AWS Lambda function that is deployed from a AWS CloudFormation template. CloudWatch invokes the appropriate Lambda functions as needed and makes use of the returned metrics immediately — they are not buffered or kept around.

Creating and using connectors
To get started I open the CloudWatch Console, click All metrics, and activate the Multi source query tab, then I click Create and manage data sources:

And then I do it again:

Then I choose a data source type:

CloudWatch will then prompt me for the details that it needs to create and set up the connector for my data source. For example, if I select Amazon RDS – MySQL, I give my data source a name, choose the RDS database instance, and specify the connection info:

When I click Create data source, a Lambda function, a Lambda Permission, an IAM role, a Secrets Manager Secret, a Log Group, and a AWS CloudFormation Stack will be created in my account:

Then, when I am ready to reference the data source and make use of the metrics that it provides, I enter a SQL query that returns timestamps and values for the metric:

Inside the Lambda function
The code for the Custom – getting started template is short, simple, and easy to understand. It implements handlers for two events:

DescribeGetMetricData – This handler returns a string that includes the name of the connector, default values for the arguments to the other handler, and a text description in Markdown format that is displayed in the custom data source query builder in the CloudWatch console.

GetMetricData – This handler returns a metric name, 1-dimensional array of timestamps and metric values, all for a time range that is provided as arguments to the handler.

If you spend a few minutes examining this code you should be able to see how to write functions to connect to your own data sources.

Things to know
Here are a couple of things to keep in mind about this powerful new feature:

Regions – You can create and use data connectors in all commercial AWS Regions; a connector that is running in one region can connect to and retrieve data from services and endpoints in other regions and other AWS accounts.

Pricing – There is no extra charge for the connectors. You pay for the invocations of the Lambda functions and for any other AWS infrastructure that you create.

Jeff;

Announcing cross-region data replication for Amazon WorkSpaces

Post Syndicated from Jeff Barr original https://aws.amazon.com/blogs/aws/cross-region-data-replication-for-amazon-workspaces/

You can now use cross-region data replication to provide business continuity for your Amazon WorkSpaces users. Snapshots are taken every 12 hours, replicated to the desired destination region, and are used to provide a recovery point objective (RPO) of 12-24 hours.

Multi-Region Resilience Review
In her 2022 post Advancing business continuity with Amazon WorkSpaces Multi-Region Resilience, my colleague Ariel introduced you to the initial version of this feature and showed you how to use it to set up standby virtual desktops available for your users. After it has been set up, users log in with Amazon WorkSpaces registration codes that include fully qualified domain names (FQDNs). If the WorkSpaces in the primary region are unavailable, the users are redirected to standby WorkSpaces in the secondary region.

The standby WorkSpaces are available for a small, fixed monthly fee for infrastructure and storage, with a low flat rate change for each hour of usage during the month. Together, this feature and this business model make it easy and economical for you to maintain a standby deployment.

Cross-Region Data Replication
Today we are making this feature even more powerful by adding one-way cross-region data replication. Applications, documents, and other resources stored on the primary WorkSpace are snapshotted every 12 hours and copied to the region hosting the secondary WorkSpace. You get an additional layer of redundancy, enhanced data protection, and can minimize productivity that would otherwise be lost to disruptions. This is particularly helpful if users have installed and configured applications on top of the base image since they won’t have to repeat these steps on the secondary WorkSpace.

Here’s how it all works:

Normal Operation – During normal operation, the users in your WorkSpaces fleet are using the primary region. EBS snapshots of the system (C:) and data (D:) drives are created every 12 hours. Multi-Region Resilience runs in the secondary region and checks for fresh snapshots regularly. When it finds them, it initiates a copy to the secondary region. As the copies arrive in the secondary region they are used to update the secondary WorkSpace.

Failover Detection – As part of the setup process, you will follow Configure your DNS service and setup DNS routing policies to set up DNS routing policies and optional Amazon Route 53 health checks to manage cross-Region redirection.

Failover – If a large-scale event (LSE) affects the primary region and the primary WorkSpace, the failover detection that I just described goes in to effect. When users try to reconnect, they are redirected to the secondary region, the latest snapshots are used to launch a WorkSpace for them, and they are back up and running with access to data and apps that are between 12 and 24 hours old.

Failback – At the conclusion of the LSE, the users manually back up any data that they have created on the secondary WorkSpace and log out of it. Then they log in again, and this time they will be directed to the primary region and WorkSpace, where they can restore their backups and continue to work.

Getting Set Up
As a WorkSpaces administrator, I start by locating the desired primary WorkSpace:

I select it and choose Create Standby WorkSpaces from the Actions menu:

I select the desired region for the secondary WorkSpace and click Next:

Then I choose the right directory in the region, and again click Next:

If the primary WorkSpace is encrypted, I must enter the ARN of the KMS key in the secondary region (or, even better, use a multi-Region key). I check Enable data replication and confirm that I am authorizing an additional monthly charge:

On the next page I review my choices and click Create to initiate the creation of the secondary WorkSpace in the region that I selected.

As mentioned earlier I also need to set up Multi-Region Resilience. This includes setting up a domain name to use as a WorkSpaces registration code, setting up Route 53 health checks, and using them to power routing policies.

Things to Know
Here are a couple of important things to know about Cross-Region Data Replication:

Directories – You can use a self-managed Active Directory, AWS Managed AD or AD Connector configured as described in this post. Simple AD is not supported.

Snapshots – The first-ever EBS snapshot for a particular data volume is full, and subsequent snapshots are incremental. As a result, the first replication for a given WorkSpace will likely take longer than subsequent ones. Snapshots are initiated on a schedule that is internal to WorkSpaces and you cannot control the timing.

Encryption – You can use this feature with Encrypted WorkSpaces as long as you use the same AWS Key Management Service (AWS KMS) keys in the primary and secondary regions. You can also use multi-Region keys.

Bundles – You can use the Windows 10 and Windows 11 bundles, and you can also BYOL.

Accounts – Every AWS account has a fixed limit on the number of pending EBS snapshots. This may affect your ability to use this feature with large fleets of WorkSpaces.

Pricing – You pay a fixed monthly fee based on the amount of storage configured for each primary WorkSpace. See the Amazon WorkSpaces Pricing page for more information.

Jeff;

Amazon Transcribe Call Analytics adds new generative AI-powered call summaries (preview)

Post Syndicated from Veliswa Boya original https://aws.amazon.com/blogs/aws/amazon-transcribe-call-analytics-adds-new-generative-ai-powered-call-summaries-preview/

We are announcing generative artificial intelligence (AI)-powered call summarization in Amazon Transcribe Call Analytics in preview. Powered by Amazon Bedrock, this feature helps businesses improve customer experience, and agent and supervisor productivity by automatically summarizing customer service calls. Amazon Transcribe Call Analytics provides machine learning (ML)-powered analytics that allows contact centers to understand the sentiment, trends, and policy compliance of customer conversations to improve their experience and identify crucial feedback. A single API call is all it takes to extract transcripts, rich insights, and summaries from your customer conversations.

We understand that as a business, you want to maintain an accurate historical record of key conversation points, including action items associated with each conversation. To do this, agents summarize notes after the conversation has ended and enter these in their CRM system, a process that is time-consuming and subject to human error. Now imagine the customer trust erosion that follows when the agent fails to correctly capture and act upon important action items discussed during conversations.

How it works
Starting today, to assist agents and supervisors with the summarization of customer conversations, Amazon Transcribe Call Analytics will generate a concise summary of a contact center interaction that captures key components such as why the customer called, how the issue was addressed, and what follow-up actions were identified. After completing a customer interaction, agents can directly proceed to help the next customer since they don’t have to summarize a conversation, resulting in reduced customer wait times and improved agent productivity. Further, supervisors can review the summary when investigating a customer issue to get a gist of the conversation, without having to listen to the entire call recording or read the transcript.

Exploring Amazon Transcribe Call Analytics in the console
To see how this works visually, I first create an Amazon Simple Storage Service (Amazon S3) bucket in the relevant AWS Region. I then upload the audio file to the S3 bucket.

Audio file in S3 bucket

To create an analytics job that transcribes the audio and provides additional analytics about the conversation that the customer and the agent were having, I go to the Amazon Transcribe Call Analytics console. I select Post-call Analytics in the left hand navigation bar and then choose Create job.

Create Post-call analytics job

Next I enter a job name making sure to keep the language settings based on the language in the audio file.

Job settings

In the Amazon S3 URI path, I provide the link to the audio file uploaded in the first screenshot shown in this post.

Audio file details

In Role name, I select Create an IAM role which will have access to the Amazon S3 bucket, then choose Next.

Create IAM Role

I enable Generative call summarization, and then choose Create job.

Configure job

After a few minutes, the job’s status will change from In progress to Complete, indicating that it was completed successfully.

Job status

Select the job, and the next screen will show the transcript and a new tab, Generative call summarization – preview.

You can also download the transcript to view the analytics and summary.

Now available
Generative call summarization in Amazon Transcribe Call Analytics is available today in English in US East (N. Virginia) and US West (Oregon).

With generative call summarization in Amazon Transcribe Call Analytics, you pay as you go and are billed monthly based on tiered pricing. For more information, see Amazon Transcribe pricing.

Learn more:

Veliswa

Build generative AI apps using AWS Step Functions and Amazon Bedrock

Post Syndicated from Marcia Villalba original https://aws.amazon.com/blogs/aws/build-generative-ai-apps-using-aws-step-functions-and-amazon-bedrock/

Today we are announcing two new optimized integrations for AWS Step Functions with Amazon Bedrock. Step Functions is a visual workflow service that helps developers build distributed applications, automate processes, orchestrate microservices, and create data and machine learning (ML) pipelines.

In September, we made available Amazon Bedrock, the easiest way to build and scale generative artificial intelligence (AI) applications with foundation models (FMs). Bedrock offers a choice of foundation models from leading providers like AI21 Labs, Anthropic, Cohere, Stability AI, and Amazon, along with a broad set of capabilities that customers need to build generative AI applications, while maintaining privacy and security. You can use Amazon Bedrock from the AWS Management Console, AWS Command Line Interface (AWS CLI), or AWS SDKs.

The new Step Functions optimized integrations with Amazon Bedrock allow you to orchestrate tasks to build generative AI applications using Amazon Bedrock, as well as to integrate with over 220 AWS services. With Step Functions, you can visually develop, inspect, and audit your workflows. Previously, you needed to invoke an AWS Lambda function to use Amazon Bedrock from your workflows, adding more code to maintain them and increasing the costs of your applications.

Step Functions provides two new optimized API actions for Amazon Bedrock:

  • InvokeModel – This integration allows you to invoke a model and run the inferences with the input provided in the parameters. Use this API action to run inferences for text, image, and embedding models.
  • CreateModelCustomizationJob – This integration creates a fine-tuning job to customize a base model. In the parameters, you specify the foundation model and the location of the training data. When the job is completed, your custom model is ready to be used. This is an asynchronous API, and this integration allows Step Functions to run a job and wait for it to complete before proceeding to the next state. This means that the state machine execution will pause while the create model customization job is running and will resume automatically when the task is complete.

Optimized connectors

The InvokeModel API action accepts requests and responses that are up to 25 MB. However, Step Functions has a 256 kB limit on state payload input and output. In order to support larger payloads with this integration, you can define an Amazon Simple Storage Service (Amazon S3) bucket where the InvokeModel API reads data from and writes the result to. These configurations can be provided in the parameters section of the API action configuration parameters section.

How to get started with Amazon Bedrock and AWS Step Functions
Before getting started, ensure that you create the state machine in a Region where Amazon Bedrock is available. For this example, use US East (N. Virginia), us-east-1.

From the AWS Management Console, create a new state machine. Search for “bedrock,” and the two available API actions will appear. Drag the InvokeModel to the state machine.

Using the invoke model connector

You can now configure that state in the menu on the right. First, you can define which foundation model you want to use. Pick a model from the list, or get the model dynamically from the input.

Then you need to configure the model parameters. You can enter the inference parameters in the text box or load the parameters from Amazon S3.

Configuration for the API Action

If you keep scrolling in the API action configuration, you can specify additional configuration options for the API, such as the S3 destination bucket. When this field is specified, the API action stores the API response in the specified bucket instead of returning it to the state output. Here, you can also specify the content type for the requests and responses.

Additional configuration for the connector

When you finish configuring your state machine, you can create and run it. When the state machine runs, you can visualize the execution details, select the Amazon Bedrock state, and check its inputs and outputs.

Executing the state machine

Using Step Functions, you can build state machines as extensively as you need, combining different services to solve many problems. For example, you can use Step Functions with Amazon Bedrock to create applications using prompt chaining. This is a technique for building complex generative AI applications by passing multiple smaller and simpler prompts to the FM instead of a very long and detailed prompt. To build a prompt chain, you can create a state machine that calls Amazon Bedrock multiple times to get an inference for each of the smaller prompts. You can use the parallel state to run all these tasks in parallel and then use an AWS Lambda function that unifies the responses of the parallel tasks into one response and generates a result.

Available now
AWS Step Functions optimized integrations for Amazon Bedrock are limited to the AWS Regions where Amazon Bedrock is available.

You can get started with Step Functions and Amazon Bedrock by trying out a sample project from the Step Functions console.

Marcia

New Cost Optimization Hub centralizes recommended actions to save you money

Post Syndicated from Channy Yun original https://aws.amazon.com/blogs/aws/new-cost-optimization-hub-to-find-all-recommended-actions-in-one-place-for-saving-you-money/

Today, we are announcing Cost Optimization Hub, a new AWS Billing and Cost Management feature that makes it easy for you to identify, filter, aggregate, and quantify savings for AWS cost optimization recommendations.

With the new Cost Optimization Hub, you can interactively query cost optimization recommendations such as idle resource detection, resource rightsizing, and purchasing options across multiple AWS Regions and AWS accounts in your organizations without any data aggregation and processing. You can find out how much you’ll save if you implement those recommendations and easily compare and prioritize recommendations by savings.

Andy Jassy, CEO of Amazon, told shareholders, “We’re trying to build customer relationships (and a business) that outlast all of us, and as a result, our AWS sales and support teams are spending much of their time helping customers optimize their AWS spend so they can better weather this uncertain economy” in his 2022 Letter to Shareholders.

Cost Optimization Hub gathers all cost-optimizing recommended actions across AWS Cloud Financial Management (CFM) services, including AWS Cost Explorer and AWS Compute Optimizer, in one place. It incorporates customer-specific pricing and discounts into these recommendations, and it deduplicates findings and savings to give a consolidated view of your cost optimization opportunities.

If you are a FinOps team or infrastructure management team member who wants to understand your cost optimization opportunities in aggregate, such as which AWS accounts or AWS Regions have the most cost optimization opportunities, you should start with Cost Optimization Hub.

You can easily analyze cost optimization opportunities with built-in filters and grouping options. For example, after understanding which AWS account has the most cost optimization opportunities, you can identify the top cost optimization strategies, such as stopping idle resources, rightsizing, and Graviton migration. If you identify which AWS Region has the highest number of rightsizing opportunities, you can get a list of rightsizing recommendations for the Region. It will redirect you to the Compute Optimizer console through deep linking to validate the details, such as the projected CPU utilization if you implement the change.

Getting started with Cost Optimization Hub
To get started, choose Cost Optimization Hub in the left navigation menu of the AWS Billing and Cost Management Console. You can opt in by selecting Enable. There is a 24-hour wait time for Cost Optimization Hub to populate data initially and data will be refreshed daily afterward.

After opt-in, you can see the dashboard of cost optimization recommendations by AWS account, AWS Region, and tag key. If you want to see the list of resources available for optimization, choose View opportunities.

Cost Optimization Hub supports six types of cost-optimizing recommended actions, including:

  • Stop – Stop idle or unused resources to save up to 100 percent of the resources’ cost.
  • Rightsize – Move to a smaller Amazon EC2 instance type, Amazon EBS volume, AWS Lambda memory size, or AWS Fargate task size
  • Upgrade – Move to a later-generation product, such as moving from EBS io1 volume type to io2.
  • Graviton migration – Move from EC2 instance types with x86-based processors to EC2 instance types with AWS Graviton-based processors to save costs.
  • Purchase Savings Plans – Purchase Compute Savings Plans, EC2 Instance Savings Plans, and Amazon SageMaker Savings Plans
  • Purchase Reserved Instances – Purchase Amazon EC2, Amazon RDS, Amazon DynamoDB, Amazon ElastiCache, and Amazon Redshift Reserved Instances.

You can see the resource type, top recommended action, and estimated monthly savings. You can also filter the list by AWS account, AWS Region, implementation effort, and tag key as the group-by dimension.

You also can classify each recommendation as “Is resources restart needed” or “Is rollback possible.” If you specify Is resources restart needed=No as the filter, you can only see recommendations that don’t require you to restart your resources, such as EBS volume recommendations. Similarly, If you specify Is rollback possible=Yes as the filter, you can only see recommendations that can be rolled back.

If you select a specific source, for example, right-sizing EC2 instance, you can view details and connect to Amazon EC2 and the AWS Compute Optimizer console. Note that estimated monthly savings is a quick approximation of future savings. The actual savings you will realize are dependent on your future AWS usage patterns.

You can also interactively query through AWS Command Line Interface (AWS CLI) and AWS SDKs.  Here’s a sample query to find the recommendations about deleting and rightsizing resources:

$ aws cost-optimization-hub list-recommendations

The preceding query gives you the following results:

{
   "items":[
      {
         "recommendationId":"MDA2MDI1ODQ1MTA1XzQ5MzNhYzZlLWZmYTUtNGI2ZC04YzBkLTAxYWE3Y2JlNjNlYg==",
         "accountId":"006025845105",
         "region":"Global",
         "resourceId":"006025845105_ComputeSavingsPlans",
         "currentResourceType":"ComputeSavingsPlans",
         "recommendedResourceType":"ComputeSavingsPlans",
         "estimatedMonthlySavings":1506.591472696,
         "estimatedSavingsPercentage":55.46400024,
         "estimatedMonthlyCost":2716.341169146,
         "currencyCode":"USD",
         "implementationEffort":"VeryLow",
         "restartNeeded":false,
         "actionType":"PurchaseSavingsPlans",
         "rollbackPossible":false,
         "recommendedResourceSummary":"$1.628/hour with three years term",
         "lastRefreshTimestamp":"2023-10-23T16:54:13-07:00",
         "recommendationLookbackPeriodInDays":30,
         "source":"CostExplorer"
      },
      {
         "recommendationId":"MDA2MDI1ODQ1MTA1XzhiZTRlNTczLTE0MDctNGIzOS05MmY3LTdmN2EzOTU2Y2ZkYw==",
         "accountId":"006025845105",
         "region":"us-east-1",
         "resourceId":"arn:aws:lambda:us-east-1:006025845105:function:Lambda-recommendation-testing:$LATEST",
         "resourceArn":"arn:aws:lambda:us-east-1:006025845105:function:Lambda-recommendation-testing:$LATEST",
         "currentResourceType":"LambdaFunction",
         "recommendedResourceType":"LambdaFunction",
         "estimatedMonthlySavings":3.1682091425308054e-06,
         "estimatedSavingsPercentage":1.936368871741565,
         "estimatedMonthlyCost":0.00016044778307703665,
         "currencyCode":"USD",
         "implementationEffort":"Low",
         "restartNeeded":false,
         "actionType":"Rightsize",
         "rollbackPossible":true,
         "currentResourceSummary":"128 MB memory",
         "recommendedResourceSummary":"160 MB memory",
         "lastRefreshTimestamp":"2023-10-24T04:07:35.364000-07:00",
         "recommendationLookbackPeriodInDays":14,
         "source":"ComputeOptimizer"
      }
   ]
}

For more information about new Cost Optimization Hub APIs, see the Cost Optimization Hub API documentation.

Now available
Cost Optimization Hub is now generally available for all customers. There is no additional charge for this new capability. You can now get started and view cost optimization recommendations across all AWS Regions.

To learn more, see the Cost Optimization Hub page and send feedback to AWS re:Post for Cost Optimization or through your usual AWS Support contacts.

Channy

Amazon CloudWatch Logs now offers automated pattern analytics and anomaly detection

Post Syndicated from Danilo Poccia original https://aws.amazon.com/blogs/aws/amazon-cloudwatch-logs-now-offers-automated-pattern-analytics-and-anomaly-detection/

Searching through log data to find operational or business insights often feels like looking for a needle in a haystack. It usually requires you to manually filter and review individual log records. To help you with that, Amazon CloudWatch has added new capabilities to automatically recognize and cluster patterns among log records, extract noteworthy content and trends, and notify you of anomalies using advanced machine learning (ML) algorithms trained using decades of Amazon and AWS operational data.

Specifically, CloudWatch now offers the following:

  • The Patterns tab on the Logs Insights page finds recurring patterns in your query results and lets you analyze them in detail. This makes it easier to find what you’re looking for and drill down into new or unexpected content in your logs.
  • The Compare button in the time interval selector on the Logs Insights page lets you quickly compare the query result for the selected time range to a previous period, such as the previous day, week, or month. In this way, it takes less time to see what has changed compared to a previous stable scenario.
  • The Log Anomalies page in the Logs section of the navigation pane automatically surfaces anomalies found in your logs while they are processed during ingestion.

Let’s see how these work in practice with a typical troubleshooting journey. I will look at some application logs to find key patterns, compare two time periods to understand what changed, and finally see how detecting anomalies can help discover issues.

Finding recurring patterns in the logs
In the CloudWatch console, I choose Logs Insights from the Logs section of the navigation pane. To start, I have selected which log groups I want to query. In this case, I select a log group of a Lambda function that I want to inspect and choose Run query.

In the Pattern tab, I see the patterns that have been found in these log groups. One of the patterns seems to be an error. I can select it to quickly add it as a filter to my query and focus on the logs that contain this pattern. For now, I choose the magnifying glass icon to analyze the pattern.

Console screenshot.

In the Pattern inspect window, a histogram with the occurrences of the pattern in the selected time period is shown. After the histogram, samples from the logs are provided.

Console screenshot.

The variable parts of the pattern (such as numbers) have been extracted as “tokens.” I select the Token values tab to see the values for a token. I can select a token value to quickly add it as a filter to the query and focus on the logs that contain this pattern with this specific value.

Console screenshot.

I can also look at the Related patterns tab to see other logs that typically occurred at the same time as the pattern I am analyzing. For example, if I am looking at an ERROR log that was always written alongside a DEBUG log showing more details, I would see that relationship there.

Comparing logs with a previous period
To better understand what is happening, I choose the Compare button in the time interval selector. This updates the query to compare results with a previous period. For example, I choose Previous day to see what changed compared to yesterday.

Console screenshot.

In the Patterns tab, I notice that there has actually been a 10 percent decrease in the number of errors, so the current situation might not be too bad.

I choose the magnifying glass icon on the pattern with severity type ERROR to see a full comparison of the two time periods. The graph overlaps the occurrences of the pattern over the two periods (now and yesterday in this case) inside the selected time range (one hour).

Console screenshot.

Errors are decreasing but are still there. To reduce those errors, I make some changes to the application. I come back after some time to compare the logs, and a new ERROR pattern is found that was not present in the previous time period.

Console screenshot.

My update probably broke something, so I roll back to the previous version of the application. For now, I’ll keep it as it is because the number of errors is acceptable for my use case.

Detecting anomalies in the log
I am reassured by the decrease in errors that I discovered comparing the logs. But how can I know if something unexpected is happening? Anomaly detection for CloudWatch Logs looks for unexpected patterns in the logs as they are processed during ingestion and can be enabled at log group level.

I select Log groups in the navigation pane and type a filter to see the same log group I was looking at before. I choose Configure in the Anomaly detection column and select an Evaluation frequency of 5 minutes. Optionally, I can use a longer interval (up to 60 minutes) and add patterns to process only specific log events for anomaly detection.

After I activate anomaly detection for this log group, incoming logs are constantly evaluated against historical baselines. I wait for a few minutes and, to see what has been found, I choose Log anomalies from the Logs section of the navigation pane.

Console screenshot.

To simplify this view, I can suppress anomalies that I am not interested in following. For now, I choose one of the anomalies in order to inspect the corresponding pattern in a way similar to before.

Console screenshot.

After this additional check, I am convinced there are no urgent issues with my application. With all the insights I collected with these new capabilities, I can now focus on the errors in the logs to understand how to solve them.

Things to know
Amazon CloudWatch automated log pattern analytics is available today in all commercial AWS Regions where Amazon CloudWatch Logs is offered excluding the China (Beijing), the China (Ningxia), and Israel (Tel Aviv) Regions.

The patterns and compare query features are charged according to existing Logs Insights query costs. Comparing a one-hour time period against another one-hour time period is equivalent to running a single query over a two-hour time period. Anomaly detection is included as part of your log ingestion fees, and there is no additional charge for this feature. For more information, see CloudWatch pricing.

Simplify how you analyze logs with CloudWatch automated log pattern analytics.

Danilo