Tag Archives: data collection

China’s Olympics App Is Horribly Insecure

Post Syndicated from Bruce Schneier original https://www.schneier.com/blog/archives/2022/01/chinas-olympics-app-is-horribly-insecure.html

China is mandating that athletes download and use a health and travel app when they attend the Winter Olympics next month. Citizen Lab examined the app and found it riddled with security holes.

Key Findings:

  • MY2022, an app mandated for use by all attendees of the 2022 Olympic Games in Beijing, has a simple but devastating flaw where encryption protecting users’ voice audio and file transfers can be trivially sidestepped. Health customs forms which transmit passport details, demographic information, and medical and travel history are also vulnerable. Server responses can also be spoofed, allowing an attacker to display fake instructions to users.
  • MY2022 is fairly straightforward about the types of data it collects from users in its public-facing documents. However, as the app collects a range of highly sensitive medical information, it is unclear with whom or which organization(s) it shares this information.
  • MY2022 includes features that allow users to report “politically sensitive” content. The app also includes a censorship keyword list, which, while presently inactive, targets a variety of political topics including domestic issues such as Xinjiang and Tibet as well as references to Chinese government agencies.
  • While the vendor did not respond to our security disclosure, we find that the app’s security deficits may not only violate Google’s Unwanted Software Policy and Apple’s App Store guidelines but also China’s own laws and national standards pertaining to privacy protection, providing potential avenues for future redress.

News article:

It’s not clear whether the security flaws were intentional or not, but the report speculated that proper encryption might interfere with some of China’s ubiquitous online surveillance tools, especially systems that allow local authorities to snoop on phones using public wireless networks or internet cafes. Still, the researchers added that the flaws were probably unintentional, because the government will already be receiving data from the app, so there wouldn’t be a need to intercept the data as it was being transferred.

[…]

The app also included a list of 2,422 political keywords, described within the code as “illegalwords.txt,” that worked as a keyword censorship list, according to Citizen Lab. The researchers said the list appeared to be a latent function that the app’s chat and file transfer function was not actively using.

The US government has already advised athletes to leave their personal phones and laptops home and bring burners.

Are Fake COVID Testing Sites Harvesting Data?

Post Syndicated from Bruce Schneier original https://www.schneier.com/blog/archives/2022/01/are-fake-covid-testing-sites-harvesting-data.html

Over the past few weeks, I’ve seen a bunch of writing about what seems to be fake COVID-19 testing sites. They take your name and info, and do a nose swab, but you never get test results. Speculation centered around data harvesting, but that didn’t make sense because it was far too labor intensive for that and — sorry to break it to you — your data isn’t worth all that much.

It seems to be multilevel marketing fraud instead:

The Center for COVID Control is a management company to Doctors Clinical Laboratory. It provides tests and testing supplies, software, personal protective equipment and marketing services — online and printed — to testing sites, said a person who was formerly associated with the Center for COVID Control. Some of the sites are owned independently but operate in partnership with the chain under its name and with its guidance.

[…]

Doctors Clinical Lab, the lab Center for COVID Control uses to process tests, makes money by billing patients’ insurance companies or seeking reimbursement from the federal government for testing. Insurance statements reviewed by Block Club show the lab has, in multiple instances, billed insurance companies $325 for a PCR test, $50 for a rapid test, $50 for collecting a person’s sample and $80 for a “supplemental fee.”

In turn, the testing sites are paid for providing samples to the lab to be processed, said a person formerly associated with the Center for COVID Control.

In a January video talking to testing site operators, Syed said the Center for COVID Control will no longer provide them with PCR tests, but it will continue supplying them with rapid tests at a cost of $5 per test. The companies will keep making money for the rapid tests they collect, he said.

“You guys will continue making the $28.50 you’re making for the rapid test,” Syed said in the video.

Read the article for the messy details. Or take a job and see for yourself.

Simplifying Zabbix API workflows with named Zabbix API tokens

Post Syndicated from Arturs Lontons original https://blog.zabbix.com/simplifying-zabbix-api-workflows-with-named-zabbix-api-tokens/16653/

Zabbix API enables you to collect any and all information from your Zabbix instance by using a multitude of API methods. You can even utilize Zabbix API calls in your HTTP items. For example, this can be used to monitor the number of particular sets of metrics and visualize their growth over time. With named Zabbix API tokens, such use cases are a lot more simple to implement.

Before Zabbix 5.4 we had to perform the user.login API call to obtain the authentication token. Once the user session was closed, we had to relog, obtain the new authentication token and use it in the subsequent API calls.

With the pre-defined named Zabbix API tokens, you don’t have to constantly check if the authentication token needs to be updated. Starting from Zabbix 5.4 you can simply create a new named Zabbix API token with an expiration date and use it in your API calls.

Creating a new named Zabbix API token

The Zabbix API token creation process is extremely simple. All you have to do is navigate to Administration – General – API tokens and create a new API token. The named API tokens are created for a particular user and can have an optional expiration date and time – otherwise, the tokens are defined without an expiry date.

You can create a named API token in the API tokens section, under Administration – General

Once the Token has been created, make sure to store it somewhere safe, since you won’t be able to recover it afterward. If the token is lost – you will have to recreate it.

Make sure to store the auth token!

Don’t forget, that when defining a role for the particular API user, we can restrict which API methods this user has access to.

Simplifying API tasks with the named API token

There are many different use cases where you could implement Zabbix API calls to collect some additional information. For this blog post, I will create an HTTP item that uses item.get API call to monitor the number of unsupported items.

To achieve that, I will create an HTTP item on a host (This can be the default Zabbix server host or a host dedicated to collecting metrics via Zabbix API calls) and provide the API call in the request body. Since the named API token now provides a static authentication token until it expires, I can simply use it in my API call without the need to constantly keep it updated.

An HTTP agent item that uses a Zabbix API call in its request body

{
    "jsonrpc": "2.0",
    "method": "item.get",
    "params": {
			"countOutput":"1",
			 "filter": {
 "state": "1"
 }
    },
    "id": 2,
    "auth": "b72be8cf163438aacc5afa40a112155e307c3548ae63bd97b87ff4e98b1f7657"
}

HTTP item request body, which returns a count of unsupported items

I will also use regular expression preprocessing to obtain the numeric value from the API call result – otherwise, we won’t be able to graph our value or calculate trends for it.

Regular expression preprocessing step to obtain a numeric value from our Zabbix API call result

Utilizing Zabbix API scripts in Actions

In one of our previous blog posts, we covered resolving problems automatically with the event.acknowledge API method. The logic defined in the blog post was quite complex since we needed to keep an eye out for the authentication tokens and use a custom script to keep them up to date. With named Zabbix API tokens, this use case is a lot more simple.

All I have to do is create an Action operation script containing my API call and pass it to an action operation.

Action operation script that invokes Zabbix event.acknowledge API method

curl -sk -X POST -H "Content-Type: application/json" -d "
{
\"jsonrpc\": \"2.0\",
\"method\": \"event.acknowledge\",
\"params\": {
\"eventids\": \"{EVENT.ID}\",
\"action\": 1,
\"message\": \"Problem resolved.\"
},
\"auth\": \"<Place your authentication token here>",
\"id\": 2
}" <Place your Zabbix API endpoint URL here>

Problem remediation script example

Now my problems will get closed automatically after the time period which I have defined in my action.

Action operation which runs our event.acknowledge Zabbix API script

These are but a few examples that we can now achieve by using API tokens. A lot of information can be obtained and filtered in a unique way via Zabbix API, thus providing you with a granular analysis of your monitored environment. If you have recently upgraded to Zabbix 5.4 or plan to upgrade to Zabbix 6.0 LTS in the future, I would recommend implementing named Zabbix API tokens to simplify your day-to-day workflow and consider the possibilities that this new feature opens up for you.

If you have any questions or if you wish to share your particular use case for data collection or task automation with Zabbix API – feel free to share them in the comments section below!

Combining preprocessing with storing only trend data for high-frequency monitoring

Post Syndicated from Arturs Lontons original https://blog.zabbix.com/combining-preprocessing-with-storing-only-trend-data-for-high-frequency-monitoring/16568/

There are many design choices to consider when we build our monitoring environment for high-frequency monitoring. How to minimize performance impact? What are the data retention policies with storage space in mind? What are the available out-of-the-box features to solve these potential problems?
In this blog post, we will discuss when you should use preprocessing and when it is better to use the “Do not keep history” option for your metrics, and what are the pros and cons for both of these approaches.

Throttling and other preprocessing steps

We’ve discussed throttling previously as the go-to approach for high-frequency monitoring. Indeed, with throttling, you can discard repeated values and do so with a heartbeat. This is extremely useful with metrics that come as discreet values – services states, network port statuses, and so on.
Example of throttling with and without heartbeat
In addition, since starting from Zabbix 4.2 all preprocessing is also performed by Zabbix proxies. This means we can discard the repeated values before they reach the Zabbix server. This can help us both with the performance (fewer metrics to insert in the Zabbix server DB) and reduce the DB size (Fewer metrics stored in the DB. This also helps with improving overall Zabbix performance)
There are a few caveats with this approach – since metrics get discarded before they reach the Zabbix server, the triggers will not react on these metrics (This is where having a heartbeat is useful) and, since trends are calculated by Zabbix server based on the received history data, there could be a lack of trend information for these metrics. Keep in mind that this applies not only to throttling preprocessing rules – any preprocessing can be done on the proxy and any preprocessing rules can be used to transform your data.

Understanding “Do not keep history” option

The behavior of “Do not keep history” which we can define when configuring an item is a bit different though. If we collect an item by a Proxy and configure the item with “Do not keep history”, the history won’t always get discarded! There are a couple of reasons for this.
  • First off, let’s not forget that some of our values can populate host inventory! If the particular item is configured to populate an inventory field – it will be forwarded to the Zabbix server, but it will not get stored in the history tables.
  • If the item does not populate an inventory field – the text data such as character, log and text will indeed get discarded before reaching the Zabbix server, but Numeric values – both float and integer, will get forwarded to the server. The reason for that is deriving trend information from the numeric values. Mind that the numeric data will still not get stored in the history tables, only trends will be available for these items.

Note: This behavior has been properly implemented starting from Zabbix 5.2. See ZBX-17548

Setting the “Do not keep history” option for an item

Using trend functions with high-frequency monitoring

With the specifics of “Do not keep history” in mind, we should now recall that starting from Zabbix 5.2 we have trend functions available at our disposal!
History functions such as trendavg, trendcount, trendmax, trendmin, trendsum allow us to perform different kinds of trend calculations – from counting the number of trend values to retrieving min/max/avg trend values for a time period.
This means, that if we require only the metric trend for specific time periods (hours, days, weeks, etc) we can use these trend functions together with “Do not keep history” option, thus discarding unnecessary data and improving our Zabbix server performance!
There are two approaches two using trend functions:
  • If you wish to collect and display the trend data, you need to create the item which will collect the metrics (say, a net.if.in Agent item for collecting incoming network traffic) and then create a separate calculated item that uses the trend function to calculate the avg/min/max value for the trend over a time period. The original item can then have “Do not keep history” option selected for it.

trendavg item for calculating hourly trends from the net.if.in[ifHCInOctets.5] item


  • If you wish to simply define triggers and react on long-term trends and are not required to collect the trend values, then we can skip the creation of the calculated item and simply use the trend function on the original item in the trigger.

This trigger fires if the hourly average trend value exceeds 100M.
Note: In this case only the original item is required.

By combining these approaches in our environment – using preprocessing when we wish to discard or transform the data and also implementing opting out of storing the history data, whenever this is appropriate, we can minimize the performance impact on our Zabbix instance. Add a layer of distributed Zabbix proxies on top of this and you can truly achieve a large, scalable Zabbix infrastructure optimized for high-frequency ingestion and processing of your data.

Monitoring MongoDB nodes and clusters with Zabbix

Post Syndicated from Dmitry Lambert original https://blog.zabbix.com/monitoring-mongodb-nodes-and-clusters-with-zabbix/16031/

Zabbix Agent 2 enables our users to monitor a whole set of new systems with minimal configuration required on the monitored systems. Forget about writing custom monitoring scripts, deploying additional packages, or configuring ODBC. A great use-case for Zabbix Agent 2  is monitoring one of the most popular NoSQL DB backends – MongoDB. Below, you can read a detailed description and step-by-step guide through the use case or refer to the video available here.

Zabbix MongoDB template

For this example, we will be using Zabbix version 5.4, but MongoDB monitoring by Zabbix Agent 2 is supported starting from version 5.0. If you have a fresh deployment of Zabbix version 5.0 or newer, you will be able to find the MongoDB template in your ‘Configuration‘ – ‘Templates‘ section.

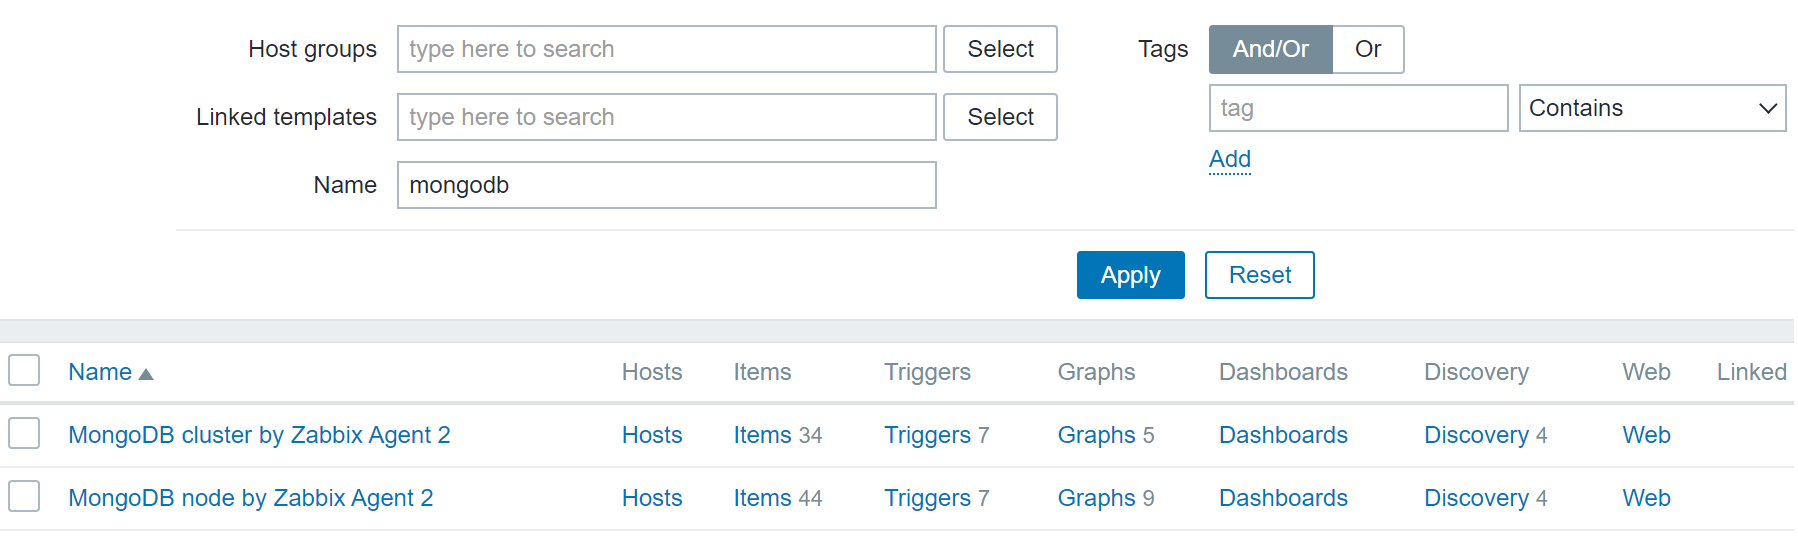
MongoDB Node and Cluster templates

On the other hand, if you have an instance that you deployed before the release of Zabbix 5.0 and then upgraded to Zabbix 5.0 or newer, you will have to import the template manually from our git page. Let’s remember that Zabbix DOES NOT apply new templates or modify existing templates during an upgrade. Therefore, newly released templates have to be IMPORTED MANUALLY!

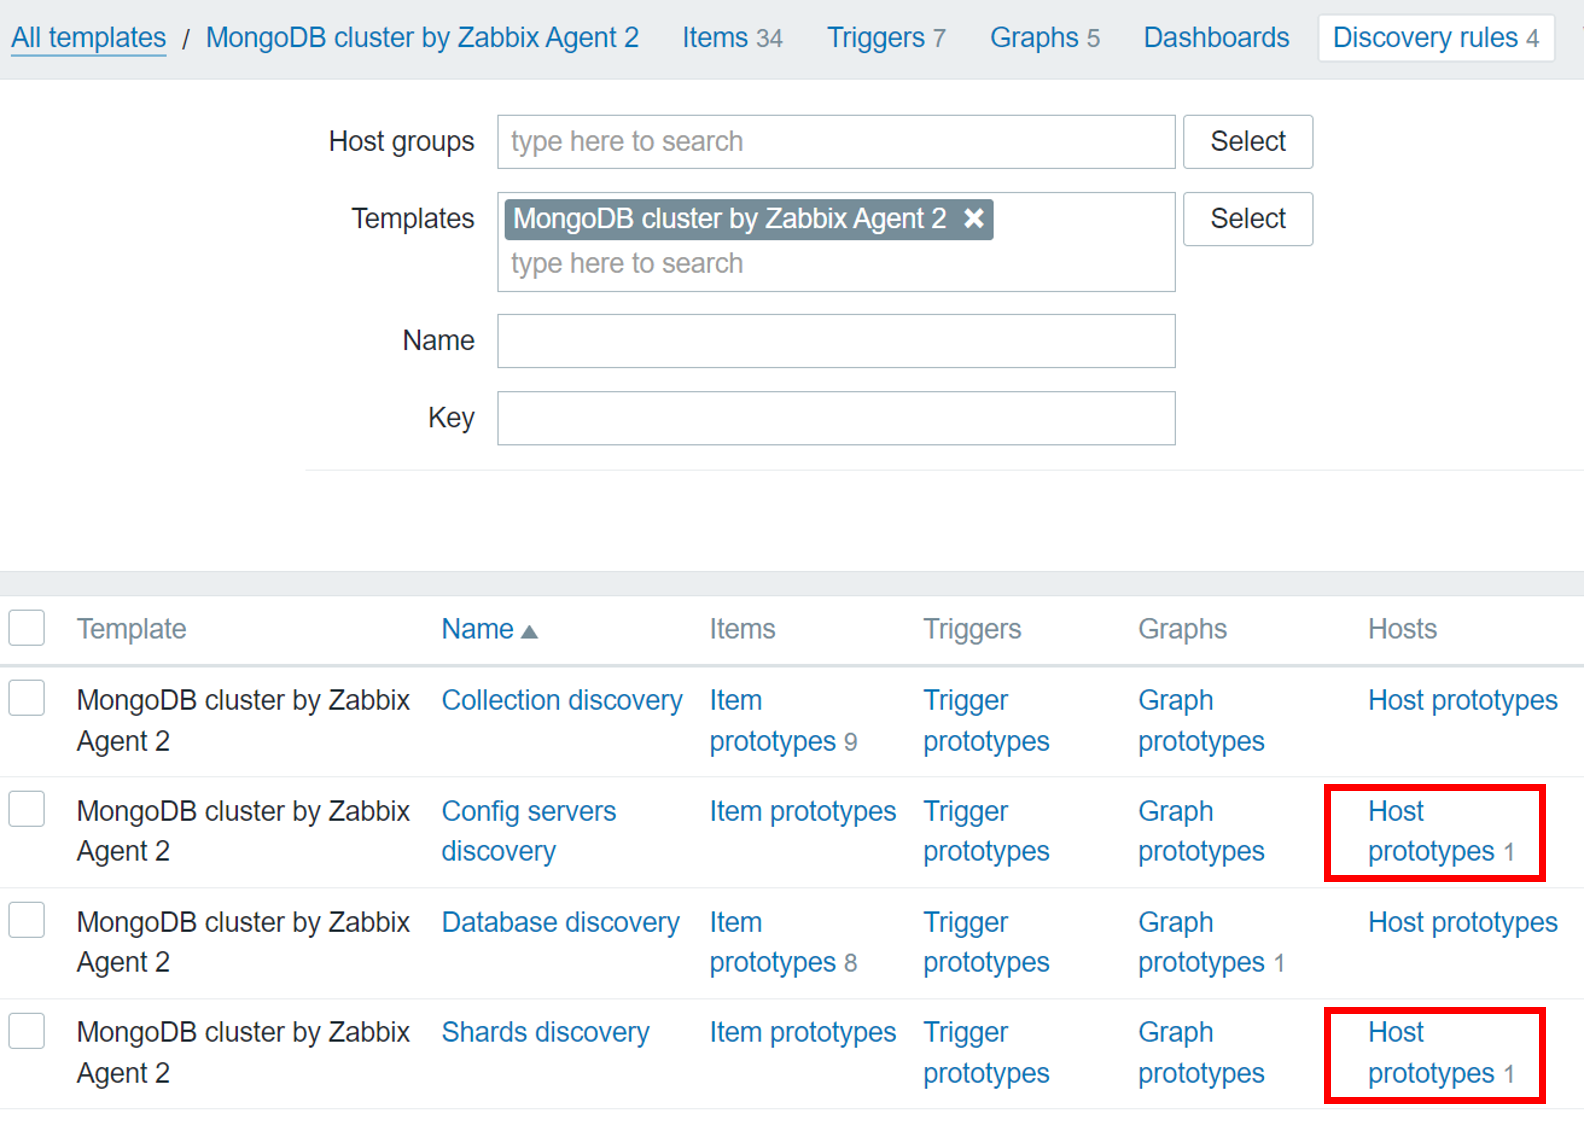
We can see that we have two MongoDB templates – ‘MongoDB cluster by Zabbix Agent 2’ and ‘MongoDB node by Zabbix agent 2’. Depending on your MongoDB setup – individual nodes or a cluster, apply the corresponding template. Note that the MongoDB cluster template can automatically create hosts for your config servers and shards and apply the MongoDB node template on these hosts.

Host prototypes for config servers and shards

Deploying Zabbix Agent 2 on your Host

Since the data collection is done by Zabbix Agent 2, first, let’s deploy Zabbix Agent 2 on our MongoDB node or cluster host. Let’s start with adding the Zabbix 5.4 repository and install the Zabbix Agent 2 via a  package.

Add the Zabbix 5.4 repository:

rpm -Uvh https://repo.zabbix.com/zabbix/5.4/rhel/8/x86_64/zabbix-release-5.4-1.el8.noarch.rpm

Install Zabbix Agent 2:

yum install zabbix-agent2

What if you already have the regular Zabbix Agent running on this machine? In this case, we have two options for how we can proceed. We can simply remove the regular Zabbix Agent and Deploy Zabbix Agent 2. In this case, make sure you make a backup of the Zabbix Agent configuration file and migrate all of the changes to the Zabbix Agent 2 configuration file.

The second option is running both of the Zabbix Agents in parallel. In this case, we need to make sure that both agents – Zabbix Agent and Zabbix Agent 2 are listening on their own specific ports because, by default, both agents are listening for connections on port 10050. This can be configured in the Zabbix Agent configuration file by changing the ‘ListenPort’ parameter.

Don’t forget to specify the ‘Server‘ parameter in the Zabbix Agent 2 configuration file. This parameter should contain your Zabbix Server address or DNS name. By defining it here, you will allow Zabbix Agent 2 to accept the metric poll requests from Zabbix Server.

After you have made the configuration changes in the Zabbix Agent 2 configuration file, don’t forget to restart Zabbix Agent 2 to apply the changes:

systemctl restart zabbix-agent2

Creating a MongoDB user for monitoring

Once the agent has been deployed and configured, you need to ensure that you have a MongoDB database user that we can use for monitoring purposes. Below you can find a brief example of how you can create a MongoDB user:

Access the MongoDB shell:

mongosh

Switch to the MongoDB admin database:

use admin

Create a user with ‘userAdminAnyDatabase‘ permissions:

db.createUser(
... {
..... user: "zabbix_mon",
..... pwd: "zabbix_mon",
..... roles: [ { role: "userAdminAnyDatabase", db: "admin" } ]
..... }
... )

The username for the newly created user is ‘zabbix_mon’. The password is also ‘zabbix_mon‘ – feel free to change these as per your security policy.

Creating and configuring a MongoDB host

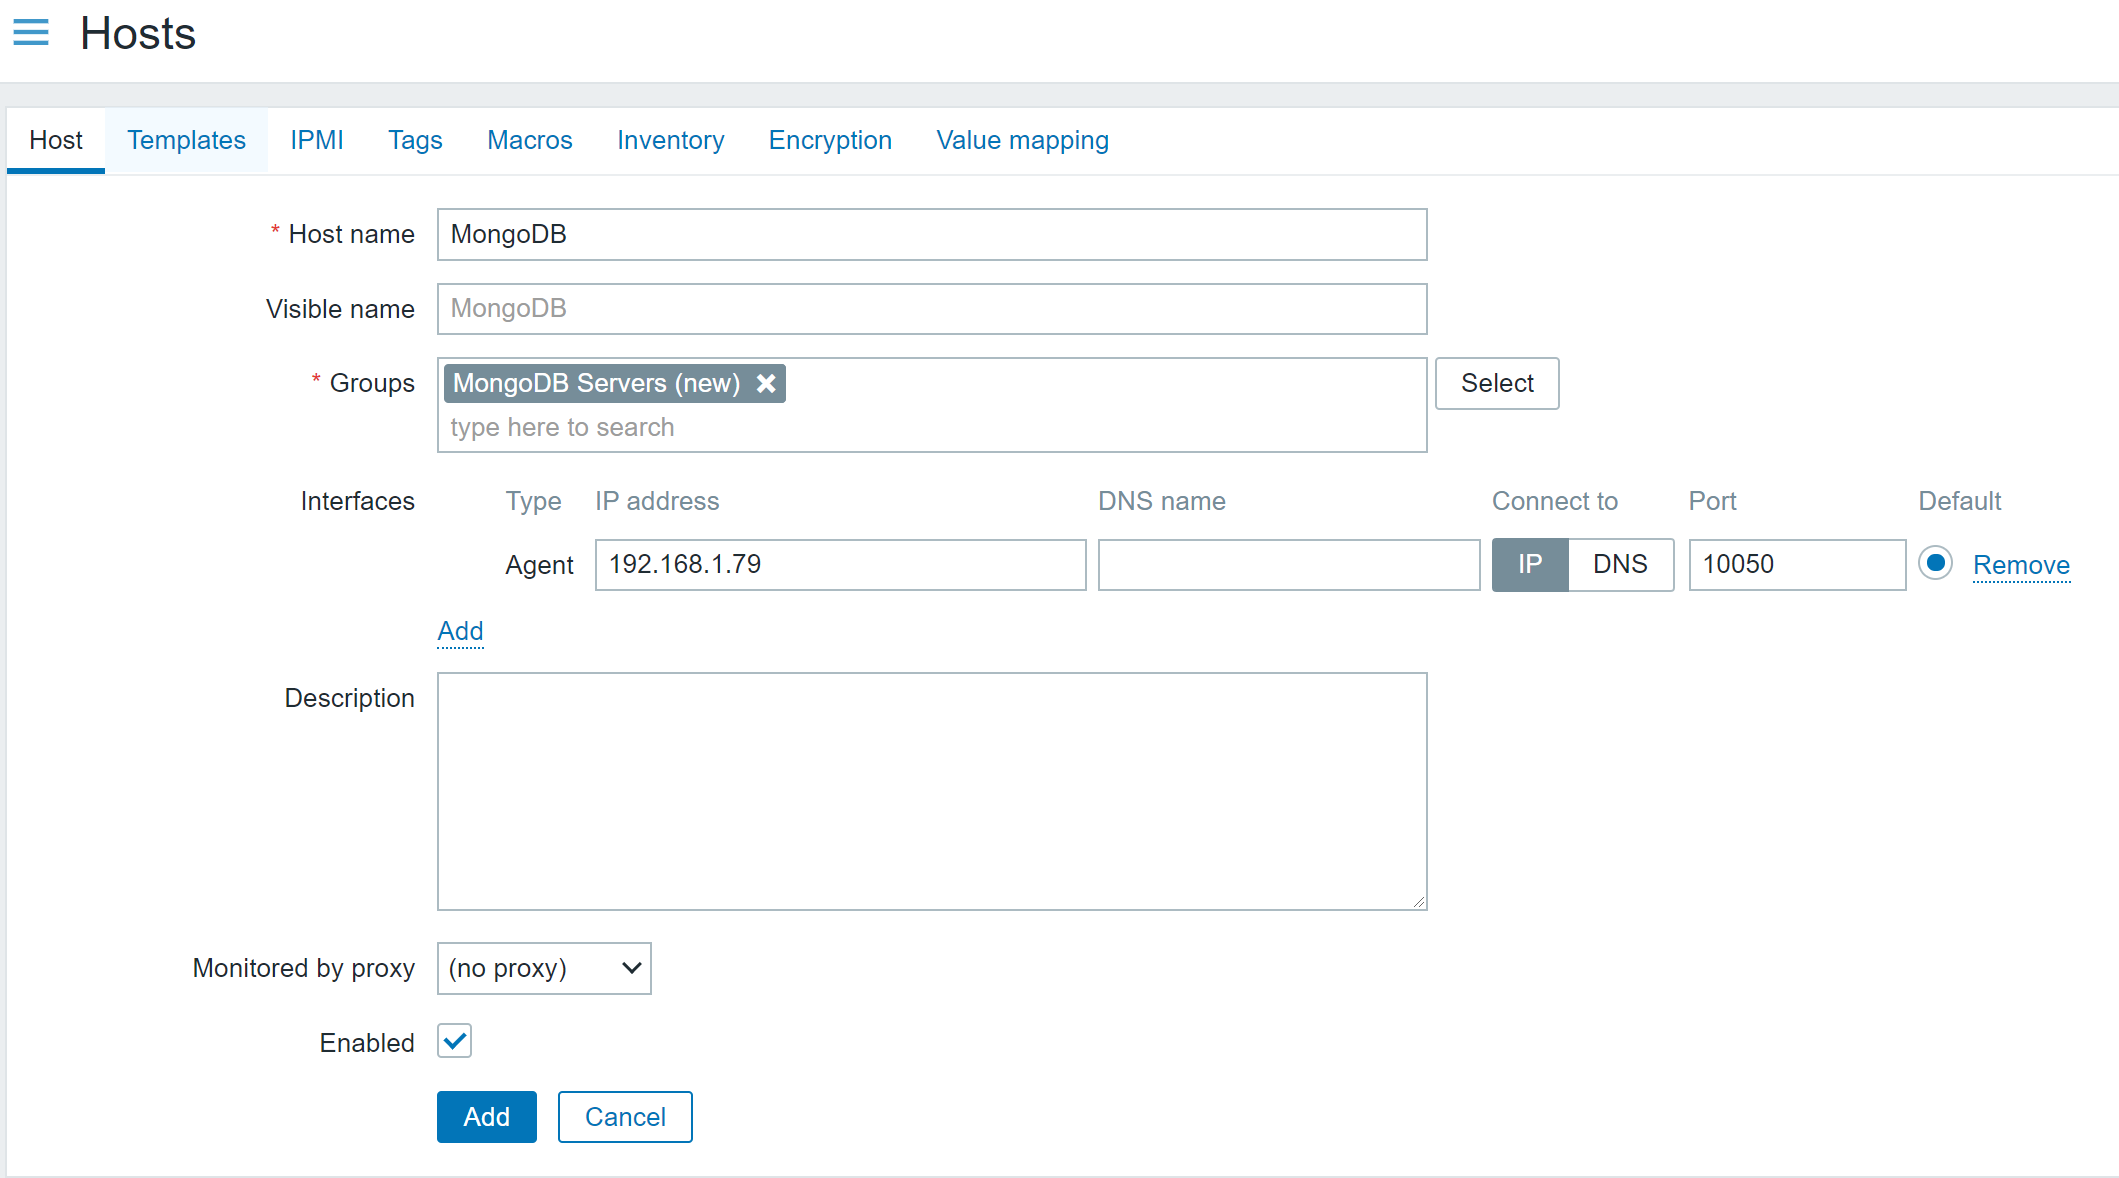
Next, you need to open your Zabbix frontend and create a new host representing your MongoDB node. You can see that in our example, we called our node ‘MongoDB’ and assigned it to a ‘MongoDB Servers’ host group. You can use more detailed naming in a production environment and use your own host group assignment logic. But remember – a host needs to belong to AT LEAST a single host group! 

Since the metrics are collected by Zabbix Agent 2, you must also create an Agent interface on the host. Zabbix Server will connect to this interface and request the metrics from the Zabbix Agent 2. Define the IP address or DNS name of your MongoDB host, where you previously deployed Zabbix Agent 2. Mind the port – by default, we have port 10050 defined over here, but if you have modified the ‘ListenPort’ parameter in the Zabbix Agent 2 config and changed the value from the default one (10050) to something else, you also need to use the same port number here.

MongoDB host configuration example

Next, navigate to the ‘Templates’ tab and assign the corresponding template – either ‘MongoDB node by Zabbix agent 2’ or ‘MongoDB cluster by Zabbix Agent 2’. In our example, we will assign the MongoDB node template.

Before adding the host, you also need to provide authentication and connection parameters by editing the corresponding User Macros. These User Macros are used by the items that specify which metrics should we be collecting. Essentially, we are forwarding the connectivity and authentication information to Zabbix Agent 2, telling it to use these values when collecting the metrics from our MongoDB instance.

To do this, navigate to the ‘Macros’ tab in the host configuration screen. Then, select ‘Inherited and host macros’ to display macros inherited from the MongoDB template.

We can see a bunch of macros here – some of them are related to trigger thresholds and discovery filters, but what we’re interested in right now are the following macros:

  • {$MONGODB.PASSWORD} –  MongoDB username. For our example, we will set this to zabbix_mon
  • {$MONGODB.USER} – MongoDB password. For our example, we will set this to zabbix_mon
  • {$MONGODB.CONNSTRING} – MongoDB connection string. Specify the MongoDB address and port here to which the Zabbix Agent 2 should connect and perform the metric collection

Now we are ready to add the host. Once the host has been added, we might have to wait for a minute or so before Zabbix begins to monitor the host. This is because Zabbix Server doesn’t instantly pick up the configuration changes. By default, Zabbix Server updates the Configuration Cache once a minute.

Fine-tuning MongoDB monitoring

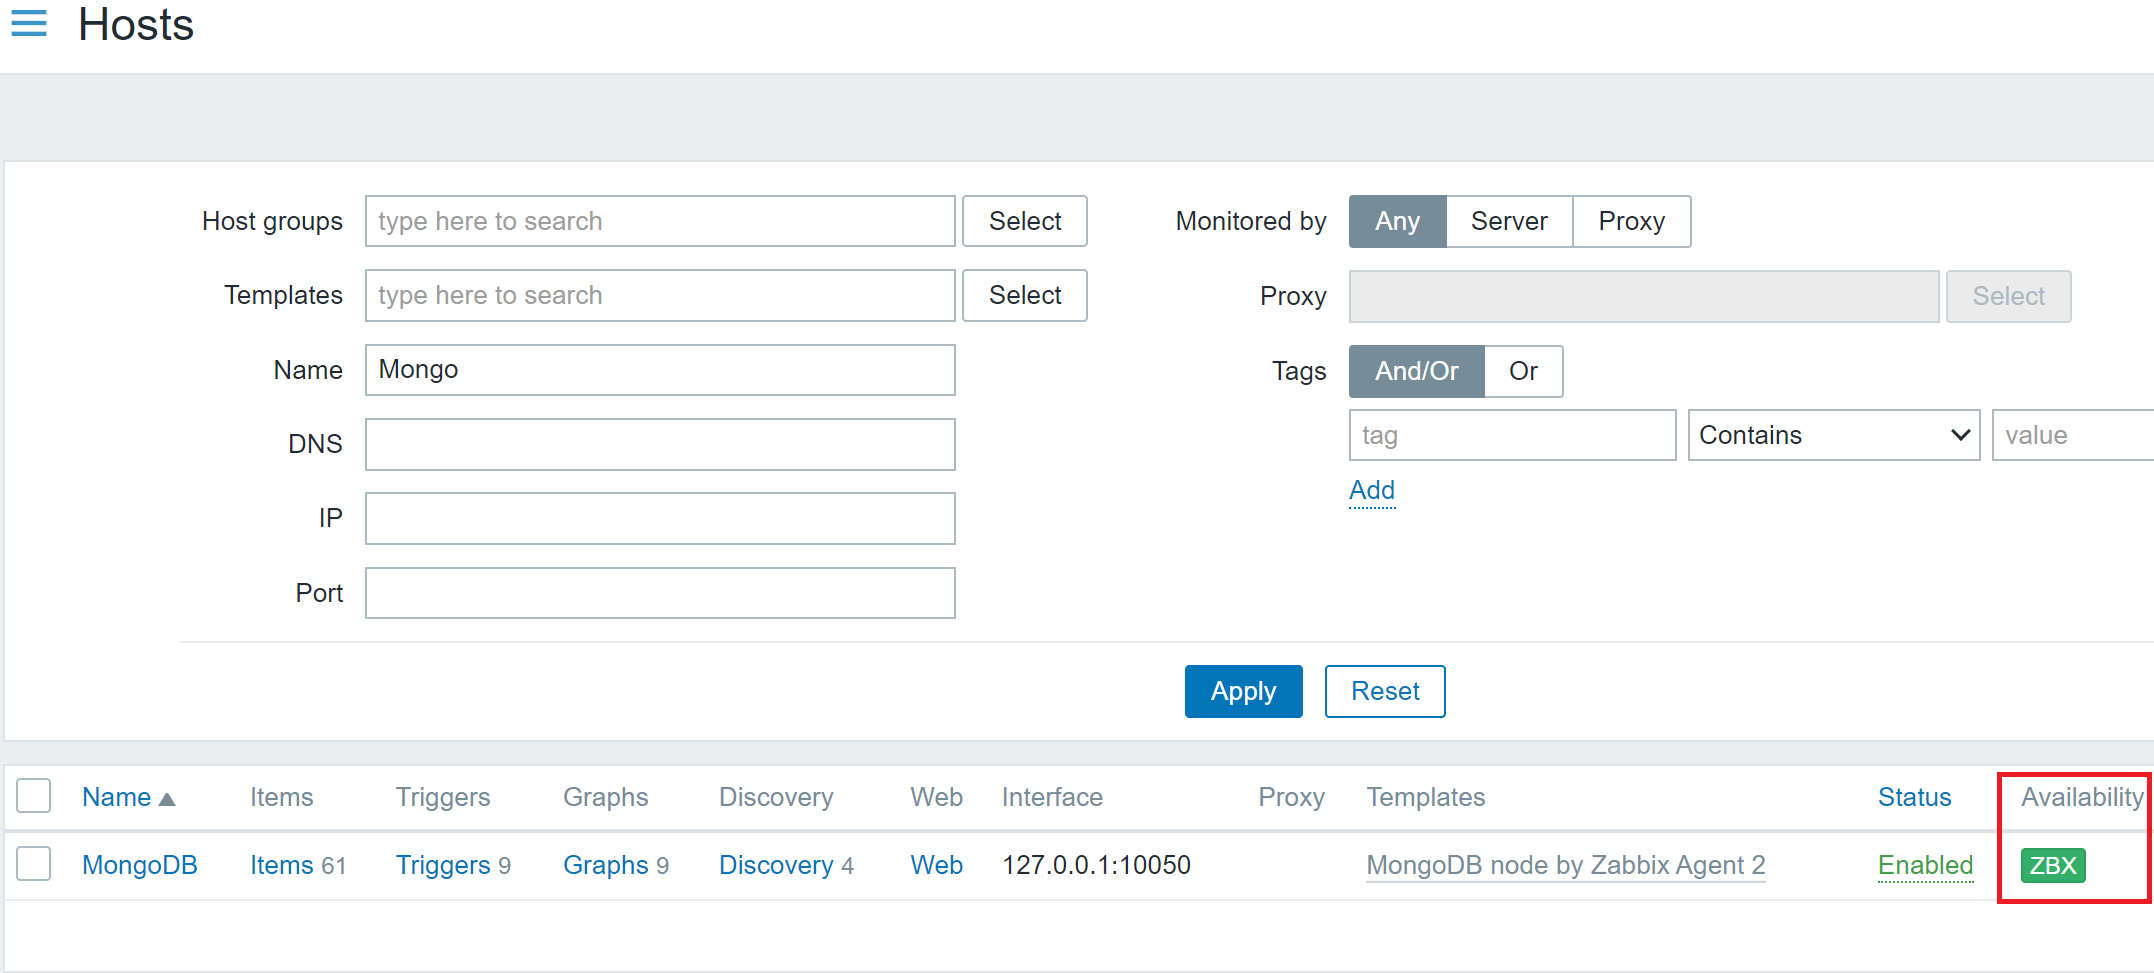
At this point, we should see a green ZBX Icon next to our MongoDB host.

Data collection on the MongoDB host has started – note the green ‘ZBX’ icon.

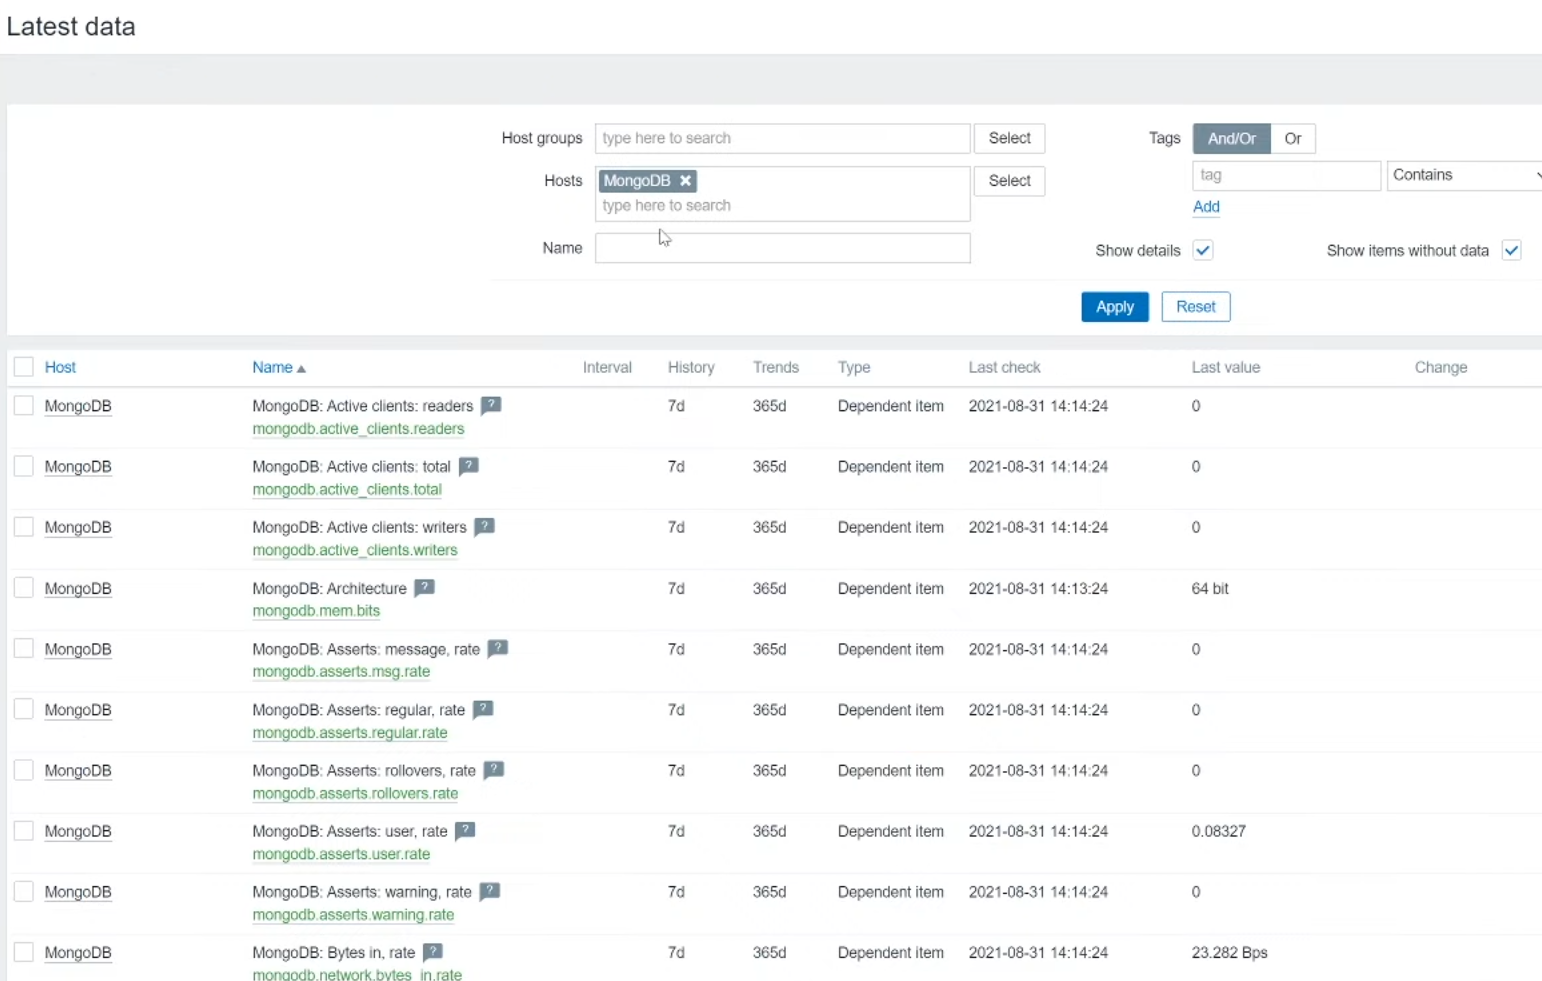
This means that the Zabbix Server has successfully connected to our Zabbix Agent 2, and the metric collection has begun. You can now navigate to the ‘Monitoring’ – ‘Latest data’ section, filter the view by your MongoDB host, and you should see all of the collected metrics here.

MongoDB metrics in ‘Monitoring’ – ‘Latest data’

The final task is to tune the MongoDB monitoring on your hosts, collecting only the required metrics. Navigate to ‘Configuration’ –Hosts’, find your MongoDB hosts, and go through the different entity types on the host – items, triggers, discovery rules. See an item that you don’t wish to collect metrics for? Feel free to disable it. Open up the discovery rules – change the update intervals on them or disable the unnecessary ones.

Note: Be careful not to disable master items. Many of the items and discovery rules here are of type ‘Dependent item’ which means, that they require a so-called ‘Master item’. Feel free to read more about dependent items here.

Remember the ‘Macros’ section in the host configuration? Let’s return to it. here we can see some macros which are used in our trigger thresholds, like:

  • {$MONGODB.REPL.LAG.MAX.WARN} – Maximum replication lag in seconds
  • {$MONGODB.CURSOR.OPEN.MAX.WARN} – Maximum number of open cursors

Feel free to change these as per your problem threshold requirements.

One last thing here – we can filter which elements get discovered by our discovery rules. This is once again defined by user macros like:

  • {$MONGODB.LLD.FILTER.DB.MATCHES} – Databases that should be discovered (By default, the value here is ‘.*’, which will match everything)
  • {$MONGODB.LLD.FILTER.DB.NOT_MATCHES} – Databases that should be excluded from the discovery

And that’s it! After some additional tuning has been applied, we are good to go – our MongoDB entities are being discovered, metrics are getting collected, and problem thresholds have been defined. And all of it has been done with the native Zabbix Agent 2 functionality and an out-of-the-box MongoDB template!

ProtonMail Now Keeps IP Logs

Post Syndicated from Bruce Schneier original https://www.schneier.com/blog/archives/2021/09/protonmail-now-keeps-ip-logs.html

After being compelled by a Swiss court to monitor IP logs for a particular user, ProtonMail no longer claims that “we do not keep any IP logs.”

EDITED TO ADD (9/14): This seems to be more complicated. ProtonMail is not yet saying that they keep logs. Their privacy policy still states that they do not keep logs except in certain circumstances, and outlines those circumstances. And ProtonMail’s warrant canary has an interesting list of data orders they have received from various authorities, whether they complied, and why or why not.

De-anonymization Story

Post Syndicated from Bruce Schneier original https://www.schneier.com/blog/archives/2021/07/de-anonymization-story.html

This is important:

Monsignor Jeffrey Burrill was general secretary of the US Conference of Catholic Bishops (USCCB), effectively the highest-ranking priest in the US who is not a bishop, before records of Grindr usage obtained from data brokers was correlated with his apartment, place of work, vacation home, family members’ addresses, and more.

[…]

The data that resulted in Burrill’s ouster was reportedly obtained through legal means. Mobile carriers sold­ — and still sell — ­location data to brokers who aggregate it and sell it to a range of buyers, including advertisers, law enforcement, roadside services, and even bounty hunters. Carriers were caught in 2018 selling real-time location data to brokers, drawing the ire of Congress. But after carriers issued public mea culpas and promises to reform the practice, investigations have revealed that phone location data is still popping up in places it shouldn’t. This year, T-Mobile even broadened its offerings, selling customers’ web and app usage data to third parties unless people opt out.

The publication that revealed Burrill’s private app usage, The Pillar, a newsletter covering the Catholic Church, did not say exactly where or how it obtained Burrill’s data. But it did say how it de-anonymized aggregated data to correlate Grindr app usage with a device that appears to be Burrill’s phone.

The Pillar says it obtained 24 months’ worth of “commercially available records of app signal data” covering portions of 2018, 2019, and 2020, which included records of Grindr usage and locations where the app was used. The publication zeroed in on addresses where Burrill was known to frequent and singled out a device identifier that appeared at those locations. Key locations included Burrill’s office at the USCCB, his USCCB-owned residence, and USCCB meetings and events in other cities where he was in attendance. The analysis also looked at other locations farther afield, including his family lake house, his family members’ residences, and an apartment in his Wisconsin hometown where he reportedly has lived.

Location data is not anonymous. It cannot be made anonymous. I hope stories like these will teach people that.

Commercial Location Data Used to Out Priest

Post Syndicated from Bruce Schneier original https://www.schneier.com/blog/archives/2021/07/commercial-location-data-used-to-out-priest.html

A Catholic priest was outed through commercially available surveillance data. Vice has a good analysis:

The news starkly demonstrates not only the inherent power of location data, but how the chance to wield that power has trickled down from corporations and intelligence agencies to essentially any sort of disgruntled, unscrupulous, or dangerous individual. A growing market of data brokers that collect and sell data from countless apps has made it so that anyone with a bit of cash and effort can figure out which phone in a so-called anonymized dataset belongs to a target, and abuse that information.

There is a whole industry devoted to re-identifying anonymized data. This was something that Snowden showed that the NSA could do. Now it’s available to everyone.

Changes in WhatsApp’s Privacy Policy

Post Syndicated from Bruce Schneier original https://www.schneier.com/blog/archives/2021/01/changes-in-whatsapps-privacy-policy.html

If you’re a WhatsApp user, pay attention to the changes in the privacy policy that you’re being forced to agree with.

In 2016, WhatsApp gave users a one-time ability to opt out of having account data turned over to Facebook. Now, an updated privacy policy is changing that. Come next month, users will no longer have that choice. Some of the data that WhatsApp collects includes:

  • User phone numbers
  • Other people’s phone numbers stored in address books
  • Profile names
  • Profile pictures and
  • Status message including when a user was last online
  • Diagnostic data collected from app logs

Under the new terms, Facebook reserves the right to share collected data with its family of companies.

EDITED TO ADD (1/13): WhatsApp tries to explain.

The US Military Buys Commercial Location Data

Post Syndicated from Bruce Schneier original https://www.schneier.com/blog/archives/2020/11/the-us-military-buys-commercial-location-data.html

Vice has a long article about how the US military buys commercial location data worldwide.

The U.S. military is buying the granular movement data of people around the world, harvested from innocuous-seeming apps, Motherboard has learned. The most popular app among a group Motherboard analyzed connected to this sort of data sale is a Muslim prayer and Quran app that has more than 98 million downloads worldwide. Others include a Muslim dating app, a popular Craigslist app, an app for following storms, and a “level” app that can be used to help, for example, install shelves in a bedroom.

This isn’t new, this isn’t just data of non-US citizens, and this isn’t the US military. We have lots of instances where the government buys data that it cannot legally collect itself.

Some app developers Motherboard spoke to were not aware who their users’ location data ends up with, and even if a user examines an app’s privacy policy, they may not ultimately realize how many different industries, companies, or government agencies are buying some of their most sensitive data. U.S. law enforcement purchase of such information has raised questions about authorities buying their way to location data that may ordinarily require a warrant to access. But the USSOCOM contract and additional reporting is the first evidence that U.S. location data purchases have extended from law enforcement to military agencies.

On Executive Order 12333

Post Syndicated from Bruce Schneier original https://www.schneier.com/blog/archives/2020/09/on-executive-order-12333.html

Mark Jaycox has written a long article on the US Executive Order 12333: “No Oversight, No Limits, No Worries: A Primer on Presidential Spying and Executive Order 12,333“:

Abstract: Executive Order 12,333 (“EO 12333”) is a 1980s Executive Order signed by President Ronald Reagan that, among other things, establishes an overarching policy framework for the Executive Branch’s spying powers. Although electronic surveillance programs authorized by EO 12333 generally target foreign intelligence from foreign targets, its permissive targeting standards allow for the substantial collection of Americans’ communications containing little to no foreign intelligence value. This fact alone necessitates closer inspection.

This working draft conducts such an inspection by collecting and coalescing the various declassifications, disclosures, legislative investigations, and news reports concerning EO 12333 electronic surveillance programs in order to provide a better understanding of how the Executive Branch implements the order and the surveillance programs it authorizes. The Article pays particular attention to EO 12333’s designation of the National Security Agency as primarily responsible for conducting signals intelligence, which includes the installation of malware, the analysis of internet traffic traversing the telecommunications backbone, the hacking of U.S.-based companies like Yahoo and Google, and the analysis of Americans’ communications, contact lists, text messages, geolocation data, and other information.

After exploring the electronic surveillance programs authorized by EO 12333, this Article proposes reforms to the existing policy framework, including narrowing the aperture of authorized surveillance, increasing privacy standards for the retention of data, and requiring greater transparency and accountability.