In 2023, Cloudflare introduced a new load balancing solution supporting Local Traffic Management (LTM). This year, we took it a step further by introducing support for layer 4 load balancing to private networks via Spectrum. Now, organizations can seamlessly balance public HTTP(S), TCP, and UDP traffic to their privately hosted applications. Today, we’re thrilled to unveil our latest enhancement: support for end-to-end private traffic flows as well as WARP authenticated device traffic, eliminating the need for dedicated hardware load balancers! These groundbreaking features are powered by the enhanced integration of Cloudflare load balancing with our Cloudflare One platform, and are available to our enterprise customers. With this upgrade, our customers can now utilize Cloudflare load balancers for both public and private traffic directed at private networks.
Cloudflare Load Balancing today
Before discussing the new features, let’s review Cloudflare’s existing load balancing support and the challenges customers face.
Cloudflare currently supports four main load balancing traffic flows:
Internet-facing load balancers connecting to publicly accessible endpoints at layer 7, supporting HTTP(S).
Internet-facing load balancers connecting to publicly accessible endpoints at layer 4 (Spectrum), supporting TCP and UDP services
Internet-facing load balancers connecting to private endpoints at layer 7 HTTP(S) via Cloudflare Tunnels.
Internet-facing load balancers connecting to private endpoints at layer 4 (Spectrum), supporting TCP and UDP services via Cloudflare Tunnels.
One of the biggest advantages of Cloudflare’s load balancing solutions is the elimination of hardware costs and maintenance. Unlike hardware-based load balancers, which are costly to purchase, license, operate, and upgrade, Cloudflare’s solution requires no hardware. There’s no need to buy additional modules or new licenses, and you won’t face end-of-life issues with equipment that necessitate costly replacements.
With Cloudflare, you can focus on innovation and growth. Load balancers are deployed in every Cloudflare data center across the globe, in over 300 cities, providing virtually unlimited scale and capacity. You never need to worry about bandwidth constraints, deployment locations, extra hardware modules, downtime, upgrades, or supply chain constraints. Cloudflare’s global Anycast network ensures that every customer connects to a nearby data center and load balancer, where policies, rules, and steering are applied efficiently. And now, the resilience, scale, and simplicity of Cloudflare load balancers can be integrated into your private networks! We have worked hard to ensure that Cloudflare load balancers are highly available and disaster ready, from the core to the edge – even when datacenters lose power.
Keeping private resources private with Magic WAN
Before today’s announcement, all of Cloudflare’s load balancers operating at layer 4 have been connected to the public Internet. Customers have been able to secure the traffic flowing to their load balancers with WAF rules and Zero Trust policies, but some customers would prefer to keep certain resources private and under no circumstances exposed to the Internet. It’s been possible to isolate origin servers and endpoints this way, which can exist on private networks that are only accessible via Cloudflare Tunnels. And as of today, we can offer a similar level of isolation to customers’ layer 4 load balancers.
In our previous LTM blog post, we discussed connecting these internal or private resources to the Cloudflare global network and how Cloudflare would soon introduce load balancers that are accessible via private IP addresses. Unlike other Cloudflare load balancers, these do not have an associated hostname. Rather, they are accessible via an RFC 1918 private IP address. In the land of load balancers, this is often referred to as a virtual IP (VIP). As of today, load balancers that are accessible at private IPs can now be used within a virtual network to isolate traffic to a certain set of Cloudflare tunnels, enabling customers to load balance traffic within their private network without exposing applications to the public Internet.
The question you might be asking is, “If I have a private IP load balancer and privately hosted applications, how do I or my users actually reach these now-private services?”
Cloudflare Magic WAN can now be used as an on-ramp in tandem with Cloudflare load balancers that are accessible via an assigned private IP address. Magic WAN provides a secure and high-performance connection to internal resources, ensuring that traffic remains private and optimized across our global network. With Magic WAN, customers can connect their corporate networks directly to Cloudflare’s global network with GRE or IPSec tunnels, maintaining privacy and security while enjoying seamless connectivity. The Magic WAN Connector easily establishes connectivity to Cloudflare without the need to configure network gear, and it can be deployed at any physical or cloud location! With the enhancements to Cloudflare’s load balancing solution, customers can confidently keep their corporate applications resilient while maintaining the end-to-end privacy and security of their resources.
This enhancement opens up numerous use cases for internal load balancing, such as managing traffic between different data centers, efficiently routing traffic for internally hosted applications, optimizing resource allocation for critical applications, and ensuring high availability for internal services. Organizations can now replace traditional hardware-based load balancers, reducing complexity and lowering costs associated with maintaining physical infrastructure. By leveraging Cloudflare load balancing and Magic WAN, companies can achieve greater flexibility and scalability, adapting quickly to changing network demands without the need for additional hardware investments.
But what about latency? Load balancing is all about keeping your applications resilient and performant and Cloudflare was built with speed at its core. There is a Cloudflare datacenter within 50ms of 95% of the Internet-connected population globally! Now, we support all Cloudflare One on-ramps to not only provide seamless and secure connectivity, but also to dramatically reduce latency compared to legacy solutions. Load balancing also works seamlessly with Argo Smart Routing to intelligently route around network congestion to improve your application performance by up to 30%! Check out the blogs here and here to read more about how Cloudflare One can reduce application latency.
Supporting distributed users with Cloudflare WARP
But what about when users are distributed and not connected to the local corporate network? Cloudflare WARP can now be used as an on-ramp to reach Cloudflare load balancers that are configured with private IP addresses. The Cloudflare WARP client allows you to protect corporate devices by securely and privately sending traffic from those devices to Cloudflare’s global network, where Cloudflare Gateway can apply advanced web filtering. The WARP client also makes it possible to apply advanced Zero Trust policies that check a device’s health before it connects to corporate applications.
In this load balancing use case, WARP pairs up perfectly with Cloudflare Tunnels so that customers can place their private origins within virtual networks to help either isolate traffic or handle overlapping private IP addresses. Once these virtual networks are defined, administrators can configure WARP profiles to allow their users to connect to the proper virtual networks. Once connected, WARP takes the configuration of the virtual networks and installs routes on the end users’ devices. These routes will tell the end user’s device how to reach the Cloudflare load balancer that was created with a private, non-publicly routable IP address. The administrator could then create a DNS record locally that would point to that private IP address. Once DNS resolves locally, the device would route all subsequent traffic over the WARP connection. This is all seamless to the user and occurs with minimal latency.
How we connected load balancing to Cloudflare One
In contrast to public L4 or L7 load balancers, private L4 load balancers are not going to have publicly addressable hostnames or IP addresses, but we still need to be able to handle their traffic. To make this possible, we had to integrate existing load balancing services with private networking services created by our Cloudflare One team. To do this, upon creation of a private load balancer, we now assign a private IP address within the customer’s virtual network. When traffic destined for a private load balancer enters Cloudflare, our private networking services make a request to load balancing to determine which endpoint to connect to. The information in the response from load balancing is used to connect directly to a privately hosted endpoint via a variety of secure traffic off-ramps. This differs significantly from our public load balancers where traffic is off-ramped to the public internet. In fact, we can now direct traffic from any on-ramp to any off-ramp! This allows for significant flexibility in architecture. For example, not only can we direct WARP traffic to an endpoint connected via GRE or IPSec, but we can also off-ramp this traffic to Cloudflare Tunnel, a CNI connection, or out to the public internet! Now, instead of purchasing a bespoke load balancing solution for each traffic type, like an application or network load balancer, you can configure a single load balancing solution to handle virtually any permutation of traffic that your business needs to run!
Getting started with internal load balancing
We are excited to be releasing these new load balancing features that solve critical connectivity issues for our customers and effectively eliminate the need for a hardware load balancer. Cloudflare load balancers now support end-to-end private traffic flows with Cloudflare One. To get started with configuring this feature, take a look at our load balancing documentation.
We are just getting started with our local traffic management load balancing support. There is so much more to come including user experience changes, enhanced layer 4 session affinity, new steering methods, refined control of egress ports, and more.
Cloudflare’s network spans more than 320 cities in over 120 countries, where we interconnect with over 13,000 network providers in order to provide a broad range of services to millions of customers. The breadth of both our network and our customer base provides us with a unique perspective on Internet resilience, enabling us to observe the impact of Internet disruptions. Thanks to Cloudflare Radar functionality released earlier this year, we can explore the impact from a routing perspective, as well as a traffic perspective, at both a network and location level.
As we have seen in previous years, nationwide exams take place across several MENA countries in the second quarter, and with them come government directed Internet shutdowns. Cable cuts, both terrestrial and submarine, caused Internet outages across a number of countries, with the ACE submarine cable being a particular source of problems. Maintenance, power outages, and technical problems also disrupted Internet connectivity, as did unknown issues. And as we have frequently seen in the two-plus years since the conflict began, Internet connectivity in Ukraine suffers as a result of Russian attacks.
As we have noted in the past, this post is intended as a summary overview of observed disruptions, and is not an exhaustive or complete list of issues that have occurred during the quarter.
Government directed
Syria, Algeria, Iraq
Each spring, governments in several countries in the Middle East and North Africa (MENA) region order local telecommunications providers to shut down or disrupt Internet connectivity across the country in an effort to prevent students from cheating on national secondary and high school exams. These shutdowns/disruptions generally occur for several hours per day over a multi-week period. We covered such events in 2023, 2022, and 2021, as they occurred in locations including Syria, Sudan, Algeria, and Iraq.
In June, we published Exam-ining recent Internet shutdowns in Syria, Iraq, and Algeria, which examined the daily Internet shutdowns that took place in Iraq and Syria, as well as the two multi-hour daily disruptions in Algeria, which appeared to be pursuing a content blocking strategy, rather than a full nationwide shutdown. The post examined the impact that these shutdowns have on Internet traffic, and also analyzed routing information and traffic from other Cloudflare services in an effort to better understand how these shutdowns are being implemented.
In addition to the shutdowns covered in the previously referenced blog post, Iraq implemented a second round of shutdowns that started on June 23, and ran through at least July 14. Some of these shutdowns impacted the same set of networks seen in the first round, and some impacted networks in the autonomous Kurdistan region in the north.
Both sets of shutdowns reviewed above appeared to have followed the same approach as the first round covered in the earlier blog post.
Kenya, Burundi, Uganda, Rwanda, Tanzania
Concerns over a potential Internet shutdown during planned protests against tax increases proposed in “Finance Bill 2024” by the Kenyan government led to the publication of a joint statement signed by multiple organizations. The statement strongly urged the Kenyan government to refrain from enforcing any
Internet shutdowns or information controls, and highlighted the “disastrous economic effects” such a move could have. In response, the Communications Authority of Kenya issued a press release stating that “For the avoidance of doubt, the Authority has no intention whatsoever to shut down Internet traffic or interfere with the quality of connectivity. Such actions would be a betrayal of the Constitution as a whole, the freedom of expression in particular and our own ethos.”
As protests escalated on June 25, Internet traffic in Kenya dropped at 16:30 local time (13:30 UTC). Initially, this outage was thought to be due to issues with one or more undersea cables that provide international connectivity to the country, with the potential cause supported by social media posts from Safaricom and Airtel.
Similar concurrent drops in Internet traffic were observed in Burundi, Uganda, Rwanda, and Tanzania, as shown below. Issues with submarine cables connected to one country can impact Internet connectivity in other countries if there is a dependency on that country/cable for upstream Internet connectivity. As such, the observed disruptions in those four countries were not that unusual. To that end, a (subsequently deleted) post on X from MTN Uganda noted: “Our esteemed customers, We are experiencing a degraded service on all our internet services due to an outage caused by our connectivity supply through Kenya. Our technical teams and partners are working jointly to resolve the issue in the shortest time possible. In the interim, we kindly advise our customers to use *165# to access Mobile Money and other app based services. Thank you.“
However, other participants in the Internet infrastructure community in Africa called the undersea cable outage explanation into question. Kyle Spencer, Executive Director of the Uganda Internet eXchange Point, posted on X that “I am told the Kenyan government ordered sea cable landing stations to disconnect circuits.” Ben Roberts, Group CTIO at Liquid Intelligent Technologies (a pan-African network infrastructure provider), posted “No cables are damaged this week.” In addition, outages on undersea cables are rarely, if ever, resolved in a matter of hours, as this disruption was – they frequently last for days or weeks.
On June 26, Safaricom’s CEO claimed “This outage was occasioned by reduced bandwidth on some cables that carry Internet traffic”, contradicting the company’s original claim. No additional information was forthcoming from Airtel or the Communications Authority of Kenya, but as noted above, some within the industry believe that the disruption that impacted connectivity in Kenya, Burundi, Uganda, Rwanda, and Tanzania was directed by the government of Kenya, and was not caused by submarine cable outages.
Cable cuts
Haiti
At 17:36 local time (21:36 UTC) on April 28, Digicel Haiti posted an “important note” on X that stated in part (translated) “On April 27, 2024, the company suffered several attacks on its international optical infrastructure in the Drouya area on National Road #1. The optical fiber was damaged by the impact of cartridges after the armed clashes in the area for a few days. It affected several services such as internet (data), SMS, MonCash and international calling. For now, we are happy to inform the population that all services are restored to 100%.” The graph below shows the impact of the fiber damage, with AS27653 (Digicel Haiti) suffering an Internet outage lasting nearly 24 hours, from around 17:30 local time (21:30 UTC) on April 27 through approximately 16:00 local time (20:00 UTC) on April 28, after which traffic quickly recovered.
Then on May 3, The Director General of Digicel Haiti posted on X that (translated) “Digicel is informing the general public that it suffered two more damages to its international fiber infrastructure at 2am this morning. We have restored Moncash services, SMS, and Fiber Optic connections. Our crews are already on their way to address the apparent landslide in the Canaan area.” The disruption caused by this fiber damage lasted for approximately eight hours, between 02:15 – 10:30 local time (06:15 – 14:30 UTC), and as seen in the graph below, appeared to have a nominal impact on traffic.
On Sunday, May 12, issues with the EASSy and Seacom submarine cables again disrupted connectivity to East Africa, impacting a number of countries previously affected by a set of cable cuts that occurred nearly three months earlier. Insight into these earlier cable cuts and the initial impact of May’s cable damage was covered in our East African Internet connectivity again impacted by submarine cable cuts blog post.
Traffic levels across a number of the impacted countries dropped just before 11:00 local time (08:00 UTC). The magnitude of the initial impact varied by country, with traffic initially dropping by 10-25% in Kenya, Uganda, Madagascar, and Mozambique, while traffic in Rwanda, Malawi, and Tanzania dropped by one-third or more than compared to the previous week. The overall impact was most significant in Tanzania, Madagascar, and Rwanda, as seen in the graphs below. Traffic returned to expected levels at various times over the following week, ranging from a day and a half later (May 13) in Kenya to a week later (May 19) in Rwanda.
Repairs to the EASSy and Seacom cables were completed on May 31. Repairs to the cables damaged in February were ongoing as of July 9, as their location in a war zone complicates repair efforts.
Chad
A reported fiber optic cable cut in Cameroon disrupted Internet connectivity for customers of Moov Africa TChad on May 25. The outage lasted three hours, between 15:15 -18:15 local time (14:15 – 17:15 UTC), with the impact visible at a country level as well. Routing was disrupted too, as the number of IPv4 /24 prefixes (256 IPv4 addresses) announced by Moov Africa Tchad fell from eight to three during the disruption.
The event was similar to one that occurred on January 10, when Moov Africa Tchad and country-level traffic was disrupted for over 12 hours “due to a cut in the optical fiber coming from Cameroon through which Chad has access to the Internet”. During that event, significant volatility was also observed from a routing perspective, as the volume of announced IPv4 address space shifted frequently at a network and country level during the disruption. As we noted last quarter, as a landlocked country, Chad is dependent on terrestrial Internet connections to/through neighboring countries, and the AfTerFibre cable map illustrates Chad’s reliance on limited cable paths through Cameroon and Sudan.
Gambia, Mauritania, Senegal
A reported “network interruption” on the Africa Coast to Europe (ACE) submarine cable disrupted traffic across networks in the Gambia, Mauritania, and Senegal on June 5. AS25250 (Gamtel), AS29544 (Mauritel), and AS37649 (Free/Tigo) all saw traffic drop around 23:00 local time (23:00 UTC). As seen in the graphs below, the outage lasted for nearly 11 hours, with traffic recovering just 10:00 local time on June 6 (10:00 UTC). Mauritel saw a near complete outage, while Gamtel and Free/Tigo saw less severe impacts, possibly because they were able to shift traffic to back up links.
Maintenance
Guinea, Gambia, Sierra Leone, Liberia
Above, we discussed an unexpected network interruption on the ACE submarine cable that caused outages across multiple countries on June 5. However, two months earlier, a planned outage for repair work on the cable also disrupted connectivity across multiple African countries. A communiqúe issued by the Ministry of Posts, Telecommunications and the Digital Economy in Guinea noted in part (translated) “…the ACE (Africa Coast to Europe) network will undergo a planned outage on April 8, 2024, between midnight and 2:00 a.m. morning in the following countries: Guinea, Senegal, Gambia, Sierra Leone and Liberia. This total outage of approximately 2 hours will affect Internet traffic and international calls.”
The graphs below show the impact to traffic in the listed countries for the planned two-hour repair window, though it appears that traffic did not return fully to expected levels after the repair window concluded – it is unclear why it remained slightly depressed. In addition, despite being listed as one of the impacted countries, no impact to traffic was observed in Senegal.
Guinea
Rounding out a trifecta of entries about the ACE submarine cable, planned maintenance work on the cable by GUILAB reportedly caused a multi-hour outage at AS37461 (Orange Guinea) and at a country level as well, lasting from 12:15 – 15:45 local time (12:15 – 15:45 UTC). (GUILAB is the company in charge of managing the capacity allocated to Guinea on the ACE submarine cable.) The maintenance work was reported by Orange Guinea in two X posts (1, 2), although these posts were subsequently deleted.
Power outage
Kenya
At 18:30 local time (15:30 UTC) on May 2, Kenya Power posted a “Power Outage Alert” on X that stated “At 5:40 PM (EAT) today, Thursday, 2nd May 2024, we experienced a system disturbance on the grid, resulting in power supply disruption in most parts of the country.” The graph below shows the resultant impact on Internet connectivity in the country, with traffic dropping sharply between 17:30 – 17:45 local time (14:30 – 14:45 UTC). The drop in traffic lasted until approximately 21:30 local time (18:30 UTC), the same time that Kenya Power posted a “Power Supply Restoration” notice on X, highlighting the restoration of power to parts of the country. Although the post-outage spike seen in the graph would suggest pent-up demand for online content, a longer-term view of Kenya’s Internet traffic shows traffic peaks at the same time (22:00 local time, 19:00 UTC) during the preceding two days as well.
Ecuador
A nationwide power outage in Ecuador on June 19 impacted hospitals, homes, and the subway, in addition to causing a major disruption to Internet connectivity. The graph below shows Ecuador’s Internet traffic dropping sharply just after 15:00 local time (20:00 UTC). A post on X from Public Works Minister Roberto Luque explained (translated) “The immediate report that we received from CENACE is that there is a failure in the transmission line that caused a cascade disconnection, so there is no energy service on a national scale.” A subsequent post pointed at a lack of investment in the underlying systems, and noted that as of 18:41 pm local time (23:41 UTC), “95% of the energy has already been restored”. After the initial sharp drop, traffic began to recover fairly quickly, and was effectively back to expected levels by the stated time.
Albania, Bosnia, Montenegro
A sudden increase in power consumption related to increased usage due to high temperatures, as well electrical systems being impacted by the heat, caused a widespread power outage across Montenegro, Bosnia, and Montenegro on June 21. The outage reportedly originated in Montenegro after a 400-kilowatt transmission line exploded. While power outages are generally more localized to a single country, or region within a country, power distribution systems are linked across Balkan countries as part of the Trans-Balkan Electricity Corridor.
Published reports (MSN, Reuters) noted that electrical networks went down 12:00 – 13:00 local time (10:00 – 11:00 UTC), and that electricity suppliers in the impacted countries started restoring power by mid-afternoon, and had it largely restored by the evening. The graphs below show traffic from Albania, Bosnia, and Montenegro starting to drop around 12:00 local time (10:00 UTC), reaching its nadir in Albania and Bosnia at 12:30 local time (10:30 UTC) and at 13:00 local time (11:00 UTC) in Montenegro. Traffic recovered gradually over the next several hours as power was restored, returning to expected levels by 15:30 local time (13:30 UTC).
Croatia was reportedly impacted by the power outage as well, but no adverse impact to traffic at a country level is visible during the timeframe that connectivity in the other countries was disrupted.
Military action
Ukraine
During the two-plus years of the Russia-Ukraine conflict, Ukraine’s power grid has been a frequent target for Russian air attacks. When damage to Ukraine’s electrical power infrastructure occurs as a result of these attacks, Internet connectivity is also disrupted. Attacks on May 21 caused power outages across a number of areas in Ukraine. The most significant impact was in Sumy, where traffic dropped as low as 82% below the previous week at 00:00 on May 22 local time (21:00 UTC). As the graphs below illustrate, traffic was also lower than the previous week for several hours in Kyiv, Kharkiv, and Vinnytsia, with traffic returning to expected levels by around 08:00 local time (05:00 UTC) on May 22.
\
Technical problems
Malaysia
As we’ve covered in previous quarterly posts, Internet outages and disruptions aren’t always due to significant wide-scale events like severe weather, power outages, or cable cuts. Sometimes more mundane technical issues can cause problems when users try to access the Internet. One example of this occurred on April 15 in Malaysia, when customers of Time Internet experienced a network outage for nearly two hours. The company explained the reason for the outage in a contrite post on their Facebook page, stating in part “This Internet service outage was by far the worst in our history – affecting approximately 40% of our customers. … At 5.38pm today, both our primary and secondary Secure DNS servers became unreachable. This means that any browser or service requiring a DNS address resolution was not able to reach its intended site.” Because subscribers could not reach Time Internet’s DNS resolvers, they were unable to resolve hostnames for Internet services, sites, and applications, including those delivered by Cloudflare. This resulted in the drop in traffic seen in the graph below, which started just after 17:00 local time (05:00 UTC), and began to recover approximately an hour later. The company did not provide any additional information on what caused the DNS servers to fail.
Nepal
In Nepal, a number of local Internet service providers including AS45650 (Vianet) and AS139922 (Dishhome) rely on Indian provider Bharti Airtel for upstream connectivity, enabling them to reach the rest of the Internet. A published report underscores the reliance, noting “Nepali ISPs buy 70 percent of their internet from Airtel.”
On April 25, these ISPs warned that their services could be interrupted because the Nepali government had not provided them with foreign exchange services that would enable them to pay bandwidth vendors such as Airtel, whom they reportedly owed USD $30 million to. On May 1, Airtel informed the delinquent Nepali providers that Internet services may be interrupted at any time due to the overdue payment, and on May 2, Airtel took that step. The graphs below show Vianet’s traffic dropping to near zero at 16:15 local time (10:30 UTC), recovering to expected levels six hours later. An hour later, at 17:15 local time (11:30 UTC), Dishhome’s traffic dropped significantly, though not as severely as Vianet’s. Dishhome’s traffic also recovered approximately six hours later.
A month later, on June 3, AS45650 (Vianet) and AS17501 (Worldlink) in Nepal experienced Internet disruptions that were reportedly caused by routing issues on Bharti Airtel’s network. On Worldlink, a drop in traffic occurred between 12:15 – 14:00 local time (06:30 – 08:15 UTC), while on Vianet, the loss of traffic took place between 12:15 – 13:15 local time (06:30 – 07:30 local time).
Unknown
Most of the Internet disruptions covered in this blog post series have a known root cause, whether admitted/stated by the impacted provider(s) or closely associated with a real world event (severe weather, power outage, etc.) However, other disruptions are observed and even publicized by the impacted provider, but no underlying reason for the outage is ever made public.
Malaysia
On May 21, CelcomDigi (AS10030)posted on X that it was experiencing an outage on its network, and that it was working to resolve the issue as soon as possible. However. just 12 minutes later, it published a second post stating that it had fully restored Celcom Internet service. These posts were made at 21:35 and 21:47 local time (13:35 and 13:47) respectively. However, as the graph below shows, traffic volumes had returned to expected levels over an hour earlier, as the observed Internet disruption on Celcom’s network lasted between 18:00 – 20:15 local time (10:00 – 12:15 UTC). (Note that the second disruption shown in the graph below was due to an internal Cloudflare data pipeline issue, and not any sort of problem with Celcom’s network.)
Starlink
SpaceX Starlink’s satellite Internet service is unique in that it has an international subscriber base, so outages on its network have a more wide-reaching impact than issues with an ISP that covers a single country. At 01:59 UTC on May 29, Starlinkshared on X that it was currently experiencing a network outage, and that it was actively implementing a solution. Twenty-eight minutes later, it posted “The network issue has been fully resolved.” This brief outage is visible in the graph below as a slight dip in traffic. However, what is particularly interesting is the spike in traffic to Cloudflare from Starlink’s network following the resolution of the outage. The sharp increase and rapid decline of the traffic curve after service was restored suggests that it may be related to an automated connectivity check of some kind, rather than pent-up user demand for content.
Chad
A near-complete Internet outage was observed in Chad on June 5 between 08:15 – 12:00 local time (07:15 – 11:00 UTC), as seen in the graph below. Routing was also impacted, as the number of IPv4 /24 address blocks (256 IPv4 addresses) announced by network providers in the country dropped by as much as 75% during the outage.
A news item covering the outage noted that only Starlink subscribers retained Internet access during the outage. It also noted that Chad has faced recurring Internet disruptions since 2016, either because of problems with fiber-optic cables, or due to government directed shutdowns in the name of national security. It is unclear what ultimately caused this particular outage.
India
With an estimated subscriber base in excess of over 460 million, any Internet disruption affecting Reliance Jio’s network (AS55836) is going to have a widespread impact across India. On June 18, Reliance Jio experienced two disruptions that occurred between 13:15 – 17:15 local time (07:45 – 11:45 UTC). Each disruption lasted less than an hour, and dropped traffic levels to approximately half of those seen at the same time a week prior. Both mobile and fiber connectivity was affected, and no additional information has been provided by Reliance Jio regarding the root cause of the connectivity issues.
Conclusion
As we become increasingly dependent on reliable Internet connectivity, we must recognize that that connectivity is itself reliant on a complex and interconnected foundation of physical, technical, and political factors. A failure in any one of these foundational components, whether due to a cable cut, power outage, misconfiguration, or government action, can have a significant impact, disrupting Internet connectivity for millions of users, potentially across multiple countries. While the resilience and reliability of the physical and technical components can be improved through redundancy and best practices, political factors have arguably proven to be the hardest to address. However, organizations like AccessNow, through their #KeepItOn campaign, mobilize people, communities, and civil society actors globally to fight against government-directed Internet shutdowns, which can have significant financial consequences.
My colleagues and fellow AWS News Blog writers Veliswa Boya and Sébastien Stormacq were at the AWS Community Day Cameroon last week. They were energized to meet amazing professionals, mentors, and students – all willing to learn and exchange thoughts about cloud technologies. You can access the video replay to feel the vibes or just watch some of the talks!
Last week’s launches In addition to the launches at the New York Summit, here are a few others that got my attention.
Advanced RAG capabilities Knowledge Bases for Amazon Bedrock – These include custom chunking options to enable customers to write their own chunking code as a Lambda function; smart parsing to extract information from complex data such as tables; and query reformulation to break down queries into simpler sub-queries, retrieve relevant information for each, and combine the results into a final comprehensive answer.
Amazon Bedrock Prompt Management and Prompt Flows– This is a preview launch of Prompt Management that help developers and prompt engineers get the best responses from foundation models for their use cases; and Prompt Flows accelerates the creation, testing, and deployment of workflows through an intuitive visual builder.
IDE workspace context awareness in Amazon Q Developer chat – Users can now add @workspace to their chat message in Q Developer to ask questions about the code in the project they currently have open in the IDE. Q Developer automatically ingests and indexes all code files, configurations, and project structure, giving the chat comprehensive context across your entire application within the IDE.
Amazon EC2 R8g instances powered by AWS Graviton4 are now generally available – Amazon EC2 R8g instances are ideal for memory-intensive workloads such as databases, in-memory caches, and real-time big data analytics. These are powered by AWS Graviton4 processors and deliver up to 30% better performance compared to AWS Graviton3-based instances.
Vector search for Amazon MemoryDB is now generally available – Vector search for MemoryDB enables real-time machine learning (ML) and generative AI applications. It can store millions of vectors with single-digit millisecond query and update latencies at the highest levels of throughput with >99% recall.
Introducing Valkey GLIDE, an open source client library for Valkey and Redis open source – Valkey is an open source key-value data store that supports a variety of workloads such as caching, and message queues. Valkey GLIDE is one of the official client libraries for Valkey and it supports all Valkey commands. GLIDE supports Valkey 7.2 and above, and Redis open source 6.2, 7.0, and 7.2.
Open source release of Secrets Manager Agent for AWS Secrets Manager – Secrets Manager Agent is a language agnostic local HTTP service that you can install and use in your compute environments to read secrets from Secrets Manager and cache them in memory, instead of making a network call to Secrets Manager.
Amazon CloudFront announces managed cache policies for web applications – Previously, Amazon CloudFront customers had two options for managed cache policies, and had to create custom cache policies for all other cases. With the new managed cache policies, CloudFront caches content based on the Cache-Control headers returned by the origin, and defaults to not caching when the header is not returned.
AWS open source news and updates – My colleague Ricardo Sueiras writes about open source projects, tools, and events from the AWS Community; check out Ricardo’s page for the latest updates.
Upcoming AWS events Check your calendars and sign up for upcoming AWS events:
AWS Summits – Join free online and in-person events that bring the cloud computing community together to connect, collaborate, and learn about AWS. To learn more about future AWS Summit events, visit the AWS Summit page. Register in your nearest city: Bogotá (July 18), Taipei (July 23–24), AWS Summit Mexico City (Aug. 7), and AWS Summit Sao Paulo (Aug. 15).
AWS Community Days – Join community-led conferences that feature technical discussions, workshops, and hands-on labs led by expert AWS users and industry leaders from around the world. Upcoming AWS Community Days are in Aotearoa (Aug. 15), Nigeria (Aug. 24), New York (Aug. 28), and Belfast (Sept. 6).
On June 25, Matthew Wilcox posted
a second version of a patch set
introducing a new
data structure called rosebush, which
“is a resizing, scalable, cache-aware, RCU optimised hash
table.” The kernel already has generic hash tables, though, including rhashtable. Wilcox believes that the design of
rhashtable is not the best choice for performance, and has written rosebush as
an alternative for use in the
directory-entry cache (dcache) — the filesystem cache used to speed up
file-name lookup.
Citations of scientific work abide by a standardized referencing system: Each reference explicitly mentions at least the title, authors’ names, publication year, journal or conference name, and page numbers of the cited publication. These details are stored as metadata, not visible in the article’s text directly, but assigned to a digital object identifier, or DOI—a unique identifier for each scientific publication.
References in a scientific publication allow authors to justify methodological choices or present the results of past studies, highlighting the iterative and collaborative nature of science.
However, we found through a chance encounter that some unscrupulous actors have added extra references, invisible in the text but present in the articles’ metadata, when they submitted the articles to scientific databases. The result? Citation counts for certain researchers or journals have skyrocketed, even though these references were not cited by the authors in their articles.
[…]
In the journals published by Technoscience Academy, at least 9% of recorded references were “sneaked references.” These additional references were only in the metadata, distorting citation counts and giving certain authors an unfair advantage. Some legitimate references were also lost, meaning they were not present in the metadata.
In addition, when analyzing the sneaked references, we found that they highly benefited some researchers. For example, a single researcher who was associated with Technoscience Academy benefited from more than 3,000 additional illegitimate citations. Some journals from the same publisher benefited from a couple hundred additional sneaked citations.
Be careful what you’re measuring, because that’s what you’ll get. Make sure it’s what you actually want.
This post is co-written with Çağrı Çakır and Özge Kavalcı from PostNL.
PostNL is the designated universal postal service provider for the Netherlands and has three main business units offering postal delivery, parcel delivery, and logistics solutions for ecommerce and cross-border solutions. With 5,800 retail points, 11,000 mailboxes, and over 900 automated parcel lockers, the company plays an important role in the logistics value chain. It aims to be the delivery organization of choice by making it as easy as possible to send and receive parcels and mail. With almost 34,000 employees, PostNL is at the heart of society. On a typical weekday, the company delivers an average of 1.1 million parcels and 6.9 million letters across Belgium, Netherlands, and Luxemburg.
In this post, we describe the legacy PostNL stream processing solution, its challenges, and why PostNL chose Amazon Managed Service for Apache Flink to help modernize their Internet of Things (IoT) data stream processing platform. We provide a reference architecture, describe the steps we took to migrate to Apache Flink, and the lessons learned along the way.
With this migration, PostNL has been able to build a scalable, robust, and extendable stream processing solution for their IoT platform. Apache Flink is a perfect fit for IoT. Scaling horizontally, it allows processing the sheer volume of data generated by IoT devices. With event time semantics, you can correctly handle events in the order they were generated, even from occasionally disconnected devices.
PostNL is excited about the potential of Apache Flink, and now plans to use Managed Service for Apache Flink with other streaming use cases and shift more business logic upstream into Apache Flink.
Apache Flink and Managed Service for Apache Flink
Apache Flink is a distributed computation framework that allows for stateful real-time data processing. It provides a single set of APIs for building batch and streaming jobs, making it straightforward for developers to work with bounded and unbounded data. Managed Service for Apache Flink is an AWS service that provides a serverless, fully managed infrastructure for running Apache Flink applications. Developers can build highly available, fault-tolerant, and scalable Apache Flink applications with ease and without needing to become an expert in building, configuring, and maintaining Apache Flink clusters on AWS.
The challenge of real-time IoT data at scale
Today, PostNL’s IoT platform, Roller Cages solution, tracks more than 380,000 assets with Bluetooth Low Energy (BLE) technology in near real time. The IoT platform was designed to provide availability, geofencing, and bottom state events of each asset by using telemetry sensor data such as GPS points and accelerometers that are coming from Bluetooth devices. Those events are used by different internal consumers to make logistical operations straightforward to plan, more efficient, and sustainable.
Tracking this high volume of assets emitting different sensor readings inevitably creates billions of raw IoT events for the IoT platform as well as for the downstream systems. Handling this load repeatedly both within the IoT platform and throughout the downstream systems was neither cost-efficient nor easy to maintain. To reduce the cardinality of events, the IoT platform uses stream processing to aggregate data over fixed time windows. These aggregations must be based on the moment when the device emitted the event. This type of aggregation based on event time becomes complex when messages may be delayed and arrive out of order, which may frequently happen with IoT devices that can get disconnected temporarily.
The following diagram illustrates the overall flow from edge to the downstream systems.
The workflow consists of the following components:
The edge architecture includes IoT BLE devices that serve as sources of telemetry data, and gateway devices that connect these IoT devices to the IoT platform.
The aggregation application filters IoT detections, aggregates them for a fixed time window, and sinks aggregations to the destination data stream.
Event producers are the combination of different stateful services that generate IoT events such as geofencing, availability, bottom state, and in-transit.
Consumers, which are internal teams, interpret IoT events and build business logic based on them.
The core component of this architecture is the aggregation application. This component was originally implemented using a legacy stream processing technology. For several reasons, as we discuss shortly, PostNL decided to evolve this critical component. The journey of replacing the legacy stream processing with Managed Service for Apache Flink is the focus of the rest of this post.
The decision to migrate the aggregation application to Managed Service for Apache Flink
As the number of connected devices grows, so does the necessity for a robust and scalable platform capable of handling and aggregating massive volumes of IoT data. After thorough analysis, PostNL opted to migrate to Managed Service for Apache Flink, driven by several strategic considerations that align with evolving business needs:
Enhanced data aggregation – Using Apache Flink’s strong capabilities in real-time data processing enables PostNL to efficiently aggregate raw IoT data from various sources. The ability to extend the aggregation logic beyond what was provided by the current solution can unlock more sophisticated analytics and more informed decision-making processes.
Scalability – The managed service provides the ability to scale your application horizontally. This allows PostNL to handle increasing data volumes effortlessly as the number of IoT devices grows. This scalability means that data processing capabilities can expand in tandem with the business.
Focus on core business – By adopting a managed service, the IoT platform team can focus on implementing business logic and develop new use cases. The learning curve and overhead of operating Apache Flink at scale would have diverted valuable energies and resources of the relatively small team, slowing down the adoption process.
Cost-effectiveness – Managed Service for Apache Flink employs a pay-as-you-go model that aligns with operational budgets. This flexibility is particularly beneficial for managing costs in line with fluctuating data processing needs.
Challenges of handling late events
Common stream processing use cases require aggregating events based on when they were generated. This is called event time semantics. When implementing this type of logic, you may encounter the problem of delayed events, in which events reach your processing system late, long after other events generated around the same time.
Late events are common in IoT due to reasons inherent to the environment, such as network delays, device failures, temporarily disconnected devices, or downtime. IoT devices often communicate over wireless networks, which can introduce delays in transmitting data packets. And sometimes they may experience intermittent connectivity issues, resulting in data being buffered and sent in batches after connectivity is restored. This may result in events being processed out of order—some events may be processed several minutes after other events that were generated around the same time.
Imagine you want to aggregate events generated by devices within a specific 10-second window. If events can be several minutes late, how can you be sure you have received all events that were generated in those 10 seconds?
A simple implementation may just wait for several minutes, allowing late events to arrive. But this method means that you can’t calculate the result of your aggregation until several minutes later, increasing the output latency. Another solution would be waiting a few seconds, and then dropping any events arriving later.
Increasing latency or dropping events that may contain critical information are not palatable options for the business. The solution must be a good compromise, a trade-off between latency and completeness.
Apache Flink offers event time semantics out of the box. In contrast to other stream processing frameworks, Flink offers multiple options for dealing with late events. We dive into how Apache Flink deal with late events next.
A powerful stream processing API
Apache Flink provides a rich set of operators and libraries for common data processing tasks, including windowing, joins, filters, and transformations. It also includes over 40 connectors for various data sources and sinks, including streaming systems like Apache Kafka and Amazon Managed Streaming for Apache Kafka, or Kinesis Data Streams, databases, and also file system and object stores like Amazon Simple Storage Service (Amazon S3).
But the most important characteristic for PostNL is that Apache Flink offers different APIs with different level of abstractions. You can start with a higher level of abstraction, SQL, or Table API. These APIs abstract streaming data as more familiar tables, making them easier to learn for simpler use cases. If your logic becomes more complex, you can switch to the lower level of abstraction of the DataStream API, where streams are represented natively, closer to the processing happening inside Apache Flink. If you need the finest-grained level of control on how each single event is handled, you can switch to the Process Function.
A key learning has been that choosing one level of abstraction for your application is not an irreversible architectural decision. In the same application, you can mix different APIs, depending on the level of control you need at that specific step.
Scaling horizontally
To process billions of raw events and grow with the business, the ability to scale was an essential requirement for PostNL. Apache Flink is designed to scale horizontally, distributing processing and application state across multiple processing nodes, with the ability to scale out further when the workload grows.
For this particular use case, PostNL had to aggregate the sheer volume of raw events with similar characteristics and over time, to reduce their cardinality and make the data flow manageable for the other systems downstream. These aggregations go beyond simple transformations that handle one event at a time. They require a framework capable of stateful stream processing. This is exactly the type of use case Apache Flink was designed for.
Advanced event time semantics
Apache Flink emphasizes event time processing, which enables accurate and consistent handling of data with respect to the time it occurred. By providing built-in support for event time semantics, Flink can handle out-of-order events and late data gracefully. This capability was fundamental for PostNL. As mentioned, IoT generated events may arrive late and out of order. However, the aggregation logic must be based on the moment the measurement was actually taken by the device—the event time—and not when it’s processed.
Resiliency and guarantees
PostNL had to make sure no data sent from the device is lost, even in case of failure or restart of the application. Apache Flink offers strong fault tolerance guarantees through its distributed snapshot-based checkpointing mechanism. In the event of failures, Flink can recover the state of the computations and achieve exactly-once semantics of the result. For example, each event from a device is never missed nor counted twice, even in the event of an application failure.
The journey of choosing the right Apache Flink API
A key requirement of the migration was reproducing exactly the behavior of the legacy aggregation application, as expected by the downstream systems that can’t be modified. This introduced several additional challenges, in particular around windowing semantics and late event handling.
As we have seen, in IoT, events may be out of order by several minutes. Apache Flink offers two high-level concepts for implementing event time semantics with out-of-order events: watermarks and allowed lateness.
Apache Flink provides a range of flexible APIs with different levels of abstraction. After some initial research, Flink-SQL and the Table API were discarded. These higher levels of abstraction provide advanced windowing and event time semantics, but couldn’t provide the fine-grained control PostNL needed to reproduce exactly the behavior of the legacy application.
The lower level of abstraction of the DataStream API also offers windowing aggregation capabilities, and allows you to customize the behaviors with custom triggers, evictors, and handling late events by setting an allowed lateness.
Unfortunately, the legacy application was designed to handle late events in a peculiar way. The result was a hybrid event time and processing time logic that couldn’t be easily reproduced using high-level Apache Flink primitives.
Fortunately, Apache Flink offers a further lower level of abstraction, the ProcessFunction API. With this API, you have the finest-grained control on application state, and you can use timers to implement virtually any custom time-based logic.
PostNL decided to go in this direction. The aggregation was implemented using a KeyedProcessFunction that provides a way to perform arbitrary stateful processing on keyed streams—logically partitioned streams. Raw events from each IoT device are aggregated based on their event time (the timestamp written on the event by the source device) and the results of each window is emitted based on processing time (the current system time).
This fine-grained control finally allowed PostNL to reproduce exactly the behavior expected by the downstream applications.
The journey to production readiness
Let’s explore the journey of migrating to Managed Service for Apache Flink, from the start of the project to the rollout to production.
Identifying requirements
The first step of the migration process focused on thoroughly understanding the existing system’s architecture and performance metrics. The goal was to provide a seamless transition to Managed Service for Apache Flink with minimal disruption to ongoing operations.
Understanding Apache Flink
PostNL needed to familiarize themselves with the Managed Service for Apache Flink application and its streaming processing capabilities, including built-in windowing strategies, aggregation functions, event time vs. processing time differences, and finally KeyProcessFunction and mechanisms for handling late events.
Different options were considered, using primitives provided by Apache Flink out of the box, for event time logic and late events. The biggest requirement was to reproduce exactly the behavior of the legacy application. The ability to switch to using a lower level of abstraction helped. Using the finest-grained control allowed by the ProcessFunction API, PostNL was able to handle late events exactly as the legacy application.
Designing and implementing ProcessFunction
The business logic is designed using ProcessFunction to emulate the peculiar behavior of the legacy application in handling late events without excessively delaying the initial results. PostNL decided to use Java for the implementation, because Java is the primary language for Apache Flink. Apache Flink allows you to develop and test your application locally, in your preferred integrated development environment (IDE), using all the available debug tools, before deploying it to Managed Service for Apache Flink. Java 11 with Maven compiler was used for implementation. For more information about IDE requirements, refer to Getting started with Amazon Managed Service for Apache Flink (DataStream API).
Testing and validation
The following diagram shows the architecture used to validate the new application.
To validate the behavior of the ProcessFunction and late event handling mechanisms, integration tests were designed to run both the legacy application and the Managed Service for Flink application in parallel (Steps 3 and 4). This parallel execution allowed PostNL to directly compare the results generated by each application under identical conditions. Multiple integration test cases push data to the source stream (2) in parallel (7) and wait until their aggregation window is complete, then they pull the aggregated results from the destination stream to compare (8). Integration tests are automatically triggered by the CI/CD pipeline after deployment of the infrastructure is complete. During the integration tests, the primary focus was on achieving data consistency and processing accuracy between the legacy application and the Managed Service for Flink application. The output streams, aggregated data, and processing latencies were compared to validate that the migration didn’t introduce any unexpected discrepancies. For writing and running the integration tests, Robot Framework, an open source automation framework, was utilized.
After the integration tests are passed, there is one more validation layer: end-to-end tests. Similar to the integration tests, end-to-end tests are automatically invoked by the CI/CD pipeline after the deployment of the platform infrastructure is complete. This time, multiple end-to-end test cases send data to AWS IoT Core (1) in parallel (9) and check the aggregated results from the destination S3 bucket (5, 6) dumped from the output stream to compare (10).
Deployment
PostNL decided to run the new Flink application on shadow mode. The new application ran for some time in parallel with the legacy application, consuming exactly the same inputs, and sending output from both applications to a data lake on Amazon S3. This allowed them to compare the results of the two applications using real production data, and also to test the stability and performance of the new one.
Performance optimization
During migration, the PostNL IoT platform team learned how the Flink application can be fine-tuned for optimal performance, considering factors such as data volume, processing speed, and efficient late event handling. A particularly interesting aspect was to verify that the state size wasn’t increasing unbounded over the long term. A risk of using the finest-grained control of ProcessFunction is state leak. This happens when your implementation, directly controlling the state in the ProcessFunction, misses some corner cases where a state is never deleted. This causes the state to grow unbounded. Because streaming applications are designed to run continuously, an expanding state can degrade performance and eventually exhaust memory or local disk space.
With this phase of testing, PostNL found the right balance of application parallelism and resources—including compute, memory, and storage—to process the normal daily workload profile without lag, and handle occasional peaks without over-provisioning, optimizing both performance and cost-effectiveness.
Final switch
After running the new application in shadow mode for some time, the team decided the application was stable and emitting the expected output. The PostNL IoT platform finally switched over to production and shut down the legacy application.
Key takeaways
Among the several learnings gathered in the journey of adopting Managed Service for Apache Flink, some are particularly important, and proving key when expanding to new and diverse use cases:
Understand event time semantics – A deep understanding of event time semantics is crucial in Apache Flink for accurately implementing time-dependent data operations. This knowledge makes sure events are processed correctly relative to when they actually occurred.
Use the powerful Apache Flink API – Apache Flink’s API allows for the creation of complex, stateful streaming applications beyond basic windowing and aggregations. It’s important to fully grasp the extensive capabilities offered by the API to tackle sophisticated data processing challenges.
With power comes more responsibility – The advanced functionality of Apache Flink’s API brings significant responsibility. Developers must make sure applications are efficient, maintainable, and stable, requiring careful resource management and adherence to best practices in coding and system design.
Don’t mix event time and processing time logic – Combining event time and processing time for data aggregation presents unique challenges. It prevents you from using higher-level functionalities provided out of the box by Apache Flink. The lowest level of abstractions among Apache Flink APIs allow for implementing custom time-based logic, but require a careful design to achieve accuracy and timely results, alongside extensive testing to validate good performance.
Conclusion
In the journey of adopting Apache Flink, the PostNL team learned how the powerful Apache Flink APIs allow you to implement complex business logic. The team came to appreciate how Apache Flink can be utilized to solve several and diverse problems, and they are now planning to extend it to more stream processing use cases.
With Managed Service for Apache Flink, the team was able to focus on the business value and implementing the required business logic, without worrying about the heavy lifting of setting up and managing an Apache Flink cluster.
Çağrı Çakır is the Lead Software Engineer for the PostNL IoT platform, where he manages the architecture that processes billions of events each day. As an AWS Certified Solutions Architect Professional, he specializes in designing and implementing event-driven architectures and stream processing solutions at scale. He is passionate about harnessing the power of real-time data, and dedicated to optimizing operational efficiency and innovating scalable systems.
Özge Kavalcı works as Senior Solution Engineer for the PostNL IoT platform and loves to build cutting-edge solutions that integrate with the IoT landscape. As an AWS Certified Solutions Architect, she specializes in designing and implementing highly scalable serverless architectures and real-time stream processing solutions that can handle unpredictable workloads. To unlock the full potential of real-time data, she is dedicated to shaping the future of IoT integration.
Amit Singh works as a Senior Solutions Architect at AWS with enterprise customers on the value proposition of AWS, and participates in deep architectural discussions to make sure solutions are designed for successful deployment in the cloud. This includes building deep relationships with senior technical individuals to enable them to be cloud advocates. In his free time, he likes to spend time with his family and learn more about everything cloud.
Lorenzo Nicora works as Senior Streaming Solutions Architect at AWS helping customers across EMEA. He has been building cloud-centered, data-intensive systems for several years, working in the finance industry both through consultancies and for fintech product companies. He has used open-source technologies extensively and contributed to several projects, including Apache Flink.
As security best practices have evolved over the years, so has the range of security telemetry options. Customers face the challenge of navigating through security-relevant telemetry and log data produced by multiple tools, technologies, and vendors while trying to monitor, detect, respond to, and mitigate new and existing security issues. In this post, we provide you with three patterns to centralize the ingestion of log data into Amazon Security Lake, regardless of the source. You can use the patterns in this post to help streamline the extract, transform and load (ETL) of security log data so you can focus on analyzing threats, detecting anomalies, and improving your overall security posture. We also provide the corresponding code and mapping for the patterns in the amazon-security-lake-transformation-library.
Security Lake automatically centralizes security data into a purpose-built data lake in your organization in AWS Organizations. You can use Security Lake to collect logs from multiple sources, including natively supported AWS services, Software-as-a-Service (SaaS) providers, on-premises systems, and cloud sources.
Centralized log collection in a distributed and hybrid IT environment can help streamline the process, but log sources generate logs in disparate formats. This leads to security teams spending time building custom queries based on the schemas of the logs and events before the logs can be correlated for effective incident response and investigation. You can use the patterns presented in this post to help build a scalable and flexible data pipeline to transform log data using Open Cybersecurity Schema Framework (OCSF) and stream the transformed data into Security Lake.
Security Lake custom sources
You can configure custom sources to bring your security data into Security Lake. Enterprise security teams spend a significant amount of time discovering log sources in various formats and correlating them for security analytics. Custom source configuration helps security teams centralize distributed and disparate log sources in the same format. Security data in Security Lake is centralized and normalized into OCSF and compressed in open source, columnar Apache Parquet format for storage optimization and query efficiency. Having log sources in a centralized location and in a single format can significantly improve your security team’s timelines when performing security analytics. With Security Lake, you retain full ownership of the security data stored in your account and have complete freedom of choice for analytics. Before discussing creating custom sources in detail, it’s important to understand the OCSF core schema, which will help you map attributes and build out the transformation functions for the custom sources of your choice.
Understanding the OCSF
OCSF is a vendor-agnostic and open source standard that you can use to address the complex and heterogeneous nature of security log collection and analysis. You can extend and adapt the OCSF core security schema for a range of use cases in your IT environment, application, or solution while complementing your existing security standards and processes. As of this writing, the most recent major version release of the schema is v1.2.0, which contains six categories: System Activity, Findings, Identity and Access Management, Network Activity, Discovery, and Application Activity. Each category consists of different classes based on the type of activity, and each class has a unique class UID. For example, File System Activity has a class UID of 1001.
As of this writing, Security Lake (version 1) supports OCSF v1.1.0. As Security Lake continues to support newer releases of OCSF, you can continue to use the patterns from this post. However, you should revisit the mappings in case there’s a change in the classes you’re using.
Prerequisites
You must have the following prerequisites for log ingestion into Amazon Security Lake. Each pattern has a sub-section of prerequisites that are relevant to the data pipeline for the custom log source.
AWS Organizations is configured your AWS environment. AWS Organizations is an AWS account management service that provides account management and consolidated billing capabilities that you can use to consolidate multiple AWS accounts and manage them centrally.
Open the AWS Management Console and navigate to AWS Organizations. Set up an organization with a Log Archive account. The Log Archive account should be used as the delegated Security Lake administrator account where you will configure Security Lake. For more information on deploying the full complement of AWS security services in a multi-account environment, see AWS Security Reference Architecture.
Configure permissions for the Security Lake administrator access by using an AWS Identity and Access Management (IAM) role. This role should be used by your security teams to administer Security Lake configuration, including managing custom sources.
Enable Security Lake in the AWS Region of your choice in the Log Archive account. When you configure Security Lake, you can define your collection objectives, including log sources, the Regions that you want to collect the log sources from, and the lifecycle policy you want to assign to the log sources. Security Lake uses Amazon Simple Storage Service (Amazon S3) as the underlying storage for the log data. Amazon S3 is an object storage service offering industry-leading scalability, data availability, security, and performance. S3 is built to store and retrieve data from practically anywhere. Security Lake creates and configures individual S3 buckets in each Region identified in the collection objectives in the Log Archive account.
To use the transformation library, you should understand how to build the mapping configuration file. The mapping configuration file holds mapping information from raw events to OCSF formatted logs. The transformation function builds the OCSF formatted logs based on the attributes mapped in the file and streams them to the Security Lake S3 buckets.
The mapping configuration file is a JSON-formatted file that’s used by the transformation function to evaluate the attributes of the raw logs and map them to the relevant OCSF class attributes. The configuration is based on the mapping identified in Table 3 (File System Activity class mapping) and extended to the Process Activity class. The file uses the $. notation to identify attributes that the transformation function should evaluate from the event.
Configuration in the mapping file is stored under the custom_source_events key. You must keep the value for the key source_name the same as the name of the custom source you add for Security Lake. The matched_field is the key that the transformation function uses to iterate over the log events. The iterator (1), in the preceding snippet, is the Sysmon event ID and the data structure that follows is the OCSF attribute mapping.
Some OCSF attributes are of an Object data type with a map of pre-defined values based on the event signature such as activity_id. You represent such attributes in the mapping configuration as shown in the following example:
In the preceding snippet, you can see the words enum and evaluate. These keywords tell the underlying mapping function that the result will be the value from the map defined in values and the key to evaluate is the EventId, which is listed as the value of the evaluate key. You can build your own transformation function based on your custom sources and mapping or you can extend the function provided in this post.
Pattern 1: Log collection in a hybrid environment using Kinesis Data Streams
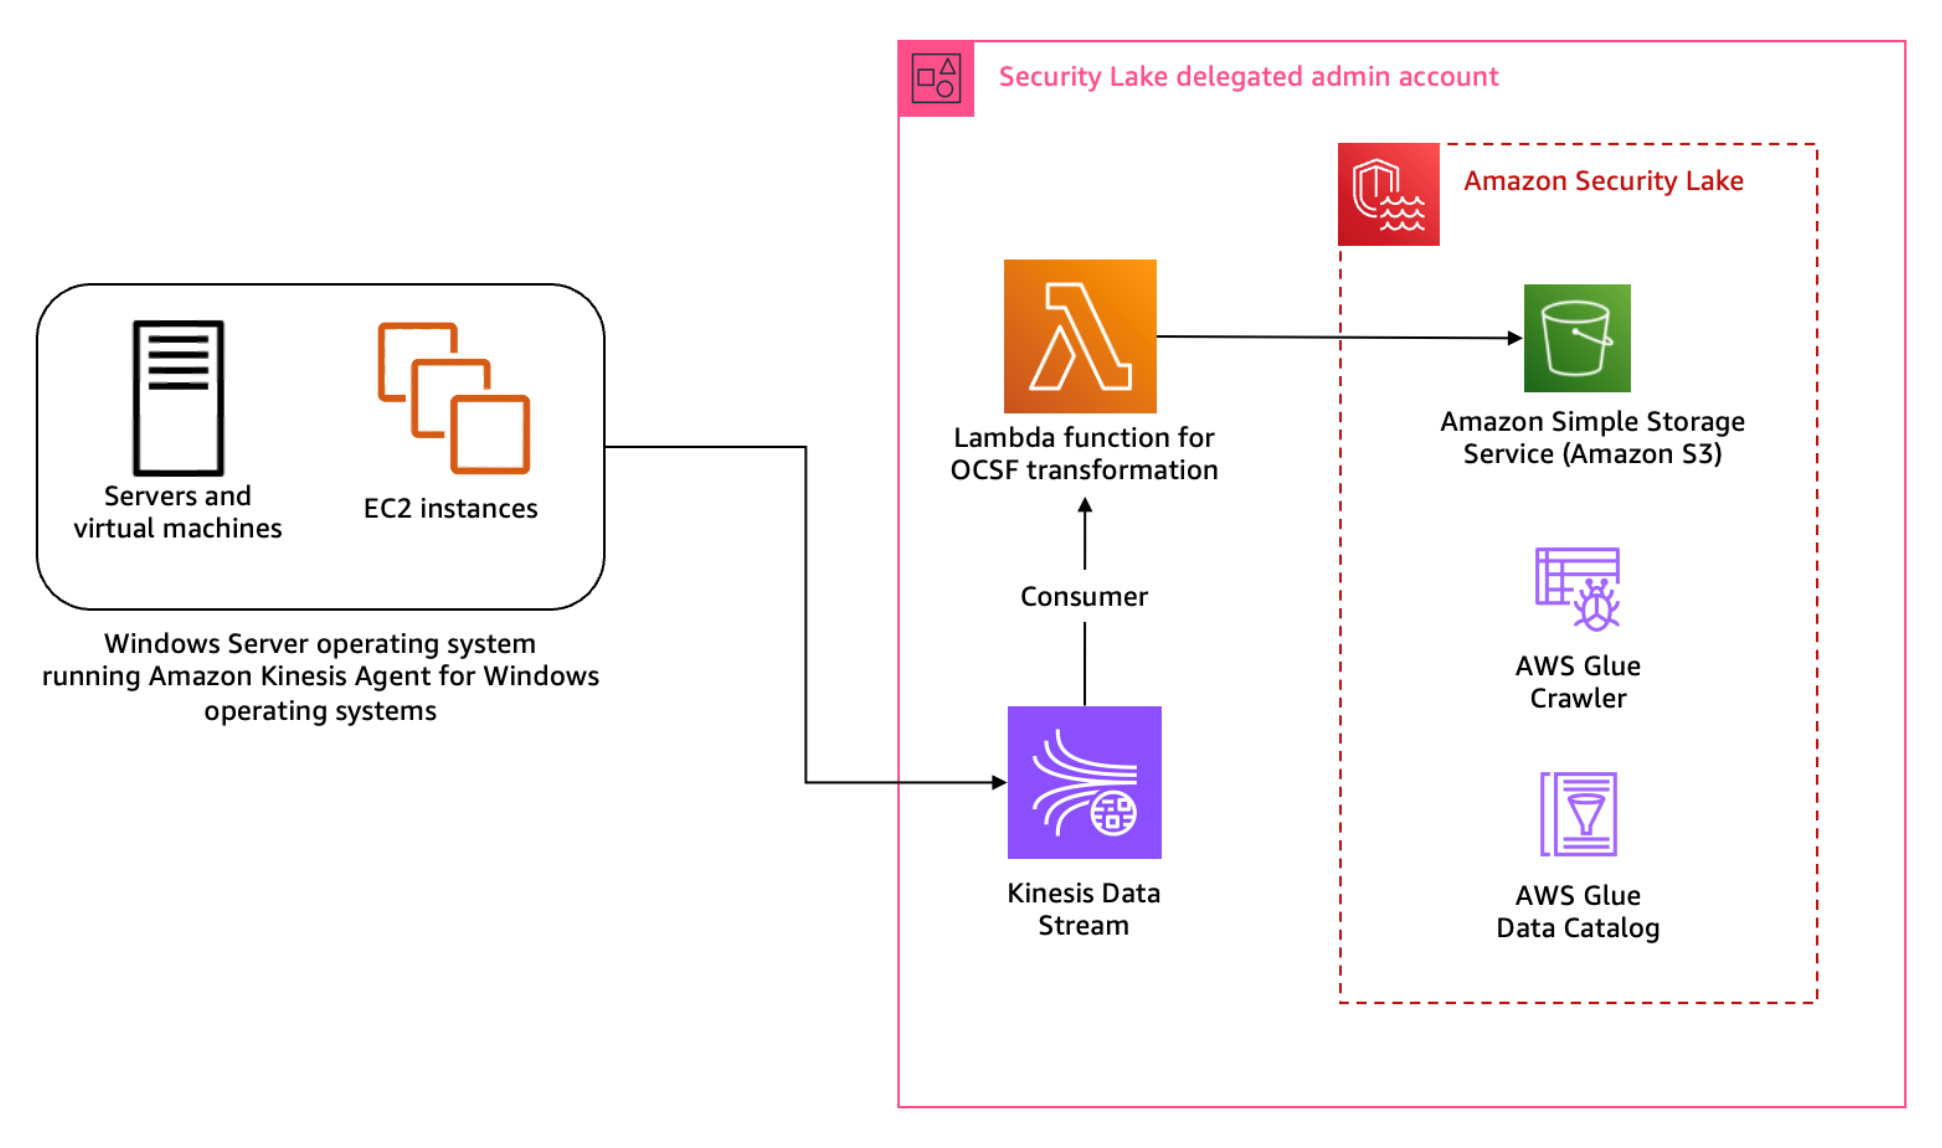
The first pattern we discuss in this post is the collection of log data from hybrid sources such as operating system logs collected from Microsoft Windows operating systems using System Monitor (Sysmon). Sysmon is a service that monitors and logs system activity to the Windows event log. It’s one of the log collection tools used by customers in a Windows Operating System environment because it provides detailed information about process creations, network connections, and file modifications This host-level information can prove crucial during threat hunting scenarios and security analytics.
Solution overview
The solution for this pattern uses Amazon Kinesis Data Streams and Lambda to implement the schema transformation. Kinesis Data Streams is a serverless streaming service that makes it convenient to capture and process data at any scale. You can configure stream consumers—such as Lambda functions—to operate on the events in the stream and convert them into required formats—such as OCSF—for analysis without maintaining processing infrastructure. Lambda is a serverless, event-driven compute service that you can use to run code for a range of applications or backend services without provisioning or managing servers. This solution integrates Lambda with Kinesis Data Streams to launch transformation tasks on events in the stream.
To stream Sysmon logs from the host, you use Amazon Kinesis Agent for Microsoft Windows. You can run this agent on fleets of Windows servers hosted on-premises or in your cloud environment.
Figure 1: Architecture diagram for Sysmon event logs custom source
Figure 1 shows the interaction of services involved in building the custom source ingestion. The servers and instances generating logs run the Kinesis Agent for Windows to stream log data to the Kinesis Data Stream which invokes a consumer Lambda function. The Lambda function transforms the log data into OCSF based on the mapping provided in the configuration file and puts the transformed log data into Security Lake S3 buckets. We cover the solution implementation later in this post, but first let’s review how you can map Sysmon event streaming through Kinesis Data Streams into the relevant OCSF classes. You can deploy the infrastructure using the AWS Serverless Application Model (AWS SAM)template provided in the solution code. AWS SAM is an extension of the AWS Command Line Interface (AWS CLI), which adds functionality for building and testing applications using Lambda functions.
Mapping
Windows Sysmon events map to various OCSF classes. To build the transformation of the Sysmon events, work through the mapping of events with relevant OCSF classes. The latest version of Sysmon (v15.14) defines 30 events including a catch-all error event.
Table 1: Sysmon event mapping with OCSF (v1.1.0) classes
Start by mapping the Sysmon events to the relevant OCSF classes in plain text as shown in Table 1 before adding them to the mapping configuration file for the transformation library. This mapping is flexible; you can choose to map an event to a different event class depending on the standard defined within the security engineering function. Based on our mapping, Table 1 indicates that a majority of the events reported by Sysmon align with the File System Activity or the Process Activity class. Registry events map better with the Registry Key Activity and Registry Value Activity classes, but these classes are deprecated in OCSF v1.0.0, so we recommend using File System Activity instead of registry events for compatibility with future versions of OCSF. You can be selective about the events captured and reported by Sysmon by altering the Sysmon configuration file. For this post, we’re using the sysmonconfig.xml published in the sysmon-modular project. The project provides a modular configuration along with publishing tactics, techniques, and procedures (TTPs) with Sysmon events to help in TTP-based threat hunting use cases. If you have your own curated Sysmon configuration, you can use that. While this solution offers mapping advice, if you’re using your own Sysmon configuration, you should make sure that you’re mapping the relevant attributes using this solution as a guide. As a best practice, mapping should be non-destructive to keep your information after the OCSF transformation. If there are attributes in the log data that you cannot map to an available attribute in the OCSF class, then you should use the unmapped attribute to collect all such information. In this pattern, RuleName captures the TTPs associated with the Sysmon event, because TTPs don’t map to a specific attribute within OCSF.
Across all classes in OCSF, there are some common attributes that are mandatory. The common mandatory attributes are mapped shown in Table 2. You need to set these attributes regardless of the OCSF class you’re transforming the log data to.
OCSF
Raw
metadata.profiles
[host]
metadata.version
v1.1.0
metadata.product.name
System Monitor (Sysmon)
metadata.product.vendor_name
Microsoft Sysinternals
metadata.product.version
v15.14
severity
Informational
severity_id
1
Table 2: Mapping mandatory attributes
Each OCSF class has its own schema, which is extendable. After mapping the common attributes, you can map the attributes in the File System Activity class relevant to the log information. Some of the attribute values can be derived from a map of options standardised by the OCSF schema. One such attribute is Activity ID. Depending on the type of activity performed on the file, you can assign a value from the pre-defined set of values in the schema such as 0 if the event activity is unknown, 1 if a file was created, 2 if a file was read, and so on. You can find more information on standard attribute maps in File System Activity, System Activity Category.
File system activity mapping example
The following is a sample file creation event reported by Sysmon:
When the event is streamed to the Kinesis Data Streams stream, the Kinesis Agent can be used to enrich the event. We’re enriching the event with source_instance_id using ObjectDecoration configured in the agent configuration file.
Because the transformation Lambda function reads from a Kinesis Data Stream, we use the event information from the stream to map the attributes of the File System Activity class. The following mapping table has attributes mapped to the values based on OCSF requirements, the values enclosed in brackets (<>) will come from the event. In the solution implementation section for this pattern, you learn about the transformation Lambda function and mapping implementation for a sample set of events.
First update the mapping configuration, then add the custom source in Security Lake and deploy and configure the log streaming and transformation infrastructure, which includes the Kinesis Data Stream, transformation Lambda function and associated IAM roles.
Step 1: Update mapping configuration
Each supported custom source documentation contains the mapping configuration. Update the mapping configuration for the windows-sysmon custom source for the transformation function.
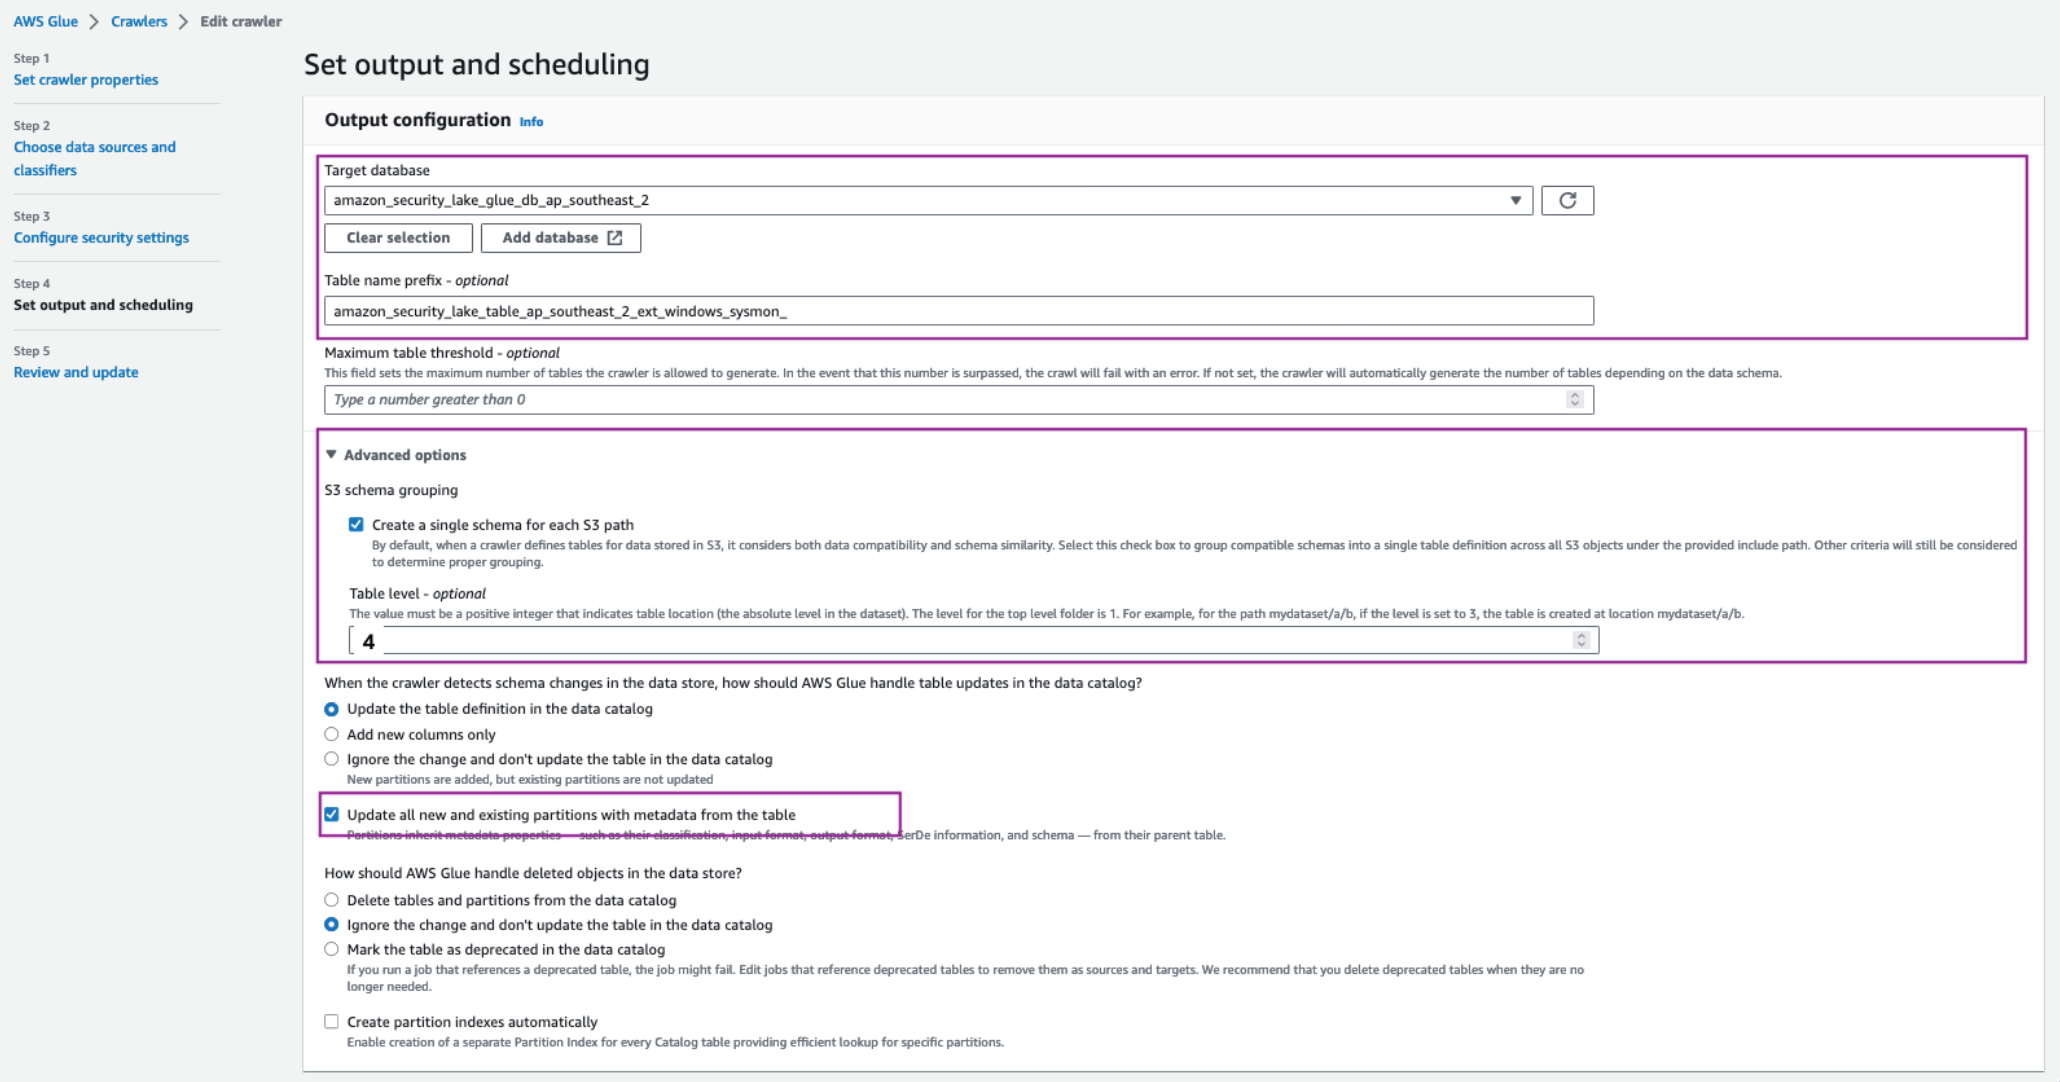
To add the custom source for Sysmon events, configure an IAM role for the AWS Glue crawler that will be associated with the custom source to update the schema in the Security Lake AWS Glue database. You can deploy the ASLCustomSourceGlueRole.yaml CloudFormation template to automate the creation of the IAM role associated with the custom source AWS Glue crawler.
Capture the Amazon Resource Name (ARN) for the IAM role, which is configured as an output of the infrastructure deployed in the previous step.
Add a custom source using the following AWS CLI command. Make sure you replace the <AWS_ACCOUNT_ID>, <SECURITY_LAKE_REGION> and the <GLUE_IAM_ROLE_ARN> placeholders with the AWS account ID you’re deploying into, the Security Lake deployment Region and the ARN of the IAM role created above, respectively. External ID is a unique identifier that is used to establish trust with the AWS identity. You can use External ID to add conditional access from third-party sources and to subscribers.
Note: When creating the custom log source, you only need to specify FILE_ACTIVITY and PROCESS_ACTIVITY event classes as these are the only classes mapped in the example configuration deployed in Step 1. If you extend your mapping configuration to handle additional classes, you would add them here.
Step 3: Deploy the transformation infrastructure
The solution uses the AWS SAM framework—an open source framework for building serverless applications—to deploy the OCSF transformation infrastructure. The infrastructure includes a transformation Lambda function, Kinesis data stream, IAM roles for the Lambda function and the hosts running the Kinesis Agent, and encryption keys for the Kinesis data stream. The Lambda function is configured to read events streamed into the Kinesis Data Stream and transform the data into OCSF based on the mapping configuration file. The transformed events are then written to an S3 bucket managed by Security Lake. A sample of the configuration file is provided in the solution repository capturing a subset of the events. You can extend the same for the remaining Sysmon events.
To deploy the infrastructure:
Clone the solution codebase into your choice of integrated development environment (IDE). You can also use AWS CloudShell or AWS Cloud9.
Sign in to the Security Lake delegated administrator account.
Review the prerequisites and detailed deployment steps in the project’s README file. Use the SAM CLI to build and deploy the streaming infrastructure by running the following commands:
sam build

sam deploy –guided
Step 4: Update the default AWS Glue crawler
Sysmon logs are a complex use case because a single source of logs contains events mapped to multiple schemas. The transformation library handles this by writing each schema to different prefixes (folders) within the target Security Lake bucket. The AWS Glue crawler deployed by Security Lake for the custom log source must be updated to handle prefixes that contain differing schemas.
To update the default AWS Glue crawler:
In the Security Lake delegated administrator account, navigate to the AWS Glue console.
Navigate to Crawlers in the Data Catalog section. Search for the crawler associated with the custom source. It will have the same name as the custom source name. For example, windows-sysmon. Select the check box next to the crawler name, then choose Action and select Edit Crawler.
Figure 2: Select and edit an AWS Glue crawler
Select Edit for the Step 2: Choose data sources and classifiers section on the Review and update page.
In the Choose data sources and classifiers section, make the following changes:
For Is your data already mapped to Glue tables?, change the selection to Not yet.
For Data sources, select Add a data source. In the selection prompt, select the Security Lake S3 bucket location as presented in the output of the create-custom-source command above. For example, s3://aws-security-data-lake-<region>–<exampleid>/ext/windows-sysmon/. Make sure you include the path all the way to the custom source name and replace the <region> and <exampleid> placeholders with the actual values. Then choose Add S3 data source.
Choose Next.
On the Configure security settings page, leave everything as is and choose Next.
On the Set output and scheduling page, select the Target database as the Security Lake Glue database.
In a separate tab, navigate to AWS Glue > Tables. Copy the name of the custom source table created by Security Lake.
Navigate back to the AWS Glue crawler configuration tab, update the Table name prefix with the copied table name and add an underscore (_) at the end. For example, amazon_security_lake_table_ap_southeast_2_ext_windows_sysmon_.
Under Advanced options, select the checkbox for Create a single schema for each S3 path and for Table level enter 4.
Make sure you allow the crawler to enforce table schema to the partitions by selecting the Update all new and existing partitions with metadata from the table checkbox.
For the Crawler schedule section, select Monthly from the Frequency dropdown. For Minute, enter 0. This configuration will run the crawler every month.
Choose Next, then Update.
Figure 3: Set AWS Glue crawler output and scheduling
To configure hosts to stream log information:
As discussed in the Solution overview section, you use Kinesis Data Streams with a Lambda function to stream Sysmon logs and transform the information into OCSF.
Install Kinesis Agent for Microsoft Windows. There are three ways to install Kinesis Agent on Windows Operating Systems. Using AWS Systems Manager helps automate the deployment and upgrade process. You can also install Kinesis Agent by using a Windows installer package or PowerShell scripts.
After installation you must configure Kinesis Agent to stream log data to Kinesis Data Streams (you can use the following code for this). Kinesis Agent for Windows helps capture important metadata of the host system and enrich information streamed to the Kinesis Data Stream. The Kinesis Agent configuration file is located at %PROGRAMFILES%\Amazon\AWSKinesisTap\appsettings.json and includes three parts—sources, pipes, and sinks:
The preceding configuration shows the information flow through sources, pipes, and sinks using the Kinesis Agent for Windows. Use the sample configuration file provided in the solution repository. Observe the ObjectDecoration key in the Sink configuration; you can use this key to add key information to identify the generating system. For example, to identify whether the event is being generated by an Amazon Elastic Compute Cloud (Amazon EC2) instance or a hybrid server. This information can be used to map the Device attribute in the various OCSF classes such as File System Activity and Process Activity. The <KinesisAgentIAMRoleARN> is configured by the transformation library deployment unless you create your own IAM role and provide it as a parameter to the deployment.
Update the Kinesis agent configuration file %PROGRAMFILES%\Amazon\AWSKinesisTap\appsettings.json with the contents of the kinesis_agent_configuration.json file from this repository. Make sure you replace the <LogCollectionStreamName> and <KinesisAgentIAMRoleARN> placeholders with the value of the CloudFormation outputs, LogCollectionStreamName and KinesisAgentIAMRoleARN, that you captured in the Deploy transformation infrastructure step.
Start Kinesis Agent on the hosts to start streaming the logs to Security Lake buckets. Open an elevated PowerShell command prompt window, and start Kinesis Agent for Windows using the following PowerShell command:
Start-Service -Name AWSKinesisTap
Pattern 2: Log collection from services and products using AWS Glue
You can use Amazon VPC to launch resources in an isolated network. AWS Network Firewall provides the capability to filter network traffic at the perimeter of your VPCs and define stateful rules to configure fine-grained control over network flow. Common Network Firewall use cases include intrusion detection and protection, Transport Layer Security (TLS) inspection, and egress filtering. Network Firewall supports multiple destinations for log delivery, including Amazon S3.
In this pattern, you focus on adding a custom source in Security Lake where the product in use delivers raw logs to an S3 bucket.
Solution overview
This solution uses an S3 bucket (the staging bucket) for raw log storage using the prerequisites defined earlier in this post. Use AWS Glue to configure the ETL and load the OCSF transformed logs into the Security Lake S3 bucket.
Figure 4: Architecture using AWS Glue for ETL
Figure 4 shows the architecture for this pattern. This pattern applies to AWS services or partner services that natively support log storage in S3 buckets. The solution starts by defining the OCSF mapping.
Mapping
Network firewall records two types of log information—alert logs and netflow logs. Alert logs report traffic that matches the stateful rules configured in your environment. Flow logs are network traffic flow logs that capture network traffic information for standard stateless rule groups. You can use stateful rules for use cases such as egress filtering to restrict the external domains that the resources deployed in a VPC in your AWS account have access to. In the Network Firewall use case, events can be mapped to various attributes in the Network Activity class in the Network Activity category.
Configure the log source to use Amazon S3 for log delivery
Add a custom source in Security Lake
Deploy the log staging and transformation infrastructure
Because Network Firewall logs can be mapped to a single OCSF class, you don’t need to update the AWS Glue crawler as in the previous pattern. However, you must update the AWS Glue crawler if you want to add a custom source with multiple OCSF classes.
Step 1: Update the mapping configuration
Each supported custom source documentation contains the mapping configuration. Update the mapping configuration for the Network Firewall custom source for the transformation function.
Step 2: Configure the log source to use S3 for log delivery
Configure Network Firewall to log to Amazon S3. The transformation function infrastructure deploys a staging S3 bucket for raw log storage. If you already have an S3 bucket configured for raw log delivery, you can update the value of the parameter RawLogS3BucketName during deployment. The deployment configures event notifications with Amazon Simple Queue Service (Amazon SQS). The transformation Lambda function is invoked by SQS event notifications when Network Firewall delivers log files in the staging S3 bucket.
Step 3: Add a custom source in Security Lake
As with the previous pattern, add a custom source for Network Firewall in Security Lake. In the previous pattern you used the AWS CLI to create and configure the custom source. In this pattern, we take you through the steps to do the same using the AWS console.
Under Custom source details enter a name for the custom log source such as network_firewall and choose Network Activity as the OCSF Event class
Figure 6: Data source name and OCSF Event class
Under Account details, enter your AWS account ID for the AWS account ID and External ID fields. Leave Create and use a new service role selected and choose Create.
Figure 7: Account details and service access
The custom log source will now be available.
Step 4: Deploy transformation infrastructure
As with the previous pattern, use AWS SAM CLI to deploy the transformation infrastructure.
To deploy the transformation infrastructure:
Clone the solution codebase into your choice of IDE.
Sign in to the Security Lake delegated administrator account.
The infrastructure is deployed using the AWS SAM, which is an open source framework for building serverless applications. Review the prerequisites and detailed deployment steps in the project’s README file. Use the SAM CLI to build and deploy the streaming infrastructure by running the following commands:
sam build

sam deploy --guided
Clean up
The resources created in the previous patterns can be cleaned up by running the following command:
sam delete
You also need to manually delete the custom source by following the instructions from the Security Lake User Guide.
Pattern 3: Log collection using integration with supported AWS services.
In a threat hunting and response use case, customers often use multiple sources of logs to correlate information to find more information on unauthorized third-party interactions originating from trusted software vendors. These interactions can be due to vulnerable components in the product or exposed credentials such as integration API keys. An operationally effective way to source logs from partner software and external vendors is to use the supported AWS services that natively integrate with Security Lake.
AWS Security Hub
AWS Security Hub is a cloud security posture measurement service that provides a comprehensive view of the security posture of your AWS environment. Security Hub supports integration with several AWS services including AWS Systems Manager Patch Manager, Amazon Macie, Amazon GuardDuty, and Amazon Inspector. For the full list, see AWS service integrations with AWS Security Hub. Security Hub also integrates with multiple third-party partner products that you can use. These products support sending findings to Security Hub seamlessly.
Security Lake natively supports ingestion of Security Hub findings, which centralizes the findings from the source integrations into Security Lake. Before you start building a custom source, we recommend you review whether the product is supported by Security Hub, which could remove the need for building manual mapping and transformation solutions.
AWS AppFabric
AWS AppFabric is a fully managed software as a service (SaaS) interoperability solution. Security Lake supports AppFabric output schema and format—OCSF and JSON respectively. Security Lake supports AppFabric as a custom source using Amazon Kinesis Data Firehose delivery stream. You can find step-by-step instructions in the AppFabric user guide.
Conclusion
Security Lake offers customers the capability to centralize disparate log sources in a single format, OCSF. Using OCSF improves correlation and enrichment activities because security teams no longer have to build queries based on the individual log source schema. Log data is normalized such that customers can use the same schema across the log data collected. Using the patterns and solution identified in this post, you can significantly reduce the effort involved in building custom sources to bring your own data into Security Lake.
You can extend the concepts and mapping function code provided in the amazon-security-lake-transformation-library to build out a log ingestion and ETL solution. You can use the flexibility offered by Security Lake and the custom source feature to ingest log data generated by all sources including third-party tools, log forwarding software, AWS services, and hybrid solutions.
In this post, we provided you with three patterns that you can use across multiple log sources. The most flexible being Pattern 1, where you can choose the OCSF mapped class and attributes that are in-line with your organizational mappings and custom source configuration with Security Lake. You can continue to use the mapping function code from the amazon-security-lake-transformation-library demonstrated through this post and update the mapping variable for the OCSF class you’re mapping to. This solution can be scaled to build a range of custom sources to enhance your threat detection and investigation workflow.
If you have feedback about this post, submit comments in the Comments section below. If you have questions about this post, contact AWS Support.
The 6.10 kernel was released
on July 14 after a nine-week development cycle. This time around,
13,312 non-merge changesets were pulled into the mainline repository — the
lowest changeset count since 5.17 in early 2022. Longstanding tradition
says that it is time for LWN to gather some statistics on where the new
code for 6.10 came from and how it got to the mainline; read on for the
details.
Greg Kroah-Hartman has released the 6.6.40
and 6.1.99 stable kernels. Both contain a
fix for the USB subsystem; anyone who uses those kernel series and “the XHCI
USB host controller driver (i.e. USB 3) must upgrade“.
To provide the best experiences, we use technologies like cookies to store and/or access device information. Consenting to these technologies will allow us to process data such as browsing behavior or unique IDs on this site. Not consenting or withdrawing consent, may adversely affect certain features and functions.
Functional
Always active
The technical storage or access is strictly necessary for the legitimate purpose of enabling the use of a specific service explicitly requested by the subscriber or user, or for the sole purpose of carrying out the transmission of a communication over an electronic communications network.
Preferences
The technical storage or access is necessary for the legitimate purpose of storing preferences that are not requested by the subscriber or user.
Statistics
The technical storage or access that is used exclusively for statistical purposes.The technical storage or access that is used exclusively for anonymous statistical purposes. Without a subpoena, voluntary compliance on the part of your Internet Service Provider, or additional records from a third party, information stored or retrieved for this purpose alone cannot usually be used to identify you.
Marketing
The technical storage or access is required to create user profiles to send advertising, or to track the user on a website or across several websites for similar marketing purposes.
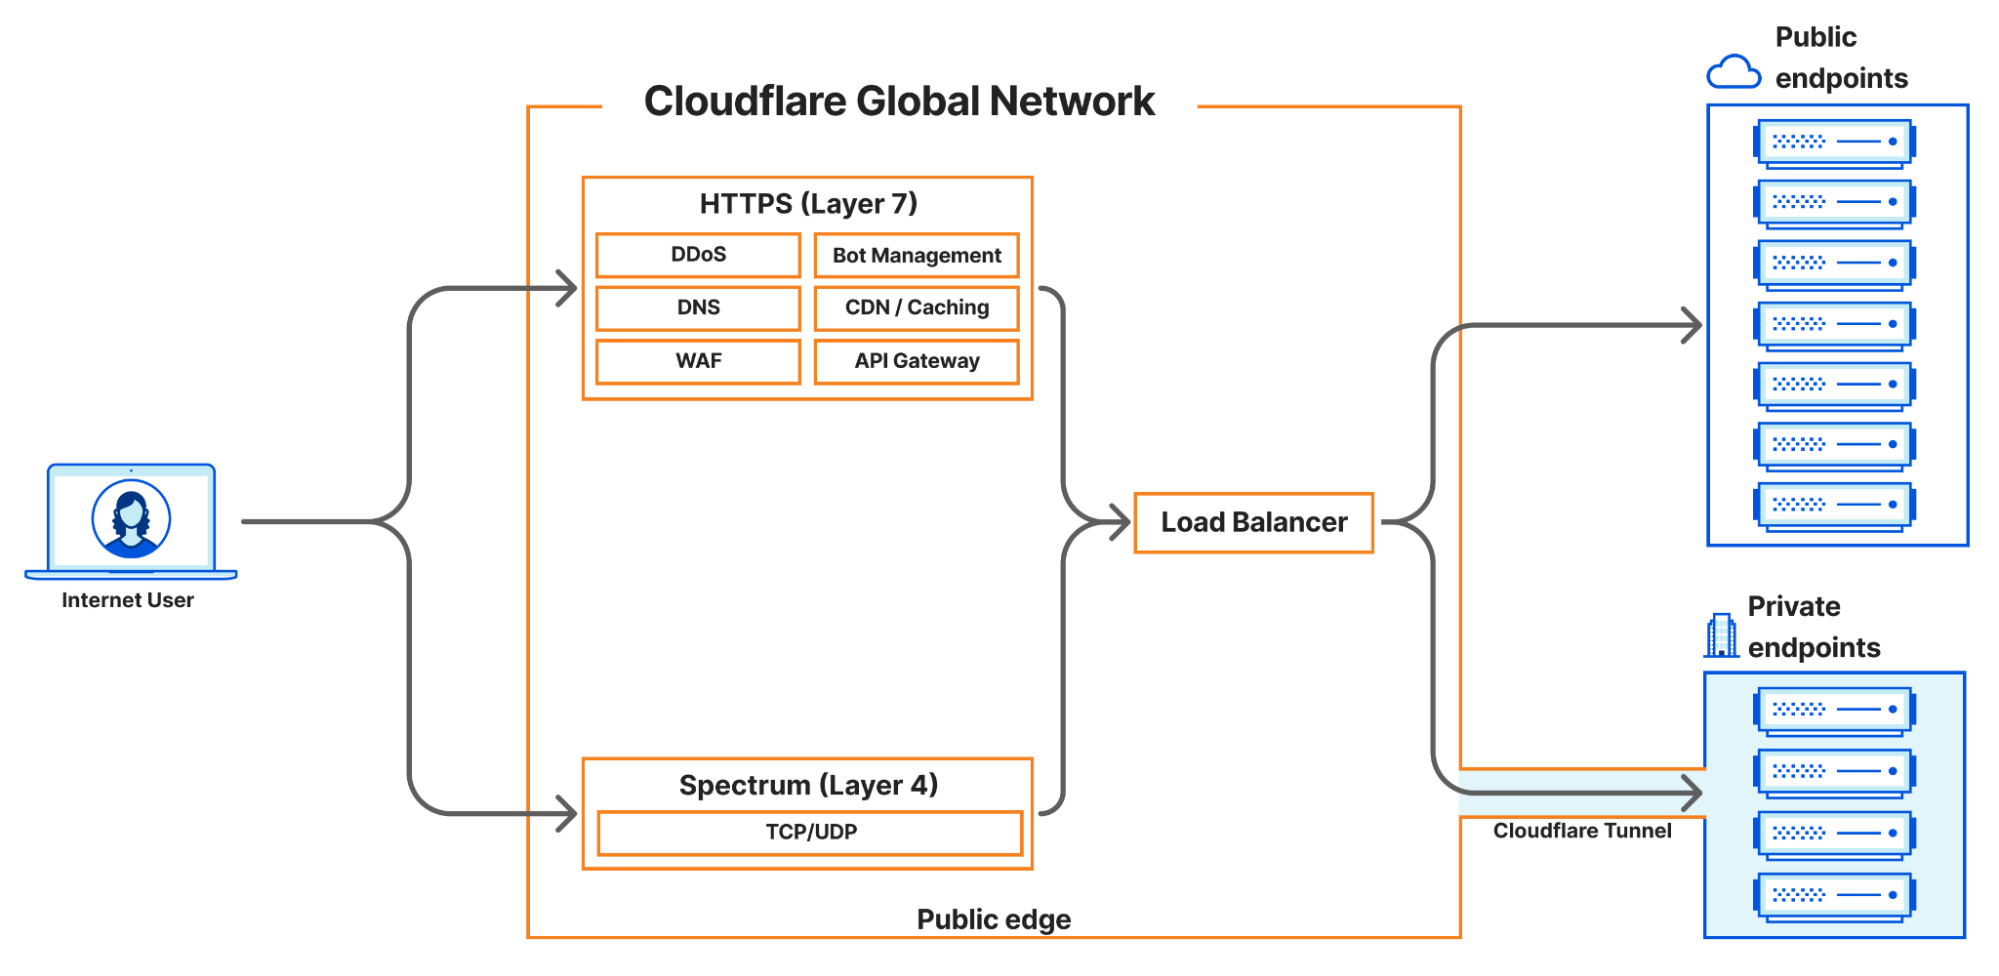
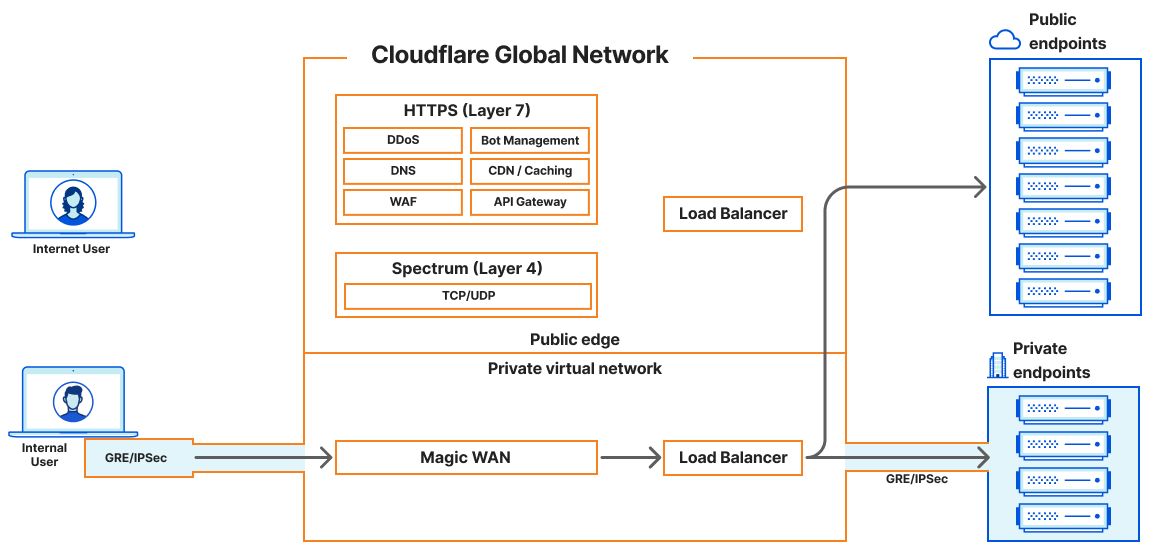
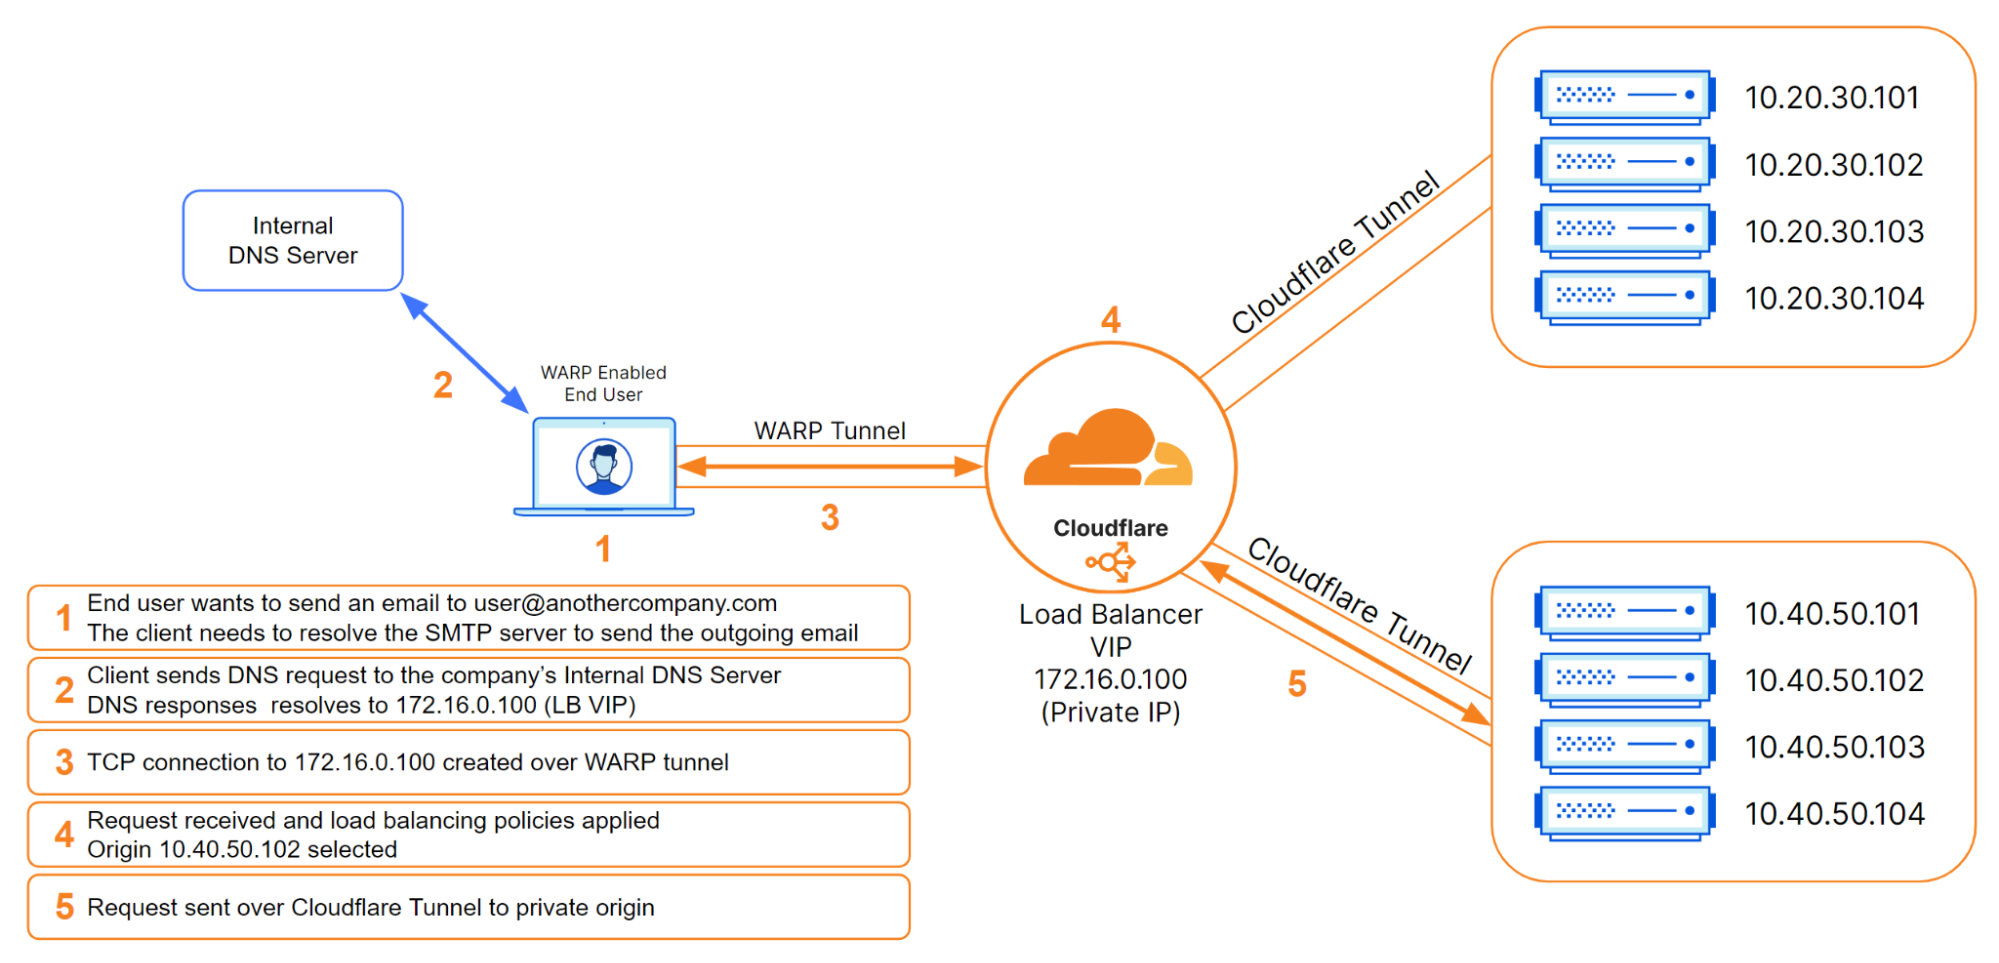


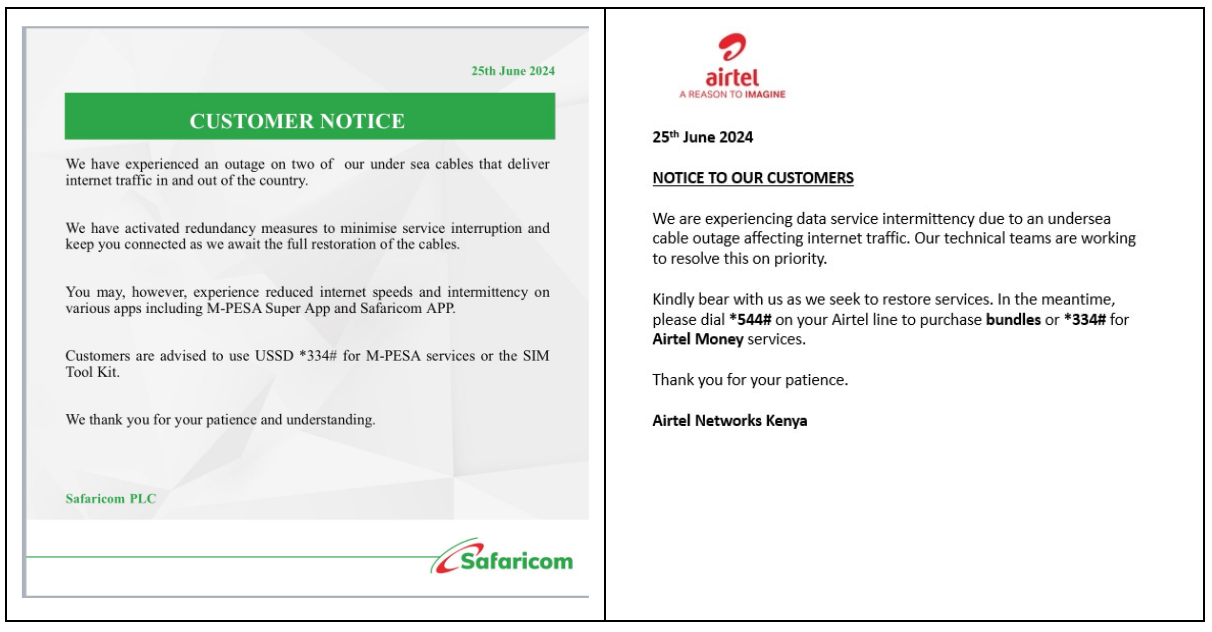
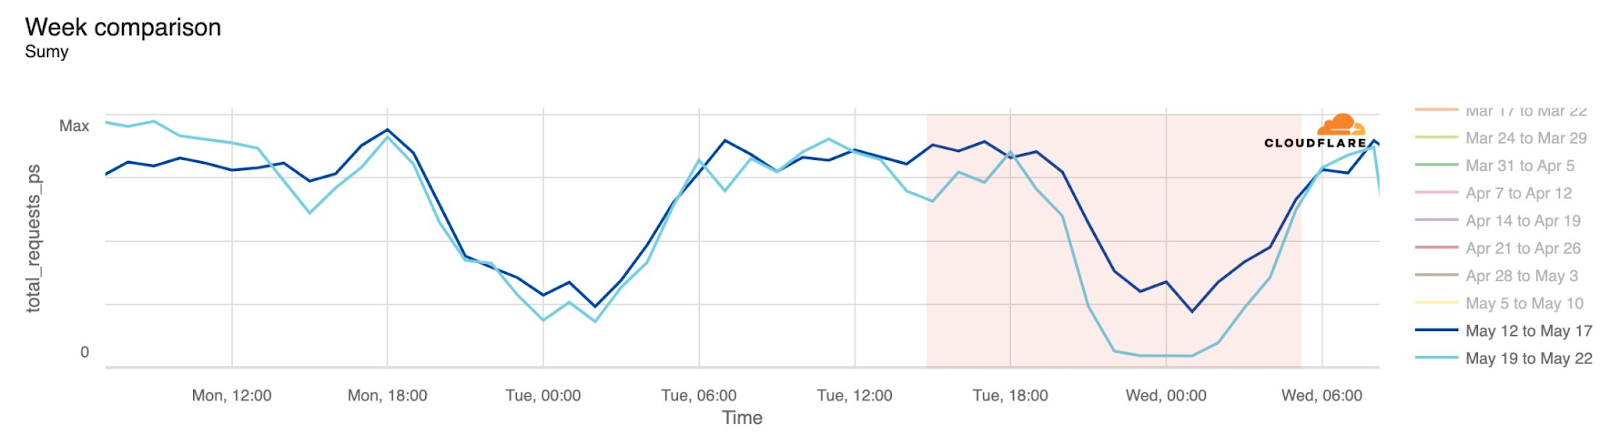
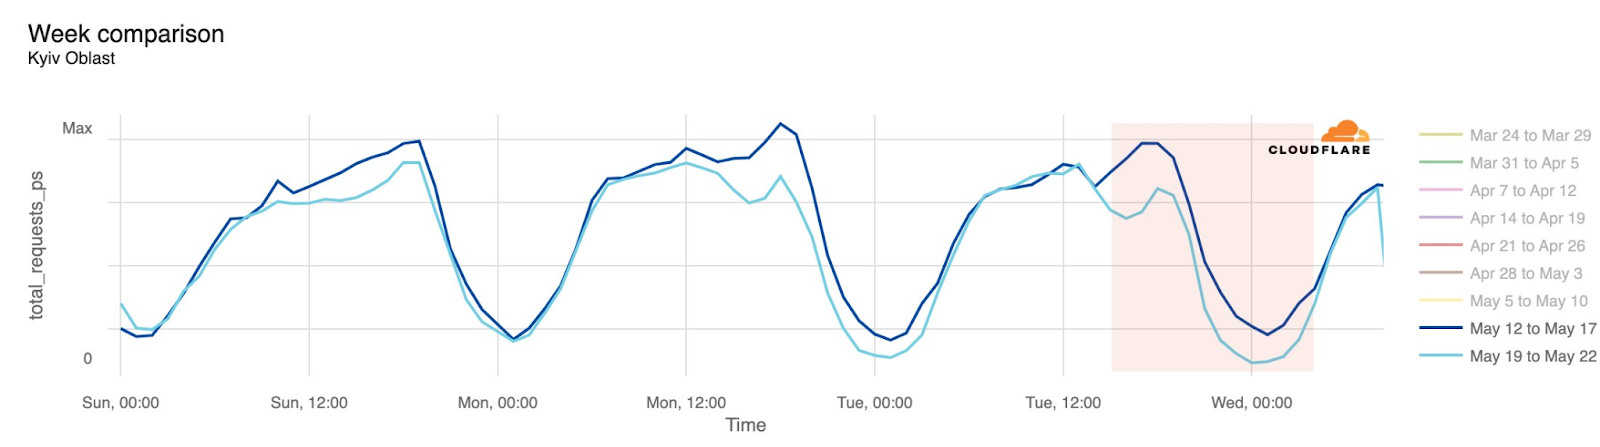
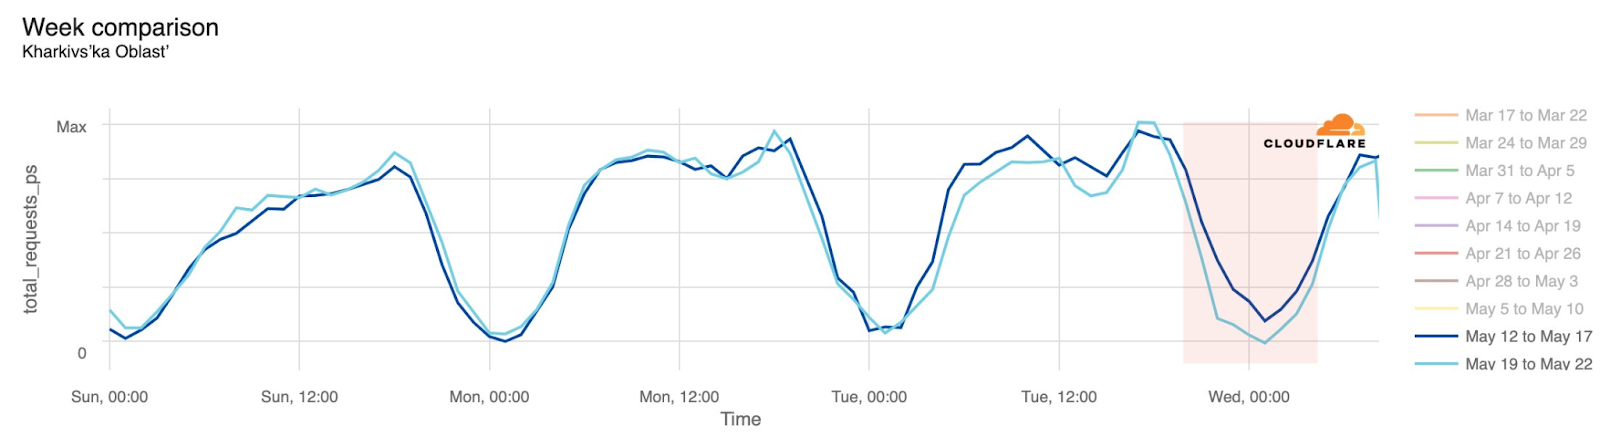
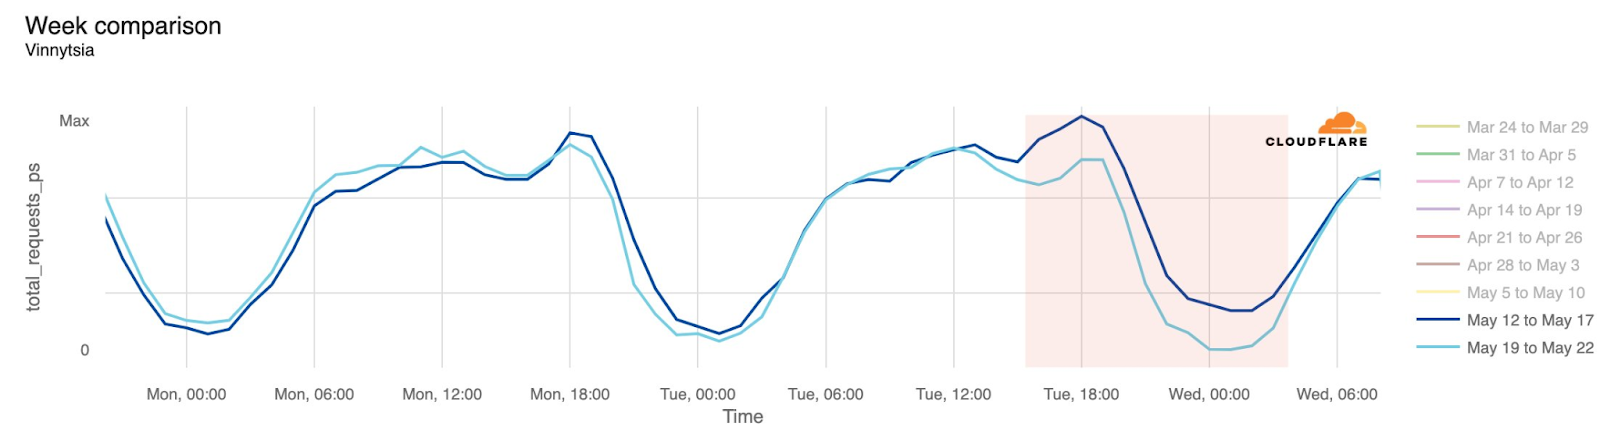


 Çağrı Çakır is the Lead Software Engineer for the PostNL IoT platform, where he manages the architecture that processes billions of events each day. As an AWS Certified Solutions Architect Professional, he specializes in designing and implementing event-driven architectures and stream processing solutions at scale. He is passionate about harnessing the power of real-time data, and dedicated to optimizing operational efficiency and innovating scalable systems.
 Özge Kavalcı works as Senior Solution Engineer for the PostNL IoT platform and loves to build cutting-edge solutions that integrate with the IoT landscape. As an AWS Certified Solutions Architect, she specializes in designing and implementing highly scalable serverless architectures and real-time stream processing solutions that can handle unpredictable workloads. To unlock the full potential of real-time data, she is dedicated to shaping the future of IoT integration.
 Amit Singh works as a Senior Solutions Architect at AWS with enterprise customers on the value proposition of AWS, and participates in deep architectural discussions to make sure solutions are designed for successful deployment in the cloud. This includes building deep relationships with senior technical individuals to enable them to be cloud advocates. In his free time, he likes to spend time with his family and learn more about everything cloud.
 Lorenzo Nicora works as Senior Streaming Solutions Architect at AWS helping customers across EMEA. He has been building cloud-centered, data-intensive systems for several years, working in the finance industry both through consultancies and for fintech product companies. He has used open-source technologies extensively and contributed to several projects, including Apache Flink.