IAM Access Analyzer makes it simpler to author and validate role trust policies

Post Syndicated from Mathangi Ramesh original https://aws.amazon.com/blogs/security/iam-access-analyzer-makes-it-simpler-to-author-and-validate-role-trust-policies/

AWS Identity and Access Management (IAM) Access Analyzer provides many tools to help you set, verify, and refine permissions. One part of IAM Access Analyzer—policy validation—helps you author secure and functional policies that grant the intended permissions. Now, I’m excited to announce that AWS has updated the IAM console experience for role trust policies to make it simpler for you to author and validate the policy that controls who can assume a role. In this post, I’ll describe the new capabilities and show you how to use them as you author a role trust policy in the IAM console.

Overview of changes

A role trust policy is a JSON policy document in which you define the principals that you trust to assume the role. The principals that you can specify in the trust policy include users, roles, accounts, and services. The new IAM console experience provides the following features to help you set the right permissions in the trust policy:

  • An interactive policy editor prompts you to add the right policy elements, such as the principal and the allowed actions, and offers context-specific documentation.
  • As you author the policy, IAM Access Analyzer runs over 100 checks against your policy and highlights issues to fix. This includes new policy checks specific to role trust policies, such as a check to make sure that you’ve formatted your identity provider correctly. These new checks are also available through the IAM Access Analyzer policy validation API.
  • Before saving the policy, you can preview findings for the external access granted by your trust policy. This helps you review external access, such as access granted to a federated identity provider, and confirm that you grant only the intended access when you create the policy. This functionality was previously available through the APIs, but now it’s also available in the IAM console.

In the following sections, I’ll walk you through how to use these new features.

Example scenario

For the walkthrough, consider the following example, which is illustrated in Figure 1. You are a developer for Example Corp., and you are working on a web application. You want to grant the application hosted in one account—the ApplicationHost account—access to data in another account—the BusinessData account. To do this, you can use an IAM role in the BusinessData account to grant temporary access to the application through a role trust policy. You will grant a role in the ApplicationHost account—the PaymentApplication role—to access the BusinessData account through a role—the ApplicationAccess role. In this example, you create the ApplicationAccess role and grant cross-account permissions through the trust policy by using the new IAM console experience that helps you set the right permissions.

Figure 1: Visual explanation of the scenario

Figure 1: Visual explanation of the scenario

Create the role and grant permissions through a role trust policy with the policy editor

In this section, I will show you how to create a role trust policy for the ApplicationAccess role to grant the application access to the data in your account through the policy editor in the IAM console.

To create a role and grant access

  1. In the BusinessData account, open the IAM console, and in the left navigation pane, choose Roles.
  2. Choose Create role, and then select Custom trust policy, as shown in Figure 2.
    Figure 2: Select "Custom trust policy" when creating a role

    Figure 2: Select “Custom trust policy” when creating a role

  3. In the Custom trust policy section, for 1. Add actions for STS, select the actions that you need for your policy. For example, to add the action sts:AssumeRole, choose AssumeRole.
    Figure 3: JSON role trust policy

    Figure 3: JSON role trust policy

  4. For 2. Add a principal, choose Add to add a principal.
  5. In the Add principal box, for Principal type, select IAM roles. This populates the ARN field with the format of the role ARN that you need to add to the policy, as shown in Figure 4.
    Figure 4: Add a principal to your role trust policy

    Figure 4: Add a principal to your role trust policy

  6. Update the role ARN template with the actual account and role information, and then choose Add principal. In our example, the account is ApplicationHost with an AWS account number of 111122223333, and the role is PaymentApplication role. Therefore, the role ARN is arn:aws:iam:: 111122223333: role/PaymentApplication. Figure 5 shows the role trust policy with the action and principal added.
    Figure 5: Sample role trust policy

    Figure 5: Sample role trust policy

  7. (Optional) To add a condition, for 3. Add a condition, choose Add, and then complete the Add condition box according to your needs.

Author secure policies by reviewing policy validation findings

As you author the policy, you can see errors or warnings related to your policy in the policy validation window, which is located below the policy editor in the console. With this launch, policy validation in IAM Access Analyzer includes 13 new checks focused on the trust relationship for the role. The following are a few examples of these checks and how to address them:

  • Role trust policy unsupported wildcard in principal – you can’t use a * in your role trust policy.
  • Invalid federated principal syntax in role trust policy – you need to fix the format of the identity provider.
  • Missing action for condition key – you need to add the right action for a given condition, such as the sts:TagSession when there are session tag conditions.

For a complete list of checks, see Access Analyzer policy check reference.

To review and fix policy validation findings

  1. In the policy validation window, do the following:
    • Choose the Security tab to check if your policy is overly permissive.
    • Choose the Errors tab to review any errors associated with the policy.
    • Choose the Warnings tab to review if aspects of the policy don’t align with AWS best practices.
    • Choose the Suggestions tab to get recommendations on how to improve the quality of your policy.
    Figure 6: Policy validation window in IAM Access Analyzer with a finding for your policy

    Figure 6: Policy validation window in IAM Access Analyzer with a finding for your policy

  2. For each finding, choose Learn more to review the documentation associated with the finding and take steps to fix it. For example, Figure 6 shows the error Mismatched Action For Principal. To fix the error, remove the action sts:AssumeRoleWithWebIdentity.

Preview external access by reviewing cross-account access findings

IAM Access Analyzer also generates findings to help you assess if a policy grants access to external entities. You can review the findings before you create the policy to make sure that the policy grants only intended access. To preview the findings, you create an analyzer and then review the findings.

To preview findings for external access

  1. Below the policy editor, in the Preview external access section, choose Go to Access Analyzer, as shown in Figure 7.

    Note: IAM Access Analyzer is a regional service, and you can create a new analyzer in each AWS Region where you operate. In this situation, IAM Access Analyzer looks for an analyzer in the Region where you landed on the IAM console. If IAM Access Analyzer doesn’t find an analyzer there, it asks you to create an analyzer.

    Figure 7: Preview external access widget without an analyzer

    Figure 7: Preview external access widget without an analyzer

  2. On the Create analyzer page, do the following to create an analyzer:
    • For Name, enter a name for your analyzer.
    • For Zone of trust, select the correct account.
    • Choose Create analyzer.
    Figure 8: Create an analyzer to preview findings

    Figure 8: Create an analyzer to preview findings

  3. After you create the analyzer, navigate back to the role trust policy for your role to review the external access granted by this policy. The following figure shows that external access is granted to PaymentApplication.
    Figure 9: Preview finding

    Figure 9: Preview finding

  4. If the access is intended, you don’t need to take any action. In this example, I want the PaymentApplication role in the ApplicationHost account to assume the role that I’m creating.
  5. If the access is unintended, resolve the finding by updating the role ARN information.
  6. Select Next and grant the required IAM permissions for the role.
  7. Name the role ApplicationAccess, and then choose Save to save the role.

Now the application can use this role to access the BusinessData account.

Conclusion

By using the new IAM console experience for role trust policies, you can confidently author policies that grant the intended access. IAM Access Analyzer helps you in your least-privilege journey by evaluating the policy for potential issues to make it simpler for you to author secure policies. IAM Access Analyzer also helps you preview external access granted through the trust policy to help ensure that the granted access is intended. To learn more about how to preview IAM Access Analyzer cross-account findings, see Preview access in the documentation. To learn more about IAM Access Analyzer policy validation checks, see Access Analyzer policy validation. These features are also available through APIs.

If you have feedback about this post, submit comments in the Comments section below. If you have questions about this post, start a new thread at AWS IAM re:Post or contact AWS Support.

Mathangi Ramesh

Mathangi Ramesh

Mathangi is the product manager for AWS Identity and Access Management. She enjoys talking to customers and working with data to solve problems. Outside of work, Mathangi is a fitness enthusiast and a Bharatanatyam dancer. She holds an MBA degree from Carnegie Mellon University.

Announcing General Availability of Amazon Connect Cases

Post Syndicated from Veliswa Boya original https://aws.amazon.com/blogs/aws/announcing-general-availability-of-amazon-connect-cases/

In June 2022 AWS announced a preview of Amazon Connect Cases, a feature of Amazon Connect that simplifies these customer interactions and reduces the average handle times of issues.

Today I am excited to announce the general availability of Amazon Connect Cases. Cases, a feature of Amazon Connect, makes it easy for your contact center agents to create, collaborate on, and quickly resolve customer issues that require several customer conversations and follow-up tasks, and they can focus on solving the customer issue, no matter how simple or how complex. Agents have relevant case details (such as date and time opened, issue summary, or customer information) in a single unified view, and they can focus on solving the customer issue.

Getting started with Cases takes only a few clicks because it is built into Amazon Connect. With Cases, you automatically create cases or find existing cases, saving agents time searching and entering data manually. Cases accelerates resolution times, improves efficiency, and reduces errors to help increase customer satisfaction.

Best of all, Cases is part of the unified agent application that also includes the Amazon Connect Contact Control Panel to handle contacts, Amazon Connect Customer Profiles to identify the customer and personalize the experience, Amazon Connect Wisdom to surface relevant knowledge articles, and Amazon Connect Tasks to automate, track, and monitor follow up items.

An Overview of Amazon Connect Cases

Litigation Practice Group is a provider of legal support for debt relief. Litigation’s Director of Business Intelligence, Alex Miles, spoke about how they have experienced Cases. He said:

“Amazon Connect not only addresses many of the technological limitations we were facing but brings with it a suite of modern solutions for all our business needs. One of those needs is case management to handle operating activities, including payments, document control, and legal cases. Amazon Connect Cases seamlessly integrates with our existing contact center workflows. Our agents and legal teams now have full performance visibility and spend less time on manual tasks, creating more time to find solutions to enhance the customer journey.”

Cases provides built-in case management capabilities, eliminating the need for contact centers to build custom solutions or integrate with third-party products to handle complex customer
issues. For every issue, Cases enables agents to view case history and activity all in one place, automatically capture case data from interactive voice response (IVR) or chats (via Amazon Lex), and track follow-up work with Tasks.

  1. View case history and activity all in one place – Agents view the details of the customer issue (including calls, tasks, and chats associated with the case) all in one place within the unified Amazon Connect agent application. The timeline view shows agents a case at a glance, removing the need for agents to go back and forth between applications.

    View case history and activity in one place

    View case history and activity in one place

  2. Automatically capture case data from interactive voice response (IVR) or chats – With this feature you can automatically create and update cases by using information gathered in a customer’s self-service IVR or chatbot interaction. When agent assistance is required, the contact will then be routed to an available agent with the relevant case attached, resulting in improved average handle time and first-contact resolution.

    Automatically capture case data from your IVR and chatbots

    Automatically capture case data from your IVR and chatbots

  3. Take action with task management – This feature is Cases working together with Amazon Connect Tasks to help you reduce resolution time and improve efficiency. Tasks, which tracks the work that must be done to resolve the customer’s issue, ensures that a case is captured and includes prior and pending actions needed to resolve the issue. This makes it easier for agents to create, prioritize, and monitor work assigned to other agents or teams. Here I’d also like to highlight how all this results in great collaboration between agents and ultimately, teams.

    Take action with task management

    Take action with task management

  4. Get started in a few clicks! Turn on Cases and configure permissions, fields, and templates, all within Amazon Connect. No third-party tools or integrations are required.
    Get Started

    Get Started

General Availability
Amazon Connect Cases is generally available in US East (N. Virginia), and US West (Oregon).

Veliswa x

Git 2.38 released

Post Syndicated from original https://lwn.net/Articles/910213/

Version 2.38.0 of the Git distributed version-control system has been released. It comes with lots of new features and bug fixes, some of the former are described in a GitHub blog post by Taylor Blau. Highlights include the promotion of the scalar addition for large repositories into Git core, improvements to multi-branch rebase operations with --update-refs, performance improvements, a bash prompt indication for unmerged indexes, and lots more.

Netdev 0x16 accepted sessions announced

Post Syndicated from original https://lwn.net/Articles/910210/

The accepted sessions for the upcoming Netdev 0x16 have been posted. The conference will be held virtually and in-person in Lisbon, Portugal October 24-28. In addition, early-bird registration rates have been extended to October 4.

Netdev 0x16, like all the previous netdev conferences, is a conference of the netdev community, by the netdev community, for the netdev community. Linux kernel networking and user space utilization of the interfaces to the Linux kernel networking subsystem are the focus. If you are using Linux as a boot system for proprietary networking, then this conference _may not be for you_.

AWS Week in Review – October 3, 2022

Post Syndicated from Danilo Poccia original https://aws.amazon.com/blogs/aws/aws-week-in-review-october-3-2022/

This post is part of our Week in Review series. Check back each week for a quick roundup of interesting news and announcements from AWS!

A new week and a new month just started. Curious which were the most significant AWS news from the previous seven days? I got you covered with this post.

Last Week’s Launches
Here are the launches that got my attention last week:

Amazon File Cache – A high performance cache on AWS that accelerates and simplifies demanding cloud bursting and hybrid workflows by giving access to files using a fast and familiar POSIX interface, no matter if the original files live on premises on any file system that can be accessed through NFS v3 or on S3.

Amazon Data Lifecycle Manager – You can now automatically archive Amazon EBS snapshots to save up to 75 percent on storage costs for those EBS snapshots that you intend to retain for more than 90 days and rarely access.

AWS App Runner – You can now build and run web applications and APIs from source code using the new Node.js 16 managed runtime.

AWS Copilot – The CLI for containerized apps adds IAM permission boundaries, support for FIFO SNS/SQS for the Copilot worker-service pattern, and using Amazon CloudFront for low-latency content delivery and fast TLS-termination for public load-balanced web services.

Bottlerocket – The Linux-based operating system purpose-built to run container workloads is now supported by Amazon Inspector. Amazon Inspector can now recommend an update of Bottlerocket if it finds a vulnerability.

Amazon SageMaker Canvas – Now supports mathematical functions and operators for richer data exploration and to understand the relationships between variables in your data.

AWS Compute Optimizer – Now provides cost and performance optimization recommendations for 37 new EC2 instance types, including bare metal instances (m6g.metal) and compute optimized instances (c7g.2xlarge, hpc6a.48xlarge), and new memory metrics for Windows instances.

AWS Budgets – Use a simplified 1-click workflow for common budgeting scenarios with step-by-step tutorials on how to use each template.

Amazon Connect – Now provides an updated flow designer UI that makes it easier and faster to build personalized and automated end-customer experiences, as well as a queue dashboard to view and compare real-time queue performance through time series graphs.

Amazon WorkSpaces – You can now provision Ubuntu desktops and use virtual desktops for new categories of workloads, such as for your developers, engineers, and data scientists.

Amazon WorkSpaces Core – A fully managed infrastructure-only solution for third-party Virtual Desktop Infrastructure (VDI) management software that simplifies VDI migration and combines your current VDI software with the security and reliability of AWS. Read more about it in this Desktop and Application Streaming blog post.

For a full list of AWS announcements, be sure to keep an eye on the What’s New at AWS page.

Other AWS News
A few more blog posts you might have missed:

Introducing new language extensions in AWS CloudFormation – In this Cloud Operations & Migrations blog post, we introduce the new language transform that enhances CloudFormation core language with intrinsic functions that simplify handling JSON strings (Fn::ToJsonString), array lengths (Fn::Length), and update and deletion policies.

Building a GraphQL API with Java and AWS Lambda – This blog shows different options for resolving GraphQL queries using serverless technologies on AWS.

For AWS open-source news and updates, here’s the latest newsletter curated by Ricardo to bring you the most recent updates on open-source projects, posts, events, and more.

Upcoming AWS Events
As usual, there are many opportunities to meet:

AWS Summits– Connect, collaborate, and learn about AWS at these free in-person events: Bogotá (October 4), and Singapore (October 6).

AWS Community DaysAWS Community Day events are community-led conferences to share and learn together. Join us in Amersfoort, Netherlands (on October 3, today), Warsaw, Poland (October 14), and Dresden, Germany (October 19).

That’s all from me for this week. Come back next Monday for another Week in Review!

Danilo

Highlights from Git 2.38

Post Syndicated from Taylor Blau original https://github.blog/2022-10-03-highlights-from-git-2-38/

The open source Git project just released Git 2.38, with features and bug fixes from over 92 contributors, 24 of them new. We last caught up with you on the latest in Git back when 2.37 was released.

To celebrate this most recent release, here’s GitHub’s look at some of the most interesting features and changes introduced since last time.

A repository management tool for large repositories

We talk a lot about performance in Git, especially in the context of large repositories. Returning readers of these blog posts will no doubt be familiar with the dozens of performance optimizations that have landed in Git over the years.

But with so many features to keep track of, it can be easy to miss out some every now and then (along with their corresponding performance gains).

Git’s new built-in repository management tool, Scalar, attempts to solve that problem by curating and configuring a uniform set of features with the biggest impact on large repositories. To start using it, you can either clone a new repository with scalar clone:

$ scalar clone /path/to/repo

Or, you can use the --full-clone option if you don’t want to start out with a sparse checkout. To apply Scalar’s recommended configuration to a clone you already have, you can instead run:

$ cd /path/to/repo
$ scalar register

At the time of writing, Scalar’s default configured features include:

Scalar’s configuration is updated as new (even experimental!) features are introduced to Git. To make sure you’re always using the latest and greatest, be sure to run scalar reconfigure /path/to/repo after a new release to update your repository’s config (or scalar reconfigure -a to update all of your Scalar-registered repositories at once).

Git 2.38 is the first time Scalar has been included in the release, but it has actually existed for much longer. Check back soon for a blog post on how Scalar came to be—from its early days as a standalone .NET application to its journey into core Git!

[source]

Rebase dependent branches with –update-refs

When working on a large feature, it’s often helpful to break up the work across multiple branches that build on each other.

But these branches can become cumbersome to manage when you need to rewrite history in an earlier branch. Since each branch depends on the previous ones, rewriting commits in one branch will leave the subsequent branches disconnected from history after rewriting.

In case that didn’t quite make sense, let’s walk through an example.

Suppose that you are working on a feature (my-feature), but want to break it down into a few distinct parts (maybe for ease of review, or to ensure you’re deploying it safely, etc.). Before you share your work with your colleagues, you build the entire feature up front to make sure that the end-result is feasible, like so.

$ git log --oneline origin/main..HEAD
741a3174683 (HEAD -> my-feature/part-three) Part 3: all done!
1ff073007eb Part 3: step two
880c07e326f Part 3: step one
40529bd11dc (my-feature/part-two) Part 2: step two
0a92cc3acd8 Part 2: step one
eed018043ba (my-feature/part-one) Part 1: step three
646c870d69e Part 1: step two
9147f6d2eb4 Part 1: step one

In the example below, the my-feature/part-three branch resembles what you imagine the final state will look like. But the intermediate check-points (my-feature/part-one, and so on) represent the chunks you intend to submit for code review.

After you submit everything, what happens if you want to make a change to one of the patches in part one?

You might create a fixup! commit on top, but squashing that patch into the one you wanted to change from part one will cause parts two and three to become disconnected:

Creating a fixup commit that causes parts two and three to become disconnected

Notice that after we squashed our fix into “Part 1: step one,” the subsequent branches vanished from history. That’s because they didn’t get updated to depend on the updated tip of my-feature/part-one after rebasing.

You could go through and manually checkout each branch, resetting each to the right commit. But this can get cumbersome quickly if you have a lot of branches, are making frequent changes, or both.

Git 2.38 ships with a new option to git rebase called --update-refs that knows how to perform these updates for you. Let’s try that same example again with the new version of Git.

Rebasing with the new viersion of Git, which updates each branch for you.

Because we used --update-refs, git rebase knew to update our dependent branches, so our history remains intact without having to manually update each individual branch.

If you want to use this option every time you rebase, you can run git config --global rebase.updateRefs true to have Git act as if the --update-refs option is always given.

[source]

Tidbits

This release coincides with the Git project’s participation in the annual Google Summer of Code program. This year, the Git project mentored two students, Shaoxuan Yuan, and Abhradeep Chakraborty, working on sparse index integration and various improvements to reachability bitmaps, respectively.

  • Shaoxuan’s first contribution was integrating the git rm command with the sparse index. The sparse index is a relatively new Git feature that enables Git to shrink the size of its index data structure to only track the contents of your sparse checkout, instead of the entire repository. Long-time readers will remember that Git commands have been converted to be compatible with the sparse-index one-by-one. Commands that aren’t compatible with the sparse index need to temporarily expand the index to cover the entire repository, leading to slow-downs when working in a large repository.

    Shaoxuan’s work made the git rm command compatible with the sparse index, causing it to only expand the index when necessary, bringing Git closer to having all commands be compatible with the sparse index by default.

    [source]

  • Shaoxuan also worked on improving git mv‘s behavior when moving a path from within the sparse checkout definition (sometimes called a “cone”) to outside of the sparse checkout. There were a number of corner cases that required careful reasoning, and curious readers can learn more about exactly how this was implemented in the patches linked below.

    [source]

  • Abhradeep worked on adding a new “lookup table” extension to Git’s reachability bitmap index. For those unfamiliar, this index (stored in a .bitmap file) associates a set of commits to a set of bitmaps, where each bit position corresponds to an object. A 1 bit indicates that a commit can reach the object specified by that bit position, and a 0 indicates that it cannot.

    But .bitmap files do not list their selected commits in a single location. Instead, they prefix each bitmap with the object ID of the commit it corresponds to. That means that in order to know what set of commits are covered by a .bitmap, Git must read the entire contents of the file to discover the set of bitmapped commits.

    Abhradeep addressed this shortcoming by adding an optional “lookup table” at the end of the .bitmap format, which provides a concise list of selected commits, as well as the offset of their corresponding bitmaps within the file. This provided some speed-ups across a handful of benchmarks, making bitmaps faster to load and use, especially for large repositories.

    [source]

  • Abhradeep also worked on sprucing up the technical documentation for the .bitmap format. So if you have ever been curious about or want to hack on Git’s bitmap internals, now is the time!

    [source]

For more about these projects, you can check out each contributor’s final blog posts here and here. Thank you, Shaoxuan, and Abhradeep!

Now that we’ve covered a handful of changes contributed by Google Summer of Code students, let’s take a look at some changes in this release of Git from other Git contributors.

  • You may not be familiar with Git’s merge-tree command, which historically was used to compute trivial three-way merges using Git’s recursive merge strategy. In Git 2.38, this command now knows how to integrate with the new ort merge strategy, allowing it to compute non-trivial merges without touching the index or working copy.

    The existing mode is still available behind a (deprecated) --trivial-merge option. When the new --write-tree mode is used, merge-tree takes two branches to merge, and computes the result using the ort strategy, all without touching the working copy or index. It outputs the resulting tree’s object ID, along with some information about any conflicts it encountered.

    As an aside, we at GitHub recently started using merge-ort to compute merges on GitHub.com more than an order of magnitude faster than before. We had previously used the implementation in libgit2 in order to compute merges without requiring a worktree, since GitHub stores repositories as bare, meaning we do not have a worktree to rely on. These changes will make their way to GitHub Enterprise beginning with verion 3.7.

    [source]

  • Bare Git repositories can be stored in and distributed with other Git repositories. This is often convenient, for example, as an easy mechanism to distribute Git repositories for use as test fixtures.

    When using repositories from less-than-trustworthy sources, this can also present a security risk. Git repositories often execute user-defined programs specified via the $GIT_DIR/config file. For example, core.pager defines which pager program Git uses, and core.editor defines which editor Git opens when you want to write a commit message (among other things).

    There are other examples, but an often-discussed one is the core.fsmonitor configuration, which can be used to specify a path to a filesystem monitoring hook. Because Git often needs to query the state of the filesystem, this hook (when configured) is invoked many times, including from git status, which people commonly script around in their shell prompt.

    This means that it’s possible to convince a victim to run arbitrary code by convincing them to clone a repository with a malicious bare repository embedded inside of it. If they change their working directory into the malicious repository within (since you cannot embed a bare repository at the top-level directory of a repository) and run some Git command, then they are likely to execute the script specified by core.fsmonitor (or any other configuration that specifies a command to execute).

    For this reason, the new safe.bareRepository configuration was introduced. When set to “explicit,” Git will only work with bare repositories specified by the top-level --git-dir argument. Otherwise, when set to “all” (which is the default), Git will continue to work with all bare repositories, embedded or not.

    It is worth noting that setting safe.bareRepository to “explicit” is only required if you worry that you may be cloning malicious repositories and executing Git commands in them.

    [source]

  • git grep learned a new -m option (short for --max-count), which behaves like GNU grep‘s options of the same name. This new option limits the number of matches shown per file. This can be especially useful when combined with other options, like -C or -p (which show code context, or the name of the function which contains each match).

    You could, for example, combine all three of these options to show a summary of how some function is called by many different files in your project. Git has a handful of objects that contain the substring oid_object_info. If you want to look at how callers across different files are structured without seeing more than one example from the same file, you can now run:

    $ git grep -C3 -p -m1 oid_object_info

    [source]

  • If you’ve ever scripted around the directory contents of your Git repository, there’s no doubt that you’ve encountered the git ls-files command. Unlike ls-tree (which lists the contents of a tree object), ls-files lists the contents of the index, the working directory, or both.

    There are already lots of options which can further specify what does or doesn’t get printed in ls-files‘s output. But its output was not easily customizable without additional scripting.

    In Git 2.38, that is no longer the case, with ls-files‘s new --format option. You can now customize how each entry is printed, with fields to print an object’s name and mode, as well as more esoteric options, like its stage in the index, or end-of-line (EOL) behavior.

    [source]

  • git cat-file also learned a new option to respect the mailmap when printing the contents of objects with identifiers in them. This feature was contributed by another Google Summer of Code student, this time working on behalf of GitLab!

    For the uninitiated, the mailmap is a feature which allows mapping name and email pairs to their canonical values, which can be useful if you change your name or email and want to retain authorship over historical commits without rewriting history.

    git show, and many other tools already understand how to remap identities under the mailmap (for example, git show‘s %aN and %aE format placeholders print the mailmapped author name and email, respectively, as opposed to %an and %ae, which don’t respect the mailmap). But git cat-file, which is a low-level command which prints the contents of objects, did not know how to perform this conversion.

    That meant that if you wanted to print a stream of objects, but transform any author, committer, or tagger identities according to the mailmap, you would have to pipe their contents through git show or similar. This is no longer the case, since git cat-file now understands the --[no]-use-mailmap option, meaning this transformation can be done before printing out object contents.

    [source]

  • Finally, Git’s developer documentation got an improvement in this most recent release, by adding a codified version of the Git community’s guidelines for code review. This document is a helpful resource for new and existing contributors to learn about the cultural norms around reviewing patches on the Git mailing list.

    If you’ve ever had the itch to contribute to the Git project, I highly encourage you to read the new reviewing guidelines (as well as the coding guidelines, and the “My First Contribution” document) and get started!

    [source]

The rest of the iceberg

That’s just a sample of changes from the latest release. For more, check out the release notes for 2.38, or any previous version in the Git repository.

Design a data mesh with event streaming for real-time recommendations on AWS

Post Syndicated from Vittorio Denti original https://aws.amazon.com/blogs/big-data/design-a-data-mesh-with-event-streaming-for-real-time-recommendations-on-aws/

This blog post was co-authored with Federico Piccinini.

The data landscape has been changing in recent years: there is a proliferation of entities producing and consuming large quantities of data within companies, and for most of them defining a proper data strategy has become of fundamental importance. A modern data strategy gives you a comprehensive plan to manage, access, analyze, and act on data.

As a result, more companies are considering the adoption of a data mesh architecture, a recently introduced paradigm where data is organized by domain, clear ownership of data and technology stack is enhanced, and a more agile setup is achieved. Because of this, some of your applications may need to be designed for a data-by-domain separation in order to benefit from a data mesh architecture.

In this post, we show you how to design a data mesh architecture for a scenario that requires real-time recommendations. The recommendation system is implemented through Amazon Personalize, a fully managed machine learning (ML) service, and works by consuming data by domain. For recommendations use cases, it’s important to have access to information about users, items, and interactions, often associated with different data sources within a company.

Because ML applications may have multiple types of input data, we propose a solution that works both for data at rest as well as real-time streaming. Real-time recommendations require streaming data in order to adapt to the user’s current intent.

Throughout the post, we introduce the data mesh paradigm and then extend it to a real-time use case by adding event streaming capabilities. We use the use case of a music streaming company that offers its customers the opportunity to listen to on-demand songs. The company has also started to offer, through the same platform, on-demand podcasts, and wants to take advantage of a modern data architecture to support data access for fast ML experimentation and inference.

Data mesh: A paradigm shift

Domain-driven design (DDD) represents a software design approach where complex solutions are divided into domains according to the underlying business logic. An architectural style that is often mentioned in the context of DDD is microservice architecture, a concept where software systems are structured into loosely coupled entities, namely microservices, each one owned by a small team and structured around business requirements. These paradigms, together with the advancement of cloud technologies, allowed companies to release software updates faster and continuously adapt their technology stack to evolving business requirements.

However, unlike software architectures, most data architectures were still designed around technologies rather than business domains. This changed in 2019, when Zhamak Dehghani introduced the data mesh. Data mesh is a paradigm shift towards data being treated as a product and processed as part of a domain. Data mesh applies the principles of DDD to data architectures: data is organized into data domains and the data is considered the product that the team owns and offers for consumption. This is a shift from a centralized ownership model to a decentralized one that allows companies to access data at scale. This shift also allows each team assigned to a data domain to build the data products by choosing the right technology for their job, analogous to software engineers working on a microservice.

Data mesh advocates for decentralized ownership and delivery of data management systems, while emphasizing the need for distributed governance and self-service tooling. The data mesh approach enables better autonomy of data domain owners and brings domains together to enable data sharing and federation across business units, without compromising on data security. This type of architecture supports the idea of distributed data, where all data is accessible for those with the right authority to access it. One key differentiator between a data lake and a data mesh is that in a data mesh, data doesn’t have to be consolidated into a single data lake and can remain within different databases.

For more information about the details and advantages of adopting the data mesh as a domain-driven data architecture, refer to Design a data mesh architecture using AWS Lake Formation and AWS Glue.

The components of a data mesh

Now that we have a good understanding of the data mesh paradigm, let’s look at the implementation and its components.

First, we start with data producers. These are the entities that are responsible for maintaining, owning, and exposing the specific data of their domain. Because of the domain separation, each producer can choose its own technology stack independently.

Similarly, we also have data consumers. These components, as their name indicates, use one or more data sources exposed by the producers. As before, adopting a data mesh architecture implies that each consumer is independent one another, meaning they could implement different technology stacks as well as solve different use cases.

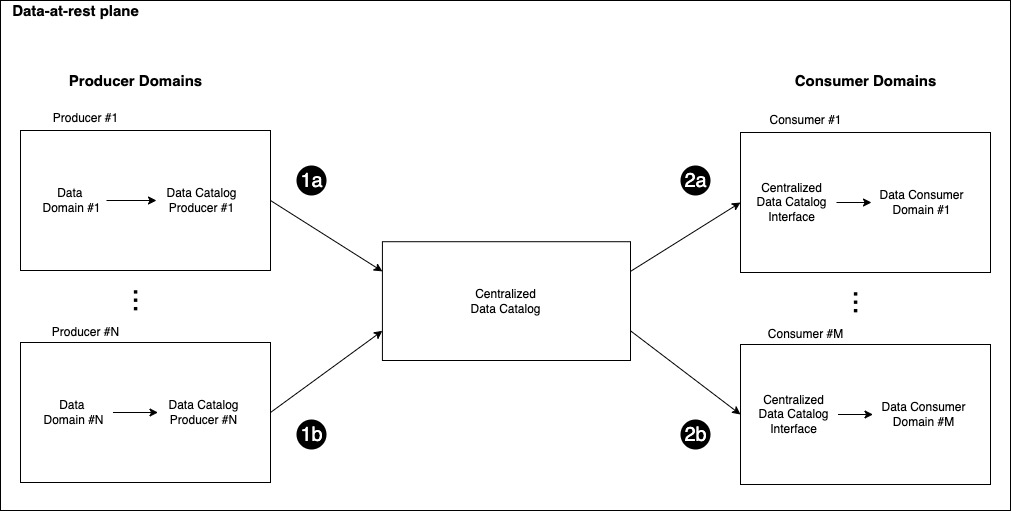
The data-at-rest plane is then completed by the Centralized Data Catalog, a component that works as the link between producers and consumers. This middle layer is responsible for indexing the available data producers into a centralized data catalog as well as controlling access to the different data sources.

The data catalog is used by the producers to expose the data products (steps 1a and 1b) to the organization’s data scientists and data engineers working on the consumer domains. The following figure illustrates how data products should be easily discoverable: the central data catalog allows the data consumers to find their data source of interest (steps 2a and 2b) after they have been registered with the centralized catalog by their corresponding producer domain (steps 1a and 1b).

Working with real-time events

One could argue that this architecture can only support data at rest as it is; indeed, there is no straightforward solution to move data in real time from a producer domain to a consumer. The paradigm presented so far addresses the scenario of data at rest, where producers are pulling data on demand rather than being notified when data is changed.

Because several applications need to quickly respond to the changes happening in the environment, real-time data is an important consideration in data architectures. For example, an ecommerce platform or a video streaming service can extract value from the real-time user interactions with content. In these cases, it’s critical to track events as they happen, feed them in the ML model, and adapt the predictions accordingly.

In this section, we want to introduce some of the streaming platforms that can work to implement this pattern, with a focus on Apache Kafka because it’s frequently used and many companies are moving their Kafka workloads to the cloud.

Apache Kafka is an open-source distributed event streaming platform that captures data in real time from sources such as microservices or databases, stores the events in streams organized into topics, and reacts to these events in real time as well as retrospectively. Event streaming architectures built on Apache Kafka follow the publish/subscribe paradigm: the producers publish events to topics via a write operation, and the consumers, which subscribe to such topics, receive the events as they happen. An alternative to Apache Kafka in this scenario could be Amazon Kinesis Data Streams, a streaming service that allows developers to collect, store, and process real-time data in the cloud.

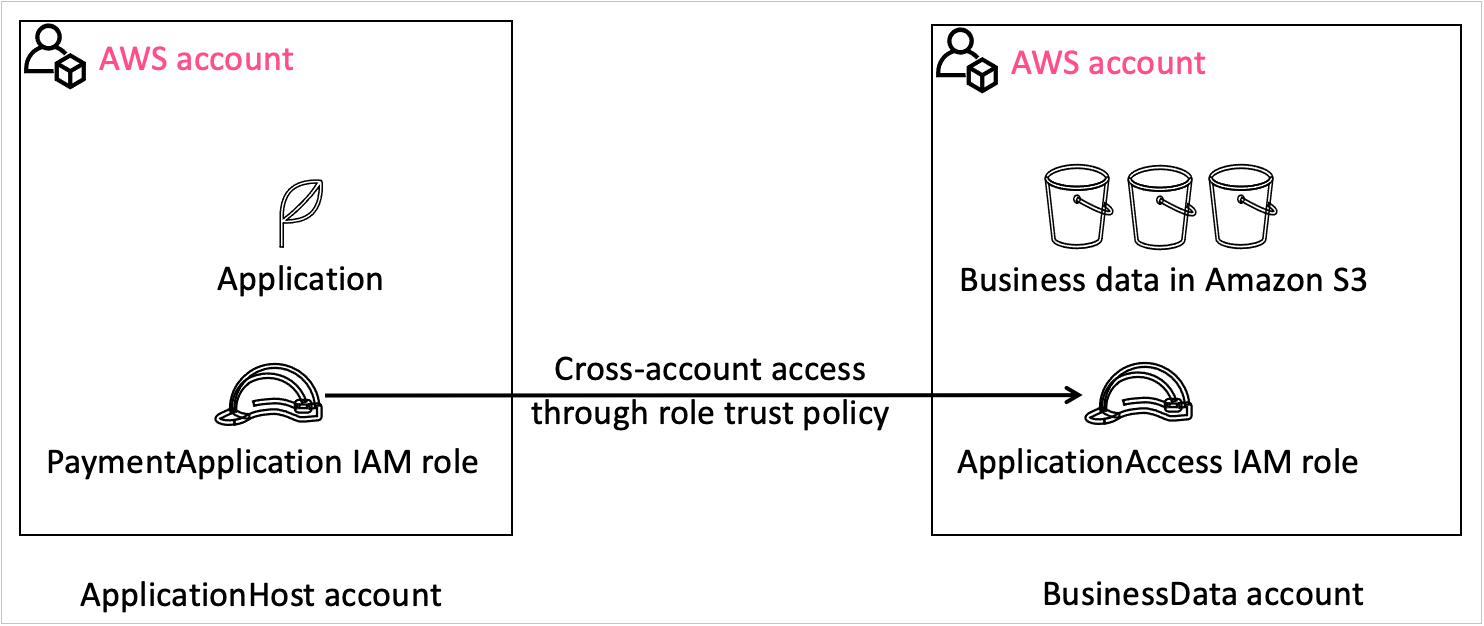
If we consider for example an ecommerce platform, we could have a Payment microservice running the payment functionalities of the system publishing events to Purchases topic, tracking every transaction happening on the platform. Then, we could have another component subscribing to the Purchases topic to receive the events and take action accordingly, for example by updating a dashboard for business intelligence. For more information on Apache Kafka, we recommend reading Introduction to Apache Kafka.

Event-streaming architecture

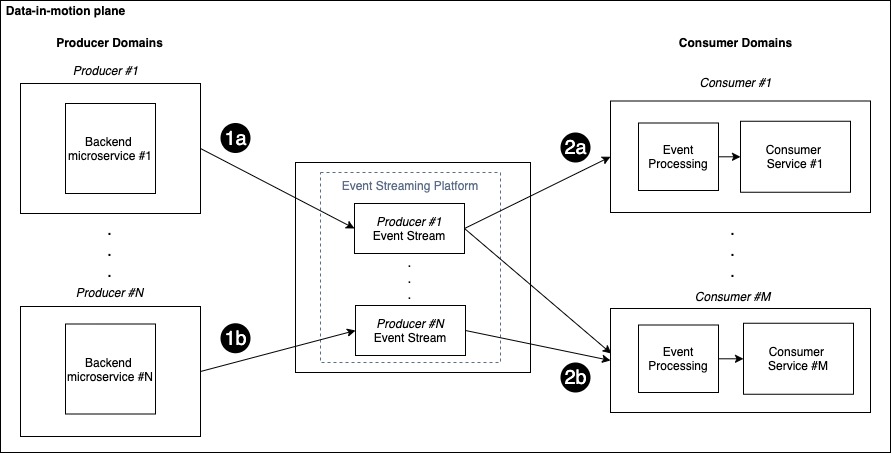
The data-in-motion plane is introduced to implement the publish/subscribe pattern in the context of a data mesh. Such a plane is composed of the set of producer and consumer domains connected via a central event streaming component that makes real-time events accessible. To benefit from the data-by-domain architecture, we consider each producer to have its own corresponding centralized stream, as shown in the following figure.

You can also think of the event stream as the channel for sending real-time events to the consumers, therefore each producer has its dedicated channel to send updates.

Each consumer can subscribe to multiple topics based on specific data needs. When new events are available, the corresponding producer publishes them in the associated stream (steps 1a and 1b) and the subscribers can read the events (step 2a and 2b), process them, and take action accordingly.

The preceding figure shows a scenario with N producer domains and M consumer domains: each consumer subscribes only to the streams of interest for that domain. In this example, Consumer #1 is subscribed to the events coming from Producer #1, while Consumer #M is subscribed to the events coming from both Producer #1 and Producer #N.

You could adopt this pattern to solve several use cases and data domains. For instance, a user playing a song on a music streaming platform can generate a new event sent from the Interactions service producer to the Personalization consumer, where the recommendation system generates personalized recommendations. Similarly, a Payment producer can send a transaction request, and a Fraud Detector consumer determines whether the transaction is fraudulent or not.

For producers and consumers to communicate correctly, the event payload schema needs to be consistent. Applications depend on schemas so no changes made to events break the implicit contract between producers and consumers. For complex use cases, you can use a schema registry to enforce compatibility in event streaming. For more information about the options for working with the AWS Glue Schema Registry, refer to Validate streaming data over Amazon MSK using schemas in cross-account AWS Glue Schema Registry.

Recommendation use case

Previously, we introduced the overall idea behind the data mesh architecture without focusing on a specific use case. In this section, we present a real-world scenario where the mesh paradigm is implemented using AWS.

Let’s consider the music streaming company XYZ, which offers its customers the opportunity to listen to on-demand songs. XYZ has recently started to offer, through the same platform, on-demand podcasts as well.

The ML team is interested in adding podcasts to the catalog of personalized recommendations that are presented to users. To do so, the ML team working on the recommendation system, which in the data mesh paradigm can be seen as a consumer, needs access to multiple data domains (producers): Users, Songs, Podcasts, and Interactions.

In this post, we use Amazon Personalize as a fully managed ML service for personalized recommendations. It allows developers to train, tune, and deploy custom ML models to deliver highly customized experiences. Amazon Personalize provisions the infrastructure and manages the entire ML pipeline, including processing the data; identifying features; and training, optimizing, and hosting the models. You can learn more about Amazon Personalize in the Developer Guide.

We now dive deeper into the implementation of the solution, both for the data-at-rest and data-in-motion scenario. ML needs large amounts of data at rest to create a dataset and train the models. Additionally, the personalization scenario requires access to real-time data to adapt to the users’ current intent, so we need access to real-time events and interactions. A data mesh solution for this scenario will require both:

  • Data at rest – Historical data from user, items, and interactions. Some of this could be stored in separate systems and data sources.
  • Data in motion – This data is for the real-time events, for instance songs listened to or new items made available in the catalog.

Architecture for data at rest

In this section, we focus on the data at rest part of the solution.

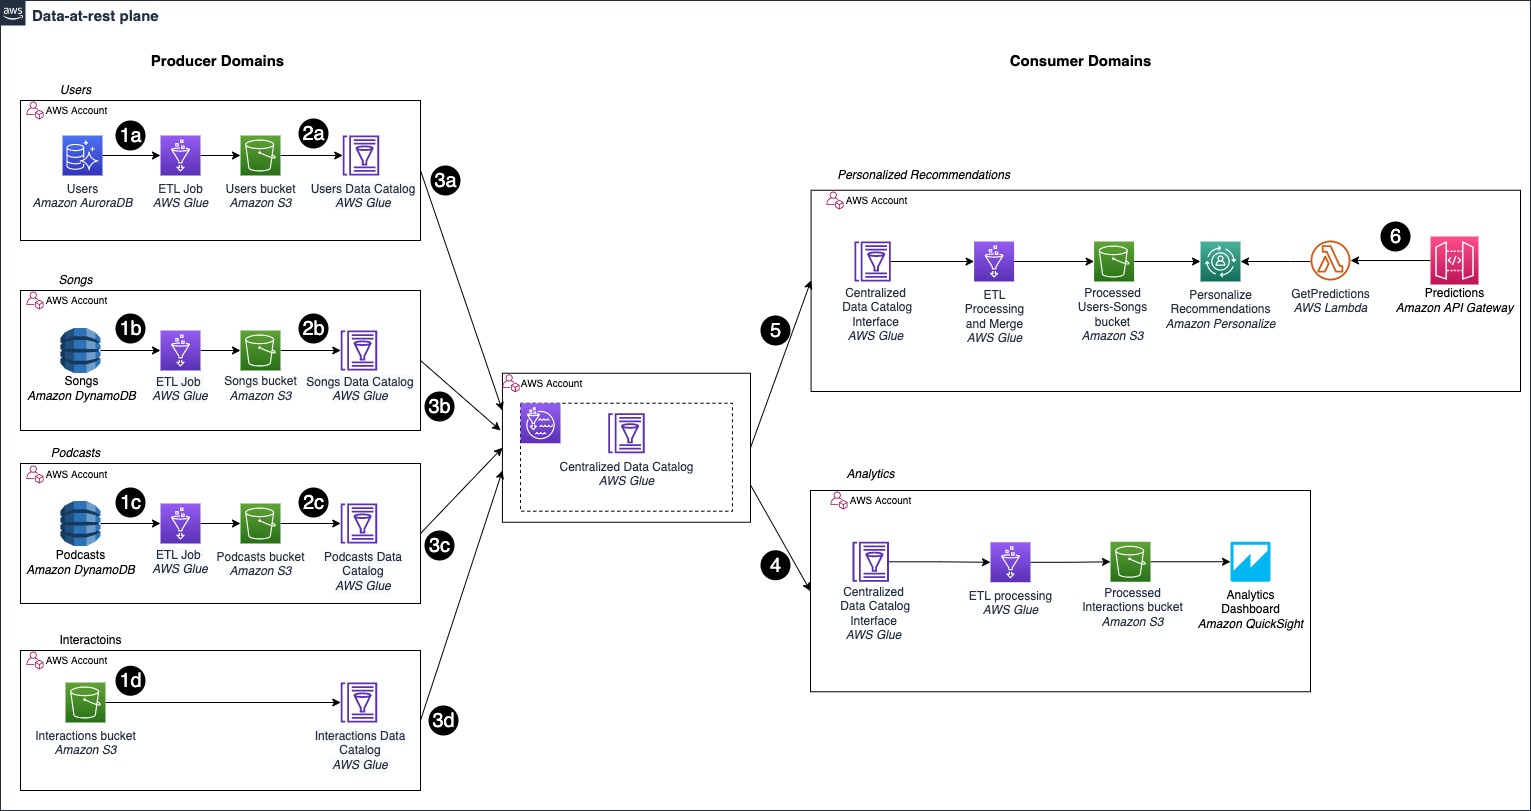
The following diagram shows how we can implement the data mesh architecture in the context of personalized recommendations, and include the podcasts in the recommendation system deployed with Amazon Personalize. Each producer domain owns the data and exposes them via the data catalogs. The consumers use the data catalogs to find the data they need for their application.

First, we can identify the three main components of the mesh architecture introduced before: data producers, the centralized data catalog, and data consumers.

In this specific example, we can see how different producer domains implement different storage solutions:

  • The Users domain uses Amazon Aurora as its own line of business (LOB) database, a relational database (step 1a)
  • Songs and Podcasts use Amazon DynamoDB, a NoSQL database (steps 1b and 1c)
  • Interactions ingests the events directly into Amazon S3 (step 1d)

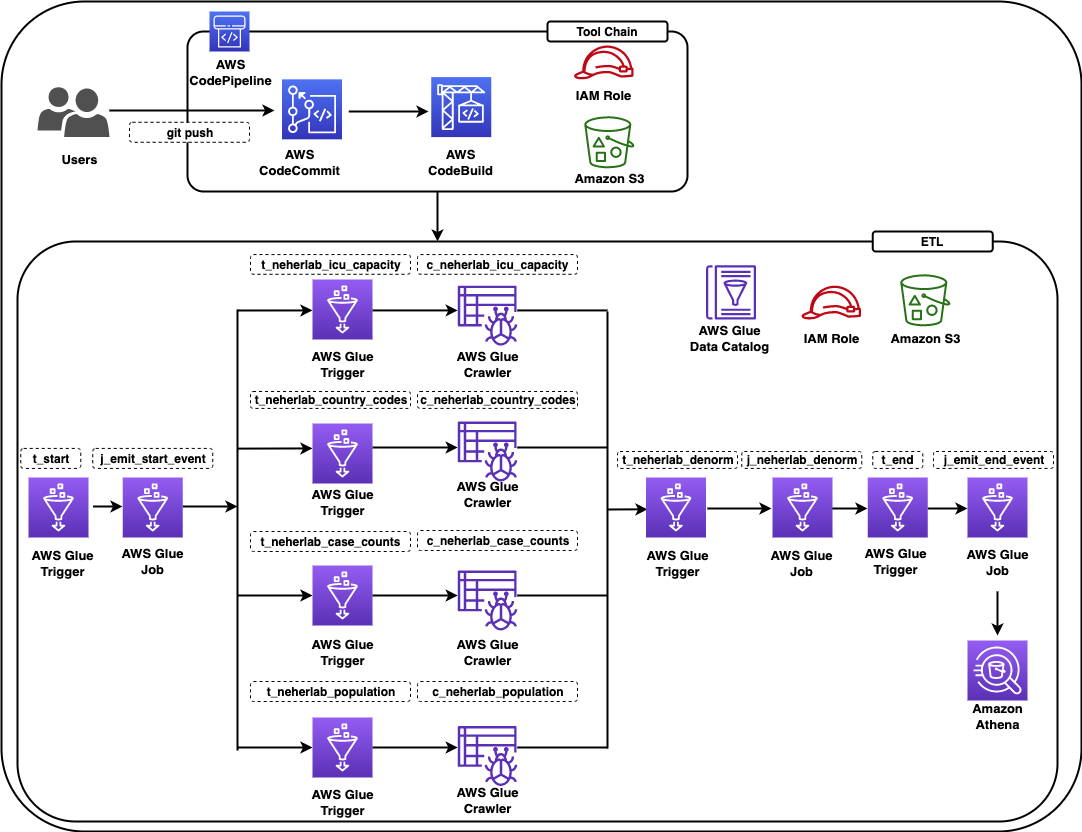
The producer domains are decoupling their LOB databases from the data catalogs by using Amazon Simple Storage Service (Amazon S3). With the data mesh paradigm, each producer considers the data as a product, therefore it can preprocess the data before exposing them, and store the results in a format that is suitable for the consumers. This decoupling is implemented using AWS Glue to define an extract, transform, and load (ETL) pipeline, whose results are eventually stored in S3 buckets (steps 2a, 2b, 2c).

Finally, each producer shares its respective AWS Glue Data Catalog with the Centralized Data Catalog (steps 3a, 3b, 3c, 3d).

Data consumers can now access the different data domains through the central catalog. As shown in the preceding figure, we have two consumers: the Analytics domain, which accesses certain catalogs and showcases metrics on an Amazon QuickSight dashboard (step 4), and the Personalized Recommendations domain (step 5).

The latter, which is the one of interest for this post, consists of an AWS Glue ETL job that accesses, through the central catalog, data from the different producers. The ETL job performs traditional data engineering tasks, for example merging song and podcast data. We can now generate our Amazon Personalize solution, where our items dataset includes information about both songs and podcasts, expanding the initial recommendation catalog.

Our recommendation engine is then made available for inference requests through an API deployed using Amazon API Gateway (step 6).

The architecture is designed to work across multiple accounts: an AWS account is a natural boundary for the resources deployed into it and a single unit of billing. This approach allows us to separate the resources owned by the different domains and maintain operational agility: each team owns and controls its account. To learn more about the approaches for sharing data catalogs across different accounts while working with a data mesh, check out Design a data mesh architecture using AWS Lake Formation and AWS Glue.

We’re now able to provide users with song or podcast recommendations based on their comprehensive listening preferences across the two categories. In the next section, we explore how to improve the architecture to be reactive to continuously evolving data, such as new songs added to the catalog or new interactions made available.

Architecture for data in motion

Earlier, we introduced the theoretical framework for event streaming in the context of the data mesh, defined as the data-in-motion plane. We can now drill down into the architecture for our specific use case.

We’re using a scenario with four producers (Users, Songs, Podcasts, and Interactions), the central streaming component, and two consumer domains (Personalized Recommendations and Analytics). The data-in-motion plane is implemented by using a platform for event streaming, namely Apache Kafka, and each producer has a dedicated stream to publish its events.

In the scenario of real-time recommendations for music, the Personalized Recommendations consumer is notified about changes to Users, Songs, Podcasts, and Interactions. Similar to the at-rest example, we also consider a second consumer domain, called Analytics, used to create real-time dashboards about the trends in the interactions. Here, the analytics consumer requires only interaction events, therefore it subscribes only to the Interactions stream.

This architecture is designed to offer a loosely coupled interaction mechanism for producers and consumers: the producers don’t need to know about the consumers that are part of the system. The producers focus on emitting the events, the events are sent to the data-in-motion plane, and the delivery is guaranteed by the streaming platform.

Let’s drill down into the strategy for building this architecture in the cloud. For readability purposes, we study this part of the solution in isolation, without adding to the diagram of the data-at-rest scenario.

From a technological perspective, we use AWS Lambda to run the back-end business logic of the application: the microservice runs the logic in a Lambda function and publishes events to the event streams. We use Lambda because it fits our use case well, both for scalability and operational efficiency, because it offers minimal operational overhead. However, the architecture pattern is also valid for other types of backend deployments, for example, containers running on Amazon Elastic Kubernetes Service (Amazon EKS) or Amazon Elastic Container Service (Amazon ECS).

The data-in-motion plane is implemented using Amazon Managed Streaming for Apache Kafka (Amazon MSK), a fully managed solution for running Apache Kafka in the cloud. It provisions the servers, configures the Apache Kafka clusters, replaces servers when they fail, orchestrates server patches and upgrades, and runs clusters for high availability. Kafka organizes and stores events into topics. Topics are always multi-producer and multi-consumer: this means that one or many producers can publish to the same topic, and one or many consumers can subscribe to read from the topic. We use the concept of topics to model this architecture paradigm, and we assign one topic for each producer domain.

Finally, we adapt our previously introduced consumer domain, Personalized Recommendations, to take into account real-time events. This time, we use Lambda to read the events from the topics and invoke the commands to call the Amazon Personalize API through the Amazon Personalize SDK. Within the same consumer domain, we use a Lambda function per topic, which is triggered as soon as a new event is published in the monitored topic. This event-driven pattern allows us to run code only when a new event is published and we need to update the information in Amazon Personalize. Each Lambda function in the Personalized Recommendations domain uses the Amazon Personalize SDK to invoke the corresponding actions on Amazon Personalize and update the datasets.

Let’s consider a new interaction happening in the system using the following figure. This serverless implementation of the event streaming pattern extends the data mesh to respond to real-time events.

The Interactions microservice, which is running the backend logic of the application, publishes a new event (step 1), which is persisted in the Interactions topic (step 2). The publishing of a new event triggers the Lambda functions subscribed to the topic, in this case InteractionsUpdate and InteractionsIngestor (step 3). The InteractionsUpdate function invokes the PutEvents operation on the Amazon Personalize API through the Amazon Personalize SDK to add the real-time event to the recommendation system (step 4). InteractionsIngestor triggers the operations to refresh the dashboards according to the strategy adopted by the Analytics domain. Finally, other services and components can consume the recommendations through the API exposed by the Personalized Recommendation domain to make the predictions consumable (step 5).

For the Analytics domain, which we added to showcase the scalability of this architecture, we use a Lambda function to ingest the real-time events into Amazon Kinesis Data Firehose. Then we can visualize the interactions using Amazon OpenSearch Service in conjunction with Amazon QuickSight. For more details, refer to Visualize live analytics from Amazon QuickSight connected to Amazon OpenSearch Service.

Because the data producers, Kafka resources, and data consumers are all in different accounts, we need to establish cross-account connectivity to keep the traffic within the AWS infrastructure and avoid the public internet, both for security reasons as well as cost-optimization. The objective of this post is to show the architecture and the approach to implement this pattern. If you want to dive deeper into how to establish cross-account connectivity between producers and consumers and Amazon MSK, refer to Secure connectivity patterns to access Amazon MSK and How Goldman Sachs builds cross-account connectivity to their Amazon MSK clusters with AWS Private Link.

Data mesh with event streaming: Putting it all together

Earlier, we recalled the data mesh paradigm and designed a solution to emphasize the importance of adopting a data as a product strategy. Each producer domain exposes the data via the catalog, and they are made centrally discoverable through the Centralized Data Catalog. Each consumer domain has a catalog interface for connecting to the central catalog and finding the data required to build the solution the domain focuses on.

Next, we studied the scenario for data in motion, introduced Apache Kafka and Amazon MSK to implement the event streaming platform, and connected the producers and consumers with the streaming service via Lambda. This event-driven implementation allows us to decouple the producers from the consumers, and make the solution scalable as the domains may change and evolve during time, without significant changes required in the architecture.

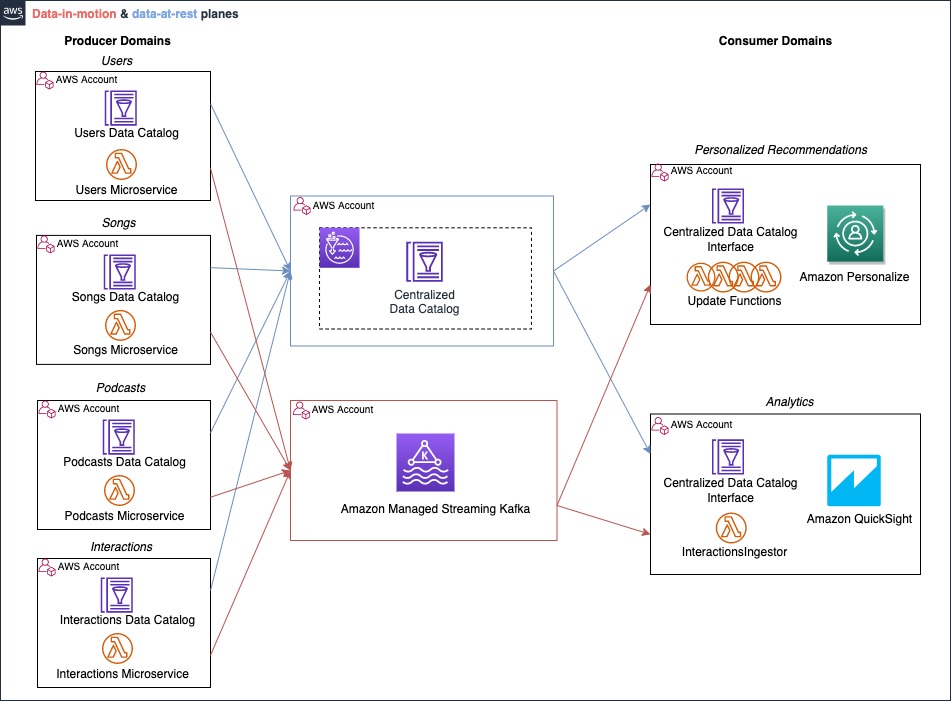
We can now put it all together, as shown in the following figure. The complete data mesh with event streaming architecture uses two different data planes: one is dedicated for sharing data at rest (blue); the other one is for data in motion (red).

Each domain has two interfaces required to communicate with both planes: the data catalogs and the Lambda functions. The data at rest is shared and discovered by taking advantage of the data catalogs, whereas the data in motion are emitted by the service running the backend logic in the producer domains. They’re consumed using the Lambda functions subscribed to the topics, which are deployed in the consumer domains.

Conclusion

In this post, we introduced the high-level architecture paradigm that allows you to extend the concept of a data mesh to real-time events.

We first covered the fundamental concepts associated with this architectural style, and then showcased how to apply this solution to solve real-world business challenges, such as real-time personalized recommendations and analytics, in a multi-account setting on AWS.

Furthermore, the framework presented in this post can be generalized to different domains, for example other AWS AI services such as Amazon Forecast or Amazon Comprehend, or your custom ML solutions built for your specific scenario and deployed through Amazon SageMaker. With the most experience, the most reliable, scalable and secure cloud, and the most comprehensive set of services and solutions, AWS is the best place to unlock value from your data.

More resources:


About the authors

Vittorio Denti is a Solutions Architect at AWS based in London. After completing his M.Sc. in Computer Science and Engineering at Politecnico di Milano (Milan) and the KTH Royal Institute of Technology (Stockholm), he joined AWS. Vittorio has a background in Distributed Systems and Machine Learning, and a strong interest in cloud technologies. He’s especially passionate for software engineering, building ML models, and putting ML into production.

Anna Grüebler is a Specialist Solutions Architect at AWS focusing on in Artificial Intelligence. She has more than 10 years experience helping customers develop and deploy machine learning applications. Her passion is taking new technologies and putting them in the hands of everyone, and solving difficult problems leveraging the advantages of using AI in the cloud.

Build, Test and Deploy ETL solutions using AWS Glue and AWS CDK based CI/CD pipelines

Post Syndicated from Puneet Babbar original https://aws.amazon.com/blogs/big-data/build-test-and-deploy-etl-solutions-using-aws-glue-and-aws-cdk-based-ci-cd-pipelines/

AWS Glue is a serverless data integration service that makes it easy to discover, prepare, and combine data for analytics, machine learning (ML), and application development. It’s serverless, so there’s no infrastructure to set up or manage.

This post provides a step-by-step guide to build a continuous integration and continuous delivery (CI/CD) pipeline using AWS CodeCommit, AWS CodeBuild, and AWS CodePipeline to define, test, provision, and manage changes of AWS Glue based data pipelines using the AWS Cloud Development Kit (AWS CDK).

The AWS CDK is an open-source software development framework for defining cloud infrastructure as code using familiar programming languages and provisioning it through AWS CloudFormation. It provides you with high-level components called constructs that preconfigure cloud resources with proven defaults, cutting down boilerplate code and allowing for faster development in a safe, repeatable manner.

Solution overview

The solution constructs a CI/CD pipeline with multiple stages. The CI/CD pipeline constructs a data pipeline using COVID-19 Harmonized Data managed by Talend / Stitch. The data pipeline crawls the datasets provided by neherlab from the public Amazon Simple Storage Service (Amazon S3) bucket, exposes the public datasets in the AWS Glue Data Catalog so they’re available for SQL queries using Amazon Athena, performs ETL (extract, transform, and load) transformations to denormalize the datasets to a table, and makes the denormalized table available in the Data Catalog.

The solution is designed as follows:

  • A data engineer deploys the initial solution. The solution creates two stacks:
    • cdk-covid19-glue-stack-pipeline – This stack creates the CI/CD infrastructure as shown in the architectural diagram (labeled Tool Chain).
    • cdk-covid19-glue-stack – The cdk-covid19-glue-stack-pipeline stack deploys the cdk-covid19-glue-stack stack to create the AWS Glue based data pipeline as shown in the diagram (labeled ETL).
  • The data engineer makes changes on cdk-covid19-glue-stack (when a change in the ETL application is required).
  • The data engineer pushes the change to a CodeCommit repository (generated in the cdk-covid19-glue-stack-pipeline stack).
  • The pipeline is automatically triggered by the push, and deploys and updates all the resources in the cdk-covid19-glue-stack stack.

At the time of publishing of this post, the AWS CDK has two versions of the AWS Glue module: @aws-cdk/aws-glue and @aws-cdk/aws-glue-alpha, containing L1 constructs and L2 constructs, respectively. At this time, the @aws-cdk/aws-glue-alpha module is still in an experimental stage. We use the stable @aws-cdk/aws-glue module for the purpose of this post.

The following diagram shows all the components in the solution.

BDB-2467-architecture-diagram

Figure 1 – Architecture diagram

The data pipeline consists of an AWS Glue workflow, triggers, jobs, and crawlers. The AWS Glue job uses an AWS Identity and Access Management (IAM) role with appropriate permissions to read and write data to an S3 bucket. AWS Glue crawlers crawl the data available in the S3 bucket, update the AWS Glue Data Catalog with the metadata, and create tables. You can run SQL queries on these tables using Athena. For ease of identification, we followed the naming convention for triggers to start with t_*, crawlers with c_*, and jobs with j_*. A CI/CD pipeline based on CodeCommit, CodeBuild, and CodePipeline builds, tests and deploys the solution. The complete infrastructure is created using the AWS CDK.

The following table lists the tables created by this solution that you can query using Athena.

Table Name Description Dataset Location Access Location
neherlab_case_counts Total number of cases s3://covid19-harmonized-dataset/covid19tos3/neherlab_case_counts/ Read Public
neherlab_country_codes Country code s3://covid19-harmonized-dataset/covid19tos3/neherlab_country_codes/ Read Public
neherlab_icu_capacity Intensive Care Unit (ICU) capacity s3://covid19-harmonized-dataset/covid19tos3/neherlab_icu_capacity/ Read Public
neherlab_population Population s3://covid19-harmonized-dataset/covid19tos3/neherlab_population/ Read Public
neherla_denormalized Denormalized table that combines all the preceding tables into one table s3://<your-S3-bucket-name>/neherlab_denormalized Read/Write Reader’s AWS account

Anatomy of the AWS CDK application

In this section, we visit key concepts and anatomy of the AWS CDK application, review the important sections of the code, and discuss how the AWS CDK reduces complexity of the solution as compared to AWS CloudFormation.

An AWS CDK app defines one or more stacks. Stacks (equivalent to CloudFormation stacks) contain constructs, each of which defines one or more concrete AWS resources. Each stack in the AWS CDK app is associated with an environment. An environment is the target AWS account ID and Region into which the stack is intended to be deployed.

In the AWS CDK, the top-most object is the AWS CDK app, which contains multiple stacks vs. the top-level stack in AWS CloudFormation. Given this difference, you can define all the stacks required for the application in the AWS CDK app. In AWS Glue based ETL projects, developers need to define multiple data pipelines by subject area or business logic. In AWS CloudFormation, we can achieve this by writing multiple CloudFormation stacks and often deploy them independently. In some cases, developers write nested stacks, which over time becomes very large and complicated to maintain. In the AWS CDK, all stacks are deployed from the AWS CDK app, increasing modularity of the code and allowing developers to identify all the data pipelines associated with an application easily.

Our AWS CDK application consists of four main files:

  • app.py – This is the AWS CDK app and the entry point for the AWS CDK application
  • pipeline.py – The pipeline.py stack, invoked by app.py, creates the CI/CD pipeline
  • etl/infrastructure.py – The etl/infrastructure.py stack, invoked by pipeline.py, creates the AWS Glue based data pipeline
  • default-config.yaml – The configuration file contains the AWS account ID and Region.

The AWS CDK application reads the configuration from the default-config.yaml file, sets the environment information (AWS account ID and Region), and invokes the PipelineCDKStack class in pipeline.py. Let’s break down the preceding line and discuss the benefits of this design.

For every application, we want to deploy in pre-production environments and a production environment. The application in all the environments will have different configurations, such as the size of the deployed resources. In the AWS CDK, every stack has a property called env, which defines the stack’s target environment. This property receives the AWS account ID and Region for the given stack.

Lines 26–34 in app.py show the aforementioned details:

# Initiating the CodePipeline stack
PipelineCDKStack(
app,
"PipelineCDKStack",
config=config,
env=env,
stack_name=config["codepipeline"]["pipelineStackName"]
)

The env=env line sets the target AWS account ID and Region for PipelieCDKStack. This design allows an AWS CDK app to be deployed in multiple environments at once and increases the parity of the application in all environment. For our example, if we want to deploy PipelineCDKStack in multiple environments, such as development, test, and production, we simply call the PipelineCDKStack stack after populating the env variable appropriately with the target AWS account ID and Region. This was more difficult in AWS CloudFormation, where developers usually needed to deploy the stack for each environment individually. The AWS CDK also provides features to pass the stage at the command line. We look into this option and usage in the later section.

Coming back to the AWS CDK application, the PipelineCDKStack class in pipeline.py uses the aws_cdk.pipeline construct library to create continuous delivery of AWS CDK applications. The AWS CDK provides multiple opinionated construct libraries like aws_cdk.pipeline to reduce boilerplate code from an application. The pipeline.py file creates the CodeCommit repository, populates the repository with the sample code, and creates a pipeline with the necessary AWS CDK stages for CodePipeline to run the CdkGlueBlogStack class from the etl/infrastructure.py file.

Line 99 in pipeline.py invokes the CdkGlueBlogStack class.

The CdkGlueBlogStack class in etl/infrastructure.py creates the crawlers, jobs, database, triggers, and workflow to provision the AWS Glue based data pipeline.

Refer to line 539 for creating a crawler using the CfnCrawler construct, line 564 for creating jobs using the CfnJob construct, and line 168 for creating the workflow using the CfnWorkflow construct. We use the CfnTrigger construct to stitch together multiple triggers to create the workflow. The AWS CDK L1 constructs expose all the available AWS CloudFormation resources and entities using methods from popular programing languages. This allows developers to use popular programing languages to provision resources instead of working with JSON or YAML files in AWS CloudFormation.

Refer to etl/infrastructure.py for additional details.

Walkthrough of the CI/CD pipeline

In this section, we walk through the various stages of the CI/CD pipeline. Refer to CDK Pipelines: Continuous delivery for AWS CDK applications for additional information.

  • Source – This stage fetches the source of the AWS CDK app from the CodeCommit repo and triggers the pipeline every time a new commit is made.
  • Build – This stage compiles the code (if necessary), runs the tests, and performs a cdk synth. The output of the step is a cloud assembly, which is used to perform all the actions in the rest of the pipeline. The pytest is run using the amazon/aws-glue-libs:glue_libs_3.0.0_image_01 Docker image. This image comes with all the required libraries to run tests for AWS Glue version 3.0 jobs using a Docker container. Refer to Develop and test AWS Glue version 3.0 jobs locally using a Docker container for additional information.
  • UpdatePipeline – This stage modifies the pipeline if necessary. For example, if the code is updated to add a new deployment stage to the pipeline or add a new asset to your application, the pipeline is automatically updated to reflect the changes.
  • Assets – This stage prepares and publishes all AWS CDK assets of the app to Amazon S3 and all Docker images to Amazon Elastic Container Registry (Amazon ECR). When the AWS CDK deploys an app that references assets (either directly by the app code or through a library), the AWS CDK CLI first prepares and publishes the assets to Amazon S3 using a CodeBuild job. This AWS Glue solution creates four assets.
  • CDKGlueStage – This stage deploys the assets to the AWS account. In this case, the pipeline deploys the AWS CDK template etl/infrastructure.py to create all the AWS Glue artifacts.

Code

The code can be found at AWS Samples on GitHub.

Prerequisites

This post assumes you have the following:

Deploy the solution

To deploy the solution, complete the following steps:

  • Download the source code from the AWS Samples GitHub repository to the client machine:
$ git clone [email protected]:aws-samples/aws-glue-cdk-cicd.git
  • Create the virtual environment:
$ cd aws-glue-cdk-cicd 
$ python3 -m venv .venv

This step creates a Python virtual environment specific to the project on the client machine. We use a virtual environment in order to isolate the Python environment for this project and not install software globally.

  • Activate the virtual environment according to your OS:
    • On MacOS and Linux, use the following code:
$ source .venv/bin/activate
    • On a Windows platform, use the following code:
% .venv\Scripts\activate.bat

After this step, the subsequent steps run within the bounds of the virtual environment on the client machine and interact with the AWS account as needed.

  • Install the required dependencies described in requirements.txt to the virtual environment:
$ pip install -r requirements.txt
  • Bootstrap the AWS CDK app:
cdk bootstrap

This step populates a given environment (AWS account ID and Region) with resources required by the AWS CDK to perform deployments into the environment. Refer to Bootstrapping for additional information. At this step, you can see the CloudFormation stack CDKToolkit on the AWS CloudFormation console.

  • Synthesize the CloudFormation template for the specified stacks:
$ cdk synth # optional if not default (-c stage=default)

You can verify the CloudFormation templates to identify the resources to be deployed in the next step.

  • Deploy the AWS resources (CI/CD pipeline and AWS Glue based data pipeline):
$ cdk deploy # optional if not default (-c stage=default)

At this step, you can see CloudFormation stacks cdk-covid19-glue-stack-pipeline and cdk-covid19-glue-stack on the AWS CloudFormation console. The cdk-covid19-glue-stack-pipeline stack gets deployed first, which in turn deploys cdk-covid19-glue-stack to create the AWS Glue pipeline.

Verify the solution

When all the previous steps are complete, you can check for the created artifacts.

CloudFormation stacks

You can confirm the existence of the stacks on the AWS CloudFormation console. As shown in the following screenshot, the CloudFormation stacks have been created and deployed by cdk bootstrap and cdk deploy.

BDB-2467-cloudformation-stacks

Figure 2 – AWS CloudFormation stacks

CodePipeline pipeline

On the CodePipeline console, check for the cdk-covid19-glue pipeline.

BDB-2467-code-pipeline-summary

Figure 3 – AWS CodePipeline summary view

You can open the pipeline for a detailed view.

BDB-2467-code-pipeline-detailed

Figure 4 – AWS CodePipeline detailed view

AWS Glue workflow

To validate the AWS Glue workflow and its components, complete the following steps:

  • On the AWS Glue console, choose Workflows in the navigation pane.
  • Confirm the presence of the Covid_19 workflow.
BDB-2467-glue-workflow-summary

Figure 5 – AWS Glue Workflow summary view

You can select the workflow for a detailed view.

BDB-2467-glue-workflow-detailed

Figure 6 – AWS Glue Workflow detailed view

  • Choose Triggers in the navigation pane and check for the presence of seven t-* triggers.
BDB-2467-glue-triggers

Figure 7 – AWS Glue Triggers

  • Choose Jobs in the navigation pane and check for the presence of three j_* jobs.
BDB-2467-glue-jobs

Figure 8 – AWS Glue Jobs

The jobs perform the following tasks:

    • etlScripts/j_emit_start_event.py – A Python job that starts the workflow and creates the event
    • etlScripts/j_neherlab_denorm.py – A Spark ETL job to transform the data and create a denormalized view by combining all the base data together in Parquet format
    • etlScripts/j_emit_ended_event.py – A Python job that ends the workflow and creates the specific event
  • Choose Crawlers in the navigation pane and check for the presence of five neherlab-* crawlers.
BDB-2467-glue-crawlers

Figure 9 – AWS Glue Crawlers

Execute the solution

  • The solution creates a scheduled AWS Glue workflow which runs at 10:00 AM UTC on day 1 of every month. A scheduled workflow can also be triggered on-demand. For the purpose of this post, we will execute the workflow on-demand using the following command from the AWS CLI. If the workflow is successfully started, the command returns the run ID. For instructions on how to run and monitor a workflow in Amazon Glue, refer to Running and monitoring a workflow in Amazon Glue.
aws glue start-workflow-run --name Covid_19
  • You can verify the status of a workflow run by execution the following command from the AWS CLI. Please use the run ID returned from the above command. A successfully executed Covid_19 workflow should return a value of 7 for SucceededActions  and 0 for FailedActions.
aws glue get-workflow-run --name Covid_19 --run-id <run_ID>
  • A sample output of the above command is provided below.
{
"Run": {
"Name": "Covid_19",
"WorkflowRunId": "wr_c8855e82ab42b2455b0e00cf3f12c81f957447abd55a573c087e717f54a4e8be",
"WorkflowRunProperties": {},
"StartedOn": "2022-09-20T22:13:40.500000-04:00",
"CompletedOn": "2022-09-20T22:21:39.545000-04:00",
"Status": "COMPLETED",
"Statistics": {
"TotalActions": 7,
"TimeoutActions": 0,
"FailedActions": 0,
"StoppedActions": 0,
"SucceededActions": 7,
"RunningActions": 0
}
}
}
  • (Optional) To verify the status of the workflow run using AWS Glue console, choose Workflows in the navigation pane, select the Covid_19 workflow, click on the History tab, select the latest row and click on View run details. A successfully completed workflow is marked in green check marks. Please refer to the Legend section in the below screenshot for additional statuses.

    BDB-2467-glue-workflow-success

    Figure 10 – AWS Glue Workflow successful run

Check the output

  • When the workflow is complete, navigate to the Athena console to check the successful creation and population of neherlab_denormalized table. You can run SQL queries against all 5 tables to check the data. A sample SQL query is provided below.
SELECT "country", "location", "date", "cases", "deaths", "ecdc-countries",
        "acute_care", "acute_care_per_100K", "critical_care", "critical_care_per_100K" 
FROM "AwsDataCatalog"."covid19db"."neherlab_denormalized"
limit 10;
BDB-2467-athena

Figure 10 – Amazon Athena

Clean up

To clean up the resources created in this post, delete the AWS CloudFormation stacks in the following order:

  • cdk-covid19-glue-stack
  • cdk-covid19-glue-stack-pipeline
  • CDKToolkit

Then delete all associated S3 buckets:

  • cdk-covid19-glue-stack-p-pipelineartifactsbucketa-*
  • cdk-*-assets-<AWS_ACCOUNT_ID>-<AWS_REGION>
  • covid19-glue-config-<AWS_ACCOUNT_ID>-<AWS_REGION>
  • neherlab-denormalized-dataset-<AWS_ACCOUNT_ID>-<AWS_REGION>

Conclusion

In this post, we demonstrated a step-by-step guide to define, test, provision, and manage changes to an AWS Glue based ETL solution using the AWS CDK. We used an AWS Glue example, which has all the components to build a complex ETL solution, and demonstrated how to integrate individual AWS Glue components into a frictionless CI/CD pipeline. We encourage you to use this post and associated code as the starting point to build your own CI/CD pipelines for AWS Glue based ETL solutions.


About the authors

Puneet Babbar is a Data Architect at AWS, specialized in big data and AI/ML. He is passionate about building products, in particular products that help customers get more out of their data. During his spare time, he loves to spend time with his family and engage in outdoor activities including hiking, running, and skating. Connect with him on LinkedIn.

Suvojit Dasgupta is a Sr. Lakehouse Architect at Amazon Web Services. He works with customers to design and build data solutions on AWS.

Justin Kuskowski is a Principal DevOps Consultant at Amazon Web Services. He works directly with AWS customers to provide guidance and technical assistance around improving their value stream, which ultimately reduces product time to market and leads to a better customer experience. Outside of work, Justin enjoys traveling the country to watch his two kids play soccer and spending time with his family and friends wake surfing on the lakes in Michigan.

New Hands-On Course for Business Analysts – Practical Decision Making using No-Code ML on AWS

Post Syndicated from Antje Barth original https://aws.amazon.com/blogs/aws/new-hands-on-course-for-business-analysts-practical-decision-making-using-no-code-ml-on-aws/

Artificial intelligence (AI) is all around us. AI sends certain emails to our spam folders. It powers autocorrect, which helps us fix typos when we text. And now we can use it to solve business problems.

In business, data-driven insights have become increasingly valuable. These insights are often discovered with the help of machine learning (ML), a subset of AI and the foundation of complex AI systems. And ML technology has come a long way. Today, you don’t need to be a data scientist or computer engineer to gain insights. With the help of no-code ML tools such as Amazon SageMaker Canvas, you can now achieve effective business outcomes using ML without writing a single line of code. You can better understand patterns, trends, and what’s likely to happen in the future. And that means making better business decisions!

Today, I’m happy to announce that AWS and Coursera are launching the new hands-on course Practical Decision Making using No-Code ML on AWS. This five-hour course is designed to demystify AI/ML and give anyone with a spreadsheet the ability to solve real-life business problems.

Practical Decision Making on Coursera

Course Highlights
Over the course of three lessons, you will learn how to address your business problem using ML, how to build and understand an ML model without any code, and how to use ML to extract value to make better decisions. Each lesson walks you through real-life business scenarios and hands-on exercises using Amazon SageMaker Canvas, a visual, no-code ML tool.

Lesson 1 – How To Address Your Business Problem Using ML
In the first lesson, you will learn how to address your business problem using ML without knowing data science. You will be able to describe the four stages of analytics and discuss the high-level concepts of AI/ML.

Practical Data Science - Prescriptive Analytics

This lesson will also introduce you to automated machine learning (AutoML) and how AutoML can help you generate insights based on common business use cases. You will then practice forming business questions around the most common machine learning problem types.

Practical Decision Making - Forming ML questions

For example, imagine you are a business analyst at a ticketing company. You manage ticket sales for large venues—concerts, sporting events, and so on. Let’s assume you want to predict cash flow. A question to solve with ML could be: “How can you better forecast ticket sales?” This is an example of time series forecasting. You will also explore numeric and category ML problems throughout the course. They will help you answer business questions such as “What’s the likely annual revenue for a customer?” and “Will this customer buy another ticket in the next three months?”.

Next, you will learn about the iterative process of asking questions for machine learning to make the questions more explicit and explore how to pick the highest value problems to work on.

Practical Decision Making - Value vs. Ease

The first lesson wraps up with a deep dive on how time influences your data across forecasting and nonforecasting business problems and how to set up your data for each ML problem type.

Lesson 2 – Build and Understand an ML Model Without Any Code
In the second lesson, you learn how to build and understand an ML model without any code using Amazon SageMaker Canvas. You will focus on a customer churn example with synthetically generated data from a cellular services company. The problem question is, “Which customers are most likely to cancel their service next month?”

Practical Decision Making - Customer Churn Example

You will learn how to import data and start exploring it. This lesson will explain how to select the right configuration, pick the target column, and show you how to prepare your data for ML.

SageMaker Canvas also recently introduced new visualizations for exploratory data analysis (EDA), including scatter plots, bar charts, and box plots. These visualizations help you analyze the relationships between features in your data sets and comprehend your data better.

Practical Decision Making - SageMaker Canvas Scatter Plot

After a final data validation, you can preview the model. This shows you right away how accurate the model might be and, on average, which features or columns have the greatest relative impact on model predictions. Once you are done preparing and validating the data, you can go ahead and build the model.

Practical Decision Making - Model Evaluation

Next, you will learn how to evaluate the performance of the model. You will be able to describe the difference between training data and test data splits and how they are used to derive the model’s accuracy score. The lesson also discusses additional performance metrics and how you can apply domain knowledge to decide if the model is performing well. Once you understand how to evaluate the performance metrics, you have the foundation for making better business decisions.

The second lesson wraps up with some common gotchas to watch out for and shows how to iterate on the model to keep improving performance. You will be able to describe the concept of data leakage as a result of memorization versus generalization and additional model flaws to avoid. You will also learn how to iterate on questions, included features, and sample sizes to keep increasing model performance.

Lesson 3 – Extract Value From ML
In the third lesson, you learn how to extract value from ML to make better decisions. You will be able to generate and read predictions, including predictions on a single row of a spreadsheet, called a single prediction, and predictions on the entire spreadsheet, called batch prediction. You will be able to understand what is impacting predictions and play with different scenarios.

Next, you will learn how to share insights and predictions with others. You will learn how to take visuals from the product, such as feature importance charts or scoring diagrams, and share the insights through presentations or business reports.

The third lesson wraps up with how to collaborate with the data science team or a team member with machine learning expertise. When you build your model using SageMaker Canvas, you can choose either a Quick build or a Standard build. The Quick build usually takes 2–15 minutes and limits the input dataset to a maximum of 50,000 rows. The Standard build usually takes 2–4 hours and generally has a higher accuracy. SageMaker Canvas makes it easy to share a standard build model. In the process, you can reveal the model’s behind-the-scenes complexity down to the code level.

Once you have the trained model open, you can click on the Share button. This creates a link that can be opened in SageMaker Studio, an integrated development environment used by data science teams.

Practical Decision Making - Share Model

In SageMaker Studio, you can see the transformations to the input data set and detailed information about scoring and artifacts, like the model object. You can also see the Python notebooks for data exploration and feature engineering.

Practical Decision Making - SageMaker Studio

Hands-On Exercises
This course includes seven hands-on labs to put your learning into practice. You will have the opportunity to use no-code ML with SageMaker Canvas to solve real-world challenges based on publicly available datasets.

The labs focus on different business problems across industries, including retail, financial services, manufacturing, healthcare, and life sciences, as well as transport and logistics.

You will have the opportunity to work on customer churn predictions, housing price predictions, sales forecasting, loan predictions, diabetic patient readmission prediction, machine failure predictions, and supply chain delivery on-time predictions.

Register Today
Practical Decision Making using No-Code ML on AWS is a five-hour course for business analysts and anyone who wants to learn how to solve real-life business problems using no-code ML.

Sign up for Practical Decision Making using No-Code ML on AWS today at Coursera!

— Antje

What we served up for the last Birthday Week before we’re a teenager

Post Syndicated from John Graham-Cumming original https://blog.cloudflare.com/what-we-served-up-for-the-last-birthday-week-before-were-a-teenager/

What we served up for the last Birthday Week before we're a teenager

What we served up for the last Birthday Week before we're a teenager

Almost a teen. With Cloudflare’s 12th birthday last Tuesday, we’re officially into our thirteenth year. And what a birthday we had!

36 announcements ranging from SIM cards to post quantum encryption via hardware keys and so much more. Here’s a review of everything we announced this week.

Monday

What In a sentence…
The First Zero Trust SIM We’re bringing Zero Trust security controls to the humble SIM card, rethinking how mobile device security is done, with the Cloudflare SIM: the world’s first Zero Trust SIM.
Securing the Internet of Things We’ve been defending customers from Internet of Things botnets for years now, and it’s time to turn the tides: we’re bringing the same security behind our Zero Trust platform to IoT.
Bringing Zero Trust to mobile network operators Helping bring the power of Cloudflare’s Zero Trust platform to mobile operators and their subscribers.

Tuesday

What In a sentence…
Workers Launchpad Leading venture capital firms to provide up to $1.25 BILLION to back startups built on Cloudflare Workers.
Startup Plan v2.0 Increasing the scope, eligibility and products we include under our Startup Plan, enabling more developers and startups to build the next big thing on top of Cloudflare.
workerd: the Open Source Workers runtime workerd, the JavaScript/Wasm runtime based on the same code that powers Cloudflare Workers. workerd is open source under the Apache License version 2.0.
Cloudflare Calls A new product that lets developers build real-time audio/video apps. Cloudflare Calls exposes a set of APIs to build video conferencing, screen sharing, and group calling apps on our network.
Cloudflare Queues Queues is a global message queuing service that allows applications to reliably send and receive messages using Cloudflare Workers. It offers at-least once message delivery, supports batching of messages, and charges no bandwidth egress fees.
What’s new with D1 Improving the developer experience of D1 with CLI support for backups, snapshots and local development.
WebRTC live streaming Cloudflare Stream now supports live video streaming over WebRTC, with sub-second latency, to unlimited concurrent viewers.
The future of Page Rules Our plan to replace Page Rules with four dedicated products, offering increased rules quota, more functionality, and better granularity.
Cache Rules Evolving rules-based caching on Cloudflare with more configurable Cache Rules.
Configuration Rules Configuration Rules enable new use-cases that previously were impossible without writing custom code in a Cloudflare Worker, including A/B testing configuration, enabling features for a set of file extensions and much more.
Origin Rules A new product which allows for overriding the host header, the Server Name Indication (SNI), destination port and DNS resolution of matching HTTP requests.
Dynamic URL redirects Users can redirect visitors to another webpage or website based upon hundreds of options such as the visitor’s country of origin or language, without having to write a single line of code.
Cloudflare named a Leader in WAF by Forrester Forrester has recognised Cloudflare as a Leader in The Forrester Wave™: Web Application Firewalls, Q3 2022 report.

Wednesday

What In a sentence…
Turnstile, a user-friendly, privacy-preserving alternative to CAPTCHA Turnstile is an invisible alternative to CAPTCHA. Anyone, anywhere on the Internet, who wants to replace CAPTCHA on their site will be able to call a simple API, without having to be a Cloudflare customer or sending traffic through the Cloudflare global network.
Magic Network Monitoring for everyone Magic Network Monitoring will be available to everyone, and now features a powerful analytics dashboard, self-serve configuration, and a step-by-step onboarding wizard.
Botnet Threat Feed for service providers The Botnet Threat Feed will give ISPs threat intelligence on their own IP addresses that have participated in HTTP DDoS attacks as observed from the Cloudflare network — allowing them to reduce their abuse-driven costs, and ultimately reduce the amount and force of DDoS attacks across the Internet.
Build privacy-preserving products with Privacy Edge Privacy Edge, including Code Auditability, Privacy Gateway, Privacy Proxy, and Cooperative Analytics, is a suite of products that make it easy for site owners and developers to build privacy into their products, by default.
Quick search in the dashboard Our first release of quick search for the Cloudflare dashboard, a beta version of our first ever cross-dashboard search tool to help you navigate our products and features.

Thursday

What In a sentence…
Making phishing defense seamless with Cloudflare Zero Trust and Yubico An exclusive program for Cloudflare customers that makes hardware keys more accessible and economical than ever. This program is made possible through a new collaboration with Yubico, the industry’s leading hardware security key vendor and provides Cloudflare customers with exclusive “Good for the Internet” pricing.
How Cloudflare implemented hardware keys to prevent phishing How Cloudflare uses hardware keys, built on FIDO2 and Webauthn, to become phish proof and more easily enforce least privilege access control.
Role Based Access Controls for every Cloudflare plan Role based access controls, and all of our additional roles, will be rolled out to users on every plan.
Email Link Isolation Bringing Browser Isolation to potentially unsafe links in email with Zero Trust and Area 1.
Unmetered Rate Limiting Today, we are announcing that Free, Pro and Business plans include Rate Limiting rules without extra charges, including an updated version that is built on the powerful ruleset engine and allows building rules like in Custom Rules.

Friday

What In a sentence…
Gateway + CASB When CASB, Cloudflare’s API-driven SaaS security scanning tool, discovers a problem, it’s now possible to easily create a corresponding Gateway policy in as few as three clicks.
Project A11Y How we upgraded Cloudflare’s dashboard to adhere to industry accessibility standards.
Bringing (free) Stream to Pro and Business plans Beginning December 1, 2022, if you have a Business or Pro subscription, you will receive a complimentary allocation of Cloudflare Stream, including up to 100 minutes of video content and deliver up to 10,000 minutes of video content each month at no additional cost.
Workers Analytics Engine public beta Workers Analytics Engine is a new way for developers to store and analyze time series analytics about anything using Cloudflare Workers, and it’s now in open beta!
Radar 2.0 On the second anniversary of Cloudflare Radar, we are launching Cloudflare Radar 2.0 in beta. It makes it easier to find insights and explore data, see more insights, and share them with others.
Cloudflare Radar Outage Center The new Cloudflare Radar Outage Center (CROC), launched today as part of Radar 2.0, is intended to be an archive of Internet outages around the world.
Radar Domain Rankings Radar Domain Rankings is a new dataset for exploring the most popular domains on the Internet. The dataset aims to identify the top most popular domains based on how people use the Internet globally, without tracking individuals’ Internet use.

One More Thing

We had so much over the week that we had to add just one more day, with a big focus on cryptography: not only how clients connect to our network, but also how Cloudflare connects to customer origins.

What In a sentence…
Bringing post quantum cryptography to Cloudflare customers As a beta service, all websites and APIs served through Cloudflare support post-quantum hybrid key agreement. This is on by default; no need for an opt-in. This means that if your browser/app supports it, the connection to our network is also secure against any future quantum computer.
Cloudflare Tunnel goes post quantum Cloudflare Tunnel gets a new option to use post-quantum connections.
Securing Origin Connectivity Cloudflare will automatically find the most secure connection possible to origin servers and use it automatically.

Next

And that’s it for Birthday Week 2022. But it’s not over for Cloudflare Innovation Weeks this year; stay tuned for a week of developer goodies coming soon.

Security updates for Monday

Post Syndicated from original https://lwn.net/Articles/910161/

Security updates have been issued by Debian (chromium, gdal, kernel, libdatetime-timezone-perl, libhttp-daemon-perl, lighttpd, mariadb-10.3, node-thenify, snakeyaml, tinyxml, and tzdata), Fedora (enlightenment, kitty, and thunderbird), Mageia (expat, firejail, libjpeg, nodejs, perl-HTTP-Daemon, python-mako, squid, and thunderbird), Scientific Linux (firefox and thunderbird), SUSE (buildah, connman, cosign, expat, ImageMagick, python36, python39, slurm, and webkit2gtk3), and Ubuntu (linux, linux-aws, linux-kvm, linux-lts-xenial and linux-gke-5.15).

Defending against future threats: Cloudflare goes post-quantum

Post Syndicated from Bas Westerbaan original https://blog.cloudflare.com/post-quantum-for-all/

Defending against future threats: Cloudflare goes post-quantum

Defending against future threats: Cloudflare goes post-quantum

There is an expiration date on the cryptography we use every day. It’s not easy to read, but somewhere between 15 or 40 years, a sufficiently powerful quantum computer is expected to be built that will be able to decrypt essentially any encrypted data on the Internet today.

Luckily, there is a solution: post-quantum (PQ) cryptography has been designed to be secure against the threat of quantum computers. Just three months ago, in July 2022, after a six-year worldwide competition, the US National Institute of Standards and Technology (NIST), known for AES and SHA2, announced which post-quantum cryptography they will standardize. NIST plans to publish the final standards in 2024, but we want to help drive early adoption of post-quantum cryptography.

Starting today, as a beta service, all websites and APIs served through Cloudflare support post-quantum hybrid key agreement. This is on by default1; no need for an opt-in. This means that if your browser/app supports it, the connection to our network is also secure against any future quantum computer.

We offer this post-quantum cryptography free of charge: we believe that post-quantum security should be the new baseline for the Internet.

Deploying post-quantum cryptography seems like a no-brainer with quantum computers on the horizon, but it’s not without risks. To start, this is new cryptography: even with years of scrutiny, it is not inconceivable that a catastrophic attack might still be discovered. That is why we are deploying hybrids: a combination of a tried and tested key agreement together with a new one that adds post-quantum security.

We are primarily worried about what might seem mere practicalities. Even though the protocols used to secure the Internet are designed to allow smooth transitions like this, in reality there is a lot of buggy code out there: trying to create a post-quantum secure connection might fail for many reasons — for example a middlebox being confused about the larger post-quantum keys and other reasons we have yet to observe because these post-quantum key agreements are brand new. It’s because of these issues that we feel it is important to deploy post-quantum cryptography early, so that together with browsers and other clients we can find and work around these issues.

In this blog post we will explain how TLS, the protocol used to secure the Internet, is designed to allow a smooth and secure migration of the cryptography it uses. Then we will discuss the technical details of the post-quantum cryptography we have deployed, and how, in practice, this migration might not be that smooth at all. We finish this blog post by explaining how you can build a better, post-quantum secure, Internet by helping us test this new generation of cryptography.

TLS: Transport Layer Security

When you’re browsing a website using a secure connection, whether that’s using HTTP/1.1 or QUIC, you are using the Transport Layer Security (TLS) protocol under the hood. There are two major versions of TLS in common use today: the new TLS 1.3 (~90%) and the older TLS 1.2 (~10%), which is on the decline.

TLS 1.3 is a huge improvement over TLS 1.2: it’s faster, more secure, simpler and more flexible in just the right places. This makes it easier to add post-quantum security to TLS 1.3 compared to 1.2. For the moment, we will leave it at that: we’ve only added post-quantum support to TLS 1.3.

So, what is TLS all about? The goal is to set up a connection between a browser and website such that

  • Confidentiality and integrity, no one can read along or tamper with the data undetected.
  • Authenticity you know you’re connected to the right website; not an imposter.

Building blocks: AEAD, key agreement and signatures

Three different types of cryptography are used in TLS to reach this goal.

  • Symmetric encryption, or more precisely Authenticated Encryption With Associated Data (AEAD), is the workhorse of cryptography: it’s used to ensure confidentiality and integrity. This is a straight-forward kind of encryption: there is a single key that is used to encrypt and decrypt the data. Without the right key you cannot decrypt the data and any tampering with the encrypted data results in an error while decrypting.

In TLS 1.3, ChaCha20-Poly1305 and AES128-GCM are in common use today.
What about quantum attacks? At first glance, it looks like we need to switch to 256-bit symmetric keys to defend against Grover’s algorithm. In practice, however, Grover’s algorithm doesn’t parallelize well, so the currently deployed AEADs will serve just fine.

So if we can agree on a shared key to use with symmetric encryption, we’re golden. But how to get to a shared key? You can’t just pick a key and send it to the server: anyone listening in would know the key as well. One might think it’s an impossible task, but this is where the magic of asymmetric cryptography helps out:

  • A key agreement, also called key exchange or key distribution, is a cryptographic protocol with which two parties can agree on a shared key without an eavesdropper being able to learn anything. Today the X25519 Elliptic Curve Diffie–Hellman protocol (ECDH) is the de facto standard key agreement used in TLS 1.3. The security of X25519 is based on the discrete logarithm problem for elliptic curves, which is vulnerable to quantum attacks, as it is easily solved by a cryptographically relevant quantum computer using Shor’s algorithm. The solution is to use a post-quantum key agreement, such as Kyber.

A key agreement only protects against a passive attacker. An active attacker, that can intercept and modify messages (MitM), can establish separate shared keys with both the server and the browser, re-encrypting all data passing through. To solve this problem, we need the final piece of cryptography.

  • With a digital signature algorithm, such as RSA or ECDSA, there are two keys: a public and a private key. Only with the private key, one can create a signature for a message. Anyone with the corresponding public key can check whether a signature is indeed valid for a given message. These digital signatures are at the heart of TLS certificates that are used to authenticate websites.
    Both RSA and ECDSA are vulnerable to quantum attacks. We haven’t replaced those with post-quantum signatures, yet. The reason is that authentication is less urgent: we only need to have them replaced by the time a sufficiently large quantum computer is built, whereas any data secured by a vulnerable key agreement today can be stored and decrypted in the future. Even though we have more time, deploying post-quantum authentication will be quite challenging.

So, how do these building blocks come together to create TLS?

High-level overview of TLS 1.3

A TLS connection starts with a handshake which is used to authenticate the server and derive a shared key. The browser (client) starts by sending a ClientHello message that contains a list of the AEADs, signature algorithms, and key agreement methods it supports. To remove a roundtrip, the client is allowed to make a guess of what the server supports and start the key agreement by sending one or more client keyshares. That guess might be correct (on the left in the diagram below) or the client has to retry (on the right).

Defending against future threats: Cloudflare goes post-quantum
Protocol flow for server-authenticated TLS 1.3 with a supported client keyshare on the left and a HelloRetryRequest on the right.

Key agreement

Before we explain the rest of this interaction, let’s dig into the key agreement: what is a keyshare? The way the key agreement for Kyber and X25519 work is different: the first is a Key Encapsulation Mechanism (KEM), while the latter is a Diffie–Hellman (DH) style agreement. The latter is more flexible, but for TLS it doesn’t make a difference.

Defending against future threats: Cloudflare goes post-quantum
The shape of a KEM and Diffie–Hellman key agreement in TLS-compatible handshake is the same.

In both cases the client sends a client keyshare to the server. From this client keyshare the server generates the shared key. The server then returns a server keyshare with which the client can also compute the shared key.

Going back to the TLS 1.3 flow: when the server receives the ClientHello message it picks an AEAD (cipher), signature algorithm and client keyshare that it supports. It replies with a ServerHello message that contains the chosen AEAD and the server keyshare for the selected key agreement. With the AEAD and shared key locked in, the server starts encrypting data (shown with blue boxes).

Authentication

Together with the AEAD and server keyshare, the server sends a signature, the handshake signature, on the transcript of the communication so far together with a certificate (chain) for the public key that it used to create the signature. This allows the client to authenticate the server: it checks whether it trusts the certificate authority (e.g. Let’s Encrypt) that certified the public key and whether the signature verifies for the messages it sent and received so far. This not only authenticates the server, but it also protects against downgrade attacks.

Downgrade protection

We cannot upgrade all clients and servers to post-quantum cryptography at once. Instead, there will be a transition period where only some clients and some servers support post-quantum cryptography. The key agreement negotiation in TLS 1.3 allows this: during the transition servers and clients will still support non post-quantum key agreements, and can fall back to it if necessary.

This flexibility is great, but also scary: if both client and server support post-quantum key agreement, we want to be sure that they also negotiate the post-quantum key agreement. This is the case in TLS 1.3, but it is not obvious: the keyshares, the chosen keyshare and the list of supported key agreements are all sent in plain text. Isn’t it possible for an attacker in the middle to remove the post-quantum key agreements? This is called a downgrade attack.

This is where the transcript comes in: the handshake signature is taken over all messages received and sent by the server so far. This includes the supported key agreements and the key agreement that was picked. If an attacker changes the list of supported key agreements that the client sends, then the server will not notice. However, the client checks the server’s handshake signature against the list of supported key agreements it has actually sent and thus will detect the mischief.

The downgrade attack problems are much more complicated for TLS 1.2, which is one of the reasons we’re hesitant to retrofit post-quantum security in TLS 1.2.

Wrapping up the handshake

The last part of the server’s response is “server finished”, a message authentication code (MAC) on the whole transcript so far. Most of the work has been done by the handshake signature, but in other operating modes of TLS without handshake signature, such as session resumption, it’s important.

With the chosen AEAD and server keyshare, the client can compute the shared key and decrypt and verify the certificate chain, handshake signature and handshake MAC. We did not mention it before, but the shared key is not used directly for encryption. Instead, for good measure, it’s mixed together with communication transcripts, to derive several specific keys for use during the handshake and the main connection afterwards.

To wrap up the handshake, the client sends its own handshake MAC, and can then proceed to send application-specific data encrypted with the keys derived during the handshake.

Hello! Retry Request?

What we just sketched is the desirable flow where the client sends a keyshare that is supported by the server. That might not be the case. If the server doesn’t accept any key agreements advertised by the client, then it will tell the client and abort the connection.

If there is a key agreement that both support, but for which the client did not send a keyshare, then the server will respond with a HelloRetryRequest (HRR) message requesting a keyshare of a specific key agreement that the client supports as shown on the diagram on the right. In turn, the client responds with a new ClientHello with the selected keyshare.

If there is a key agreement that both support, but for which the client did not send a keyshare, then the server will respond with a HelloRetryRequest (HRR) message requesting a keyshare of a specific key agreement that the client supports as shown on the diagram on the right. In turn, the client responds with a new ClientHello with the selected keyshare.

This is not the whole story: a server is also allowed to send a HelloRetryRequest to request a different key agreement that it prefers over those for which the client sent shares. For instance, a server can send a HelloRetryRequest to a post-quantum key agreement if the client supports it, but didn’t send a keyshare for it.

HelloRetryRequests are rare today. Almost every server supports the X25519 key-agreement and almost every client (98% today) sends a X25519 keyshare. Earlier P-256 was the de facto standard and for a long time many browsers would send both a P-256 and X25519 keyshare to prevent a HelloRetryRequest. As we will discuss later, we might not have the luxury to send two post-quantum keyshares.

That’s the theory

TLS 1.3 is designed to be flexible in the cryptography it uses without sacrificing security or performance, which is convenient for our migration to post-quantum cryptography. That is the theory, but there are some serious issues in practice — we’ll go into detail later on. But first, let’s check out the post-quantum key agreements we’ve deployed.

What we deployed

Today we have enabled support for the X25519Kyber512Draft00 and X25519Kyber768Draft00 key agreements using TLS identifiers 0xfe30 and 0xfe31 respectively. These are exactly the same key agreements we enabled on a limited number of zones this July.

These two key agreements are a combination, a hybrid, of the classical X25519 and the new post-quantum Kyber512 and Kyber768 respectively and in that order. That means that even if Kyber turns out to be insecure, the connection remains as secure as X25519.

Kyber, for now, is the only key agreement that NIST has selected for standardization. Kyber is very light on the CPU: it is faster than X25519 which is already known for its speed. On the other hand, its keyshares are much bigger:

Size keyshares(in bytes) Ops/sec (higher is better)
Algorithm PQ Client Server Client Server
Kyber512 800 768 50,000 100,000
Kyber768 1,184 1,088 31,000 70,000
X25519 32 32 17,000 17,000

Size and CPU performance compared between X25519 and Kyber. Performance varies considerably by hardware platform and implementation constraints and should be taken as a rough indication only.

Kyber is expected to change in minor, but backwards incompatible ways, before final standardization by NIST in 2024. Also, the integration with TLS, including the choice and details of the hybrid key agreement, are not yet finalized by the TLS working group. Once they are, we will adopt them promptly.

Because of this, we will not support the preliminary key agreements announced today for the long term; they’re provided as a beta service. We will post updates on our deployment on pq.cloudflareresearch.com and announce it on the IETF PQC mailing list.

Now that we know how TLS negotiation works in theory, and which key agreements we’re adding, how could it fail?

Where things might break in practice

Protocol ossification

Protocols are often designed with flexibility in mind, but if that flexibility is not exercised in practice, it’s often lost. This is called protocol ossification. The roll-out of TLS 1.3 was difficult because of several instances of ossification. One poignant example is TLS’ version negotiation: there is a version field in the ClientHello message that indicates the latest version supported by the client. A new version was assigned to TLS 1.3, but in testing it turned out that many servers would not fallback properly to TLS 1.2, but crash the connection instead. How do we deal with ossification?

Workaround

Today, TLS 1.3 masquerades itself as TLS 1.2 down to including many legacy fields in the ClientHello. The actual version negotiation is moved into a new extension to the message. A TLS 1.2 server will ignore the new extension and ignorantly continue with TLS 1.2, while a TLS 1.3 server picks up on the extension and continues with TLS 1.3 proper.

Protocol grease

How do we prevent ossification? Having learnt from this experience, browsers will regularly advertise dummy versions in this new version field, so that misbehaving servers are caught early on. This is not only done for the new version field, but in many other places in the TLS handshake, and presciently also for the key agreement identifiers. Today, 40% of browsers send two client keyshares: one X25519 and another a bogus 1-byte keyshare to keep key agreement flexibility.

This behavior is standardized in RFC 8701: Generate Random Extensions And Sustain Extensibility (GREASE) and we call it protocol greasing, as in “greasing the joints” from Adam Langley’s metaphor of protocols having rusty joints in need of oil.

This keyshare grease helps, but it is not perfect, because it is the size of the keyshare that in this case causes the most concern.

Fragmented ClientHello

Post-quantum keyshares are big. The two Kyber hybrids are 832 and 1,216 bytes. Compared to that, X25519 is tiny with only 32 bytes. It is not unlikely that some implementations will fail when seeing such large keyshares.

Our biggest concern is with the larger Kyber768 based keyshare. A ClientHello with the smaller 832 byte Kyber512-based keyshare will just barely fit in a typical network packet. On the other hand, the larger 1,216 byte Kyber768-keyshare will typically fragment the ClientHello into two packets.

Assembling packets together isn’t free: it requires you to keep track of the partial messages around. Usually this is done transparently by the operating system’s TCP stack, but optimized middleboxes and load balancers that look at each packet separately, have to (and might not) keep track of the connections themselves.

QUIC
The situation for HTTP/3, which is built on QUIC, is particularly interesting. Instead of a simple port number chosen by the client (as in TCP), a QUIC packet from the client contains a connection ID that is chosen by the server. Think of it as “your reference” and “our reference” in snailmail. This allows a QUIC load-balancer to encode the particular machine handling the connection into the connection ID.

When opening a connection, the QUIC client doesn’t know which connection ID the server would like and sends a random one instead. If the client needs multiple initial packets, such as with a big ClientHello, then the client will use the same random connection ID. Even though multiple initial packets are allowed by the QUIC standard, a QUIC load balancer might not expect this, and won’t be able to refer to an underlying TCP connection.

Performance

Aside from these hard failures, soft failures, such as performance degradation are also of concern: if it’s too slow to load, a website might as well have been broken to begin with.

Back in 2019 in a joint experiment with Google, we deployed two post-quantum key agreements: CECPQ2, based on NTRU-HRSS, and CECPQ2b, based on SIKE. NTRU-HRSS is very similar to Kyber: it’s a bit larger and slower. Results from 2019 are very promising: X25519+NTRU-HRSS (orange line) is hard to distinguish from X25519 on its own (blue line).

Defending against future threats: Cloudflare goes post-quantum

We will continue to keep a close eye on performance, especially on the tail performance: we want a smooth transition for everyone, from the fastest to the slowest clients on the Internet.

How to help out

The Internet is a very heterogeneous system. To find all issues, we need sufficient numbers of diverse testers. We are working with browsers to add support for these key agreements, but there may not be one of these browsers in every network.

So, to help the Internet out, try and switch a small part of your traffic to Cloudflare domains to use these new key agreement methods. We have open-sourced forks for BoringSSL, Go and quic-go. For BoringSSL and Go, check out the sample code here. If you have any issues, please let us know at [email protected]. We will be discussing any issues and workarounds at the IETF TLS working group.

Outlook

The transition to a post-quantum secure Internet is urgent, but not without challenges. Today we have deployed a preliminary post-quantum key agreement on all our servers — a sizable portion of the Internet — so that we can all start testing the big migration today. We hope that come 2024, when NIST puts a bow on Kyber, we will all have laid the groundwork for a smooth transition to a Post-Quantum Internet.

…..
1We only support these post-quantum key agreements in protocols based on TLS 1.3 including HTTP/3. There is one exception: for the moment we disable these hybrid key exchanges for websites in FIPS-mode.

Automatic (secure) transmission: taking the pain out of origin connection security

Post Syndicated from Alex Krivit original https://blog.cloudflare.com/securing-origin-connectivity/

Automatic (secure) transmission: taking the pain out of origin connection security

Automatic (secure) transmission: taking the pain out of origin connection security

In 2014, Cloudflare set out to encrypt the Internet by introducing Universal SSL. It made getting an SSL/TLS certificate free and easy at a time when doing so was neither free, nor easy. Overnight millions of websites had a secure connection between the user’s browser and Cloudflare.

But getting the connection encrypted from Cloudflare to the customer’s origin server was more complex. Since Cloudflare and all browsers supported SSL/TLS, the connection between the browser and Cloudflare could be instantly secured. But back in 2014 configuring an origin server with an SSL/TLS certificate was complex, expensive, and sometimes not even possible.

And so we relied on users to configure the best security level for their origin server. Later we added a service that detects and recommends the highest level of security for the connection between Cloudflare and the origin server. We also introduced free origin server certificates for customers who didn’t want to get a certificate elsewhere.

Today, we’re going even further. Cloudflare will shortly find the most secure connection possible to our customers’ origin servers and use it, automatically. Doing this correctly, at scale, while not breaking a customer’s service is very complicated. This blog post explains how we are automatically achieving that highest level of security possible for those customers who don’t want to spend time configuring their SSL/TLS set up manually.

Why configuring origin SSL automatically is so hard

When we announced Universal SSL, we knew the backend security of the connection between Cloudflare and the origin was a different and harder problem to solve.

In order to configure the tightest security, customers had to procure a certificate from a third party and upload it to their origin. Then they had to indicate to Cloudflare that we should use this certificate to verify the identity of the server while also indicating the connection security capabilities of their origin. This could be an expensive and tedious process. To help alleviate this high set up cost, in 2015 Cloudflare launched a beta Origin CA service in which we provided free limited-function certificates to customer origin servers. We also provided guidance on how to correctly configure and upload the certificates, so that secure connections between Cloudflare and a customer’s origin could be established quickly and easily.

What we discovered though, is that while this service was useful to customers, it still required a lot of configuration. We didn’t see the change we did with Universal SSL because customers still had to fight with their origins in order to upload certificates and test to make sure that they had configured everything correctly. And when you throw things like load balancers into the mix or servers mapped to different subdomains, handling server-side SSL/TLS gets even more complicated.

Around the same time as that announcement, Let’s Encrypt and other services began offering certificates as a public CA for free, making TLS easier and paving the way for widespread adoption. Let’s Encrypt and Cloudflare had come to the same conclusion: by offering certificates for free, simplifying server configuration for the user, and working to streamline certificate renewal, they could make a tangible impact on the overall security of the web.

Automatic (secure) transmission: taking the pain out of origin connection security

The announcements of free and easy to configure certificates correlated with an increase in attention on origin-facing security. Cloudflare customers began requesting more documentation to configure origin-facing certificates and SSL/TLS communication that were performant and intuitive. In response, in 2016 we announced the GA of origin certificate authority to provide cheap and easy origin certificates along with guidance on how to best configure backend security for any website.

The increased customer demand and attention helped pave the way for additional features that focused on backend security on Cloudflare. For example, authenticated origin pull ensures that only HTTPS requests from Cloudflare will receive a response from your origin, preventing an origin response from requests outside of Cloudflare. Another option, Cloudflare Tunnel can be set up to run on the origin servers, proactively establishing secure and private tunnels to the nearest Cloudflare data center. This configuration allows customers to completely lock down their origin servers to only receive requests routed through our network. For customers unable to lock down their origins using this method, we still encourage adopting the strongest possible security when configuring how Cloudflare should connect to an origin server.

Cloudflare currently offers five options for SSL/TLS configurability that we use when communicating with origins:

  • In Off mode, as you might expect, traffic from browsers to Cloudflare and from Cloudflare to origins are not encrypted and will use plain text HTTP.
  • In Flexible mode, traffic from browsers to Cloudflare can be encrypted via HTTPS, but traffic from Cloudflare to the site’s origin server is not. This is a common selection for origins that cannot support TLS, even though we recommend upgrading this origin configuration wherever possible. A guide for upgrading can be found here.
  • In Full mode, Cloudflare follows whatever is happening with the browser request and uses that same option to connect to the origin. For example, if the browser uses HTTP to connect to Cloudflare, we’ll establish a connection with the origin over HTTP. If the browser uses HTTPS, we’ll use HTTPS to communicate with the origin; however we will not validate the certificate on the origin to prove the identity and trustworthiness of the server.
  • In Full (strict) mode, traffic between Cloudflare follows the same pattern as in Full mode, however Full (strict) mode adds validation of the origin server’s certificate. The origin certificate can either be issued by a public CA like Let’s Encrypt or by Cloudflare Origin CA.
  • In Strict mode, traffic from the browser to Cloudflare that is HTTP or HTTPS will always be connected to the origin over HTTPS with a validation of the origin server’s certificate.
Automatic (secure) transmission: taking the pain out of origin connection security

What we have found in a lot of cases is that when customers initially signed up for Cloudflare, the origin they were using could not support the most advanced versions of encryption, resulting in origin-facing communication using unencrypted HTTP. These default values persisted over time, even though the origin has become more capable. We think the time is ripe to re-evaluate the entire concept of default SSL/TLS levels.

That’s why we will reduce the configuration burden for origin-facing security by automatically managing this on behalf of our customers. Cloudflare will provide a zero configuration option for how we will communicate with origins: we will simply look at an origin and use the most-secure option available to communicate with it.

Re-evaluating default SSL/TLS modes is only the beginning. Not only will we automatically upgrade sites to their best security setting, we will also open up all SSL/TLS modes to all plan levels. Historically, Strict mode was reserved for enterprise customers only. This was because we released this mode in 2014 when few people had origins that were able to communicate over SSL/TLS, and we were nervous about customers breaking their configurations. But this is 2022, and we think that Strict mode should be available to anyone who wants to use it. So we will be opening it up to everyone with the launch of the automatic upgrades.

How will automatic upgrading work?

To upgrade the origin-facing security of websites, we first need to determine the highest security level the origin can use. To make this determination, we will use the SSL/TLS Recommender tool that we released a year ago.

The recommender performs a series of requests from Cloudflare to the customer’s origin(s) to determine if the backend communication can be upgraded beyond what is currently configured. The recommender accomplishes this by:

  • Crawling the website to collect links on different pages of the site. For websites with large numbers of links, the recommender will only examine a subset. Similarly, for sites where the crawl turns up an insufficient number of links, we augment our results with a sample of links from recent visitors requests to the zone. All of this is to get a representative sample to where requests are going in order to know how responses are served from the origin.
  • The crawler uses the user agent Cloudflare-SSLDetector and has been added to Cloudflare’s list of known “good bots”.
  • Next, the recommender downloads the content of each link over both HTTP and HTTPS. The recommender makes only idempotent GET requests when scanning origin servers to avoid modifying server resource state.
  • Following this, the recommender runs a content similarity algorithm to determine if the content collected over HTTP and HTTPS matches.
  • If the content that is downloaded over HTTP matches the content downloaded over HTTPS, then it’s known that we can upgrade the security of the website without negative consequences.
  • If the website is already configured to Full mode, we will perform a certificate validation (without the additional need for crawling the site) to determine whether it can be updated to Full (strict) mode or higher.

If it can be determined that the customer’s origin is able to be upgraded without breaking, we will upgrade the origin-facing security automatically.

But that’s not all. Not only are we removing the configuration burden for services on Cloudflare, but we’re also providing more precise security settings by moving from per-zone SSL/TLS settings to per-origin SSL/TLS settings.

The current implementation of the backend SSL/TLS service is related to an entire website, which works well for those with a single origin. For those that have more complex setups however, this can mean that origin-facing security is defined by the lowest capable origin serving a part of the traffic for that service. For example, if a website uses img.example.com and api.example.com, and these subdomains are served by different origins that have different security capabilities, we would not want to limit the SSL/TLS capabilities of both subdomains to the least secure origin. By using our new service, we will be able to set per-origin security more precisely to allow us to maximize the security posture of each origin.

The goal of this is to maximize the origin-facing security of everything on Cloudflare. However, if any origin that we attempt to scan blocks the SSL recommender, has a non-functional origin, or opts-out of this service, we will not complete the scans and will not be able to upgrade security. Details on how to opt-out will be provided via email announcements soon.

Opting out

There are a number of reasons why someone might want to configure a lower-than-optimal security setting for their website. One common reason customers provide is a fear that having higher security settings will negatively impact the performance of their site. Others may want to set a suboptimal security setting for testing purposes or to debug some behavior. Whatever the reason, we will provide the tools needed to continue to configure the SSL/TLS mode you want, even if that’s different from what we think is the best.

When is this going to happen?

We will begin to roll this change out before the end of the year. If you read this and want to make sure you’re at the highest level of backend security already, we recommend Full (strict) or Strict mode. If you prefer to wait for us to automatically upgrade your origin security for you, please keep your eyes peeled to your inbox for the date we will begin rolling out this change for your group.

At Cloudflare, we believe that the Internet needs to be secure and private. If you’d like to help us achieve that, we’re hiring across the engineering organization.

Introducing post-quantum Cloudflare Tunnel

Post Syndicated from Bas Westerbaan original https://blog.cloudflare.com/post-quantum-tunnel/

Introducing post-quantum Cloudflare Tunnel

Introducing post-quantum Cloudflare Tunnel

Undoubtedly, one of the big themes in IT for the next decade will be the migration to post-quantum cryptography. From tech giants to small businesses: we will all have to make sure our hardware and software is updated so that our data is protected against the arrival of quantum computers. It seems far away, but it’s not a problem for later: any encrypted data captured today (not protected by post-quantum cryptography) can be broken by a sufficiently powerful quantum computer in the future.

Luckily we’re almost there: after a tremendous worldwide effort by the cryptographic community, we know what will be the gold standard of post-quantum cryptography for the next decades. Release date: somewhere in 2024. Hopefully, for most, the transition will be a simple software update then, but it will not be that simple for everyone: not all software is maintained, and it could well be that hardware needs an upgrade as well. Taking a step back, many companies don’t even have a full list of all software running on their network.

For Cloudflare Tunnel customers, this migration will be much simpler: introducing Post-Quantum Cloudflare Tunnel. In this blog post, first we give an overview of how Cloudflare Tunnel works and explain how it can help you with your post-quantum migration. Then we’ll explain how to get started and finish with the nitty-gritty technical details.

Cloudflare Tunnel

With Cloudflare Tunnel you can securely expose a server sitting within an internal network to the Internet by running the cloudflared service next to it. For instance, after having installed cloudflared on your internal network, you can expose your on-prem webapp on the Internet under, say example.com, so that remote workers can access it from anywhere,

Introducing post-quantum Cloudflare Tunnel
Life of a Cloudflare Tunnel request.

How does it work? cloudflared creates long-running connections to two nearby Cloudflare data centers, for instance San Francisco (connection 3) and one other. When your employee visits your domain, they connect (1) to a Cloudflare server close to them, say in Frankfurt. That server knows that this is a Cloudflare Tunnel and that your cloudflared has a connection to a server in San Francisco, and thus it relays (2) the request to it. In turn, via the reverse connection, the request ends up at cloudflared, which passes it (4) to the webapp via your internal network.

In essence, Cloudflare Tunnel is a simple but convenient tool, but the magic is in what you can do on top with it: you get Cloudflare’s DDoS protection for free; fine-grained access control with Cloudflare Access (even if the application didn’t support it) and request logs just to name a few. And let’s not forget the matter at hand:

Post-quantum tunnels

Our goal is to make it easy for everyone to have a fully post-quantum secure connection from users to origin. For this, Post-Quantum Cloudflare Tunnel is a powerful tool, because with it, your users can benefit from a post-quantum secure connection without upgrading your application (connection 4 in the diagram).

Today, we make two important steps towards this goal: cloudflared 2022.9.1 adds the --post-quantum flag, that when given, makes the connection from cloudflared to our network (connection 3) post-quantum secure.

Also today, we have announced support for post-quantum browser connections (connection 1).

We aren’t there yet: browsers (and other HTTP clients) do not support the post-quantum security offered by our network, yet, and we still have to make the connections between our data centers (connection 2) post-quantum secure.

An attacker only needs to have access to one vulnerable connection, but attackers don’t have access everywhere: with every connection we make post-quantum secure, we remove one opportunity for compromise.

We are eager to make post-quantum tunnels the default, but for now it is a beta feature. The reason is that the cryptography used and its integration into the network protocol are not yet final. Making post-quantum the default now, would require users to update cloudflared more often than we can reasonably expect them to.

Getting started

Are frequent updates to cloudflared not a problem for you? Then please do give post-quantum Cloudflare Tunnel a try. Make sure you’re on at least 2022.9.1 and simply run cloudflared with the --post-quantum flag:

$ cloudflared tunnel run --post-quantum tunnel-name
2022-09-23T11:44:42Z INF Starting tunnel tunnelID=[...]
2022-09-23T11:44:42Z INF Version 2022.9.1
2022-09-23T11:44:42Z INF GOOS: darwin, GOVersion: go1.19.1, GoArch: amd64
2022-09-23T11:44:42Z INF Settings: map[post-quantum:true pq:true]
2022-09-23T11:44:42Z INF Generated Connector ID: [...]
2022-09-23T11:44:42Z INF cloudflared will not automatically update if installed by a package manager.
2022-09-23T11:44:42Z INF Initial protocol quic
2022-09-23T11:44:42Z INF Using experimental hybrid post-quantum key agreement X25519Kyber768Draft00
2022-09-23T11:44:42Z INF Starting metrics server on 127.0.0.1:53533/metrics
2022-09-23T11:44:42Z INF Connection [...] registered connIndex=0 ip=[...] location=AMS
2022-09-23T11:44:43Z INF Connection [...] registered connIndex=1 ip=[...] location=AMS
2022-09-23T11:44:44Z INF Connection [...] registered connIndex=2 ip=[...] location=AMS
2022-09-23T11:44:45Z INF Connection [...] registered connIndex=3 ip=[...] location=AMS

If you run cloudflared as a service, you can turn on post-quantum by adding post-quantum: true to the tunnel configuration file. Conveniently, the cloudflared service will automatically update itself if not installed by a package manager.

If, for some reason, creating a post-quantum tunnel fails, you’ll see an error message like

2022-09-22T17:30:39Z INF Starting tunnel tunnelID=[...]
2022-09-22T17:30:39Z INF Version 2022.9.1
2022-09-22T17:30:39Z INF GOOS: darwin, GOVersion: go1.19.1, GoArch: amd64
2022-09-22T17:30:39Z INF Settings: map[post-quantum:true pq:true]
2022-09-22T17:30:39Z INF Generated Connector ID: [...]
2022-09-22T17:30:39Z INF cloudflared will not automatically update if installed by a package manager.
2022-09-22T17:30:39Z INF Initial protocol quic
2022-09-22T17:30:39Z INF Using experimental hybrid post-quantum key agreement X25519Kyber512Draft00
2022-09-22T17:30:39Z INF Starting metrics server on 127.0.0.1:55889/metrics
2022-09-22T17:30:39Z INF 

===================================================================================
You are hitting an error while using the experimental post-quantum tunnels feature.

Please check:

   https://pqtunnels.cloudflareresearch.com

for known problems.
===================================================================================


2022-09-22T17:30:39Z ERR Failed to create new quic connection error="failed to dial to edge with quic: CRYPTO_ERROR (0x128): tls: handshake failure" connIndex=0 ip=[...]

When the post-quantum flag is given, cloudflared will not fall back to a non post-quantum connection.

What to look for

The setup phase is the crucial part: once established, the tunnel is the same as a normal tunnel. That means that performance and reliability should be identical once the tunnel is established.

The post-quantum cryptography we use is very fast, but requires roughly a kilobyte of extra data to be exchanged during the handshake. The difference will be hard to notice in practice.

Our biggest concern is that some network equipment/middleboxes might be confused by the bigger handshake. If the post-quantum Cloudflare Tunnel isn’t working for you, we’d love to hear about it. Contact us at [email protected] and tell us which middleboxes or ISP you’re using.

Under the hood

When the --post-quantum flag is given, cloudflared restricts itself to the QUIC transport for the tunnel connection to our network and will only allow the post-quantum hybrid key exchanges X25519Kyber512Draft00 and X25519Kyber768Draft00 with TLS identifiers 0xfe30 and 0xfe31 respectively. These are hybrid key exchanges between the classical X25519 and the post-quantum secure Kyber. Thus, on the off-chance that Kyber turns out to be insecure, we can still rely on the non-post quantum security of X25519. These are the same key exchanges supported on our network.

cloudflared randomly picks one of these two key exchanges. The reason is that the latter usually requires two initial packets for the TLS ClientHello whereas the former only requires one. That allows us to test whether a fragmented ClientHello causes trouble.

When cloudflared fails to set up the post-quantum connection, it will report the attempted key exchange, cloudflared version and error to pqtunnels.cloudflareresearch.com so that we have visibility into network issues. Have a look at that page for updates on our post-quantum tunnel deployment.

The control connection and authentication of the tunnel between cloudflared and our network are not post-quantum secure yet. This is less urgent than the store-now-decrypt-later issue of the data on the tunnel itself.

We have open-sourced support for these post-quantum QUIC key exchanges in Go.

Outlook

In the coming decade the industry will roll out post-quantum data protection. Some cases will be as simple as a software update and others will be much more difficult. Post-Quantum Cloudflare Tunnel will secure the connection between Cloudflare’s network and your origin in a simple and user-friendly way — an important step towards the Post-Quantum Internet, so that everyone may continue to enjoy a private and secure Internet.

Detecting Deepfake Audio by Modeling the Human Acoustic Tract

Post Syndicated from Bruce Schneier original https://www.schneier.com/blog/archives/2022/10/detecting-deepfake-audio-by-modeling-the-human-acoustic-tract.html

This is interesting research:

In this paper, we develop a new mechanism for detecting audio deepfakes using techniques from the field of articulatory phonetics. Specifically, we apply fluid dynamics to estimate the arrangement of the human vocal tract during speech generation and show that deepfakes often model impossible or highly-unlikely anatomical arrangements. When parameterized to achieve 99.9% precision, our detection mechanism achieves a recall of 99.5%, correctly identifying all but one deepfake sample in our dataset.

From an article by two of the researchers:

The first step in differentiating speech produced by humans from speech generated by deepfakes is understanding how to acoustically model the vocal tract. Luckily scientists have techniques to estimate what someone—or some being such as a dinosaur—would sound like based on anatomical measurements of its vocal tract.

We did the reverse. By inverting many of these same techniques, we were able to extract an approximation of a speaker’s vocal tract during a segment of speech. This allowed us to effectively peer into the anatomy of the speaker who created the audio sample.

From here, we hypothesized that deepfake audio samples would fail to be constrained by the same anatomical limitations humans have. In other words, the analysis of deepfaked audio samples simulated vocal tract shapes that do not exist in people.

Our testing results not only confirmed our hypothesis but revealed something interesting. When extracting vocal tract estimations from deepfake audio, we found that the estimations were often comically incorrect. For instance, it was common for deepfake audio to result in vocal tracts with the same relative diameter and consistency as a drinking straw, in contrast to human vocal tracts, which are much wider and more variable in shape.

This is, of course, not the last word. Deepfake generators will figure out how to use these techniques to create harder-to-detect fake voices. And the deepfake detectors will figure out another, better, detection technique. And the arms race will continue.

Slashdot thread.

The collective thoughts of the interwebz