Родителска среща в Лиляната (Патриах Евтимий Пловдив) – ужасът за трезвомислещия родител – ЧАСТ 2

Post Syndicated from VassilKendov original http://kendov.com/roditelska-sreshta-lilianata-plovdiv/

Родителска среща в Лиляната (Патриах Евтимий Пловдив)  – ужасът за трезвомислещия родител – ЧАСТ 2

Преди 3 седмици бившата ни вече класна г-жа Ранджева, решава да направи родителска среща обявена като свързана с дисциплината. На срещата задължително трябваше да присъстват и децата.
Както пише в детските книги – Речено, сторено!
Съпругата ми ме праща като посланик, понеже тази родителска среща е ни в клин, ни в ръкав. Влизам и какво да видя…
След кратка анотация, че дисциплината по български и математика е отчайваща в класа и има деца, които рушат нормалния идеологично-възпитателен процес, следва разпит на свидетел. Ама такъв какъвто и съпругата ми адв. Кендова не може да направи.
Това се случва пред всички
г-жа Ранджева (класната) пита

– Ти Иване, кажи сега пред всички тука, защо говориш в час по математика?
– Ама аз госпожо, защото ме разсeйват и…
– И като те разсейват ти не можеш ли да си замълчиш? Защо трябва непременно да говориш? Кажи пред всички? – прекъсва го г-жа Ранджева.
момчето естeствено мълчи, но г-жа Ранджева продължава.
– Не знаеш така ли? Да видим Георги защо се върти в час по български. Кажи Георги пред всички, защо се въртиш?
– Ами аз госпожо защото си изпуснах химикала…
– И всеки час ли си го изпускаш този химикал? Кажи пред всички сега… И ти ли не знаеш? Добре тогава Драган да каже…
г-жа Ранджева продължи в този дух с още 5-6 дечица, а някои дори се насълзиха

За актуални финансови новини можете да използвате Telegram канала Kendov.com

Не знам как съм стискал зъби, но успях да си замълча. В главата ми се наби само репликата „Кажи пред всички!”. Казах си, че вече не мога да спася реномето на класната, дори и да искам. Не знам оттук нататък децата как изобщо биха възприели нещо от тази учителка. Но най-тъпото предстоеше. И това бяха мерките, които да се вземат за поправяне на дисциплината. Децата излязоха и останахме ние – незнаещите и глупави родители.
Естествено не всички бяха глупави. Имаше един баща на момиченце пред мен, който излезе със становище, че цитирам:

„Трябва да се наказват децата, ама така да се наказват, че да ги заболи.”

Не разбрах какво има предвид, но пак си замълчах. Така или иначе аз нямах намерение да наказвам, а да мотивирам детето си. Вече беше явно, че в училището няма да го мотивират.

Мерките

Започна една надпревара за мерки и се стигна до извода, че г-жа Ранджева е добре да предложи такива. И те бяха 1. Да се канят в часовете по български и математика директорката или зам. Директорката и 2. Да присъстват в часовете родители, които са свободни в момента и когато имат време.

WTF? Само аз ли си спомням че на откритите уроци мълчахме като партизани на разпит и после всичко си вървеше по старо му? Верно ли това е педагогическия подход за справяне с дисциплината?
Тук не издържах и взех думата.

– Добре де, само по български и математика ли е лоша дисциплината?
– Предимно. – отговори г-жа Ранджева.
– Добре де, а в другите класове така ли е? Има ли майки които са разпитвали в другите класове?
Намериха се разпитали майки.
– И в другите класове има проблеми, но не са чак такива. – отговориха те.
– Е не е ли тогава логично да обсъдим дали пък проблемът може да е в преподавателките? – попитах аз, знаейки че преподавателката по български е 23 годишна, а за математичката вече писах в ЧАСТ 1.

И тук обществото се раздели. Половината родители ме анатемосаха, една част си замълчаха, но имаше и неколцина които изразиха съгласие с мен и попитаха – А защо ги няма учителките по математика и български на тази родителска среща да си кажат какво точно им пречи?

В този момента г-жа Ранджева ми обяви:
– Като не Ви харесва тук. Ходете в друго училище!
Тук не си замълчах вече. Нямаше как при положение, че от моите данъци и плащат заплатата, да ми държи такъв тон. Даже си излезе от стаята за да не ме слуша. Явно усети, че е сгазила лука.

Общо взето оттук нататък срещата приключи, а у мен останаха въпросите.

– Нормално ли е на децата да се прави такъв разпит? Това педагогическо ли е?
– Защо учителките по математика и български ги няма?
– Какво очакват да се промени с присъствието на директорката или родител? Това за всеки час ли ще е или е просто отбиване на номера?

В крана сметка 3 седмици по-късно, когато детето ми вече е в друго училище чувам, че щели да правят родителска среща за цялото училище свързана с дисциплината. Тази седмица ще е. И отново въпроси:
– Ама нали в другите класове беше по-добра дисциплината?
– Още ли твърдим, че няма проблем с учителския колектив и начина на преподаване?
– Това някаква превантивна мярка на директорката ли е, към сигнала който готвя към инспектората?

Прочетете също
Училище Патриарх Евтимий – Пловдив (Голямата Лиляна) ЧАСТ 1 – МАТЕМАТИЧКАТА КОЛЕВА

Хубавото е, че вече не ме касае отговорът на тези въпроси. При срещата ми с директорката и тя не можа да ми отговори, та се чудя оттук нататък какъв родител трябва да си за да запишеш детето си в 5 клас в Лиляната при Ранджева. Ами че на нея само наказания и санкции са и в главата.
Проверих и къде е сформиран този начин на мислене. В Тракийския университет в Стара Загора е формиран – специалност география и икономика.
Оказа се, че ми била колежка жената. Ако просто бях си поговорил с нея за начина на формиране на лихвата при ипотечните кредити или мерките за спасяването на Credit Suisse, сигурно щяхме да намерим общ език, колеги сме все пак.

С две думи педагогическите похвати ме изумиха. Целия свят е виновен, само не и учителките в Лиляната (Патриарх Евтимий Пловдив).
Докато не се признае като проблем педагогическия похват на учителите, то дисциплината никога няма да е на ниво. И за това основна роля има директорката. Но за срещите си с нея ще пиша друг път. До тогава ще се забавляваме с клюкини за административните хитринки с които се прикрива некомпетентността на някои от учителите.

П.П – Никога не записвайте детето си в обикновена паралелка в Лиляната. Тук слагат „Б” отбора на учителите. Или по-скоро „Я” отбора. За другите, специализирани паралелки съм чувал и добри неща, но там са други учителските колективи.

The post Родителска среща в Лиляната (Патриах Евтимий Пловдив) – ужасът за трезвомислещия родител – ЧАСТ 2 appeared first on Kendov.com.

Metasploit Weekly Wrap-Up

Post Syndicated from Grant Willcox original https://blog.rapid7.com/2023/03/17/metasploit-weekly-wrap-up-196-2/

FortiNAC EITW Content Added

Metasploit Weekly Wrap-Up

Whilst we did have a few cool new modules added this week, one particularly interesting one was a Fortinet FortiNAC vulnerability, CVE-2022-39952, that was added in by team member Jack Heysel. This module exploits an unauthenticated RCE in Fortinet FortiNAC versions 9.4.0, 9.2.0 through 9.2.5, 9.1.0 through 9.1.7, 8.8.0 through 8.8.11, 8.7.0 through 8.7.6, 8.6.0 through 8.6.5, 8.5.0 through 8.5.4, and 8.3.7 to gain root level access to affected devices. This bug has seen active exploitation in the wild from several threat feeds such as ShadowServer at https://twitter.com/Shadowserver/status/1628140029322362880, so definitely patch if you haven’t done so already.

Tomcat Gives Me All The Shells

One other exploit we did want to call out this week was a local privilege escalation on Apache Tomcat prior to 7.0.54-8. Tomcat is widely deployed in a lot of environments, and this PR, exploiting CVE-2016-5425, allows you to escalate from an authenticated user to full root control over a web server by exploiting a file permissions issue. These vulnerabilities can be quite beneficial to attackers looking to gain further access to a network as often they will compromise a web server and then use that web server to start pivoting deeper into the network. Gaining root access to a web server can further assist them with these efforts. It’s also rather unusual to see a web server specifically being used to assist with local privilege escalation as most exploits tend to focus on using them to gain initial access, so we appreciate the efforts from h00die to add this into Metasploit.

New module content (3)

Fortinet FortiNAC keyUpload.jsp arbitrary file write

Authors: Gwendal Guégniaud, Zach Hanley, and jheysel-r7
Type: Exploit
Pull request: #17750 contributed by jheysel-r7
AttackerKB reference: CVE-2022-39952

Description: A new exploit has been added for CVE-2022-39952, a vulnerability in FortiNAC’s keyUpload.jsp page which allows for arbitrary file write as an unauthenticated user. Successful exploitation results in unauthenticated RCE in the context of the root user, giving full control over the target device.

Apache Tomcat on RedHat Based Systems Insecure Temp Config Privilege Escalation

Authors: Dawid Golunski and h00die
Type: Exploit
Pull request: #17509 contributed by h00die
AttackerKB reference: CVE-2016-5425

Description: This PR adds an exploit that targets a vulnerability in RedHat based systems where improper file permissions are applied to /usr/lib/tmpfiles.d/tomcat.conf for Apache Tomcat versions before 7.0.54-8, allowing attackers to inject commands into the systemd-tmpfiles service to write a cron job that will execute their payload. Successful exploitation should result in privilege escalation to the root user.

Bitbucket Environment Variable RCE

Authors: Ry0taK, Shelby Pace, and y4er
Type: Exploit
Pull request: #17775 contributed by space-r7
AttackerKB reference: CVE-2022-43781

Description: This adds an exploit module for CVE-2022-43781, an authenticated command injection vulnerability in various versions of Bitbucket. Arbitrary command execution is done by injecting specific environment variables into a user name and coercing the Bitbucket application into generating a diff. This module requires at least admin credentials. Successful exploitation results in RCE as the atlbitbucket user.

Enhancements and features (1)

  • #17757 from adfoster-r7 – Updates the formatting logic for info command to improve the readability of the module description. Previously the module description was squashed into a single line, but now each paragraph and bullet list etc will be rendered on their own new lines.

Bugs fixed (1)

  • #17774 from adfoster-r7 – A bug has been fixed when displaying the Metasploit banner due to use of an undefined function; this has been updated to use the proper function.

Documentation added (1)

You can always find more documentation on our docsite at docs.metasploit.com.

Get it

As always, you can update to the latest Metasploit Framework with msfupdate
and you can get more details on the changes since the last blog post from
GitHub:

If you are a git user, you can clone the Metasploit Framework repo (master branch) for the latest.
To install fresh without using git, you can use the open-source-only Nightly Installers or the
binary installers (which also include the commercial edition).

Extend geospatial queries in Amazon Athena with UDFs and AWS Lambda

Post Syndicated from John Telford original https://aws.amazon.com/blogs/big-data/extend-geospatial-queries-in-amazon-athena-with-udfs-and-aws-lambda/

Amazon Athena is a serverless and interactive query service that allows you to easily analyze data in Amazon Simple Storage Service (Amazon S3) and 25-plus data sources, including on-premises data sources or other cloud systems using SQL or Python. Athena built-in capabilities include querying for geospatial data; for example, you can count the number of earthquakes in each Californian county. One disadvantage of analyzing at county-level is that it may give you a misleading impression of which parts of California have had the most earthquakes. This is because the counties aren’t equally sized; a county may have had more earthquakes simply because it’s a big county. What if we wanted a hierarchical system that allowed us to zoom in and out to aggregate data over different equally-sized geographic areas?

In this post, we present a solution that uses Uber’s Hexagonal Hierarchical Spatial Index (H3) to divide the globe into equally-sized hexagons. We then use an Athena user-defined function (UDF) to determine which hexagon each historical earthquake occurred in. Because the hexagons are equally-sized, this analysis gives a fair impression of where earthquakes tend to occur.

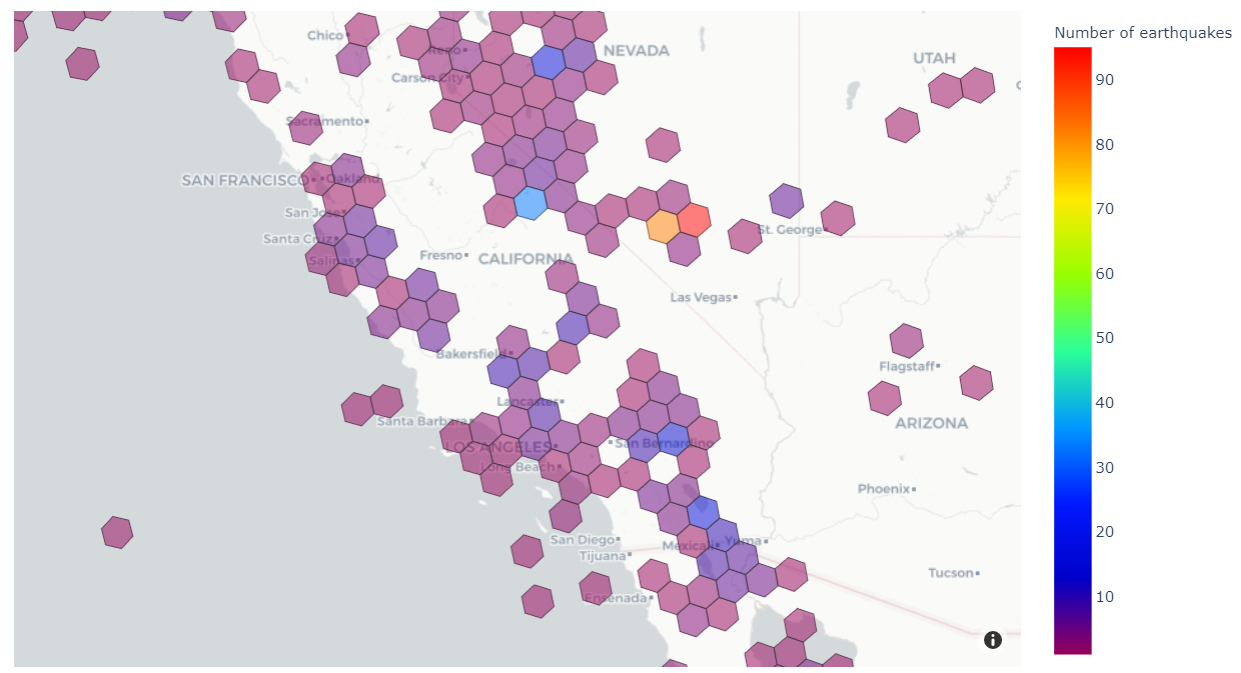
At the end, we’ll produce a visualization like the one below that shows the number of historical earthquakes in different areas of the western US.

H3 divides the globe into equal-sized regular hexagons. The number of hexagons depends on the chosen resolution, which may vary from 0 (122 hexagons, each with edge lengths of about 1,100 km) to 15 (569,707,381,193,162 hexagons, each with edge lengths of about 50 cm). H3 enables analysis at the area level, and each area has the same size and shape.

Solution overview

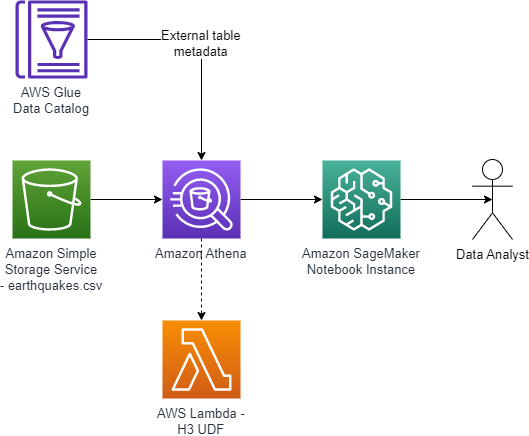
The solution extends Athena’s built-in geospatial capabilities by creating a UDF powered by AWS Lambda. Finally, we use an Amazon SageMaker notebook to run Athena queries that are rendered as a choropleth map. The following diagram illustrates this architecture.

The end-to-end architecture is as follows:

  1. A CSV file of historical earthquakes is uploaded into an S3 bucket.
  2. An AWS Glue external table is created based on the earthquake CSV.
  3. A Lambda function calculates H3 hexagons for parameters (latitude, longitude, resolution). The function is written in Java and can be called as a UDF using queries in Athena.
  4. A SageMaker notebook uses an AWS SDK for pandas package to run a SQL query in Athena, including the UDF.
  5. A Plotly Express package renders a choropleth map of the number of earthquakes in each hexagon.

Prerequisites

For this post, we use Athena to read data in Amazon S3 using the table defined in the AWS Glue Data Catalog associated with our earthquake dataset. In terms of permissions, there are two main requirements:

Configure Amazon S3

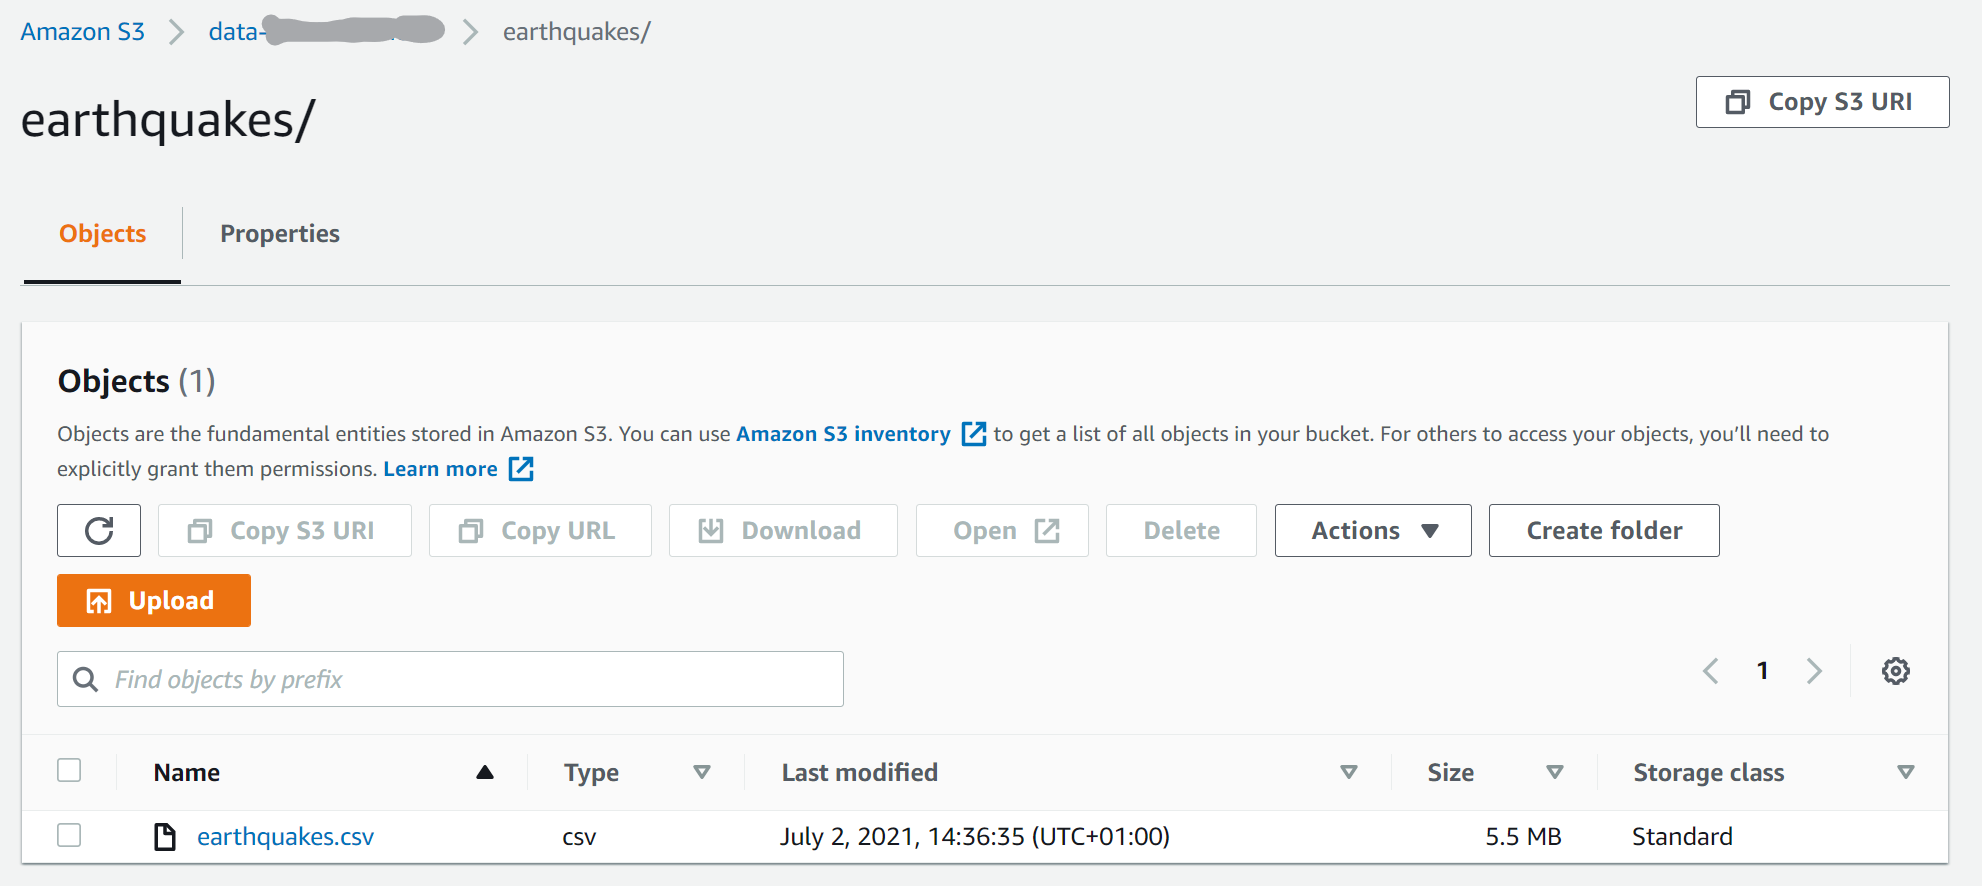
The first step is to create an S3 bucket to store the earthquake dataset, as follows:

  1. Download the CSV file of historical earthquakes from GitHub.
  2. On the Amazon S3 console, choose Buckets in the navigation pane.
  3. Choose Create bucket.
  4. For Bucket name, enter a globally unique name for your data bucket.
  5. Choose Create folder, and enter the folder name earthquakes.
  6. Upload the file to the S3 bucket. In this example, we upload the earthquakes.csv file to the earthquakes prefix.

Create a table in Athena

Navigate to Athena console to create a table. Complete the following steps:

  1. On the Athena console, choose Query editor.
  2. Select your preferred Workgroup using the drop-down menu.
  3. In the SQL editor, use the following code to create a table in the default database:
    CREATE external TABLE earthquakes
    (
      earthquake_date STRING,
      latitude DOUBLE,
      longitude DOUBLE,
      depth DOUBLE,
      magnitude DOUBLE,
      magtype STRING,
      mbstations STRING,
      gap STRING,
      distance STRING,
      rms STRING,
      source STRING,
      eventid STRING
    )
    ROW FORMAT DELIMITED FIELDS TERMINATED BY ','
    STORED AS TEXTFILE LOCATION 's3://<MY-DATA-BUCKET>/earthquakes/';

Create a Lambda function for the Athena UDF

For a thorough explanation on how to build Athena UDFs, see Querying with user defined functions. We use Java 11 and Uber H3 Java binding to build the H3 UDF. We provide the implementation of the UDF on GitHub.

There are several options for deploying a UDF using Lambda. In this example, we use the AWS Management Console. For production deployments, you probably want to use infrastructure as code such as the AWS Cloud Development Kit (AWS CDK). For information about how to use the AWS CDK to deploy the Lambda function, refer to the project code repository. Another possible deployment option is using AWS Serverless Application Repository (SAR).

Deploy the UDF

Deploy the Uber H3 binding UDF using the console as follows:

  1. Go to binary directory in the GitHub repository, and download aws-h3-athena-udf-*.jar to your local desktop.
  2. Create a Lambda function called H3UDF with Runtime set to Java 11 (Corretto), and Architecture set to x86_64.
  3. Upload the aws-h3-athena-udf*.jar file.
  4. Change the handler name to com.aws.athena.udf.h3.H3AthenaHandler.
  5. In the General configuration section, choose Edit to set the memory of the Lambda function to 4096 MB, which is an amount of memory that works for our examples. You may need to set the memory size larger for your use cases.

Use the Lambda function as an Athena UDF

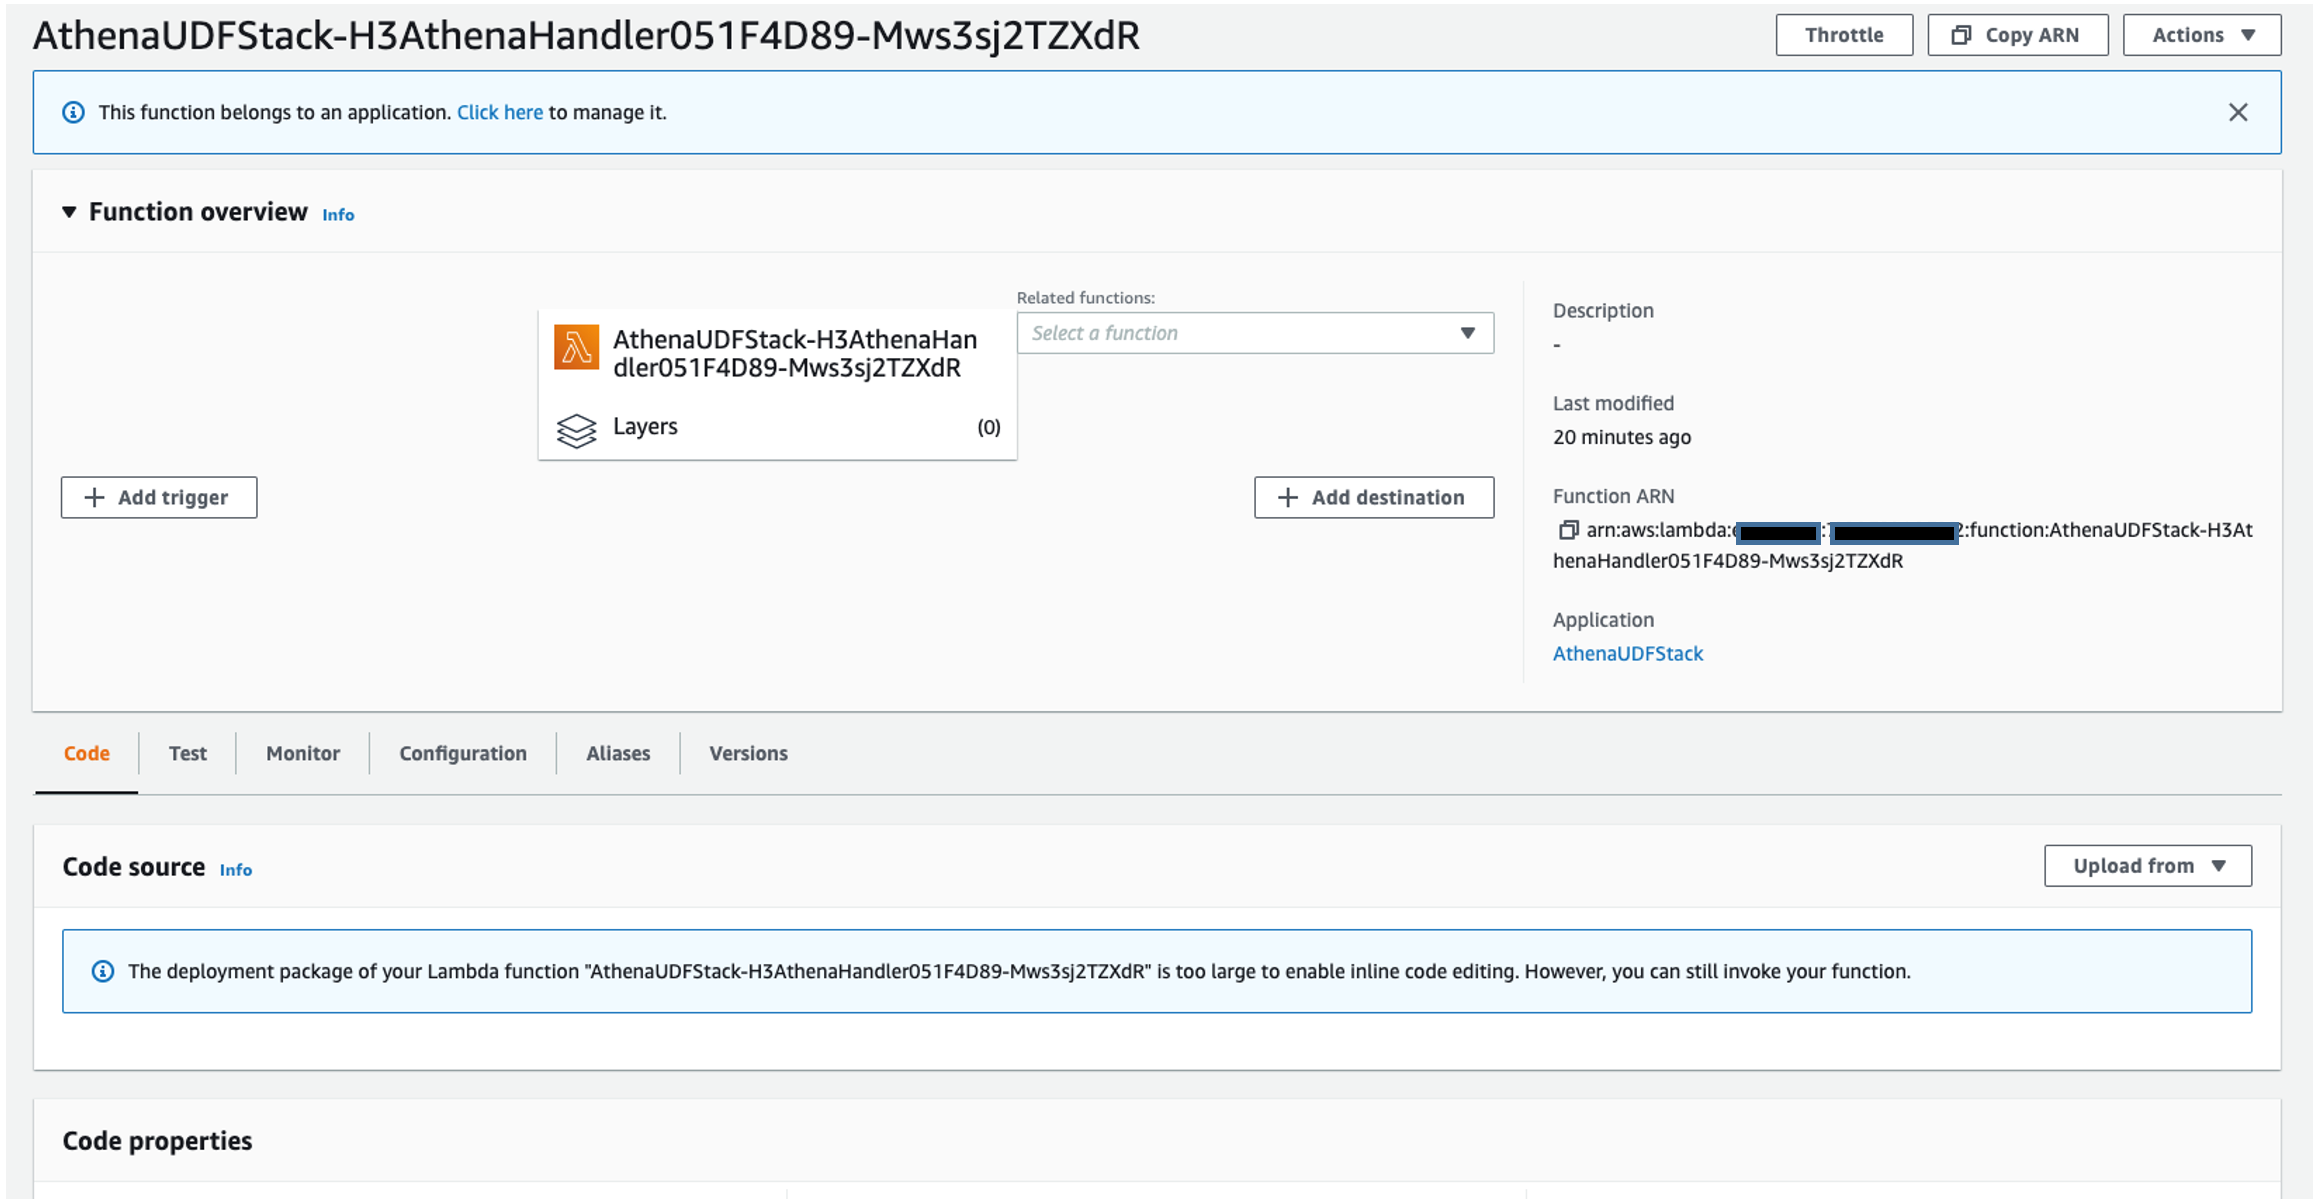
After you create the Lambda function, you’re ready to use it as a UDF. The following screenshot shows the function details.

You can now use the function as an Athena UDF. On the Athena console, run the following command:

USING EXTERNAL FUNCTION lat_lng_to_cell_address(lat DOUBLE, lng DOUBLE, res INTEGER)
RETURNS VARCHAR
LAMBDA '<MY-LAMBDA-ARN>'-- Replace with ARN of your Lambda function.
SELECT *,
       lat_lng_to_cell_address(latitude, longitude, 4) AS h3_cell
FROM earthquakes
WHERE latitude BETWEEN 18 AND 70;

The udf/examples folder in the GitHub repository includes more examples of the Athena queries.

Developing the UDFs

Now that we showed you how to deploy a UDF for Athena using Lambda, let’s dive deeper into how to develop these kinds of UDFs. As explained in Querying with user defined functions, in order to develop a UDF, we first need to implement a class that inherits UserDefinedFunctionHandler. Then we need to implement the functions inside the class that can be used as UDFs of Athena.

We begin the UDF implementation by defining a class H3AthenaHandler that inherits the UserDefinedFunctionHandler. Then we implement functions that act as wrappers of functions defined in the Uber H3 Java binding. We make sure that all the functions defined in the H3 Java binding API are mapped, so that they can be used in Athena as UDFs. For example, we map the lat_lng_to_cell_address function used in the preceding example to the latLngToCell of the H3 Java binding.

On top of the call to the Java binding, many of the functions in the H3AthenaHandler check whether the input parameter is null. The null check is useful because we don’t assume the input to be non-null. In practice, null values for an H3 index or address are not unusual.

The following code shows the implementation of the get_resolution function:

/** Returns the resolution of an index.
     *  @param h3 the H3 index.
     *  @return the resolution. Null when h3 is null.
     *  @throws IllegalArgumentException when index is out of range.
     */
    public Integer get_resolution(Long h3){
        final Integer result;
        if (h3 == null) {
            result = null;
        } else {
            result = h3Core.getResolution(h3);
        }
        return result;
    }

Some H3 API functions such as cellToLatLng return List<Double> of two elements, where the first element is the latitude and the second is longitude. The H3 UDF that we implement provides a function that returns well-known text (WKT) representation. For example, we provide cell_to_lat_lng_wkt, which returns a Point WKT string instead of List<Double>. We can then use the output of cell_to_lat_lng_wkt in combination with the built-in spatial Athena function ST_GeometryFromText as follows:

USING EXTERNAL FUNCTION cell_to_lat_lng_wkt(h3 BIGINT) 
RETURNS VARCHAR
LAMBDA '<MY-LAMBDA-ARN>'
SELECT ST_GeometryFromText(cell_to_lat_lng_wkt(622506764662964223))

Athena UDF only supports scalar data types and does not support nested types. However, some H3 APIs return nested types. For example, the polygonToCells function in H3 takes a List<List<List<GeoCoord>>>. Our implementation of polygon_to_cells UDF receives a Polygon WKT instead. The following shows an example Athena query using this UDF:

-- get all h3 hexagons that cover Toulouse, Nantes, Lille, Paris, Nice 
USING EXTERNAL FUNCTION polygon_to_cells(polygonWKT VARCHAR, res INT)
RETURNS ARRAY(BIGINT)
LAMBDA '<MY-LAMBDA-ARN>'
SELECT polygon_to_cells('POLYGON ((43.604652 1.444209, 47.218371 -1.553621, 50.62925 3.05726, 48.864716 2.349014, 43.6961 7.27178, 3.604652 1.444209))', 2)

Use SageMaker notebooks for visualization

A SageMaker notebook is a managed machine learning compute instance that runs a Jupyter notebook application. In this example, we will use a SageMaker notebook to write and run our code to visualize our results, but if your use case includes Apache Spark then using Amazon Athena for Apache Spark would be a great choice. For advice on security best practices for SageMaker, see Building secure machine learning environments with Amazon SageMaker. You can create your own SageMaker notebook by following these instructions:

  1. On the SageMaker console, choose Notebook in the navigation pane.
  2. Choose Notebook instances.
  3. Choose Create notebook instance.
  4. Enter a name for the notebook instance.
  5. Choose an existing IAM role or create a role that allows you to run SageMaker and grants access to Amazon S3 and Athena.
  6. Choose Create notebook instance.
  7. Wait for the notebook status to change from Creating to InService.
  8. Open the notebook instance by choosing Jupyter or JupyterLab.

Explore the data

We’re now ready to explore the data.

  1. On the Jupyter console, under New, choose Notebook.
  2. On the Select Kernel drop-down menu, choose conda_python3.
  3. Add new cells by choosing the plus sign.
  4. In your first cell, download the following Python modules that aren’t included in the standard SageMaker environment:
    !pip install geojson
    !pip install awswrangler
    !pip install geomet
    !pip install shapely

    GeoJSON is a popular format for storing spatial data in a JSON format. The geojson module allows you to easily read and write GeoJSON data with Python. The second module we install, awswrangler, is the AWS SDK for pandas. This is a very easy way to read data from various AWS data sources into Pandas data frames. We use it to read earthquake data from the Athena table.

  5. Next, we import all the packages that we use to import the data, reshape it, and visualize it:
    from geomet import wkt
    import plotly.express as px
    from shapely.geometry import Polygon, mapping
    import awswrangler as wr
    import pandas as pd
    from shapely.wkt import loads
    import geojson
    import ast

  6. We begin importing our data using the athena.read_sql._query function in AWS SDK for pandas. The Athena query has a subquery that uses the UDF to add a column h3_cell to each row in the earthquakes table, based on the latitude and longitude of the earthquake. The analytic function COUNT is then used to find out the number of earthquakes in each H3 cell. For this visualization, we’re only interested in earthquakes within the US, so we filter out rows in the data frame that are outside the area of interest:
    def run_query(lambda_arn, db, resolution):
        query = f"""USING EXTERNAL FUNCTION cell_to_boundary_wkt(cell VARCHAR)
                        RETURNS ARRAY(VARCHAR)
                        LAMBDA '{lambda_arn}'
                           SELECT h3_cell, cell_to_boundary_wkt(h3_cell) as boundary, quake_count FROM(
                            USING EXTERNAL FUNCTION lat_lng_to_cell_address(lat DOUBLE, lng DOUBLE, res INTEGER)
                             RETURNS VARCHAR
                            LAMBDA '{lambda_arn}'
                        SELECT h3_cell, COUNT(*) AS quake_count
                          FROM
                            (SELECT *,
                               lat_lng_to_cell_address(latitude, longitude, {resolution}) AS h3_cell
                             FROM earthquakes
                             WHERE latitude BETWEEN 18 AND 70        -- For this visualisation, we're only interested in earthquakes within the USA.
                               AND longitude BETWEEN -175 AND -50
                             )
                           GROUP BY h3_cell ORDER BY quake_count DESC) cell_quake_count"""
        return wr.athena.read_sql_query(query, database=db)
    
    lambda_arn = '<MY-LAMBDA-ARN>' # Replace with ARN of your lambda.
    db_name = '<MY-DATABASE-NAME>' # Replace with name of your Glue database.
    earthquakes_df = run_query(lambda_arn=lambda_arn,db=db_name, resolution=4)
    earthquakes_df.head()

    The following screenshot shows our results.

Follow along with the rest of the steps in our Jupyter notebook to see how we analyze and visualize our example with H3 UDF data.

Visualize the results

To visualize our results, we use the Plotly Express module to create a choropleth map of our data. A choropleth map is a type of visualization that is shaded based on quantitative values. This is a great visualization for our use case because we’re shading different regions based on the frequency of earthquakes.

In the resulting visual, we can see the ranges of frequency of earthquakes in different areas of North America. Note, the H3 resolution in this map is lower than in the earlier map, which makes each hexagon cover a larger area of the globe.

Clean up

To avoid incurring extra charges on your account, delete the resources you created:

  1. On the SageMaker console, select the notebook and on the Actions menu, choose Stop.
  2. Wait for the status of the notebook to change to Stopped, then select the notebook again and on the Actions menu, choose Delete.
  3. On the Amazon S3 console, select the bucket you created and choose Empty.
  4. Enter the bucket name and choose Empty.
  5. Select the bucket again and choose Delete.
  6. Enter the bucket name and choose Delete bucket.
  7. On the Lambda console, select the function name and on the Actions menu, choose Delete.

Conclusion

In this post, you saw how to extend functions in Athena for geospatial analysis by adding your own user-defined function. Although we used Uber’s H3 geospatial index in this demonstration, you can bring your own geospatial index for your own custom geospatial analysis.

In this post, we used Athena, Lambda, and SageMaker notebooks to visualize the results of our UDFs in the western US. Code examples are in the h3-udf-for-athena GitHub repo.

As a next step, you can modify the code in this post and customize it for your own needs to gain further insights from your own geographical data. For example, you could visualize other cases such as droughts, flooding, and deforestation.


About the Authors

John Telford is a Senior Consultant at Amazon Web Services. He is a specialist in big data and data warehouses. John has a Computer Science degree from Brunel University.

Anwar Rizal is a Senior Machine Learning consultant based in Paris. He works with AWS customers to develop data and AI solutions to sustainably grow their business.

Pauline Ting is a Data Scientist in the AWS Professional Services team. She supports customers in achieving and accelerating their business outcome by developing sustainable AI/ML solutions. In her spare time, Pauline enjoys traveling, surfing, and trying new dessert places.

Amazon QuickSight helps TalentReef empower its customers to make more informed hiring decisions

Post Syndicated from Alexander Plumb original https://aws.amazon.com/blogs/big-data/amazon-quicksight-helps-talentreef-empower-its-customers-to-make-more-informed-hiring-decisions/

This post is co-written with Alexander Plumb, Product Manager at Mitratech.

TalentReef, now part of Mitratech, is a talent management platform purpose-built for location-based, high-volume hiring. TalentReef was acquired by Mitratech in August 2022 with the goal to combine TalentReef’s best-in-class systems with Mitratech’s expertise, technology, and global platform to ensure their customers’ hiring needs are serviced better and faster than anyone else in the industry.

The TalentReef team are experts in hourly recruiting, onboarding, and hiring, with the mission to help its customers engage with great candidates utilizing an intelligent, easy-to-use single platform. TalentReef differentiates itself from its competitors by not just building features, but creating an entire talent management ecosystem on the idea of eliminating friction and making the hiring and onboarding process as smooth and easy as possible for their customers and applicants.

TalentReef used Amazon QuickSight with the intent of replacing their legacy business intelligence (BI) reporting. The team found QuickSight easy to use and developed two new dashboards that replaced dozens of legacy reports. The response has been overwhelmingly positive, leading to the development of two additional analytics dashboards, Job Postings and Onboarding, both set to be released in the first half of 2023.

The following screenshot shows the Applicant dashboard, which is used internally by TalentReef Customer Solution Managers as well as externally directly by customers embedded within the talent management application. This dashboard provides quick access to their customers’ important metrics. For example, it shows the total number of applicants for all the job postings. It also shows how many applicants are present in the system by position.
full TalentReef dashboard

Providing clarity to customers for hourly workforce hiring

The war for talent is top of mind for those hiring within the hourly workforce. Hiring managers are constantly looking for top talent and trying to understand where they came from, why they are applying, and more. They want to see how their job postings are performing, if there is a drop in any posting, and opportunities to optimize their process. TalentReef’s previous solution wasn’t designed to convey this information, and required manual intervention to extract these hidden insights from multiple reports.

With the new dashboards embedded directly into TalentReef’s customer view, the development team is able to streamline their data ingestion process to ensure up-to-date data is available to their customers within the TalentReef platform. QuickSight features such as forecasts, cross-sheet filtering, and the ability to drill into underlying data allows customers to quickly see the value through different lenses.

Whenever a new feature was rolled out in the previous solution, it wasn’t possible to gauge the impact it had on applicants and new hires because it required a lot of manual work. Development teams had to provide a raw data file to internal users, upon request, to show the value of the new feature, and even then it was limited in how they could show value. With QuickSight, not only are they able to show the value of new features quickly, but they can do so without development intervention.

Data visualization helps business analysts scale client support

The sheer volume of our datasets made gathering insights a slow process. Not only that, but datasets weren’t accessible to a wide audience outside our team, such as partners, program managers, product managers, and so on. As a result, Business Intelligence Engineers (BIEs) spent a lot of time writing ad hoc queries, which then took a long time to run. When the insights were ready, BIEs were tasked with answering questions via manual processes that didn’t scale.

On September 6, 2022, TalentReef launched two new analytics dashboards, Applicant and Hire, which are embedded into their customer application. Since the launch, TalentReef has seen usage increase over 20% and has saved manual internal resources hours of their time putting together insights for their customer base during QBR calls that now can be accessed directly from the dashboards. With TalentReef’s previous tool, reports were unstable and would time out, which required development teams to troubleshoot and repair. Since implementing QuickSight, TalentReef has found efficiencies for both internal resources as well as customer hiring managers, and are confident in the ability to meet the demand of these users.

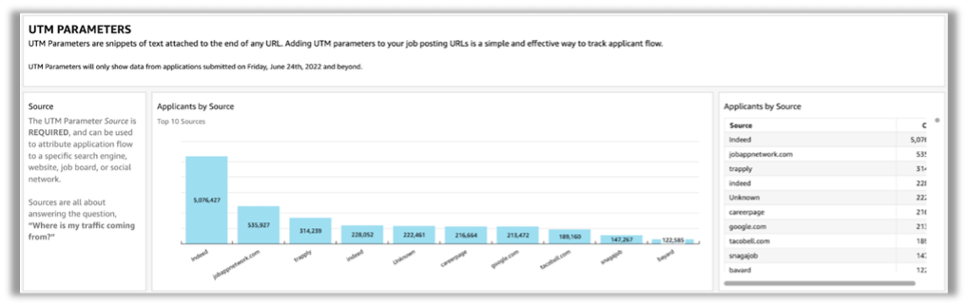
The following image demonstrates UTM parameters (Urchin Tracking Modules—a tracking device that helps get really specific with the traffic source). This dashboard enables TalentReef’s customer base to understand where their applicants are coming from, so they know where to invest their recruitment dollars (whether the applicants came from indeed.com, or google.com, and so on). This embedded dashboard even allows users to drill further into their data, understanding the name, date, location, and more that the UTM source is tied to.

UTM Parameters

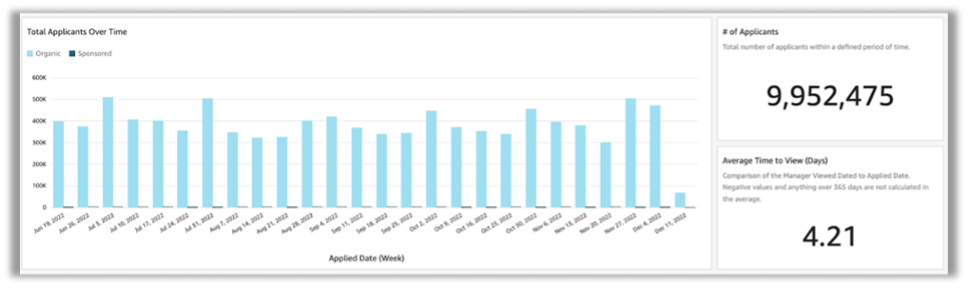
QuickSight has allowed TalentReef to unlock insights that were not previously attainable, or very manual to derive, from their previous reporting tool. An example of this in the following image is the average time to review an application. In the war for talent, minutes can make a difference between finding the individuals needed to fill a position or letting them slip through the cracks. This type of information gives leadership advantage to know where to focus their attention and help win the war for talent in the hourly workforce.

Applicants over time

Unlock the power of applicant and hire data to get insights you never had before!

Our customers have been extremely impressed with our QuickSight dashboards because they provide information that was previously unavailable, without manual effort by development teams. The interactive nature of the QuickSight dashboards allows TalentReef’s customer base to dive deeper into the applicants and hired candidates, for example to understand from where an applicant came from or how an applicant applied to a job posting.

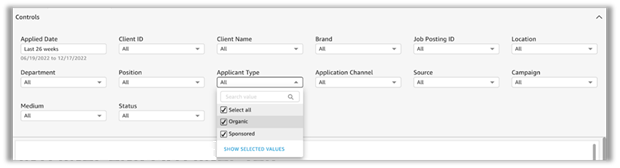
With QuickSight, not only can we visualize applicant and hire data in multiple, meaningful ways for our customer base, but also we can help them see the ROI from additional products they’ve added on to the platform. In the following example, we have a variety of filters that allow clients to see if their sponsorship dollars are returning successful hiring applications, if their add-on of chat apply brings higher application volume, if the applicant came from text to apply, and more.

dashboard controls
Applicant report

Innovating faster with intuitive UI, increasing customer satisfaction

QuickSight enables TalentReef to innovate faster in response to customer feedback. With the intuitive UI and native data lake connections of QuickSight, TalentReef’s product team is able to quickly build visualizations based off the needs and wants of all their customers.

TalentReef’s previous reporting tool required manual efforts from development teams. Enhancements and bug fixes required prioritization against other initiatives and had a higher likelihood of error. With QuickSight, TalentReef was able to set up a data lake that allows dashboards to be built and innovated on by the product team, freeing up development resources to continue on the highest priority. Developers get the data into the data lake, and then the product team pulls in the data into QuickSight and deploys it as needed. This has lead to higher customer satisfaction both internally and externally with the quick turnaround time.

The right people with the right information

In any type of HR space, the right level of data access is key to make sure you aren’t leaving yourself open to compliance issues. Our development team developed a solution that is able to be applied across all QuickSight dashboards using row-level security on the dataset.

TalentReef’s partnership with QuickSight has enabled us to unlock insights that were previously difficult or impossible to attain. We’ve allowed our customer base to know what is happening and why it is happening, and visualize data that is most impactful and important to them.

To learn more about how you can embed customized data visuals, interactive dashboards, and natural language querying into any application, visit Amazon QuickSight Embedded.


About the Authors

Alexander Plumb is a Product Manager at Mitratech. Alexander has been a product leader with over 5 years of experience leading to highly successful product launches that meet customer needs.

Bani Sharma is a Sr Solutions Architect with Amazon Web Services (AWS), based out of Denver, Colorado. As a Solutions Architect, she works with a large number of Small and Medium businesses, and provides technical guidance and solutions on AWS. She has an area of depth in Containers and Modernization. Prior to AWS, Bani worked in various technical roles for a large Telecom provider Dish Networks and worked as a Senior Developer for HSBC Bank Software development.

Brian Klein is a Sr Technical Account Manager with Amazon Web Services (AWS), helping digital native businesses utilize AWS services to bring value to their organizations. Brian has worked with AWS technologies for 9 years, designing and operating production internet-facing workloads, with a focus on security, availability, and resilience while demonstrating operational efficiency.

Architecting for data residency with AWS Outposts rack and landing zone guardrails

Post Syndicated from Sheila Busser original https://aws.amazon.com/blogs/compute/architecting-for-data-residency-with-aws-outposts-rack-and-landing-zone-guardrails/

This blog post was written by Abeer Naffa’, Sr. Solutions Architect, Solutions Builder AWS, David Filiatrault, Principal Security Consultant, AWS and Jared Thompson, Hybrid Edge SA Specialist, AWS.

In this post, we will explore how organizations can use AWS Control Tower landing zone and AWS Organizations custom guardrails to enable compliance with data residency requirements on AWS Outposts rack. We will discuss how custom guardrails can be leveraged to limit the ability to store, process, and access data and remain isolated in specific geographic locations, how they can be used to enforce security and compliance controls, as well as, which prerequisites organizations should consider before implementing these guardrails.

Data residency is a critical consideration for organizations that collect and store sensitive information, such as Personal Identifiable Information (PII), financial, and healthcare data. With the rise of cloud computing and the global nature of the internet, it can be challenging for organizations to make sure that their data is being stored and processed in compliance with local laws and regulations.

One potential solution for addressing data residency challenges with AWS is to use Outposts rack, which allows organizations to run AWS infrastructure on premises and in their own data centers. This lets organizations store and process data in a location of their choosing. An Outpost is seamlessly connected to an AWS Region where it has access to the full suite of AWS services managed from a single plane of glass, the AWS Management Console or the AWS Command Line Interface (AWS CLI).  Outposts rack can be configured to utilize landing zone to further adhere to data residency requirements.

The landing zones are a set of tools and best practices that help organizations establish a secure and compliant multi-account structure within a cloud provider. A landing zone can also include Organizations to set policies – guardrails – at the root level, known as Service Control Policies (SCPs) across all member accounts. This can be configured to enforce certain data residency requirements.

When leveraging Outposts rack to meet data residency requirements, it is crucial to have control over the in-scope data movement from the Outposts. This can be accomplished by implementing landing zone best practices and the suggested guardrails. The main focus of this blog post is on the custom policies that restrict data snapshots, prohibit data creation within the Region, and limit data transfer to the Region.

Prerequisites

Landing zone best practices and custom guardrails can help when data needs to remain in a specific locality where the Outposts rack is also located.  This can be completed by defining and enforcing policies for data storage and usage within the landing zone organization that you set up. The following prerequisites should be considered before implementing the suggested guardrails:

1. AWS Outposts rack

AWS has installed your Outpost and handed off to you. An Outpost may comprise of one or more racks connected together at the site. This means that you can start using AWS services on the Outpost, and you can manage the Outposts rack using the same tools and interfaces that you use in AWS Regions.

2. Landing Zone Accelerator on AWS

We recommend using Landing Zone Accelerator on AWS (LZA) to deploy a landing zone for your organization. Make sure that the accelerator is configured for the appropriate Region and industry. To do this, you must meet the following prerequisites:

    • A clear understanding of your organization’s compliance requirements, including the specific Region and industry rules in which you operate.
    • Knowledge of the different LZAs available and their capabilities, such as the compliance frameworks with which you align.
    • Have the necessary permissions to deploy the LZAs and configure it for your organization’s specific requirements.

Note that LZAs are designed to help organizations quickly set up a secure, compliant multi-account environment. However, it’s not a one-size-fits-all solution, and you must align it with your organization’s specific requirements.

3. Set up the data residency guardrails

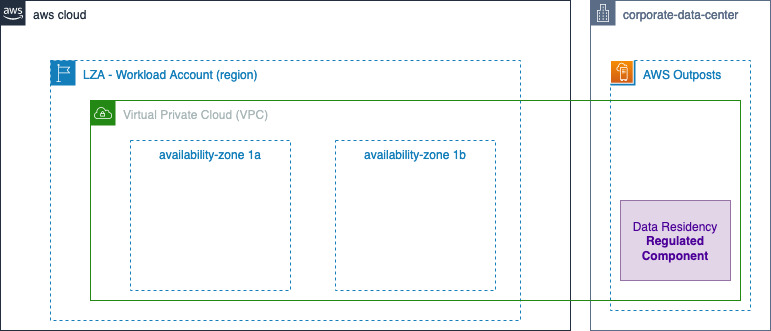
Using Organizations, you must make sure that the Outpost is ordered within a workload account in the landing zone.

Figure 1 Landing Zone Accelerator Outposts workload on AWS high level Architecture

Figure 1: Landing Zone Accelerator – Outposts workload on AWS high level Architecture

Utilizing Outposts rack for regulated components

When local regulations require regulated workloads to stay within a specific boundary, or when an AWS Region or AWS Local Zone isn’t available in your jurisdiction, you can still choose to host your regulated workloads on Outposts rack for a consistent cloud experience. When opting for Outposts rack, note that, as part of the shared responsibility model, customers are responsible for attesting to physical security, access controls, and compliance validation regarding the Outposts, as well as, environmental requirements for the facility, networking, and power. Utilizing Outposts rack requires that you procure and manage the data center within the city, state, province, or country boundary for your applications’ regulated components, as required by local regulations.

Procuring two or more racks in the diverse data centers can help with the high availability for your workloads. This is because it provides redundancy in case of a single rack or server failure. Additionally, having redundant network paths between Outposts rack and the parent Region can help make sure that your application remains connected and continue to operate even if one network path fails.

However, for regulated workloads with strict service level agreements (SLA), you may choose to spread Outposts racks across two or more isolated data centers within regulated boundaries. This helps make sure that your data remains within the designated geographical location and meets local data residency requirements.

In this post, we consider a scenario with one data center, but consider the specific requirements of your workloads and the regulations that apply to determine the most appropriate high availability configurations for your case.

Outposts rack workload data residency guardrails

Organizations provide central governance and management for multiple accounts. Central security administrators use SCPs with Organizations to establish controls to which all AWS Identity and Access Management (IAM) principals (users and roles) adhere.

Now, you can use SCPs to set permission guardrails.  A suggested preventative controls for data residency on Outposts rack that leverage the implementation of SCPs are shown as follows. SCPs enable you to set permission guardrails by defining the maximum available permissions for IAM entities in an account. If an SCP denies an action for an account, then none of the entities in the account can take that action, even if their IAM permissions let them. The guardrails set in SCPs apply to all IAM entities in the account, which include all users, roles, and the account root user.

Upon finalizing these prerequisites, you can create the guardrails for the Outposts Organization Unit (OU).

Note that while the following guidelines serve as helpful guardrails – SCPs – for data residency, you should consult internally with legal and security teams for specific organizational requirements.

 To exercise better control over workloads in the Outposts rack and prevent data transfer from Outposts to the Region or data storage outside the Outposts, consider implementing the following guardrails. Additionally, local regulations may dictate that you set up these additional guardrails.

  1. When your data residency requirements require restricting data transfer/saving to the Region, consider the following guardrails:

a. Deny copying data from Outposts to the Region for Amazon Elastic Compute Cloud (Amazon EC2), Amazon Relational Database Service (Amazon RDS), Amazon ElastiCache and data sync “DenyCopyToRegion”.

b. Deny Amazon Simple Storage Service (Amazon S3) put action to the Region “DenyPutObjectToRegionalBuckets”.

If your data residency requirements mandate restrictions on data storage in the Region,  consider implementing this guardrail to prevent  the use of S3 in the Region.

Note: You can use Amazon S3 for Outposts.

c. If your data residency requirements mandate restrictions on data storage in the Region, consider implementing “DenyDirectTransferToRegion” guardrail.

Out of Scope is metadata such as tags, or operational data such as KMS keys.

{
  "Version": "2012-10-17",
  "Statement": [
      {
      "Sid": "DenyCopyToRegion",
      "Action": [
        "ec2:ModifyImageAttribute",
        "ec2:CopyImage",  
        "ec2:CreateImage",
        "ec2:CreateInstanceExportTask",
        "ec2:ExportImage",
        "ec2:ImportImage",
        "ec2:ImportInstance",
        "ec2:ImportSnapshot",
        "ec2:ImportVolume",
        "rds:CreateDBSnapshot",
        "rds:CreateDBClusterSnapshot",
        "rds:ModifyDBSnapshotAttribute",
        "elasticache:CreateSnapshot",
        "elasticache:CopySnapshot",
        "datasync:Create*",
        "datasync:Update*"
      ],
      "Resource": "*",
      "Effect": "Deny"
    },
    {
      "Sid": "DenyDirectTransferToRegion",
      "Action": [
        "dynamodb:PutItem",
        "dynamodb:CreateTable",
        "ec2:CreateTrafficMirrorTarget",
        "ec2:CreateTrafficMirrorSession",
        "rds:CreateGlobalCluster",
        "es:Create*",
        "elasticfilesystem:C*",
        "elasticfilesystem:Put*",
        "storagegateway:Create*",
        "neptune-db:connect",
        "glue:CreateDevEndpoint",
        "glue:UpdateDevEndpoint",
        "datapipeline:CreatePipeline",
        "datapipeline:PutPipelineDefinition",
        "sagemaker:CreateAutoMLJob",
        "sagemaker:CreateData*",
        "sagemaker:CreateCode*",
        "sagemaker:CreateEndpoint",
        "sagemaker:CreateDomain",
        "sagemaker:CreateEdgePackagingJob",
        "sagemaker:CreateNotebookInstance",
        "sagemaker:CreateProcessingJob",
        "sagemaker:CreateModel*",
        "sagemaker:CreateTra*",
        "sagemaker:Update*",
        "redshift:CreateCluster*",
        "ses:Send*",
        "ses:Create*",
        "sqs:Create*",
        "sqs:Send*",
        "mq:Create*",
        "cloudfront:Create*",
        "cloudfront:Update*",
        "ecr:Put*",
        "ecr:Create*",
        "ecr:Upload*",
        "ram:AcceptResourceShareInvitation"
      ],
      "Resource": "*",
      "Effect": "Deny"
    },
    {
      "Sid": "DenyPutObjectToRegionalBuckets",
      "Action": [
        "s3:PutObject"
      ],
      "Resource": ["arn:aws:s3:::*"],
      "Effect": "Deny"
    }
  ]
}
  1. If your data residency requirements require limitations on data storage in the Region, consider implementing this guardrail “DenySnapshotsToRegion” and “DenySnapshotsNotOutposts” to restrict the use of snapshots in the Region.

a. Deny creating snapshots of your Outpost data in the Region “DenySnapshotsToRegion”

 Make sure to update the Outposts “<outpost_arn_pattern>”.

b. Deny copying or modifying Outposts Snapshots “DenySnapshotsNotOutposts”

Make sure to update the Outposts “<outpost_arn_pattern>”.

Note: “<outpost_arn_pattern>” default is arn:aws:outposts:*:*:outpost/*

{
  "Version": "2012-10-17",
  "Statement": [

    {
      "Sid": "DenySnapshotsToRegion",
      "Effect":"Deny",
      "Action":[
        "ec2:CreateSnapshot",
        "ec2:CreateSnapshots"
      ],
      "Resource":"arn:aws:ec2:*::snapshot/*",
      "Condition":{
         "ArnLike":{
            "ec2:SourceOutpostArn":"<outpost_arn_pattern>"
         },
         "Null":{
            "ec2:OutpostArn":"true"
         }
      }
    },
    {

      "Sid": "DenySnapshotsNotOutposts",          
      "Effect":"Deny",
      "Action":[
        "ec2:CopySnapshot",
        "ec2:ModifySnapshotAttribute"
      ],
      "Resource":"arn:aws:ec2:*::snapshot/*",
      "Condition":{
         "ArnLike":{
            "ec2:OutpostArn":"<outpost_arn_pattern>"
         }
      }
    }

  ]
}
  1. This guardrail helps to prevent the launch of Amazon EC2 instances or creation of network interfaces in non-Outposts subnets. It is advisable to keep data residency workloads within the Outposts rather than the Region to ensure better control over regulated workloads. This approach can help your organization achieve better control over data residency workloads and improve governance over your AWS Organization.

Make sure to update the Outposts subnets “<outpost_subnet_arns>”.

{
"Version": "2012-10-17",
  "Statement":[{
    "Sid": "DenyNotOutpostSubnet",
    "Effect":"Deny",
    "Action": [
      "ec2:RunInstances",
      "ec2:CreateNetworkInterface"
    ],
    "Resource": [
      "arn:aws:ec2:*:*:network-interface/*"
    ],
    "Condition": {
      "ForAllValues:ArnNotEquals": {
        "ec2:Subnet": ["<outpost_subnet_arns>"]
      }
    }
  }]
}

Additional considerations

When implementing data residency guardrails on Outposts rack, consider backup and disaster recovery strategies to make sure that your data is protected in the event of an outage or other unexpected events. This may include creating regular backups of your data, implementing disaster recovery plans and procedures, and using redundancy and failover systems to minimize the impact of any potential disruptions. Additionally, you should make sure that your backup and disaster recovery systems are compliant with any relevant data residency regulations and requirements. You should also test your backup and disaster recovery systems regularly to make sure that they are functioning as intended.

Additionally, the provided SCPs for Outposts rack in the above example do not block the “logs:PutLogEvents”. Therefore, even if you implemented data residency guardrails on Outpost, the application may log data to CloudWatch logs in the Region.

Highlights

By default, application-level logs on Outposts rack are not automatically sent to Amazon CloudWatch Logs in the Region. You can configure CloudWatch logs agent on Outposts rack to collect and send your application-level logs to CloudWatch logs.

logs: PutLogEvents does transmit data to the Region, but it is not blocked by the provided SCPs, as it’s expected that most use cases will still want to be able to use this logging API. However, if blocking is desired, then add the action to the first recommended guardrail. If you want specific roles to be allowed, then combine with the ArnNotLike condition example referenced in the previous highlight.

Conclusion

The combined use of Outposts rack and the suggested guardrails via AWS Organizations policies enables you to exercise better control over the movement of the data. By creating a landing zone for your organization, you can apply SCPs to your Outposts racks that will help make sure that your data remains within a specific geographic location, as required by the data residency regulations.

Note that, while custom guardrails can help you manage data residency on Outposts rack, it’s critical to thoroughly review your policies, procedures, and configurations to make sure that they are compliant with all relevant data residency regulations and requirements. Regularly testing and monitoring your systems can help make sure that your data is protected and your organization stays compliant.

References

Using DPUs Hands-on Lab with the NVIDIA BlueField-2 DPU and VMware vSphere Demo

Post Syndicated from Patrick Kennedy original https://www.servethehome.com/using-dpus-hands-on-lab-with-the-nvidia-bluefield-2-dpu-and-vmware-vsphere-demo/

We get hands-on with the NVIDIA BlueField-2 DPUs and VMware vSphere Project Monterey to show the performance and operational benefits of DPUs

The post Using DPUs Hands-on Lab with the NVIDIA BlueField-2 DPU and VMware vSphere Demo appeared first on ServeTheHome.

New AWS Security Blog homepage

Post Syndicated from Anna Brinkmann original https://aws.amazon.com/blogs/security/new-aws-security-blog-homepage/

We’ve launched a new AWS Security Blog homepage! While we currently have no plans to deprecate our existing list-view homepage, we have recently launched a new, security-centered homepage to provide readers with more blog info and easy access to the rest of AWS Security. Please bookmark the new page, and let us know what you think, by adding a comment, below.

Thumbnail view of the new page

The new AWS Security Blog homepage

If you have feedback about this post, submit comments in the Comments section below.

Want more AWS Security news? Follow us on Twitter.

Author

Anna Brinkmann

Anna is a technical editor and writer, and she manages the AWS Security Blog. She enjoys creating helpful content and running short, streamlined meetings. In her free time, you can find her hanging out with her son, reading, and cooking with her air fryer.

Ivy Lin

Ivy Lin

Ivy is a seasoned web production expert. With the nickname “IvyBOT” from previous jobs, she has a passion for transforming raw documents and design comps into web pages with exceptional user experiences. In her spare time, she enjoys sharing information about delicious foods from her mother country of Taiwan with her friends.

Какво се случва с банките в момента, преведено на достъпен език

Post Syndicated from VassilKendov original http://kendov.com/bank-crises/

Пиша тази статия поради многото запитвания на познати как да постъпят в конкретната ситуация с личните си финанси. Не мога да отделя на всички време по телефона, затова ще обясня на разбираем език какво се случва с банките, а по-надолу ще публикувам форма със заявка, за тези които искат да направим конкретна среща и да получат съвет или мнение, съобразени с техните лични финансови намерения.

За да разберем проблема и как ще ни засегне е нужно да познаваме малко от малко основните макроикономически принципи и как работи финансовата система.
Буквално в няколко реда ще обясня на достъпен език, някои от основните пазарни принципи, имащи отношение към сегашната ситуация.

Няй-силният лост за управлението на една икономика е ПАРИЧНАТА МАСА В ОБРАЩЕНИЕ! Тоест парите с които ние боравим. Трябва да знаете, че няма по-силен лост за влияние върху икономиката от този. Когато се развиваш и растеш, печаташ пари за да обслужиш или инициираш този ръст. Когато се появи инфлация от многото пазаруване, вдигаш лихвите за да вкараш парите в банките (на депозити или в ценни книги) и те да не участват в оборота. По този начин също така вдигаш стойността на парите и тушираш инфлацията.

За актуални финансови новини можете да използвате Telegram канала Kendov.com

Когато банките имат излишни пари и достатъчно депозити, с част от тях те купуват ценни книги. Много често това са държавни облигации. Тук ключовия момент е „ЧАСТ ОТ ТЯХ”. Никоя банка няма да допусне портфейла и да се състои само и единствено от ДЦК (държавни ценни книжа). Счита се че ДЦК са безрискови, понеже държавата не може да фалира. Най-малкото може винаги да напечата пари и да покрие задълженията си с цената на инфлация. Затова и инфлацията често се използва за „ликвидиране” на задълженията. Помните голямата инфлация в България през 90-те, когато с доживотните си спестявания си купихте един чифт дънки или обратното – когато с една заплата си погасихте жилищния кредит за следващите 15 години?
Това е един много опростен модел, но трябва да го споменем, за да сме сигурни, че ще разберем важността на случващото се в момента и връзката му с нашите лични финанси.

Какво се случи на практика

От 2008 година насам, централните банки по света пуснаха в обращение БЕЗПРЕЦЕДЕНТНО количество пари. Някой дори заговориха за „хеликоптерни пари”, но сега няма да се отклонявам за да обяснявам какво е това (в Гугъл има достатъчно информация).

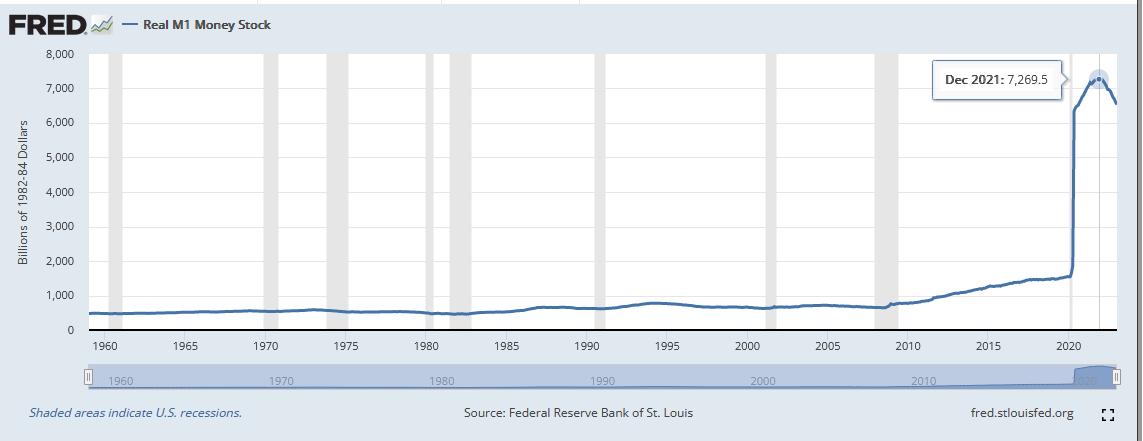
На тази графика Федералния резерв на САЩ са дали как се движи през годините паричната маса в обращение М1 (парите в обращение + кредитните карти+краткосрочните депозити).

От кризата през 2008 виждате, че тази маса нараства. През 2020 има една промяна в начина на отчитане и затова графиката изглежда така. Но като цяло виждате, че преди САЩ да започнат да вдигат лихвите 2021-ва, паричната маса в обращение расте. И то расте добре. Мисля, че няма смисъл да се чудим откъде дойде инфлацията. Само да отбележа, че у нас дойде главно през валутния борд и свързаноста на лева с еврото. Тоест дойде от инфлацията в ЕС, където от 2008 насам също се пуснаха в обращение безпрецедентно количество пари.

През всичките тези годни ливите бяха на исторически ниски нива. EURIBOR-a дори беше отрицателен. Имаше момент в който Германия пусна ДЦК с отрицателна доходност и те бяха изкупени. Тоест като ги купуваш си наясно, че ще си на загуба, но го правиш. Не ме питайте защо, и аз не знам но го правеха.
Като резултат банките се „набълбукаха” с такива дългосрочни и бездоходни ДЦК, но лихвите започнаха да се качват. Както в САЩ, така и в Европа. Този четвъртък ЕЦБ дори вдигна лихвата с още 0.5%.
По този начин купените вече ДЦК започват да губят стойност, защото новите са с 3-4% доходност, а старите с 0-0,5% доходност и то ако ги държиш до падежа. Но пък са част от активите на банката, за съжаление вече с по-ниска цена, защото никой не иска да ги купи. Тоест би ги купил с голяма отстъпка и това вече е загуба за банката.

За  срещa моля използвайте посочената форма.

[contact-form-7]

За вида и качеството на активите има изисквания от страна на централните банки и точно в този момент те поискаха от търговските банки да направят преоценка на активите си, по новите пазарни цени.
Както сами се сещате, това доведе до отчитане на загуби и изисквания тези активи да бъдат заменени с други по-стойностни, за които се изискваше събиране на капитал от фондовите борси.
Това добре, но  вие бихте ли си купили облигации или акции на губещо предприятие, защото след преоценката банките вече бяха на загуба?
Това комбинирано с действията на директорите на банките, които побързаха да продадат акциите си и да изтеглят депозитите си, доведе до така наречения “bank run” – всички теглят авоарите си от тази банка и продават ценните си книги.
Същото става и в Европа, но по традиция  малко закъснение.

Горните са фактите, но интерпретацията им е важна за да сформирате очакванията си.
Доколкото сме в пазарна икономика, фалита би следвало да е нещо нормално. Виждаме обаче, че някои не е приемливо да фалират и затова им помагаме. На други обаче не.
В случая със SVB Bank, Федералния резерв на САЩ взе решение да гарантира депозитите без значение от размера им, защото това са парите на IТ компаниите. Как става това? С пускане на пазара на още пари.
Днес обявиха, че ще бъде спасена и другата закъсала регионална банка – First Republic. Тя щяла да бъде спасена чрез предоставянето на депозити от големите банки, членове на федералния резерв на САЩ.
За Credit Siusse вече знаете, че също ще бъде спасена с помощ от централната банка на Швейцария в размер на 50 млрд франка. Смятайте го като инжектиране на още 50 млрд в обращение. И инфлацията е гарантирана!

Без значение как ще бъдат спасени банките, това ще доведе до увеличение на паричната маса в обращение и то във времена на достатъчно голяма инфлация (около 9.2% средно за ЕС). Но и това не е най-голямият проблем.
Спасявайки големите банки, се случват няколко социални феномена

– Вече не е пазарно да фалираш! Влизаме в комунизма, където предприятията работеха на загуба и накрая държавата покриваше загубата. В сегашния социален строй обаче, загубите в крайна сметка ще се покрият от хората. А какво друго е  инфлацията?
10% инфлация си е близо 10% спад в доходите или 10% данък. Разглеждайте го както ви харесва, но в крайна сметка плащат хората.
– Как очакваме малките да пораснат, ако всеки път спасяваме неефективните големи, за сметка на малките по-прогресивни? Представете си как това влияе на мотивацията на бизнеса. Посланието е – „Колкото и да работиш, голям няма да станеш ако не ти позволим.”

Най-големия проблем от финансова гледна точка е поставянето в подчинение на получилите помощ финансови институции. Разбрате, че няма как просто да им дадат парите, без да има условия. Но всяко условие си е вид подчинение.
Интересно ми е дали и други банки биха „симулирали” фалит за да получат и те помощи.

Наивно е да си мислим, че централните банки не са знаели какво ще се случи, ако вдигнат лихвите и накарат търговските банки да преоценят активите си. Те много добре знаят какъв е портфейла на всяка подотчетна банка и как би повлияло това.

Въпросът е защо го направиха и защо сега?

Лично моето очакване е за още по-висока инфлация и лихви, което да доведе до условия за въвеждане на CBDCs – дигитални пари. Но това е друга тема и за последствията от тяхното въвеждане тепърва ще четете, а аз тепърва ще пиша.
През това време е редно всеки да помисли за спестяванията си и въобще за личните си финанси. Ще помогна с каквото мога, но всеки сам трябва да вземе решение какво да прави в тези условия. В тази ситуация няма после. После е инфлацията!

Ако статията Ви е харесала, помогнете да развием този блог като го споделите на стената си във ФБ. Благодаря Ви предварително.
Можете да се включите в дискусията в Telegram канала Kendov.com

За контакт
[contact-form-7]

The post Какво се случва с банките в момента, преведено на достъпен език appeared first on Kendov.com.

Cloudflare Access is the fastest Zero Trust proxy

Post Syndicated from David Tuber original https://blog.cloudflare.com/network-performance-update-security-week-2023/

Cloudflare Access is the fastest Zero Trust proxy

Cloudflare Access is the fastest Zero Trust proxy

During every Innovation Week, Cloudflare looks at our network’s performance versus our competitors. In past weeks, we’ve focused on how much faster we are compared to reverse proxies like Akamai, or platforms that sell serverless compute that compares to our Supercloud, like Fastly and AWS. This week, we’d like to provide an update on how we compare to other reverse proxies as well as an update to our application services security product comparison against Zscaler and Netskope. This product is part of our Zero Trust platform, which helps secure applications and Internet experiences out to the public Internet, as opposed to our reverse proxy which protects your websites from outside users.

In addition to our previous post showing how our Zero Trust platform compared against Zscaler, we also have previously shared extensive network benchmarking results for reverse proxies from 3,000 last mile networks around the world. It’s been a while since we’ve shown you our progress towards being #1 in every last mile network. We want to show that data as well as revisiting our series of tests comparing Cloudflare Access to Zscaler Private Access and Netskope Private Access. For our overall network tests, Cloudflare is #1 in 47% of the top 3,000 most reported networks. For our application security tests, Cloudflare is 50% faster than Zscaler and 75% faster than Netskope.

In this blog we’re going to talk about why performance matters for our products, do a deep dive on what we’re measuring to show that we’re faster, and we’ll talk about how we measured performance for each product.

Why does performance matter?

We talked about it in our last blog, but performance matters because it impacts your employees’ experience and their ability to get their job done. Whether it’s accessing services through access control products, connecting out to the public Internet through a Secure Web Gateway, or securing risky external sites through Remote Browser Isolation, all of these experiences need to be frictionless.

A quick summary: say Bob at Acme Corporation is connecting from Johannesburg out to Slack or Zoom to get some work done. If Acme’s Secure Web Gateway is located far away from Bob in London, then Bob’s traffic may go out of Johannesburg to London, and then back into Johannesburg to reach his email. If Bob tries to do something like a voice call on Slack or Zoom, his performance may be painfully slow as he waits for his emails to send and receive. Zoom and Slack both recommend low latency for optimal performance. That extra hop Bob has to take through his gateway could decrease throughput and increase his latency, giving Bob a bad experience.

As we’ve discussed before, if these products or experiences are slow, then something worse might happen than your users complaining: they may find ways to turn off the products or bypass them, which puts your company at risk. A Zero Trust product suite is completely ineffective if no one is using it because it’s slow. Ensuring Zero Trust is fast is critical to the effectiveness of a Zero Trust solution: employees won’t want to turn it off and put themselves at risk if they barely know it’s there at all.

Much like Zscaler, Netskope may outperform many older, antiquated solutions, but their network still fails to measure up to a highly performant, optimized network like Cloudflare’s. We’ve tested all of our Zero Trust products against Netskope equivalents, and we’re even bringing back Zscaler to show you how Zscaler compares against them as well. So let’s dig into the data and show you how and why we’re faster in a critical Zero Trust scenario, comparing Cloudflare Access to Zscaler Private Access and Netskope Private Access.

Cloudflare Access: the fastest Zero Trust proxy

Access control needs to be seamless and transparent to the user: the best compliment for a Zero Trust solution is employees barely notice it’s there. These services allow users to cache authentication information on the provider network, ensuring applications can be accessed securely and quickly to give users that seamless experience they want. So having a network that minimizes the number of logins required while also reducing the latency of your application requests will help keep your Internet experience snappy and reactive.

Cloudflare Access does all that 75% faster than Netskope and 50% faster than Zscaler, ensuring that no matter where you are in the world, you’ll get a fast, secure application experience:

Cloudflare Access is the fastest Zero Trust proxy

Cloudflare measured application access across ourselves, Zscaler and Netskope from 300 different locations around the world connecting to 6 distinct application servers in Hong Kong, Toronto, Johannesburg, São Paulo, Phoenix, and Switzerland. In each of these locations, Cloudflare’s P95 response time was faster than Zscaler and Netskope. Let’s take a look at the data when the application is hosted in Toronto, an area where Zscaler and Netskope should do well as it’s in a heavily interconnected region: North America.

Cloudflare Access is the fastest Zero Trust proxy

ZT Access – Response time (95th Percentile) – Toronto
95th Percentile Response (ms)
Cloudflare 2,182
Zscaler 4,071
Netskope 6,072

Cloudflare really stands out in regions with more diverse connectivity options like South America or Asia Pacific, where Zscaler compares better to Netskope than it does Cloudflare:

Cloudflare Access is the fastest Zero Trust proxy

When we look at application servers hosted locally in South America, Cloudflare stands out:

ZT Access – Response time (95th Percentile) – South America
95th Percentile Response (ms)
Cloudflare 2,961
Zscaler 9,271
Netskope 8,223

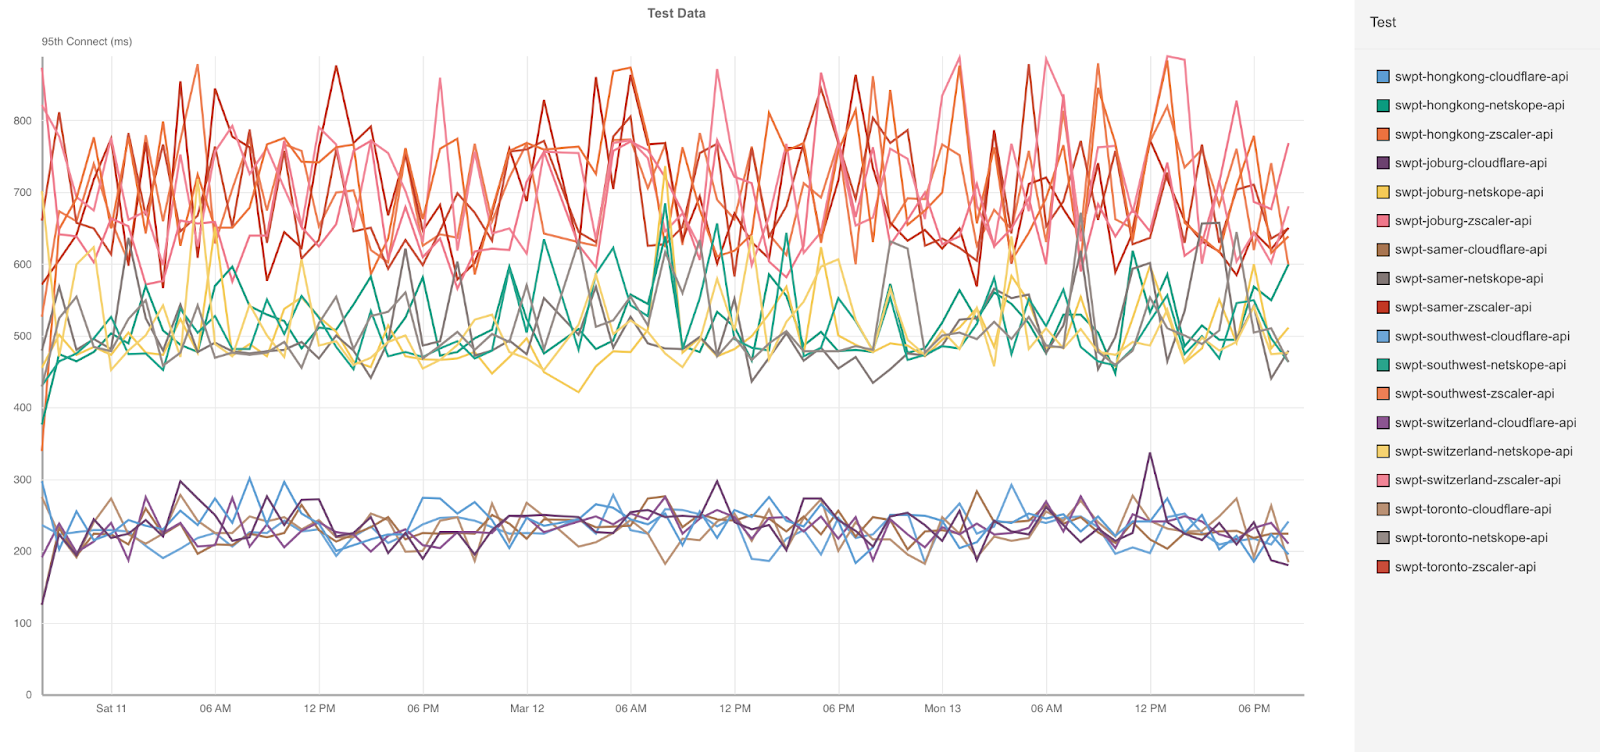
Cloudflare’s network shines here, allowing us to ingress connections close to the users. You can see this by looking at the Connect times in South America:

ZT Access – Connect time (95th Percentile) – South America
95th Percentile Connect (ms)
Cloudflare 369
Zscaler 1,753
Netskope 1,160

Cloudflare’s network sets us apart here because we’re able to get users onto our network faster and find the optimal routes around the world back to the application host. We’re twice as fast as Zscaler and three times faster than Netskope because of this superpower. Across all the different tests, Cloudflare’s Connect times is consistently faster across all 300 testing nodes.

Cloudflare Access is the fastest Zero Trust proxy

In our last blog, we looked at two distinct scenarios that need to be measured individually when we compared Cloudflare and Zscaler. The first scenario is when a user logs into their application and has to authenticate. In this case, the Zero Trust Access service will direct the user to a login page, the user will authenticate, and then be redirected to their application.

This is called a new session, because no authentication information is cached or exists on the Access network. The second scenario is called an existing session, when a user has already been authenticated and that authentication information can be cached. This scenario is usually much faster, because it doesn’t require an extra call to an identity provider to complete.

We like to measure these scenarios separately, because when we look at 95th percentile values, we would almost always be looking at new sessions if we combined new and existing sessions together. But across both scenarios, Cloudflare is consistently faster in every region. Let’s go back and look at an application hosted in Toronto, where users connecting to us connect faster than Zscaler and Netskope for both new and existing sessions.

ZT Access – Response Time (95th Percentile) – Toronto
New Sessions (ms) Existing Sessions (ms)
Cloudflare 1,276 1,022
Zscaler 2,415 1,797
Netskope 5,741 1,822

You can see that new sessions are generally slower as expected, but Cloudflare’s network and optimized software stack provides a consistently fast user experience. In scenarios where end-to-end connectivity can be more challenging, Cloudflare stands out even more. Let’s take a look at users in Asia connecting through to an application in Hong Kong.

ZT Access – Response Time (95th Percentile) – Hong Kong
New Sessions (ms) Existing Sessions (ms)
Cloudflare 2,582 2,075
Zscaler 4,956 3,617
Netskope 5,139 3,902

One interesting thing that stands out here is that while Cloudflare’s network is hyper-optimized for performance, Zscaler more closely compares to Netskope on performance than they do to Cloudflare. Netskope also performs poorly on new sessions, which indicates that their service does not react well when users are establishing new sessions.

We like to separate these new and existing sessions because it’s important to look at similar request paths to do a proper comparison. For example, if we’re comparing a request via Zscaler on an existing session and a request via Cloudflare on a new session, we could see that Cloudflare was much slower than Zscaler because of the need to authenticate. So when we contracted a third party to design these tests, we made sure that they took that into account.

For these tests, Cloudflare configured five application instances hosted in Toronto, Los Angeles, Sao Paulo, and Hong Kong. Cloudflare then used 300 different Catchpoint nodes from around the world to mimic a browser login as follows:

  • User connects to the application from a browser mimicked by a Catchpoint instance – new session
  • User authenticates against their identity provider
  • User accesses resource
  • User refreshes the browser page and tries to access the same resource but with credentials already present – existing session

This allows us to look at Cloudflare versus all the other products for application performance for both new and existing sessions, and we’ve shown that we’re faster. As we’ve mentioned, a lot of that is due to our network and how we get close to our users. So now we’re going to talk about how we compare to other large networks and how we get close to you.

Network effects make the user experience better

Getting closer to users improves the last mile Round Trip Time (RTT). As we discussed in the Access comparison, having a low RTT improves customer performance because new and existing sessions don’t have to travel very far to get to Cloudflare’s Zero Trust network. Embedding ourselves in these last mile networks helps us get closer to our users, which doesn’t just help Zero Trust performance, it helps web performance and developer performance, as we’ve discussed in prior blogs.

To quantify network performance, we have to get enough data from around the world, across all manner of different networks, comparing ourselves with other providers. We used Real User Measurements (RUM) to fetch a 100kb file from several different providers. Users around the world report the performance of different providers. The more users who report the data, the higher fidelity the signal is. The goal is to provide an accurate picture of where different providers are faster, and more importantly, where Cloudflare can improve. You can read more about the methodology in the original Speed Week 2021 blog post here.

We are constantly going through the process of figuring out why we were slow — and then improving. The challenges we faced were unique to each network and highlighted a variety of different issues that are prevalent on the Internet. We’re going to provide an overview of some of the efforts we use to improve our performance for our users.

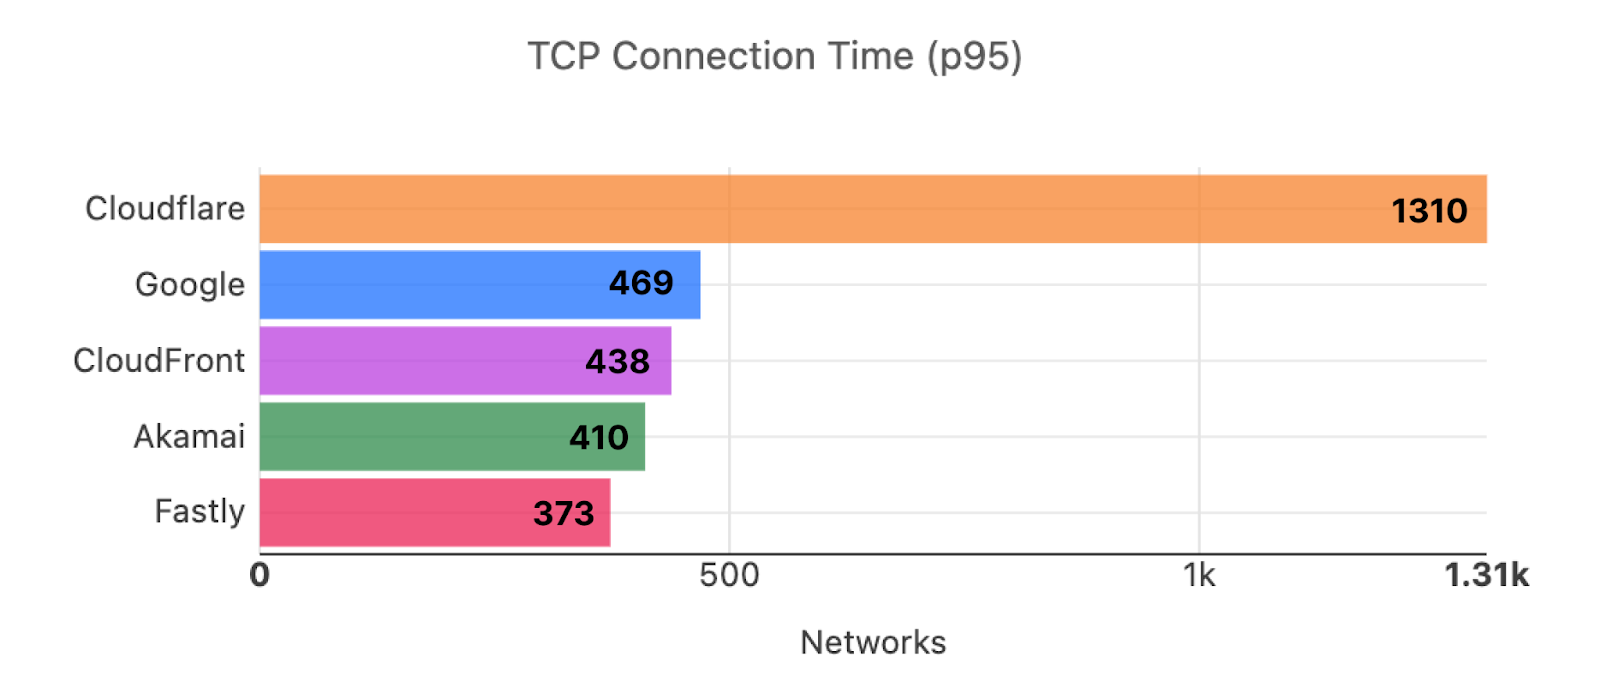
But before we do, here are the results of our efforts since Developer Week 2022, the last time we showed off these numbers. Out of the top 3,000 networks in the world (by number of IPv4 addresses advertised), here’s a breakdown of the number of networks where each provider is number one in p95 TCP Connection Time, which represents the time it takes for a user on a given network to connect to the provider:

Cloudflare Access is the fastest Zero Trust proxy

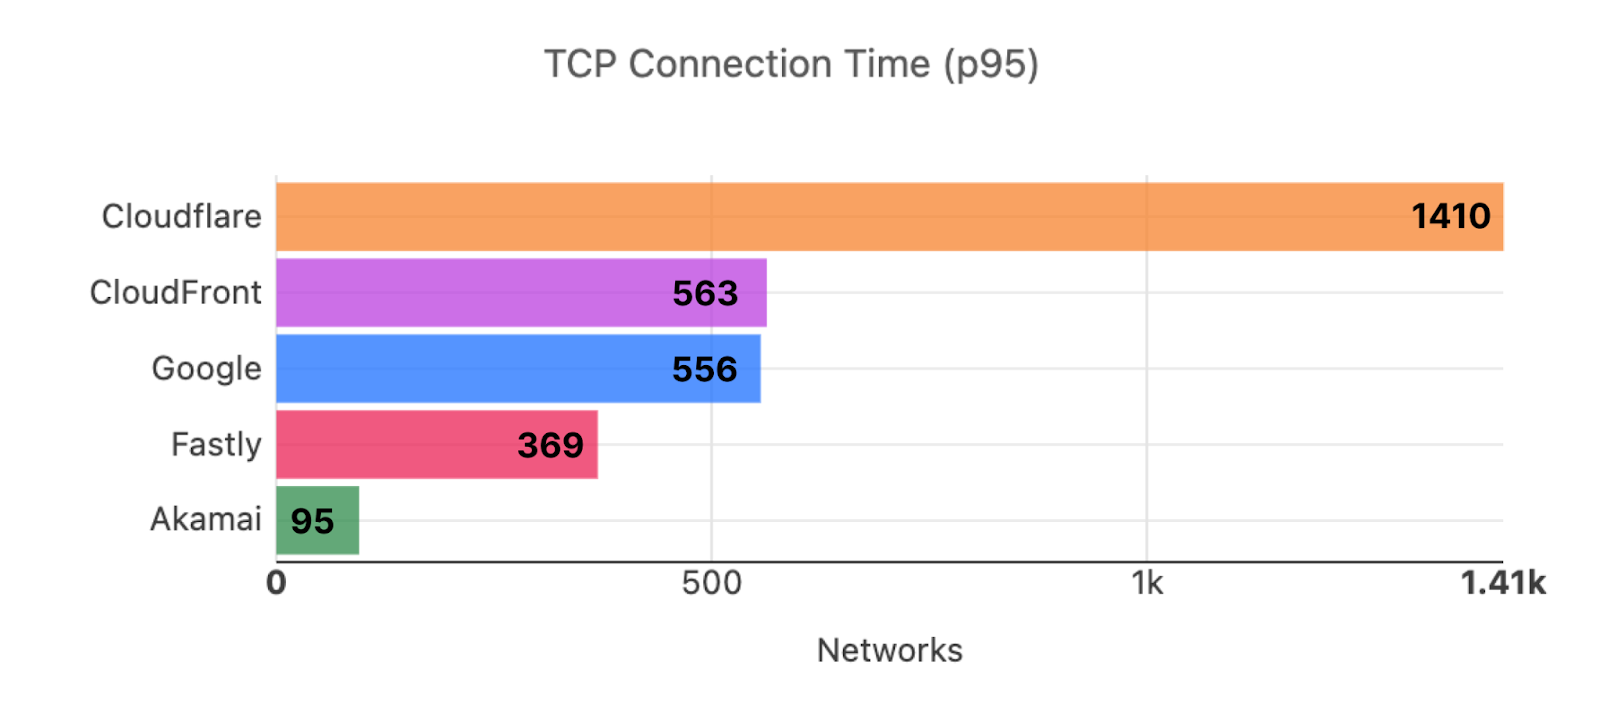
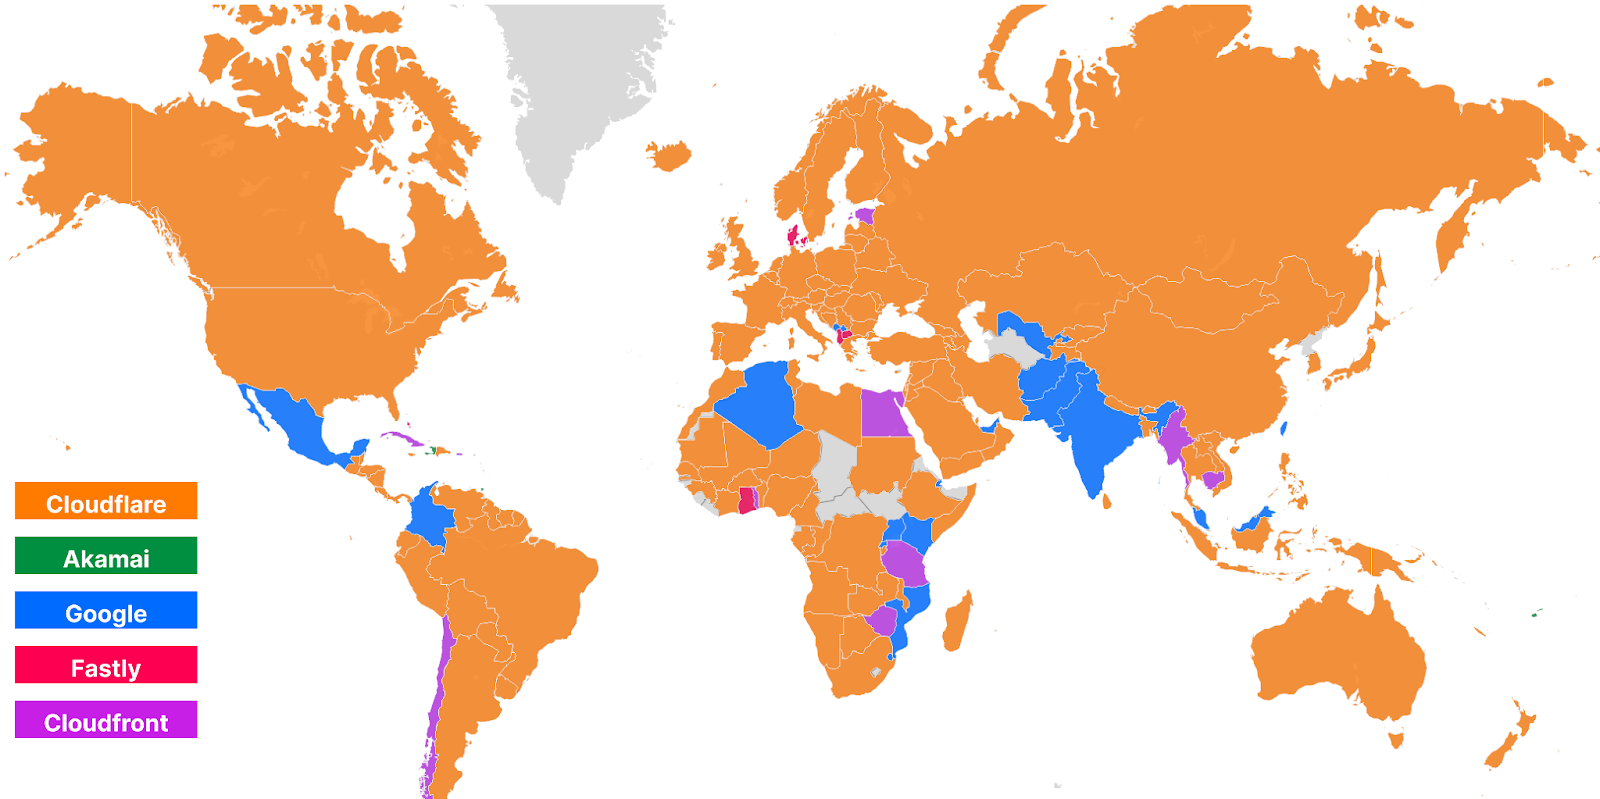
Here’s what those numbers look like as of this week, Security Week 2023:

Cloudflare Access is the fastest Zero Trust proxy

As you can see, Cloudflare has extended its lead in being faster in more networks, while other networks that previously were faster like Akamai and Fastly lost their lead. This translates to the effects we see on the World Map. Here’s what that world map looked like in Developer Week 2022:

Cloudflare Access is the fastest Zero Trust proxy

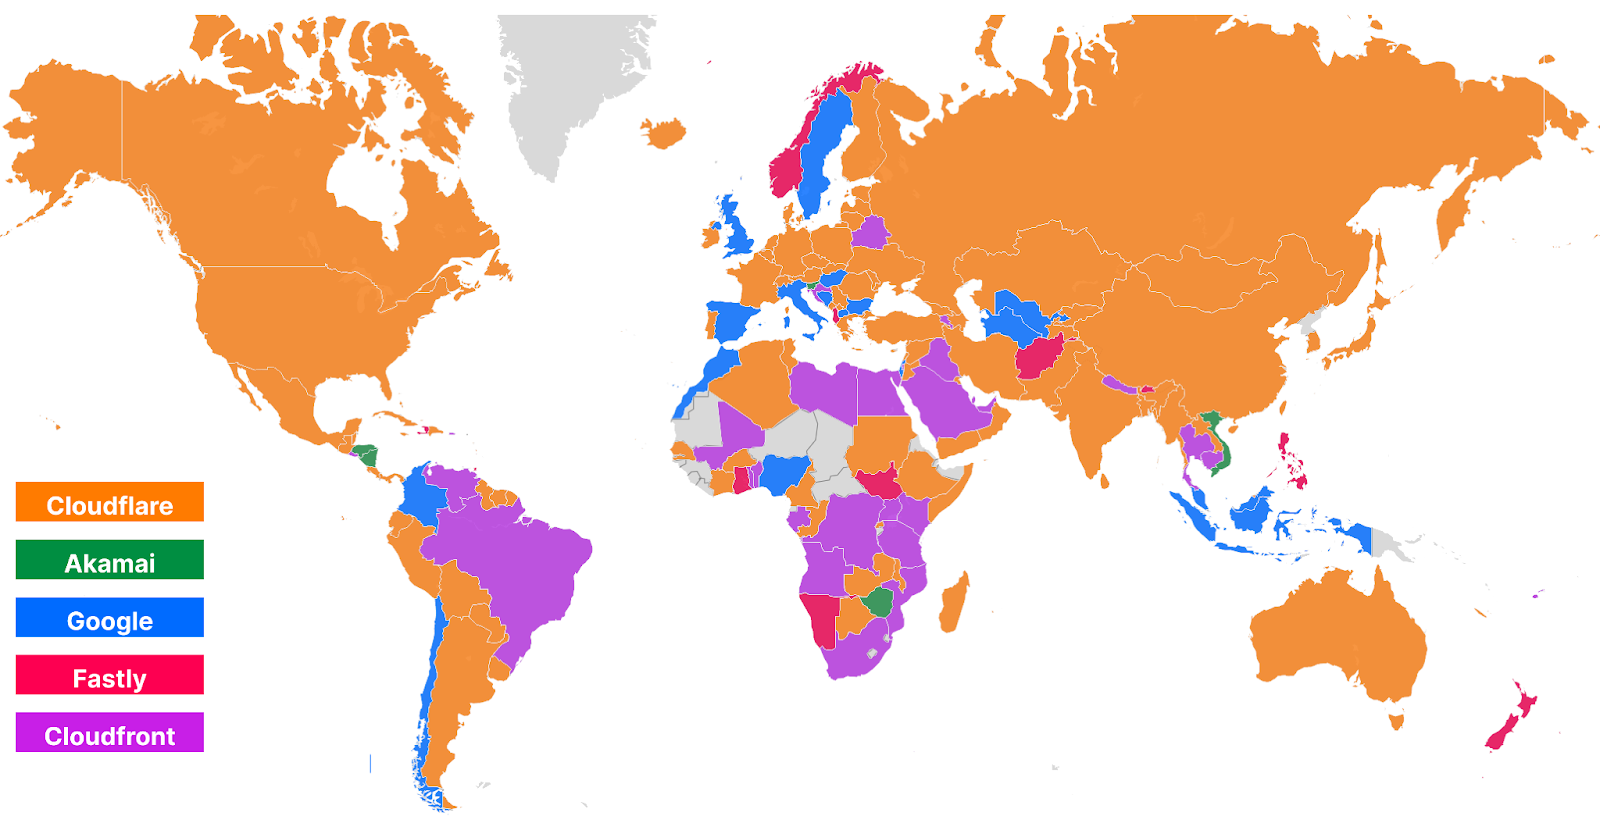
Here’s how that world map looks today during Security Week 2023:

Cloudflare Access is the fastest Zero Trust proxy

As you can see, Cloudflare has gotten faster in Brazil, many countries in Africa including South Africa, Ethiopia, and Nigeria, as well as Indonesia in Asia, and Norway, Sweden, and the UK in Europe.

A lot of these countries benefited from the Edge Partner Program that we discussed in the Impact Week blog. A quick refresher: the Edge Partner Program encourages last mile ISPs to partner with Cloudflare to deploy Cloudflare locations that are embedded in the last mile ISP. This improves the last mile RTT and improves performance for things like Access. Since we last showed you this map, Cloudflare has deployed more partner locations in places like Nigeria, and Saudi Arabia, which have improved performance for users in all scenarios. Efforts like the Edge Partner Program help improve not just the Zero Trust scenarios like we described above, but also the general web browsing experience for end users who use websites protected by Cloudflare.

Next-generation performance in a Zero Trust world

In a non-Zero Trust world, you and your IT teams were the network operator — which gave you the ability to control performance. While this control was comforting, it was also a huge burden on your IT teams who had to manage middle mile connections between offices and resources. But in a Zero Trust world, your network is now… well, it’s the public Internet. This means less work for your teams — but a lot more responsibility on your Zero Trust provider, which has to manage performance for every single one of your users. The better your Zero Trust provider is at improving end-to-end performance, the better an experience your users will have and the less risk you expose yourself to. For real-time applications like authentication and secure web gateways, having a snappy user experience is critical.

A Zero Trust provider needs to not only secure your users on the public Internet, but it also needs to optimize the public Internet to make sure that your users continuously stay protected. Moving to Zero Trust doesn’t just reduce the need for corporate networks, it also allows user traffic to flow to resources more naturally. However, given your Zero Trust provider is going to be the gatekeeper for all your users and all your applications, performance is a critical aspect to evaluate to reduce friction for your users and reduce the likelihood that users will complain, be less productive, or turn the solutions off. Cloudflare is constantly improving our network to ensure that users always have the best experience, through programs like the Edge Partner Program and constantly improving our peering and interconnectivity. It’s this tireless effort that makes us the fastest Zero Trust provider.

[$] Generic iterators for BPF

Post Syndicated from original https://lwn.net/Articles/926041/

BPF programs destined to be loaded into the kernel are generally written in
C but, increasingly, the environment in which those programs run differs
significantly from the C environment. The BPF virtual machine and
associated verifier make a growing set of checks in an attempt to make BPF
code safe to run. The proposed addition of an iterator mechanism to BPF
highlights the kind of features that are being added — as well as the
constraints placed on programmers by BPF.

Introducing custom pages for Cloudflare Access

Post Syndicated from Kenny Johnson original https://blog.cloudflare.com/access-custom-pages/

Introducing custom pages for Cloudflare Access

Introducing custom pages for Cloudflare Access

Over 10,000 organizations rely on Cloudflare Access to connect their employees, partners, and contractors to the applications they need. From small teams on our free plan to some of the world’s largest enterprises, Cloudflare Access is the Zero Trust front door to how they work together. As more users start their day with Cloudflare Access, we’re excited to announce new options to customize how those users experience our industry-leading Zero Trust solution. We’re excited to announce customizable Cloudflare Access pages including login, blocks and the application launcher.

Where does Cloudflare Access fit in a user’s workflow today?

Most teams we work with start their Zero Trust journey by replacing their existing virtual private network (VPN) with Cloudflare Access. The reasons vary. For some teams, their existing VPN allows too much trust by default and Access allows them to quickly build segmentation based on identity, device posture, and other factors. Other organizations deploy Cloudflare Access because they are exhausted from trying to maintain their VPN and dealing with end user complaints.

When those administrators begin setting up Cloudflare Access, they connect the resources they need to protect to Cloudflare’s network. They can deploy a Cloudflare Tunnel to create a secure, outbound-only, connection to Cloudflare, rely on our existing DNS infrastructure, or even force SaaS application logins through our network. Administrators can then layer on granular Zero Trust rules to determine who can reach a given resource.

To the end user, Cloudflare Access is just a security guard checking for identity, device posture, or other signals at every door. In most cases they should never need to think about us. Instead, they just enjoy a much faster experience with less hassle. When they attempt to reach an application or service, we check each and every request and connection for proof that they should be allowed.

When they do notice Cloudflare Access, they interact with screens that help them make a decision about what they need. In these cases we don’t just want to be a silent security guard – we want to be a helpful tour guide.

Introducing custom pages for Cloudflare Access

Cloudflare Access supports the ability for administrators to configure multiple identity providers simultaneously. Customers love this capability when they work with contractors or acquired teams. We can also configure this only for certain applications. When users arrive, though, we need to know which direction to send them for their initial authentication. We present this selection screen, along with guiding text provided by the administrator, to the user.

Introducing custom pages for Cloudflare Access

When teams move their applications behind Cloudflare Access, we become the front door to how they work. We use that position to present the user with all of the applications they can reach in a portal that allows them to click on any tile to launch the application.

Introducing custom pages for Cloudflare Access

In some cases, the user lacks sufficient permissions to reach the destination. Even though they are being blocked we still want to reduce confusion. Instead of just presenting a generic browser error or dropping a connection, we display a block page.

Why do these need to change?

More and more large enterprises are starting to adopt a Zero Trust VPN replacement and they’re selecting Cloudflare to do so. Unlike small teams that can send a short Slack message about an upcoming change to their employee workflow, some of the CIOs and CSOs that deploy Access need to anticipate questions and curiosity from tens of thousands of employees and contractors.

Those users do not know what Cloudflare is and we don’t need them to. Instead, we just want to securely connect them to the tools they need. To solve that, we need to give IT administrators more space to communicate and we need to get our branding out of the way.

What will I be able to customize?

Following the release of Access page customization, administrators will be able to customize: the login screen, access denied errors and the Access Application Launcher.

What’s next?

We are building page customization in Cloudflare Access following the existing template our reverse proxy customers can use to modify pages presented to end users. We’re excited to bring that standard experience to these workflows as well.

Even though we’re building on that pattern, we still want your feedback. Ahead of a closed beta we are looking for customers who want to provide input as we fine tune this new configuration option. Interested in helping shape this work? Let us know here.

Cloudflare partners with KnowBe4 to equip organizations with real-time security coaching to avoid phishing attacks

Post Syndicated from Ayush Kumar original https://blog.cloudflare.com/knowbe4-emailsecurity-integration/

Cloudflare partners with KnowBe4 to equip organizations with real-time security coaching to avoid phishing attacks

Cloudflare partners with KnowBe4 to equip organizations with real-time security coaching to avoid phishing attacks

Today, we are very excited to announce that Cloudflare’s cloud email security solution, Area 1, now integrates with KnowBe4, a leading security awareness training and simulated phishing platform. This integration allows mutual customers to offer real-time coaching to their employees when a phishing campaign is detected by Cloudflare’s email security solution.

We are all aware that phishing attacks often use email as a vector to deliver the fraudulent message. Cybercriminals use a range of tactics, such as posing as a trustworthy organization, using urgent or threatening language, or creating a sense of urgency to entice the recipient to click on a link or download an attachment.

Despite the increasing sophistication of these attacks and the solutions to stop them, human error remains the weakest link in this chain of events. This is because humans can be easily manipulated or deceived, especially when they are distracted or rushed. For example, an employee might accidentally click on a link in an email that looks legitimate but is actually a phishing attempt, or they might enter their password into a fake login page without realizing it. According to the 2021 Verizon Data Breach Investigations Report, phishing was the most common form of social engineering attack, accounting for 36% of all breaches. The report also noted that 85% of all breaches involved a human element, such as human error or social engineering.

Therefore, it is essential to educate and train individuals on how to recognize and avoid phishing attacks. This includes raising awareness of common phishing tactics and training individuals to scrutinize emails carefully before clicking on any links or downloading attachments.

Area1 integrates with KnowBe4

Our integration allows for the seamless integration of Cloudflare’s advanced email security capabilities with KnowBe4’s Security Awareness Training platform, KSMAT, and its real-time coaching product, SecurityCoach. This means that organizations using both products can now benefit from an added layer of security that detects and prevents email-based threats in real-time while also training employees to recognize and avoid such threats.

Organizations can offer real-time security coaching to their employees whenever our email security solution detects four types of events: malicious attachments, malicious links, spoofed emails, and suspicious emails. IT or security professionals can configure their real-time coaching campaigns to immediately deliver relevant training to their users related to a detected event.

“KnowBe4 is proud to partner with Cloudflare to provide a seamless integration with our new SecurityCoach product, which aims to deliver real-time security coaching and advice to help end users enhance their cybersecurity knowledge and strengthen their role in contributing to a strong security culture. KnowBe4 is actively working with Cloudflare to provide an API-based integration to connect our platform with systems that IT/security professionals already utilize, making rolling out new products to their teams an easy and unified process.”
– Stu Sjouwerman, CEO, KnowBe4

By using the integration, organizations can ensure that their employees are not only protected by advanced security technology that detects and blocks malicious emails, but are also educated on how to identify and avoid these threats. This has been a commonly demanded feature from our customers and we have made it simple for them to implement it.

How it works

Create private key and public key in the Area 1 dashboard

Before you can set up this integration in your KnowBe4 (KMSAT) console, you will need to create a private key and public key with Cloudflare.

  • Log in to your Cloudflare Area 1 email security console as an admin.
  • Click the gear icon in the top-right corner of the page, and then navigate to the Service Accounts tab.
Cloudflare partners with KnowBe4 to equip organizations with real-time security coaching to avoid phishing attacks
  • Click + Add Service Account.
Cloudflare partners with KnowBe4 to equip organizations with real-time security coaching to avoid phishing attacks
  • In the NAME field, enter a name for your new service account.
Cloudflare partners with KnowBe4 to equip organizations with real-time security coaching to avoid phishing attacks
  • Click + Create Service Account.
  • In the pop-up window that opens, copy and save the private key somewhere that you can easily access. You will need this key to complete the setup process in the Set Up the Integration in your KnowBe4 (KMSAT) Console section below.
Cloudflare partners with KnowBe4 to equip organizations with real-time security coaching to avoid phishing attacks

Set up the integration in your KnowBe4 (KMSAT) Console

Once you have created a private key and public key in your Cloudflare Area 1 email security console, you can set up the integration in your KMSAT console. To register Cloudflare Area 1 email security with SecurityCoach in your KMSAT console, follow the steps below:

  • Log in to your KMSAT console and navigate to SecurityCoach > Setup > Security Vendor Integrations.
  • Locate Cloudflare Area 1 Email Security and click Configure.
Cloudflare partners with KnowBe4 to equip organizations with real-time security coaching to avoid phishing attacks
  • Enter the Public Key and Private Key that you saved in the ‘Create your private Key and public key’ section above.
Cloudflare partners with KnowBe4 to equip organizations with real-time security coaching to avoid phishing attacks
  • Click authorize. Once you’ve successfully authorized this integration, you can manage detection rules for Cloudflare Area 1 on the ‘Detection rules subtab’ of SecurityCoach.

SecurityCoach in action

Now that the SecurityCoach is set up, users within your organization will receive messages if Area 1 finds that a malicious email was sent to them. An example one can be seen below.

Cloudflare partners with KnowBe4 to equip organizations with real-time security coaching to avoid phishing attacks

This message not only alerts the user to be more scrutinous about emails they are receiving, since they now know they are being actively targeted, but also provides them with followup steps that they can take to ensure their account is as safe as possible. The image and text that shows up in the email can be configured from the KnowBe4 console giving customers full flexibility on what to communicate with their employees.

Cloudflare partners with KnowBe4 to equip organizations with real-time security coaching to avoid phishing attacks

What’s next

We’ll be expanding this integration with KnowBe4 to our other Zero Trust products in the coming months. If you have any questions or feedback on this integration, please contact your account team at Cloudflare. We’re excited to continue closely working with technology partners to expand existing and create new integrations that help customers on their Zero Trust journey.

How we built DMARC Management using Cloudflare Workers

Post Syndicated from André Cruz original https://blog.cloudflare.com/how-we-built-dmarc-management/

How we built DMARC Management using Cloudflare Workers

What are DMARC reports

How we built DMARC Management using Cloudflare Workers

DMARC stands for Domain-based Message Authentication, Reporting, and Conformance. It’s an email authentication protocol that helps protect against email phishing and spoofing.

When an email is sent, DMARC allows the domain owner to set up a DNS record that specifies which authentication methods, such as SPF (Sender Policy Framework) and DKIM (DomainKeys Identified Mail), are used to verify the email’s authenticity. When the email fails these authentication checks DMARC instructs the recipient’s email provider on how to handle the message, either by quarantining it or rejecting it outright.

DMARC has become increasingly important in today’s Internet, where email phishing and spoofing attacks are becoming more sophisticated and prevalent. By implementing DMARC, domain owners can protect their brand and their customers from the negative impacts of these attacks, including loss of trust, reputation damage, and financial loss.

In addition to protecting against phishing and spoofing attacks, DMARC also provides reporting capabilities. Domain owners can receive reports on email authentication activity, including which messages passed and failed DMARC checks, as well as where these messages originated from.

DMARC management involves the configuration and maintenance of DMARC policies for a domain. Effective DMARC management requires ongoing monitoring and analysis of email authentication activity, as well as the ability to make adjustments and updates to DMARC policies as needed.

Some key components of effective DMARC management include:

  • Setting up DMARC policies: This involves configuring the domain’s DMARC record to specify the appropriate authentication methods and policies for handling messages that fail authentication checks. Here’s what a DMARC DNS record looks like:

v=DMARC1; p=reject; rua=mailto:[email protected]

This specifies that we are going to use DMARC version 1, our policy is to reject emails if they fail the DMARC checks, and the email address to which providers should send DMARC reports.

  • Monitoring email authentication activity: DMARC reports are an important tool for domain owners to ensure email security and deliverability, as well as compliance with industry standards and regulations. By regularly monitoring and analyzing DMARC reports, domain owners can identify email threats, optimize email campaigns, and improve overall email authentication.
  • Making adjustments as needed: Based on analysis of DMARC reports, domain owners may need to make adjustments to DMARC policies or authentication methods to ensure that email messages are properly authenticated and protected from phishing and spoofing attacks.
  • Working with email providers and third-party vendors: Effective DMARC management may require collaboration with email providers and third-party vendors to ensure that DMARC policies are being properly implemented and enforced.

Today we launched DMARC management. This is how we built it.

How we built it

As a leading provider of cloud-based security and performance solutions, we at Cloudflare take a specific approach to test our products. We “dogfood” our own tools and services, which means we use them to run our business. This helps us identify any issues or bugs before they affect our customers.

We use our own products internally, such as Cloudflare Workers, a serverless platform that allows developers to run their code on our global network. Since its launch in 2017, the Workers ecosystem has grown significantly. Today, there are thousands of developers building and deploying applications on the platform. The power of the Workers ecosystem lies in its ability to enable developers to build sophisticated applications that were previously impossible or impractical to run so close to clients. Workers can be used to build APIs, generate dynamic content, optimize images, perform real-time processing, and much more. The possibilities are virtually endless. We used Workers to power services like Radar 2.0, or software packages like Wildebeest.

Recently our Email Routing product joined forces with Workers, enabling processing incoming emails via Workers scripts. As the documentation states: “With Email Workers you can leverage the power of Cloudflare Workers to implement any logic you need to process your emails and create complex rules. These rules determine what happens when you receive an email.” Rules and verified addresses can all be configured via our API.

Here’s how a simple Email Worker looks like:

export default {
  async email(message, env, ctx) {
    const allowList = ["[email protected]", "[email protected]"];
    if (allowList.indexOf(message.headers.get("from")) == -1) {
      message.setReject("Address not allowed");
    } else {
      await message.forward("inbox@corp");
    }
  }
}

Pretty straightforward, right?

With the ability to programmatically process incoming emails in place, it seemed like the perfect way to handle incoming DMARC report emails in a scalable and efficient manner, letting Email Routing and Workers do the heavy lifting of receiving an unbound number of emails from across the globe. A high level description of what we needed is:

  1. Receive email and extract report
  2. Publish relevant details to analytics platform
  3. Store the raw report

Email Workers enable us to do #1 easily. We just need to create a worker with an email() handler. This handler will receive the SMTP envelope elements, a pre-parsed version of the email headers, and a stream to read the entire raw email.

For #2 we can also look into the Workers platform, and we will find the Workers Analytics Engine. We just need to define an appropriate schema, which depends both on what’s present in the reports and the queries we plan to do later. Afterwards we can query the data using either the GraphQL or SQL API.

For #3 we don’t need to look further than our R2 object storage. It is trivial to access R2 from a Worker. After extracting the reports from the email we will store them in R2 for posterity.

We built this as a managed service that you can enable on your zone, and added a dashboard interface for convenience, but in reality all the tools are available for you to deploy your own DMARC reports processor on top of Cloudflare Workers, in your own account, without having to worry about servers, scalability or performance.

Architecture

How we built DMARC Management using Cloudflare Workers

Email Workers is a feature of our Email Routing product. The Email Routing component runs in all our nodes, so any one of them is able to process incoming mail, which is important because we announce the Email ingress BGP prefix from all our datacenters. Sending emails to an Email Worker is as easy as setting a rule in the Email Routing dashboard.

How we built DMARC Management using Cloudflare Workers

When the Email Routing component receives an email that matches a rule to be delivered to a Worker, it will contact our internal version of the recently open-sourced workerd runtime, which also runs on all nodes. The RPC schema that governs this interaction is defined in a Capnproto schema, and allows the body of the email to be streamed to Edgeworker as it’s read. If the worker script decides to forward this email, Edgeworker will contact Email Routing using a capability sent in the original request.

jsg::Promise<void> ForwardableEmailMessage::forward(kj::String rcptTo, jsg::Optional<jsg::Ref<Headers>> maybeHeaders) {
  auto req = emailFwdr->forwardEmailRequest();
  req.setRcptTo(rcptTo);

  auto sendP = req.send().then(
      [](capnp::Response<rpc::EmailMetadata::EmailFwdr::ForwardEmailResults> res) mutable {
    auto result = res.getResponse().getResult();
    JSG_REQUIRE(result.isOk(), Error, result.getError());
  });
  auto& context = IoContext::current();
  return context.awaitIo(kj::mv(sendP));
}

In the context of DMARC reports this is how we handle the incoming emails:

  1. Fetch the recipient of the email being processed, this is the RUA that was used. RUA is a DMARC configuration parameter that indicates where aggregate DMARC processing feedback should be reported pertaining to a certain domain. This recipient can be found in the “to” attribute of the message.
const ruaID = message.to
  1. Since we handle DMARC reports for an unbounded number of domains, we use Workers KV to store some information about each one and key this information on the RUA. This also lets us know if we should be receiving these reports.
const accountInfoRaw = await env.KV_DMARC_REPORTS.get(dmarc:${ruaID})
  1. At this point, we want to read the entire email into an arrayBuffer in order to parse it. Depending on the size of the report we may run into the limits of the free Workers plan. If this happens, we recommend that you switch to the Workers Unbound resource model which does not have this issue.
const rawEmail = new Response(message.raw)
const arrayBuffer = await rawEmail.arrayBuffer()
  1. Parsing the raw email involves, among other things, parsing its MIME parts. There are multiple libraries available that allow one to do this. For example, you could use postal-mime:
const parser = new PostalMime.default()
const email = await parser.parse(arrayBuffer)
  1. Having parsed the email we now have access to its attachments. These attachments are the DMARC reports themselves and they can be compressed. The first thing we want to do is store them in their compressed form in R2 for long-term storage. They can be useful later on for re-processing or investigating interesting reports. Doing this is as simple as calling put() on the R2 binding. In order to facilitate retrieval later we recommend that you spread the report files across directories based on the current time.
await env.R2_DMARC_REPORTS.put(
    `${date.getUTCFullYear()}/${date.getUTCMonth() + 1}/${attachment.filename}`,
    attachment.content
  )
  1. We now need to look into the attachment mime type. The raw form of DMARC reports is XML, but they can be compressed. In this case we need to decompress them first. DMARC reporter files can use multiple compression algorithms. We use the MIME type to know which one to use. For Zlib compressed reports pako can be used while for ZIP compressed reports unzipit is a good choice.

  2. Having obtained the raw XML form of the report, fast-xml-parser has worked well for us in parsing them. Here’s how the DMARC report XML looks:

<feedback>
  <report_metadata>
    <org_name>example.com</org_name>
    <[email protected]</email>
   <extra_contact_info>http://example.com/dmarc/support</extra_contact_info>
    <report_id>9391651994964116463</report_id>
    <date_range>
      <begin>1335521200</begin>
      <end>1335652599</end>
    </date_range>
  </report_metadata>
  <policy_published>
    <domain>business.example</domain>
    <adkim>r</adkim>
    <aspf>r</aspf>
    <p>none</p>
    <sp>none</sp>
    <pct>100</pct>
  </policy_published>
  <record>
    <row>
      <source_ip>192.0.2.1</source_ip>
      <count>2</count>
      <policy_evaluated>
        <disposition>none</disposition>
        <dkim>fail</dkim>
        <spf>pass</spf>
      </policy_evaluated>
    </row>
    <identifiers>
      <header_from>business.example</header_from>
    </identifiers>
    <auth_results>
      <dkim>
        <domain>business.example</domain>
        <result>fail</result>
        <human_result></human_result>
      </dkim>
      <spf>
        <domain>business.example</domain>
        <result>pass</result>
      </spf>
    </auth_results>
  </record>
</feedback>
  1. We now have all the data in the report at our fingertips. What we do from here on depends a lot on how we want to present the data. For us, the goal was to display meaningful data extracted from them in our Dashboard. Therefore we needed an Analytics platform where we could push the enriched data. Enter, Workers Analytics Engine. The Analytics engine is perfect for this task since it allows us to send data to it from a worker, and exposes a GraphQL API to interact with the data afterwards. This is how we obtain the data to show in our dashboard.

In the future, we are also considering integrating Queues in the workflow to asynchronously process the report and avoid waiting for the client to complete it.

We managed to implement this project end-to-end relying only on the Workers infrastructure, proving that it’s possible, and advantageous, to build non-trivial apps without having to worry about scalability, performance, storage and security issues.

Open sourcing

As we mentioned before, we built a managed service that you can enable and use, and we will manage it for you. But, everything we did can also be deployed by you, in your account, so that you can manage your own DMARC reports. It’s easy, and free. To help you with that, we are releasing an open-source version of a Worker that processes DMARC reports in the way described above: https://github.com/cloudflare/dmarc-email-worker

If you don’t have a dashboard where to show the data, you can also query the Analytics Engine from a Worker. Or, if you want to store them in a relational database, then there’s D1 to the rescue. The possibilities are endless and we are excited to find out what you’ll build with these tools.

Please contribute, make your own, we’ll be listening.

Final words

We hope that this post has furthered your understanding of the Workers platform. Today Cloudflare takes advantage of this platform to build most of our services, and we think you should too.

Feel free to contribute to our open-source version and show us what you can do with it.

The Email Routing is also working on expanding the Email Workers API more functionally, but that deserves another blog soon.

Stop brand impersonation with Cloudflare DMARC Management

Post Syndicated from Joao Sousa Botto original https://blog.cloudflare.com/dmarc-management/

Stop brand impersonation with Cloudflare DMARC Management

Stop brand impersonation with Cloudflare DMARC Management

At the end of 2021 Cloudflare launched Security Center, a unified solution that brings together our suite of security products and unique Internet intelligence. It enables security teams to quickly identify potential security risks and threats to their organizations, map their attack surface and mitigate these risks with just a few clicks. While Security Center initially focused on application security, we are now adding crucial zero trust insights to further enhance its capabilities.

When your brand is loved and trusted, customers and prospects are looking forward to the emails you send them. Now picture them receiving an email from you: it has your brand, the subject is exciting, it has a link to register for something unique — how can they resist that opportunity?

But what if that email didn’t come from you? What if clicking on that link is a scam that takes them down the path of fraud or identity theft? And what if they think you did it? The truth is, even security minded people occasionally fall for well crafted spoof emails.

That poses a risk to your business and reputation. A risk you don’t want to take – no one does. Brand impersonation is a significant problem for organizations globally, and that’s why we’ve built DMARC Management – available in Beta today.

With DMARC Management you have full insight on who is sending emails on your behalf. You can one-click approve each source that is a legitimate sender for your domain, and then set your DMARC policy to reject any emails sent from unapproved clients.

Stop brand impersonation with Cloudflare DMARC Management

When the survey platform your company uses is sending emails from your domain, there’s nothing to worry about – you configured it that way. But if an unknown mail service from a remote country is sending emails using your domain that can be quite scary, and something you’ll want to address. Let’s see how.

Anti-spoofing mechanisms

Sender Policy Framework (SPF), DomainKeys Identified Mail (DKIM) and Domain-based Message Authentication Reporting and Conformance (DMARC) are three common email authentication methods. Together, they help prevent spammers, phishers, and other unauthorized parties from sending emails on behalf of a domain they do not own.

SPF is a way for a domain to list all the servers the company sends emails from. Think of it like a publicly available employee directory that helps someone to confirm if an employee works for an organization. SPF records list all the IP addresses of all the servers that are allowed to send emails from the domain.

DKIM enables domain owners to automatically “sign” emails from their domain. Specifically, DKIM uses public key cryptography:

  1. A DKIM record stores the domain’s public key, and mail servers receiving emails from the domain can check this record to obtain the public key.
  2. The private key is kept secret by the sender, who signs the email’s header with this key.
  3. Mail servers receiving the email can verify that the sender’s private key was used by applying the public key. This also guarantees that the email was not tampered with while in transit.

DMARC tells a receiving email server what to do after evaluating the SPF and DKIM results. A domain’s DMARC policy can be set in a variety of ways — it can instruct mail servers to quarantine emails that fail SPF or DKIM (or both), to reject such emails, or to deliver them.

It’s not trivial to configure and maintain SPF and DMARC, though. If your configuration is too strict, legitimate emails will be dropped or marked as spam. If it’s too relaxed, your domain might be misused for email spoofing. The proof is that these authentication mechanisms (SPF / DKIM / DMARC) have existed for over 10 years and still, there are still less than 6 million active DMARC records.

DMARC reports can help, and a full solution like DMARC Management reduces the burden of creating and maintaining a proper configuration.

DMARC reports

All DMARC-compliant mailbox providers support sending DMARC aggregated reports to an email address of your choice. Those reports list the services that have sent emails from your domain and the percentage of messages that passed DMARC, SPF and DKIM. They are extremely important because they give administrators the information they need to decide how to adjust their DMARC policies — for instance, that’s how administrators know if their legitimate emails are failing SPF and DKIM, or if a spammer is trying to send illegitimate emails.

Stop brand impersonation with Cloudflare DMARC Management

But beware, you probably don’t want to send DMARC reports to a human-monitored email address, as these come in fast and furious from virtually every email provider your organization sends messages to, and are delivered in XML format. Typically, administrators set up reports to be sent to a service like our DMARC Management, that boils them down to a more digestible form. Note: These reports do not contain personal identifiable information (PII).

DMARC Management automatically creates an email address for those reports to be sent to, and adds the corresponding RUA record to your Cloudflare DNS to announce to mailbox providers where to send reports to. And yes, if you’re curious, these email addresses are being created using Cloudflare Email Routing.

Note: Today, Cloudflare DNS is a requirement for DMARC Management. Cloudflare Area 1 customers will soon also be able to see DMARC reports even if they’re using third-party DNS services.

Stop brand impersonation with Cloudflare DMARC Management

As reports are received in this dedicated email address, they are processed by a Worker that extracts the relevant data, parses it and sends it over to our analytics solution. And you guessed again, that’s implemented using Email Workers. You can read more about the technical implementation here.

Taking action

Now that reports are coming in, you can review the data and take action.

Note: It may take up to 24 hours for mailbox providers to start sending reports and for these analytics to be available to you.

At the top of DMARC Management you have an at-a-glance view of the outbound security configuration for your domain, more specifically DMARC, DKIM, and SPF. DMARC Management will soon start reporting on inbound email security as well, which includes STARTTLS, MTA-STS, DANE, and TLS reporting.

Stop brand impersonation with Cloudflare DMARC Management

The middle section shows the email volume over time, with individual lines showing those that pass DMARC and those that fail.

Stop brand impersonation with Cloudflare DMARC Management

Below, you have additional details that include the number of email messages sent by each source (per the DMARC reports), and the corresponding DMARC, SPF and DKIM statistics. You can approve (that is, include in SPF) any of these sources by clicking on “…”, and you can easily spot applications that may not have DKIM correctly configured.

Stop brand impersonation with Cloudflare DMARC Management

Clicking on any source gives you the same DMARC, SPF and DKIM statistics per IP address of that source. This is how you identify if there’s an additional IP address you might need to include in your SPF record, for example.

Stop brand impersonation with Cloudflare DMARC Management

The ones that fail are the ones you’ll want to take action on, as they will need to either be approved (which technically means including in the SPF record) if legitimate, or stay unapproved and be rejected by the receiving server when the DMARC policy is configured with p=reject.

Getting to a DMARC reject policy is the goal, but you don’t want to apply such a restrictive policy until you have high confidence that all legitimate sending services are accounted for in SPF (and DKIM, if appropriate). That may take a few weeks, depending on the number of services you have sending messages from your domain, but with DMARC Management you will quickly grasp when you’re ready to go.

What else is needed

Once you have approved all your authorized email senders (sources) and configured DMARC to quarantine or reject, you should be confident that your brand and organization are much safer. From then on, keeping an eye on your approved sources list is a very lightweight operation that doesn’t take more than a few minutes per month from your team. Ideally, when new applications that send emails from your domain are deployed in your company, you would proactively include the corresponding IP addresses in your SPF record.

But even if you don’t, you will find new unapproved senders notices on your Security Center, under the Security Insights tab, alongside other important security issues you can review and manage.

Stop brand impersonation with Cloudflare DMARC Management

Or you can check the unapproved list on DMARC Management every few weeks.

Whenever you see a legitimate sender source show up as unapproved, you know what to do — click “…” and mark them as approved!

What’s coming next

DMARC Management takes email security to the next level, and this is only the beginning.

We’re excited to demonstrate our investments in features that provide customers even more insight into their security. Up next we’ll be connecting security analytics from Cloudflare’s Cloud Access Security Broker (CASB) into the Security Center.

Stop brand impersonation with Cloudflare DMARC Management

This product integration will provide customers a way to understand the status of their wider SaaS security at a glance. By surfacing the makeup of CASB Findings (or security issues identified in popular SaaS apps) by severity, health of the SaaS integration, and the number of hidden issues, IT and security administrators will have a way to understand the status of their wider security surface area from a single source.

Stay tuned for more news on CASB in Security Center. In the meantime you can join the waitlist for DMARC Management beta for free today and, if you haven’t yet, we recommend you also check out Cloudflare Area 1 and request a Phishing Risk Assessment to block phishing, spoof and spam emails from coming into your environment.

Security updates for Friday

Post Syndicated from original https://lwn.net/Articles/926411/

Security updates have been issued by Debian (sox and thunderbird), Fedora (containerd, libtpms, mingw-binutils, mingw-LibRaw, mingw-python-werkzeug, stargz-snapshotter, and tkimg), Slackware (mozilla and openssh), SUSE (apache2, firefox, hdf5, jakarta-commons-fileupload, kernel, perl-Net-Server, python-PyJWT, qemu, and vim), and Ubuntu (abcm2ps, krb5, and linux-intel-iotg).

The collective thoughts of the interwebz