Friday Squid Blogging: Newfoundland Giant Squid Sculpture

Post Syndicated from Bruce Schneier original https://www.schneier.com/blog/archives/2022/11/friday-squid-blogging-newfoundland-giant-squid-sculpture.html

In 1878, a 55-foot-long giant squid washed up on the shores of Glover’s Harbour, Newfoundland. It’s the largest giant squid ever recorded—although scientists now think that the size was an exaggeration or the result of postmortem stretching—and there’s a full-sized statue of it near the beach where it was found.

As usual, you can also use this squid post to talk about the security stories in the news that I haven’t covered.

Read my blog posting guidelines here.

Metasploit Weekly Wrap-Up

Post Syndicated from Brendan Watters original https://blog.rapid7.com/2022/11/04/metasploit-weekly-wrap-up-182/

C is for cookie

Metasploit Weekly Wrap-Up

And that’s good enough for Apache CouchDB, apparently. Our very own Jack Heysel added an exploit module based on CVE-2022-24706 targeting CouchDB prior to 3.2.2, leveraging a special default ‘monster’ cookie that allows users to run OS commands.

This fake computer I just made says I’m an Admin

Metasploit’s zeroSteiner added a module to perform Role-based Constrained Delegation (RBCD) on an Active Directory network. If you need someone to vouch for your credentials as an Administrator on a local host and you have a set of specific permissions, this module will allow you to create your own friendly computer object to vouch for you!

Proving your Mettle while watching a fire

FLIR Cameras measure the heat given off by an exothermic reaction, but they also execute Metasploit’s ARM Meterpreter (formerly known as Mettle) payloads as root, thanks to a module by Samy Younsi that takes advantage of CVE-2022-37061, an unauthenticated command injection vulnerability in FLIR AX8 cameras up to and including 1.46.16.

That OpenSSL Vuln was certainly not greater than or equal to the hype

It was a tense and scary Halloween for many when it shouldn’t have been, thanks to a “cryptic” early announcement of an OpenSSL vulnerability that proved to be a bust. On AttackerKB Rapid7 researchers break down why this was not the vuln you feared, or much of a vuln at all.

New module content (5)

  • FLIR AX8 unauthenticated RCE by Samy Younsi (https://www.linkedin.com/in/samy-younsi), Thomas Knudsen (https://www.linkedin.com/in/thomasjknudsen), and h00die-gr3y, which exploits CVE-2022-37061 – This adds an exploit module that targets FLIR AX8 thermal cameras. A command injection vulnerability exists in the id POST parameter to the res.php endpoint, which can be leveraged by an unauthenticated attacker to achieve RCE as the root user.
  • Webmin File Manager RCE by faisalfs10x and jheysel-r7, which exploits CVE-2022-0824 – This adds a module that exploits improper access controls in Webmin File Manager. An authenticated attacker can coerce Webmin into downloading a malicious CGIcgi script from an attacker-controlled http server. After that, the attacker can further use File Manager utilities to set execute permissions on the cgi script, execute it, and achieve RCE as the root user.
  • Apache CouchDB Erlang RCE by 1F98D, Konstantin Burov, Milton Valencia (wetw0rk), _sadshade, and jheysel-r7, which exploits CVE-2022-24706 – A new module has been added to exploit CVE-2022-24706 an RCE within Apache CouchDB prior to 3.2.2 via the Erlang/OTP Distribution protocol, which used a default cookie of "monster" to allow users to connect and run OS commands.
  • Linux Gather ManageEngine Password Manager Pro Password Extractor by Charles Yost, Christophe De La Fuente, Rob Simon, and Travis Kaun – This post module gathers ManageEngine’s Password Manager Pro credentials from the local ManageEngine database.
  • #17181 from zeroSteiner – Adds a new auxiliary/admin/ldap/rbcd module which uses LDAP to set the msDS-AllowedToActOnBehalfOfOtherIdentity attribute on the user provided delegate_to datastore option within Active Directory. This technique is used as part of Role Based Constrained Delegation (RBCD) attacks. Example usage: run rhost=192.168.123.13 [email protected] password=p4$$w0rd delegate_to=dc3$ action=WRITE delegate_from=fake_computer. This new module can be used in conjunction with the existing auxiliary/admin/dcerpc/samr_computer module to create the required fake computer account.

Enhancements and features (6)

  • #17155 from h00die – This PR updates version checking for the recent Remote mouse RCE module and updates the docs with a vulnerable version download link.
  • #17184 from adfoster-r7 – Updates the metashell upload/download commands to work for powershell and windows sessions.
  • #17186 from adfoster-r7 – Fixes broken file writes on windows targets when newlines are present within the uploaded file.
  • #17195 from adfoster-r7 – Fixes uploading binary files with identical names to a Windows shell session. Previously this would silently error and not write the new file contents, now the file contents will successfully be written out.
  • #17196 from bcoles – Adds new get_hostname library support for Windows sessions.
  • #17207 from memN0ps – Updates msfvenom and msfconsole to support formatting shellcode as a Rust array. Example usage: msfvenom -p windows/x64/exec cmd='calc.exe' -f rust.

Bugs fixed (3)

  • #17188 from zeroSteiner – Fixes a regression issue that stopped Python Meterpreter working for v3.1-3.3.
  • #17190 from zeroSteiner – This sets the bufptr parameter in multiple netapi32 railgun functions to the PLPVOID data type and consequently fixes a crash in the post/windows/gather/enum_domain_tokens module caused by improper data types being set for the bufptr parameter.
  • #17213 from bwatters-r7 – Fixes a bug that stopped the post/linux/gather/vcenter_secrets_dump module from loading.

Get it

As always, you can update to the latest Metasploit Framework with msfupdate
and you can get more details on the changes since the last blog post from
GitHub:

If you are a git user, you can clone the Metasploit Framework repo (master branch) for the latest.
To install fresh without using git, you can use the open-source-only Nightly Installers or the
binary installers (which also include the commercial edition).

How to Download and Back Up Your Twitter Account

Post Syndicated from Barry Kaufman original https://www.backblaze.com/blog/how-to-download-and-back-up-your-twitter-account/

If you’ve been following the news lately, you might be thinking now is a good time to start downloading and backing up your Twitter history.

It’s officially the Elon Age of Twitter, and subsequently, there have been a few people rumbling about leaving the platform following Musk’s firing of top executives and an alarming rise in hate speech. Needless to say, we’re sticking around—you might have stumbled upon this article from Twitter itself. We just can’t quit the little blue bird quite yet. But there is one thing we can do, and that’s help you download and back up your Twitter archive—most likely for free.

Whether you’re anti-Elon or you’re just worried that the folks who are good at building electric cars or spaceships might not know how to manage a social media algorithm, you can take a few easy steps to protect your treasured Twitter memories. Here’s how.

Downloading Your Twitter Data

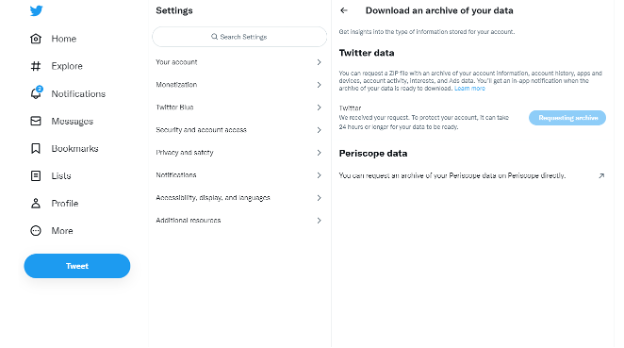
The first step is to log in to your Twitter account on a web browser. Once logged in, click on the “More” section in the navigation bar. From there, a new navigation bar will appear. You should select the “Settings and Support” dropdown, followed by the “Settings and Privacy” tab to progress.

Under the “Your Account” section, you will find an area labeled “Download an archive of your data.” The function of this is pretty self-explanatory, but does lead to a further menu that allows you to request an archive of your Twitter data or Periscope data.

After requesting your archive you will receive a notification with a link when your archive is ready for download. This archive will consist of a ZIP file with data that Twitter has deemed most relevant or useful to you, including DMs, moments, profile media and any media you may have used in your Tweets such as gifs, photos, and videos.

Archive Your Twitter Data for Free

Once you download your Twitter data, you can then save a full archive copy in the cloud on Backblaze B2—for free if it’s under 10GB.

Click here to get started with Backblaze B2 Storage Cloud today.

Back Up Your Twitter Data (Not Free, But Super Easy)

In addition to an archive copy, it’s important to use a secure backup strategy so all of those Tweets and memories will be preserved and kept safe from accidental deletion, equipment failure, or disasters (whether they’re natural or Musk-made). This is where a 3-2-1 backup strategy comes in handy. Using a 3-2-1 approach means keeping one copy of your data locally, one copy on a different type of media like an external hard drive, and one off-site (the cloud is a great place to keep it!).

You’ll need to manually download your Twitter data periodically, but once you have it on your machine, you can ensure it’s backed up with Backblaze Computer Backup—it automatically backs up all of your files, including documents, photos, music, movies, and, yes, all of that Twitter data you downloaded.

Click here to sign up for a 15-day trial of Backblaze Computer Backup, and save those Tweets.

While You’re At It…

We’ve gathered a handful of guides to help you protect social content across many different platforms. We’re working on developing this list—please comment below if you’d like to see another platform covered.

The post How to Download and Back Up Your Twitter Account appeared first on Backblaze Blog | Cloud Storage & Cloud Backup.

[$] Two performance-oriented patches: epoll and NUMA balancing

Post Syndicated from original https://lwn.net/Articles/913291/

The search for better performance from the kernel never ends. Recently
there has been a stream of smaller patches that promise incremental
performance gains, at least for some types of applications. Read on for an
overview of two of those patches, which make changes to the epoll system
calls and to NUMA balancing. This work shows where developers are looking
for performance improvements — and that not everybody measures performance
the same way.

NSA on Supply Chain Security

Post Syndicated from Bruce Schneier original https://www.schneier.com/blog/archives/2022/11/nsa-on-supply-chain-security.html

The NSA (together with CISA) has published a long report on supply-chain security: “Securing the Software Supply Chain: Recommended Practices Guide for Suppliers.“:

Prevention is often seen as the responsibility of the software developer, as they are required to securely develop and deliver code, verify third party components, and harden the build environment. But the supplier also holds a critical responsibility in ensuring the security and integrity of our software. After all, the software vendor is responsible for liaising between the customer and software developer. It is through this relationship that additional security features can be applied via contractual agreements, software releases and updates, notifications and mitigations of vulnerabilities.

Software suppliers will find guidance from NSA and our partners on preparing organizations by defining software security checks, protecting software, producing well-secured software, and responding to vulnerabilities on a continuous basis. Until all stakeholders seek to mitigate concerns specific to their area of responsibility, the software supply chain cycle will be vulnerable and at risk for potential compromise.

They previously published “Securing the Software Supply Chain: Recommended Practices Guide for Developers.” And they plan on publishing one focused on customers.

Rapid7’s Impact from Apache Commons Text Vulnerability (CVE-2022-42889)

Post Syndicated from Rapid7 original https://blog.rapid7.com/2022/11/04/rapid7s-impact-from-apache-commons-text-vulnerability-cve-2022-42889/

Rapid7’s Impact from Apache Commons Text Vulnerability (CVE-2022-42889)

As stated in our Apache Commons Text blog post, CVE-2022-42889 is a vulnerability in the popular Apache Commons Text library that can result in code execution when processing malicious input, and affects versions 1.5 through 1.9. This vulnerability has been patched as of Commons Text version 1.10.

As part of standard due diligence, Rapid7 evaluates the potential impact of vulnerabilities in its products. This process includes validating the existence of the vulnerable libraries or services, interdependencies, the exploitability of the vulnerability in a given context, and impacts related to applying available patches.

Rapid7’s Nexpose console and InsightVM products are confirmed to currently include commons-text.1.6.jar (as of the date of this post). This library is not directly used within the scan engine, but has a shared dependency within the security console. While Rapid7’s assessment has found no paths to exploit for this vulnerability, we do plan to patch this vulnerability in Nexpose and InsightVM during the month of November 2022.

Optimize your sending reputation and deliverability with SES dedicated IPs

Post Syndicated from Lauren Cudney original https://aws.amazon.com/blogs/messaging-and-targeting/optimize-your-sending-reputation-and-deliverability-with-ses-dedicated-ips/

Optimize your sending reputation and deliverability with SES dedicated IPs

Email remains the best medium for communicating with customers, with a ROI of 4200%, higher than social media or blogs. Organizations that fail to adequately manage their email sending and reputation risk having their emails marked as spam, not reaching their customers’ inboxes, reducing trust with their customers and ultimately, losing revenue. Studies showed that 16% of all marketing emails have either gone completely missing or have been caught by popular spam filters. In this blog post we will explain the benefits of sending email over a dedicated IP, and how dedicated IPs (managed) makes it easy to do so.

Improve your sender reputation and deliverability with dedicated IPs
When customers sign up to SES, their sending is automatically sent from shared IPs. Shared IPs offer a cost-effective and safe method of sending email. A limitation of sending over a shared IP is that customers do not control their own sending reputations. The reputation of the IP that you send from is determined by the quality of content and engagement levels of all the emails sent from that IP. This means that good senders, that send highly engaged content or important transactional emails, cannot improve their sending reputation on shared IPs. By improving their sending reputation, senders can improve their deliverability rates and make sure that more of their emails get to to the recipient’s inbox rather than their junk folder. Today, this is avoided by customers sending via a dedicated IP. Dedicated IPs are exclusive to a single sender so other bad actors cannot affect their sending reputation and good senders can improve their sending reputation.

A common method organizations use to increase delivery rate is to lease dedicated IPs where they are the sole exclusive sender and do not share their IP with other senders. This helps grow and maintain sending reputation and build high levels of trust with ISPs and mailbox vendors, ensuring high delivery rates. Today however, there are a number of issues with sending email via dedicated IPs. Customers experience difficulties in estimating how many dedicated IPs they need to handle their sending volume. This means that customers often lease too many IPs and pay for bandwidth that they don’t need. Dedicated IPs must also be “warmed-up” by sending a gradually increasing amount of email each day via the IP so that the recipient ISPs and mailboxes do not see a sudden large burst of emails coming from it, which is a signal of spam and can result in a blocking. Customers must manually configure the amount of mail to increase by, often not reaching the required volume, on average, after 45 days, hampering their time-to-market agility. This burden of provisioning, configuring and managing dedicated IPs inhibits many email senders from adopting them, meaning that their sending reputation is not optimized.

Dedicated IPs (managed)
SES customers can now send their email via dedicated IPs (managed) and will have the entire process of provisioning, leasing, warming up and managing the IP fully automated. Dedicated IPs (managed) is a feature of SES that simplifies how SES customers setup and maintain email sending through a dedicated IP space. It builds on learnings and feedback gathered from customers using the current standard Dedicated IP offering.

Dedicated IPs (managed) provides the following key benefits:

  • Easy Onboarding – Customers can create a managed dedicated pool through the API/CLI/Console and start with dedicated sending, without having to open AWS support cases to lease/release individual IPs.
  • Auto-Scaling per ISP – No more manual monitoring or scaling of dedicated pools. The pool scales out and in automatically based on usage. This auto-scaling also takes into consideration ISPs specific policies. For example, if SES detects that an ISP supports a low daily send quota, the pool will scale-out to better distribute traffic to that ISP across more IPs. In the current offering, customers are responsible for right sizing the number of IPs in their sending pools.
  • Warmup per ISP – SES will track the warmup level for each IP in the pool toward each ISP individually. SES will also track domain reputation at the individual ISP level. If a customer has been sending all their traffic to Gmail, the IP is considered warmed up only for Gmail and cold for other ISPs. If the traffic pattern changes and customer ramps up their traffic to Hotmail, SES will ramp up traffic slowly for Hotmail as the IPs are not warmed up yet. In the current manual dedicated offering, warmup % is tracked at the aggregate IP level and therefore can’t track the individual ISP level of granularity.
  • Adaptive warmup – The warmup % calculation is adaptive and takes into account actual sending patterns at an ISP level. When the sending to an ISP drops, the warmup % also drops for the given ISP. Today, when warming up the IP, customers must specify a warm up schedule and choose their volumes. Rather than having to specify a schedule and guess the optimal volume to send, Dedicated IPs (managed) will adapt the sending volume based on each individual ISP’s capacity, optimizing the warm-up schedule
  • Spill-over into shared & defer – Messages will be accepted through the API/SMTP and the system will be deferring and retrying excess sending from a customer when it is above what the pool can safely support for a particular ISP. In the early phases of the pool, the system will still leverage spill-over into shared as is done in the current offering.

Onboarding

If you use several dedicated IP addresses with Amazon SES, you can create groups of those addresses. These groups are called dedicated IP pools. A common scenario is to create one pool of dedicated IP addresses for sending marketing communications, and another for sending transactional emails. Your sender reputation for transactional emails is then isolated from that of your marketing emails. In this scenario, if a marketing campaign generates a large number of complaints, the delivery of your transactional emails is not impacted.

Configuration sets are groups of rules that you can apply to your verified identities. A verified identity is a domain, subdomain, or email address you use to send email through Amazon SES. When you apply a configuration set to an email, all of the rules in that configuration set are applied to the email. For example, you can associate these dedicated IP pools with configuration sets and use one for sending marketing communications, and another for sending transactional emails.

Onboarding to a managed dedicated pool for the most part is very similar to onboarding to regular dedicated IP sending. It involves creating a dedicated on demand pool, associating the pool with a configuration set, and specifying the configuration set to use when sending email. The configuration set can be also applied implicitly to a sending identity by using the default configuration set feature.

Below are the instructions of how to get set up on dedicated IPs (managed)

Instructions

Console

Customer accounts allow-listed for the feature preview will be able to configure and view the relevant SES resources through the SES Console UI as well.

1. Go to the SES AWS console and click on Dedicated IPs
2. On the Dedicated IPs Screen, select the Dedicated IPs (managed) tab
3. Clink on the “Create dedicated on demand IP Pool” button
4. Enter the details of your new dedicated on demand pool. Specify Scaling Mode to be “OnDemand”. Do not associate it with a Configuration Set at this point. Click create.
5. Going back to the dedicated IP on demand pool view, you should see your newly created dedicated IPs (managed) pool in the “IP pools” table. If you have any existing standard dedicated pools, you can view them and their individual IPs under the “Standard dedicated IPs” tab.
6. View your current configuration sets.
7. Click on the “Create set” button.
8. Enter the details of your new configuration set. For Sending IP pool select your newly created dedicated on demand IP pool and click create.
9. View your verified sending identities and click on the identity you wish to onboard to dedicated sending.
10. Select the configuration tab. Under default configuration set, click on the Edit button.
11. Click on the “Assign a default configuration set” checkbox and select your newly created configuration set. Click save.
12. At this point all sending from that verified identity will automatically be sent using the dedicated on demandpool.

CLI

The dedicated on demand pool feature is currently in preview and not yet available through the public CLI. If you wish to configure or view your SES resources through the CLI, you can download and add an internal preview sesv2 model that contains the relevant API changes. A dedicated pool can be specified to be managed by setting the –scaling-mode MANAGED parameter when creating the dedicated pool.

wget https://tiny.amazon.com/qjdb5ewf/seses3amazemaidedijson -O "email-2019-09-27.dedicated-pool-managed.json"

aws configure add-model —service-model file://email-2019-09-27.dedicated-pool-managed.json —service-name sesv2-dedicated-managed

export AWS_DEFAULT_REGION=eu-central-1

# Create a managed dedicated pool
aws sesv2-dedicated-managed create-dedicated-ip-pool --pool-name dedicated1 --scaling-mode MANAGED

# Create a configuration set that that will send through the dedicated pool
aws sesv2-dedicated-managed create-configuration-set --configuration-set-name cs_dedicated1 --delivery-options SendingPoolName=dedicated1

# Configure the configuration set as the default for your sending identity
aws sesv2 put-email-identity-configuration-set-attributes --email-identity {{YOUR-SENDING-IDENTITY-HERE}} --configuration-set-name cs_dedicated1

# Send SES email through the API or SMTP without requiring any code changes. Emails will # be sent out through the dedicated pool.
aws ses send-email --destination ToAddresses={{DESTINATION-GOES-HERE}} --from {{YOUR-SENDING-IDENTITY-HERE}} --message "Subject={Data='Sending via managed ',Charset=UTF-8},Body={Text={Data=thebody,Charset=UTF-8}}"

Monitoring

We recommend customers onboard to event destinations [6] and delivery delay events [7] to more accurately track the sending performance of their dedicated sending.

Conclusion

In this blog post we explained the benefits of sending via a dedicated IP and the ease at which you can now do this using the new dedicated IPs (managed) feature.

For more information, please visit the below links:

https://docs.aws.amazon.com/ses/latest/dg/dedicated-ip.html 
https://docs.aws.amazon.com/ses/latest/dg/dedicated-ip-pools.html 
https://docs.aws.amazon.com/ses/latest/dg/managing-ip-pools.html
https://docs.aws.amazon.com/ses/latest/dg/using-configuration-sets-in-email.html
https://docs.aws.amazon.com/ses/latest/dg/managing-configuration-sets.html#default-config-sets
https://docs.aws.amazon.com/ses/latest/dg/monitor-using-event-publishing.html
https://aws.amazon.com/about-aws/whats-new/2020/06/amazon-ses-can-now-send-notifications-when-the-delivery-of-an-email-is-delayed/
https://docs.aws.amazon.com/ses/latest/dg/dedicated-ip-warming.html
https://docs.aws.amazon.com/ses/latest/dg/dedicated-ip-warming.html#dedicated-ip-auto-warm-up
https://docs.aws.amazon.com/ses/latest/dg/using-configuration-sets.html

https://dma.org.uk/uploads/misc/marketers-email-tracker-2019.pdf
https://www.emailtooltester.com/en/email-deliverability-test/

What’s new with Amazon QuickSight at AWS re:Invent 2022

Post Syndicated from Mia Heard original https://aws.amazon.com/blogs/big-data/whats-new-with-amazon-quicksight-at-aws-reinvent-2022/

AWS re:Invent is a learning conference hosted by AWS for the global cloud computing community. This year’s re:Invent will be held in Las Vegas, Nevada, from November 28 to December 2.

Amazon QuickSight is the most popular cloud-native serverless BI service. This post walks you through the details of all QuickSight-related sessions and activities to help you plan your conference week accordingly. These sessions should appeal to data and analytics teams, product and engineering teams, and line of business and technology leaders interested in modernizing their BI capabilities to transform data into actionable insights for all.

To access the session catalog and reserve your seat for one of our BI sessions, you must be registered for re:Invent. Register now!

Keynotes

Adam Selipsky, Chief Executive Officer of Amazon Web Services – Keynote

Tuesday November 29 | 8:30 AM – 10:30 AM PST | The Venetian

Join Adam Selipsky, Chief Executive Officer of Amazon Web Services, as he looks at the ways that forward-thinking builders are transforming industries and even our future, powered by AWS. He highlights innovations in data, infrastructure, and more that are helping customers achieve their goals faster, take advantage of untapped potential, and create a better future with AWS.

Swami Sivasubramanian, Vice President of AWS Data and Machine Learning – Keynote

Wednesday November 30 | 8:30 AM – 10:30 AM PST | The Venetian

Join Swami Sivasubramanian, Vice President of AWS Data and Machine Learning, as he reveals the latest AWS innovations that can help you transform your company’s data into meaningful insights and actions for your business. In this keynote, several speakers discuss the key components of a future-proof data strategy and how to empower your organization to drive the next wave of modern invention with data. Hear from leading AWS customers who are using data to bring new experiences to life for their customers.

Leadership sessions

ANT203-L (LVL 200) Unlock the value of your data with AWS analytics

Wednesday November 30 | 2:30 – 3:30 PM PST | The Venetian

Data fuels digital transformation and drives effective business decisions. To survive in an ever-changing world, organizations are turning to data to derive insights, create new experiences, and reinvent themselves so they can remain relevant today and in the future. AWS offers analytics services that allow organizations to gain faster and deeper insights from all their data. In this session, G2 Krishnamoorthy, VP of AWS Analytics, addresses the current state of analytics on AWS, covers the latest service innovations around data, and highlights customer successes with AWS analytics. Also, learn from organizations like FINRA and more who have turned to AWS for their digital transformation journey.
Reserve your seat now!

BSI201 (LVL 200) Reinvent how you derive value from your data with Amazon QuickSight

Tuesday November 29 | 2:00 PM – 3:00 PM PST | Mandalay Bay

In this session, learn how you can use AWS-native business analytics to provide your users with machine learning-powered interactive dashboards, natural language query (NLQ), and embedded analytics to provide insights to users at scale, when and where they need it. Join this session to also learn more about how Amazon uses QuickSight internally.
Reserve your seat now!

Breakout sessions

BSI202 (LVL 200) Migrate to cloud-native business analytics with Amazon QuickSight

Wednesday November 30 | 2:30 PM – 3:30 PM PST | Encore

Legacy BI systems can hurt agile decision-making in the modern organization, with expensive licensing, outdated capabilities, and expensive infrastructure management. In this session, discover how migrating your BI to the cloud with cloud-native, fully managed business analytics capabilities from QuickSight can help you overcome these challenges. Learn how you can use QuickSight’s interactive dashboards and reporting capabilities to provide insights to every user in the organization, lowering your costs and enabling better decision-making. Join this session to also learn more about Siemens QuickSight use case.
Reserve your seat now!

BSI207 (LVL 200) Get clarity on your data in seconds with Amazon QuickSight Q

Wednesday November 30 | 4:45 PM – 5:45 PM PST | MGM Grand

Amazon QuickSight Q is a machine learning–powered natural language capability that empowers business users to ask questions about all of their data using everyday business language and get answers in seconds. Q interprets questions to understand their intent and generates an answer instantly in the form of a visual without requiring authors to create graphics, dashboards, or analyses. In this session, the QuickSight Q team provides an overview and demonstration of Q in action. Join this session to also learn more about NASDAQ’s QuickSight use case.
Reserve your seat now!

BSI203 (LVL 200) Differentiate your apps with Amazon QuickSight embedded analytics

Thursday December 1 | 12:30 PM – 1:30 PM PST | Caesars Forum

In this session, learn how to enable new monetization opportunities and grow your business with QuickSight embedded analytics. Discover how you can differentiate your end-user experience by embedding data visualizations, dashboards, and ML-powered natural language query into your applications at scale with no infrastructure to manage. Join this session to also learn more about Guardian Life and Showpad’s QuickSight use case.
Reserve your seat now!

BSI304 (LVL 300) Optimize your AWS cost and usage with Cloud Intelligence Dashboards

Thursday December 1 | 3:30 PM – 4:30 PM PST | Encore

Do your engineers know how much they’re spending? Do you have insight into the details of your cost and usage on AWS? Are you taking advantage of all your cost optimization opportunities? Attend this session to learn how organizations are using the Cloud Intelligence Dashboards to start their FinOps journeys and create cost-aware cultures within their organizations. Dive deep into specific use cases and learn how you can use these insights to drive and measure your cost optimization efforts. Discover how unit economics, resource-level visibility, and periodic spend updates make it possible for FinOps practitioners, developers, and business executives to come together to make smarter decisions. Join this session to also learn more about Dolby laboratories’ QuickSight use case.
Reserve your seat now!

Chalk talks

BSI302 (LVL 300) Deploy your BI assets at scale to thousands with Amazon QuickSight

Tuesday November 29 | 11:45 AM – 12:45 AM PST | Wynn
As your user bases grow to hundreds or thousands of users, managing assets and user permissions at scale becomes increasingly important. In this chalk talk, learn about best practices for content development, promotion, authorization, organization, and cleanup to help ensure that your users are developing and sharing content in a safe and scalable manner.
Reserve your seat now!

BSI301 (LVL 300) Architecting multi-tenancy for your apps with Amazon QuickSight

Tuesday November 29 | 2:45 PM – 3:45 PM PST | Caesars Forum

Whether you are deploying QuickSight internally in a centrally managed single account or developing a SaaS application with multiple external tenants, it is paramount to focus on security and governance and to isolate tenants from each other. In this chalk talk, learn about different architectures and security frameworks that you can use to deploy QuickSight to thousands of departments or clients in a scalable and controlled manner.
Reserve your seat now!

*This session will also be repeated Wednesday November 30 | 7:45 PM – 8:45 PM PST | Wynn

BSI401 (LVL 400) Insightful dashboards through advanced calculations with QuickSight

Monday November 28 | 12:15 PM – 1:15 PM PST | MGM Grand
Loading data into various charting types is very rarely the end goal for your users. When they find interesting patterns or trends, they tend to dig deeper into their data and use calculations to surface more underlying insights. In this chalk talk, learn about various ways to build insightful and creative dashboards using QuickSight’s new advanced calculation capabilities, such as level-aware calculation and period functions.
Reserve your seat now!

Workshops

BSI205 (LVL 200) Build stunning customized dashboards with Amazon QuickSight

Monday November 28 | 10:45 AM – 12:45 PM PST | Wynn

Want to grow your dashboard building skills? In this workshop, the QuickSight team demonstrates the latest authoring functionality designed to empower you to build beautiful layouts and robust interactive experiences with other applications, right from within your dashboard. You must bring your laptop to participate.
Reserve your seat now!

*This session will be also be repeated Thursday December 1 | 11:45 AM – 1:45 PM PST | Caesars Forum

BSI303 (LVL 300) Seamlessly embed analytics into your apps with Amazon QuickSight
Wednesday November 30 | 5:30 PM – 7:30 PM PST | Wynn

In this workshop, learn how you can bring data insights to your internal teams and end customers by simply and seamlessly embedding rich, interactive data visualizations and dashboards into your web applications and portals. You must bring your laptop to participate.
Reserve your seat now!

Partner session

PEX307 (LVL 300) Migrating business intelligence systems to Amazon QuickSight

Wednesday November 30 | 9:15 AM – 10:15 AM PST | Encore

QuickSight is a scalable, serverless, embeddable, machine learning–powered BI tool built for the cloud. If you’re building a cloud-native BI solution and are unsure how to migrate on AWS, this session is for you. Dive deep into BI best practices, tools, and methodologies for migrating BI dashboards to QuickSight, and learn how to use APIs and the AWS CLI to automate common migration tasks required to perform BI dashboard migration. This session is intended for AWS Partners.
Reserve your seat now!

Additional activities

Business Intelligence kiosk in the AWS Village

Visit the Business Intelligence kiosk within the AWS Village to meet with experts to dive deeper into QuickSight capabilities such as Q and embedded analytics. You will be able to ask our experts questions and experience live demos for our newly launched capabilities.

Free QuickSight swag

Make sure to stop by the swag distribution table to grab free QuickSight swag if you have attended either the Business Intelligence kiosk or one of our breakout sessions, chalk talks, or workshops.

Useful resources

Whether you plan on attending re:Invent in person or view available content virtually, you can always learn more about QuickSight through these helpful resources:

QuickSight Community Hub – Ask, answer, and learn with others in the QuickSight Community.

QuickSight YouTube channel – Subscribe to stay up to date on the latest QuickSight workshops, how tos, and demo videos.

QuickSight DemoCentral – Experience QuickSight first-hand through interactive dashboards and demos


About the authors

Mia Heard is a Product Marketing Manager for Amazon QuickSight, AWS’ cloud-native, fully managed BI service.

Security updates for Thursday

Post Syndicated from original https://lwn.net/Articles/913771/

Security updates have been issued by Debian (pypy3), Fedora (drupal7, git, java-1.8.0-openjdk, java-11-openjdk, java-17-openjdk, and php), Oracle (kernel, lua, openssl, pcs, php-pear, pki-core, python3.9, and zlib), Red Hat (kernel, kernel-rt, kpatch-patch, lua, openssl-container, pcs, php-pear, pki-core, python3.9, and zlib), Scientific Linux (kernel, pcs, and php-pear), SUSE (EternalTerminal, hsqldb, ntfs-3g_ntfsprogs, privoxy, rubygem-actionview-4_2, sqlite3, and xorg-x11-server), and Ubuntu (ntfs-3g, python3.10, and sqlite3).

How the Brazilian Presidential elections affected Internet traffic

Post Syndicated from João Tomé original https://blog.cloudflare.com/how-the-brazilian-presidential-elections-affected-internet-traffic/

How the Brazilian Presidential elections affected Internet traffic

Brasil, sei lá
Ou o meu coração se engana
Ou uma terra igual não há
— From Tom Jobim’s song, Brasil Nativo

How the Brazilian Presidential elections affected Internet traffic

Brazil’s recent presidential election got significant attention from both global and national media outlets, not only because of the size of the country, but also because of premature allegations of electoral fraud. The first round of the Brazilian 2022 general election was held on October 2, and the runoff was held on Sunday, October 30. With 124 million votes counted, former president Lula da Silva (2003-2010) won with 50.9% of the votes, beating incumbent Jair Bolsonaro, who had 49.1% of the votes.

How the Brazilian Presidential elections affected Internet traffic
The final results of the elections as published by the official Tribunal Super Eleitoral, with more than 124 million votes counted.)

Using Cloudflare’s data, we can explore the impact that this election had on Internet traffic patterns in Brazil, as well as interest in content from election-related websites, news organizations, social media platforms, and video platforms.

Here are a few highlights: while the runoff generated much more interest to election related websites (we actually have a view to DNS queries, a proxy to websites), the first round showed bigger increases in traffic to news organizations.

For the candidate’s domains, Lula’s win had the higher impact.

Also: official results came earlier on the runoff than the first round, and spikes in traffic were higher earlier that day (October 30).

(Note: we’re using local times — that means UTC-3, that is related to the more populated regions of Brazil — in this blog, although some charts have x-axis UTC).

Let’s start by looking at general Internet traffic in Brazil.

On election days, traffic goes down (during the day)

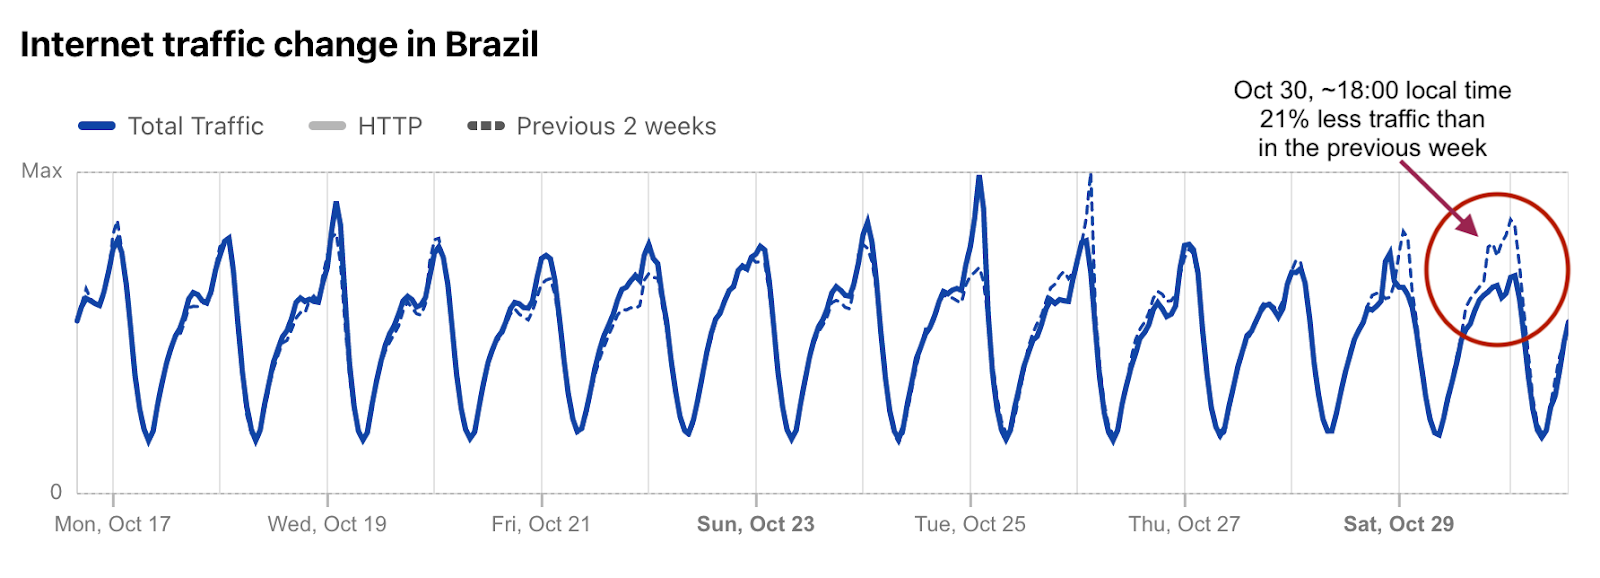
Using Cloudflare Radar, we can see something that has also been observed in other countries that hold Sunday elections: when most people are getting outside to vote, Internet traffic goes down (in comparison with previous Sundays). We saw this in the two rounds of the Presidential elections in France back in April 2022, in Portugal’s legislative elections in January 2022 and now, in Brazil.

How the Brazilian Presidential elections affected Internet traffic

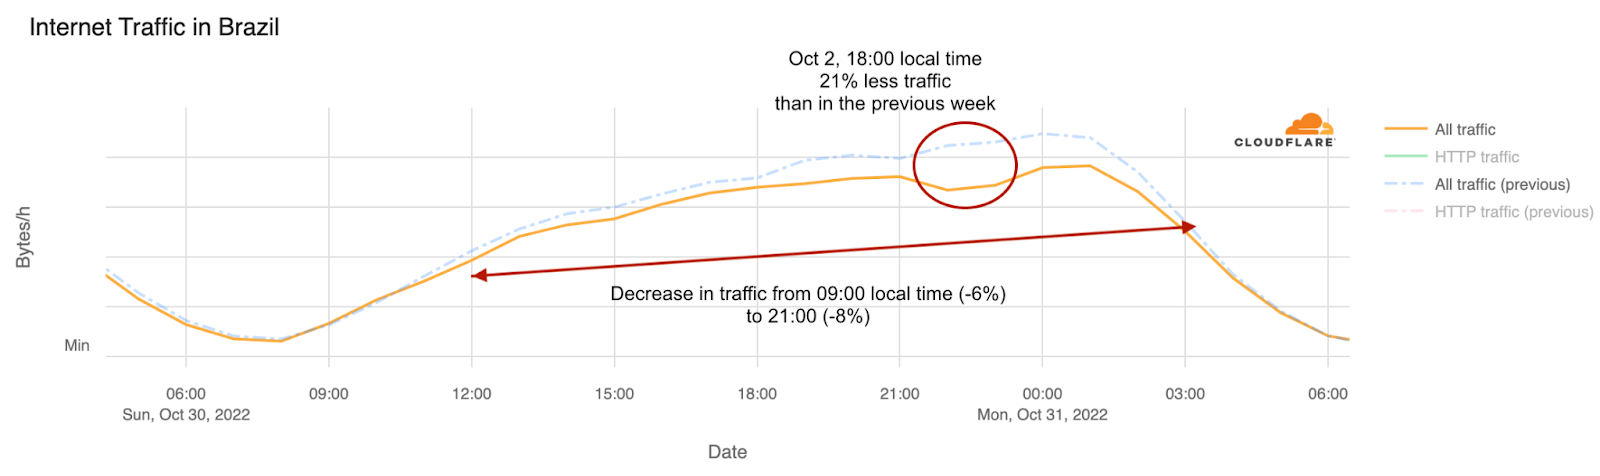
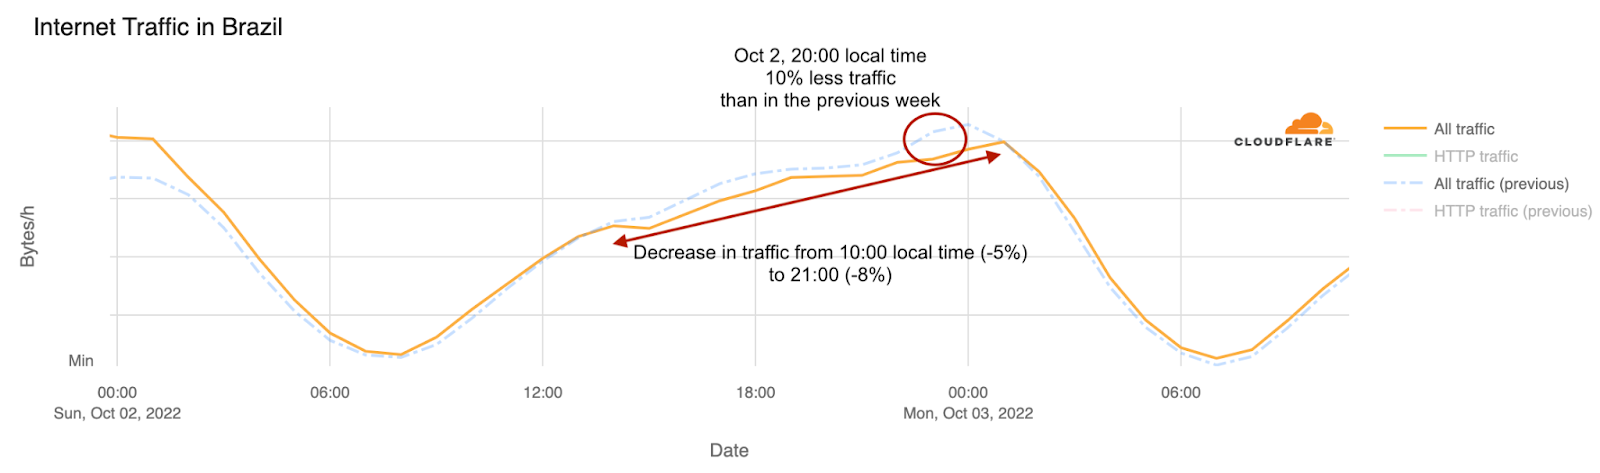
We can also compare Sundays in October. There were five weekends. The two that had elections show the same pattern of lower traffic during the day, as seen in the previous chart. Comparing the two election days, there was a bigger drop in traffic on October 30 (down 21% at around 18:00 local time), than on October 2 (down 10% at around 20:00). Related or not, there was a bigger turnout on the runoff (124 million votes) than on the first round (123 million). Here’s the view on October 30:

How the Brazilian Presidential elections affected Internet traffic

And here’s October 2:

How the Brazilian Presidential elections affected Internet traffic

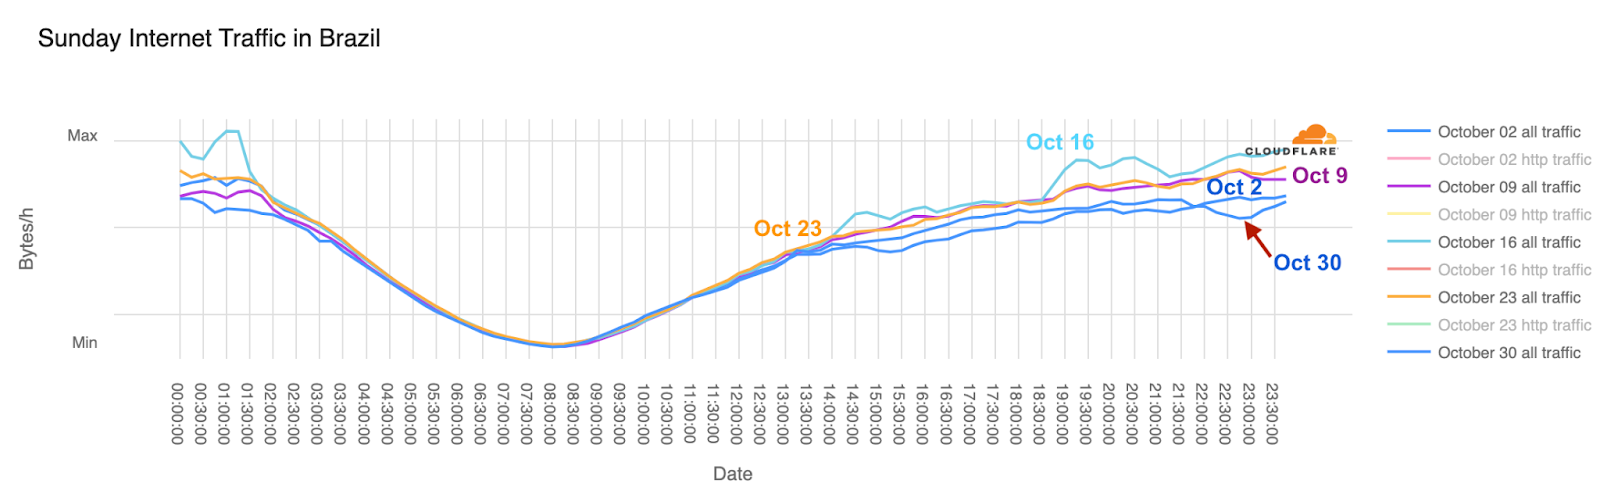
A more clear view in comparing the October weekends, and where you can see how the October 2 and 30 Sundays have the same pattern and different from the others three of the month, is this one (bear in mind that the x-axis is showing UTC time, it’s -3 hours in Brazil):

How the Brazilian Presidential elections affected Internet traffic

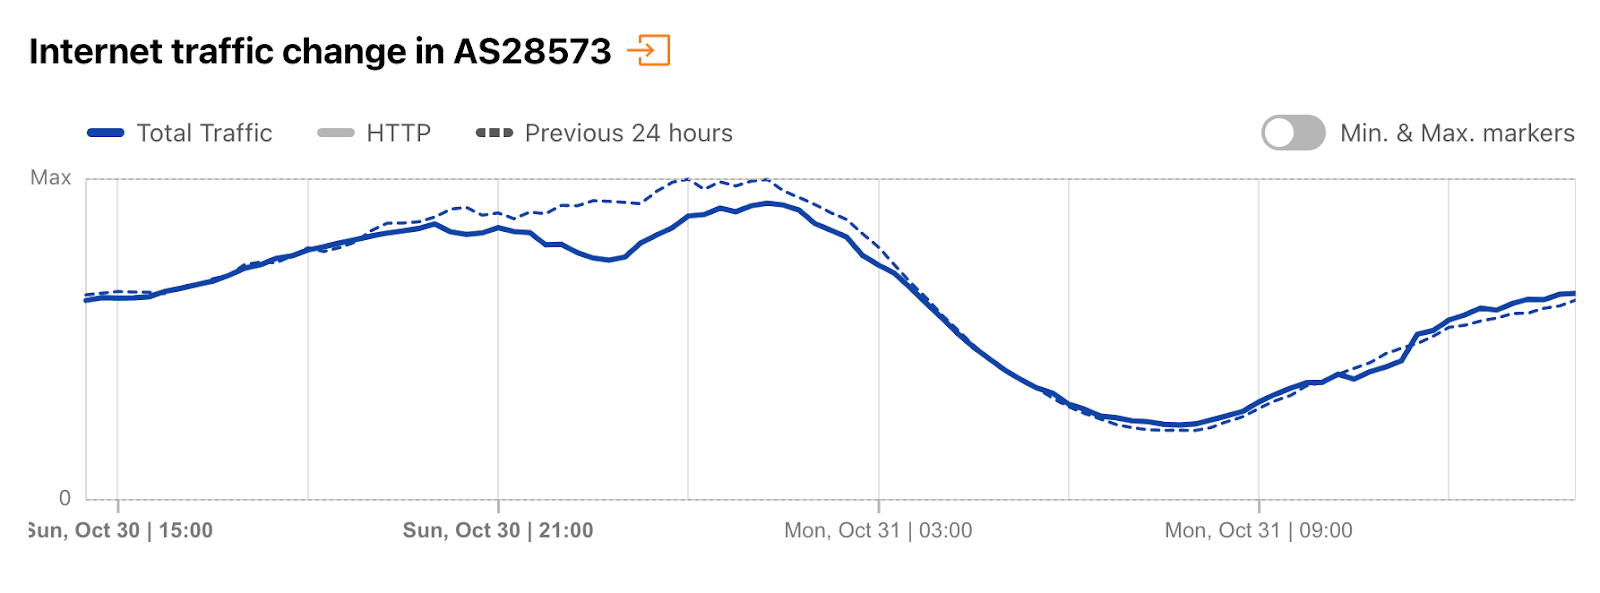
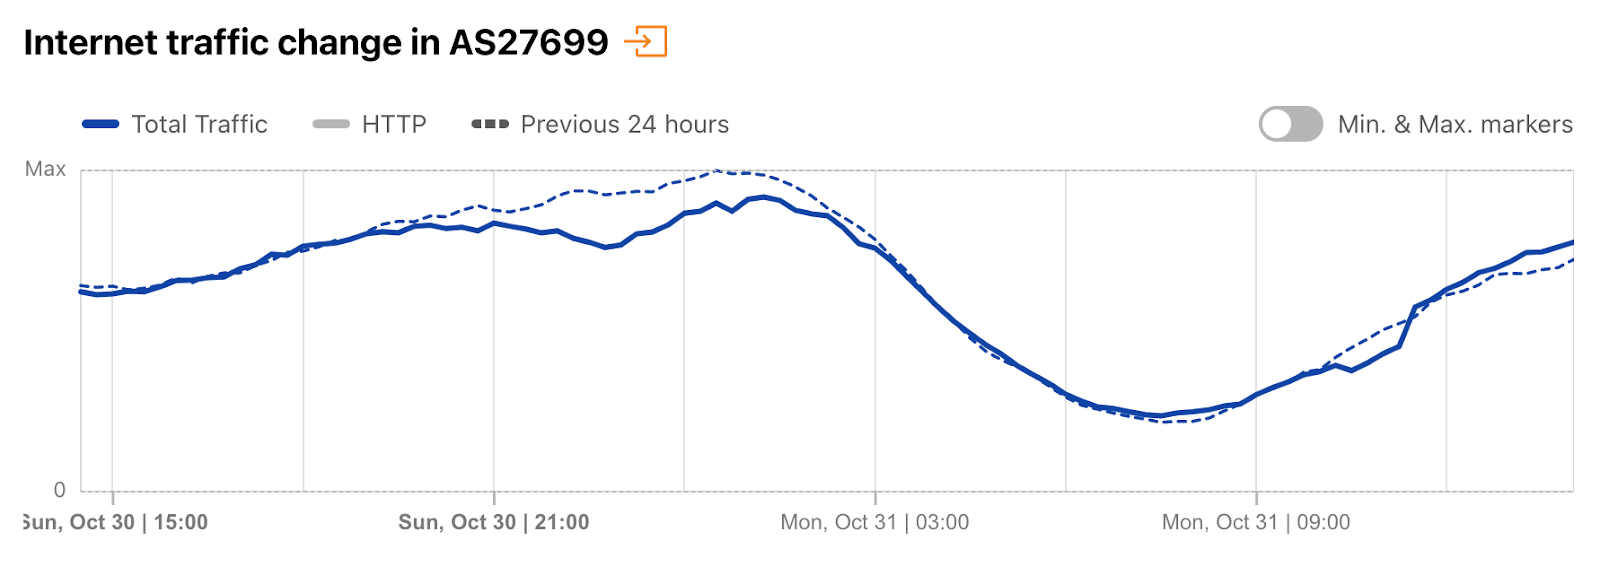
If we look at the main network providers (ASNs) in Brazil, the trend is the same. Claro (AS28573) also shows the drop in traffic on October 30, as does Telefonica (AS27699):

How the Brazilian Presidential elections affected Internet traffic

Here’s Telefonica:

How the Brazilian Presidential elections affected Internet traffic

We observed a similar impact from the October 30 runoff election to traffic from different states in Brazil, including São Paulo, Rio de Janeiro, Rio Grande do Norte, Minas Gerais, and Bahia.

Mobile device usage greater on weekends (and on election days)

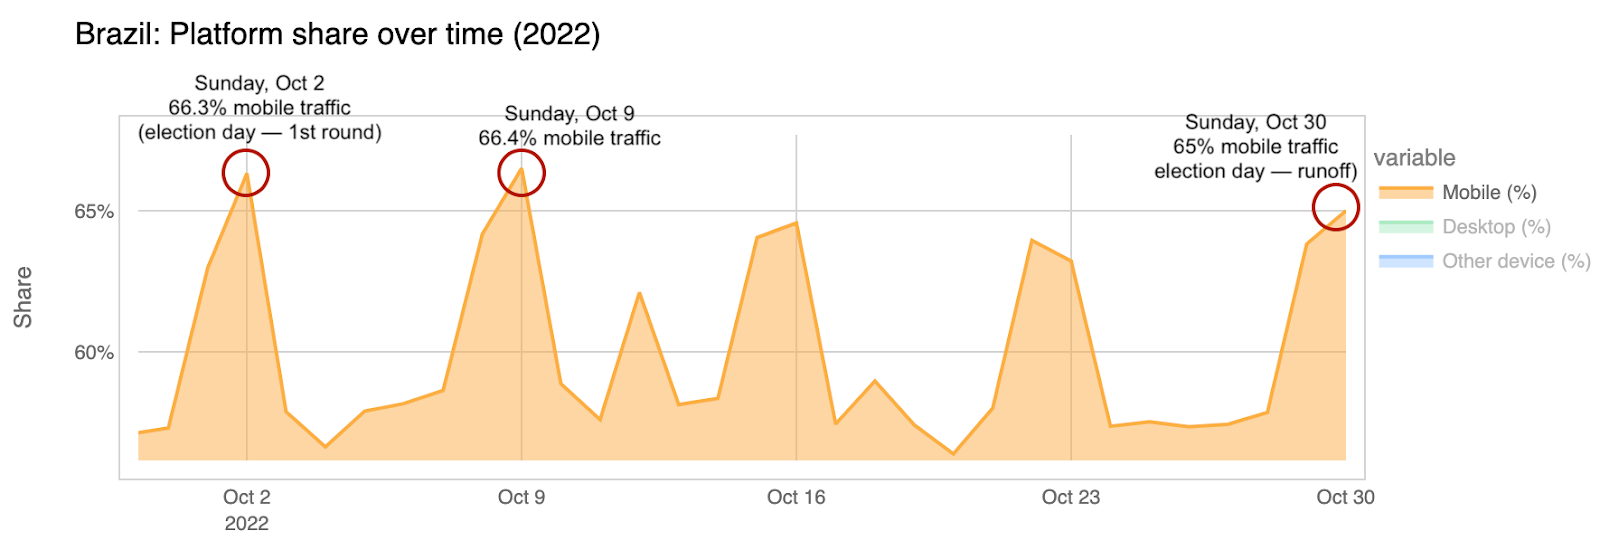
When we look at the share of Brazil’s Internet traffic from mobile devices during October, we find that the highest percentages were on October 2 (first round of the elections, 66.3%), October 9 (66.4%) and October 30 (runoff election, 65%). We’ve seen this in other elections, an increase in mobile device traffice, so this seems to follow the same trend.

How the Brazilian Presidential elections affected Internet traffic

This chart also shows how mobile device usage in Brazil is at its highest on the weekends (all the main spikes for percentage of mobile devices are over the weekend, and more on Sundays).

Now, let’s look at anonymized and aggregated DNS traffic data from our 1.1.1.1 resolver. This data provides a proxy for traffic to, and thus interest in, different categories of sites from users in Brazil around the election.

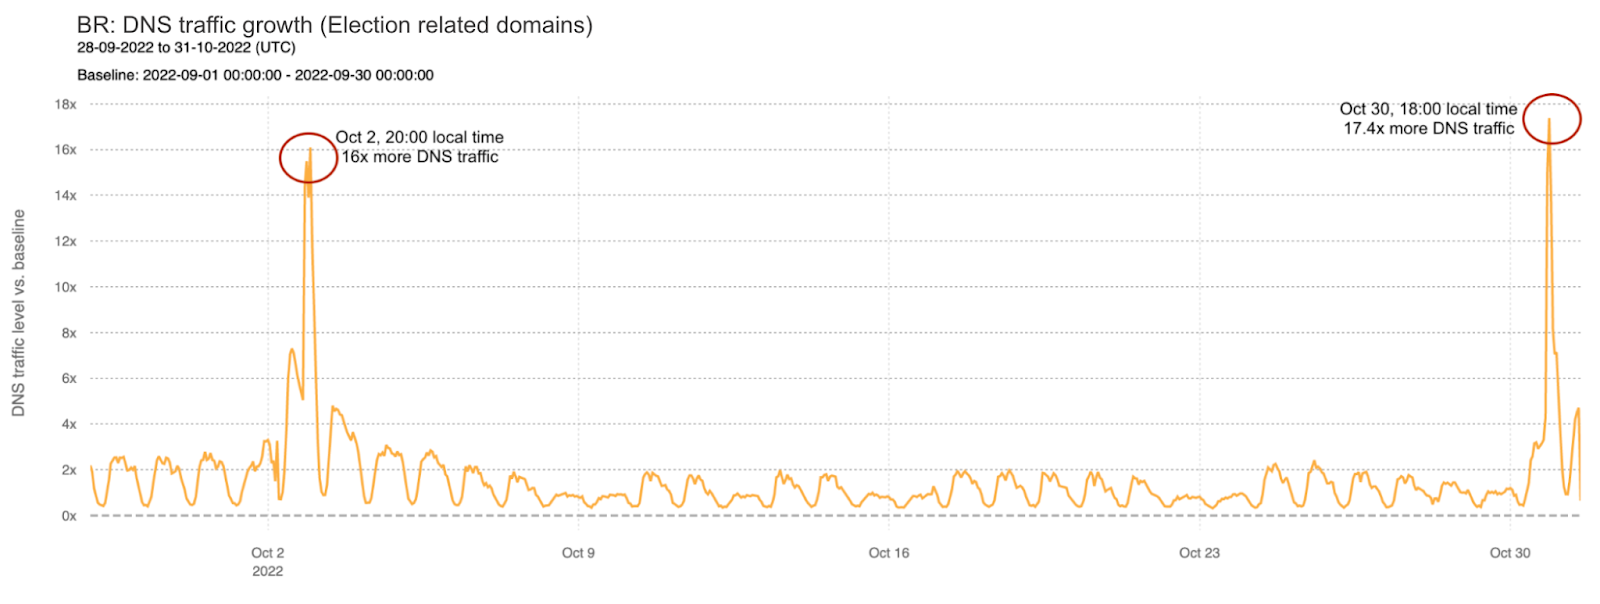
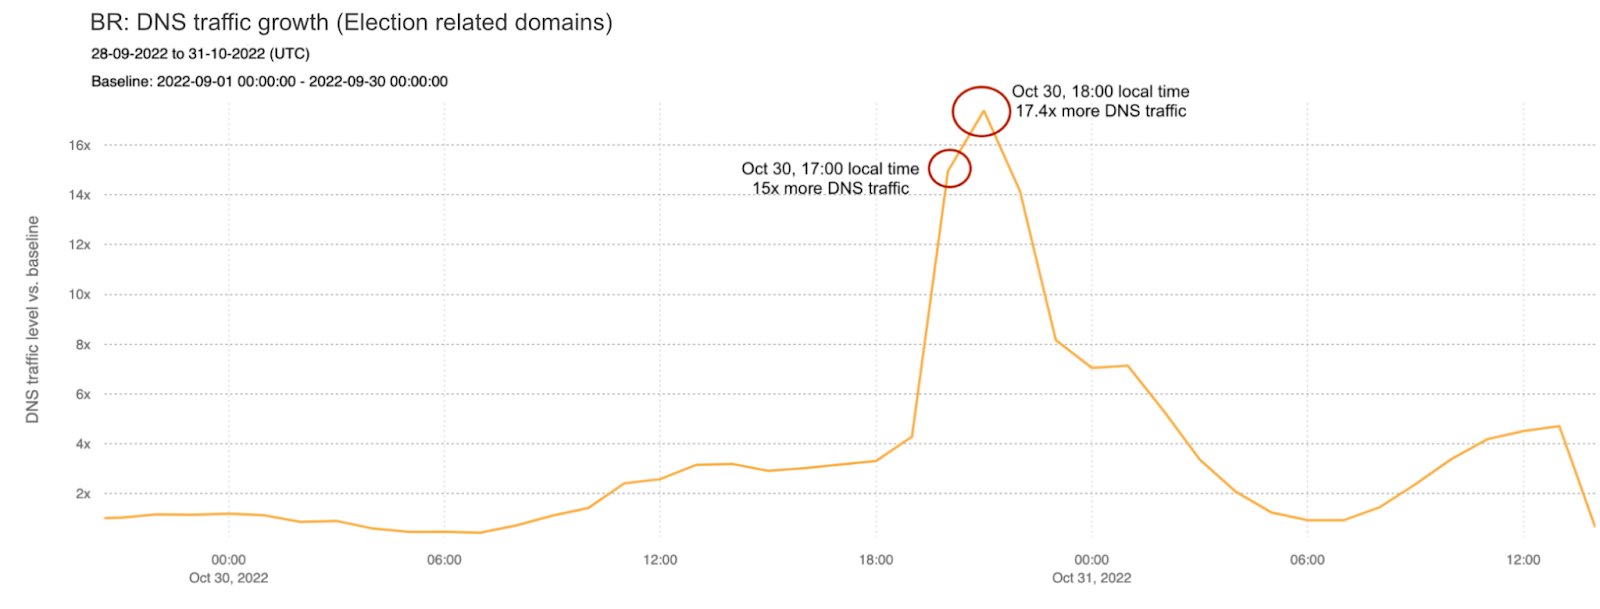
Brazil has government websites related to elections, but also its own Tribunal Superior Eleitoral (Electoral Superior Court) that includes a website and app with live updates on the results of the elections for everyone to check. Looking at those related domains and using mean hourly traffic in September as a baseline, we can see that the October 2 first round spiked to 16x more DNS queries at 20:00 local time. However, DNS query traffic during the runoff election peaked at 18:00 local time on October 30 with 17.4x more DNS traffic as compared to the September baseline.

How the Brazilian Presidential elections affected Internet traffic

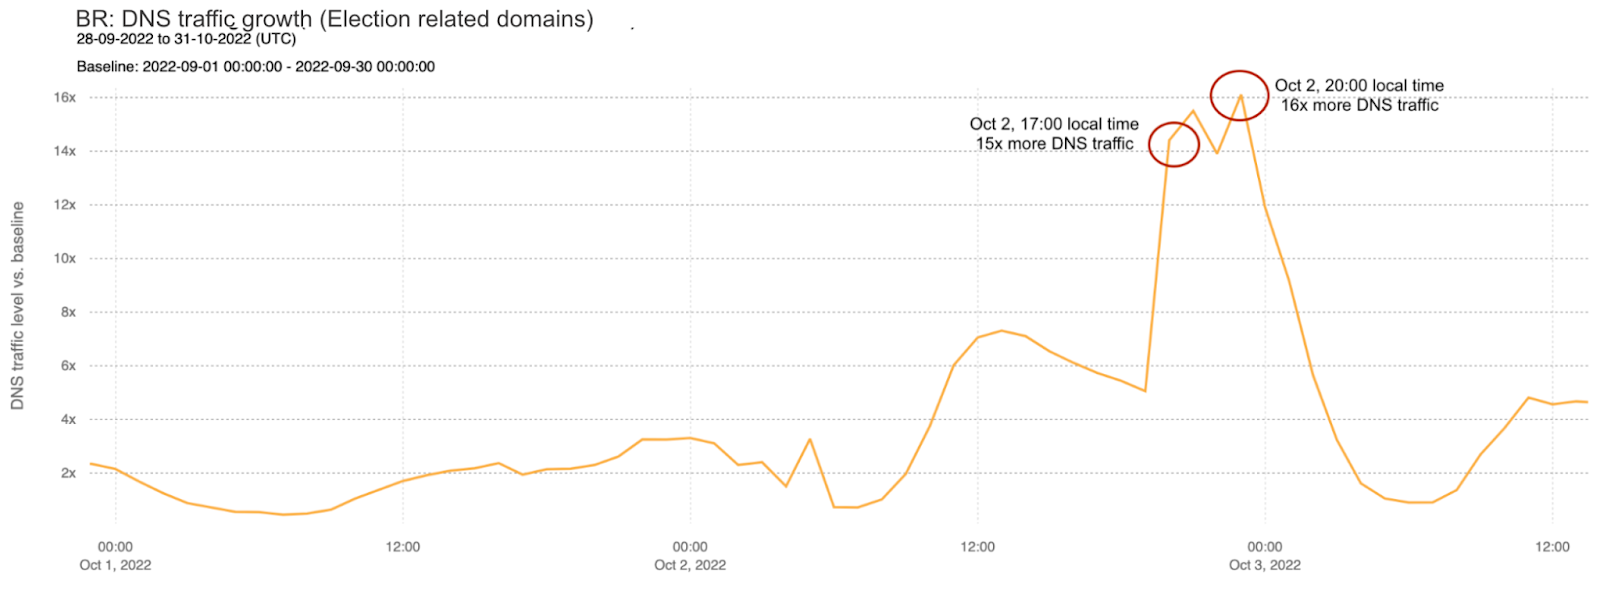
We can look more closely at each one of those two election days. On October 2, traffic had its first significant increase at around 17:00 local time, reaching 15x more requests to election-related domains as compared to the September baseline. This initial peak occurred at the same time the polling stations were closing. However, the peak that day, at 16x above baseline, was reached at 20:00 local time, as seen in the figure below.

How the Brazilian Presidential elections affected Internet traffic

On Sunday, October 30, 2022, the pattern is similar, although the peak was reached earlier, given that results started to arrive earlier than on the first round. The peak was reached at around 18:00 local time, with request traffic 17.4x above baseline.

How the Brazilian Presidential elections affected Internet traffic

As seen in the figure below, Lula first led in the official results at 18:45 local time, with votes from 67% of the polling stations counted at that time. Around 20:00 Lula was considered the winner (the peak seen in the previous chart was at that time).

How the Brazilian Presidential elections affected Internet traffic

Candidate websites: in the end, winner takes all?

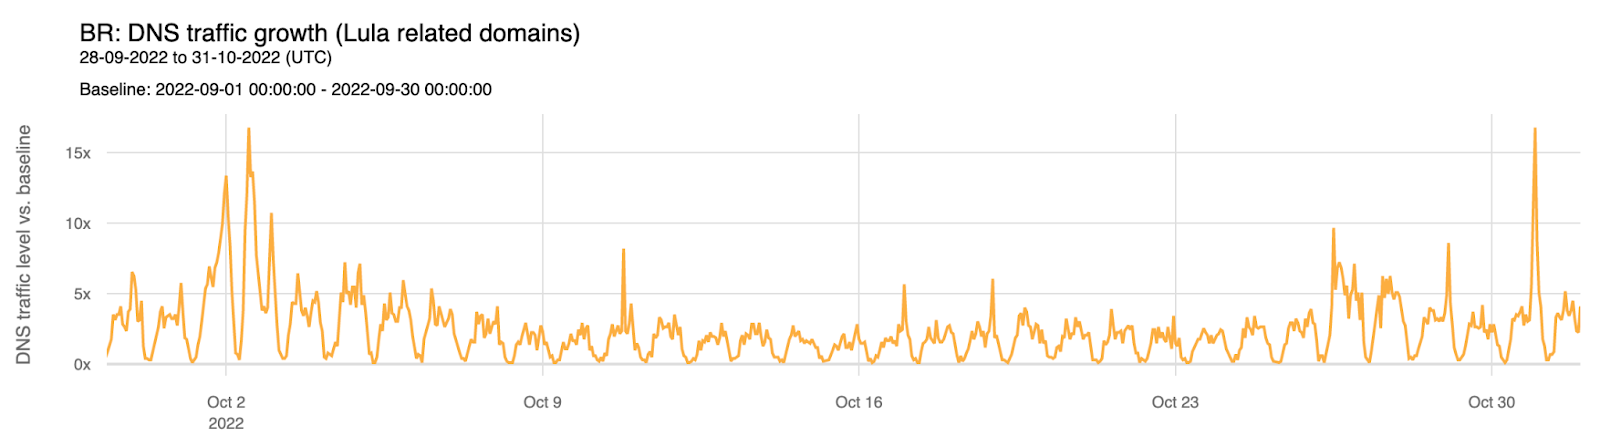
For Lula-related domains, there are clear spikes around the first round of elections on October 2. A 13x spike was observed on October 1 at around 21:00 local time. Two notable spikes were observed on October 2 — one at 16.7x above baseline at 09:00 local time, and the other at 10.7x above baseline at 21:00 local time. During the October 30 runoff election, only one clear spike was observed. The spike, at 16.7x above baseline, occurred at around 20:00, coincident with the time Lula was being announced as the winner.

How the Brazilian Presidential elections affected Internet traffic

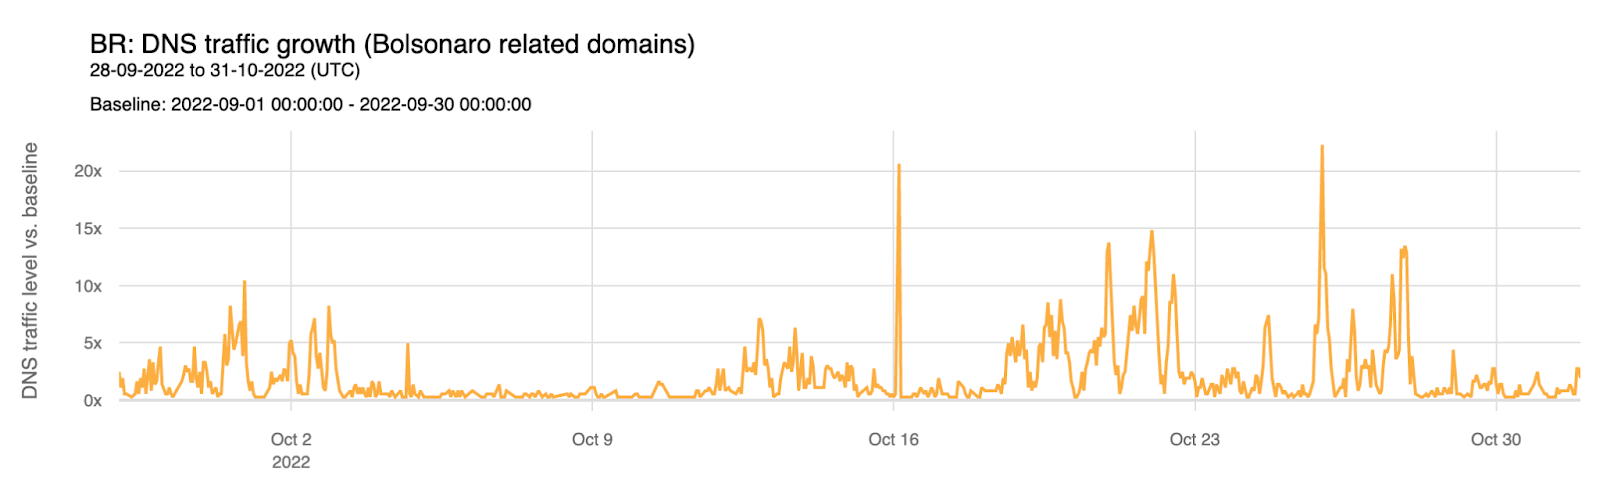
For Bolsonaro-related domains, we observed a different pattern. Increased traffic as compared to the baseline is visible in the days leading up to the first round election, reaching 10x on September 30. On October 2, a 8x spike above baseline was seen at 18:00 local time. However, the two most significant spikes seen over the course of the month were observed on October 16, at 20x above baseline, a few hours after the first Lula-Bolsonaro television debate, and on October 25, at around 20:00, at 22x above baseline. That was the last week of campaigning before the October 30 runoff and when several polling predictions were announced. The second and last Bolsonaro-Lula debate was on October 28, and there’s a spike at 22:00 to Lula’s websites, and a smaller but also clear one at 21:00 to Bolsonaro’s websites).

How the Brazilian Presidential elections affected Internet traffic

News websites: more interest in the first round

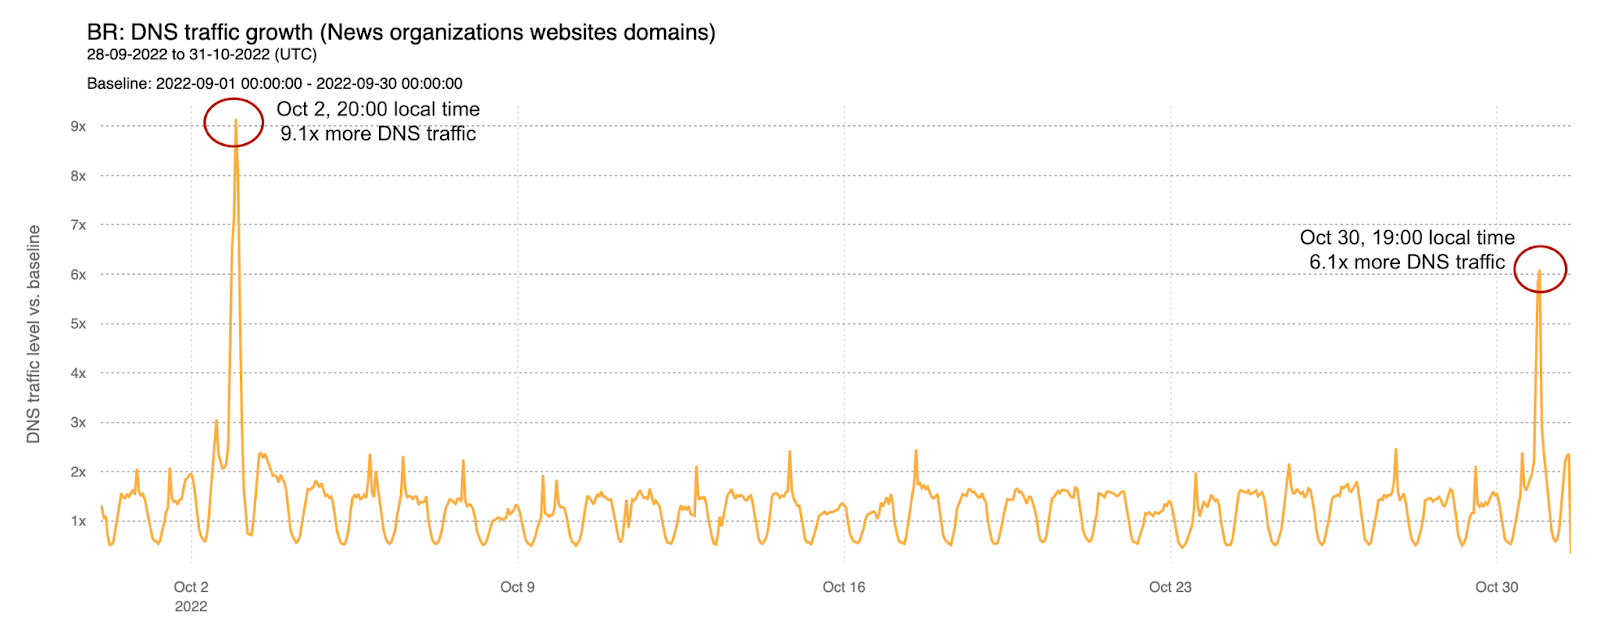
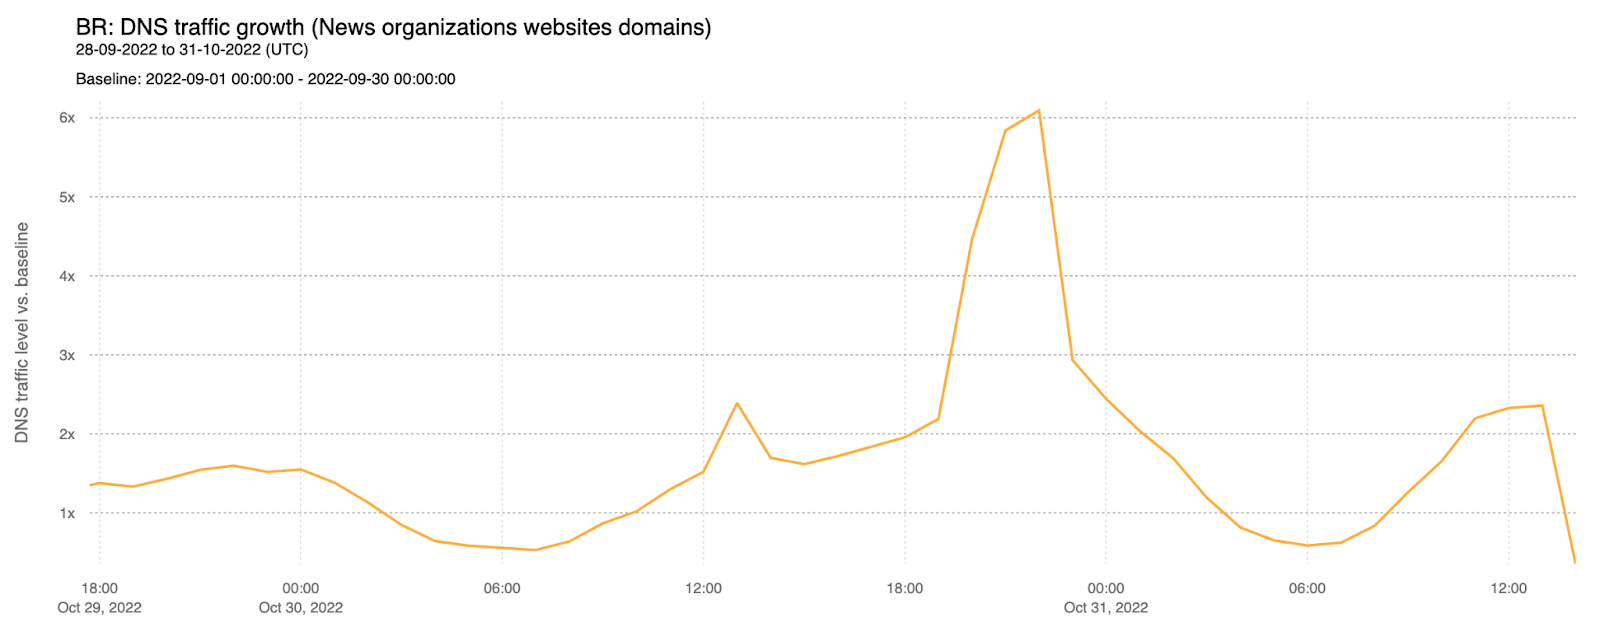
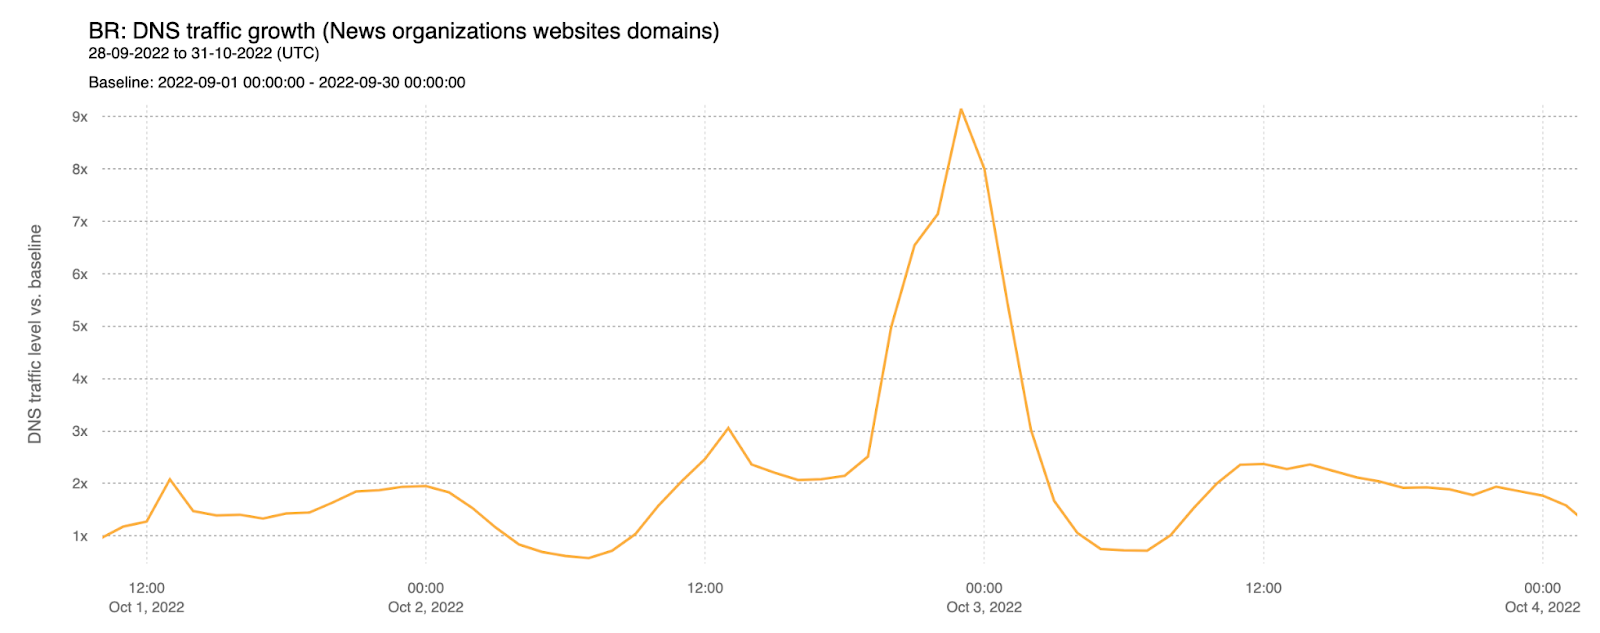
With official election results being available more rapidly, DNS traffic for Brazilian news organization websites peaked much earlier in the evening than what we saw in France, for example, where more definitive election results arrived much later on election day. But another interesting trend here is how the first round, on October 2, had 9.1x more DNS traffic (compared with the September baseline), than what we saw during the runoff on October 30 (6.1x).

How the Brazilian Presidential elections affected Internet traffic

The way the results arrived faster also had an impact on the time of the peak, occurring at around 19:00 local time on October 30, as compared to around 20:00 on October 2.

At 19:45 local time on October 30, Lula was already the winner with more than 98% of the votes counted. After 20:00 there was a clear drop in DNS traffic to news organizations.

How the Brazilian Presidential elections affected Internet traffic

On October 2, it was only around 22:00 that it became official that there would be a runoff between Lula and Bolsonaro. Peak request volume was reached at 20:00 (9x), but traffic remained high (8x) at around 21:00 and until 22:00, like the following chart shows:

How the Brazilian Presidential elections affected Internet traffic

Conclusion: Real world events impact the Internet

Cloudflare Radar, our tool for Internet insights, can provide a unique perspective on how major global or national events impact the Internet. It is interesting to not only see that a real world event can impact Internet traffic (and different types of websites) for a whole country, but also see how much that impact is represented at specific times. It’s all about human behavior at relevant moments in time, like elections as a collective event is.

Past examples of this include important presidential elections, the Super Bowl, the Oscars, Eurovision, never before seen views of the universe from a telescope , the holiday shopping season, or religious events such as Ramadan.

You can keep an eye on these trends using Cloudflare Radar.

Consistent caching mechanism in Titus Gateway

Post Syndicated from Netflix Technology Blog original https://netflixtechblog.com/consistent-caching-mechanism-in-titus-gateway-6cb89b9ce296

by Tomasz Bak and Fabio Kung

Introduction

Titus is the Netflix cloud container runtime that runs and manages containers at scale. In the time since it was first presented as an advanced Mesos framework, Titus has transparently evolved from being built on top of Mesos to Kubernetes, handling an ever-increasing volume of containers. As the number of Titus users increased over the years, the load and pressure on the system increased substantially. The original assumptions and architectural choices were no longer viable. This blog post presents how our current iteration of Titus deals with high API call volumes by scaling out horizontally.

We introduce a caching mechanism in the API gateway layer, allowing us to offload processing from singleton leader elected controllers without giving up strict data consistency and guarantees clients observe. Titus API clients always see the latest (not stale) version of the data regardless of which gateway node serves their request, and in which order.

Overview

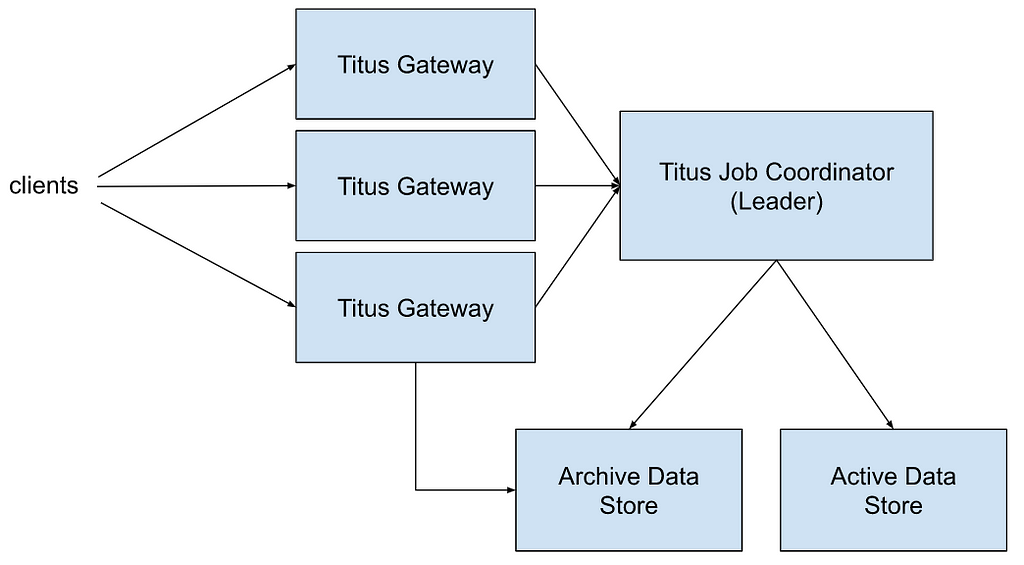
The figure below depicts a simplified high-level architecture of a single Titus cluster (a.k.a cell):

Titus Job Coordinator is a leader elected process managing the active state of the system. Active data includes jobs and tasks that are currently running. When a new leader is elected it loads all data from external storage. Mutations are first persisted to the active data store before in-memory state is changed. Data for completed jobs and tasks is moved to the archive store first, and only then removed from the active data store and from the leader memory.

Titus Gateway handles user requests. A user request could be a job creation request, a query to the active data store, or a query to the archive store (the latter handled directly in Titus Gateway). Requests are load balanced across all Titus Gateway nodes. All reads are consistent, so it does not matter which Titus Gateway instance is serving a query. For example, it is OK to send writes through one instance, and do reads from another one with full data read consistency guarantees. Titus Gateways always connect to the current Titus Job Coordinator leader. During leader failovers, all writes and reads of the active data are rejected until a connection to the active leader is re-established.

In the original version of the system, all queries to the active data set were forwarded to a singleton Titus Job Coordinator. The freshest data is served to all requests, and clients never observe read-your-write or monotonic-read consistency issues¹:

Data consistency on the Titus API is highly desirable as it simplifies client implementation. Causal consistency, which includes read-your-writes and monotonic-reads, frees clients from implementing client-side synchronization mechanisms. In PACELC terms we choose PC/EC and have the same level of availability for writes of our previous system while improving our theoretical availability for reads.

For example, a batch workflow orchestration system may create multiple jobs which are part of a single workflow execution. After the jobs are created, it monitors their execution progress. If the system creates a new job, followed immediately by a query to get its status, and there is a data propagation lag, it might decide that the job was lost and a replacement must be created. In that scenario, the system would need to deal with the data propagation latency directly, for example, by use of timeouts or client-originated update tracking mechanisms. As Titus API reads are always consistently reflecting the up-to-date state, such workarounds are not needed.

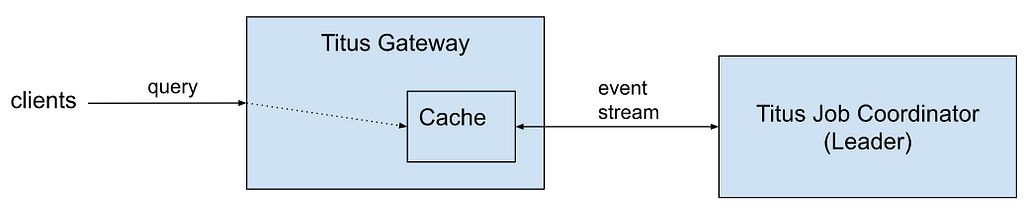
With traffic growth, a single leader node handling all request volume started becoming overloaded. We started seeing increased response latencies and leader servers running at dangerously high utilization. To mitigate this issue we decided to handle all query requests directly from Titus Gateway nodes but still preserve the original consistency guarantees:

The state from Titus Job Coordinator is replicated over a persistent stream connection, with low event propagation latencies. A new wire protocol provided by Titus Job Coordinator allows monitoring of the cache consistency level and guarantees that clients always receive the latest data version. The cache is kept in sync with the current leader process. When there is a failover (because of node failures with the current leader or a system upgrade), a new snapshot from the freshly elected leader is loaded, replacing the previous cache state. Titus Gateways handling client requests can now be horizontally scaled out. The details and workings of these mechanisms are the primary topics of this blog post.

How do I know that my cache is up to date?

It is an easy answer for systems that were built from the beginning with a consistent data versioning scheme and can depend on clients to follow the established protocol. Kubernetes is a good example here. Each object and each collection read from the Kubernetes cluster has a unique revision which is a monotonically increasing number. A user may request all changes since the last received revision. For more details, see Kubernetes API Concepts and the Shared Informer Pattern.

In our case, we did not want to change the API contract and impose additional constraints and requirements on our users. Doing so would require a substantial migration effort to move all clients off the old API with questionable value to the affected teams (except for helping us solve Titus' internal scalability problems). In our experience, such migrations require a nontrivial amount of work, particularly with the migration timeline not fully in our control.

To fulfill the existing API contract, we had to guarantee that for a request received at a time T₀, the data returned to the client is read from a cache that contains all state updates in Titus Job Coordinator up to time T₀.

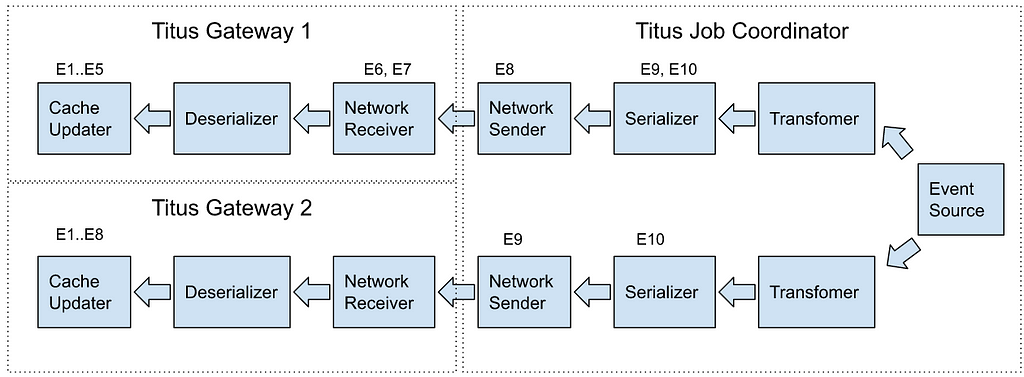
The path over which data travels from Titus Job Coordinator to a Titus Gateway cache can be described as a sequence of event queues with different processing speeds:

A message generated by the event source may be buffered at any stage. Furthermore, as each event stream subscription from Titus Gateway to Titus Job Coordinator establishes a different instance of the processing pipeline, the state of the cache in each gateway instance may be vastly different.

Let’s assume a sequence of events E₁…E₁₀, and their location within the pipeline of two Titus Gateway instances at time T₁:

If a client makes a call to Titus Gateway 2 at the time T₁, it will read version E₈ of the data. If it immediately makes a request to Titus Gateway 1, the cache there is behind with respect to the other gateway so the client might read an older version of the data.

In both cases, data is not up to date in the caches. If a client created a new object at time T₀, and the object value is captured by an event update E₁₀, this object will be missing in both gateways at time T₁. A surprise to the client who successfully completed a create request, but the follow-up query returned a not-found error (read-your-write consistency violation).

The solution is to flush all the events created up to time T₁ and force clients to wait for the cache to receive them all. This work can be split into two different steps each with its own unique solution.

Implementation details

We solved the cache synchronization problem (as stated above) with a combination of two strategies:

  • Titus Gateway <-> Titus Job Coordinator synchronization protocol over the wire.
  • Usage of high-resolution monotonic time sources like Java’s nano time within a single server process. Java’s nano time is used as a logical time within a JVM to define an order for events happening in the JVM process. An alternative solution based on an atomic integer values generator to order the events would suffice as well. Having the local logical time source avoids issues with distributed clock synchronization.

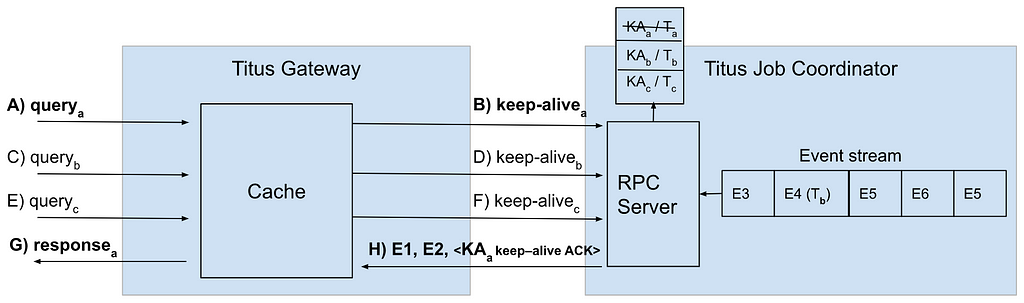
If Titus Gateways subscribed to the Titus Job Coordinator event stream without synchronization steps, the amount of data staleness would be impossible to estimate. To guarantee that a Titus Gateway received all state updates that happened until some time Tₙ an explicit synchronization between the two services must happen. Here is what the protocol we implemented looks like:

  1. Titus Gateway receives a client request (queryₐ).
  2. Titus Gateway makes a request to the local cache to fetch the latest version of the data.
  3. The local cache in Titus Gateway records the local logical time and sends it to Titus Job Coordinator in a keep-alive message (keep-aliveₐ).
  4. Titus Job Coordinator saves the keep-alive request together with the local logical time Tₐ of the request arrival in a local queue (KAₐ, Tₐ).
  5. Titus Job Coordinator sends state updates to Titus Gateway until the former observes a state update (event) with a timestamp past the recorded local logical time (E1, E2).
  6. At that time, Titus Job Coordinator sends an acknowledgment event for the keep-alive message (KAₐ keep-alive ACK).
  7. Titus Gateway receives the keep-alive acknowledgment and consequently knows that its local cache contains all state changes that happened up to the time when the keep-alive request was sent.
  8. At this point the original client request can be handled from the local cache, guaranteeing that the client will get a fresh enough version of the data (responseₐ).

This process is illustrated by the figure below:

The procedure above explains how to synchronize a Titus Gateway cache with the source of truth in Titus Job Coordinator, but it does not address how the internal queues in Titus Job Coordinator are drained to the point where all relevant messages are processed. The solution here is to add a logical timestamp to each event and guarantee a minimum time interval between messages emitted inside the event stream. If not enough events are created because of data updates, a dummy message is generated and inserted into the stream. Dummy messages guarantee that each keep-alive request is acknowledged within a bounded time, and does not wait indefinitely until some change in the system happens. For example:

Ta, Tb, Tc, Td, and Te are high-resolution monotonic logical timestamps. At time Td a dummy message is inserted, so the interval between two consecutive events in the event stream is always below a configurable threshold. These timestamp values are compared with keep-alive request arrival timestamps to know when a keep-alive acknowledgment can be sent.

There are a few optimization techniques that can be used. Here are those implemented in Titus:

  • Before sending a keep-alive request for each new client request, wait a fixed interval and send a single keep-alive request for all requests that arrived during that time. So the maximum rate of keep-alive requests is constrained by 1 / max_interval. For example, if max_interval is set to 5ms, the max keep alive request rate is 200 req / sec.
  • Collapse multiple keep-alive requests in Titus Job Coordinator, sending a response to the latest one which has the arrival timestamp less than that of the timestamp of the last event sent over the network. On the Titus Gateway side, a keep-alive response with a given timestamp acknowledges all pending requests with keep-alive timestamps earlier or equal to the received one.
  • Do not wait for cache synchronization on requests that do not have ordering requirements, serving data from the local cache on each Titus Gateway. Clients that can tolerate eventual consistency can opt into this new API for lower response times and increased availability.

Given the mechanism described so far, let’s try to estimate the maximum wait time of a client request that arrived at Titus Gateway for different scenarios. Let’s assume that the maximum keep alive interval is 5ms, and the maximum interval between events emitted in Titus Job Coordinator is 2ms.

Assuming that the system runs idle (no changes made to the data), and the client request arrives at a time when a new keep-alive request wait time starts, the cache update latency is equal to 7 milliseconds + network propagation delay + processing time. If we ignore the processing time and assume that the network propagation delay is <1ms given we have to only send back a small keep-alive response, we should expect an 8ms delay in the typical case. If the client request does not have to wait for the keep-alive to be sent, and the keep-alive request is acknowledged immediately in Titus Job Coordinator, the delay is equal to network propagation delay + processing time, which we estimated to be <1ms. The average delay introduced by cache synchronization is around 4ms.

Network propagation delays and stream processing times start to become a more important factor as the number of state change events and client requests increases. However, Titus Job Coordinator can now dedicate its capacity for serving high bandwidth streams to a finite number of Titus Gateways, relying on the gateway instances to serve client requests, instead of serving payloads to all client requests itself. Titus Gateways can then be scaled out to match client request volumes.

We ran empirical tests for scenarios of low and high request volumes, and the results are presented in the next section.

Performance test results

To show how the system performs with and without the caching mechanism, we ran two tests:

  • A test with a low/moderate load showing a median latency increase due to overhead from the cache synchronization mechanism, but better 99th percentile latencies.
  • A test with load close to the peak of Titus Job Coordinator capacity, above which the original system collapses. Previous results hold, showing better scalability with the caching solution.

A single request in the tests below consists of one query. The query is of a moderate size, which is a collection of 100 records, with a serialized response size of ~256KB. The total payload (request size times the number of concurrently running requests) requires a network bandwidth of ~2Gbps in the first test and ~8Gbps in the second one.

Moderate load level

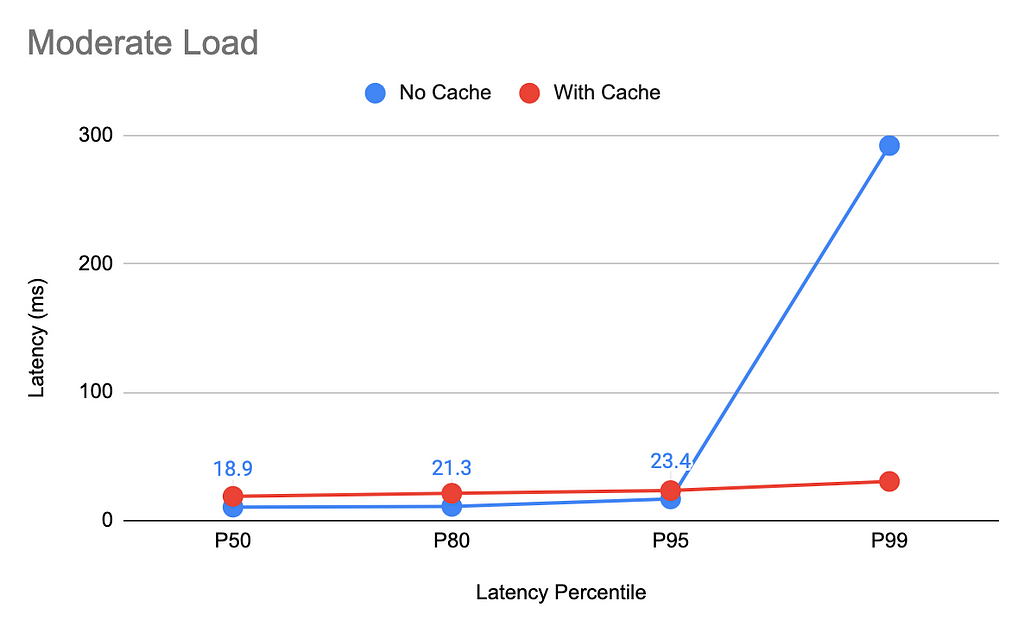
This test shows the impact of cache synchronization on query latency in a moderately loaded system. The query rate in this test is set to 1K requests/second.

Median latency without caching is half of what we observe with the introduction of the caching mechanism, due to the added synchronization delays. In exchange, the worst-case 99th percentile latencies are 90% lower, dropping from 292 milliseconds without a cache to 30 milliseconds with the cache.

Load level close to Titus Job Coordinator maximum

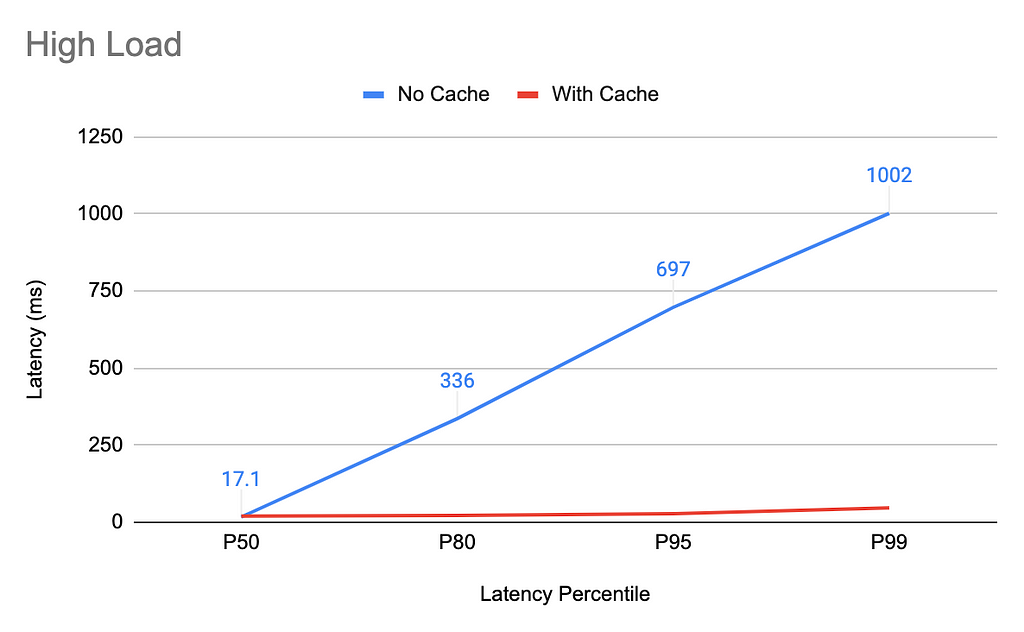
If Titus Job Coordinator has to handle all query requests (when the cache is not enabled), it handles the traffic well up to 4K test queries / second, and breaks down (sharp latency increase and a rapid drop of throughput) at around 4.5K queries/sec. The maximum load test is thus kept at 4K queries/second.

Without caching enabled the 99th percentile hovers around 1000ms, and the 80th percentile is around 336ms, compared with the cache-enabled 99th percentile at 46ms and 80th percentile at 22ms. The median still looks better on the setup with no cache at 17ms vs 19ms when the cache is enabled. It should be noted however that the system with caching enabled scales out linearly to more request load while keeping the same latency percentiles, while the no-cache setup collapses with a mere ~15% additional load increase.

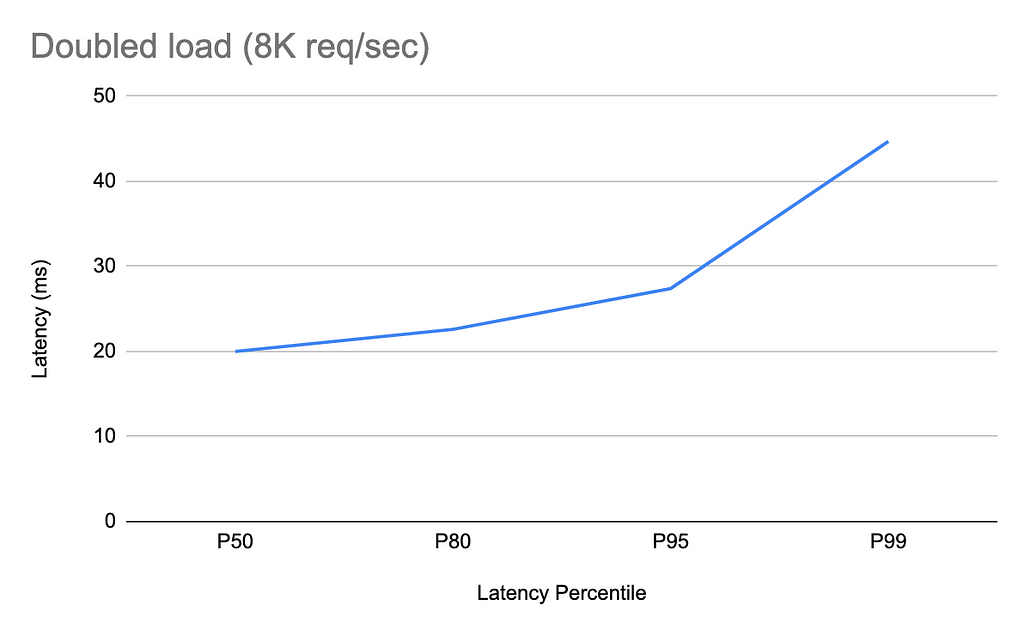
Doubling the load when the caching is enabled does not increase the latencies at all. Here are latency percentiles when running 8K query requests/second:

Conclusion

After reaching the limit of vertical scaling of our previous system, we were pleased to implement a real solution that provides (in a practical sense) unlimited scalability of Titus read-only API. We were able to achieve better tail latencies with a minor sacrifice in median latencies when traffic is low, and gained the ability to horizontally scale out our API gateway processing layer to handle growth in traffic without changes to API clients. The upgrade process was completely transparent, and no single client observed any abnormalities or changes in API behavior during and after the migration.

The mechanism described here can be applied to any system relying on a singleton leader elected component as the source of truth for managed data, where the data fits in memory and latency is low.

As for prior art, there is ample coverage of cache coherence protocols in the literature, both in the context of multiprocessor architectures (Adve & Gharachorloo, 1996) and distributed systems (Gwertzman & Seltzer, 1996). Our work fits within mechanisms of client polling and invalidation protocols explored by Gwertzman and Seltzer (1996) in their survey paper. Central timestamping to facilitate linearizability in read replicas is similar to the Calvin system (example real-world implementations in systems like FoundationDB) as well as the replica watermarking in AWS Aurora.

¹ Designing Data-Intensive Applications is an excellent book that goes into detail about consistency models discussed in this blog post.

² Adve, S. V., & Gharachorloo, K. (1996). Shared memory consistency models: A tutorial. computer, 29(12), 66–76.

³ Gwertzman, J., & Seltzer, M. I. (1996, January). World Wide Web Cache Consistency. In USENIX annual technical conference (Vol. 141, p. 152).


Consistent caching mechanism in Titus Gateway was originally published in Netflix TechBlog on Medium, where people are continuing the conversation by highlighting and responding to this story.

[$] A report from the 2022 Image-Based Linux Summit

Post Syndicated from original https://lwn.net/Articles/912774/

The first Image-Based Linux Summit was
held in Berlin on October 5 and 6, 2022. The main goal of this summit was to
agree on common concepts and tooling for how to build, deploy, and run modern,
secure, image-based Linux distributions — a project that that the organizers,
Christian Brauner, Luca Boccassi, and Lennart Poettering, have been working on
for some time. The result was a more refined vision of how Linux systems
can be built and deployed securely.

Use Amazon Inspector to manage your build and deploy pipelines for containerized applications

Post Syndicated from Scott Ward original https://aws.amazon.com/blogs/security/use-amazon-inspector-to-manage-your-build-and-deploy-pipelines-for-containerized-applications/

Amazon Inspector is an automated vulnerability management service that continually scans Amazon Web Services (AWS) workloads for software vulnerabilities and unintended network exposure. Amazon Inspector currently supports vulnerability reporting for Amazon Elastic Compute Cloud (Amazon EC2) instances and container images stored in Amazon Elastic Container Registry (Amazon ECR).

With the emergence of Docker in 2013, container technology has quickly moved from the experimentation phase into a viable production tool. Many customers are using containers to modernize their existing applications or as the foundations for new applications or services that they build. In this blog post, we’ll explore the process that Amazon Inspector takes to scan container images. We’ll also show how you can integrate Amazon Inspector into your containerized application build and deployment pipeline, and control pipeline steps based on the results of an Amazon Inspector container image scan.

Solution overview and walkthrough

The solution outlined in this post covers a deployment pipeline modeled in AWS CodePipeline. The source for the pipeline is AWS CodeCommit, and the build of the container image is performed by AWS CodeBuild. The solution uses a collection of AWS Lambda functions and an Amazon DynamoDB table to evaluate the container image status and make an automated decision about deploying the container image. Finally, the pipeline has a deploy stage that will deploy the container image into an Amazon Elastic Container Service (Amazon ECS) cluster. In this section, I’ll outline the key components of the solution and how they work. In the following section, Deploy the solution, I’ll walk you through how to actually implement the solution.

Although this solution uses AWS continuous integration and continuous delivery (CI/CD) services such as CodePipeline and CodeBuild, you can also build similar capabilities by using third-party CI/CD solutions. In addition to CodeCommit, other third-party code repositories such as GitHub or Amazon Simple Storage Service (Amazon S3) can be substituted in as a source for the pipeline.

Solution architecture

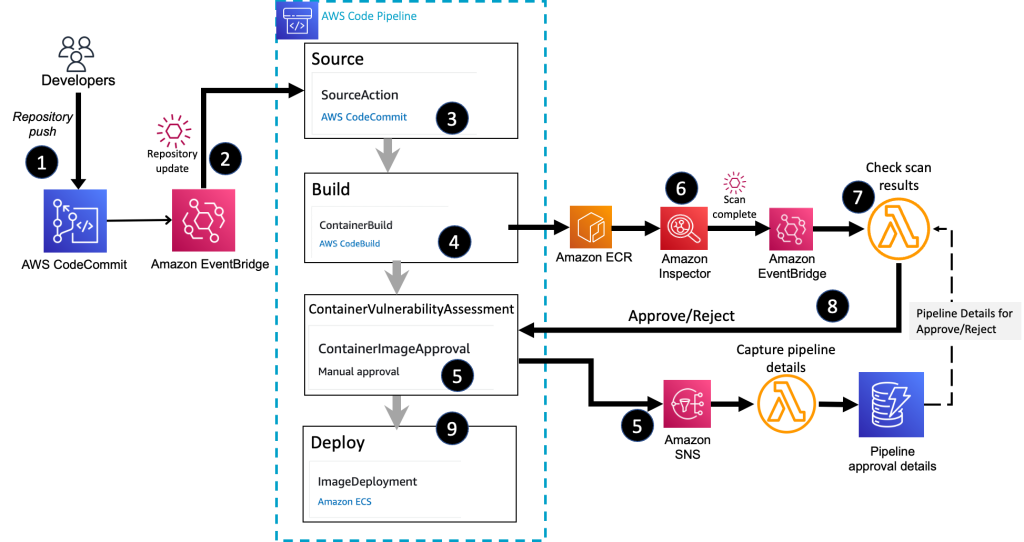
Figure 1 shows the high-level architecture of the solution, which integrates Amazon Inspector into a container build and deploy pipeline.

Figure 1: Overall container build and deploy architecture

Figure 1: Overall container build and deploy architecture

The high-level workflow is as follows:

  1. You commit the image definition to a CodeCommit repository.
  2. An Amazon EventBridge rule detects the repository commit and initiates the container pipeline.
  3. The source stage of the pipeline pulls the image definition and build instructions from the CodeCommit repository.
  4. The build stage of the pipeline creates the container image and stores the final image in Amazon ECR.
  5. The ContainerVulnerabilityAssessment stage sends out a request for approval by using an Amazon Simple Notification Service (Amazon SNS) topic. A Lambda function associated with the topic stores the details about the container image and the active pipeline, which will be needed in order to send a response back to the pipeline stage.
  6. Amazon Inspector scans the Amazon ECR image for vulnerabilities.
  7. The Lambda function receives the Amazon Inspector scan summary message, through EventBridge, and makes a decision on allowing the image to be deployed. The function retrieves the pipeline approval details so that the approve or reject message is sent to the correct active pipeline stage.
  8. The Lambda function submits an Approved or Rejected status to the deployment pipeline.
  9. CodePipeline deploys the container image to an Amazon ECS cluster and completes the pipeline successfully if an approval is received. The pipeline status is set to Failed if the image is rejected.

Container image build stage

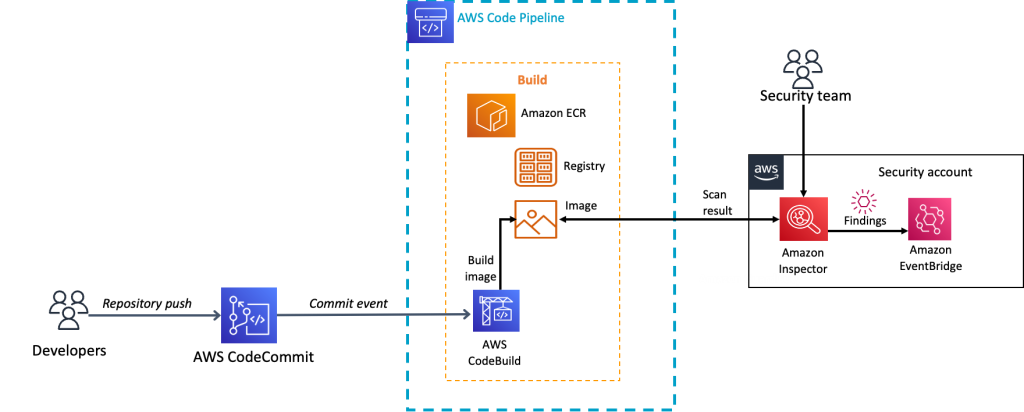
Let’s now review the build stage of the pipeline that is associated with the Amazon Inspector container solution. When a new commit is made to the CodeCommit repository, an EventBridge rule, which is configured to look for updates to the CodeCommit repository, initiates the CodePipeline source action. The source action then collects files from the source repository and makes them available to the rest of the pipeline stages. The pipeline then moves to the build stage.

In the build stage, CodeBuild extracts the Dockerfile that holds the container definition and the buildspec.yaml file that contains the overall build instructions. CodeBuild creates the final container image and then pushes the container image to the designated Amazon ECR repository. As part of the build, the image digest of the container image is stored as a variable in the build stage so that it can be used by later stages in the pipeline. Additionally, the build process writes the name of the container URI, and the name of the Amazon ECS task that the container should be associated with, to a file named imagedefinitions.json. This file is stored as an artifact of the build and will be referenced during the deploy phase of the pipeline.

Now that the image is stored in an Amazon ECR repository, Amazon Inspector scanning begins to check the image for vulnerabilities.

The details of the build stage are shown in Figure 2.

Figure 2: The container build stage

Figure 2: The container build stage

Container image approval stage

After the build stage is completed, the ContainerVulnerabilityAssessment stage begins. This stage is lightweight and consists of one stage action that is focused on waiting for an Approved or Rejected message for the container image that was created in the build stage. The ContainerVulnerabilityAssessment stage is configured to send an approval request message to an SNS topic. As part of the approval request message, the container image digest, from the build stage, will be included in the comments section of the message. The image digest is needed so that approval for the correct container image can be submitted later. Figure 3 shows the comments section of the approval action where the container image digest is referenced.

Figure 3: Container image digest reference in approval action configuration

Figure 3: Container image digest reference in approval action configuration

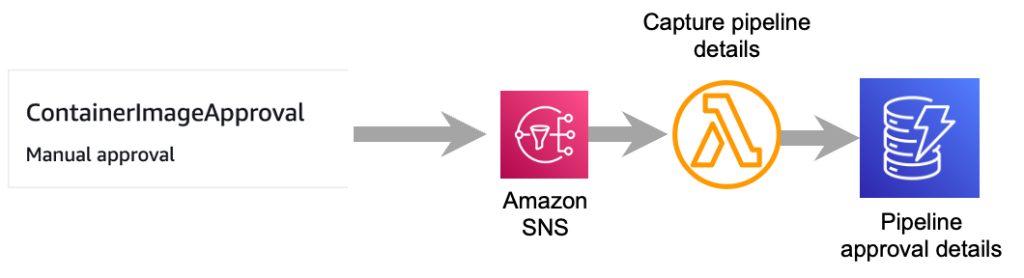
The SNS topic that the pipeline approval message is sent to is configured to invoke a Lambda function. The purpose of this Lambda function is to pull key details from the SNS message. Details retrieved from the SNS message include the pipeline name and stage, stage approval token, and the container image digest. The pipeline name, stage, and approval token are needed so that an approved or rejected response can be sent to the correct pipeline. The container image digest is the unique identifier for the container image and is needed so that it can be associated with the correct active pipeline. This information is stored in a DynamoDB table so that it can be referenced later when the step that assesses the result of an Amazon Inspector scan submits an approved or rejected decision for the container image. Figure 4 illustrates the flow from the approval stage through storing the pipeline approval data in DynamoDB.

Figure 4: Flow to capture container image approval details

Figure 4: Flow to capture container image approval details

This approval action will remain in a pending status until it receives an Approved or Rejected message or the timeout limit of seven days is reached. The seven-day timeout for approvals is the default for CodePipeline and cannot be changed. If no response is received in seven days, the stage and pipeline will complete with a Failed status.

Amazon Inspector and container scanning

When the container image is pushed to Amazon ECR, Amazon Inspector scans it for vulnerabilities.

In order to show how you can use the findings from an Amazon Inspector container scan in a build and deploy pipeline, let’s first review the workflow that occurs when Amazon Inspector scans a container image located in Amazon ECR.

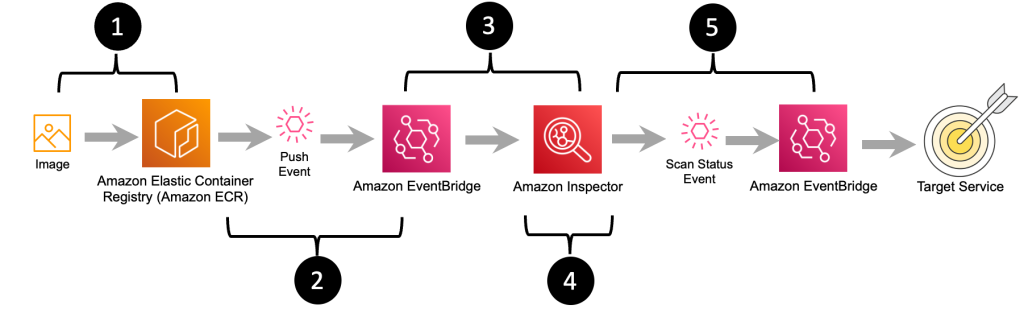
Figure 5: Image push, scan, and notification workflow

Figure 5: Image push, scan, and notification workflow

The workflow diagram in Figure 5 outlines the steps that happen after an image is pushed to Amazon ECR all the way to messaging that the image has been successfully scanned and what the final scan results are. The steps in this workflow are as follows:

  1. The final container image is pushed to Amazon ECR by an individual or as part of a build.
  2. Amazon ECR sends a message indicating that a new image has been pushed.
  3. The message about the new image is received by Amazon Inspector.
  4. Amazon Inspector pulls a copy of the container image from Amazon ECR and performs a vulnerability scan.
  5. When Amazon Inspector is done scanning the image, a message summarizing the severity of vulnerabilities that were identified during the container image scan is sent to Amazon EventBridge. You can create EventBridge rules that match the vulnerability summary message to route the message onto a target for notifications or to enable further action to be taken.

Here’s a sample EventBridge pattern that matches the scan summary message from Amazon Inspector.

{
  "detail-type": ["Inspector2 Scan"],
  "source": ["aws.inspector2"]
}

This entire workflow, from ingesting the initial image to sending out the status on the Amazon Inspector scan, is fully managed. You just focus on how you want to use the Amazon Inspector scan status message to govern the approval and deployment of your container image.

The following is a sample of what the Amazon Inspector vulnerability summary message looks like. Note, in bold, the container image Amazon Resource Name (ARN), image repository ARN, message detail type, image digest, and the vulnerability summary.

{
    "version": "0",
    "id": "bf67fc08-f522-f598-6946-8e7b372ba426",
    "detail-type": "Inspector2 Scan",
    "source": "aws.inspector2",
    "account": "<account id>",
    "time": "2022-05-25T16:08:17Z",
    "region": "us-east-2",
    "resources":
    [
        "arn:aws:ecr:us-east-2:<account id>:repository/vuln-images/vulhub/rsync"
    ],
    "detail":
    {
        "scan-status": "INITIAL_SCAN_COMPLETE",
        "repository-name": "arn:aws:ecr:us-east-2:<account id>:repository/vuln-images/vulhub/rsync",
        "finding-severity-counts": { "CRITICAL": 3, "HIGH": 16, "MEDIUM": 4, "TOTAL": 24 },
        "image-digest": "sha256:21ae0e3b7b7xxxx",
        "image-tags":
        [
            "latest"
        ]
    }
}

Processing Amazon Inspector scan results

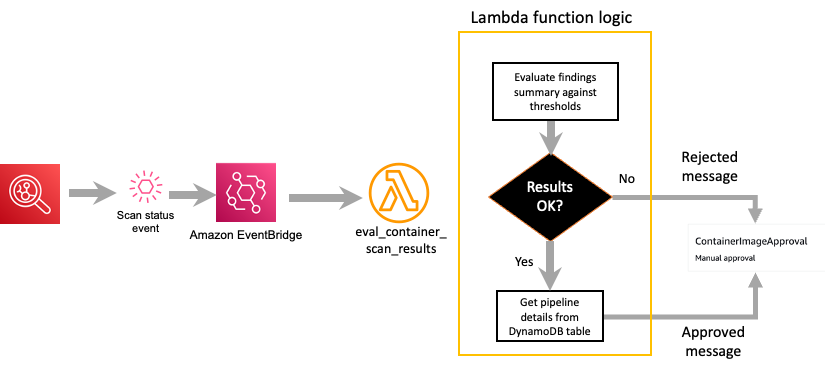
After Amazon Inspector sends out the scan status event, a Lambda function receives and processes that event. This function needs to consume the Amazon Inspector scan status message and make a decision about whether the image can be deployed.

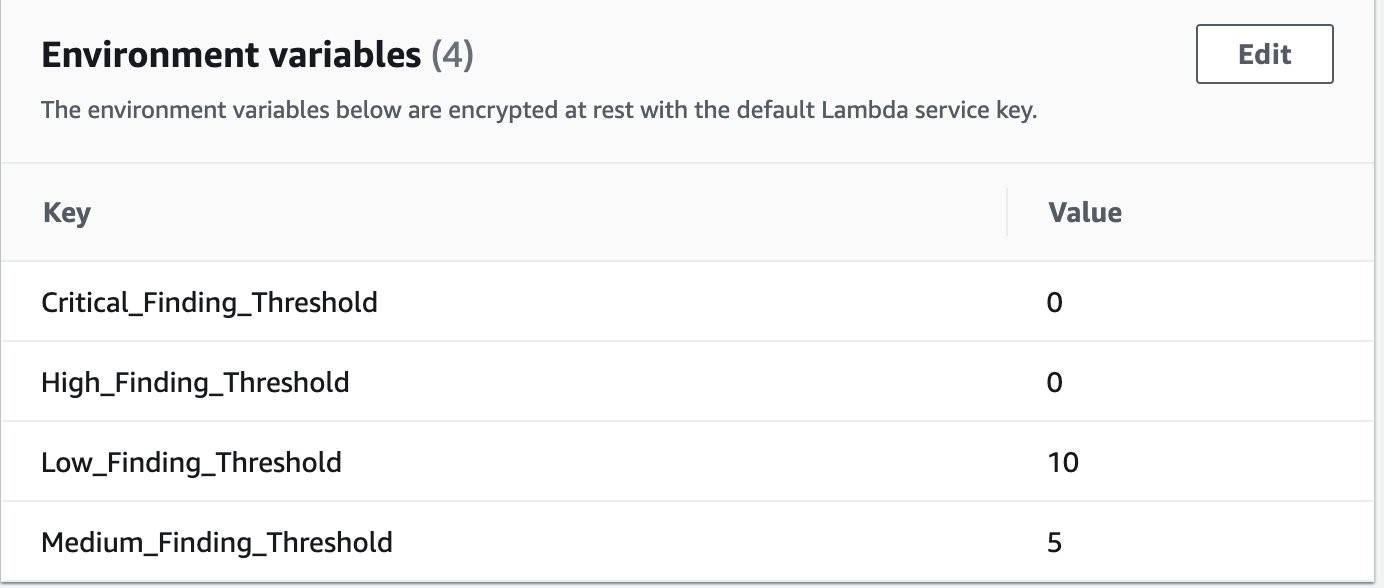
The eval_container_scan_results Lambda function serves two purposes: The first is to extract the findings from the Amazon Inspector scan message that invoked the Lambda function. The second is to evaluate the findings based on thresholds that are defined as parameters in the Lambda function definition. Based on the threshold evaluation, the container image will be flagged as either Approved or Rejected. Figure 6 shows examples of thresholds that are defined for different Amazon Inspector vulnerability severities, as part of the Lambda function.

Figure 6: Vulnerability thresholds defined in Lambda environment variables

Figure 6: Vulnerability thresholds defined in Lambda environment variables

Based on the container vulnerability image results, the Lambda function determines whether the image should be approved or rejected for deployment. The function will retrieve the details about the current pipeline that the image is associated with from the DynamoDB table that was populated by the image approval action in the pipeline. After the details about the pipeline are retrieved, an Approved or Rejected message is sent to the pipeline approval action. If the status is Approved, the pipeline continues to the deploy stage, which will deploy the container image into the defined environment for that pipeline stage. If the status is Rejected, the pipeline status is set to Rejected and the pipeline will end.

Figure 7 highlights the key steps that occur within the Lambda function that evaluates the Amazon Inspector scan status message.

Figure 7: Amazon Inspector scan results decision

Figure 7: Amazon Inspector scan results decision

Image deployment stage

If the container image is approved, the final image is deployed to an Amazon ECS cluster. The deploy stage of the pipeline is configured with Amazon ECS as the action provider. The deploy action contains the name of the Amazon ECS cluster and stage that the container image should be deployed to. The image definition file (imagedefinitions.json) that was created in the build stage is also listed in the deploy configuration. When the deploy stage runs, it will create a revision to the existing Amazon ECS task definition. This task definition contains the name of the Amazon ECR image that has been approved for deployment. The task definition is then deployed to the Amazon ECS cluster and service.

Deploy the solution

Now that you have an understanding of how the container pipeline solution works, you can deploy the solution to your own AWS account. This section will walk you through the steps to deploy the container approval pipeline, and show you how to verify that each of the key steps is working.

Step 1: Activate Amazon Inspector in your AWS account

The sample solution provided by this blog post requires that you activate Amazon Inspector in your AWS account. If this service is not activated in your account, learn more about the free trial and pricing for this service, and follow the steps in Getting started with Amazon Inspector to set up the service and start monitoring your account.

Step 2: Deploy the AWS CloudFormation template

For this next step, make sure you deploy the template within the AWS account and AWS Region where you want to test this solution.

To deploy the CloudFormation stack

  1. Choose the following Launch Stack button to launch a CloudFormation stack in your account. Use the AWS Management Console navigation bar to choose the region you want to deploy the stack in.

    Select this image to open a link that starts building the CloudFormation stack

  2. Review the stack name and the parameters for the template. The parameters are pre-populated with the necessary values, and there is no need to change them.
  3. Scroll to the bottom of the Quick create stack screen and select the checkbox next to I acknowledge that AWS CloudFormation might create IAM resources.
  4. Choose Create stack. The deployment of this CloudFormation stack will take 3–5 minutes.

After the CloudFormation stack has deployed successfully, you can proceed to reviewing and interacting with the deployed solution.

Step 3: Review the container pipeline and supporting resources

The CloudFormation stack is designed to deploy a collection of resources that will be used for an initial container build. When the CodePipeline resource is created, it will automatically pull the assets from the CodeCommit repository and start the pipeline for the container image.

To review the pipeline and resources

  1. In the CodePipeline console, navigate to the Region that the stack was deployed in.
  2. Choose the pipeline named ContainerBuildDeployPipeline to show the full pipeline details.
  3. Review the Source and Build stage, which will show a status of Succeeded.
  4. Review the ContainerVulnerabilityAssessment stage, which will show as failed with a Rejected status in the Manual Approval step.

    Figure 8 shows the full completed pipeline.

    Figure 8: Rejected container pipeline

    Figure 8: Rejected container pipeline

  5. Choose the Details link in the Manual Approval stage to reveal the reasons for the rejection. An example review summary is shown in Figure 9.
    Figure 9: Container pipeline approval rejection

    Figure 9: Container pipeline approval rejection

Review findings in Amazon Inspector (Optional)

You can use the Amazon Inspector console to see the full findings detail for this container image, if needed.

To view the findings in Amazon Inspector

  1. In the Amazon Inspector console, under Findings, choose By repository.
  2. From the list of repositories, choose the inspector-blog-images repository.
  3. Choose the Image tag link to bring up a list of the individual vulnerabilities that were found within the container image. Figure 10 shows an example of the vulnerabilities list in the findings details.
    Figure 10: Container image findings in Amazon Inspector

    Figure 10: Container image findings in Amazon Inspector

Step 4: Adjust the Amazon ECS desired count for the cluster service

Up to this point, you’ve deployed a pipeline to build and validate the container image, and you’ve seen an example of how the pipeline handles a container image that did not meet the defined vulnerability thresholds. Now you’ll deploy a new container image that will pass a vulnerability assessment and complete the pipeline.

The Amazon ECS service that the CloudFormation template deploys is initially created with the number of desired tasks set to 0. In order to allow the container pipeline to successfully deploy a container, you need to update the desired tasks value.

To adjust the task count in Amazon ECS (console)

  1. In the Amazon ECS console, choose the link for the cluster, in this case InspectorBlogCluster.
  2. On the Services tab, choose the link for the service named InspectorBlogService.
  3. Choose the Update button. On the Configure service page, set Number of tasks to 1.
  4. Choose Skip to review, and then choose Update Service.

To adjust the task count in Amazon ECS (AWS CLI)

Alternatively, you can run the following AWS CLI command to update the desired task count to 1. In order to run this command, you need the ARN of the Amazon ECS cluster, which you can retrieve from the Output tab of the CloudFormation stack that you created. You can run this command from the command line of an environment of your choosing, or by using AWS CloudShell. Make sure to replace <Cluster ARN> with your own value.

$ aws ecs update-service --cluster <Cluster ARN> --service InspectorBlogService --desired-count 1

Step 5: Build and deploy a new container image

Deploying a new container image will involve pushing an updated Dockerfile to the ContainerComponentsRepo repository in CodeCommit. With CodeCommit you can interact by using standard Git commands from a command line prompt, and there are multiple approaches that you can take to connect to the AWS CodeCommit repository from the command line. For this post, in order to simplify the interactions with CodeCommit, you will be shown how to add an updated file directly through the CodeCommit console.

To add an updated Dockerfile to CodeCommit

  1. In the CodeCommit console, choose the repository named ContainerComponentsRepo.
  2. In the screen listing the repository files, choose the Dockerfile file link and choose Edit.
  3. In the Edit a file form, overwrite the existing file contents with the following command:
    FROM public.ecr.aws/amazonlinux/amazonlinux:latest
  4. In the Commit changes to main section, fill in the following fields.
    1. Author name: your name
    2. Email address: your email
    3. Commit message: ‘Updated Dockerfile’

    Figure 11 shows what the completed form should look like.

    Figure 11: Complete CodeCommit entry for an updated Dockerfile

    Figure 11: Complete CodeCommit entry for an updated Dockerfile

  5. Choose Commit changes to save the new Dockerfile.

This update to the Dockerfile will immediately invoke a new instance of the container pipeline, where the updated container image will be pulled and evaluated by Amazon Inspector.

Step 6: Verify the container image approval and deployment

With a new pipeline initiated through the push of the updated Dockerfile, you can now review the overall pipeline to see that the container image was approved and deployed.

To see the full details in CodePipeline

  1. In the CodePipeline console, choose the container-build-deploy pipeline. You should see the container pipeline in an active status. In about five minutes, you should see the ContainerVulnerabilityAssessment stage move to completed with an Approved status, and the deploy stage should show a Succeeded status.
  2. To confirm that the final image was deployed to the Amazon ECS cluster, from the Deploy stage, choose Details. This will open a new browser tab for the Amazon ECS service.
  3. In the Amazon ECS console, choose the Tasks tab. You should see a task with Last status showing RUNNING. This is confirmation that the image was successfully approved and deployed through the container pipeline. Figure 12 shows where the task definition and status are located.
    Figure 12: Task status after deploying the container image

    Figure 12: Task status after deploying the container image

  4. Choose the task definition to bring up the latest task definition revision, which was created by the deploy stage of the container pipeline.
  5. Scroll down in the task definition screen to the Container definitions section. Note that the task is tied to the image you deployed, providing further verification that the approved container image was successfully deployed. Figure 13 shows where the container definition can be found and what you should expect to see.
    Figure 13: Container associated with revised task definition

    Figure 13: Container associated with revised task definition

Clean up the solution

When you’re finished deploying and testing the solution, use the following steps to remove the solution stack from your account.

To delete images from the Amazon ECR repository

  1. In the Amazon ECR console, navigate to the AWS account and Region where you deployed the solution.
  2. Choose the link for the repository named inspector-blog-images.
  3. Delete all of the images that are listed in the repository.

To delete objects in the CodePipeline artifact bucket

  1. In the Amazon S3 console in your AWS account, locate the bucket whose name starts with blog-base-setup-codepipelineartifactstorebucket.
  2. Delete the ContainerBuildDeploy folder that is in the bucket.

To delete the CloudFormation stack

  • In the CloudFormation console, delete the CloudFormation stack that was created to perform the steps in this post.

Conclusion

This post describes a solution that allows you to build your container images, have the images scanned for vulnerabilities by Amazon Inspector, and use the output from Amazon Inspector to determine whether the image should be allowed to be deployed into your environments.

This solution represents a pipeline with very simple build and deploy stages. Your pipeline will vary and may consist of multiple test stages and deployment stages for multiple environments. Additionally, the logic you use to determine whether a container image should be deployed may be different. The contents of this blog post are intended to help serve as a foundation that you can build on as you decide how to use Amazon Inspector for container vulnerability scanning. Feel free to use this guidance, and the example we provided, to extend the solution into your specific deployment pipeline.

 
If you have questions, contact AWS Support, or start a new thread on the AWS re:Post Amazon Inspector Forum. If you have feedback about this post, submit comments in the Comments section below.

Want more AWS Security news? Follow us on Twitter.
Scott Ward

Scott Ward

Scott is a Principal Solutions Architect with the External Security Services (ESS) product team and has been with Amazon for over 20 years. Scott provides technical guidance to customers on how to use security services to protect their AWS environments. Past roles included technical lead for the AWS security partner segment and member of the technical team for Amazon.com’s global financial systems.
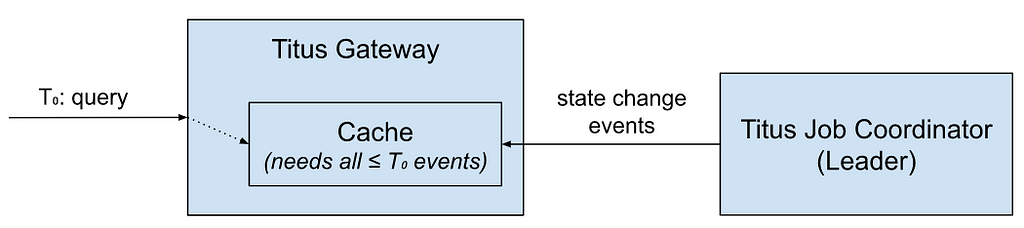
The collective thoughts of the interwebz