Security updates for Thursday

Post Syndicated from original https://lwn.net/Articles/908137/

Security updates have been issued by Debian (nova, pcs, and rails), Fedora (firejail, moby-engine, and pspp), Oracle (.NET 6.0, gnupg2, kernel, python3, and rsyslog rsyslog7), Red Hat (.NET 6.0 and .NET Core 3.1), SUSE (kernel), and Ubuntu (intel-microcode, poppler, and webkit2gtk).

Take part in Moonhack 2022: Community, culture, coding

Post Syndicated from Isabel Ronaldson original https://www.raspberrypi.org/blog/moonhack-2022/

In 2016, Code Club Australia launched the Moonhack online coding event and broke the world record for the most children coding in one day. Then in 2017 they broke the record again. By now, more than 150,000 young learners from 70 countries have participated in Moonhack.

A girl with a laptop in a space station replica.
Moonhack inspires young people to celebrate humans’ technological achievements through fun coding projects.

Moonhack is an online coding challenge for young learners and celebrates humans’ technological achievements. The 2022 event takes place from 10 to 23 October to coincide with World Space Week, and it features six brand-new projects that show how satellites can help us live more sustainably. We caught up with Kaye North, Community and Engagement Manager at Code Club Australia, to find out more.

What will this year’s Moonhack bring? 

Kaye developed this year’s projects across Scratch, micro:bit, and Python to cater for learners with all levels of coding experience. One project was designed in collaboration with astrophysicist Dr Brad Tucker from the Australian National University. Another project highlights that objects in the sky have been meaningful for humans since way before the advent of modern satellites. Kaye developed this project together with a community in the Torres Strait.

The earth seen from space, with a satellite in view.
By coding a project in this year’s Moonhack, young people will learn about satellites.

“The Torres Strait is a unique part of Australia off the tip of Queensland,” Kaye told us. “It’s this amazing group of islands. As a teacher I taught there for three years and learned a lot about the community’s culture.” When a colleague suggested a project about Tagai — a constellation central to Torres Strait Islander culture — Kaye jumped at the chance to work with the island community again.

The Tagai constellation of Torres Strait Islander culture.
One of this year’s Moonhack projects teaches about Tagai, a constellation central to Torres Strait Islander culture.

Kaye initially intended to work with a Torres Strait elder, “but that really snowballed. I had two days at a Tagai school, where the cultural teacher shared his story about the Tagai constellation. I worked with a Year 6 class, coding and putting ideas together, creating this one amazing project. And as we were pulling it together, one of the girls said ‘We need to put our language into it, we should be able to speak in it.’ And that’s where the idea of having the kids’ voices in the project came from.”

What will young learners gain from taking part in Moonhack?

Moonhack 2021 had over 25,000 participants, and Kaye wants to share the Tagai project with as many people in 2022. When we asked her what else she hopes young people take away from Moonhack this year, she said:

“I hope that people really get the connection to satellites in space and how these are going to influence us fulfilling the United Nations’ Sustainable Development Goals. I really hope that comes through. Big picture though? That the kids have fun.”

Moonhack 2022 runs from 10 to 23 October and is free and open to any young coder, whether they are part of a Code Club or not. The projects are already available in English, French, Dutch, and Greek. Arabic and Latin American Spanish versions are in preparation.

To take part with your young people, register on the Moonhack website.

Code Club Australia is powered by Telstra Foundation as part of a strategic partnership with the Raspberry Pi Foundation.

The post Take part in Moonhack 2022: Community, culture, coding appeared first on Raspberry Pi.

git signatures with SSH certificates

Post Syndicated from original https://mjg59.dreamwidth.org/60916.html

Last night I complained that git’s SSH signature format didn’t support using SSH certificates rather than raw keys, and was swiftly corrected, once again highlighting that the best way to make something happen is to complain about it on the internet in order to trigger the universe to retcon it into existence to make you look like a fool. But anyway. Let’s talk about making this work!

git’s SSH signing support is actually just it shelling out to ssh-keygen with a specific set of options, so let’s go through an example of this with ssh-keygen. First, here’s my certificate:

$ ssh-keygen -L -f id_aurora-cert.pub
id_aurora-cert.pub:
Type: [email protected] user certificate
Public key: ECDSA-CERT SHA256:(elided)
Signing CA: RSA SHA256:(elided)
Key ID: "[email protected]"
Serial: 10505979558050566331
Valid: from 2022-09-13T17:23:53 to 2022-09-14T13:24:23
Principals:
[email protected]
Critical Options: (none)
Extensions:
permit-agent-forwarding
permit-port-forwarding
permit-pty

Ok! Now let’s sign something:

$ ssh-keygen -Y sign -f ~/.ssh/id_aurora-cert.pub -n git /tmp/testfile
Signing file /tmp/testfile
Write signature to /tmp/testfile.sig

To verify this we need an allowed signatures file, which should look something like:

*@aurora.tech cert-authority ssh-rsa AAA(elided)

Perfect. Let’s verify it:

$ cat /tmp/testfile | ssh-keygen -Y verify -f /tmp/allowed_signers -I [email protected] -n git -s /tmp/testfile.sig
Good "git" signature for [email protected] with ECDSA-CERT key SHA256:(elided)

Woo! So, how do we make use of this in git? Generating the signatures is as simple as

$ git config --global commit.gpgsign true
$ git config --global gpg.format ssh
$ git config --global user.signingkey /home/mjg59/.ssh/id_aurora-cert.pub

and then getting on with life. Any commits will now be signed with the provided certificate. Unfortunately, git itself won’t handle verification of these – it calls ssh-keygen -Y find-principals which doesn’t deal with wildcards in the allowed signers file correctly, and then falls back to verifying the signature without making any assertions about identity. Which means you’re going to have to implement this in your own CI by extracting the commit and the signature, extracting the identity from the commit metadata and calling ssh-keygen on your own. But it can be made to work!

But why would you want to? The current approach of managing keys for git isn’t ideal – you can kind of piggy-back off github/gitlab SSH key infrastructure, but if you’re an enterprise using SSH certificates for access then your users don’t necessarily have enrolled keys to start with. And using certificates gives you extra benefits, such as having your CA verify that keys are hardware-backed before issuing a cert. Want to ensure that whoever made a commit was actually on an authorised laptop? Now you can!

I’ll probably spend a little while looking into whether it’s plausible to make the git verification code work with certificates or whether the right thing is to fix up ssh-keygen -Y find-principals to work with wildcard identities, but either way it’s probably not much effort to get this working out of the box.

comment count unavailable comments

New – Direct VPC Routing Between On-Premises Networks and AWS Outposts Rack

Post Syndicated from Steve Roberts original https://aws.amazon.com/blogs/aws/new-direct-vpc-routing-between-on-premises-networks-and-aws-outposts-rack/

Today, we announced direct VPC routing for AWS Outposts rack. This enables you to connect Outposts racks and on-premises networks using simplified IP address management. Direct VPC routing automatically advertises Amazon Virtual Private Cloud (Amazon VPC) subnet CIDR addresses to on-premises networks. This enables you to use the private IP addresses of resources in your VPC when communicating with your on-premises network. Furthermore, you can enable direct VPC routing using a self-serve process without needing to contact AWS.

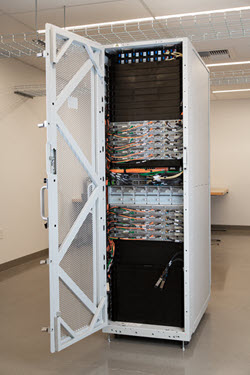
AWS Outposts rack

If you’re unfamiliar, AWS Outposts rack, a part of the Outposts family, is a fully-managed service that offers the same AWS infrastructure, AWS services, APIs, and tools to virtually any on-premises datacenter or co-location space for a consistent hybrid experience. They’re ideal for workloads that require low-latency access to on-premises systems, local data processing, data residency, and migration of applications with local system interdependencies. Once installed, your Outposts rack becomes an extension of your VPC, and it’s managed using the same APIs, tools, and management controls that you already use in the cloud.

With direct VPC routing, you now have two options to configure and connect your Outposts rack to your on-premises networks. Previously, to configure network routing between an on-premises network and an Outposts rack, you needed to use Customer-owned IP addresses (CoIP). During an Outposts rack installation, this involved providing a separate IP address range/CIDR from your on-premises network for AWS to create an address pool, which is known as a CoIP pool. When an Amazon Elastic Compute Cloud (Amazon EC2) instance on your Outposts rack needed to communicate with your on-premises network, Outposts rack would perform a 1:1 network address translation (NAT) from the VPC private IP address to a CoIP address in the CoIP pool. Using CoIP means that you must manage both VPC and CoIP address pools, without overlap, and configure route propagation between the two sets of addresses. When adding a subnet to a VPC, you also needed to follow several steps to update route propagation between your networks to recognize the new subnet addresses.

Managing IP address ranges for AWS cloud and onsite resources, as well as dealing with CoIP ranges on Outposts rack, can be an operational burden. Although the option to use CoIP is still available and will continue to be fully supported, the new direct VPC routing option simplifies your IP address management. Automatic advertisement of CIDR addresses for subnets, including new subnets added in the future, between the VPC and your Outposts rack, removes the need for you to reconfigure IP addresses. This also keeps route propagation up-to-date, thereby saving you time and effort. Furthermore, as mentioned earlier, you can enable all of this with a self-serve option.

Enabling Direct VPC Routing
You can select either CoIP or direct VPC routing approaches and utilize a new self-service API, CreateLocalGatewayRouteTable, to configure direct VPC routing for both new and existing Outposts racks. This eliminates the need to contact AWS to enable the configuration. To enable direct VPC routing, simply set the mode property in the CreateLocalGatewayRouteTable API’s request parameters to the value direct-vpc-routing. If you’re already using CoIP, then you must delete and recreate the route table that’s propagating traffic between the Outposts rack and your on-premises network.

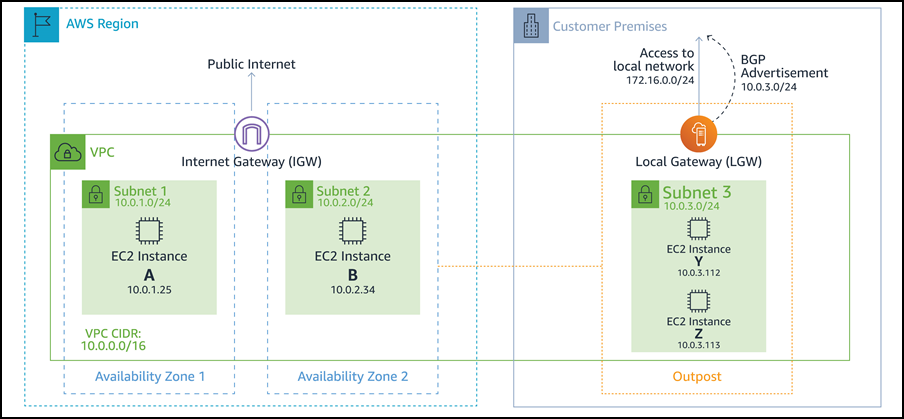
The following example diagram, taken from the user guide, illustrates the setup for an Outposts rack running several Amazon EC2 instances and connected to an on-premises network, with automatic address advertisement. Note that private IP address ranges are utilized across the Outposts rack resources and the on-premises network.

Example of direct VPC routing

Get started with Direct VPC Routing today
The option to enable direct VPC routing is available now for both new and existing Outposts racks. As mentioned earlier, the option to use CoIP will continue to be supported, but now you can choose between direct VPC routing and CoIP based on your on-premises networking needs. Direct VPC routing is available in all AWS Regions where Outposts rack is supported.

Find more information on this topic in the AWS Outposts User Guide. More information on AWS Outposts rack is available here.

— Steve

Amazon introduces dynamic intermediate certificate authorities

Post Syndicated from Adina Lozada original https://aws.amazon.com/blogs/security/amazon-introduces-dynamic-intermediate-certificate-authorities/

AWS Certificate Manager (ACM) is a managed service that lets you provision, manage, and deploy public and private Secure Sockets Layer/Transport Layer Security (SSL/TLS) certificates for use with Amazon Web Services (AWS) and your internal connected resources. Starting October 11, 2022, at 9:00 AM Pacific Time, public certificates obtained through ACM will be issued from one of the multiple intermediate certificate authorities (CAs) that Amazon manages. In this blog post, we share important details about this change and how you can prepare.

What is changing and why?

Public certificates that you request through ACM are obtained from Amazon Trust Services, which is a public certificate authority (CA) that Amazon manages. Like other public CAs, Amazon Trust Services CAs have a structured trust hierarchy. The public certificate issued to you, also known as the leaf certificate, can chain to one or more intermediate CAs and then to the Amazon Trust Services root CA. The Amazon Trust Services root CA is trusted by default by most and operating systems. This is why Amazon can issue public certificates that are trusted by these systems.

Starting October 11, 2022 at 9:00 AM Pacific Time, public certificates obtained through ACM will be issued from one of the multiple intermediate CAs that Amazon manages. These intermediate CAs chain to an existing Amazon Trust Services root CA. With this change, leaf certificates issued to you will be signed by different intermediate CAs. Before this change, Amazon maintained a limited number of intermediate CAs and issued and renewed certificates from the same intermediate CAs.

Amazon is making this change to create a more resilient and agile certificate infrastructure that will help us respond more quickly to future requirements. This change also presents an opportunity to correct a known issue related to delayed revocation of a subordinate CA and help minimize the scope of impact for new risks that might emerge in the future.

What can I do to prepare?

Most customers won’t experience an impact from this change. Browsers and most applications will continue to work just as they do now, because these services trust the Amazon Trust Services root CA and not a specific intermediate CA. If you’re using one of the standard operating systems and web browsers that are listed in the next section of this post, you don’t need to take any action.

If you use intermediate CA information through certificate pinning, you will need to make changes and pin to an Amazon Trust Services root CA instead of an intermediate CA or leaf certificate. Certificate pinning is a process in which your application that initiates the TLS connection only trusts a specific public certificate through one or more certificate variables that you define. If the pinned certificate is replaced, your application won’t initiate the connection. AWS recommends that you don’t use certificate pinning because it introduces an availability risk. However, if your use case requires certificate pinning, AWS recommends that you pin to an Amazon Trust Services root CA instead of an intermediate CA or leaf certificate. When you pin to an Amazon Trust Services root CA, you should pin to all of the root CAs shown in the following table.

Amazon Trust Services root CA certificates

Distinguished name SHA-256 hash of subject public key information Test URL
CN=Amazon Root CA
1,O=Amazon,C=US
fbe3018031f9586bcbf41727e417b7d1c45c2f47f93be372a17b96b50757d5a2 Test URL
CN=Amazon Root CA
2,O=Amazon,C=US
7f4296fc5b6a4e3b35d3c369623e364ab1af381d8fa7121533c9d6c633ea2461 Test URL
CN=Amazon Root CA
3,O=Amazon,C=US
36abc32656acfc645c61b71613c4bf21c787f5cabbee48348d58597803d7abc9 Test URL
CN=Amazon Root CA
4,O=Amazon,C=US
f7ecded5c66047d28ed6466b543c40e0743abe81d109254dcf845d4c2c7853c5 Test URL

To test that your trust store contains the Amazon Trust Services root CA, see the preceding table, which lists the Amazon Trust Services root CA certificates, and choose each test URL in the table. If the test URL works, you should see a message that says Expected Status: Good, along with the certificate chain. If the test URL doesn’t work, you will receive an error message that indicates the connection has failed.

What should I do if the Amazon Trust Services CAs are not in my trust store?

If your application is using a custom trust store, you must add the Amazon Trust Services root CAs to your application’s trust store. The instructions for doing this vary based on the application or service. Refer to the documentation for the application or service that you’re using.

If your tests of any of the test URLs failed, you must update your trust store. The simplest way to update your trust store is to upgrade the operating system or browser that you’re using.

The following operating systems use the Amazon Trust Services CAs:

  • Amazon Linux (all versions)
  • Microsoft Windows versions, with updates installed, from January 2005, Windows Vista, Windows 7, Windows Server 2008, and newer versions
  • Mac OS X 10.4 with Java for Mac OS X 10.4 Release 5, Mac OS X 10.5, and newer versions
  • Red Hat Enterprise Linux 5 (March 2007 release), Linux 6, and Linux 7 and CentOS 5, CentOS 6, and CentOS 7
  • Ubuntu 8.10
  • Debian 5.0
  • Java 1.4.2_12, Java 5 update 2, and all newer versions, including Java 6, Java 7, and Java 8

Modern browsers trust Amazon Trust Services CAs. To update the certificate bundle in your browser, update your browser. For instructions on how to update your browser, see the update page for your browser:

Where can I get help?

If you have questions, contact AWS Support or your technical account manager (TAM), or start a new thread on the AWS re:Post ACM Forum. If you have feedback about this post, submit comments in the Comments section below.

Want more AWS Security news? Follow us on Twitter.

Adina Lozada

Adina Lozada

Adina is a Principal Technical Program Manager on the Amazon Certificate Manager (ACM) team with over 18 years of professional experience as a multi-disciplined, security careerist in both public and private sector. She works with AWS services to help make complex, cross-functional program delivery faster for our customers.

Chandan Kundapur

Chandan Kundapur

Chandan is a, Sr. Technical Product Manager on the Amazon Certificate Manager (ACM) team. With over 15 years of cyber security experience, he has a passion for driving our product strategy to help AWS customers identify and secure their resources and endpoints with public and private certificates.

[Security Nation] Chris Levendis and Lisa Olson on Cloud CVEs

Post Syndicated from Rapid7 original https://blog.rapid7.com/2022/09/14/security-nation-chris-levendis-and-lisa-olson-on-cloud-cves/

[Security Nation] Chris Levendis and Lisa Olson on Cloud CVEs

In this episode of Security Nation, Jen and Tod chat with Chris Levendis of MITRE and Lisa Olson of Microsoft about assigning CVE IDs for vulnerabilities affecting cloud solutions. They recount their experiences working with the CVE board to establish guidelines for disclosing cloud vulnerabilities and talk through some of the challenges in understanding responsibility for mitigating and managing risks in the cloud.

Stick around for our Rapid Rundown, where Tod and Jen talk about a helpful new feature in iOS 16 that allows users to tell their devices to forget certain Wi-Fi networks, as well as RFC 9293, the newly dropped transmission control protocol (TCP) that obsoletes RFC 793.

Chris Levendis

[Security Nation] Chris Levendis and Lisa Olson on Cloud CVEs

Chris Levendis is a Principal Systems Engineer in the Cybersecurity Operations & Integration department in the Center for Securing the Homeland at MITRE. He has supported various DHS missions since 2004, including infrastructure protection and cybersecurity. Currently, in support of the Cybersecurity and Infrastructure Security Agency (CISA), Chris leads the Homeland Security Systems Engineering and Development Institute’s (HSSEDI) work for Threat Hunting, Office of the Chief Technology Officer (OCTO), Common Vulnerabilities and Exposures (CVE), Common Weakness Enumeration (CWE), and Common Attack Pattern Enumeration and Classification (CAPEC).  

Lisa Olson

[Security Nation] Chris Levendis and Lisa Olson on Cloud CVEs

Lisa Olson has been in the business of developing technology and products to manage complex networks and network devices since the 1980s. She started her career working as a software engineer for IBM and has gone on to management positions for large companies including Boeing and Jupiter/Media Metrix.

For the last 10 years, Lisa has immersed herself in cybersecurity by managing Microsoft’s monthly Security Update releases (aka Patch Tuesday). Under her leadership, Patch Tuesday has undergone digital transformation from a primarily manual labor-intensive production of security bulletins for a relatively small number of products, to a highly automated all-electronic environment supporting hundreds of products including Microsoft’s Azure via a database and APIs. The Security Update Guide is published by Lisa’s team every month and provides information about Microsoft’s CVE list.

Show notes

Interview links

Rapid Rundown links

Like the show? Want to keep Jen and Tod in the podcasting business? Feel free to rate and review with your favorite podcast purveyor, like Apple Podcasts.

Want More Inspiring Stories From the Security Community?

Subscribe to Security Nation Today

Scaling Git’s garbage collection (GitHub blog)

Post Syndicated from original https://lwn.net/Articles/908035/

The GitHub blog has a
detailed look at garbage collection in Git
and the work that has been
done to make it faster.

To solve this problem, we turned to a long-discussed idea on the
Git mailing list: cruft packs. The idea is simple: store an
auxiliary list of mtime data alongside a pack containing
just unreachable objects. To garbage collect a repository, Git
places the unreachable objects in a pack. That pack is designated
as a “cruft pack” because Git also writes the mtime data
corresponding to each object in a separate file alongside that
pack. This makes it possible to update the mtime of a
single unreachable object without changing the mtimes of
any other unreachable object.

Unicode 15 released

Post Syndicated from original https://lwn.net/Articles/908032/

Version
15
of the Unicode standard has been released.

This version adds 4,489 characters, bringing the total to 149,186
characters. These additions include two new scripts, for a total of
161 scripts, along with 20 new emoji characters, and 4,193 CJK
(Chinese, Japanese, and Korean) ideographs.

Upcoming Speaking Engagements

Post Syndicated from Schneier.com Webmaster original https://www.schneier.com/blog/archives/2022/09/upcoming-speaking-engagements-23.html

This is a current list of where and when I am scheduled to speak:

The list is maintained on this page.

8 things you didn’t know you could do with GitHub Copilot

Post Syndicated from Rizel Scarlett original https://github.blog/2022-09-14-8-things-you-didnt-know-you-could-do-with-github-copilot/

Similar to other AI pair programming tools, GitHub Copilot is changing the game of software development. GitHub Copilot is an AI pair programmer that helps you write code faster with less work. We use the terms “AI pair programmer” and “Copilot” to imply that this tool cannot work without you–the developer! It’s not magic. It cannot read minds, although it sometimes feels like it can. However, by sharing code completion suggestions based on my project’s context and style conventions, GitHub Copilot increased my velocity and confidence as a programmer.

The best part is you can use GitHub Copilot to increase your velocity and confidence as you code, too! In June 2022, we made GitHub Copilot available to all individual developers. You can learn how to get started with GitHub Copilot here.

If it’s not reading minds and it’s not magic, then how does it work?

Open AI Codex, a machine learning model that translates natural language into code, powers GitHub Copilot to draw context from comments and code to suggest individual lines and whole functions as you type. Codex is a version of GPT-3 (Generative Pre-trained Transformer 3) fine-tuned for programming tasks. Some of your favorite applications, like Duolingo, use GPT-3 for grammar correction.

For more information on how GitHub Copilot works and its effectiveness, check out the following resources:

Unexpected yet valuable GitHub Copilot use cases

Once installed, the extension will suggest code as you type, but what next? How can you optimally benefit from the GitHub Copilot extension?

First, I recommend writing clear, understandable comments to help your AI pair programmer generate desired solutions, but if you’re interested in exploring how to use GitHub Copilot in ways you might not be thinking of, we compiled some fun and valuable use cases we’ve seen in talking with developers. I hope that the following examples inspire you!

1. Assisting non-native English speakers

GitHub Copilot can understand other languages beyond English! This is helpful for developers of all backgrounds because programming languages are based on American English. For example, the CSS property color is based on American English, so it is unfamiliar for native British-English or Canadian-English speakers who use the spelling ‘colour’. Forgetting the correct spelling and syntax can often result in typos, unexpected errors, and lost time.

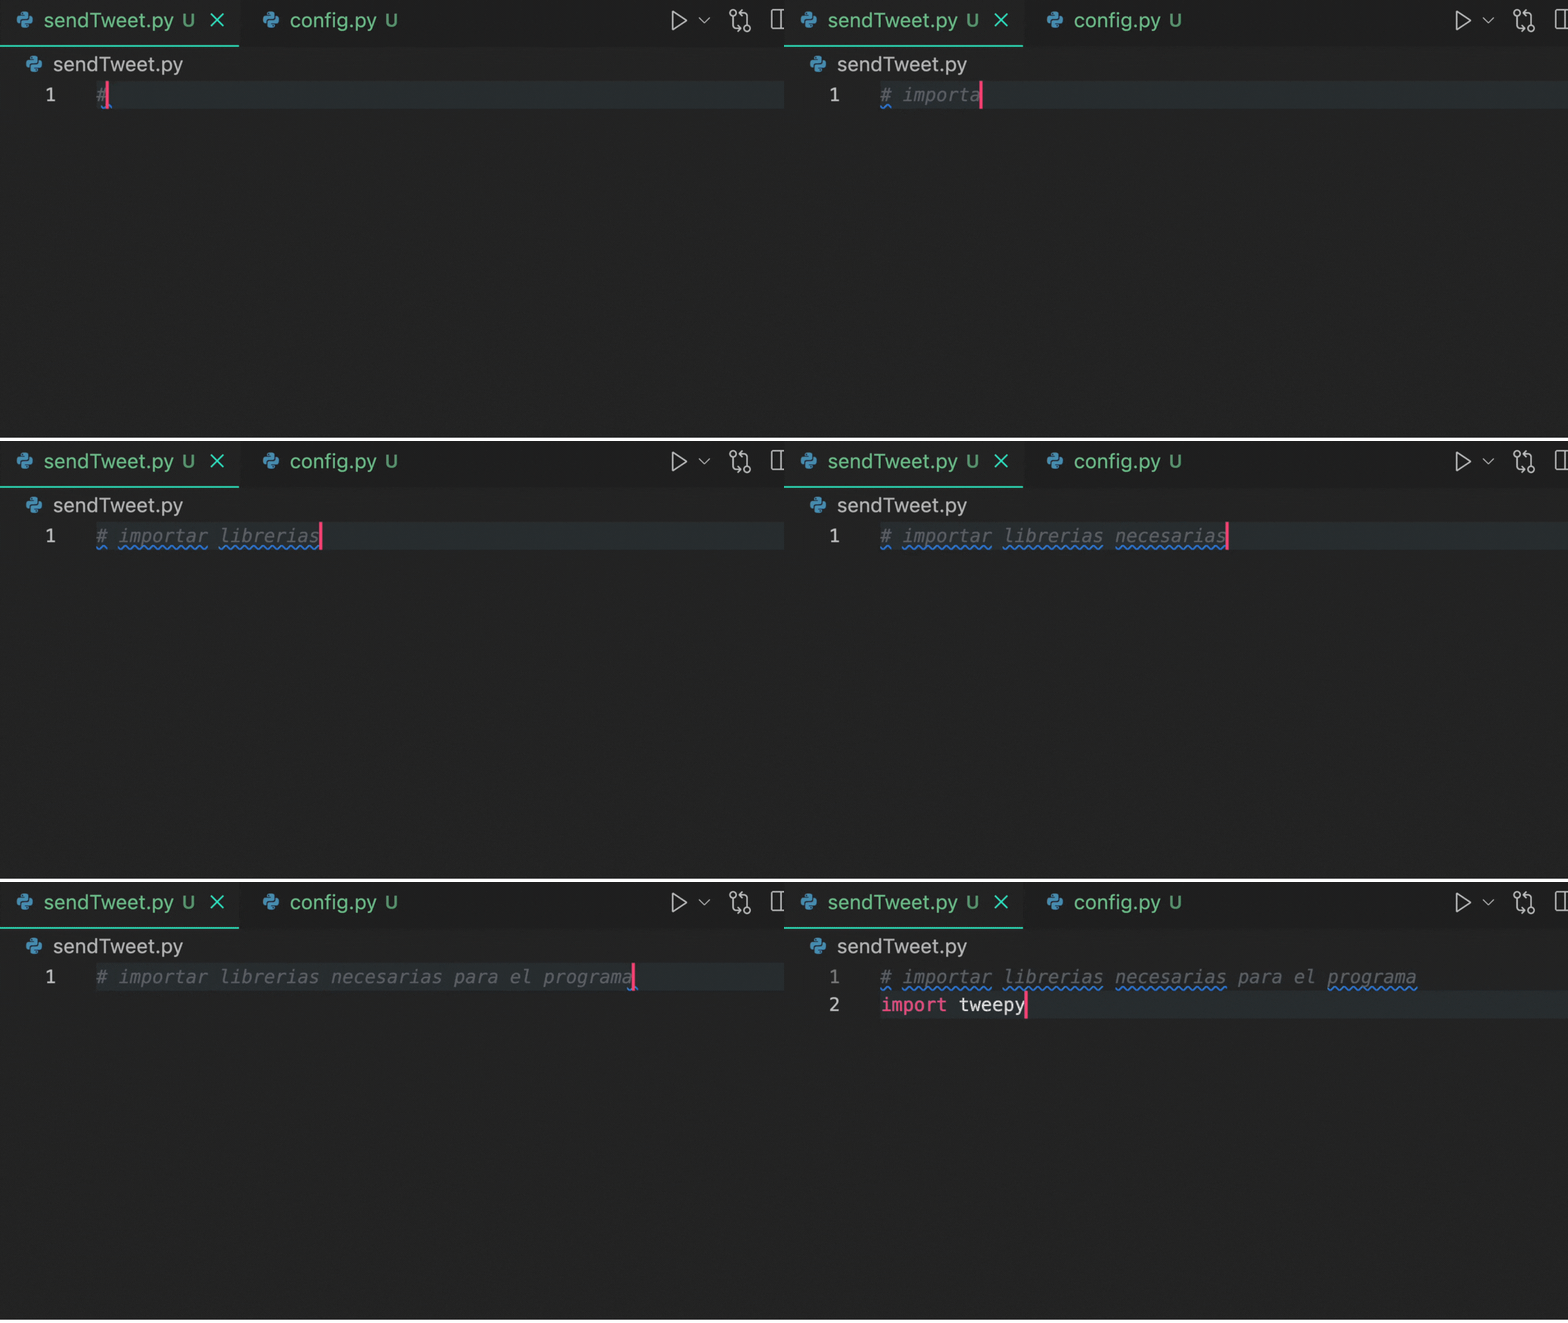
In the GIF below, I wrote a comment in Spanish that says, “importar,” which translates to “import.” GitHub Copilot quickly completed my comment in Spanish and imported the necessary libraries as the comment described.

Demonstration of GitHub Copilot interpreting a comment in Spanish.

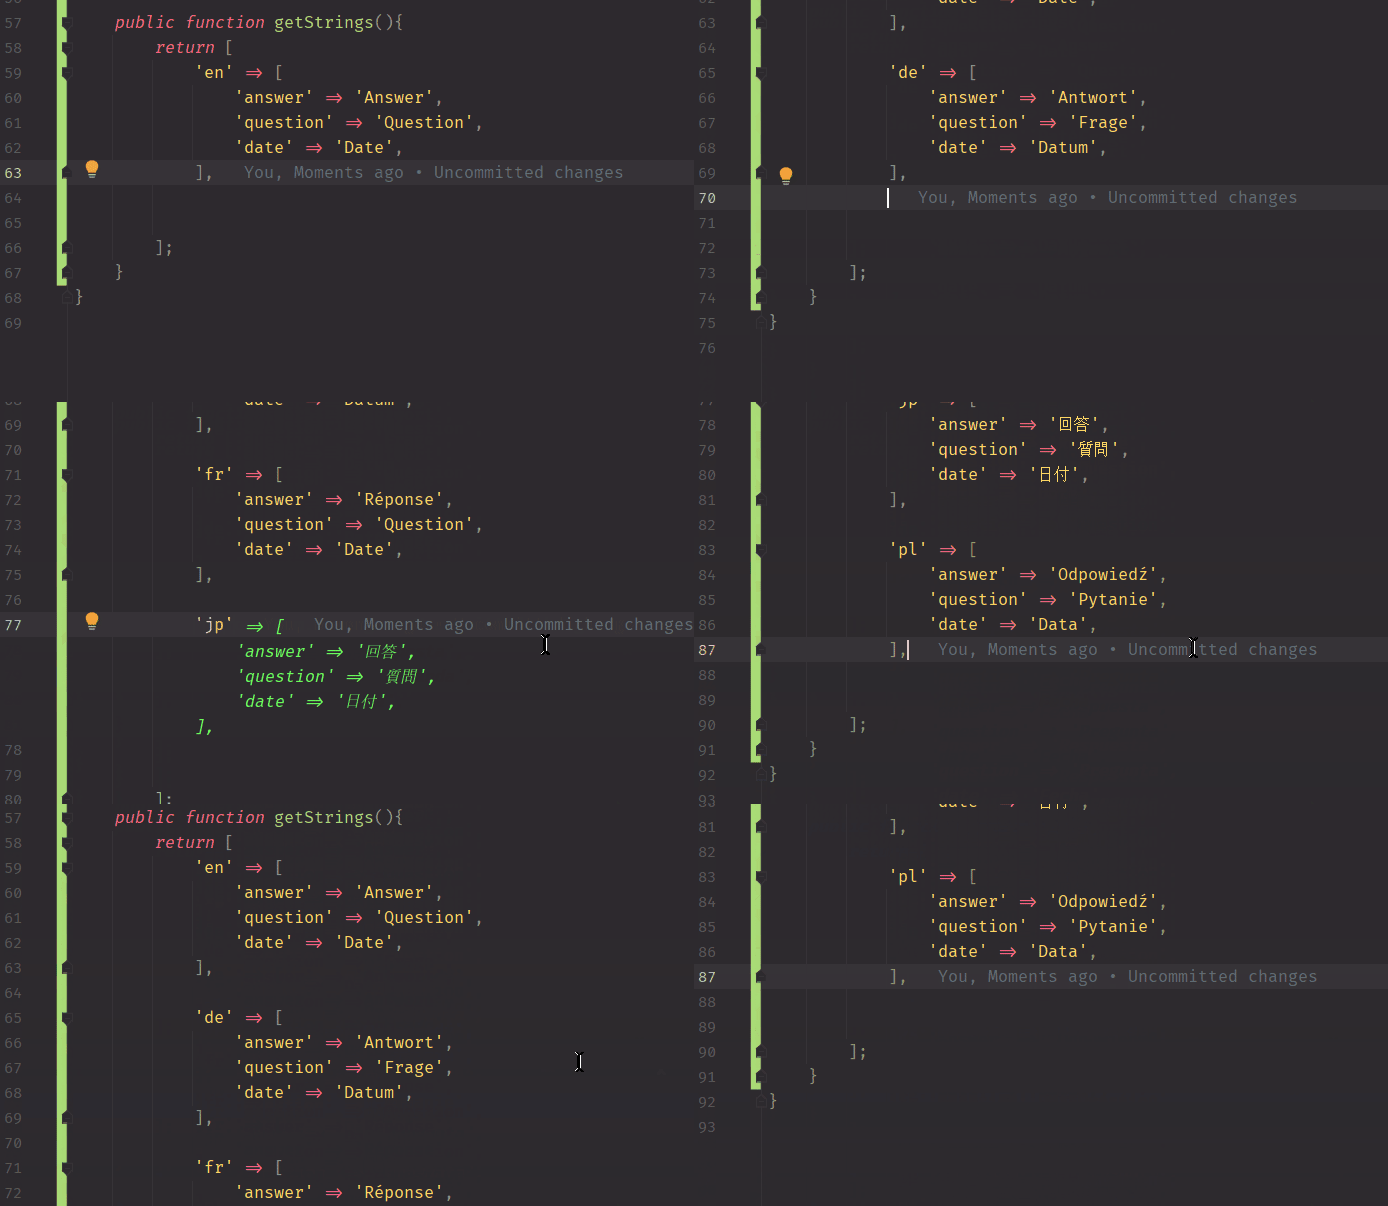
Additionally, GitHub Copilot helps translate words from English to other languages. MilMikDev on Twitter used GitHub Copilot to translate an array of words ‘answer’, ‘question,’ and ‘date’ to various languages.

Demonstration of using GitHub Copilot to translate an array of words ‘answer’, ‘question,’ and ‘date’ to various languages.

2. Creating dictionaries with lookup data

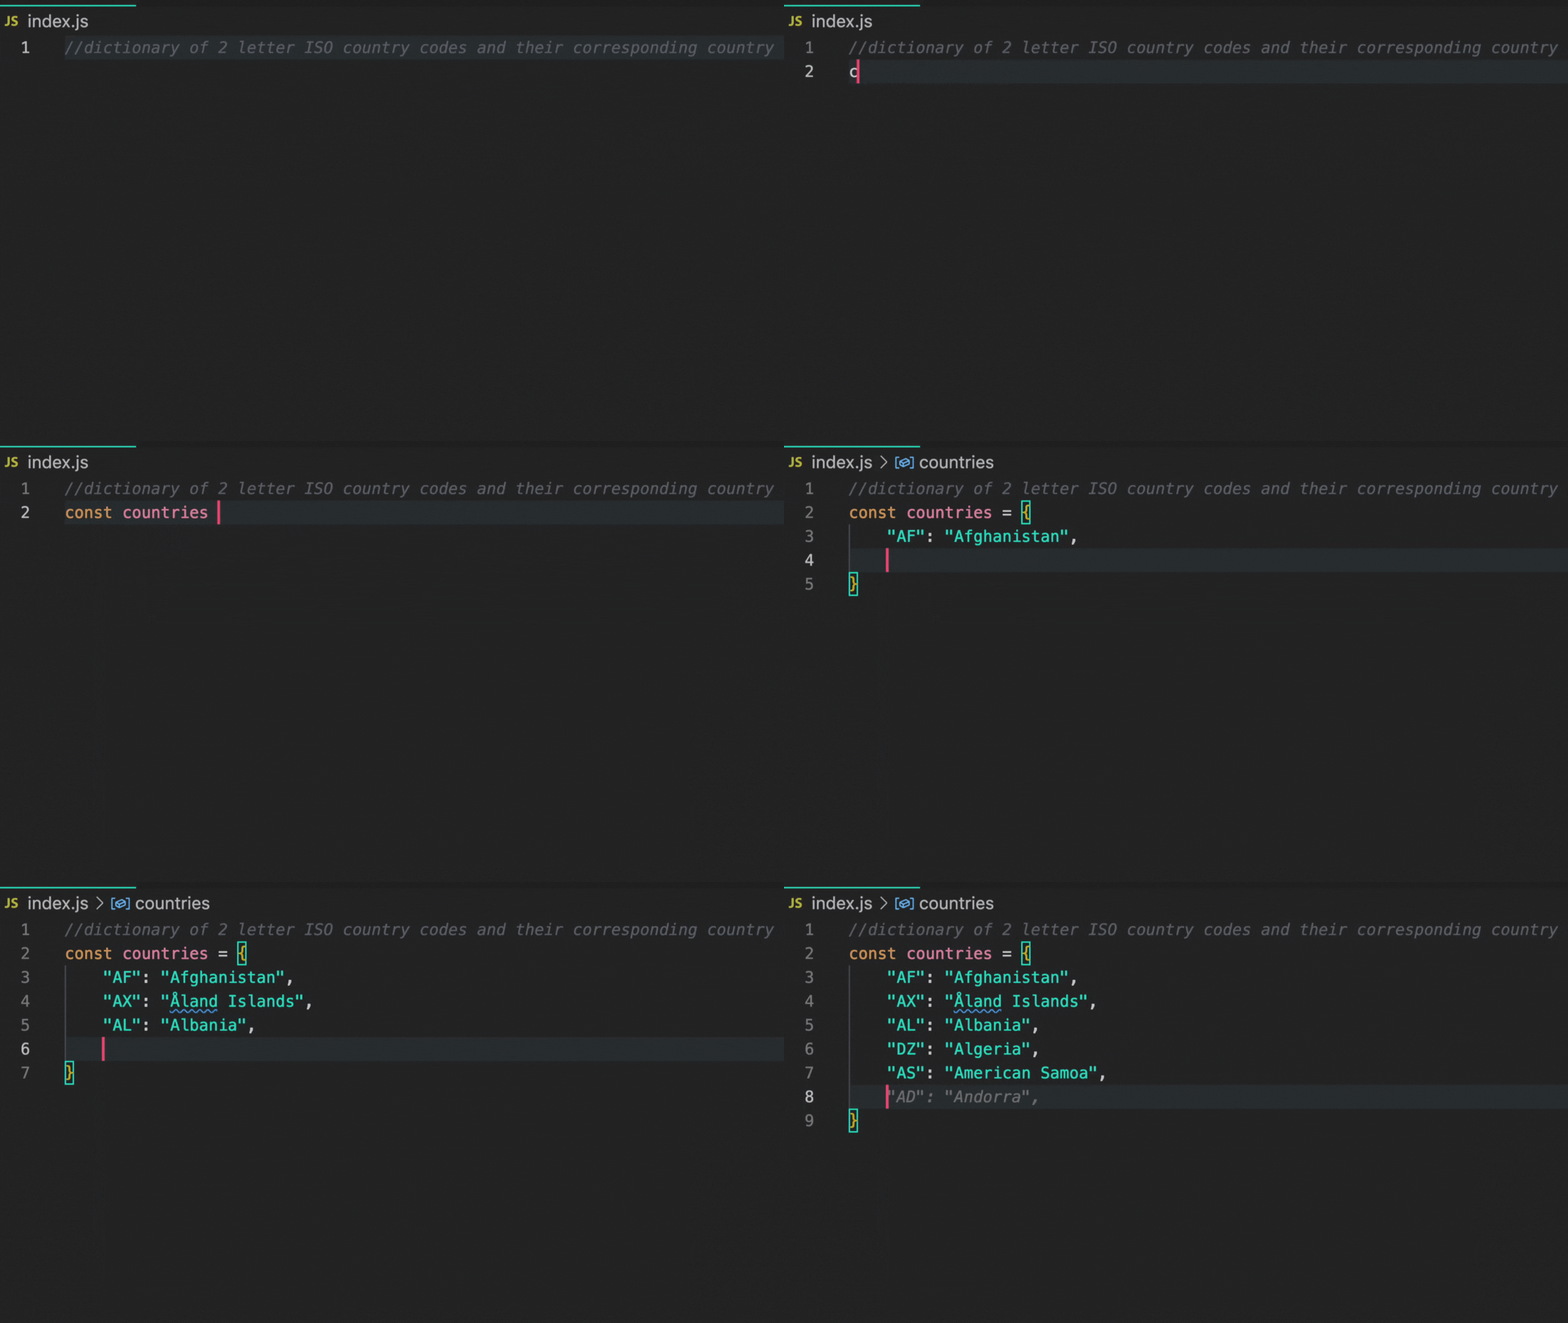
Martin Woodward, Vice President of Developer Relations at GitHub, shared this tip with us! GitHub Copilot is great at creating dictionaries of lookup data. Try it out by writing a comment instructing GitHub Copilot to create a dictionary of two-letter ISO country codes and their contributing country name. Writing a comment and the first few lines of code should help GitHub Copilot generated the desired results. See the GIF below for visual representation!

Demonstration of using GitHub Copilot to create a dictionary of two-letter ISO country codes and their contributing country name.

3. Testing your code

Writing tests is a vital yet sometimes tedious step in the software development lifecycle. Because GitHub Copilot excels in pattern recognition and pattern completion, it can speed up the process of writing unit tests, visual regression tests, and more.

Check out these resources to learn more about using GitHub Copilot for testing:

4. Matching patterns with regular expressions

With GitHub Copilot, you can spend less time fiddling in a Regex playground or combing through StackOverflow to match character combinations in strings. Instead, you can write a comment or a function name to trigger GitHub Copilot’s suggestions.

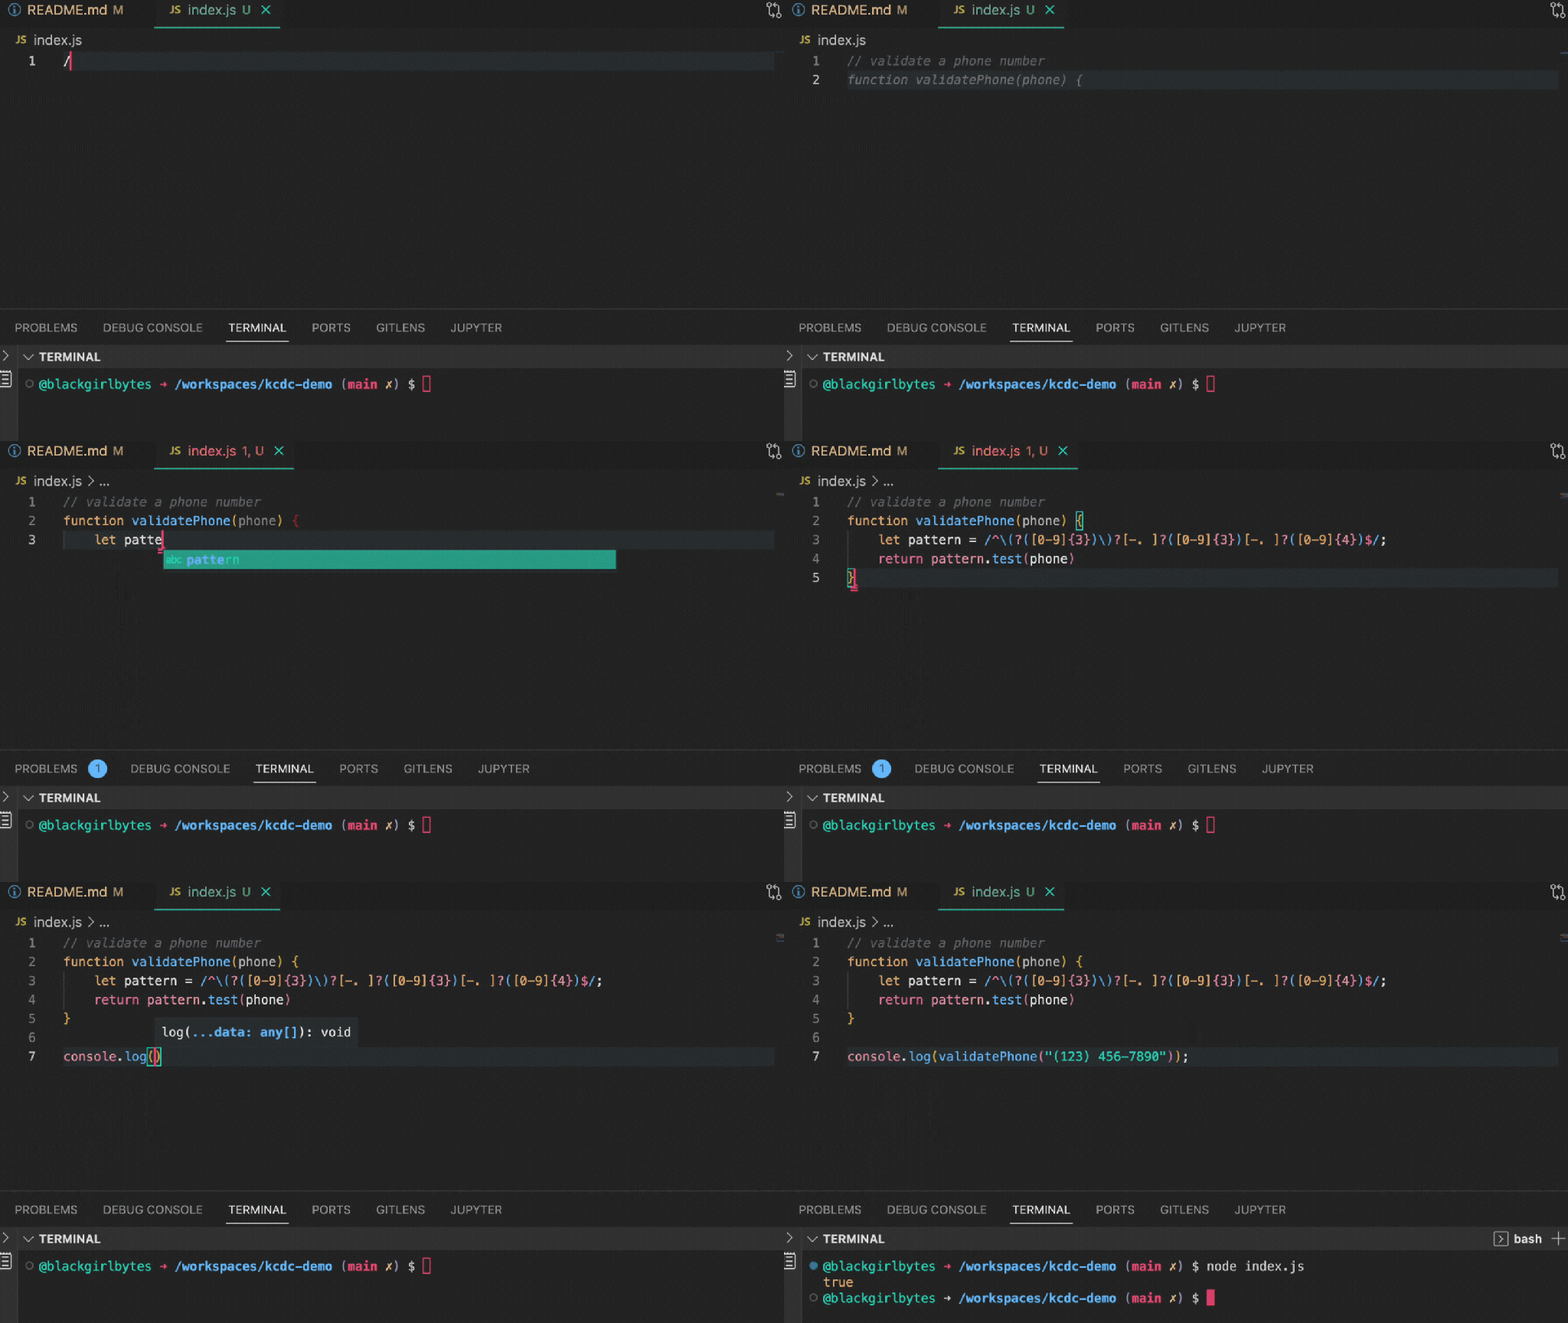
I used Copilot to help me validate a phone number!

Demonstration of using GitHub Copilot to validate a phone number.

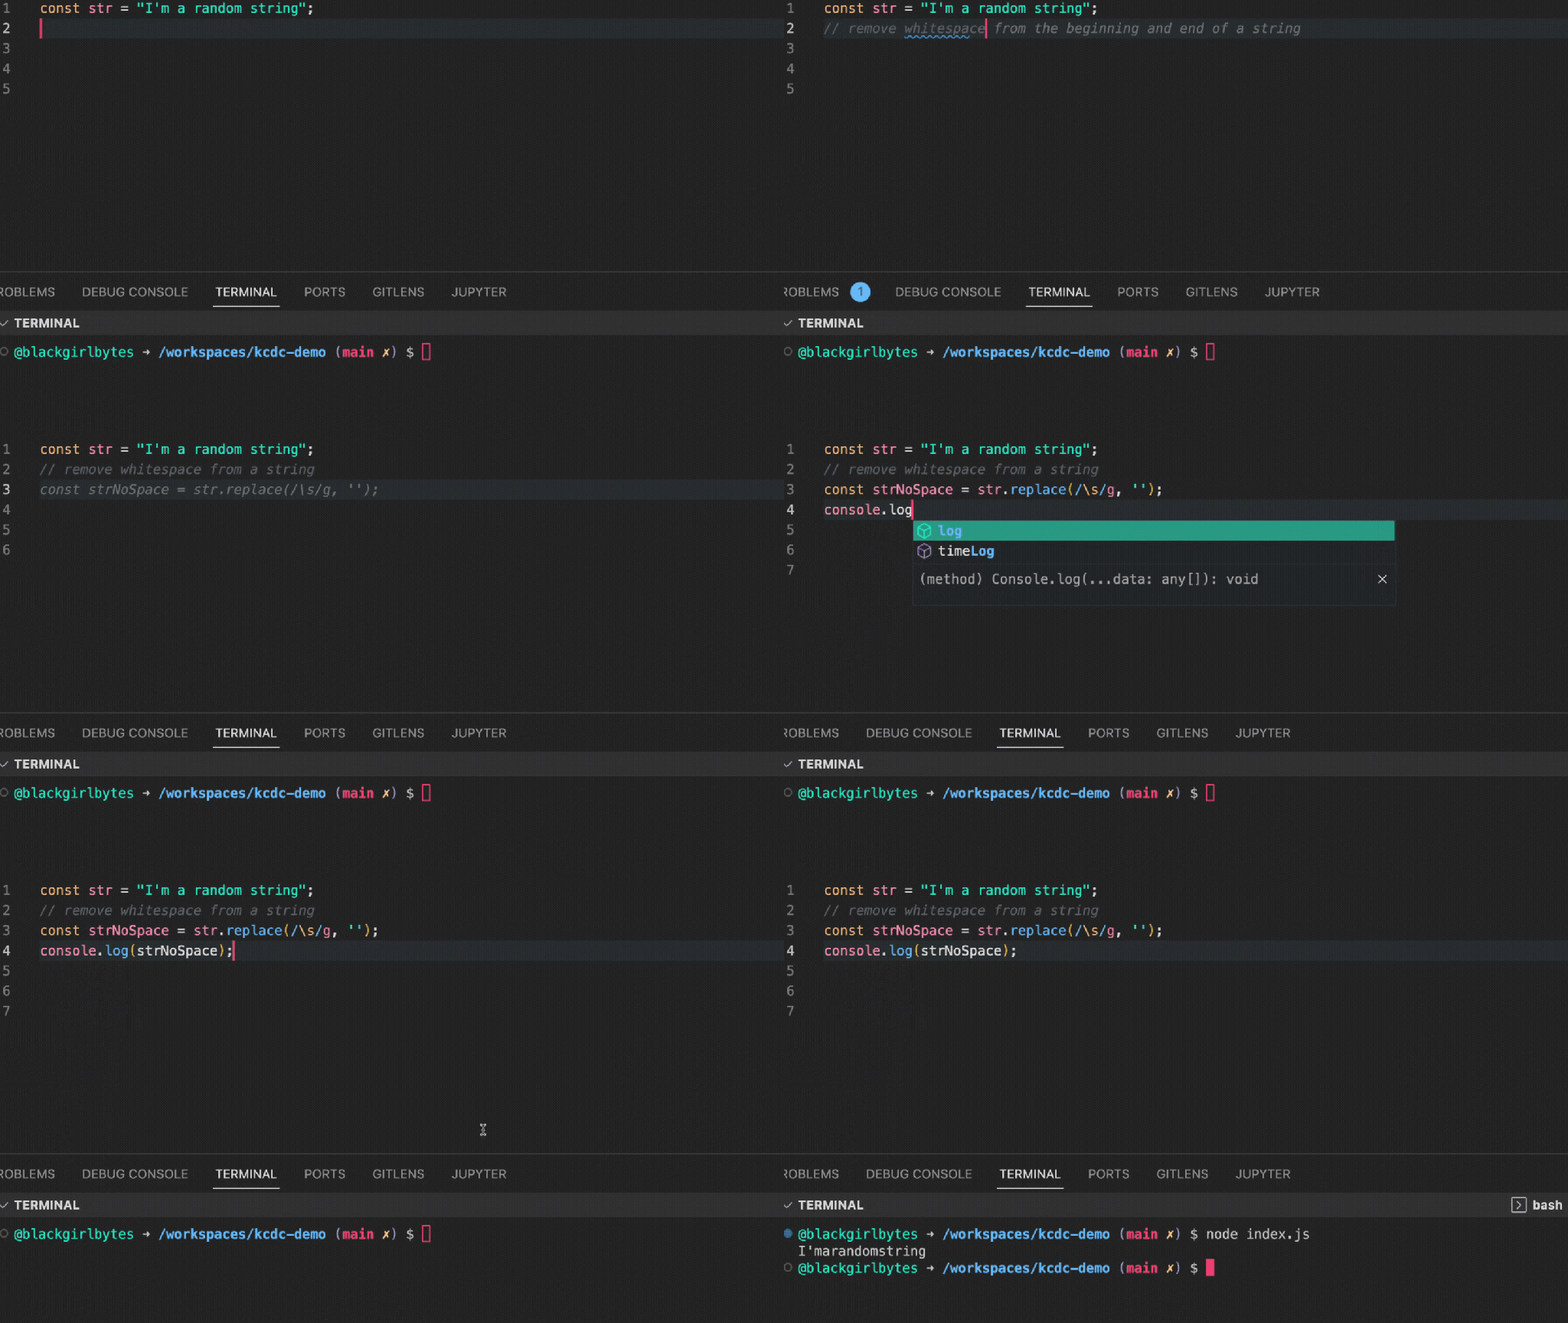
GitHub Copilot can help you remove white space from a string!

Demonstration of using GitHub Copilot to remove white space from a string.

5. Preparing for technical interviews

While this may sound unorthodox, developers, including myself, use GitHub Copilot to study for interviews.

Here’s the strategy:

  • First, I try to solve the problem without GitHub Copilot.
  • If I’m feeling extremely stuck and disheartened while solving the problem, I’ll activate GitHub Copilot and use it to generate ideas on how to solve the problem better.
  • Subsequently, I’ll delete the code GitHub Copilot generated, deactivate GitHub Copilot, and make another attempt at finding a solution with the new information in mind.

By adopting this method, I maintain momentum when tempted to quit. Instead of giving up, I gain new perspectives even when I don’t have a mentor or peer to guide me. GitHub Copilot becomes my digital mentor. But, note, that I highly discourage activating GitHub Copilot during an interview (that’s cheating!).

Interestingly, chess players take a similar approach when preparing for matches. It’s common for chess players to practice against AI engines to advance their skills. In the publication, Towards Data Science, Bharath K writes, “Artificial Intelligence has influenced the way in which chess games are played at the top level. Most of the Grandmasters and Super Grandmasters (rated at a FIDE above 2700) utilize these modern AI chess engines to analyze their games and the games of their competitors.” Learn more about the influence of AI chess engines here.

If AI is helping chess players advance their skills, perhaps it can positively impact developers’ problem-solving skills by challenging them to think differently about solving a problem.

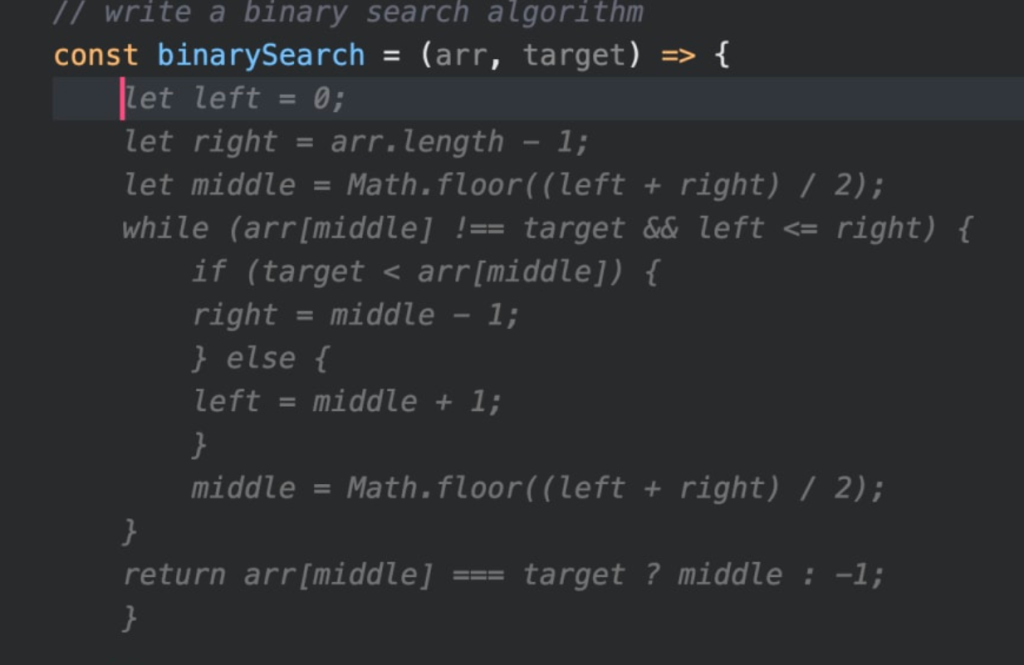
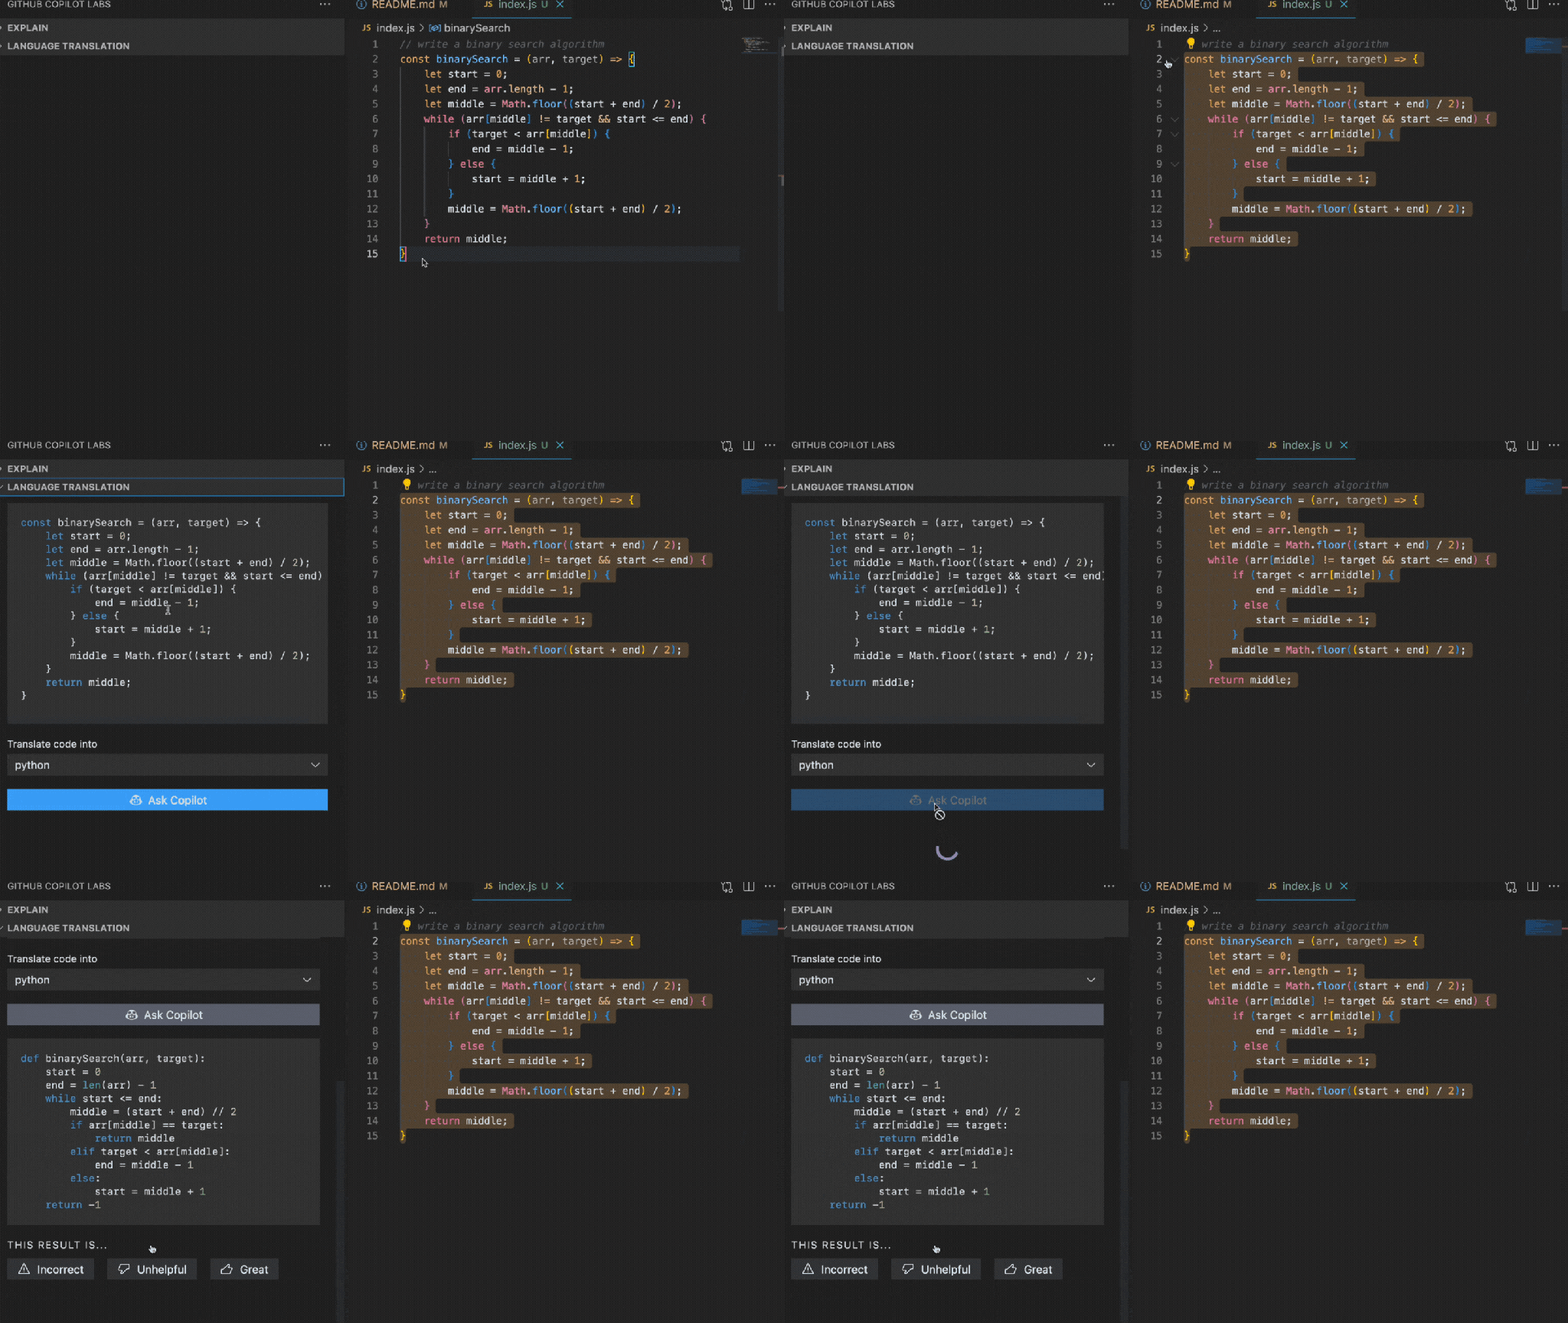
You can learn more about leveraging GitHub Copilot to solve algorithmic problems here. In the example below, I wrote a comment that says, “write a binary search algorithm,” and the first line of my function. GitHub Copilot correctly completed the function.

Screenshot of a code editor demonstrating that GitHub Copilot correctly completed a function based on the input of a comment and the first line of the function.

6. Sending tweets

Of course, you can simply use the Twitter application to send a Tweet, but it’s more fun to send a Tweet via your IDE! As a Developer Advocate, part of my job is to create demos. In a recent livestream, I had to demonstrate using Twitter API v2 with GitHub Copilot in Python, a language that I rarely use. GitHub Copilot saved the day and generated the code I needed after I wrote a few comments. Read my DEV post if you want to try sending a tweet with GitHub Copilot, too!

Screenshot of a tweet from Rizel Scarlett that reads, "I wrote this tweet with Copilot and I'm in KCDC right now."

7. Exiting Vim

Developers who are new to Vim frequently wonder how to exit the editor. Struggling to exit vim is so common that it’s a meme on the internet! Since GitHub Copilot is available in Visual Studio Code, JetBrains, and Neovim, a forked version of Vim with additional features, you can exit NeoVim using GitHub Copilot. In the video below, Brian Douglas uses GitHub Copilot to exit NeoVim, by writing a comment that says, “How do I exit vim?”

8. Navigating a new codebase with Copilot Labs

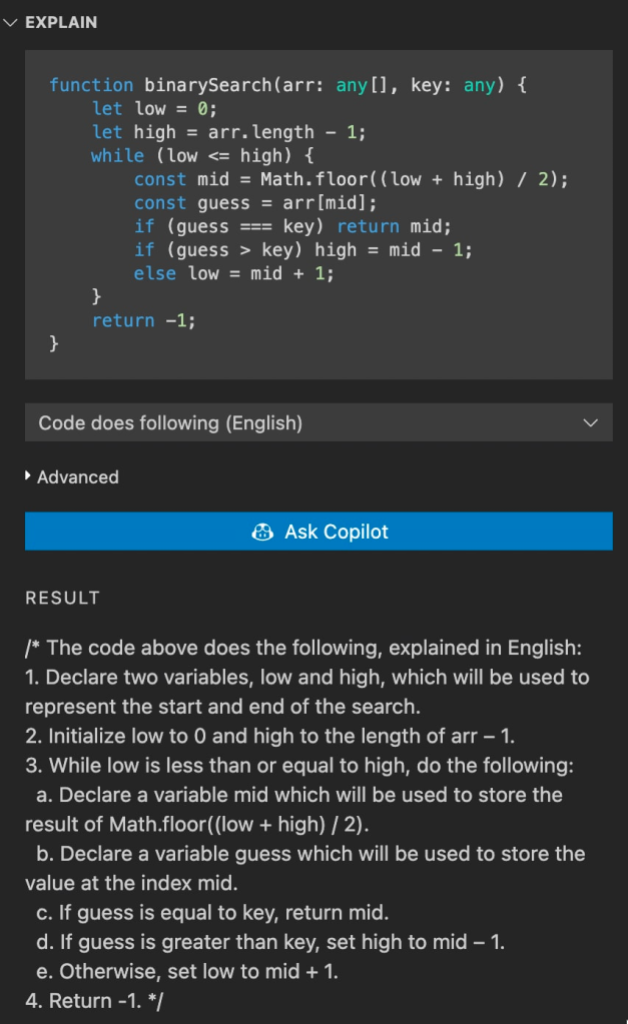
GitHub Copilot Labs is a complementary extension that comes with GitHub Copilot access. The GitHub Next team developed GitHub Copilot Labs, an experimental sidebar, to help developers translate code from one programming language to another and get a step-by-step explanation of code snippets.

There’s no easy method for building a mental model of a new codebase, but these two features within GitHub Copilot Labs can help. By translating code snippets to languages they’re more familiar with and using the ‘Explain’ feature to gain an understanding of the code, developers can better comprehend complex blocks of code.

Demonstration of using Copilot's ‘Explain’ feature to gain an understanding of the code, developers can better comprehend complex blocks of code.

Closeup look at the results of Copilot's 'Explain' feature being used.

Wrap-up

As you’ve seen in the examples above, GitHub Copilot can help you be more productive in so many ways day to day (a lot of which we’re still discovering!), and I want to kindly remind you that GitHub Copilot is an AI pair programmer, so just as you would with your coworkers’ code or even your own, review the generated code before pushing it to production! While GitHub Copilot is powerful, sometimes it makes mistakes or refers to an outdated version of an API. Nevertheless, the team at GitHub continues to work hard and learn from our users to develop a better experience and generate better results with GitHub Copilot. I’m excited to witness and experience the evolution of AI pair programming tools. If you’re just as eager as me, sign up for GitHub Copilot today!

Identify source schema changes using AWS Glue

Post Syndicated from Narendra Gupta original https://aws.amazon.com/blogs/big-data/identify-source-schema-changes-using-aws-glue/

In today’s world, organizations are collecting an unprecedented amount of data from all kinds of different data sources, such as transactional data stores, clickstreams, log data, IoT data, and more. This data is often in different formats, such as structured data or unstructured data, and is usually referred to as the three Vs of big data (volume, velocity, and variety). To extract information from the data, it’s usually stored in a data lake built on Amazon Simple Storage Service (S3). The data lake provides an important characteristic called schema on read, which allows you to bring data in the data lake without worrying about the schema or changes in the schema on the data source. This enables faster ingestion of data or building data pipelines.

However, you may be reading and consuming this data for other use cases, such as pointing to applications, building business intelligence (BI) dashboards in services like Amazon QuickSight, or doing data discovery using a serverless query engine like Amazon Athena. Additionally, you may have built an extract, transform, and load (ETL) data pipeline to populate your data store like a relational database, non-relational database, or data warehouse for further operational and analytical needs. In these cases, you need to define the schema upfront or even keep an account of the changes in the schema, such as adding new columns, deleting existing columns, changing the data type of existing columns, or renaming existing columns, to avoid any failures in your application or issues with your dashboard or reporting.

In many use cases, we have found that the data teams responsible for building the data pipeline don’t have any control of the source schema, and they need to build a solution to identify changes in the source schema in order to be able to build the process or automation around it. This might include sending notifications of changes to the teams dependent on the source schema, building an auditing solution to log all the schema changes, or building an automation or change request process to propagate the change in the source schema to downstream applications such as an ETL tool or BI dashboard. Sometimes, to control the number of schema versions, you may want to delete the older version of the schema when there are no changes detected between it and the newer schema.

For example, assume you’re receiving claim files from different external partners in the form of flat files, and you’ve built a solution to process claims based on these files. However, because these files were sent by external partners, you don’t have much control over the schema and data format. For example, columns such as customer_id and claim_id were changed to customerid and claimid by one partner, and another partner added new columns such as customer_age and earning and kept the rest of the columns the same. You need to identify such changes in advance so you can edit the ETL job to accommodate the changes, such as changing the column name or adding the new columns to process the claims.

In this solution, we showcase a mechanism that simplifies the capture of the schema changes in your data source using an AWS Glue crawler.

Solution overview

An AWS Glue data crawler is built to sync metadata based on existing data. After we identify the changes, we use Amazon CloudWatch to log the changes and Amazon Simple Notification Service (Amazon SNS) to notify the changes to the application team over email. You can expand this solution to solve for other use cases such as building an automation to propagate the changes to downstream applications or pipelines, which is out of scope for this post, to avoid any failures in downstream applications because of schema changes. We also show a way to delete older versions of the schema if there are no changes between the compared schema versions.

If you want to capture the change in an event-driven manner, you can do so by using Amazon EventBridge. However, if you want to capture the schema changes on multiple tables at the same time, based on a specific schedule, you can use the solution in this post.

In our scenario, we have two files, each with different schemas, simulating data that has undergone a schema change. We use an AWS Glue crawler to extract the metadata from data in an S3 bucket. Then we use an AWS Glue ETL job to extract the changes in the schema to the AWS Glue Data Catalog.

AWS Glue provides a serverless environment to extract, transform, and load a large number of datasets from several sources for analytic purposes. The Data Catalog is a feature within AWS Glue that lets you create a centralized data catalog of metadata by storing and annotating data from different data stores. Examples include object stores like Amazon S3, relational databases like Amazon Aurora PostgreSQL-Compatible Edition, and data warehouses like Amazon Redshift. You can then use that metadata to query and transform the underlying data. You use a crawler to populate the Data Catalog with tables. It can automatically discover new data, extract schema definitions, detect schema changes, and version tables. It can also detect Hive-style partitions on Amazon S3 (for example year=YYYY, month=MM, day=DD).

Amazon S3 serves as the storage for our data lake. Amazon S3 is an object storage service that offers industry-leading scalability, data availability, security, and performance.

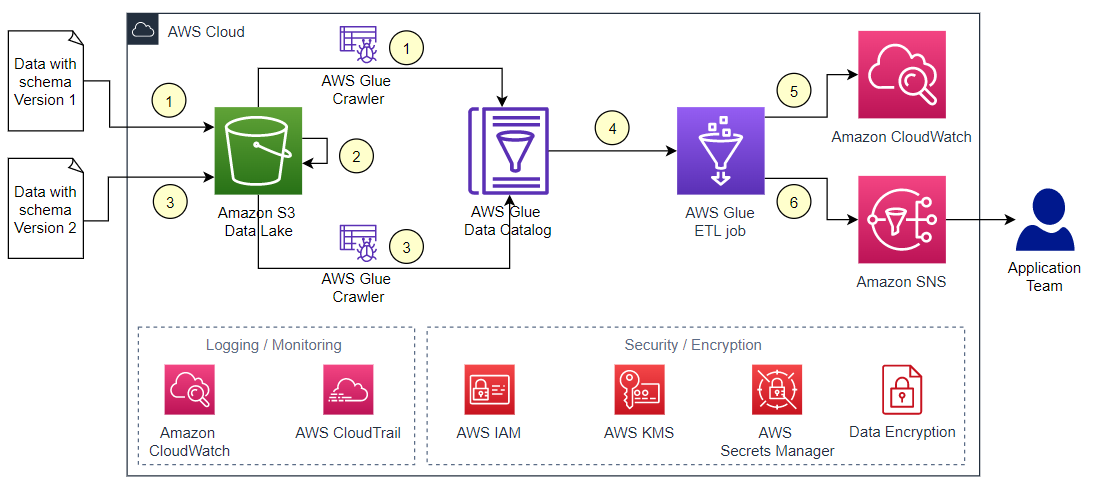
The following diagram illustrates the architecture for this solution.

The workflow includes the following steps:

  1. Copy the first data file to the data folder of the S3 bucket and run the AWS Glue crawler to create a new table in the Data Catalog.
  2. Move the existing file from the data folder to the archived folder.
  3. Copy the second data file with the updated schema to the data folder, then rerun the crawler to create new version of table schema.
  4. Run the AWS Glue ETL job to check if there is a new version of the table schema.
  5. The AWS Glue job lists the changes in the schema with the previous version of the schema in CloudWatch Logs. If there are no changes in the schema and the flag to delete older versions is set to true, the job also deletes the older schema versions.
  6. The AWS Glue job notifies all changes in the schema to the application team over email using Amazon SNS.

To build the solution, complete the following steps:

  1. Create an S3 bucket with the data and archived folders to store the new and processed data files.
  2. Create an AWS Glue database and an AWS Glue crawler that crawls the data file in the data folder to create an AWS Glue table in the database.
  3. Create an SNS topic and add an email subscription.
  4. Create an AWS Glue ETL job to compare the two versions of the table schema, list the changes in the schema with the older version of schema, and delete older versions of schema if the flag to delete older versions is set to true. The job also publishes an event in Amazon SNS to notify the changes in the schema to the data teams.

For the purpose of this post, we manually perform the steps to move the data files from the data folder to the archive folder, triggering the crawler and ETL job. Depending on your application needs, you can automate and orchestrate this process through AWS Glue workflows.

Let’s set up the infrastructure required to go through the solution to compare an AWS Glue table version to a version updated with recent schema changes.

Create an S3 bucket and folders

To create an S3 bucket with the data and archived folders to store the new and processed data files, complete the following steps:

  1. On the Amazon S3 console, choose Buckets in the navigation pane.
  2. Choose Create bucket.
  3. For Bucket name, enter a DNS-compliant unique name (for example, aws-blog-sscp-ng-202202).
  4. For Region, choose the Region where you want the bucket to reside.
  5. Keep all other settings as default and choose Create bucket.
  6. On the Buckets page, choose the newly created bucket.
  7. Choose Create folder.
  8. For Folder name, enter data.
  9. Leave server-side encryption at its default (disabled).
  10. Choose Create folder.
  11. Repeat these steps to create the archived folder in the same bucket.

Create an AWS Glue database and crawler

Now we create an AWS Glue database and crawler that crawls the data file in the data bucket to create an AWS Glue table in the new database.

  1. On the AWS Glue console, choose Databases in the navigation pane.
  2. Choose Add database.
  3. Enter a name (for example, sscp-database) and description.
  4. Choose Create.
  5. Choose Crawlers in the navigation pane.
  6. Choose Add crawler.
  7. For Crawler name, enter a name (glue-crawler-sscp-sales-data).
  8. Choose Next.
  9. For the crawler source type¸ choose Data stores.
  10. To repeat crawls of the data stores, choose Crawl all folders.
  11. Choose Next.
  12. For Choose a data store, choose S3.
  13. For Include path, choose the S3 bucket and folder you created (s3://aws-blog-sscp-ng-202202/data).
  14. Choose Next.
  15. On the Add another data store page, choose No, then choose Next.
  16. Choose Create an IAM role and enter a name for the role (for example, sscp-blog).
  17. Choose Next.
  18. Choose Run on Demand, then choose Next.
  19. For Database, choose your AWS Glue database (sscp-database).
  20. For Prefix added to tables, enter a prefix (for example, sscp_sales_).
  21. Expand the Configuration options section and choose Update the table definition in the data catalog.
  22. Leave all other settings as default and choose Next.
  23. Choose Finish to create the crawler.

Create an SNS topic

To create an SNS topic and add an email subscription, complete the following steps:

  1. On the Amazon SNS console, choose Topics in the navigation pane.
  2. Choose Create topic.
  3. For Type, choose Standard.
  4. Enter a name for the topic (for example, NotifySchemaChanges).
  5. Leave all other settings as default and choose Create topic.
  6. In the navigation pane, choose Subscriptions.
  7. Choose Create subscription.
  8. For Topic ARN, choose the ARN of the created SNS topic.
  9. For Protocol, choose Email.
  10. For Endpoint, enter the email address to receive notifications.
  11. Leave all other defaults and choose Create subscription.You should receive an email to confirm the subscription.
  12. Choose the link in the email to confirm.
  13. Add the following permission policy to the AWS Glue service role created earlier as part of the crawler creation (AWSGlueServiceRole-sscp-blog) to allow publishing to the SNS topic. Make sure to change <$SNSTopicARN> in the policy with the actual ARN of the SNS topic.
{
    "Version": "2012-10-17",
    "Statement": [
        {
            "Sid": "AllowEventPublishing",
            "Effect": "Allow",
            "Action": "sns:Publish",
            "Resource": "<$SNSTopicARN>"
        }
    ]
}

Create an AWS Glue ETL job

Now you create an AWS Glue ETL job to compare two schema versions of a table and list the changes in schemas. If there are no changes in the schema and the flag to delete older versions is set to true, the job also deletes any older versions. If there are changes in schema, the job lists changes in the CloudWatch logs and publishes an event in Amazon SNS to notify changes to the data team.

  1. On the AWS Glue console, choose AWS Glue Studio.
  2. Choose Create and manage jobs.
  3. Choose the Python Shell script editor.
  4. Choose Create to create a Python Shell job.
  5. Enter the following code in the script editor field:
    import boto3
    import pandas as pd
    
    # Input Paramaters:  
    # catalog_id - Your AWS Glue Catalg Id - it is same as your AWS account ID
    # db_name - name of your AWS Glue Database in your Glue Data catalog_id
    # table_name - name of the table in your AWS Glue Database that you would like to check of change in schema
    # topic_arn - ARN of the SNS topic to publish the changes in table schema
    # versions_to_compare - Two versions that customer would want to compare. 0 is the lastes version and 1 in the version prior to the latest version
    # delete_old_versions - If True and there are no changes in the versions compared, job would delete all old versions except for the latest "number_of_versions_to_retain" versions 
    # number_of_versions_to_retain - if delete_old_versions is True and there are no changes in the versions compared, the job would delete all old versions except for the latest "number_of_versions_to_retain" versions
    
    catalog_id = '<$catalog_id>'
    db_name='<$db_name>'
    table_name='<$table_name>'
    topic_arn='<$sns_topic_ARN>'
    versions_to_compare=[0,1]
    delete_old_versions = False
    number_of_versions_to_retain = 2
    
    columns_modified = []
    
    # Function to compare the name and type of columns in new column list with old column list to 
    # find any newly added column and the columns with changed data type
    def findAddedUpdated(new_cols_df, old_cols_df, old_col_name_list):
        for index, row in new_cols_df.iterrows():
            new_col_name = new_cols_df.iloc[index]['Name']
            new_col_type = new_cols_df.iloc[index]['Type']
    
            # Check if a column with same name exist in old table but the data type has chaged
            if new_col_name in old_col_name_list:
                old_col_idx = old_cols_df.index[old_cols_df['Name']==new_col_name][0]
                old_col_type = old_cols_df.iloc[old_col_idx]['Type']
    
                if old_col_type != new_col_type:
                    columns_modified.append(f"Data type changed for '{new_col_name}' from '{old_col_type}' to '{new_col_type}'")
            # If a column is only in new column list, it a newly added column
            else:
                columns_modified.append(f"Added new column '{new_col_name}' with data type as '{new_col_type}'")
    
    # Function to iterate through the list of old columns and check if any column doesn't exist in new columns list to find out dropped columns
    def findDropped(old_cols_df, new_col_name_list):
        for index, row in old_cols_df.iterrows():
            old_col_name = old_cols_df.iloc[index]['Name']
            old_col_type = old_cols_df.iloc[index]['Type']
    
            #check if column doesn't exist in new column list  
            if old_col_name not in new_col_name_list:
                columns_modified.append(f"Dropped old column '{old_col_name}' with data type as '{old_col_type}'")
    
    # Function to publish changes in schema to a SNS topic that can be subscribed to receive email notifications when changes are detected
    def notifyChanges(message_to_send):
        sns = boto3.client('sns')
        # Publish a simple message to the specified SNS topic
        response = sns.publish(
            TopicArn=topic_arn,   
            Message=message_to_send,  
            Subject="DWH Notification: Changes in table schema"
        )
        
    # Function to convert version_id to int to use for sorting the versions
    def version_id(json):
        try:
            return int(json['VersionId'])
        except KeyError:
            return 0
    
    # Function to delete the table versions
    def delele_versions(glue_client, versions_list, number_of_versions_to_retain):
        print("deleting old versions...")
        if len(versions_list) > number_of_versions_to_retain:
            version_id_list = []
            for table_version in versions_list:
                version_id_list.append(int(table_version['VersionId']))
            # Sort the versions in descending order
            version_id_list.sort(reverse=True)
            versions_str_list = [str(x) for x in version_id_list]
            versions_to_delete = versions_str_list[number_of_versions_to_retain:]
            
            del_response = glue_client.batch_delete_table_version(
                DatabaseName=db_name,
                TableName=table_name,
                VersionIds=versions_to_delete
            )
            return del_response
    
    # Calling glue API to get the list of table versions. The solution assums that number of version in the table are less than 100. If you have more than 100 versions, you should use pagination and loop through each page.  
    glue = boto3.client('glue')
    response = glue.get_table_versions(
        CatalogId=catalog_id,
        DatabaseName=db_name,
        TableName=table_name,
        MaxResults=100
    )
    table_versions = response['TableVersions']
    table_versions.sort(key=version_id, reverse=True)
    
    version_count = len(table_versions)
    print(version_count)
    
    # checking if the version of table to compare exists. You would need pass the numbers of versions to compare to the job. 
    if version_count > max(versions_to_compare):
    
        new_columns = table_versions[versions_to_compare[0]]['Table']['StorageDescriptor']['Columns']
        new_cols_df = pd.DataFrame(new_columns)
    
        old_columns = table_versions[versions_to_compare[1]]['Table']['StorageDescriptor']['Columns']
        old_cols_df = pd.DataFrame(old_columns)
    
        new_col_name_list =  new_cols_df['Name'].tolist()
        old_col_name_list =  old_cols_df['Name'].tolist()
        findAddedUpdated(new_cols_df, old_cols_df, old_col_name_list)
        findDropped(old_cols_df, new_col_name_list)
        if len(columns_modified) > 0: 
            email_msg = f"Following changes are identified in '{table_name}' table of '{db_name}' database of your Datawarehouse. Please review.\n\n"
            print("Job completed! -- below is list of changes.")
            for column_modified in columns_modified:
                email_msg += f"\t{column_modified}\n"
    
            print(email_msg)
            notifyChanges(email_msg)
        else:
            if delete_old_versions:
                delele_versions(glue, table_versions,number_of_versions_to_retain)
            print("Job completed! -- There are no changes in table schema.")
    else:
        print("Job completed! -- Selected table doesn't have the number of versions selected to compare. Please verify the list passed in 'versions_to_compare'")

  6. Enter a name for the job (for example, find-change-job-sscp).
  7. For IAM Role, choose the AWS Glue service role (AWSGlueServiceRole-sscp-blog).
  8. Leave all other defaults and choose Save.

Test the solution

We’ve configured the infrastructure to run the solution. Let’s now see it in action. First we upload the first data file and run our crawler to create a new table in the Data Catalog.

  1. Create a CSV file called salesdata01.csv with the following contents:
    ordertime,region,rep,item,units,unitcost
    2022-01-06,US-West,Jones,Pencil,95,1.99
    2022-01-06,US-Central,Kivell,Binder,50,19.99
    2022-01-07,US-Central,Jardine,Pencil,36,4.99
    2022-01-07,US-Central,Gill,Pen,27,19.99
    2022-01-08,US-East,Sorvino,Pencil,56,2.99
    2022-01-08,US-West,Jones,Binder,60,4.99
    2022-01-09,US-Central,Andrews,Pencil,75,1.99
    2022-01-10,US-Central,Jardine,Pencil,90,4.99
    2022-01-11,US-East,Thompson,Pencil,32,1.99
    2022-01-20,US-West,Jones,Binder,60,8.99

  2. On the Amazon S3 console, navigate to the data folder and upload the CSV file.
  3. On the AWS Glue console, choose Crawlers in the navigation pane.
  4. Select your crawler and choose Run crawler.The crawler takes a few minutes to complete. It adds a table (sscp_sales_data) in the AWS Glue database (sscp-database).
  5. Verify the created table by choosing Tables in the navigation pane.Now we move the existing file in the data folder to the archived folder.
  6. On the Amazon S3 console, navigate to the data folder.
  7. Select the file you uploaded (salesdata01.csv) and on the Actions menu, choose Move.
  8. Move the file to the archived folder.Now we copy the second data file with the updated schema to the data folder and rerun the crawler.
  9. Create a CSV file called salesdata02.csv with the following code. It contains the following changes from the previous version:
    1. The data in the region column is changed from region names to some codes (for example, the data type is changed from string to BIGINT).
    2. The rep column is dropped.
    3. The new column total is added.
      ordertime,region,item,units,unitcost,total
      2022-02-01,01,Pencil,35,4.99,174.65
      2022-02-01,03,Desk,2,125,250
      2022-02-02,01,Pen Set,16,15.99,255.84
      2022-02-02,03,Binder,28,8.99,251.72
      2022-02-03,01,Pen,64,8.99,575.36
      2022-02-03,01,Pen,15,19.99,299.85
      2022-02-06,03,Pen Set,96,4.99,479.04
      2022-02-10,03,Pencil,67,1.29,86.43
      2022-02-11,01,Pen Set,74,15.99,183.26
      2022-02-11,03,Binder,46,8.99,413.54

  10. On the Amazon S3 bucket, upload the file to the data folder.
  11. On the AWS Glue console, choose Crawlers in the navigation pane.
  12. Select your crawler and choose Run crawler.The crawler takes approximately 2 minutes to complete. It updates the schema of the previously created table (sscp_sales_data).
  13. Verify the new version of the table is created on the Tables page.Now we run the AWS Glue ETL job to check if there is a new version of the table schema and list the changes in the schema with the previous version of the schema in CloudWatch Logs.
  14. On the AWS Glue console, choose Jobs in the navigation pane.
  15. Select your job (find-change-job-sscp) and on the Actions menu, choose Edit script.
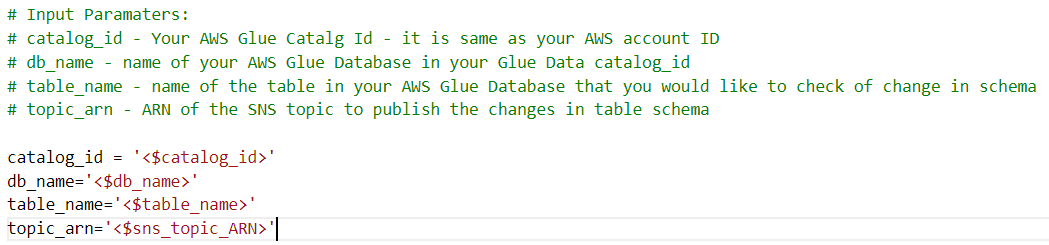
  16. Change the following input parameters for the job in the script to match with your configuration:
  17. Choose Save.
  18. Close the script editor.
  19. Select the job again and on the Actions menu, choose Run job.
  20. Leave all default parameters and choose Run job.
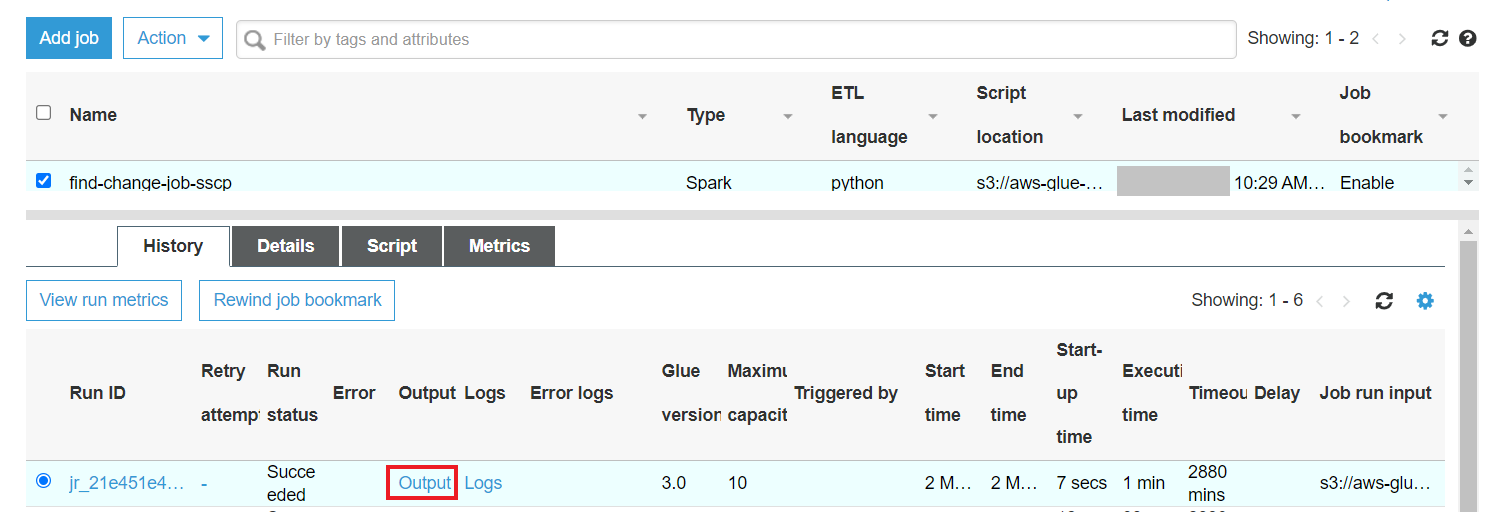
  21. To monitor the job status, choose the job and review the History tab.
  22. When the job is complete, choose the Output link to open the CloudWatch logs for the job.

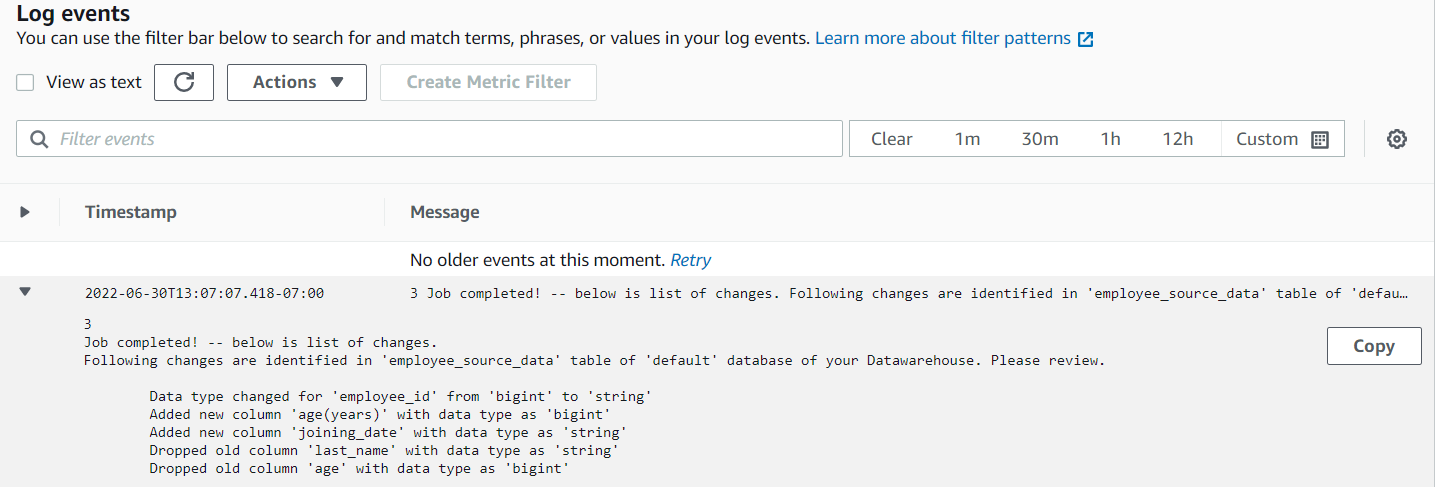
The log should show the changes identified by the AWS Glue job.

You should also receive an email with details on the changes in the schema. The following is an example of an email received.

We can now review the changes identified by the AWS Glue ETL job and make changes in the downstream data store accordingly before running the job to propagate the data from the S3 bucket to downstream applications. For example, if you have an Amazon Redshift table, after the job lists all the schema changes, you need to connect to the Amazon Redshift database and make these schema changes. Follow the change request process set by your organization before making schema changes in your production system.

The following table has a list of mappings for Apache Hive and Amazon Redshift data types. You can find similar mappings for other data stores and update your downstream data store.

The provided Python code takes care of the logic to compare the schema changes. The script takes in the parameters of the AWS Glue Data Catalog ID, AWS Glue database name, and AWS Glue table name.

Hive Data Types Description Amazon Redshift Data Types Description
TINYINT 1 byte integer . .
SMALLINT Signed two-byte integer SMALLINT Signed two-byte integer
INT Signed four-byte integer INT Signed four-byte integer
BIGINT Signed eight-byte integer BIGINT Signed eight-byte integer
DECIMAL . . .
DOUBLE . . .
STRING . VARCHAR, CHAR .
VARCHAR 1 to 65355, available starting with Hive 0.12.0 VARCHAR .
CHAR 255 length, available starting with Hive 0.13.0 CHAR .
DATE year/month/day DATE year/month/day
TIMESTAMP No timezone TIME Time without time zone
. . TIMETZ Time with time zone
ARRAY/STRUCTS . SUPER .
BOOLEAN . BOOLEAN .
BINARY . VARBYTE Variable-length binary value

Clean up

When you’re done exploring the solution, clean up the resources you created as part of this walkthrough:

  • AWS Glue ETL job (find-change-job-sscp)
  • AWS Glue crawler (glue-crawler-sscp-sales-data)
  • AWS Glue table (sscp_sales_data)
  • AWS Glue database (sscp-database)
  • IAM role for the crawler and ETL job (AWSGlueServiceRole-sscp-blog)
  • S3 bucket (aws-blog-sscp-ng-202202) with all the files in the data and archived folders
  • SNS topic and subscription (NotifySchemaChanges)

Conclusion

In this post, we showed you how to use AWS services together to detect schema changes in your source data, which you can then use to change your downstream data stores and run ETL jobs to avoid any failures in your data pipeline. We used AWS Glue to understand and catalog the source data schema, AWS Glue APIs to identify schema changes, and Amazon SNS to notify the team about the changes. We also showed you how to delete the older versions of your source data schema using AWS Glue APIs. We used Amazon S3 as our data lake storage tier.

Here you can learn more about AWS Glue.


About the authors

Narendra Gupta is a Specialist Solutions Architect at AWS, helping customers on their cloud journey with a focus on AWS analytics services. Outside of work, Narendra enjoys learning new technologies, watching movies, and visiting new places.

Navnit Shukla is AWS Specialist Solutions Architect in Analytics. He is passionate about helping customers uncover insights from their data. He has been building solutions to help organizations make data-driven decisions.

Run Apache Spark with Amazon EMR on EKS backed by Amazon FSx for Lustre storage

Post Syndicated from Vara Bonthu original https://aws.amazon.com/blogs/big-data/run-apache-spark-with-amazon-emr-on-eks-backed-by-amazon-fsx-for-lustre-storage/

Traditionally, Spark workloads have been run on a dedicated setup like a Hadoop stack with YARN or MESOS as a resource manager. Starting from Apache Spark 2.3, Spark added support for Kubernetes as a resource manager. The new Kubernetes scheduler natively supports the submission of Spark jobs to a Kubernetes cluster. Spark on Kubernetes provides simpler administration, better developer experience, easier dependency management with containers, a fine-grained security layer, and optimized resource allocation. As a result, Spark on Kubernetes gained much traction for high-performance and cost-effective ways of running big data and machine learning (ML) workloads.

In AWS, we offer a managed service, Amazon EMR on EKS, to run your Apache Spark workloads on Amazon Elastic Kubernetes Service (Amazon EKS) . This service uses the Amazon EMR runtime for Apache Spark, which increases the performance of your Spark jobs so that they run faster and cost less. EMR on EKS lets you run Spark applications alongside other application types on the same Amazon EKS cluster to improve resource utilization. In addition, EMR on EKS integrates with Amazon EMR Studio for authoring jobs and the Apache Spark UI for debugging out of the box to simplify infrastructure management.

For storage, EMR on EKS supports node ephemeral storage using hostPath where the storage is attached to individual nodes, and Amazon Elastic Block Store (Amazon EBS) volume per executor/driver pod using dynamic Persistent Volume Claims. However, some Spark users are looking for an HDFS-like shared file system to handle specific workloads like time-sensitive applications or streaming analytics. HDFS is best suited for jobs that requires highly interactive speed for a large number of files with random access reads, atomic rename operations, and sequential metadata requests.

Amazon FSx for Lustre is a fully managed shared storage option built on the world’s most popular high-performance file system. It offers highly scalable, cost-effective storage, which provides sub-millisecond latencies, millions of IOPS, and throughput of hundreds of gigabytes per second. Its popular use cases include high-performance computing (HPC), financial modeling, video rendering, and machine learning. FSx for Lustre supports two types of deployments:

  • Scratch file systems – These are designed for temporary or short-term storage where the data is not needed to replicate or persist if a file server fails
  • Persistent file systems – These are suitable for long-term storage where the file server is highly available and the data is replicated within the Availability Zone

In both deployment types, automatic data sync between the mounted file system and Amazon Simple Storage Service (Amazon S3) buckets is supported, helping you offload large volumes of cold and warm data for a better cost-efficient design. It makes multi-AZ or multi-region failover possible via Amazon S3 for businesses that require resiliency and availability.

This post demonstrates how to use EMR on EKS to submit Spark jobs with FSx for Lustre as the storage. It can be mounted on Spark driver and executor pods through static and dynamic PersistentVolumeClaims methods.

Static vs. dynamic provisioning

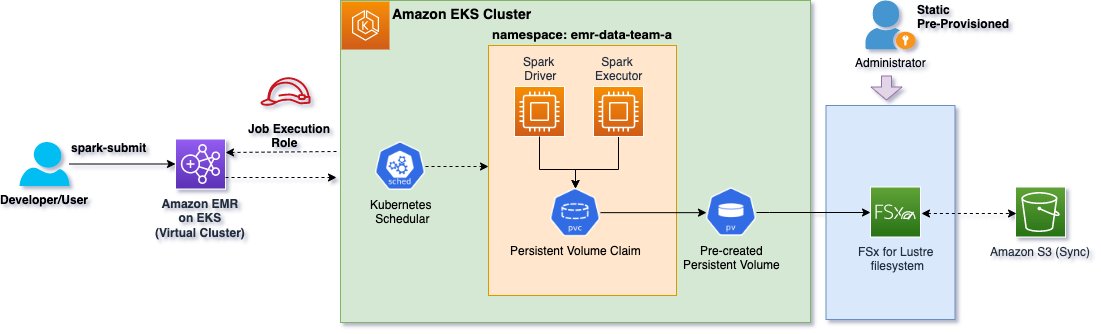
With static provisioning, the FSx for Lustre file system and PersistentVolume (PV) must be created in advance. The following diagram illustrates the static provisioning architecture. The Spark application driver and executor pods refer to an existing static PersistentVolumeClaim (PVC) to mount the FSx for Lustre file system.

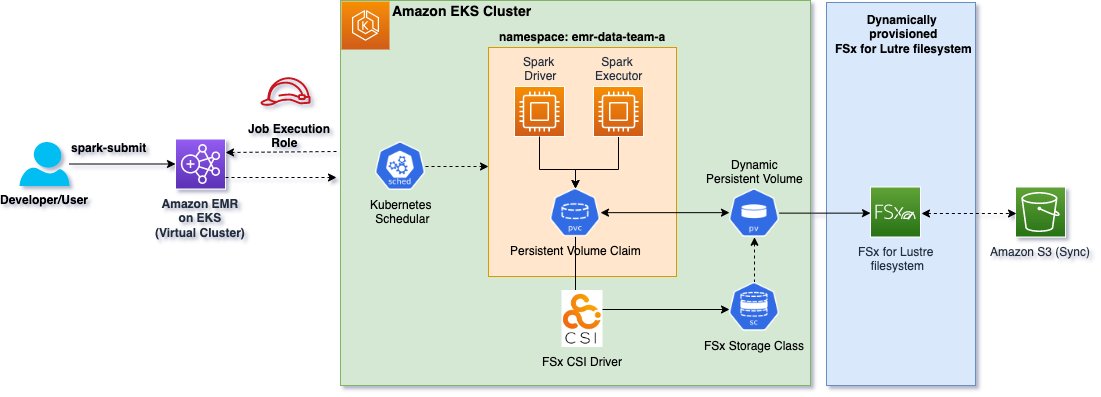
Unlike static provisioning, the FSx for Lustre file system and PV doesn’t need to be pre-created for dynamic provisioning. As shown in the following diagram, the FSx for Lustre CSI driver plugin is deployed to an Amazon EKS cluster to dynamically provision the FSx for Lustre file system with a given PVC. Dynamic provisioning only requires a PVC and the corresponding storage class. After the PVC is created in Kubernetes, the FSx for Lustre CSI driver identifies the storage class and creates the requested file system.

The Spark application driver and executor pods in the architecture refer to an existing dynamic PVC to mount the FSx for Lustre file system.

Solution overview

In this post, you provision the following resources with Amazon EKS Blueprints for Terraform to run Spark jobs using EMR on EKS:

Pre-requisites

Before you build the entire infrastructure, you must have the following prerequisites:

Now you’re ready to deploy the solution.

Clone the GitHub repo

Open your terminal window, change to the home directory, and clone the GitHub repo:

cd ~
git clone https://github.com/aws-ia/terraform-aws-eks-blueprints.git

Then, navigate to the following:

cd ~/terraform-aws-eks-blueprints/examples/analytics/emr-eks-fsx-lustre

Initialize Terraform

Initialize the project, which downloads plugins that allow Terraform to interact with AWS services:

terraform init

Run terraform plan

Run terraform plan to verify the resources created by this deployment:

export AWS_REGION="<enter-your-region>"
terraform plan

The terraform plan output shows the resources that are created by this plan.

Run terraform apply

Run terraform apply to deploy the resources:

terraform apply --auto-approve

This deployment may take up to 30 minutes to create all the resources.

Verify the resources

Verify the Amazon EKS cluster created by the deployment. This following command displays the cluster details in JSON format:

aws eks describe-cluster --name emr-eks-fsx-lustre

Let’s create a kubeconfig file for the EKS cluster with the following command. This command creates a new cluster context entry with certificate authority data under ~/.kube/config to authenticate with the EKS cluster:

aws eks --region <ENTER_YOUR_REGION> update-kubeconfig --name emr-eks-fsx-lustre

Verify the managed node groups:

aws eks list-nodegroups —cluster-name emr-eks-fsx-lustre

The output should show two node groups:

{
    "nodegroups": [
        "core-node-grp-<some_random_numbers>",
        "spark-node-grp-<some_random_numbers>"
    ]
}

List the pods created by the FSx for Lustre CSI driver. The following command shows two controllers and an fsx-csi-node daemonset pod for each node:

kubectl get pods -n kube-system | grep fsx

List the namespace created for emr-data-team-a:

kubectl get ns | grep emr-data-team-a

The output will display the active namespace.

List the FSx storage class, PV, and PVCs created by this deployment. You may notice that fsx-dynamic-pvc is in Pending status because this dynamic PVC is still creating the FSx for Lustre. The dynamic PV status changed to Bound after the file system was created.

#FSx Storage Class
kubectl get storageclasses | grep fsx
  emr-eks-fsx-lustre   fsx.csi.aws.com         Delete          Immediate              false                  109s

# Output of static persistent volume with name fsx-static-pv
kubectl get pv | grep fsx  
  fsx-static-pv                              1000Gi     RWX            Recycle          Bound    emr-data-team-a/fsx-static-pvc       fsx

# Output of static persistent volume claim with name fsx-static-pvc and fsx-dynamic-pvc
kubectl get pvc -n emr-data-team-a | grep fsx
  fsx-dynamic-pvc   Pending                                             fsx            4m56s
  fsx-static-pvc    Bound     fsx-static-pv   1000Gi     RWX            fsx            4m56s

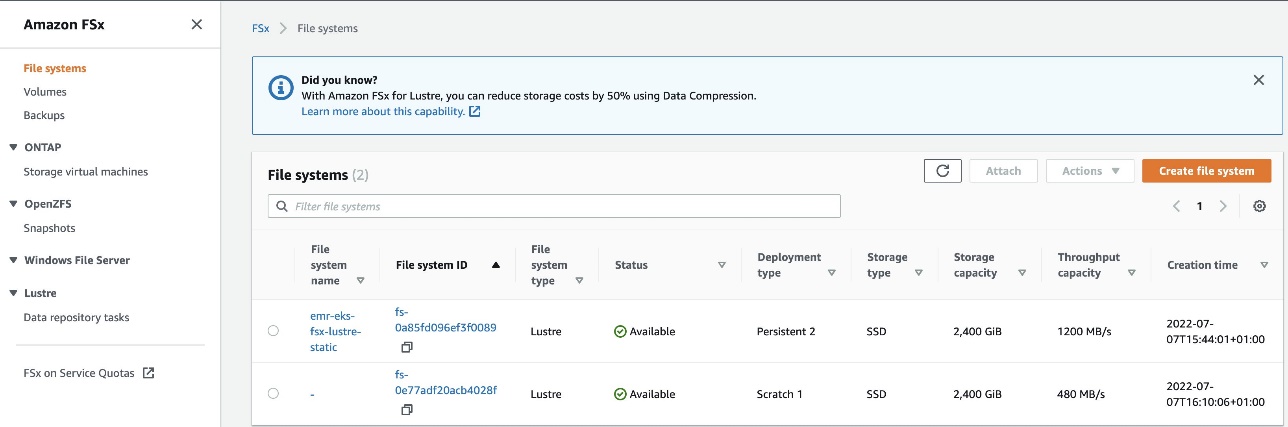
Log in to the FSx for Lustre console and verify the two file systems created by this deployment:

  • The first file system (emr-eks-fsx-lustre-static) is a persistent file system created with the Terraform resource
  • The second file system (fs-0e77adf20acb4028f) is created by the FSx for Lustre CSI driver dynamically with a dynamic PVC manifest

In this demo, we learn how to use a statically provisioned FSx for Lustre file system and dynamically provisioned FSx for Lustre file system in EMR on EKS Spark jobs.

Static provisioning

You can create an FSx for Lustre file system using the AWS CLI or any infrastructure as code (IaC) tool. In this example, we used Terraform to create the FSx for Lustre file system with deployment type as PERSISTENT_2. For static provisioning, we must create the FSx for Lustre file system first, followed by the PV and PVCs. After we create all three resources, we can mount the FSx for Lustre file system on a Spark driver and executor pod.

We use the following Terraform code snippet in the deployment to create the FSx for Lustre file system (2400 GB) and the file system association with the S3 bucket for import and export under the /data file system path. Note that this resource refers to a single subnet (single Availability Zone) for creating an FSx for Lustre file system. However, the Spark pods can use this file system across all Availability Zones, unlike the EBS volume, which is Availability Zone specific. In addition, the FSx for Lustre association with the S3 bucket creates a file system directory called /data. The Spark job driver and executor pod templates use this /data directory as a spark-local-dir for scratch space.

# New FSx for Lustre filesystem
resource "aws_fsx_lustre_file_system" "this" {
  deployment_type             = "PERSISTENT_2"
  storage_type                = "SSD"
  per_unit_storage_throughput = "500"
  storage_capacity            = 2400

  subnet_ids         = [module.vpc.private_subnets[0]]
  security_group_ids = [aws_security_group.fsx.id]
  log_configuration {
    level = "WARN_ERROR"
  }
  tags = merge({ "Name" : "${local.name}-static" }, local.tags)
}

# S3 bucket association with FSx for Lustre filesystem
resource "aws_fsx_data_repository_association" "example" {
  file_system_id       = aws_fsx_lustre_file_system.this.id
  data_repository_path = "s3://${aws_s3_bucket.this.id}"
  file_system_path     = "/data" # This directory will be used in Spark podTemplates under volumeMounts as subPath

  s3 {
    auto_export_policy {
      events = ["NEW", "CHANGED", "DELETED"]
    }

    auto_import_policy {
      events = ["NEW", "CHANGED", "DELETED"]
    }
  }
}

Persistent Volume

The following YAML template shows the definition of the PV created by this deployment. For example, running the command kubectl edit pv fsx-static-pv -n kube-system displays the manifest. PVs are a cluster scoped resource, therefore no namespace is defined in the template. The DevOps or cluster admin teams typically create this.

apiVersion: v1
kind: PersistentVolume
metadata:
  name: fsx-static-pv
spec:
  accessModes:
  - ReadWriteMany
  capacity:
    storage: 1000Gi
  claimRef:  # PV Claimed by fsx-static-pvc                
    apiVersion: v1
    kind: PersistentVolumeClaim             
    name: fsx-static-pvc
    namespace: emr-data-team-a
    resourceVersion: "5731"
    uid: 9110afc4-c605-440e-b022-190904866f0c
  csi:
    driver: fsx.csi.aws.com
    volumeAttributes:
      dnsname: fs-0a85fd096ef3f0089.fsx.eu-west-1.amazonaws.com # FSx DNS Name
      mountname: fz5jzbmv
    volumeHandle: fs-0a85fd096ef3f0089
  mountOptions:
  - flock
  persistentVolumeReclaimPolicy: Recycle

Persistent Volume Claim

The following YAML template shows the definition of the PVC created by this deployment. For example, running the command kubectl edit pvc fsx-static-pvc -n emr-data-team-a shows the deployed resource.

PVCs are namespace-specific resources typically created by the developers. The emr-data-team-a namespace is defined in the template.

apiVersion: v1
kind: PersistentVolumeClaim
metadata:
  name: fsx-static-pvc
  namespace: emr-data-team-a
spec:
  accessModes:
  - ReadWriteMany
  resources:
    requests:
      storage: 1000Gi
  storageClassName: fsx
  volumeMode: Filesystem
  volumeName: fsx-static-pv
status:
  accessModes:
  - ReadWriteMany
  capacity:
    storage: 1000Gi
  phase: Bound

Now that we have set up the static FSx for Lustre file system, we can use the PVC in EMR on EKS Spark jobs with pod templates. Key things to note in the template are that the volumes section in the following code is defined as persistentVolumeClaim with the claim name as fsx-static-pvc, and the containers section refers to the unique mountPath folder /static. We also use initContainers in the driver pod template to give correct permissions and ownership to the Hadoop users to be used by EMR on EKS driver executor pods. Finally, notice that data in the subPath is associated with the S3 bucket sync in the preceding Terraform resource.

We use the following driver pod template:

apiVersion: v1
kind: Pod
metadata:
  name: fsx-taxi-driver
  namespace: emr-data-team-a
spec:
  volumes:
    - name: spark-local-dir-ny-taxi
      persistentVolumeClaim:
        claimName: fsx-static-pvc # Static PVC pre-created by this example terraform template

  nodeSelector:
    NodeGroupType: spark

  containers:
    - name: spark-kubernetes-driver 
      volumeMounts:
        - name: spark-local-dir-ny-taxi
          mountPath: /static
          subPath: data # sub folder created in FSx for Lustre filesystem and mapped to s3 bucket sync and export
          readOnly: false
  initContainers:
    - name: spark-init-container-driver  
      image: public.ecr.aws/y4g4v0z7/busybox
      volumeMounts:
        - name: spark-local-dir-ny-taxi
          mountPath: /static
      command: ["sh", "-c", "chmod -R 777 /static", "chown -hR +999:+1000 /static/data"]

The executor pod template also refers to the same persistentVolumeClaim as fsx-static-pvc and volumeMounts with mountPath as /static. Notice that we don’t use the initContainers section in this template because the required permissions for the file system directory /static/data have been applied by the driver processes already. Because it’s a shared file system, the same permissions apply to the executor process as well.

apiVersion: v1
kind: Pod
metadata:
  name: fsx-taxi-exec
  namespace: emr-data-team-a
spec:
  volumes:
    - name: spark-local-dir-ny-taxi
      persistentVolumeClaim:
        claimName: fsx-static-pvc # Static PVC pre-created by this example terraform template

  nodeSelector:
    NodeGroupType: spark

  containers:
    - name: spark-kubernetes-executor # Don't change this name. EMR on EKS looking for this name
      volumeMounts:
        - name: spark-local-dir-ny-taxi
          mountPath: /static # mountPath name can be anything but this should match with Driver template as well
          subPath: data # sub folder created in FSx for Lustre filesystem and mapped to s3 bucket sync and export
          readOnly: false

Let’s run the sample PySpark script using the preceding pod templates. Navigate to the examples/spark-execute directory and run the shell script (fsx-static-spark.sh):

cd ~/terraform-aws-eks-blueprints/examples/analytics/emr-eks-fsx-lustre/examples/spark-execute

This shell script expects three input values. EMR_VIRTUAL_CLUSTER_ID and EMR_JOB_EXECUTION_ROLE_ARN can be extracted from the Terraform output values. Additionally, you create an S3 bucket with required permissions. This S3 bucket stores the sample PySpark scripts, pod templates, input and output data generated by this shell script, and the Spark job. Check out the shell script for more details.

EMR_VIRTUAL_CLUSTER_ID=$1     # Terraform output variable: emrcontainers_virtual_cluster_id    
S3_BUCKET=$2                  # This script requires s3 bucket as input parameter e.g., s3://<bucket-name>    
EMR_JOB_EXECUTION_ROLE_ARN=$3 # Terraform output variable: emr_on_eks_role_arn

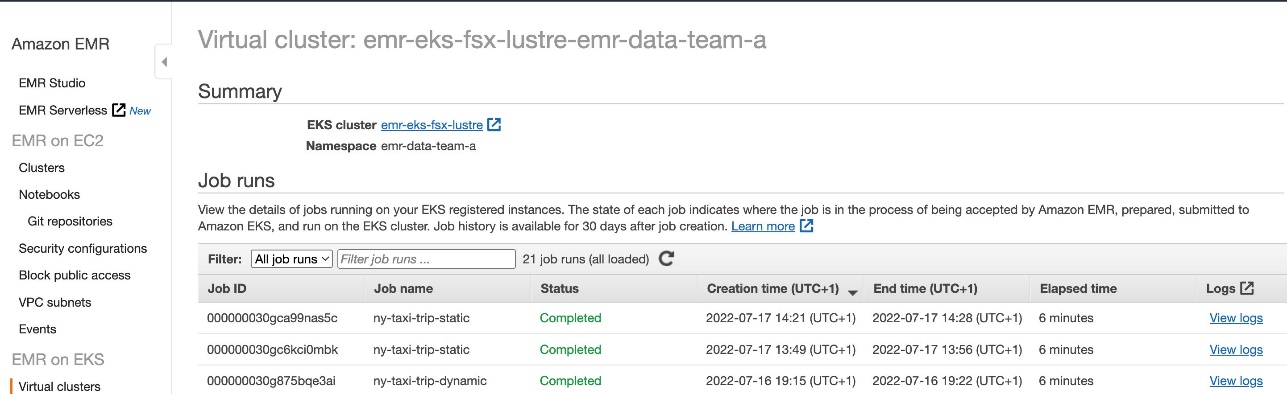
Let’s run the fsx-static-spark.sh shell script. This job takes approximately 6 minutes by two executors, which processes 40 objects with a total size of 1.4 GB. Each object is around 36.4 MB. You can adjust the number of objects from 40 to any large number to process a large amount of data. This shell script downloads the public dataset (NY Taxi Trip Data) locally in your disk and uploads it to the S3 bucket using Amazon S3 sync. PySpark jobs read the data from the S3 buckets, apply GroupBy on a few fields, and write back to the S3 bucket to demonstrate the shuffling activity.

./fsx-static-spark.sh <EMR_VIRTUAL_CLUSTER_ID> \
s3://<YOUR_BUCKET_NAME> \
<EMR_JOB_EXECUTION_ROLE_ARN>

You can run the following queries to monitor the Spark job and the usage of the FSx for Lustre file system mounted on the driver and executor pods. Verify the job run events with the following command:

kubectl get pods --namespace=emr-data-team-a -w

You will notice one job object pod, a driver pod, and two executor pods. The Spark executor instances count can be updated in the Shell script.

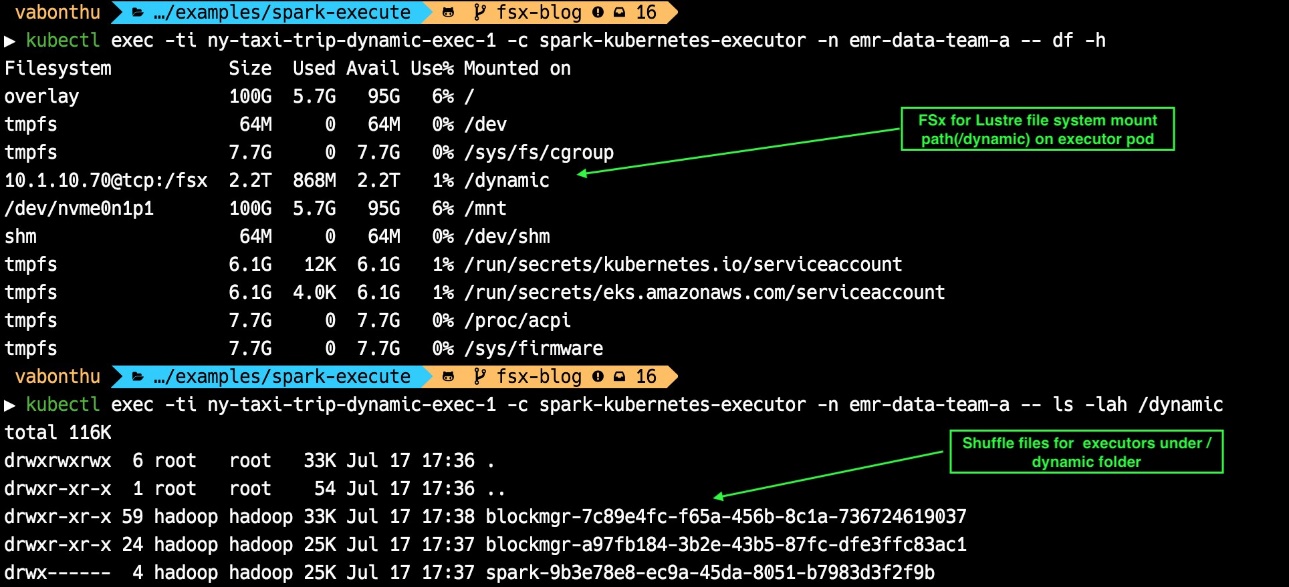
You can also query to monitor the usage of FSx for Lustre mounted file system size. The following command shows the size of the mounted file system growth during the test run:

# Verify the used FSx for Lustre filesystem disk size with executor1
kubectl exec -ti ny-taxi-trip-static-exec-1 -c spark-kubernetes-executor -n emr-data-team-a — df -h

# Verify the files created under /static/data FSx mount
kubectl exec -ti ny-taxi-trip-static-exec-1 -c spark-kubernetes-executor -n emr-data-team-a — ls -lah /static

# Verify the file sync from FSx to S3 bucket. 
aws s3 ls s3://<YOUR_SYNC_BUCKET_NAME_FROM_TERRAFORM_OUTPUT>/

The following diagram shows the output for the preceding commands. The files under the executor are the same as those under the S3 bucket. These files are the same because the S3 sync feature is enabled in the FSx for Lustre file system. This test uses the FSx for Lustre file system for scratch space, so the shuffle files will be deleted from the FSx for Lustre file system and S3 bucket when the test is complete.

This PySpark job is writing the aggregated and repartition output directly to an S3 bucket location. Instead, you can choose to write to the FSx for Lustre file system path, which syncs to an S3 bucket eventually. The FSx for Lustre file system provides low latency, high throughput, and high IOPS for reading and writing data by multiple Spark Jobs. In addition, the data stored in FSx disk is synced to an S3 bucket for durable storage.

You can monitor the FSx for Lustre file system using Amazon CloudWatch metrics. The following time series graph shows the average stats with a period of 30 seconds.

When the Spark job is complete, you can verify the results in the Spark Web UI from the EMR on EKS console.

You can also verify the FSx for Lustre file system data sync to an S3 bucket.

Dynamic provisioning

So far, we have looked at an FSx for Lustre statically provisioned file system example and its usage with Spark jobs.

We can also provision an FSx for Lustre file system on-demand using the FSx for Lustre CSI driver and Persistent Volume Claim. Whenever you create a PVC with a dynamic volume referring to an FSx storage class, the FSx for Lustre CSI driver automatically provisions the FSx for Lustre file system and the corresponding Persistent Volume. Admin teams (DevOps) are responsible for deploying the FSx for Lustre CSI driver and FSx storage class, and the developers and data engineers (DataOps) are responsible for deploying the PVC, which refers to the FSx storage class.

The following storage class is deployed to Amazon EKS by this Terraform deployment. This dynamic PVC example doesn’t use the Amazon S3 backup association. You can still do that, but it requires an Amazon S3 config in the storage class manifest. Check out Dynamic Provisioning with Data Repository to configure the FSx storage class with the S3 import/export path with the choice of deployment type (SCRATCH_1, SCRATCH_2 and PERSISTENT_1). We have also created a dedicated security group used in this manifest. For more information, refer to File System Access Control with Amazon VPC.

kind: StorageClass
apiVersion: storage.k8s.io/v1
metadata:
  name: fsx
provisioner: fsx.csi.aws.com
parameters:
  securityGroupIds: sg-0c8a656a0bbb17fe2
  subnetId: subnet-03cb3d850193b907b
reclaimPolicy: Delete
volumeBindingMode: Immediate

The following YAML template shows the definition of the dynamic PVC used in this deployment. Running the command kubectl edit pvc fsx-dynamic-pvc -n emr-data-team-a shows the deployed resource. PVCs are a namespace-specific resources typically created by the developers, therefore we define the emr-data-team-a namespace.

Spark can dynamically provision the PVC with claimName using SparkConf (for example, spark.kubernetes.driver.volumes.persistentVolumeClaim.data.options.claimName=OnDemand). However, we recommend deploying the PVC before the start of Spark jobs to avoid delays to provision the FSx for Lustre file system during the job run. The FSx for Lustre file system takes approximately 10–12 minutes to complete.

apiVersion: v1
kind: PersistentVolumeClaim
metadata:
  name: fsx-dynamic-pvc
  namespace: emr-data-team-a
spec:
  accessModes:
  - ReadWriteMany
  resources:
    requests:
      storage: 2000Gi
  storageClassName: fsx # PVC reference to Storage class created by Terraform
  volumeMode: Filesystem
  volumeName: pvc-0da5a625-03ba-48fa-b08e-3f74291c0e5e # Dynamically created Persistent Volume
status:
  accessModes:
  - ReadWriteMany
  capacity:
    storage: 2400Gi
  phase: Bound

Now that we have set up the dynamic FSx for Lustre file system, we can use this in EMR on EKS Spark jobs using pod templates. Key things to note in the following template are that the volumes section is defined as persistentVolumeClaim with the claim name as fsx-dynamic-pvc, and the containers section refers to the unique mountPath folder as /dynamic. We also use initContainers in the driver pod template to give correct permissions and ownership to the Hadoop users to be used by EMR on EKS driver executor processes.

The following is our driver pod template:

# NOTE: PVC created before the start of the Spark job to avoid waiting for 15 mins to create FSx for Lustre filesystem while the job is running
---
apiVersion: v1
kind: Pod
metadata:
  name: fsx-taxi-driver
  namespace: emr-data-team-a # Namespace used to submit the jobs
spec:
  volumes:
    - name: spark-local-dir-ny-taxi
      persistentVolumeClaim:
        claimName: fsx-dynamic-pvc  # Dynamic PVC pre-created by this example terraform template

  nodeSelector:
    NodeGroupType: spark

  containers:
    - name: spark-kubernetes-driver 
      volumeMounts:
        - name: spark-local-dir-ny-taxi
          mountPath: /dynamic # FSx SCRATCH_1 filesystem for executors scratch space
          readOnly: false
  initContainers:  # initContainer only used in Driver to set the permissions for dynamically created filesystem.
    - name: spark-init-container-driver  
      image: public.ecr.aws/y4g4v0z7/busybox
      volumeMounts:
        - name: spark-local-dir-ny-taxi
          mountPath: /dynamic # FSx Scratch 1 filesystem for executors scratch space
      command: ["sh", "-c", "chmod 777 /dynamic", "chown -hR +999:+1000 /dynamic"]

The executor pod template also refers to the same persistentVolumeClaim as fsx-dynamic-pvc and volumeMounts with mountPath as /dynamic:

apiVersion: v1
kind: Pod
metadata:
  name: fsx-taxi-exec
  namespace: emr-data-team-a
spec:
  volumes:
    - name: spark-local-dir-ny-taxi
      persistentVolumeClaim:
        claimName: fsx-dynamic-pvc  # Dynamic PVC pre-created by this example terraform template

  nodeSelector:
    NodeGroupType: spark

  containers:
    - name: spark-kubernetes-executor # Don't change this name. EMR on EKS looking for this name
      volumeMounts:
        - name: spark-local-dir-ny-taxi
          mountPath: /dynamic  # FSx Scratch 1 filesystem for executor’s scratch space
          readOnly: false

Let’s run the sample PySpark script using the preceding pod templates. Navigate to the examples/spark-execute directory and run the shell script (fsx-dynamic-spark.sh). This script is the same as the static provisioning example; the only difference is the pod templates, which refer to the dynamic volumes.

cd ~/terraform-aws-eks-blueprints/examples/analytics/emr-eks-fsx-lustre/examples/spark-execute

This shell script expects three input values: EMR_VIRTUAL_CLUSTER_ID, EMR_JOB_EXECUTION_ROLE_ARN, and your S3 bucket name. Use the same values used in the previous static provisioning example.

Let’s run the fsx-dynamic-spark.sh shell script:

./fsx-dynamic-spark.sh <EMR_VIRTUAL_CLUSTER_ID> \
s3://<YOUR_BUCKET_NAME> \
<EMR_JOB_EXECUTION_ROLE_ARN>

After the job is triggered, run the following commands to see the output of the job:

# Output of dynamic persistent volume claim fsx-dynamic-pvc
kubectl get pvc -n emr-data-team-a | grep fsx-dynamic-pvc

# Verify the used FSx for Lustre filesystem disk size with executor1
kubectl exec -ti ny-taxi-trip-dynamic-exec-1 -c spark-kubernetes-executor -n emr-data-team-a — df -h

# Verify the files created under /dynamic FSx mount
kubectl exec -ti ny-taxi-trip-dynamic-exec-1 -c spark-kubernetes-executor -n emr-data-team-a — ls -lah /dynamic

The following screenshot shows the file system mounted under the /dynamic path. We can also see the Spark shuffle files created in the /dynamic folder.

Clean up

To clean up your environment, destroy the Terraform modules in reverse order. Then, empty any S3 buckets created by this module and run the following commands:

cd ~/terraform-aws-eks-blueprints/examples/analytics/emr-eks-fsx-lustre

terraform destroy -target="module.eks_blueprints_kubernetes_addons" -auto-approve

terraform destroy -target="module.eks_blueprints" -auto-approve

terraform destroy -target="module.vpc" -auto-approve

# Finally, destroy any additional resources that are not in the above modules

terraform destroy -auto-approve

Furthermore, log in to the AWS Management Console and delete any S3 buckets or FSX for Lustre file systems created by this deployment to avoid unwanted charges to your AWS account.

Conclusion

In this post, we demonstrated how to mount an FSx for Lustre file system as a PVC to Spark applications with EMR on EKS. We showed two mounting methods: static provisioning and dynamic provisioning via the FSx for Lustre CSI driver. The HDFS-like storage can be used by Spark on a Kubernetes pattern to achieve optimal storage performance. You can use it either as a temporary scratch space to store intermediate data while processing, or as a shared, persistent file system to exchange data for multiple pods in a single job or between multiple Spark jobs.

If you want to try out the full solution or for more EMR on EKS examples, check out our open-sourced project on GitHub.


About the authors

Vara Bonthu is a Senior Open Source Engineer focused on data analytics and containers working with Strategic Accounts. He is passionate about open source, big data, Kubernetes, and has a substantial development, DevOps, and architecture background.

Karthik Prabhakar is a Senior Analytics Specialist Solutions Architect at AWS, helping strategic customers adopt and run AWS Analytics services.

Melody Yang is a Senior Big Data Solutions Architect for Amazon EMR at AWS. She is an experienced analytics leader working with AWS customers to provide best practice guidance and technical advice in order to assist their success in data transformation. Her areas of interests are open-source frameworks and automation, data engineering, and DataOps.


Deploying IBM Cloud Pak for Data on Red Hat OpenShift Service on AWS

Post Syndicated from Eduardo Monich Fronza original https://aws.amazon.com/blogs/architecture/deploying-ibm-cloud-pak-for-data-on-red-hat-openshift-service-on-aws/

Amazon Web Services (AWS) customers who are looking for a more intuitive way to deploy and use IBM Cloud Pak for Data (CP4D) on the AWS Cloud, can now use the Red Hat OpenShift Service on AWS (ROSA).

ROSA is a fully managed service, jointly supported by AWS and Red Hat. It is managed by Red Hat Site Reliability Engineers and provides a pay-as-you-go pricing model, as well as a unified billing experience on AWS.

With this, customers do not manage the lifecycle of Red Hat OpenShift Container Platform clusters. Instead, they are free to focus on developing new solutions and innovating faster, using IBM’s integrated data and artificial intelligence platform on AWS, to differentiate their business and meet their ever-changing enterprise needs.

CP4D can also be deployed from the AWS Marketplace with self-managed OpenShift clusters. This is ideal for customers with requirements, like Red Hat OpenShift Data Foundation software defined storage, or who prefer to manage their OpenShift clusters.

In this post, we discuss how to deploy CP4D on ROSA using IBM-provided Terraform automation.

Cloud Pak for data architecture

Here, we install CP4D in a highly available ROSA cluster across three availability zones (AZs); with three master nodes, three infrastructure nodes, and three worker nodes.

Review the AWS Regions and Availability Zones documentation and the regions where ROSA is available to choose the best region for your deployment.

This is a public ROSA cluster, accessible from the internet via port 443. When deploying CP4D in your AWS account, consider using a private cluster (Figure 1).

IBM Cloud Pak for Data on ROSA

Figure 1. IBM Cloud Pak for Data on ROSA

We are using Amazon Elastic Block Store (Amazon EBS) and Amazon Elastic File System (Amazon EFS) for the cluster’s persistent storage. Review the IBM documentation for information about supported storage options.

Review the AWS prerequisites for ROSA, and follow the Security best practices in IAM documentation to protect your AWS account before deploying CP4D.

Cost

The costs associated with using AWS services when deploying CP4D in your AWS account can be estimated on the pricing pages for the services used.

Prerequisites

This blog assumes familiarity with: CP4D, Terraform, Amazon Elastic Compute Cloud (Amazon EC2), Amazon EBS, Amazon EFS, Amazon Virtual Private Cloud, and AWS Identity and Access Management (IAM).

You will need the following before getting started:

Installation steps

Complete the following steps to deploy CP4D on ROSA:

  1. First, enable ROSA on the AWS account. From the AWS ROSA console, click on Enable ROSA, as in Figure 2.

    Enabling ROSA on your AWS account

    Figure 2. Enabling ROSA on your AWS account

  2. Click on Get started. Redirect to the Red Hat website, where you can register and obtain a Red Hat ROSA token.
  3. Navigate to the AWS IAM console. Create an IAM policy named cp4d-installer-policy and add the following permissions:
    {
        "Version": "2012-10-17",
        "Statement": [
            {
                "Effect": "Allow",
                "Action": [
                    "autoscaling:*",
                    "cloudformation:*",
                    "cloudwatch:*",
                    "ec2:*",
                    "elasticfilesystem:*",
                    "elasticloadbalancing:*",
                    "events:*",
                    "iam:*",
                    "kms:*",
                    "logs:*",
                    "route53:*",
                    "s3:*",
                    "servicequotas:GetRequestedServiceQuotaChange",
                    "servicequotas:GetServiceQuota",
                    "servicequotas:ListServices",
                    "servicequotas:ListServiceQuotas",
                    "servicequotas:RequestServiceQuotaIncrease",
                    "sts:*",
                    "support:*",
                    "tag:*"
                ],
                "Resource": "*"
            }
        ]
    }
  4. Next, let’s create an IAM user from the AWS IAM console, which will be used for the CP4D installation:
    a. Specify a name, like ibm-cp4d-bastion.
    b. Set the credential type to Access key – Programmatic access.
    c. Attach the IAM policy created in Step 3.
    d. Download the .csv credentials file.
  5. From the Amazon EC2 console, create a new EC2 key pair and download the private key.
  6. Launch an Amazon EC2 instance from which the CP4D installer is launched:
    a. Specify a name, like ibm-cp4d-bastion.
    b. Select an instance type, such as t3.medium.
    c. Select the EC2 key pair created in Step 4.
    d. Select the Red Hat Enterprise Linux 8 (HVM), SSD Volume Type for 64-bit (x86) Amazon Machine Image.
    e. Create a security group with an inbound rule that allows connection. Restrict access to your own IP address or an IP range from your organization.
    f. Leave all other values as default.
  7. Connect to the EC2 instance via SSH using its public IP address. The remaining installation steps will be initiated from it.
  8. Install the required packages:
    $ sudo yum update -y
    $ sudo yum install git unzip vim wget httpd-tools python38 -y
    
    $ sudo ln -s /usr/bin/python3 /usr/bin/python
    $ sudo ln -s /usr/bin/pip3 /usr/bin/pip
    $ sudo pip install pyyaml
    
    $ curl "https://awscli.amazonaws.com/awscli-exe-linux-x86_64.zip" -o "awscliv2.zip"
    $ unzip awscliv2.zip
    $ sudo ./aws/install
    
    $ wget "https://github.com/stedolan/jq/releases/download/jq-1.6/jq-linux64"
    $ chmod +x jq-linux64
    $ sudo mv jq-linux64 /usr/local/bin/jq
    
    $ wget "https://mirror.openshift.com/pub/openshift-v4/clients/ocp/4.10.15/openshift-client-linux-4.10.15.tar.gz"
    $ tar -xvf openshift-client-linux-4.10.15.tar.gz
    $ chmod u+x oc kubectl
    $ sudo mv oc /usr/local/bin
    $ sudo mv kubectl /usr/local/bin
    
    $ sudo yum install -y yum-utils
    $ sudo yum-config-manager --add-repo $ https://rpm.releases.hashicorp.com/RHEL/hashicorp.repo
    $ sudo yum -y install terraform
    
    $ sudo subscription-manager repos --enable=rhel-7-server-extras-rpms
    $ sudo yum install -y podman
  9. Configure the AWS CLI with the IAM user credentials from Step 4 and the desired AWS region to install CP4D:
    $ aws configure
    
    AWS Access Key ID [None]: AK****************7Q
    AWS Secret Access Key [None]: vb************************************Fb
    Default region name [None]: eu-west-1
    Default output format [None]: json
  10. Clone the following IBM GitHub repository:
    https://github.com/IBM/cp4d-deployment.git

    $ cd ~/cp4d-deployment/managed-openshift/aws/terraform/
  11. For the purpose of this post, we enabled Watson Machine Learning, Watson Studio, and Db2 OLTP services on CP4D. Use the example in this step to create a Terraform variables file for CP4D installation. Enable CP4D services required for your use case:
    region			= "eu-west-1"
    tenancy			= "default"
    access_key_id 		= "your_AWS_Access_key_id"
    secret_access_key 	= "your_AWS_Secret_access_key"
    
    new_or_existing_vpc_subnet	= "new"
    az				= "multi_zone"
    availability_zone1		= "eu-west-1a"
    availability_zone2 		= "eu-west-1b"
    availability_zone3 		= "eu-west-1c"
    
    vpc_cidr 		= "10.0.0.0/16"
    public_subnet_cidr1 	= "10.0.0.0/20"
    public_subnet_cidr2 	= "10.0.16.0/20"
    public_subnet_cidr3 	= "10.0.32.0/20"
    private_subnet_cidr1 	= "10.0.128.0/20"
    private_subnet_cidr2 	= "10.0.144.0/20"
    private_subnet_cidr3 	= "10.0.160.0/20"
    
    openshift_version 		= "4.10.15"
    cluster_name 			= "your_ROSA_cluster_name"
    rosa_token 			= "your_ROSA_token"
    worker_machine_type 		= "m5.4xlarge"
    worker_machine_count 		= 3
    private_cluster 			= false
    cluster_network_cidr 		= "10.128.0.0/14"
    cluster_network_host_prefix 	= 23
    service_network_cidr 		= "172.30.0.0/16"
    storage_option 			= "efs-ebs" 
    ocs 				= { "enable" : "false", "ocs_instance_type" : "m5.4xlarge" } 
    efs 				= { "enable" : "true" }
    
    accept_cpd_license 		= "accept"
    cpd_external_registry 		= "cp.icr.io"
    cpd_external_username 	= "cp"
    cpd_api_key 			= "your_IBM_API_Key"
    cpd_version 			= "4.5.0"
    cpd_namespace 		= "zen"
    cpd_platform 			= "yes"
    
    watson_knowledge_catalog 	= "no"
    data_virtualization 		= "no"
    analytics_engine 		= "no"
    watson_studio 			= "yes"
    watson_machine_learning 	= "yes"
    watson_ai_openscale 		= "no"
    spss_modeler 			= "no"
    cognos_dashboard_embedded 	= "no"
    datastage 			= "no"
    db2_warehouse 		= "no"
    db2_oltp 			= "yes"
    cognos_analytics 		= "no"
    master_data_management 	= "no"
    decision_optimization 		= "no"
    bigsql 				= "no"
    planning_analytics 		= "no"
    db2_aaservice 			= "no"
    watson_assistant 		= "no"
    watson_discovery 		= "no"
    openpages 			= "no"
    data_management_console 	= "no"
  12. Save your file, and launch the commands below to install CP4D and track progress:
    $ terraform init -input=false
    $ terraform apply --var-file=cp4d-rosa-3az-new-vpc.tfvars \
       -input=false | tee terraform.log
  13. The installation runs for 4 or more hours. Once installation is complete, the output includes (as in Figure 3):
    a. Commands to get the CP4D URL and the admin user password
    b. CP4D admin user
    c. Login command for the ROSA cluster
CP4D installation output

Figure 3. CP4D installation output

Validation steps

Let’s verify the installation!

  1. Log in to your ROSA cluster using your cluster-admin credentials.
    $ oc login https://api.cp4dblog.17e7.p1.openshiftapps.com:6443 --username cluster-admin --password *****-*****-*****-*****
  2. Initiate the following command to get the cluster’s console URL (Figure 4):
    $ oc whoami --show-console

    ROSA console URL

    Figure 4. ROSA console URL

  3. Run the commands in this step to retrieve the CP4D URL and admin user password (Figure 5).
    $ oc extract secret/admin-user-details \
      --keys=initial_admin_password --to=- -n zen
    $ oc get routes -n zen

    Retrieve the CP4D admin user password and URL

    Figure 5. Retrieve the CP4D admin user password and URL

  4. Initiate the following commands to have the CP4D workloads in your ROSA cluster (Figure 6):
    $ oc get pods -n zen
    $ oc get deployments -n zen

    $ oc get svc -n zen 
    $ oc get pods -n ibm-common-services 
    $ oc get deployments -n ibm-common-services
    $ oc get svc -n ibm-common-services
    $ oc get subs -n ibm-common-services

    Checking the CP4D pods running on ROSA

    Figure 6. Checking the CP4D pods running on ROSA

  5. Log in to your CP4D web console using its URL and your admin password.
  6. Expand the navigation menu. Navigate to Services > Services catalog for the available services (Figure 7).

    Navigating to the CP4D services catalog

    Figure 7. Navigating to the CP4D services catalog

  7. Notice that the services set as “enabled” correspond with your Terraform definitions (Figure 8).

    Services enabled in your CP4D catalog

    Figure 8. Services enabled in your CP4D catalog

Congratulations! You have successfully deployed IBM CP4D on Red Hat OpenShift on AWS.

Post installation

Refer to the IBM documentation on setting up services, if you need to enable additional services on CP4D.

When installing CP4D on productive environments, please review the IBM documentation on securing your environment. Also, the Red Hat documentation on setting up identity providers for ROSA is informative. You can also consider enabling auto scaling for your cluster.

Cleanup

Connect to your bastion host, and run the following steps to delete the CP4D installation, including ROSA. This step avoids incurring future charges on your AWS account.

$ cd ~/cp4d-deployment/managed-openshift/aws/terraform/
$ terraform destroy -var-file="cp4d-rosa-3az-new-vpc.tfvars"

If you’ve experienced any failures during the CP4D installation, run these next steps:

$ cd ~/cp4d-deployment/managed-openshift/aws/terraform
$ sudo cp installer-files/rosa /usr/local/bin
$ sudo chmod 755 /usr/local/bin/rosa
$ Cluster_Name=`rosa list clusters -o yaml | grep -w "name:" | cut -d ':' -f2 | xargs`
$ rosa remove cluster --cluster=${Cluster_Name}
$ rosa logs uninstall -c ${Cluster_Name } –watch
$ rosa init --delete-stack
$ terraform destroy -var-file="cp4d-rosa-3az-new-vpc.tfvars"

Conclusion

In summary, we explored how customers can take advantage of a fully managed OpenShift service on AWS to run IBM CP4D. With this implementation, customers can focus on what is important to them, their workloads, and their customers, and less on managing the day-to-day operations of managing OpenShift to run CP4D.

Check out the IBM Cloud Pak for Data Simplifies and Automates How You Turn Data into Insights blog to learn how to use CP4D on AWS to unlock the value of your data.

Additional resources

Lifting and shifting a web application to AWS Serverless: Part 2

Post Syndicated from Marcia Villalba original https://aws.amazon.com/blogs/compute/lifting-and-shifting-a-web-application-to-aws-serverless-part-2/

In part 1, you learn if it is possible to migrate a non-serverless web application to a serverless environment without changing much code. You learn different tools that can help you in this process, like Lambda Web Adaptor and AWS Amplify. By the end, you have migrated an application into a serverless environment.

However, if you test the migrated app, you find two issues. The first one is that the user session is not sticky. Every time you log in, you are logged out unexpectedly from the application. The second one is that when you create a new product, you cannot upload new images of that product.

This final post analyzes each of the problems in detail and shows solutions. In addition, it analyzes the cost and performance of the solution.

Authentication and authorization migration

The original application handled the authentication and authorization by itself. There is a user directory in the database, with the passwords and emails for each of the users. There are APIs and middleware that take care of validating that the user is logged in before showing the application. All the logic for this is developed inside the Node.js/Express application.

However, with the current migrated application every time you log in, you are logged out unexpectedly from the application. This is because the server code is responsible for handling the authentication and the authorization of the users, and now our server is running in an AWS Lambda function and functions are stateless. This means that there will be one function running per request—a request can load all the products in the landing page, get the details for a product, or log in to the site—and if you do something in one of these functions, the state is not shared across.

To solve this, you must remove the authentication and authorization mechanisms from the function and use a service that can preserve the state across multiple invocations of the functions.

There are many ways to solve this challenge. You can add a layer of authentication and session management with a database like Redis, or build a new microservice that is in charge of authentication and authorization that can handle the state, or use an existing managed service for this.

Because of the migration requirements, we want to keep the cost as low as possible, with the fewest changes to the application. The better solution is to use an existing managed service to handle authentication and authorization.

This demo uses Amazon Cognito, which provides user authentication and authorization to AWS resources in a managed, pay as you go way. One rapid approach is to replace all the server code with calls to Amazon Cognito using the AWS SDK. But this adds complexity that can be replaced completely by just invoking Amazon Cognito APIs from the React application.

Using Cognito

For example, when a new user is registered, the application creates the user in the Amazon Cognito user pool directory, as well as in the application database. But when a user logs in to the web app, the application calls Amazon Cognito API directly from the AWS Amplify application. This way minimizes the amount of code needed.

In the original application, all authenticated server APIs are secured with a middleware that validates that the user is authenticated by providing an access token. With the new setup that doesn’t change, but the token is generated by Amazon Cognito and then it can be validated in the backend.

let auth = (req, res, next) => {
    const token = req.headers.authorization;
    const jwtToken = token.replace('Bearer ', '');

    verifyToken(jwtToken)
        .then((valid) => {
            if (valid) {
                getCognitoUser(jwtToken).then((email) => {
                    User.findByEmail(email, (err, user) => {
                        if (err) throw err;
                        if (!user)
                            return res.json({
                                isAuth: false,
                                error: true,
                            });

                        req.user = user;
                        next();
                    });
                });
            } else {
                throw Error('Not valid Token');
            }
        })
        .catch((error) => {
            return res.json({
                isAuth: false,
                error: true,
            });
        });
};

You can see how this is implemented step by step in this video.

Storage migration

In the original application, when a new product is created, a new image is uploaded to the Node.js/Express server. However, now the application resides in a Lambda function. The code (and files) that are part of that function cannot change, unless the function is redeployed. Consequently, you must separate the user storage from the server code.

For doing this, there are a couple of solutions: using Amazon Elastic File System (EFS) or Amazon S3. EFS is a file storage, and you can use that to have a dynamic storage where you upload the new images. Using EFS won’t change much of the code, as the original implementation is using a directory inside the server as EFS provides. However, using EFS adds more complexity to the application, as functions that use EFS must be inside an Amazon Virtual Private Cloud (Amazon VPC).

Using S3 to upload your images to the application is simpler, as it only requires that an S3 bucket exists. For doing this, you must refactor the application, from uploading the image to the application API to use the AWS Amplify library that uploads and gets images from S3.

export function uploadImage(file) {
    const fileName = `uploads/${file.name}`;

    const request = Storage.put(fileName, file).then((result) => {
        return {
            image: fileName,
            success: true,
        };
    });

    return {
        type: IMAGE_UPLOAD,
        payload: request,
    };
}

An important benefit of using S3 is that you can also use Amazon CloudFront to accelerate the retrieval of the images from the cloud. In this way, you can speed up the loading time of your page. You can see how this is implemented step by step in this video.

How much does this application cost?

If you deploy this application in an empty AWS account, most of the usage of this application is covered by the AWS Free Tier. Serverless services, like Lambda and Amazon Cognito, have a forever free tier that gives you the benefits in pricing for the lifetime of hosting the application.

  • AWS Lambda—With 100 requests per hour, an average 10ms invocation and 1GB of memory configured, it costs 0 USD per month.
  • Amazon S3—Using S3 standard, hosting 1 GB per month and 10k PUT and GET requests per month costs 0.07 USD per month. This can be optimized using S3 Intelligent-Tiering.
  • Amazon Cognito—Provides 50,000 monthly active users for free.
  • AWS Amplify—If you build your client application once a week, serve 3 GB and store 1 GB per month, this costs 0.87 USD.
  • AWS Secrets Manager—There are two secrets stored using Secrets Manager and this costs 1.16 USD per month. This can be optimized by using AWS System Manager Parameter Store and AWS Key Management Service (AWS KMS).
  • MongoDB Atlas – Forever free shared cluster.

The total monthly cost of this application is approximately 2.11 USD.

Performance analysis

After you migrate the application, you can run a page speed insight tool, to measure this application’s performance. This tool provides results mostly about the front end and the experience that the user perceives. The results are displayed in the following image. The performance of this website is good, according to the insight tool performance score – it responds quickly and the user experience is good.

Page speed insight tool results

After the application is migrated to a serverless environment, you can do some refactoring to improve further the overall performance. One alternative is whenever a new image is uploaded, it gets resized and formatted into the correct next-gen format automatically using the event driven capabilities that S3 provides. Another alternative is to use Lambda on Edge to serve the right image size for the device, as it is possible to format the images on the fly when serving them from a distribution.

You can run load tests for understanding how your backend and database will perform. For this, you can use Artillery, an open-source library that allows you to run load tests. You can run tests with the expected maximum load your site will get and ensure that your site can handle it.

For example, you can configure a test that sends 30 requests per seconds to see how your application reacts:

config:
  target: 'https://xxx.lambda-url.eu-west-1.on.aws'
  phases:
    - duration: 240
      arrivalRate: 30
      name: Testing
scenarios:
  - name: 'Test main page'
    flow:
      - post:
          url: '/api/product/getProducts/'

This test is performed on the backend APIs, not only testing your backend but also your integration with the MongoDB. After running it, you can see how the Lambda function performs on the Amazon CloudWatch dashboard.

Running this load test helps you understand the limitations of your system. For example, if you run a test with too many concurrent users, you might see that the number of throttles in your function increases. This means that you need to lift the limit of invocations of the functions you can have at the same time.

Or when increasing the requests per second, you may find that the MongoDB cluster starts throttling your requests. This is because you are using the free tier and that has a set number of connections. You might need a larger cluster or to migrate your database to another service that provides a large free tier, like Amazon DynamoDB.

Cloudwatch dashboard

Conclusion

In this two-part article, you learn if it is possible to migrate a non-serverless web application to a serverless environment without changing much code. You learn different tools that can help you in this process, like AWS Lambda Web Adaptor and AWS Amplify, and how to solve some of the typical challenges that we have, like storage and authentication.

After the application is hosted in a fully serverless environment, it can scale up and down to meet your needs. This web application is also performant once the backend is hosted in a Lambda function.

If you need, from here you can start using the strangler pattern to refactor the application to take advantage of the benefits of event-driven architecture.

To see all the steps of the migration, there is a playlist that contains all the tutorials for you to follow.

For more serverless learning resources, visit Serverless Land.

Lifting and shifting a web application to AWS Serverless: Part 1

Post Syndicated from Marcia Villalba original https://aws.amazon.com/blogs/compute/lifting-and-shifting-a-web-application-to-aws-serverless-part-1/

Customers migrating to the cloud often want to get the benefits of serverless architecture. But what is the best approach and is it possible? There are many strategies to do a migration, but lift and shift is often the fastest way to get to production with the migrated workload.

You might also wonder if it’s possible to lift and shift an existing application that runs in a traditional environment to serverless. This blog post shows how to do this for a Mongo, Express, React, and Node.js (MERN) stack web app. However, the discussions presented in this post apply to other stacks too.

Why do a lift and shift migration?

Lift and shift, or sometimes referred to as rehosting the application, is moving the application with as few changes as possible. Lift and shift migrations often allow you to get the new workload in production as fast as possible. When migrating to serverless, lift and shift can bring a workload that is not yet in the cloud or in a serverless environment to use managed and serverless services quickly.

Migrating a non-serverless workload to serverless with lift and shift might not bring all the serverless benefits right away, but it enables the development team to refactor, using the strangler pattern, the parts of the application that might benefit from what serverless technologies offer.

Why migrate a web app to serverless?

Web apps hosted in a serverless environment benefit most from the capability of serverless applications to scale automatically and for paying for what you use.

Imagine that you have a personal web app with little traffic. If you are hosting in a serverless environment, you don’t pay a fixed price to have the servers up and running. Your web app has only a few requests and the rest of the time is idle.

This benefit applies to the opposite case. For an owner of a small ecommerce site running on a server, imagine if a social media influencer with millions of followers recommends one of their products. Suddenly, thousands of requests arrive and make the site unavailable. If the site is hosted on a serverless platform, the application will scale to the traffic that it receives.

Requirements for migration

Before starting a migration, it is important to define the nonfunctional requirements that you need the new application to have. These requirements help when you must make architectural decisions during the migration process.
These are the nonfunctional requirements of this migration:

  • Environment that scales to zero and scales up automatically.
  • Pay as little as possible for idle time.
  • Configure as little infrastructure as possible.
  • Automatic high availability of the application.
  • Minimal changes to the original code.

Application overview

This blog post guides you on how to migrate a MERN application. The original application is hosted in two different servers: One contains the Mongo database and another contains the Node/js/Express and ReactJS applications.

Application overview

This demo application simulates a swag ecommerce site. The database layer stores the products, users, and the purchases history. The server layer takes care of the ecommerce business logic, hosting the product images, and user authentication and authorization. The web layer takes care of all the user interaction and communicates with the server layer using REST APIs.

How the application looks like

These are the changes that you must make to migrate to a serverless environment:

  • Database migration: Migrate the database from on-premises to MongoDB Atlas.
  • Backend migration: Migrate the NodeJS/Express application from on-premises to an AWS Lambda function.
  • Web app migration: Migrate the React web app from on-premises to AWS Amplify.
  • Authentication migration: Migrate the custom-built authentication to use Amazon Cognito.
  • Storage migration: Migrate the local storage of images to use Amazon S3 and Amazon CloudFront.

The following image shows the proposed solution for the migrated application:

Proposed architecture

Database migration

The database is already in a MongoDB vanilla container that has all the data for this application. As MongoDB is the database engine for our stack, their recommended solution to migrate to serverless is to use MongoDB Atlas. Atlas provides a database cluster in the cloud that scales automatically and you pay for what you use.

To get started, create a new Atlas cluster, then migrate the data from the existing database to the serverless one. To migrate the data, you can first dump all the content of the database to a dump folder and then restore it to the cloud:

mongodump --uri="mongodb://<localuser>:<localpassword>@localhost:27017"

mongorestore --uri="mongodb+srv://<user>:<password>@<clustername>.debkm.mongodb.net" .

After doing that, your data is now in the cloud. The next step is to change the configuration string in the server to point to the new database. To see this in action, check this video that shows a walkthrough of the migration.

Backend migration

Migrating the Node.js/Express backend is the most challenging of the layers to migrate to a serverless environment, as the server layer is a Node.js application that runs in a server.

One option for this migration is to use AWS Fargate. Fargate is a serverless container service that allows you to scale automatically and you pay as you go. Another option is to use AWS AppRunner, a container service that auto scales and you also pay as you go. However, neither of these options align with our migration requirements, as they don’t scale to zero.

Another option for the lift and shift migration of this Node.js application is to use Lambda with the AWS Lambda Web Adapter. The AWS Lambda Web Adapter is an open-source project that allows you to build web applications with familiar frameworks, like Express.js, Flask, SpringBoot, and run it on Lambda. You can learn more about this project in its GitHub repository.

Lambda Web Adapter

Using this project, you can create a new Lambda function that has the Express/NodeJS application as the function code. You can lift and shift all the code into the function. If you want a step-by-step tutorial on how to do this, check out this video.

const lambdaAdapterFunction = new Function(this,`${props.stage}-LambdaAdapterFunction`,
            {
                runtime: Runtime.NODEJS_16_X,
                code: Code.fromAsset('backend-app'),
                handler: 'run.sh',
                environment: {
                    AWS_LAMBDA_EXEC_WRAPPER: '/opt/bootstrap',
                    REGION: this.region,
                    ASYNC_INIT: 'true',
                },
                memorySize: 1024,
                layers: [layerLambdaAdapter],
                timeout: Duration.seconds(2),
                tracing: Tracing.ACTIVE,
            }
        );

The next step is to create an HTTP endpoint for the server application. There are three options for doing this: API Gateway, Application Load Balancer (ALB) , or to use Lambda Function URLs. All the options are compatible with Lambda Web Adapter and can solve the challenge for you.

For this demo, choose function URLs, as they are simple to configure and one function URL forwards all routes to the Express server. API Gateway and ALB require more configuration and have separate costs, while the cost of function URLs is included in the Lambda function.

Web app migration

The final layer to migrate is the React application. The best way to migrate the web layer and to adhere to the migration requirements is to use AWS Amplify to host it. AWS Amplify is a fully managed service that provides many features like hosting web applications and managing the CICD process for the web app. It provides client libraries to connect to different AWS resources, and many other features.

Migrating the React application is as simple as creating a new Amplify application in your AWS account and uploading the React application to a code repository like GitHub. This AWS Amplify application is connected to a GitHub branch, and when there is a new commit in this branch, AWS Amplify redeploys the code.

The Amplify application receives configuration parameters like the function URL endpoint (the server URL) using environmental variables.

const amplifyApp = new App(this, `${props.stage}-AmplifyReactShopApp`, {
            sourceCodeProvider: new GitHubSourceCodeProvider({
                owner: config.frontend.owner,
                repository: config.frontend.repository_name,
                oauthToken: SecretValue.secretsManager('github-token'),
            }),
            environmentVariables: {
                REGION: this.region,
                SERVER_URL: props.serverURL,
            },
        });

If you want to see a step-by-step guide on how to make your web layer serverless, you can check this video.

Next steps

However, if you test this migrated app, you will find two issues. The first one is that the user session is not sticky. Every time you log in, you are logged out unexpectedly from the application. The second one is that when you create a new product, you cannot upload new images of that product.

In part two, I analyze each of the problems in detail and find solutions. These issues arise because of the stateless and immutable characteristics of this solution. The next part of this article explains how to solve these issues, also it analyzes costs and performance of the solution.

Conclusion

In this article, you learn if it is possible to migrate a non-serverless web application to a serverless environment without changing much code. You learn different tools that can help you in this process, like the AWS Lambda Web Adaptor and AWS Amplify.

If you want to see the migration in action and learn all the steps for this, there is a playlist that contains all the tutorials for you to follow and learn how this is possible.

For more serverless learning resources, visit Serverless Land.

The collective thoughts of the interwebz