How ZS created a multi-tenant self-service data orchestration platform using Amazon MWAA

Post Syndicated from Manish Mehra original https://aws.amazon.com/blogs/big-data/how-zs-created-a-multi-tenant-self-service-data-orchestration-platform-using-amazon-mwaa/

This is post is co-authored by Manish Mehra, Anirudh Vohra, Sidrah Sayyad, and Abhishek I S (from ZS), and Parnab Basak (from AWS). The team at ZS collaborated closely with AWS to build a modern, cloud-native data orchestration platform.

ZS is a management consulting and technology firm focused on transforming global healthcare and beyond. We leverage our leading-edge analytics, plus the power of data, science, and products, to help our clients make more intelligent decisions, deliver innovative solutions, and improve outcomes for all. Founded in 1983, ZS has more than 12,000 employees in 35 offices worldwide.

ZAIDYNTM by ZS is an intelligent, cloud-native platform that helps life sciences organizations shape the future. Its analytics, algorithms, and workflows empower people, transform processes, and unlock real value. Designed to learn and grow with our clients, the platform is modular, future-ready, and fueled by global connectivity. And as more people engage, share, and build, our platform gets smarter—helping organizations fuel discovery, connect with customers, deliver treatments, and improve lives. ZAIDYN is helping companies of all sizes gain fluency in the full spectrum of life sciences so they can move faster, together through its Data & Analytics, Customer Engagement, Field Performance and Clinical Development offerings.

ZAIDYN Data & Analytics apps provide business users with self-service tools to innovate and scale insights delivery across the enterprise. ZAIDYN Data Hub (a part of the Data & Analytics product category) provides self-service options for guided workflows, data connectors, quality checks, and more. The elastic data processing offered by AWS helps prioritize processing speeds.

Data Hub customers wanted a one-stop solution for managing their data pipelines. A solution that does not require end users to gain additional knowledge about the nitty-gritties of the tool, one which is easy for users to get onboarded on, thereby increasing the demand for data orchestration capabilities within the application. A few of the sophisticated asks like start and stop of workflows, maintaining history of past runs, and providing real-time status updates for individual tasks of the workflow became increasingly important for end clients. We needed a mature orchestration tool, which led us to Amazon Managed Workflows for Apache Airflow (Amazon MWAA).

Amazon MWAA is a managed orchestration service for Apache Airflow that makes it easier to set up and operate end-to-end data pipelines in the cloud at scale.

In this post, we share how ZS created a multi-tenant self-service data orchestration platform using Amazon MWAA.

Why we chose Amazon MWAA

Choosing the right orchestration tool was critical for us because we had to ensure that the service was operationally efficient and cost-effective, provided high availability, had extensive features to support our business cases, and yet was easy to adapt for our end-users (data engineers). We evaluated and experimented among Amazon MWAA, Azkaban on Amazon EMR, and AWS Step Functions before project initiation.

The following benefits of Amazon MWAA convinced us to adopt it:

  • AWS managed service – With Amazon MWAA, we don’t have to manage the underlying infrastructure for scalability and availability to maintain quality of service. The built-in autoscaling mechanism of Amazon MWAA automatically increases the number of Apache Airflow workers in response to running and queued tasks, and disposes of extra workers when there are no more tasks queued or running. The default environment is already built for high availability with multiple Airflow schedulers and workers, and the metadata database distributed across multiple Availability Zones. We also evaluated hosting open-source Airflow on our ZS infrastructure. However, due to infrastructure maintenance overhead and the high investment needed to make and maintain it at production grade, we decided to drop that option.
  • Security – With Amazon MWAA, our data is secure by default because workloads run in our own isolated and secure cloud environment using Amazon Virtual Private Cloud (Amazon VPC), and data is automatically encrypted using AWS Key Management Service (AWS KMS). We can control role-based authentication and authorization for Apache Airflow’s user interface via AWS Identity and Access Management (IAM), providing users single sign-on (SSO) access for scheduling and viewing workflow runs.
  • Compatibility and active community support – Amazon MWAA hosts the same open-source Apache Airflow version without any forks. The open-source community for Apache Airflow is very active with multiple commits, files changes, issue resolutions, and community advice.
  • Language and connector support – The flow definitions for Apache Airflow are based on Python, which is easy for our engineers to adapt. An extensive list of features and connectors is available out of the box in Amazon MWAA, including connectors for Hive, Amazon EMR, Livy, and Kubernetes. We needed to run all our Data Hub jobs (ingestion, applying custom rules and quality checks, or exporting data to third-party systems) on Amazon EMR. The necessary Amazon EMR operators are already available as a part of the Amazon-provided package for Airflow (apache-airflow-providers-amazon), which we could supplement rather than construct one from the ground up.
  • Cost – Cost was the most important aspect for us when adopting Amazon MWAA. Amazon MWAA is useful for those who are running thousands of tasks in the prod environment, which is why we decided to the make the Amazon MWAA environment multi-tenant such that the cost can be shared among clients. With our large Amazon MWAA environment, we only pay for what we use, with no minimum fees or upfront commitments. We estimated paying less than $1,000 per month, combined for our environment usage and additional worker instance pricing, yet achieve the scale of being able to run 200 concurrent tasks running 3 hours per day over 10 concurrent workers. This meant reduced operational costs and engineering overhead while meeting the on-demand monitoring needs of end-to-end data pipeline orchestration.

Solution overview

The following diagram illustrates the solution architecture.
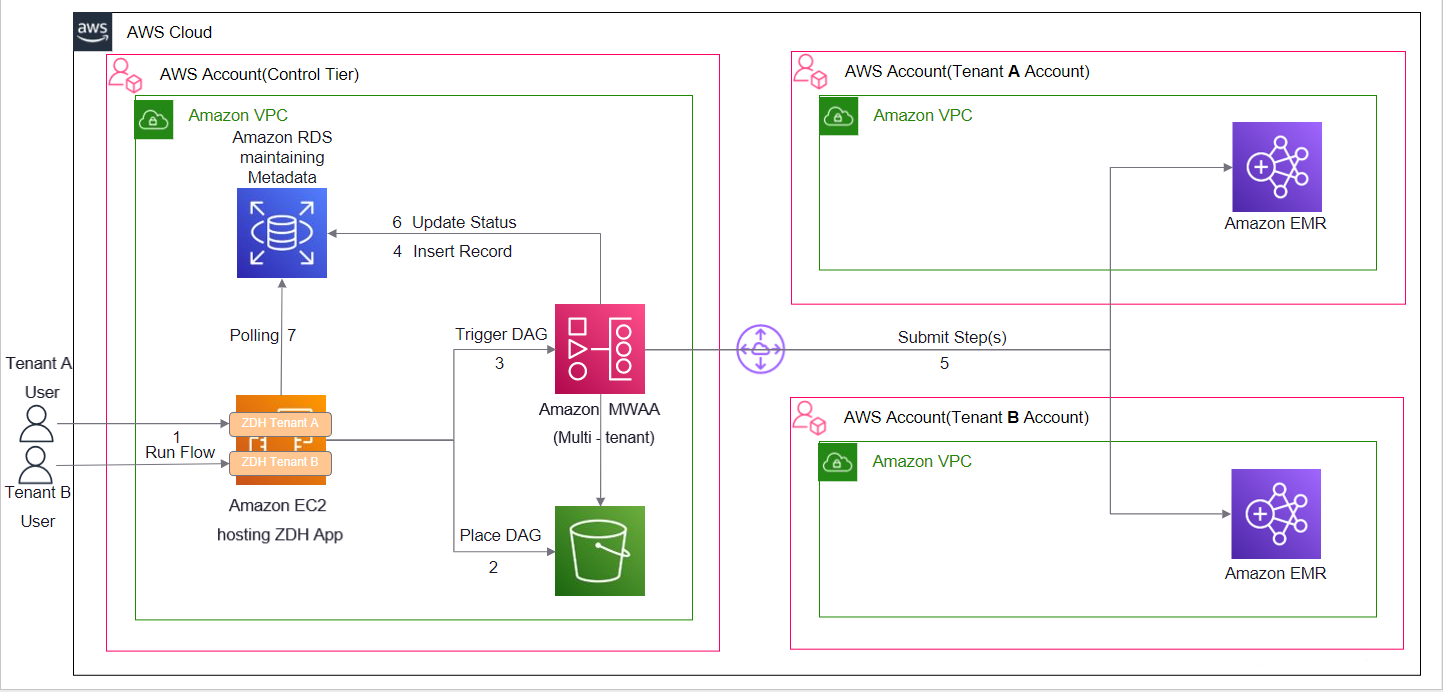
We have a common control tier account where we host our software as a service application (Data Hub) on Amazon Elastic Compute Cloud (Amazon EC2) instances. Each client has their own version of this application deployed on this shared infrastructure. Amazon MWAA is also hosted in the same common control tier account. The control tier account has connectivity with tenant-specific AWS accounts. This is to maintain strong physical isolation of client data by segregating the AWS accounts for each client. Each client-specific account hosts EMR clusters where data processing takes place. When a processing job is complete, data may reside on Amazon EMR (an HDFS cluster) or on Amazon Simple Storage Service (Amazon S3), an EMRFS cluster, depending on configuration. The DAG files generated by our Data Hub application contain metadata of the processes, and don’t contain any sensitive client information. When a job is submitted from Data Hub, the API request contains tenant-specific information needed to pull up the corresponding AWS connection details, which are stored as Airflow connection objects. These connection details are consumed by our custom implementation of Airflow EMR step operators (add and watch) to perform operations on the tenant EMR clusters.

Because the data orchestration capability is an application offering, the client teams create their processes on the Data Hub UI and don’t have access to the underlying Amazon MWAA environment.

The following screenshot shows how an end-user can configure Data Hub process on the application UI.

How Data Hub processes map to Amazon MWAA DAGs

Data Hub processes map to Amazon MWAA DAGs as follows:

  • Each process in Data Hub corresponds to a DAG in Amazon MWAA, and each component is a task (denoted by Sn​) that is submitted as a step on the client EMR clusters.
  • The application generates the DAG file dynamically and updates it on the S3 bucket linked to the Amazon MWAA environment.
  • Parsing dedicated structures representing a given process and submitting or tracking the Amazon EMR steps is abstracted from the end-user. Dynamic DAG generation is responsible for using the latest version of the underlying components and helps in managing the DAG schedule.
  • Some Airflow tasks are created as a part of the DAG, which take care of interacting with the application APIs to ensure that the required metadata is captured in a separate Amazon Relational Database Service (Amazon RDS) database instance.

A user can trigger a given process to run from the Data Hub UI or can schedule it to run at a specified time. Because a single Amazon MWAA environment is responsible for the data orchestration needs of multiple clients, our DAG decode logic ensures that the correct EMR cluster ID and Airflow connection ID are picked up at runtime. The configs responsible for storing these details are placed and updated on the S3 buckets via an automated deployment pipeline. A dedicated connection ID is created per client in Airflow, which is then utilized in our custom implementation of EmrAddStepsOperator. The connection ID captures the Region and role ARN to be assumed to interact with the EMR cluster in the client account. These cross-account roles have access to limited resources in each client account, following the principle of least privilege.

Generating a DAG from a process defined on Data Hub UI

Our front-end application is built using Angular (version 11) and uses a third-party library that facilitates drag-and-drop of components from the left pane on a canvas. Components are stitched together with connections defining dependencies to form a process. This process is translated by our custom engine to generate a dynamic Airflow DAG. A sample DAG generated from the preceding example process defined on the UI looks like the following figure.
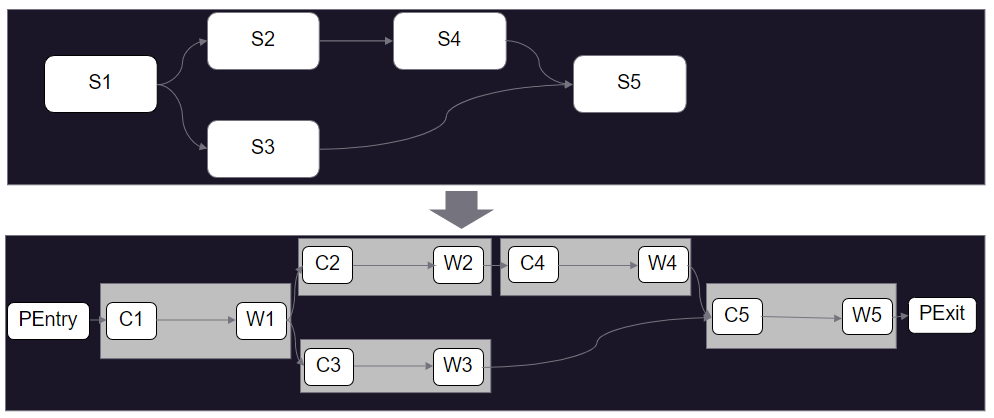
We wrap the DAG by PEntry and PExit Python operators, and for each of the components on the Data Hub UI, we create two tasks: Cn and Wn.

The relevant terms for this solution are as follows:

  • PEntry​ – The Python operator used to insert an entry in the RDS database that the process run has started via API call.​
  • Cn​ – The ZS custom implementation of EMRAddStepsOperator used to submit a job (Data Hub component) on a running EMR cluster.​ This is followed by an API call to insert an entry in the database that the component job has started.​
  • Wn​ – The custom implementation of Airflow Watcher (EmrStepSensor), which checks the status of the step from our metadata database.​
  • PExit​ – The Python operator used to update an entry in the RDS database (more of a finally block) via API call.​

Lessons learned during the implementation

When implementing this solution, we learned the following:

  • We faced challenges in being able to consistently predict when a DAG will be parsed and made available in the Airflow UI in Amazon MWAA after the DAG file is synced to the linked S3 bucket. Depending on how complex the DAG is, it could happen within seconds or several minutes. Due to the lack of availability of an API or AWS Command Line Interface (AWS CLI) command to ascertain this, we put in some blanket restrictions (delay) on user operations from our UI to overcome this limitation.
  • Within Airflow, data pipelines are represented by DAGs, and these DAGs change over time as business needs evolve. A key challenge faced by Airflow users is looking at how a DAG was run in the past, and when it was replaced by a newer version of the DAG. This is because within Airflow (as of this writing), only the current (latest) version of the DAG is represented within the user interface, without any reference to prior versions of the DAG. To overcome this limitation, we implemented a backend way of generating a DAG from the available metadata, and use it to version control over runs.
  • Airflow CLI commands when invoked in DAGs always return an HTTP 200 response. You can’t solely rely on the HTTP response code to ascertain the status of commands. We applied additional parsing logic (particularly to analyze the errors on failure) to determine the true status of commands.
  • Airflow doesn’t have a command to gracefully stop a DAG that is currently running. You can stop a DAG (unmark as running) and clear the task’s state or even delete it in the UI. The actual running tasks in the executor won’t stop, but might be stopped if the executor realizes that it’s not in the database anymore.

Conclusion

Amazon MWAA sets up Apache Airflow for you using the same Apache Airflow user interface and open-source code. With Amazon MWAA, you can use Airflow and Python to create workflows without having to manage the underlying infrastructure for scalability, availability, and security. Amazon MWAA automatically scales its workflow run capacity to meet your needs, and is integrated with AWS security services to help provide you with fast and secure access to your data. In this post, we discussed how you can build a bridge tenancy isolation model with a central Amazon MWAA orchestrating task against independent infrastructure stacks in dedicated accounts deployed for each of your tenants. Through a custom UI, you can enable self-service workflow runs via Airflow dynamic DAGs using the power and flexibility of Python. This enables you to achieve economies of scale and operational efficiency while meeting your regulatory, security, and cost considerations.


About the Authors

Manish Mehra is a Software Architect, working with the SD group in ZS. He has more than 11 years of experience working in banking, gaming, and life science domains. He is currently looking into the architecture of the Data & Analytics product category of the ZAIDYN Platform. He has expertise in full-stack application development and building robust, scalable, enterprise-grade big data applications.

Anirudh Vohra is a Director of Cloud Architecture, working within the Cloud Center of Excellence space at ZS. He is passionate about being a developer advocate for internal engineering teams, also designing and building cloud platforms and abstractions to empower developers and troubleshoot complex systems.

Abhishek I S is Associate Cloud Architect at ZS Associates working within the Cloud Centre of Excellence space. He has diverse experience ranging from application development to cloud engineering. Currently, he is primarily focusing on architecture design and automation for the cloud-native solutions of various ZS products.

Sidrah Sayyad is an Associate Software Architect at ZS working within the Software Development (SD) group. She has 9 years of experience, which includes working on identity management, infrastructure management, and ETL applications. She is passionate about coding and helps architect and build applications to achieve business outcomes.

Parnab Basak is a Solutions Architect and a Serverless Specialist at AWS. He specializes in creating new solutions that are cloud native using modern software development practices like serverless, DevOps, and analytics. Parnab was closely involved with the engagement with ZS, providing architectural guidance as well as helping the team overcome technical challenges during the implementation.

How we tripled max concurrent jobs to boost performance of GitHub Actions

Post Syndicated from Aiqiao Yan original https://github.blog/2022-09-16-how-we-tripled-max-concurrent-jobs-to-boost-performance-of-github-actions/

GitHub Actions became generally available on GitHub Enterprise Server (GHES) with the 3.0 release about two years ago. Since then, we’ve made many performance improvements to the product that reduced GitHub Actions CPU consumption on the server and allowed us to run more GitHub Actions jobs concurrently. By the numbers, on 96-core machines, the max concurrent jobs went from 2,200 on GHES 3.2 to 7,000 on GHES 3.6 (the current release) a 3x performance improvement.

Here are some of the more interesting improvements we made to reach that mark and the lessons we learned along the way.

Fix 1: Just making sure caches are working

One fine day, we realized our hottest code path that we use to access workflow secrets and callback URLs wasn’t using a cache, though we assumed it was. This was a surprise to our team since we have extensive monitors for every new cache we add to the product, but this specific cache is something we thought we enabled years ago. Issues like this are hard to catch. We only caught this by analyzing the profile traces collected during load testing and in production. After one simple change to enable the cache, CPU usage went down fast, which translated to faster workflow execution and an increase in throughput. As it turns out, sometimes you don’t have to dig too deep in order to discover a big performance win.

Fix 2: Improving the orchestration framework

How it used to work

“Orchestration” is what GitHub Actions uses to run workflows. On a high level, it’s a durable state machine that makes workflow runs resilient to machine shutdowns and intermittent failures. To achieve durability, every time the orchestrator wakes up, it replays execution from the beginning to rebuild local state until either the code is finished or it encounters new work.

We store orchestration state in a database table. The issue we had is that we were saving the state in a single column in the database as one big blob of events.

CREATE TABLE tbl_OrchestrationSession (
   SessionId           BIGINT              NOT NULL,
   CreatedOn           DATETIME            NOT NULL DEFAULT GETUTCDATE(),
   LastUpdatedOn       DATETIME            NOT NULL DEFAULT GETUTCDATE(),
   ...
   State               VARBINARY(MAX)      NULL, -- this is where we store execution state
)

When updating the state for a running orchestration, we would read the whole blob into memory, append the new events to the end, and write it back to the database. We had unnecessary overhead in that we would delete a growing blob and then have to commit a slightly bigger (but almost exactly the same) value over and over when saving state. We had to read and deserialize a big blob every time when replaying the state.

What we did instead

We adopted a new version of orchestration that supports both incremental reads and incremental writes to the database. The state history is now in its own table instead of an inline binary blob. Now when we update the orchestration state, only the new events will be written. It also allows us to do interesting things, like caching where we can skip getting all historic events, and just fetch pending events from the database. With this, the overhead of replay is avoided, which means long‐ running orchestrations from workflows with more steps are less of a concern.

-- new table to store execution state
CREATE TABLE tbl_OrchestrationSessionEvent (
   ...
   SessionId       BIGINT          NOT NULL,
   EventId         BINARY(20)      NOT NULL,
   EventData       VARBINARY(MAX)  NOT NULL
)

Impact

On GitHub.com, we saw CPU consumption for running orchestrations reduced by 50% on average, with longer-running orchestrations seeing a larger benefit. We hadn’t made much investment in the orchestration platform we depend on before making this change. The result from the change showed the importance of constantly reevaluating our approaches and underlying platforms as we grow and evolve.

Fix 3: Reducing postback load

What is a postback

As a workflow run progresses, you can see the updates as checks in the UI and API. The state of a run is kept by the GitHub Actions backend service (in orchestration), but the checks for a run are kept in the Rails monolith. Simply put, a “postback” is the service-to-service call that pushes the latest run state to checks. Postbacks are generated as the orchestrator executes a workflow run. The backend maintains an internal queue of postbacks to send to the frontend using a separate orchestration per workflow run so they are reliable and won’t get interrupted by service downtime.

Visualization of a postback

During load testing, we found that delivering a postback is consistently one of the slower activities, averaging around 250-300ms to execute. We also discovered that the backend sends one postback for every check step update and three postbacks with almost exactly the same payload whenever a check run completes. A large amount of slow postbacks consumes a lot of system resources and can stall execution of other activities, causing overall slowness. This was especially concerning for large matrix scenarios.

What we did instead

We evaluated the usefulness of every postback the backend sends. We found that check step statuses are only displayed on one specific UI. We decided to stop sending them during the workflow run and post step data only upon completion of the run. Not having step data available for in-progress runs meant that the initial navigation speed for an in-progress run could be slower than that of a completed run due to client side rendering overhead, but those are tradeoffs we were willing to make. Of course, we also removed the duplicated job completed events. Both of these changes shipped with GHES 3.3 that allowed GitHub Actions to run close to 2x more jobs concurrently than GHES 3.2.

As for slowness of each individual postback call, they are slow because postbacks were being sent via HTTP calls across four different services with each service manually handling retries, timeouts, etc. We are actively working on switching postback delivery to a faster and simpler system using a message queue. The goal is to roll out the change in the next few months, hopefully increasing performance further.

In conclusion

Of course, there are other improvements we made that didn’t make it to this post (it’s long enough already). In the end, GitHub Actions can now run three times more jobs concurrently while using less system resources. And while work like this is satisfying to us as engineers—3x is a big improvement!—we also know that this has real-world impact on our customers who rely on GitHub Actions to get their work done and deliver code into production. We learned that it’s always worthwhile to revisit fundamentals on longstanding projects, especially as they scale. Going forward, we’re looking to continue improving our load testing automation to catch issues like the ones mentioned above before they become problems and to continue optimizing performance across the GitHub platform.

Massive Data Breach at Uber

Post Syndicated from Bruce Schneier original https://www.schneier.com/blog/archives/2022/09/massive-data-breach-at-uber.html

It’s big:

The breach appeared to have compromised many of Uber’s internal systems, and a person claiming responsibility for the hack sent images of email, cloud storage and code repositories to cybersecurity researchers and The New York Times.

“They pretty much have full access to Uber,” said Sam Curry, a security engineer at Yuga Labs who corresponded with the person who claimed to be responsible for the breach. “This is a total compromise, from what it looks like.”

It looks like a pretty basic phishing attack; someone gave the hacker their login credentials. And because Uber has lousy internal security, lots of people have access to everything. So once a hacker gains a foothold, they have access to everything.

This is the same thing that Mudge accuses Twitter of: too many employees have broad access within the company’s network.

More details. Slashdot thread.

EDITED TO ADD (9/20): More details.

Author Spotlight: Lewis Tang, Senior Partner Solution Architect in Transformation and Modernization

Post Syndicated from Elise Chahine original https://aws.amazon.com/blogs/architecture/author-spotlight-lewis-tang-senior-partner-solution-architect-in-transformation-and-modernization/

The Author Spotlight series pulls back the curtain on some of AWS’s most prolific authors. Read on to find out more about our very own Lewis Tang’s journey, in his own words!


I have been a Senior Partner Solution Architect since joining Amazon Web Services (AWS) in 2019. What I really enjoy about this role is helping AWS partners build successful businesses with AWS services. Not only does this satisfy the customer need, but it clearly demonstrates what we at Amazon use to drive every decision: customer obsession! At AWS, we are encouraged to pick an area of expertise and dive deep into it. I am passionate about helping AWS customers and partners to plan and drive transformation through cloud adoption: transformation and modernization are my areas of expertise!

Whether it’s an AWS service partner in consulting business or an AWS ISV partner offering software services, building products and winning customer mindshare can be very challenging. To Amazonians, every day is Day 1. Learning with partners about these challenges and collaborating on solving problems are big parts of my daily Day 1.

Prior to joining AWS, I was a transformation architect for close to a decade. I travelled to work with customers throughout Australia, New Zealand, and the ASEAN region on their cloud transformation strategy, cloud governance and management, and to build their cloud foundational capabilities. Learning with customers face-to-face, diving deep into the industry problems, and helping them invent and simplify their business practices taught me how to leverage the power of cloud technology to deliver results. These experiences made me want to pursue this with AWS.

Now, I collaborate with partners at AWS, working backwards from their target business outcomes to identify and implement the solutions that will boost their success rates. I also provide guidance on adopting wide range of AWS services to develop an offering that can scale and solve specific problems in an efficient and cost-effective manner.

Many folks know about the AWS 7Rs migration strategy. What you may not know is I am an enthusiastic practitioner of Replatform and Refactor/Re-architect to modernize business applications. To promote and scale the adoption of modernization best practices, I work with other subject-matter experts in the Application Modernization Technical Field Community to develop thought leadership content and publish whitepapers, blogs, and prescriptive guidance (I share my favorites a little later).

I have recently created a Back to Basics video, which explores multiple patterns of running Microsoft SQL data service on AWS and the automation that these options provide, allowing you to refocus on business innovation.

At events like AWS Global Summits or AWS re:Invent, I receive feedback on these publications and answer questions about application modernization. With partners who are present at these congresses, I am able to provide guidance on building and modernizing their applications with AWS services.

In my role with AWS, I am educated and rewarded daily: I learn a lot from my AWS partners when working with them to integrate AWS services into their intellectual property solutions and tool chains, which helps to accelerate AWS customer application modernization journey. Throughout these experiences, I became a SME of modernization. It’s educational and fulfilling to help builders, customers, and partners solve their most difficult problems.

Lewis’s favorite posts!

What to consider when migrating data warehouse to Amazon Redshift

My very first blog at AWS! Many customers are looking to modernize data warehouses by migrating to Amazon Redshift because their existing data warehouse is not built for today’s data analytics needs (like data types, volume, and velocity).

A data warehouse migration project can be challenging. This post helps you secure a successful delivery of a data warehouse migration project by discussing data warehouse migration strategies and the adoption of an optimal migration process for a presented use case and the best practices of AWS migration tools, such as AWS Schema Conversion Tool.

What to consider when migrating data warehouse to Amazon Redshift

Running hybrid Active Directory service with AWS Managed Microsoft Active Directory

When migrating and modernizing application with AWS, customers often need to have applications on AWS to work with other applications located outside of AWS, such as an on-premise data center. Many of these applications use Microsoft Active Directory (AD) service for authentication, configuration, and management.

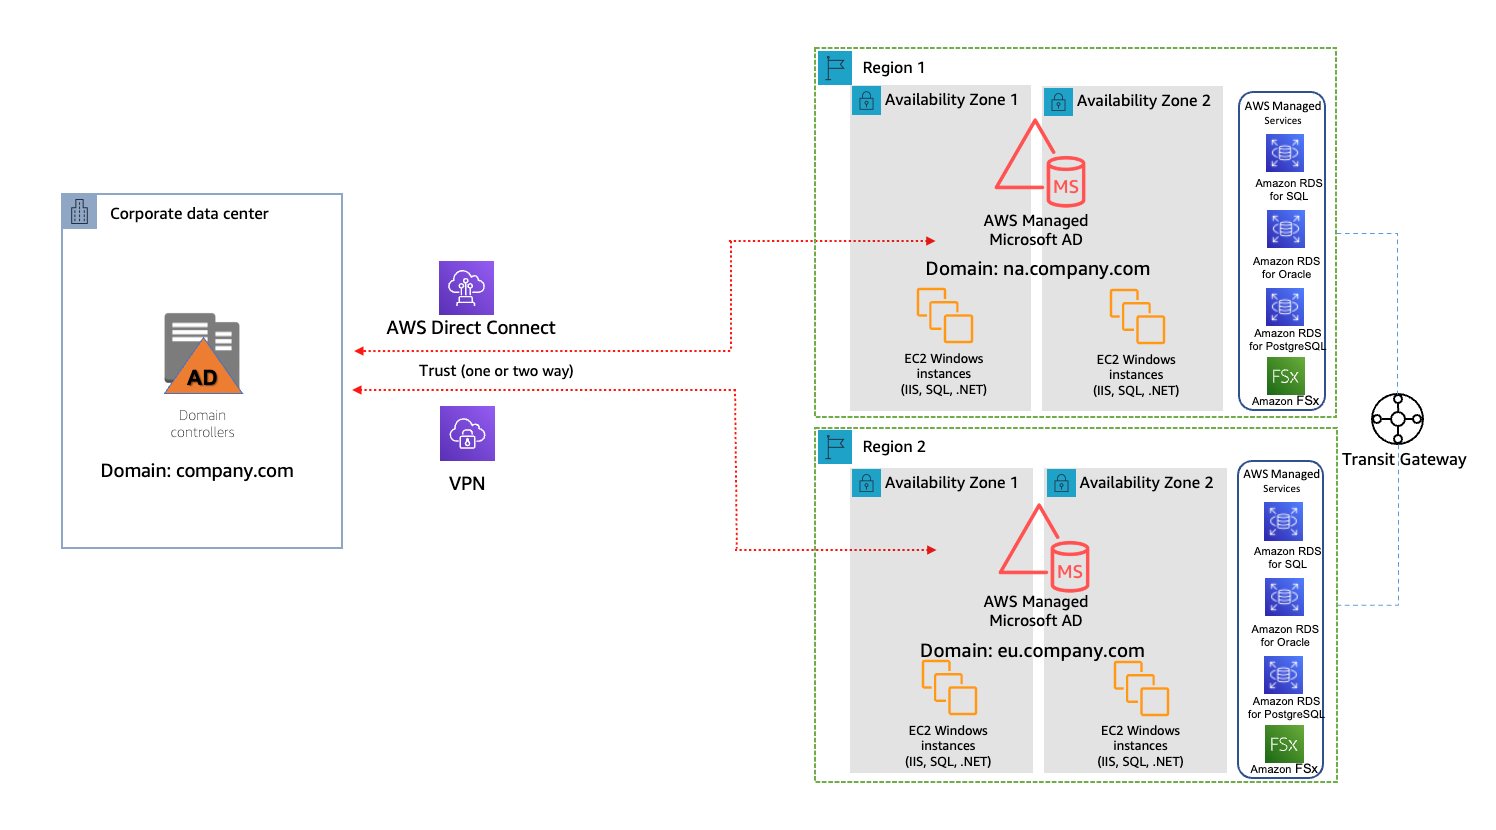
In this post, I discuss the benefits of using AWS Managed Microsoft Active Directory service and the design patterns of a hybrid AD service using AWS Managed Microsoft AD.

A single AWS account and multi-region model

Considerations for modernizing Microsoft SQL database service with high availability on AWS

Microsoft SQL database is a common relational database service. AWS customers often lift-and-shift a Microsoft SQL database to AWS, and they seek guidance on how to architect high-availability database service on Amazon Elastic Compute Cloud (Amazon EC2) in single or multiple AWS region scenario.

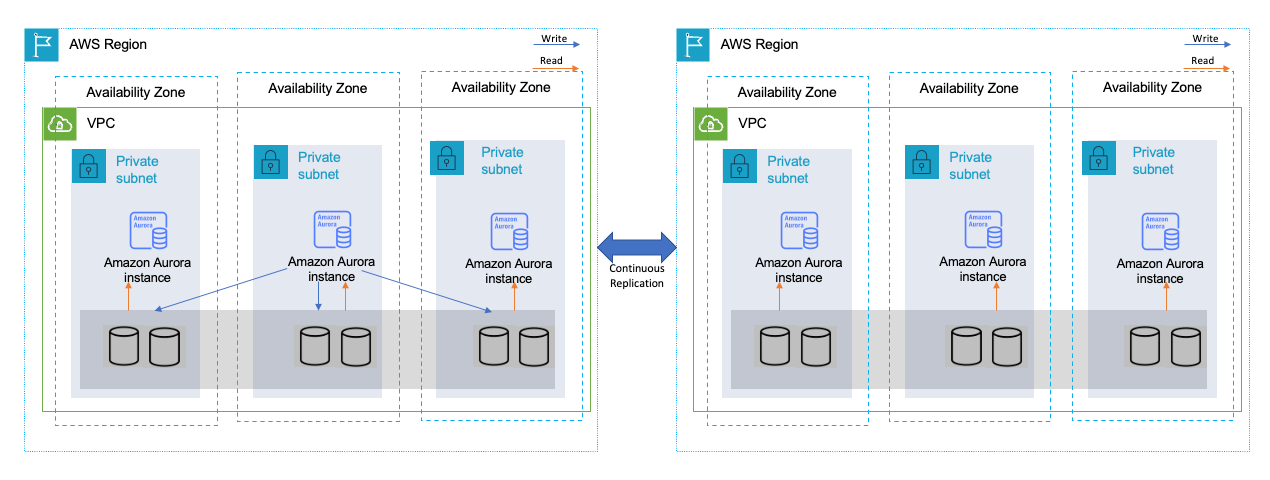
In this post, I shared all the options of modernizing Microsoft SQL database service with high availability on AWS, including lift-and-shift to Amazon EC2, replatform with Amazon Relational Database Service, and refactor with Amazon Aurora.

High availability across multiple Regions with Amazon Aurora global databases

Augmentation patterns to modernize a mainframe on AWS

I’ve had pleasure working with an AWS partner on building an AWS-focused mainframe modernization practice. I learned side-by-side with my partner using mainframe modernization use cases. By working with AWS Mainframe Modernization service team and SMEs in Technical Field Community, I published this post to share the design patterns of modernizing a mainframe through building augmentation solutions on AWS. Plus, my partner is building service offerings based on these patterns!

Mainframe data backup and archival augmentation

Strengthening Cloud Governance and Optimizing FinOps with LTI Infinity Ensure

My very first AWS Partner Network blog, co-authored with my AWS partner Larsen and Toubro Infotech (LTI). At AWS, customer obsession is probably everyone’s favorite leadership principle—and, perhaps, it is the best-known leadership principle among AWS customers.

As a partner solution architect, AWS partners—like LTI—are my immediate customers. Nothing excites me more than working with my partner to make a solution better and publish a blog explaining it to all AWS readers!

Strengthening Cloud Governance and Optimizing FinOps with LTI Infinity Ensure

[$] The road to Zettalinux

Post Syndicated from original https://lwn.net/Articles/908026/

Nobody should need more memory than a 64-bit pointer can address — or so
developers tend to think. The range covered by a pointer of that size
seems to be nearly infinite. During the Kernel Summit track at the 2022 Linux Plumbers Conference, Matthew
Wilcox took the stage to make the point that 64 bits may turn out to
be too few — and sooner than we think. It is not too early to start
planning for 128-bit Linux systems, which he termed “ZettaLinux”, and we
don’t want to find ourselves wishing we’d started sooner.

What’s Up, Home? – Automatic Temperature Control

Post Syndicated from Janne Pikkarainen original https://blog.zabbix.com/whats-up-home-automatic-temperature-control/23401/

Can you automatically control the temperature of your home in a time- and room-based manner using Zabbix? Of course, you can!

By day, I am a monitoring technical lead in a global cyber security company. By night, I monitor my home with Zabbix & Grafana and make some weird experiments with them. Welcome to my weekly blog about this project.

Earlier in this blog series, I made Zabbix read the status of our air conditioner, and made it possible to use Zabbix as manual remote control for the device. But we need to take a step further and make Zabbix control the AC based on the time of day and if I am at home or not.

Forget the sweaty nights

Usually in Finland during the summer, the nights are not so hot that an AC would be needed. However, that can happen during any rare heat wave we get. It’s annoying to wake up in the middle of the night all sweaty and turn on the AC when it’s already too late.

Of course, I could just leave the AC on when I go to bed, but let’s make Zabbix do some good for our electricity bill and for the environment by not using the AC when it’s not needed.

Detecting if I am at home

Like so many times before in this blog series, Cozify smart home hub is the true star of this story. It detects if anyone is at home based on if a specific phone or, for example, a smart key fob is present and reachable in Cozify’s range. For this case, I will be using my smart key fob in Zabbix, too. This is how it looks in Cozify.

… and here’s the key fob reachability status in Zabbix.

Surprisingly enough, it shows 1 (or “True”) as my status now that I type this blog entry at home and my keys are at home.

A deeper dive into my key fob Zabbix item

To make this all work, I have a set of Python scripts gathering data from Cozify via an unofficial Cozify API Python library. One of the scripts gets the reachability status for all the items, and here’s the configuration for my key fob Zabbix item.

… and some preprocessing …

Let’s add some triggers

Now that we have the key fob data, let’s create some triggers to combine the data about my presence with the temperature information.

I created the triggers by using Zabbix expression constructor:

.. and when I was done, this is how it looked.

I made a similar trigger for our living room, too.

Next, some scripts

Next I added some scripts under Zabbix Administration → Scripts and made them as Action operations.

This one turns on the AC:

… and this one turns it off.

Lights, camera, action!

We have our triggers and scripts, great! Next, it’s time to add some actions.

  • During the daytime, Zabbix will be interested in the living room temperature and will turn on AC if the temperature goes over 23C for ten consecutive times
  • During the nighttime, Zabbix will be reading the temperature of our bedroom and turn on AC if the temperature goes over 23C for ten consecutive times

We will see how well my attempt at this will work. Here’s what the operations look like — if it’s too hot, turn on the AC, and when the temperature comes down enough, turn off the AC.

As I built this thing while I was writing this blog entry, it’s possible I would need to fine-tune the thresholds somewhat to not make my automatic AC control too aggressive. Anyway, this now works in theory.

Oh, BTW, Cozify could also make similar rules, but as it does not directly support our air conditioner (but would require a separate Air Patrol device for that), this is again a great example of how I can utilize Cozify, but with Zabbix extend my home’s IoT functionality even more for free.

I have been working at Forcepoint since 2014 and always try to find out new ways to automate things. — Janne Pikkarainen

This post was originally published on the author’s LinkedIn account.

The post What’s Up, Home? – Automatic Temperature Control appeared first on Zabbix Blog.

Security updates for Friday

Post Syndicated from original https://lwn.net/Articles/908297/

Security updates have been issued by Debian (bzip2, chromium, glib2.0, libraw, mariadb-10.3, and mod-wsgi), Fedora (kdiskmark, wordpress, and zlib), Oracle (.NET 6.0, .NET Core 3.1, mariadb:10.3, nodejs:14, nodejs:16, ruby:2.7, and ruby:3.0), Red Hat (.NET 6.0, php:7.4, and webkit2gtk3), SUSE (389-ds, flatpak, kernel, libgit2, and thunderbird), and Ubuntu (sqlite3, vim, and wayland).

И какво като изтеглим „Винету“?

Post Syndicated from Зорница Христова original https://toest.bg/i-kakvo-kato-izteglim-winnetou/

Изчетох статията на Светла Енчева „Че какво му е на Винету“ със симпатия и разбиране, но също така и с известна доза несъгласие. Ето откъде идва то.

Факт е, че стереотипите не са нещо хубаво, дори уж да са с положителен знак. Особено когато са трайни. Особено когато изглежда, че прикриват истинската история. В случая с индианците (използвам тази дума с всички уговорки за нейната неточност) това е история на геноцид, изтласкване, културно изличаване и какво ли не още. Да, не би било приятно историята на потушаването на Априлското въстание, да речем, да бъде изтласквана по този начин.

Обаче.

Изтеглянето на една книга от пазара, още повече комерсиално „продължение“ на оригинала, не решава нищо и даже вреди. Стереотипът е комплекс от представи, който не може да бъде механично премахнат. Ако на едно огромно и мощно издателство като „Равенсбург“ наистина му пука за образа на коренното население на Америка, то има много по-добро средство да повлияе на средата.

А именно – като публикува повече произведения от индиански автори. Като ги промотира истински. Като им осигури видимост в медиите. Изобщо: като застане зад тях с парите и престижа си.

Да вземем примера на Светла Енчева. Този за имагинерната книга, в която българин и турчин са първи приятели по кърджалийско време, а в края на живота си българинът приема исляма. Е, да кажем, че турското издателство изтегля книгата от пазара. Какво ще промени това? А какво би се променило, ако вместо да я изтегля, рече да издаде „Летопис на смутното време“ на Вера Мутафчиева, да речем? И още десетина български книги?

Ето за това иде реч. Забраняването, изтеглянето, заглушаването не са добра идея. Още повече че създават прецедент за забраняване, изтегляне, заглушаване на други несходни с вкуса на част от публиката книги. Истинският либерализъм, истинската грижа за литературата, истинската грижа за представянето на всички гласове изисква друго.

Думи срещу думи. Вяра в силата на литературата. На нейната свобода.

А стереотипи, разбира се, винаги ще има. Човешката памет е устроена така, че да пести ресурси, като обобщава, често съвсем погрешно. Това не значи да ги приемем с въздишка на примирение (все пак от 1912 г., когато излиза първата книга за Винету, е минало доста време), а по-скоро да увеличаваме възможностите за разговор, за включване на нови гласове. Eто например има списък с четива от индиански автори. Луиз Ърдрич е излизала и на български. Да започнем с това.

И още нещо: или имаме свобода на словото, или нямаме. Да изтегляш книги от пазара, защото в тях има расов стереотип, и да ги изтегляш, защото го оспорват – това са двете страни на една и съща монета.

Впрочем ето какво казва Салман Рушди в едно интервю за L’Express от 2015 г. Поводът са нападенията срещу „Шарли Ебдо“ и реакцията на много интелектуалци, които смятат карикатуристите за виновни:

Оттогава имам чувството, че ако атаките срещу „Сатанински строфи“ се бяха случили днес, тези хора нямаше да ме защитят, а щяха да използват същите аргументи срещу мен, да ме обвинят, че съм обидил етническо и културно малцинство.

А ако ще оспорваме стереотипи, най-ефикасно би било някой да напише „Версията на Винету“ за същата възрастова група, към която е насочен оригиналът.

Заглавна снимка: „Мъдростта на Вселената“ (2014) на Кристи Белкорт от изложбата „Сърцата на нашите хора“ в Музея на американското изкуство „Смитсониън“, 2020 © Christi Belcourt / SAAM

Източник

Фотографът Анастас Търпанов: „Хората в наводнените села имат нужда и от психологическа помощ“

Post Syndicated from Светла Енчева original https://toest.bg/anastas-tarpanov-interview/

Анастас Търпанов е пловдивски фотограф, който работи на свободна практика. Той е участвал в изложби в България и има награда от World Press Photo. Разказва визуални истории от различни точки на света. Светла Енчева разговаря с него по повод снимките му на наводнените карловски села, и по-специално тези на ромската махала в село Слатина, които предизвикаха силен обществен отзвук.


Каква беше мотивацията Ви да отидете в наводнените села в Карловско?

В петък сутринта (на 2 септември – б.р.) моята жена ме събуди рано и каза, че е гледала новините и че има наводнения в карловските села, което е близо до нас в Пловдив. Отдавна се интересувам от социална и документална фотография и когато разбрах за това, просто си казах, че трябва да отида и да снимам какво се случва. Отначало не знаех какво е, какъв е мащабът, какво ще заваря. Но знаех, че трябва да отида там и да видя на място. Оказах се в село Каравелово по обед, точно когато падна мостът, който беше в посока село Богдан.

И видяхте падането на моста?

Да, частично го видях. Бяха затворили пътя, петдесетина метра преди реката районът беше отцепен от полицията и „Гражданска защита“.


Снимките, които публикувате в социалните мрежи, имат силен отзвук и провокират много хора да помогнат. Това ли е една от целите да бъдете там?

Разбира се, това е една от целите, но не единствената. Все пак ми се искаше да споделя това, което съм видял. Не съм го споделял точно с конкретна цел. Просто реших, че това трябва да се види и трябва да се знае. Защото когато отидох в петък на обед, имаше само един телевизионен екип. И честно казано, малко се изненадах. Очаквах да е препълнено с медии отвсякъде, но се оказа, че в петък темата нямаше почти никакво покритие в новините.

Освен да снимате на място, какво друго правите там?

Почти само снимам. Ако мога да помогна с нещо, помагам. В събота помагах на един възрастен човек, който едвам ходеше, да го върна вкъщи. Все още нямаше никаква организация, нямаше доброволци, нямаше кой да помага, та помагах малко на възрастните хора. На секретарката на читалището в село Каравелово ѝ стана лошо, докато си говорехме, и ходих да ѝ купя лекарства. Ако някой има нужда от помощ, отзовавам се веднага, но фотографската ми работа ми пречи да хвана лопатата и цял ден да рина кал, както правят повечето доброволци.

Нямах предвид конкретно ринене на кал. Доколкото имам впечатление, Вие се занимавате в голяма степен и с организиране на помощ, съзнателно или не.

Организационната дейност се случи след последните снимки от ромската махала в село Слатина. Четири-пет пъти ходих само до селата Каравелово и Богдан. Накрая исках да отида и в Слатина. И когато отидох, заварих доста тежка ситуация в ромската махала. Хората там са изолирани и реално за тях нямаше никаква помощ.

След като публикувах във Facebook снимките оттам, много хора започнаха да ми пишат. Искаха да ми пращат пари на личната сметка, за да купувам храна, материали за децата, дрехи, искаха да пращат дрехи на моя адрес. Оказах се неподготвен в тази ситуация, не очаквах такова нещо. И се наложи да направим една координационна група с други хора, които също помагат, за да можем да съгласуваме действията си на място и да има специален пункт, откъдето да минават нещата, които да стигат до местните. Утре ще пристигна на терен и ще има работа на място. Пак отивам в село Слатина.


Как стигнахте до ромската махала в Слатина – знаехте, че я има, и искахте да я видите, или попаднахте на нея?

Знаех от колега, че я има и че обитателите ѝ са доста изолирани, и исках да отида да проверя какво е положението. Очаквах, че то няма да е много наред и хората ще са откъснати, както масово се случва при нас в България. Оказа се дори по-зле, отколкото очаквах.

Защо го очаквахте? Как си обяснявате липсата на помощ точно в ромската махала?

Честно казано, нямам някакво конкретно обяснение, но според мен това е отражение на действителността в нашата държава. У нас ромите са изолирани, да не използвам думата сегрегирани, отделени от другите. И те живеят в паралелна реалност. Когато отидох там, те ми казаха: „Българите помагат на българи.“ Това ми казаха те. И мисля, че в голяма степен са прави да имат такава гледна точка.

Не знам, нямам обяснение. Може би за част от хората, които искат да помогнат, този проблем не е видим. Другите просто не ги интересува. Защото и негативни коментари видях. Опитвам се да ги игнорирам и да гледам позитивно. Искахме, каквото можем, да направим.

Кои хора не ги интересува?

Ами масово. Масово българското население не се интересува от ромските общности.

Какво се промени в Слатина, откакто сигнализирахте за ситуацията там, освен постъпленията по сметки и изпращането на помощ?

Досега само веднъж съм стигнал до село Слатина. Не знам какво се е променило, скоро ще разбера повече. Утре ми предстои да отида, да видя и най-вече да говоря с хората, да разбера те какво мислят. Но знам, че имаше доста голям отзвук. Много се направи за тези хора и това ще продължи в следващите дни и седмици.

По Ваши впечатления що за хора доброволстват в наводнените села? Има ли някакви конкретни типажи?

Много интересно е, че видях всякакъв тип доброволци. От деца и млади хора до възрастни, близки и приятели на засегнатите, както и напълно непознати от цяла България. Най-интересното за мен беше, че на места видях доброволци от очевидно противоположни краища на политическия спектър и с противоположни интереси, които бяха събрани на едно място. Те работеха заедно и нямаше проблеми. Просто всички бяха отдадени на каузата.

Много се изненадах, защото, честно казано, от страна на държавата видях голям хаос. Видях, че са неподготвени, че са несериозни, некоординирани и хаотични. Оказа се, че координационните центрове в общините по места бяха по-лошо организирани от доброволческите организации. Доброволците сами се оправяха, сами се организираха, ходеха, питаха, намираха, действаха, работеха всички заедно. И реално такова нещо в такъв мащаб и така самоорганизирано и координирано виждам за първи път в България. Останах силно впечатлен.


Неусетно преминахме към следващия ми въпрос – как оценявате ролята на институциите в справянето с щетите от наводнението?

Много слаба, много слаба. Държавната машина, не знам дали заради бюрокрация, или нещо друго, ми се видя мудна. Видях, че представителите на институциите на място имат желание да помогнат и че са искрени, не е някаква преструвка, но просто… много трудно действат. И много мудно. Но смятам, че ние нямаме опит в това. Системата за ранното предизвестяване според мен е нищо, счупена е. Две трети от помощта в селата е благодарение на доброволците.

Чудя се – имаше военни, които помагаха на места в селата. Според мен държавата можеше да прати 10 000 военни. Колко полицаи има в цяла България? Можеха да пратят 1000–2000 полицаи. Както и други професионалисти, които да работят на място с машините. Ето, днес по новините казаха, че държавата праща още 400 военни да помагат. Десет дни след наводнението. Не че военните на място не помагаха много. Просто 200–300 души ми се вижда смешна бройка, при условие че в почивните дни се събираха по над 1000 доброволци.

Какво бихте посъветвали да направят хората, които искат да помогнат за възстановяването на засегнатите села – било с жива сила, продукти, финансови средства или друго?

Не съм много сигурен какво точно мога да ги посъветвам. Някои споделиха, че нямат възможност да присъстват, някои не са в България, други не са в подходящо здравословно състояние за физическа работа и искат да даряват пари. Съветът ми е, ако се даряват пари, те да се предоставят директно на засегнатите – или на място, или чрез организации, които работят на място.

Аз лично не бих съветвал хората да даряват на сметките на общината, защото нейни представители казаха, че ще ги използват за инфраструктурни проекти. И не се знае после каква част от тези пари ще стигне директно до засегнатите.

Иначе, който иска да помага с работна ръка – според мен ще има работа и занапред. Повечето къщи в селата са изчистени основно, но работа ще има. Основният проблем към момента е, че доброволците се събират в почивните дни, защото през седмицата повечето са на работа. И в делничните дни се получават дупки, а после – голямо струпване на хора. Но който има желание, ще намери начин да помогне под каквато и да е форма.


Така стигнахме до следващия ми въпрос – какво е по-добре да не правят тези, които искат да помогнат?

Това, което казах преди малко. Лично моят съвет е да не се дарява на общинските сметки, защото не се знае какво ще бъде разпределението и влагането на парите. Казаха, че ще възстановяват мостове, ще оправят… Но това според мен не би трябвало да се прави с пари от дарения, а от бюджета на държавата и местната власт. По-скоро да се дарява на организации или на лица, които са на терен, за да стигне до хората. Няма значение дали под формата на храни, продукти, мебели, електроуреди. Просто да стигне директно до хората.

Има ли още нещо, от което жителите на засегнатите села имат нужда, но за което не се говори много?

Едно от нещата, което изскочи от разговорите ми и което нито съм видял, нито чел някъде, е, че голяма част от хората се нуждаят от психологическа помощ. Някои са уплашени. Някои от местните, с които говорих, ми казаха, че не могат да спят, будят се, не се чувстват комфортно, не искат да се връщат да живеят по къщите си. И това във всичките села са доста домакинства, стотици домакинства са засегнати. Не знам дали някой е помислил за това.

Тук пак трябва да дойде държавата, защото има нужда от по-стабилен ресурс – да се обходят тези хора, да се говори и да се мисли какво може да се направи за тях. Но бих посъветвал всеки, който има възможност, да отиде, дори да не може да работи, да си поговори с хората. Доста от тях имат нужда просто да си поговорят и да си споделят. При част от посещенията ми с часове не съм снимал, защото просто си говорех с хората. И те искаха да си кажат проблемите и притесненията.

Заглавна снимка: 30-годишният Марин Нанков изчаква нивото на водата да спадне, за да влезне в дома си в село Каравелово. По време на наводнението в къщата са били съпругата му и двегодишната им дъщеря, които са евакуирани през тавана от аварийно-спасителните служби © Анастас Търпанов

Източник

Hazard analysis and Chaos engineering at Vanguard Group

Post Syndicated from Jason Barto original https://aws.amazon.com/blogs/devops/hazard-analysis-and-chaos-engineering-at-vanguard-group/

Anticipating events that can cause a disruption to your system’s service is critical to building highly available, reliable systems.  Hazard analysis gives you a method to identify such events.  Chaos engineering gives you a method to confirm that a system behaves as expected in adverse conditions.  By combining these methods, Vanguard is building reliability into their systems.

Vanguard engineering teams perform hazard analysis on their systems and capture the identified events as failure scenarios.  They use the identified failure scenarios to create hypotheses to support chaos engineering experiments.  These hypotheses predict how the system will respond to failures and each hypothesis is then confirmed through experimentation to increase the team’s confidence in the system’s reliability.

In this article we will walk you through how Vanguard uses hazard analysis and chaos engineering.  We will also provide guidance on how you can employ these techniques on your applications.

Failure Mode & Effects Analysis

A hazard analysis can be performed using different methods.  At Vanguard, they have adapted the failure mode & effects analysis (FMEA) method to support their important services.

FMEA is a bottom-up approach to analyse an architecture and focus on the impact to system functions when one or more components of the system are disrupted. Members of the engineering team and architects responsible for designing and building a system brainstorm possible failure scenarios or failure modes, and document the impact of these failures on the system. Combined with a quantitative method for ranking the failure modes, the analysis process produces a prioritised list of failure modes which describes how the system would respond to individual or combined failures in its component parts or dependencies.

For each failure mode the team conducting the analysis will highlight what protections exist within the system to guard against the failure mode.  Sometimes, fault isolation boundaries have been put in place to prevent client impact in failure scenarios. In other scenarios, for one reason or another, there are hard dependencies in place for which the engineering team has decided not to build in fault tolerance. For example, a team responsible for a less-critical function may have architected its system to operate across multiple availability zones, but could decide not to implement other mitigations to prioritize cost over increased resilience.

The FMEA method has been in use by engineers in the automotive, aeronautical, healthcare, and military industries for more than 60 years.  Over that time, FMEA has been modified to best suit the organization and the field in which it was applied.  In many variations the FMEA measures each failure mode with a risk priority number (RPN), which is intended to quantitatively rank the failure mode based upon:

  1. The failure mode’s impact to the system as a whole
  2. The probability of the failure mode’s occurrence
  3. How easily the failure mode can be detected

Vanguard have adapted the FMEA process to serve their own specific requirements and processes.  Vanguard have decided not to adopt the RPN element of the FMEA process, as teams found they spent a lot of time debating the impact, probability, and detectability of individual failure modes.  To perform an FMEA more quickly, teams instead focus on the failure modes and system impact only, documenting a mental model of system performance which can be experimented through chaos engineering.

An excerpt of a Vanguard FMEA output is provided as an example in the following table:

The “Process Step” in the table above refers to a business function of the system being analyzed, for example “Request to retrieve stored data”. As part of the analysis, the team identifies the system components needed to perform the Process Step and considers the interactions of those components Focusing on a Process Step makes it easier to anticipate the failure scenarios that would affect the system in performing this particular business function. Also, the Process Step will imply an importance or criticality which can be a factor when prioritizing mitigations.

After selecting a Process Step, you walk through the system components involved and identify how component failures or disruptions will affect the wider system. Such component failures may involve individual components or a combination of components and are captured as “Failure Mode”. This identifies the component or components that are disrupted and their behaviour; for example, “Microservice is unavailable or returns an error”.

“Expected Behaviour” describes the effect of the failure mode on the wider system, in the context of the Process Step. This captures what other system components are affected by the Failure Mode and why, and how this impacts the Process Step as a whole.

Lastly, the “Hypothesis” column forms the basis for the chaos experiments that will follow from the FMEA to confirm that the system performs as expected.

At Vanguard, all mission-critical product teams are conducting FMEAs for their production applications. The outputs of these sessions are maintained over time and serve multiple purposes:

  1. When onboarding new team members, it is helpful to provide the FMEA document alongside an architecture diagram and narrative. It will paint a more robust picture of how the system is intended to operate in both “happy path” and “unhappy path” scenarios.
  2. When troubleshooting incidents, an FMEA document can help on-call engineers – especially those less experienced with debugging – to match up the documented expectations to the observed system behavior.
  3. Site Reliability Engineers (SREs) looking for opportunities to improve the resilience of a system might look to FMEA documentation to understand the existing fault isolation boundaries and introduce additional resilience mechanisms through automation and system changes.
  4. Finally, when selecting scenarios for experimentation with Chaos Engineering, the FMEA document provides a list of conjectures that have been mapped to hypotheses, ready to be validated through experimentation. This input into the Chaos Engineering workflow is the primary use of FMEA documents for Vanguard product teams.

There are many resources available online to learn more about how FMEA is used and applied in other organisations. In Failure Modes and Continuous Resilience, Adrian Cockcroft introduces FMEA as a method for anticipating failure scenarios. The NASA Software Engineering Handbook details how FMEAs are conducted as part of their engineering process. The Automotive Industry Group has also formally documented the use of FMEA in the Automotive Industry Action Group FMEA Handbook.

Chaos Engineering

After failure modes have been identified and mitigated through system design, it’s time to understand how resilient the system’s implementation is to those failure modes. Chaos engineering can be used to explore a system and validate that a system’s implementation meets business resiliency objectives.

Chaos engineering helps to improve a team’s mental model about the system under experimentation and provides insights into how a complex system behaves under adverse conditions. It also enables an engineer to find the unknown unknowns and the known unknowns through experiments that are built on top of the hypothesis. These experiments should simulate real world events, such as network degradation and increased client requests, and the outcome of the experiment should not be known. In other words, an experiment is not an experiment if it’s known that the conditions will cause the system to fail.

Prerequisites to Chaos Experiments at Vanguard

At Vanguard, there are some necessary prerequisites to running a chaos experiment. Firstly, the system under experiment must be set up with some basic observability tooling that will allow teams to monitor the state of the application during the failure injection. This could be as simple as an Amazon CloudWatch dashboard and some associated alarms, or as elaborate as a dedicated dashboard set up in a vendor tool.

Secondly, teams must be able to drive load to the application during the experiment; depending on the experiment type, the level and type of load may vary. The load generator can be as simple as a script on someone’s machine, or a fully automated load test depending on the requirements of the hypothesis.

Finally, teams need to have a good understanding of what the application’s “steady state” looks like. I Ideally, this takes the form of some metrics such as expected error rate, expected latency, and/or a service level objective (SLO) that can be monitored throughout the duration of the experiment. For example, a service level objective for a RESTful API might be that 90% of requests should receive a response within 100 milliseconds.

With the prerequisites met and a completed FMEA, teams can then experiment with their hypothesis using various experiment templates defined by Vanguard’s Climate of Chaos tooling.

Vanguard’s Climate of Chaos

At Vanguard, ensuring its software systems are resilient to adverse events is a critical part of its ongoing mission to provide world-class service to their clients. Vanguard believes that in order to develop high quality software, one must plan for the inevitable “stormy weather” events that occur in a distributed system.

Over the past 2 years, as a response to this need, Vanguard has developed in-house tooling called “The Climate of Chaos” to give teams easy access to common experiment templates, along with a friendly UI interface. The Climate of Chaos helps developers experiment on their systems and validate the hypotheses generated from FMEAs. It also provides the tooling for them to simulate the most common failure scenarios on Vanguard’s most commonly utilized AWS infrastructure, including Amazon Elastic Container Service (Amazon ECS), AWS Fargate, Amazon DynamoDB, Amazon Relational Database Service (Amazon RDS), AWS Lambda, and others.

The Climate of Chaos was created prior to Amazon’s release of the AWS Fault Injection Simulator (FIS), and today there is a lot of overlap with the experiment capabilities available in FIS. The Climate of Chaos has also been enhanced with company-specific features and integrations that make it easier for Vanguard developers to run chaos experiments in a controlled and predictable manner.

The Climate of Chaos includes important safety features such as an “emergency stop” function. This feature enables teams to terminate the experiment immediately if unintended side effects are encountered, rolling back the events simulated to resume steady state operation. The Climate of Chaos has been coupled with other systems like an in-house load testing tooling and added features like the ability to monitor CloudWatch alarms. Vanguard also offers teams the ability to schedule experiments to run at their convenience. Soon, Vanguard hopes to make running chaos experiments even smarter, introducing tools that will help teams run bulk experiments that systematically inject failures on a group of related applications to help pinpoint more complex failure modes.

Next Steps

Failure modes and effects analysis is a hazard analysis method which can help you identify single and combined points of failure in your system so you can prioritize the failure modes. To learn more about the FMEA process, you can read the NASA Software Engineering Handbook which outlines how they perform FMEA on their software-based systems. The AWS Whitepaper Building Mission-Critical Financial Services Applications on AWS provides example forms and suggestions for severity, probability, and detectability rankings. Appendix F in the whitepaper suggests a 1 to 10 ranking for each Risk Priority Number input, and the example spreadsheets recommend performing FMEAs for the application, platform, infrastructure, and operation layers of the system. Using these examples, you can perform an analysis of your own systems and generate hypotheses.

To experiment on your systems and validate your own hypotheses, you can use the AWS Fault Injection Simulator (FIS) mentioned earlier in this article. FIS provides you with a framework for performing controlled chaos experiments on your AWS workloads. It helps you to safely manage your experiments by providing tooling to monitor, rollback, and orchestrate chaos experiments. FIS provides the fault injection mechanisms that you will need to experiment upon your system’s implementation and resilience to identified failure modes. You can start by running experiments in pre-production environments, and then step up to running them as part of your CI/CD workflow and ultimately in your production environment. To learn more about FIS, you can read the FIS User Guide and FIS tutorials.

By using FMEA to anticipate the failures and experimenting on your systems with chaos engineering, you will gain confidence in the reliability of your system.

The content and opinions in this post are those of The Vanguard Group and AWS is not responsible for the content or accuracy of this post.

About the authors:

Tory Benya

Tory works as a Chaos Engineering Tech Lead at Vanguard.  She is passionate about automation, data, and making software work for people.  She likes to automate, integrate, and improve processes and technology.  Tory makes data-driven decisions to make a difference as part of her team at Vanguard.

Christina Yakomin

Christina works as a Senior Site Reliability Engineering Specialist in Vanguard’s Chief Technology Office. Throughout her career, she has developed an expansive skill set in front- and back-end web development, as well as cloud infrastructure and automation, with a specialization in Site Reliability Engineering. She has earned several Amazon Web Services certifications, including the Solutions Architect – Professional. Christina has also worked closely with the Women’s Initiative for Leadership Success at Vanguard, both internally at the company and externally in the local community, to further the career advancement of women and girls – in particular within the tech industry.

Jason Barto

Jason works as a Principal Solutions Architect at AWS where he works with customers to design resilient system architectures and develop chaos engineering practices. Prior to joining AWS Jason was designing and building distributed systems for complex event processing and real-time telemetry analytics.

John Formento

John is a Solutions Architect at AWS. He helps large enterprises achieve their goals by architecting secure and scalable solutions on the AWS Cloud. John holds 7 AWS certifications including AWS Certified Solutions Architect – Professional and DevOps Engineer – Professional.

Deploying Local Gateway Ingress Routing on AWS Outposts

Post Syndicated from Sheila Busser original https://aws.amazon.com/blogs/compute/deploying-local-gateway-ingress-routing-on-aws-outposts/

This post is written by Leonardo Solano, Senior Hybrid Cloud Solution Architect and Chris Lunsford, Senior Specialist Solutions Architect, AWS Outposts.

AWS Outposts lets customers use the same Amazon Virtual Private Cloud (VPC) security mechanisms, such as security groups and network access control lists, to control traffic flows for on-premises applications running on Outposts. Some customers, desiring additional security or consistency with on-premises systems, want the ability to inspect and filter incoming application traffic as it enters the Outpost. Ideally, they would like to deploy virtual appliances in front of the workloads running on Outposts.

Today, we are announcing a new feature called Outposts local lateway (LGW) ingress routing. This lets you create LGW inbound routes to redirect incoming traffic to an Amazon Elastic Compute Cloud (EC2) Elastic Network Interface (ENI) associated with an EC2 instance running on Outposts rack. The traffic is redirected for inspection before it reaches the workloads running on Outposts rack. Moreover, it lets the EC2 virtual appliance inspect, filter, or optimize the traffic in a similar way as VPC ingress routing in the Region.

Use case

A common use case for this feature is deploying a customer-preferred third-party virtual network appliance. The appliance can inspect, modify, or monitor the incoming traffic for policy compliance and forward compliant traffic on to the workloads running on the Outpost. A typical virtual appliance could be a firewall, intrusion detection system (IDS), or intrusion prevention system (IPS). The features provided by the virtual appliances vary, and they may include deep packet inspection, traffic optimization, and flow monitoring. This new Outposts rack feature modifies the default behavior of the local gateway routing table (LGW-RTB), and it lets customers redirect traffic coming into an Outposts deployment to the virtual appliance.

 Local Gateway Ingress Routing on Outposts Architecture

The new behavior?

Now you can create static routes in the LGW-RTB that target a specific ENI on the Outpost as the next hop. These static routes are propagated toward the customer network through the Border Gateway Protocol (BGP) peering sessions with the Customer Networking Devices. The on-premises network will route traffic to the specified Classless Inter-Domain Routing (CIDR) prefixes, as defined in the static routes, toward the Outposts Network Devices.

 Local Gateway Routing Table

In the preceeding diagram, the static route 198.19.33.248/29 has a longer prefix length than 198.19.33.240/28, and both routes will be propagated toward the customer network via BGP. The incoming traffic for the 198.19.33.248/29 prefix will be directed toward the ENI eni-1234example0. The architecture looks like the following diagram, where the security virtual appliance is seated between the LGW and a set of EC2 instances in Outposts.

Local Gateway Advertised routes

As ingress traffic is routed through the virtual appliance for inspection and filtering, the destination addresses of packets arriving at the ENI of the virtual appliance won’t match its ENI’s private IP address (the packets are transiting the instance). By default, the ENI will drop the inbound traffic unless you disable source/destination checking on the virtual appliance instance ENI settings. The following screenshot shows how you can disable the EC2 instance source/destination checking in the AWS console.

(aka, source-destination-check.png) . EC2 source/destination Check

Considerations for LGW ingress routing

Consider the following requirements when preparing to deploy LGW ingress routing:

  • The ENIs used as the next-hop target must be deployed in an Outposts Subnet.
  • The subnets must belong to a VPC associated with the LGW-RTB.
  • Routes with the longest matches are prioritized. If there are two with the same destination CIDR, then static routes are preferred over propagated ones.

Working with Outposts LGW ingress routing

The following output shows what the LGW route table looks like before applying the ingress routing feature:

{
    "Routes": [
        {
            "DestinationCidrBlock": "0.0.0.0/0",
            "LocalGatewayVirtualInterfaceGroupId": "lgw-vif-grp-XXX",
            "Type": "static",
            "State": "active",
            "LocalGatewayRouteTableId": "lgw-rtb-XXX",
            "LocalGatewayRouteTableArn": "arn:aws:ec2:>AWS-REGION>:<account-id>:local-gateway-route-table/lgw-rtb-XXX",
            "OwnerId": "<account-id>"
        },
        {
            "DestinationCidrBlock": "198.19.33.16/28",
            "CoipPoolId": "coip-pool-0000aaaabbbbcccc1111",
            "Type": "propagated",
            "State": "active",
            "LocalGatewayRouteTableId": "lgw-rtb-XXX",
            "LocalGatewayRouteTableArn": "arn:aws:ec2:<AWS-REGION>:<account-id>:local-gateway-route-table/lgw-XXX",
            "OwnerId": "<account-id>"
        },
        {
            "DestinationCidrBlock": "198.19.33.240/28",
            "CoipPoolId": "coip-pool-0000aaaabbbbcccc2222",
            "Type": "propagated",
            "State": "active",
            "LocalGatewayRouteTableId": "lgw-rtb-XXX",
            "LocalGatewayRouteTableArn": "arn:aws:ec2:<AWS-REGION>:<account-id>:local-gateway-route-table/lgw-XXX",
            "OwnerId": "<account-id>"
        }
     ]
}

The relevant change under an LGW-RTB before to add a local-gateway-route is the presence of the “propagated routes”. This represents the Outposts Subnets that can’t be deleted or modified with Next-Hop as specific ENIs present in Outposts. In the following section, we will cover how it will look after the creation of a local-gateway-route.

Configuring LGW ingress routing

To configure LGW ingress routing, you must provide the LGW route table ID, the ENI ID that will be utilized as a next-hop, and the destination CIDR block. Once you have identified those three parameters, you can configure LGW ingress routing via the This is shown in the following example, where the prefix 198.19.33.248/29 is routed to an Outpost. If the route points to an ENI attached to an instance, then the route will show as active. If the route points to an ENI that isn’t attached to an EC2 instance, then the route will show a blackhole state.

$ aws ec2 create-local-gateway-route \
  --local-gateway-route-table-id <lgw-rtb-id> \
  --network-interface-id <eni-id> \
  --destination-cidr-block 198.19.33.248/29
  
{
    "Route": {
        "DestinationCidrBlock": "198.19.33.248/29",
        "NetworkInterfaceId": "eni-id",
        "Type": "static",
        "State": "active",
        "LocalGatewayRouteTableId": "lgw-rtb-id",
        "LocalGatewayRouteTableArn": "arn:aws:ec2:<AWS-REGION>:<account-id>:local-gateway-route-table/<lgw-rtb-id>",
        "OwnerId": "<account-id>"
    }
}

Once LGW ingress routing has been configured, the LGW will route traffic destined to the 198.19.33.248/29 prefix to the target ENI. This must be present as part of the Outposts subnets. Note that the segment 198.19.33.248/29 is part of the Outposts CIDR range of 198.19.33.240/28. This belongs, in this case, to the Outposts customer-owned IP address (CoIP) CIDRs. When traffic follows a static route to an ENI, the packet destination address is preserved and isn’t translated to the private address of the ENI.

In this case, the new LGW-RTB will look like the following:

{
    "Routes": [
        {
            "DestinationCidrBlock": "0.0.0.0/0",
            "LocalGatewayVirtualInterfaceGroupId": "lgw-vif-grp-XXX",
            "Type": "static",
            "State": "active",
            "LocalGatewayRouteTableId": "lgw-rtb-XXX",
            "LocalGatewayRouteTableArn": "arn:aws:ec2:<AWS-REGION>:<account-id>:local-gateway-route-table/lgw-rtb-XXX",
            "OwnerId": "<account-id>"
        },
        {
            "DestinationCidrBlock": "198.19.33.16/28",
            "CoipPoolId": "coip-pool-0000aaaabbbbcccc1111",
            "Type": "propagated",
            "State": "active",
            "LocalGatewayRouteTableId": "lgw-rtb-XXX",
            "LocalGatewayRouteTableArn": "arn:aws:ec2:<AWS-REGION>:<account-id>:local-gateway-route-table/lgw-XXX",
            "OwnerId": "<account-id>"
        },
        {
            "DestinationCidrBlock": "198.19.33.240/28",
            "CoipPoolId": "coip-pool-0000aaaabbbbcccc1111",
            "Type": "propagated",
            "State": "active",
            "LocalGatewayRouteTableId": "lgw-rtb-XXX",
            "LocalGatewayRouteTableArn": "arn:aws:ec2:<AWS-REGION>:<account-id>:local-gateway-route-table/lgw-XXX",
            "OwnerId": "<account-id>"
        },
         {
            "DestinationCidrBlock": "198.19.33.248/29",
            "NetworkInterfaceId": "eni-XXX",
            "Type": "static",
            "State": "active",
            "LocalGatewayRouteTableId": "lgw-rtb-XXX",
            "LocalGatewayRouteTableArn": "arn:aws:ec2:<AWS-REGION>:<account-id>:local-gateway-route-table/lgw-rtb-XXX",
            "OwnerId": "<account-id>"
        }
     ]
}

In the AWS console, the LGW-RTB will show the new ingress routing route:

 (aka, LWG-RTB) Console Local Gateway Routing Table

Modifying LGW ingress routing

Utilize a similar AWS CLI command to the one that we used previously to create the LGW ingress routing route to modify existing routes. In this case, the command will be aws ec2 modify-local-gateway-route, and the arguments are the same as with the create command. Use this command when you want to shift inbound traffic from one EC2 instance to another – perhaps from an active to a standby network appliance while you perform required maintenance on the primary instance.

$ aws ec2 modify-local-gateway-route \
  --local-gateway-route-table-id <lgw-rtb-id> \
  --network-interface-id <new-eni-id> \
  --destination-cidr-block 198.19.33.248/29
{
    "Route": {
        "DestinationCidrBlock": "198.19.33.248/29",
        "NetworkInterfaceId": "new-eni-id",
        "Type": "static",
        "State": "active",
        "LocalGatewayRouteTableId": "lgw-rtb-id",
        "LocalGatewayRouteTableArn": "arn:aws:ec2:<AWS-REGION>:<account-id>:local-gateway-route-table/<lgw-rtb-id>",
        "OwnerId": "<account-id>"
    }
}

Conclusion

AWS Outposts LGW ingress routing allows AWS customers and partners to deploy virtual appliances on Outposts rack and direct inbound traffic through those appliances. The virtual appliance can inspect, filter, and optimize the ingress traffic before forwarding it on to the workloads running on Outposts rack, creating fine-grained network and security policies for your workloads. To learn more about AWS Outposts rack, visit the product overview page.

Optimize Ama­zon EMR costs for legacy and Spark workloads with managed scaling and node labels

Post Syndicated from Ramesh Raghupathy original https://aws.amazon.com/blogs/big-data/optimize-amazon-emr-costs-for-legacy-and-spark-workloads-with-managed-scaling-and-node-labels/

Customers migrating from large on-premises Hadoop clusters to Amazon EMR like to reduce their operational costs while running resilient applications. On-premises customers typically use in-elastic, large, fixed-size Hadoop clusters, which incurs high capital expenditure. You can now migrate your mixed workloads to managed scaling Amazon EMR, which saves costs without compromising performance.

This solution can benefit those running a mixed workload of legacy MapReduce applications concurrently with Spark applications. MapReduce applications such as Apache Sqoop jobs need to use Amazon Elastic Compute Cloud (Amazon EC2) On-Demand Instances for resilience, whereas Apache Spark job workers can use EC2 Spot Instances due to built-in resilience. Therefore, it’s critical that you can run your workloads with both On-Demand or Spot Instances when needed, while also having the elasticity and resiliency you need to achieve cost savings.

This post walks through a mixed workload scenario to illustrate the use of Amazon EMR managed scaling, node labels, and capacity scheduler configuration to create an elastic EMR cluster that provides elasticity and ability to deploy resilient applications.

Solution overview

For this post, we use the following Apache Sqoop and Apache Spark workloads to demonstrate the scenario and the results:

  • Sqoop workload – A simple Sqoop job to extract data from Amazon Redshift and write data to Amazon Simple Storage Service (Amazon S3)
  • Spark workload – A Python script that unions Amazon S3 data and writes it back to Amazon S3

The following diagram illustrates the two workloads used for this demonstration.

To build the solution, you must complete the following high-level steps:

  1. Determine the EMR cluster configuration for managed scaling with minimum and maximum capacity, and core and task nodes.
  2. For the workloads to run, identify the capacity scheduler queues required, queue capacity as % of total capacity, and Spot or On-Demand Instances used to meet the queue capacity.
  3. Assign YARN node labels to the On-Demand and Spot Instances in the capacity scheduler configuration to ensure the appropriate instance types are allocated to the queues.
  4. Create a bootstrap and step scripts to automate the configuration process during EMR cluster creation.
  5. Validate the cluster elasticity and application resilience by running the Sqoop and Spark applications.

The solution offers the following benefits:

  • Significantly reduces the time to migrate applications to Amazon EMR because you’re no longer struggling to implement cost-optimization techniques as well as application resilience while migrating from on-premises to the AWS Cloud
  • Offers cost savings when compared to running similar workloads on in-elastic, large on-premises Hadoop clusters
  • Enables you to run a mixed workload on EMR clusters without significantly redesigning your on-premises applications

Prerequisites

You need to complete the following steps before you can configure your EMR cluster and run the workloads.

Launch an Amazon Redshift cluster

We first launch an Amazon Redshift cluster. For instructions, refer to Create a sample Amazon Redshift cluster. We use Amazon Redshift as the relational database management service for the Sqoop job.

Create and associate an IAM role for loading the Amazon Redshift cluster

We create an AWS Identity and Access Management (IAM) role that allows the Amazon Redshift cluster to call AWS services on its behalf.

  1. On the IAM console, choose Roles in the navigation pane.
  2. Choose Create role.
  3. For Use case, choose Redshift and Redshift-Customizable.
  4. Choose Next.
  5. For Permissions policies, choose the policy AmazonS3ReadOnlyAccess.
  6. Choose Next.
  7. For Role name, enter load_tpch_redshift.
  8. Choose Create role.
    Now you attach this role to the Amazon Redshift cluster.
  9. On the Properties tab, choose Manage IAM roles.
  10. Associate the IAM role.

Load test data into the Amazon Redshift cluster

We create a table called SQOOP_LOAD_TBL and load it with mock data to test the Sqoop job. The following code shows the create table and copy statement. The copy statement should load around 1000000 rows in the SQOOP_LOAD_TBL table, which we use to run a large Sqoop data movement job.

CREATE TABLE EMRBLOG.SQOOP_LOAD_TBL
(
ID BIGINT NOT NULL,
NAME VARCHAR(25),
REGIONKEY BIGINT,
COMMENT   VARCHAR(150),
TS1 TIMESTAMP 
)
DISTSTYLE EVEN;

copy EMRBLOG.SQOOP_LOAD_TBL
from 's3://aws-blogs-artifacts-public/artifacts/BDB-1737/sample-data/sqoop_input/redshift_manifest'
IAM_ROLE 'arn:aws:iam::xxxxxxxxxx:role/load_tpch_redshift' format parquet 
manifest
;

Create an Amazon RDS for PostgreSQL instance

We create an Amazon Relational Database Service (Amazon RDS) for PostgreSQL instance to use as the metastore for Sqoop.

The following configuration uses a small instance. We use Sqoop as master_user and postgres as the database name. Note the database name, user ID, and password—we use these to connect Sqoop running on the EMR cluster to this metastore.

Use the Amazon EMR automation scripts while creating the cluster

We use three automation scripts from the S3 folder s3://aws-blogs-artifacts-public/artifacts/BDB-1737/config/ while creating the EMR cluster.

The first script is a node label script used by YARN to determine if each instance is Spot or On-Demand:

getNodeLabels.py 

#!/usr/bin/python3
import json
k='/mnt/var/lib/info/extraInstanceData.json'
with open(k) as f:
    response = json.load(f)
    if (response['instanceRole'] in ['core','task']):
       print (f"NODE_PARTITION:{response['marketType'].upper()}")

This script runs during cluster creation to assign node labels SPOT or ON_DEMAND based on instance type.

The next is a bootstrap script to copy the node label script to the /home/hadoop directory on all cluster nodes:

getNodeLabels_bootstrap.sh

#!/bin/bash
set -vx
aws s3 cp s3://aws-blogs-artifacts-public/artifacts/BDB-1737/config/getNodeLabels.py /home/hadoop
chmod +x /home/hadoop/getNodeLabels.py

This script is used during the bootstrap process to copy getNodeLabels.py from the S3 folder to /home/hadoop on the EMR cluster.

The last is a step script to update the Spot node to be exclusively used by the assigned capacity queue:

addNodeLabels.sh

#!/bin/bash
sudo -u yarn yarn rmadmin -addToClusterNodeLabels "SPOT(exclusive=true),ON_DEMAND(exclusive=false)"

There are two kinds of node partitions:

  • Exclusive – Containers are allocated to nodes with an exact match node partition. For example, asking partition=“x” will be allocated to the node with partition=“x”, and asking the DEFAULT partition will be allocated to the DEFAULT partition nodes.
  • Non-exclusive – If a partition is non-exclusive, it shares idle resources to the container requesting the DEFAULT partition.

We use exclusive labels for SPOT to ensure only Spark workloads can use them and non-exclusive labels for ON_DEMAND so that they can be used both by Spark and Sqoop workloads. For more details on the types of labels, refer to YARN Node Labels.

We’re now ready to run our solution.

Launch an EMR cluster

Complete the following steps to launch an EMR cluster:

  1. Determine the managed scaling EMR cluster configuration, choosing instance fleets, which allows us to choose up to 30 instance types and the minimum and maximum configuration to allocate core and task nodes while enabling scaling on the task nodes.
    We suggest the following EMR cluster configuration for instance fleets and EMR managed scaling with core and task nodes for this demonstration. The right number and types of nodes need to be chosen based on the workload needs of your use case.

    1. Minimum – 4
    2. Maximum – 64
    3. On-demand limit – 4
    4. Maximum core nodes – 4
  2. On the Amazon EMR console, choose Create cluster.
  3. In the Advanced Options section, for Software Configuration, select Hadoop, Sqoop, Oozie, and Spark.
  4. In the Edit software settings section, choose Enter configuration.
  5. Enter the following code, which includes yarn-site, capacity-scheduler, and Sqoop-site properties, and the addition of a property to spark-defaults. In the Sqoop-site section, update the metastore URL, user ID, and password.
    [
      {
        "classification": "yarn-site",
        "properties": {
          "yarn.resourcemanager.scheduler.class": "org.apache.hadoop.yarn.server.resourcemanager.scheduler.capacity.CapacityScheduler",
          "yarn.node-labels.enabled": "true",
          "yarn.node-labels.am.default-node-label-expression": "ON_DEMAND",
          "yarn.nodemanager.node-labels.provider": "script",
          "yarn.nodemanager.node-labels.provider.script.path": "/home/hadoop/getNodeLabels.py"
        },
        "configurations": []
      },
      {
        "classification": "capacity-scheduler",
        "properties": {
          "yarn.scheduler.capacity.root.queues": "default,Sqoop",
          "yarn.scheduler.capacity.root.Sqoop.capacity": "40",
          "yarn.scheduler.capacity.root.default.capacity": "60",
          "yarn.scheduler.capacity.root.default.accessible-node-labels": "*",
          "yarn.scheduler.capacity.root.Sqoop.accessible-node-labels": "ON_DEMAND",
          "yarn.scheduler.capacity.root.default.accessible-node-labels.ON_DEMAND.capacity": "45",
          "yarn.scheduler.capacity.root.Sqoop.accessible-labels.ON_DEMAND.capacity": "55",
          "yarn.scheduler.capacity.root.default.accessible-node-labels.SPOT.capacity": "100"
        },
        "configurations": []
      },
      {
        "classification": "Sqoop-site",
        "properties": {
          "Sqoop.metastore.client.enable.autoconnect": "true",
          "Sqoop.metastore.client.autoconnect.url": "jdbc:postgresql://<sqoop-metastore-alias>:5432/postgres",
          "Sqoop.metastore.client.autoconnect.username": "xxxxxx",
          "Sqoop.metastore.client.autoconnect.password": "xxxxxx",
          "Sqoop.metastore.client.record.password": "true"
        },
        "configurations": []
      },
      {
        "classification": "spark-defaults",
        "properties": {
          "spark.yarn.executor.nodeLabelExpression": "SPOT"
        }
      }
    ]

    The configuration is created with two queues (Sqoop and default). The Sqoop queue has access only to the On-Demand nodes, and the default queue has access to both On-Demand and Spot nodes.

    In the spark-defaults section, the property "spark.yarn.executor.nodeLabelExpression": "SPOT" enables quick scaling of the Spot nodes and use of the Spot nodes by the Spark executors as soon as the Spark job starts. If this property isn’t used, Spot node scaling is triggered only after the On-Demand nodes are consumed. This causes a longer runtime for the job due to delayed scaling as well as the Spark executor’s inability to use the scaled-up Spot nodes.

  6. Add the addNodeLabels.sh script as a step, which is run using script-runner.jar.
  7. Under Cluster Composition, select Instance fleets, which provides options to choose the nodes from up to 30 instance types.
  8. Choose one primary, four core, and 0 task nodes.
  9. Under Cluster scaling, choose the Amazon EMR managed scaling policy option to define the core and task units (minimum 4, maximum 64, On-Demand limit 4, max core nodes 4).
  10. For Bootstrap Actions, add the getNodeLabels_bootstrap.sh script from Amazon S3 as a step.
    This script copies getNodeLabels.py from the Amazon S3 location to the /home/hadoop directory on the primary node.
  11. Use an existing EC2 key pair or create a new one if none exists, and download it to be used for logging onto the primary node.
  12. Choose existing security groups for the primary node and core and task nodes.
  13. Choose Create cluster and wait for cluster creation to complete.

Configure proxy settings to view websites hosted on the primary node

To configure your proxy settings, follow the instructions in Option 2, part 1: Set up an SSH tunnel to the master node using dynamic port forwarding and Option 2, part 2: Configure proxy settings to view websites hosted on the master node.

After the proxy settings are configured, run the following command on your terminal window (Mac):

ssh -i ec2-login-keypair.pem [email protected] -ND 8157

Open the Resource Manager UI (found on the Application User Interfaces tab on the Amazon EMR console, similar to http://ec2-xxxxxxxx.compute-1.amazonaws.com:8088/) and choose the scheduler option to monitor the jobs and use of capacity scheduler queues.

Run the Sqoop job

To run the Sqoop job and monitor YARN, complete the following steps:

  1. Connect to the primary node and run the Sqoop job -list command.
    This command creates the Sqoop metadata tables in the metastore.If you can’t connect Sqoop to Amazon RDS, make sure the Amazon RDS security group allows an inbound PostgreSQL TCP connection on port 5432 from both the EMR primary and secondary security groups. Follow the same procedure while connecting to Amazon Redshift to open the Amazon Redshift 5439 port for connections from both the EMR primary and secondary security groups.
  2. Create a test Sqoop job that reads the data from the Amazon Redshift table and writes to Amazon S3.
  3. Substitute the <last_value> to a timestamp value older than the value in TS1 column of the table EMRBLOG.SQOOP_LOAD_TBL and the <Target S3 folder>.
    Sqoop job -Dmapred.job.queue.name=Sqoop \
    --create Sqoop_redshift_extract \
    -- import \
    --connect 'jdbc:postgresql://redshift-clusterxx.xxxxxxxx.us-east-1.redshift.amazonaws.com:5439/dev?user=awsuser&password=xxxxxxxx’ \
    --fields-terminated-by '|' \
    --null-non-string '' \
    --null-string '' \
    --target-dir S3n://<Target S3 folder> \
    --query "Select * from EMRBLOG.SQOOP_LOAD_TBL where \$CONDITIONS" \
    --m 1 \
    --append \ 
    --check-column "ts1" \
    --incremental lastmodified \ 
    --last-value "<last_value>"

  4. List the job to verify if it was created correctly, and run the Sqoop job using the following command:
    # list the job to confirm creation
    Sqoop job —list 
    # run the job
    Sqoop job —exec Sqoop_redshift_extract

  5. Monitor the job and the use of the application queues using the scheduler option on the Resource Manager UI.

You should notice that the Sqoop job is using On-Demand nodes and the Sqoop queue under it. There is no usage of Spot nodes.

Create the Spark job and monitor YARN

The Spark job (emr_union_job.py) reads a mock Parquet dataset from Amazon S3. It uses an argument count to union multiple copies of the dataset, and sorts the result data before writing it to the Amazon S3 output location. Because this job consumes a large amount of memory for performing the union and sort operations, it triggers the Spark executors to scale up Spot nodes. When the job is complete, the EMR cluster should scale down the Spot nodes.

The count value can be varied between 1–8 to achieve varying cluster scaling and runtimes for the job based on the volume of data being unioned.

  1. Run the Spark job as a step on the EMR cluster using command-runner.jar, as shown in the following screenshot.
  2. Use the following sample command to submit the Spark job (emr_union_job.py).
    It takes in three arguments:

    • <input_full_path> – The Amazon S3 location of the data file that is read in by the Spark job. The path should not be changed. The input_full_path is s3://aws-blogs-artifacts-public/artifacts/BDB-1737/sample-data/input/part-00000-a0885743-e0cb-48b1-bc2b-05eb748ab898-c000.snappy.parquet.
    • <output_path> – The Amazon S3 folder where the results are written to.
    • <number of copies to be unioned> – By varying this argument, we can use the Spark job to trigger varying job runtimes and varying scaling of Spot nodes.
    spark-submit --deploy-mode cluster s3://aws-blogs-artifacts-public/artifacts/BDB-1737/scripts/emr_union_job.py s3://aws-blogs-artifacts-public/artifacts/BDB-1737/sample-data/input/part-00000-a0885743-e0cb-48b1-bc2b-05eb748ab898-c000.snappy.parquet s3://mydatarr/union_out/ 6

  3. Review the Resource Manager UI and choose the Scheduler tab.
    You should see that only the resources under the default queue are being used both in ON_DEMAND and SPOT partitions.
  4. On the Hardware tab of the EMR cluster, verify if the cluster has scaled up the Spot Instances of the task nodes.Because Spark job executors are configured to use Spot nodes exclusively, the Spot nodes should scale up while the Spark job is running.
  5. After the job is complete, verify if the Spot nodes have scaled down to 0, indicating that the workload has run successfully.

Clean up

To help prevent unwanted charges to your AWS account, you can delete the AWS resources that you used for this walkthrough:

  • Amazon Redshift cluster
  • Amazon RDS database
  • EMR cluster

Conclusion

In this post, you learned how to configure an EMR cluster with managed scaling, assign node labels, and use a capacity scheduler to run mixed workload jobs on the EMR cluster. You created an Amazon Redshift cluster for sourcing data, Amazon RDS for Sqoop metadata, a Sqoop job to import data from Amazon Redshift to Amazon EMR, and a Spark job to test managed scaling and the usage of the capacity scheduler queues.

You also observed how to run Sqoop jobs on On-Demand nodes to provide resilience, whereas Spark jobs use inexpensive Spot nodes, which scale up and down based on the workload.

We used a sample capacity scheduler queue configuration for this post; you should adjust it for your specific workload requirements. Furthermore, you can create additional scheduler queues to meet more complex requirements.

We also showed how you can apply automation of the configuration for EMR cluster creation.

For more information about managed scaling and optimizing EC2 Spot usage, refer to Introducing Amazon EMR Managed Scaling – Automatically Resize Clusters to Lower Cost and Best practices for running Apache Spark applications using Amazon EC2 Spot Instances with Amazon EMR.

Appendix

The following code is the emr_union_job.py script:

#----------------------------------------------------------------------------------------
# Author: Ramesh Raghupathy
# Date: 06/15/2022
# Description: This pyspark script reads in 3 arguments (Input file name, multiply count 
# and outputPath (S3)). It reads the Input file and unions it as 
# many times as the Multiply count. By varying multiply count it is
# easy to generate different size of the workload required for testing
# managed scaling of a EMR cluster.
#----------------------------------------------------------------------------------------
from __future__ import print_function
from pyspark.sql import SparkSession
spark = SparkSession.builder \
        .master("yarn") \
        .appName("Generic Union") \
        .getOrCreate()

import sys
import time
from pyspark.sql import DataFrame
from functools import reduce

if (len(sys.argv) < 2):
    print ("Insufficient args ")
    quit()

ip_full_path = sys.argv[1]
outputPath = sys.argv[2].strip()
multiply_count = int(sys.argv[3].strip())
delimiter = '|'

ip_file = ip_full_path


print ("----------- Args Start '-------------")
print (multiply_count)
print (ip_full_path)
print (outputPath)
print ("----------- Args Done -------------")

ip_df  = spark.read.parquet(ip_file)

ip_df.show(20)

df_union = ip_df

for i in range(multiply_count):
    df_union = df_union.union(df_union)
    print(df_union.count())

df_union.show(30)
df_union.sort("custkey", "orderkey","comment1").show(50)

df_union.write.format("csv").mode("overwrite").option("compression", "bzip2").option("delimiter", delimiter).option("ignoreTrailingWhiteSpace", False).option("ignoreLeadingWhiteSpace", False).option("nullValue", "").option("emptyValue","").option("multiline","True").save(outputPath)


About the Authors

Ramesh Raghupathy is a Senior Data Architect with WWCO ProServe at AWS. He works with AWS customers to architect, deploy, and migrate to data warehouses and data lakes on the AWS Cloud. While not at work, Ramesh enjoys traveling, spending time with family, and yoga.

Kiran Guduguntla is a WW Go-to-Market Specialist for Amazon EMR at AWS. He works with AWS customers across the globe to strategize, build, develop, and deploy modern data analytics solutions.

Lights, Camera, Custom Action (Part Two): Inside Integrating Frame.io + Backblaze B2

Post Syndicated from Pat Patterson original https://www.backblaze.com/blog/lights-camera-custom-action-part-two-inside-integrating-frame-io-backblaze-b2/

Part 2 in a series covering the Frame.io/Backblaze B2 integration, covering the implementation. See Part 1 here, which covers the UI.

In Lights, Camera, Custom Action: Integrating Frame.io with Backblaze B2, we described a custom action for the Frame.io cloud-based media asset management (MAM) platform. The custom action allows users to export assets and projects from Frame.io to Backblaze B2 Cloud Storage and import them back from Backblaze B2 to Frame.io.

The custom action is implemented as a Node.js web service using the Express framework, and its complete source code is open-sourced under the MIT license in the backblaze-frameio GitHub repository. In this blog entry we’ll focus on how we secured the solution, how we made it deployable anywhere (including to options with free bandwidth), and how you can customize it to your needs.

What is a Custom Action?

Custom Actions are a way for you to build integrations directly into Frame.io as programmable UI components. This enables event-based workflows that can be triggered by users within the app, but controlled by an external system. You create custom actions in the Frame.io Developer Site, specifying a name (shown as a menu item in the Frame.io UI), URL, and Frame.io team, among other properties. The user sees the custom action in the contextual/right-click dropdown menu available on each asset:

When the user selects the custom action menu item, Frame.io sends an HTTP POST request to the custom action URL, containing the asset’s id. For example:

{
  "action_id": "2444cccc-7777-4a11-8ddd-05aa45bb956b",
  "interaction_id": "aafa3qq2-c1f6-4111-92b2-4aa64277c33f",
  "resource": {
    "type": "asset",
    "id": "9q2e5555-3a22-44dd-888a-abbb72c3333b"
  },
  "type": "my.action"
}

The custom action can optionally respond with a JSON description of a form to gather more information from the user. For example, our custom action needs to know whether the user wishes to export or import data, so its response is:

{
  "title": "Import or Export?",
  "description": "Import from Backblaze B2, or export to Backblaze B2?",
  "fields": [
    {
      "type": "select",
      "label": "Import or Export",
      "name": "copytype",
      "options": [
        {
          "name": "Export to Backblaze B2",
          "value": "export"
        },
        {
          "name": "Import from Backblaze B2",
          "value": "import"
        }
      ]
    }
  ]
}

When the user submits the form, Frame.io sends another HTTP POST request to the custom action URL, containing the data entered by the user. The custom action can respond with a form as many times as necessary to gather the data it needs, at which point it responds with a suitable message. For example, when it has all the information it needs to export data, our custom action indicates that an asynchronous job has been initiated:

{
  "title": "Job submitted!",
  "description": "Export job submitted for asset."
}

Securing the Custom Action

When you create a custom action in the Frame.io Developer Tools, a signing key is generated for it. The custom action code uses this key to verify that the request originates from Frame.io.

When Frame.io sends a POST request, it includes the following HTTP headers:

X-Frameio-Request-Timestamp The time the custom action was triggered, in Epoch Epoch timetime (seconds since midnight UTC, Jan 1, 1970).
X-Frameio-Signature The request signature.

The timestamp can be used to prevent replay attacks; Frame.io recommends that custom actions verify that this time is within five minutes of local time. The signature is an HMAC SHA-256 hash secured with the custom action’s signing key—a secret shared exclusively between Frame.io and the custom action. If the custom action is able to correctly verify the HMAC, then we know that the request came from Frame.io (message authentication) and it has not been changed in transit (message integrity).

The process for verifying the signature is:

    • Combine the signature version (currently “v0”), timestamp, and request body, separated by colons, into a string to be signed.
    • Compute the HMAC SHA256 signature using the signing key.
    • If the computed signature and signature header are not identical, then reject the request.

The custom action’s verify TimestampAndSignature() function implements the above logic, throwing an error if the timestamp is missing, outside the accepted range, or the signature is invalid. In all cases, 403 Forbidden is returned to the caller.

Custom Action Deployment Options

The root directory of the backblaze-frameio GitHub repository contains three directories, comprising two different deployment options and a directory containing common code:

  • node-docker—generic: Node.js deployment
  • node-risingcloud: Rising Cloud deployment
  • backblaze-frameio-common: common code

The node-docker directory contains a generic Node.js implementation suitable for deployment on any Internet-addressable machine–for example, an Optimized Cloud Compute VM on Vultr. The app comprises an Express web service that handles requests from Frame.io, providing form responses to gather information from the user, and a worker task that the web service executes as a separate process to actually copy files between Frame.io and Backblaze B2.

You might be wondering why the web service doesn’t just do the work itself, rather than spinning up a separate process to do so. Well, media projects can contain dozens or even hundreds of files, containing a terabyte or more of data. If the web service were to perform the import or export, it would tie up resources and ultimately be unable to respond to Frame.io. Spinning up a dedicated worker process frees the web service to respond to new requests while the work is being done.

The downside of this approach is that you have to deploy the custom action on a machine capable of handling the peak expected load. The node-risingcloud implementation works identically to the generic Node.js app, but takes advantage of Rising Cloud’s serverless platform to scale elastically. A web service handles the form responses, then starts a task to perform the work. The difference here is that the task isn’t a process on the same machine, but a separate job running in Rising Cloud’s infrastructure. Jobs can be queued and new task instances can be started dynamically in response to rising workloads.

Note that since both Vultr and Rising Cloud are Backblaze Compute Partners, apps deployed on those platforms enjoy zero-cost downloads from Backblaze B2.

Customizing the Custom Action

We published the source code for the custom action to GitHub under the permissive MIT license. You are free to “use, copy, modify, merge, publish, distribute, sublicense, and/or sell copies of the Software” as long as you include the copyright notice and MIT permission notice when you do so.

At present, the user must supply the name of a file when importing an asset from Backblaze B2, but it would be straightforward to add code to browse the bucket and allow the user to navigate the file tree. Similarly, it would be straightforward to extend the custom action to allow the user to import a whole tree of files based on a prefix such as raw_footage/2022-09-07. Feel free to adapt the custom action to your needs; we welcome pull requests for fixes and new features!

The post Lights, Camera, Custom Action (Part Two): Inside Integrating Frame.io + Backblaze B2 appeared first on Backblaze Blog | Cloud Storage & Cloud Backup.

Relay Attack against Teslas

Post Syndicated from Bruce Schneier original https://www.schneier.com/blog/archives/2022/09/relay-attack-against-teslas.html

Nice work:

Radio relay attacks are technically complicated to execute, but conceptually easy to understand: attackers simply extend the range of your existing key using what is essentially a high-tech walkie-talkie. One thief stands near you while you’re in the grocery store, intercepting your key’s transmitted signal with a radio transceiver. Another stands near your car, with another transceiver, taking the signal from their friend and passing it on to the car. Since the car and the key can now talk, through the thieves’ range extenders, the car has no reason to suspect the key isn’t inside—and fires right up.

But Tesla’s credit card keys, like many digital keys stored in cell phones, don’t work via radio. Instead, they rely on a different protocol called Near Field Communication or NFC. Those keys had previously been seen as more secure, since their range is so limited and their handshakes with cars are more complex.

Now, researchers seem to have cracked the code. By reverse-engineering the communications between a Tesla Model Y and its credit card key, they were able to properly execute a range-extending relay attack against the crossover. While this specific use case focuses on Tesla, it’s a proof of concept—NFC handshakes can, and eventually will, be reverse-engineered.

[$] The perils of pinning

Post Syndicated from original https://lwn.net/Articles/907876/

Parts of the Rust language may look familiar to C programmers, but the two
languages differ in fundamental ways. One difference that turns out to be
problematic for kernel programming is the stability of data in memory — or
the lack thereof. A challenging session at the 2022 Kangrejos conference wrestled with
ways to deal with objects that should not be moved behind the programmer’s
back.

Using Cloudflare R2 as an apt/yum repository

Post Syndicated from Sudarsan Reddy original https://blog.cloudflare.com/using-cloudflare-r2-as-an-apt-yum-repository/

Using Cloudflare R2 as an apt/yum repository

Using Cloudflare R2 as an apt/yum repository

In this blog post, we’re going to talk about how we use Cloudflare R2 as an apt/yum repository to bring cloudflared (the Cloudflare Tunnel daemon) to your Debian/Ubuntu and CentOS/RHEL systems and how you can do it for your own distributable in a few easy steps!

I work on Cloudflare Tunnel, a product which enables customers to quickly connect their private networks and services through the Cloudflare global network without needing to expose any public IPs or ports through their firewall. Cloudflare Tunnel is managed for users by cloudflared, a tool that runs on the same network as the private services. It proxies traffic for these services via Cloudflare, and users can then access these services securely through the Cloudflare network.

Our connector, cloudflared, was designed to be lightweight and flexible enough to be effectively deployed on a Raspberry Pi, a router, your laptop, or a server running on a data center with applications ranging from IoT control to private networking. Naturally, this means cloudflared comes built for a myriad of operating systems, architectures and package distributions: You could download the appropriate package from our GitHub releases, brew install it or apt/yum install it (https://pkg.cloudflare.com).

In the rest of this blog post, I’ll use cloudflared as an example of how to create an apt/yum repository backed by Cloudflare’s object storage service R2. Note that this can be any binary/distributable. I simply use cloudflared as an example because this is something we recently did and actually use in production.

How apt-get works

Let’s see what happens when you run something like this on your terminal.

$ apt-get install cloudflared

Let’s also assume that apt sources were already added like so:

  $ echo 'deb [signed-by=/usr/share/keyrings/cloudflare-main.gpg] https://pkg.cloudflare.com/cloudflared buster main' | sudo tee /etc/apt/sources.list.d/cloudflared.list


$ apt-get update

From the source.list above, apt first looks up the Release file (or InRelease if it’s a signed package like cloudflared, but we will ignore this for the sake of simplicity).

A Release file contains a list of supported architectures and their md5, sha1 and sha256 checksums. It looks something like this:

$ curl https://pkg.cloudflare.com/cloudflared/dists/buster/Release
Origin: cloudflared
Label: cloudflared
Codename: buster
Date: Thu, 11 Aug 2022 08:40:18 UTC
Architectures: amd64 386 arm64 arm armhf
Components: main
Description: apt repository for cloudflared - buster
MD5Sum:
 c14a4a1cbe9437d6575ae788008a1ef4 549 main/binary-amd64/Packages
 6165bff172dd91fa658ca17a9556f3c8 374 main/binary-amd64/Packages.gz
 9cd622402eabed0b1b83f086976a8e01 128 main/binary-amd64/Release
 5d2929c46648ea8dbeb1c5f695d2ef6b 545 main/binary-386/Packages
 7419d40e4c22feb19937dce49b0b5a3d 371 main/binary-386/Packages.gz
 1770db5634dddaea0a5fedb4b078e7ef 126 main/binary-386/Release
 b0f5ccfe3c3acee38ba058d9d78a8f5f 549 main/binary-arm64/Packages
 48ba719b3b7127de21807f0dfc02cc19 376 main/binary-arm64/Packages.gz
 4f95fe1d9afd0124a32923ddb9187104 128 main/binary-arm64/Release
 8c50559a267962a7da631f000afc6e20 545 main/binary-arm/Packages
 4baed71e49ae3a5d895822837bead606 372 main/binary-arm/Packages.gz
 e472c3517a0091b30ab27926587c92f9 126 main/binary-arm/Release
 bb6d18be81e52e57bc3b729cbc80c1b5 549 main/binary-armhf/Packages
 31fd71fec8acc969a6128ac1489bd8ee 371 main/binary-armhf/Packages.gz
 8fbe2ff17eb40eacd64a82c46114d9e4 128 main/binary-armhf/Release
SHA1:
…
SHA256:
…

Depending on your system’s architecture, Debian picks the appropriate Packages location. A Packages file contains metadata about the binary apt wants to install, including location and its checksum. Let’s say it’s an amd64 machine. This means we’ll go here next:

$ curl https://pkg.cloudflare.com/cloudflared/dists/buster/main/binary-amd64/Packages
Package: cloudflared
Version: 2022.8.0
License: Apache License Version 2.0
Vendor: Cloudflare
Architecture: amd64
Maintainer: Cloudflare <[email protected]>
Installed-Size: 30736
Homepage: https://github.com/cloudflare/cloudflared
Priority: extra
Section: default
Filename: pool/main/c/cloudflared/cloudflared_2022.8.0_amd64.deb
Size: 15286808
SHA256: c47ca10a3c60ccbc34aa5750ad49f9207f855032eb1034a4de2d26916258ccc3
SHA1: 1655dd22fb069b8438b88b24cb2a80d03e31baea
MD5sum: 3aca53ccf2f9b2f584f066080557c01e
Description: Cloudflare Tunnel daemon

Notice the Filename field. This is where apt gets the deb from before running a dpkg command on it. What all of this means is the apt repository (and the yum repositories too) is basically a structured file system of mostly plaintext files and a deb.

The deb file is a Debian software package that contains two things: installable data (in our case, the cloudflared binary) and metadata about the installable.

Building our own apt repository

Now that we know what happens when an apt-get install runs, let’s work our way backwards to construct the repository.

Create a deb file out of the binary

Note: It is optional but recommended one signs the packages. See the section about how apt verifies packages here.

Debian files can be built by the dpkg-buildpackage tool in a linux or Debian environment. We use a handy command line tool called fpm (https://fpm.readthedocs.io/en/v1.13.1/) to do this because it works for both rpm and deb.

$ fpm -s <dir> -t deb -C /path/to/project -name <project_name> –version <version>

This yields a .deb file.

Create plaintext files needed by apt to lookup downloads

Again, these files can be built by hand, but there are multiple tools available to generate this:

We use reprepro.

Using it is as simple as

$ reprepro buster includedeb <path/to/the/deb>

reprepro neatly creates a bunch of folders in the structure we looked into above.

Upload them to Cloudflare R2

We use Cloudflare R2 to now be the host for this structured file system. R2 lets us upload and serve objects in this structured format. This means, we just need to upload the files in the same structure reprepro created them.

Here is a copyable example of how we do it for cloudflared.

Serve them from an R2 worker

For fine-grained control, we’ll write a very lightweight Cloudflare Worker to be the service we talk to and serve as the front-end API for apt to talk to. For an apt repository, we only need it to perform the GET function.

Here’s an example on how-to do this: https://developers.cloudflare.com/r2/examples/demo-worker/

Putting it all together

Here is a handy script we use to push cloudflared to R2 ready for apt/yum downloads and includes signing and publishing the pubkey.

And that’s it! You now have your own apt/yum repo without needing a server that needs to be maintained, there are no egress fees for downloads, and it is on the Cloudflare global network, protecting it against high request volumes. You can automate many of these steps to make it part of a release process.

Today, this is how cloudflared is distributed on the apt and yum repositories: https://pkg.cloudflare.com/

The collective thoughts of the interwebz