The end of the Red Hat security-announcements list

Post Syndicated from corbet original https://lwn.net/Articles/946851/

Red Hat has announced
that its longstanding “rhsa-announce” mailing list will be shut down on
October 10. That is the list that receives security advisories for
Red Hat Enterprise Linux and a whole slew of related products. Anybody who
was counting on that list for Red Hat security advisories will need to find
an alternative; a few options are listed in the announcement.

[$] The challenge of compiling for verified architectures

Post Syndicated from corbet original https://lwn.net/Articles/946254/

On its surface, the BPF virtual machine resembles many other computer
architectures; it has registers and instructions to perform the usual
operations. But there is a key difference: BPF programs must pass the
kernel’s verifier before they can be run. The verifier imposes a long list
of additional restrictions so that it can prove to itself that any given
program is safe to run; getting past those checks can be a source of
frustration for BPF developers. At the 2023 GNU Tools Cauldron,
José Marchesi looked at the problem of compiling for verified architectures
and how the compiler can generate code that will pass verification.

Security updates for Friday

Post Syndicated from jake original https://lwn.net/Articles/946848/

Security updates have been issued by Debian (grub2, libvpx, libx11, libxpm, and qemu), Fedora (firefox, matrix-synapse, tacacs, thunderbird, and xrdp), Oracle (glibc), Red Hat (bind, bind9.16, firefox, frr, ghostscript, glibc, ImageMagick, libeconf, python3.11, python3.9, and thunderbird), Scientific Linux (ImageMagick), SUSE (kernel, libX11, and tomcat), and Ubuntu (linux-hwe-5.15, linux-oracle-5.15).

Virtual networking 101: Bridging the gap to understanding TAP

Post Syndicated from Marek Majkowski original http://blog.cloudflare.com/virtual-networking-101-understanding-tap/

Virtual networking 101: Bridging the gap to understanding TAP

Virtual networking 101: Bridging the gap to understanding TAP

It's a never-ending effort to improve the performance of our infrastructure. As part of that quest, we wanted to squeeze as much network oomph as possible from our virtual machines. Internally for some projects we use Firecracker, which is a KVM-based virtual machine manager (VMM) that runs light-weight “Micro-VM”s. Each Firecracker instance uses a tap device to communicate with a host system. Not knowing much about tap, I had to up my game, however, it wasn't easy — the documentation is messy and spread across the Internet.

Here are the notes that I wish someone had passed me when I started out on this journey!

A tap device is a virtual network interface that looks like an ethernet network card. Instead of having real wires plugged into it, it exposes a nice handy file descriptor to an application willing to send/receive packets. Historically tap devices were mostly used to implement VPN clients. The machine would route traffic towards a tap interface, and a VPN client application would pick them up and process accordingly. For example this is what our Cloudflare WARP Linux client does. Here's how it looks on my laptop:

$ ip link list
...
18: CloudflareWARP: <POINTOPOINT,MULTICAST,NOARP,UP,LOWER_UP> mtu 1280 qdisc mq state UNKNOWN mode DEFAULT group default qlen 500
	link/none

$ ip tuntap list
CloudflareWARP: tun multi_queue

More recently tap devices started to be used by virtual machines to enable networking. The VMM (like Qemu, Firecracker, or gVisor) would open the application side of a tap and pass all the packets to the guest VM. The tap network interface would be left for the host kernel to deal with. Typically, a host would behave like a router and firewall, forward or NAT all the packets. This design is somewhat surprising – it's almost reversing the original use case for tap. In the VPN days tap was a traffic destination. With a VM behind, tap looks like a traffic source.

A Linux tap device is a mean creature. It looks trivial — a virtual network interface, with a file descriptor behind it. However, it's surprisingly hard to get it to perform well. The Linux networking stack is optimized for packets handled by a physical network card, not a userspace application. However, over the years the Linux tap interface grew in features and nowadays, it's possible to get good performance out of it. Later I'll explain how to use the Linux tap API in a modern way.

Virtual networking 101: Bridging the gap to understanding TAP
Source: DALL-E

To tun or to tap?

The interface is called "the universal tun/tap" in the kernel. The "tun" variant, accessible via the IFF_TUN flag, looks like a point-to-point link. There are no L2 Ethernet headers. Since most modern networks are Ethernet, this is a bit less intuitive to set up for a novice user. Most importantly, projects like Firecracker and gVisor do expect L2 headers.

"Tap", with the IFF_TAP flag, is the one which has Ethernet headers, and has been getting all the attention lately. If you are like me and always forget which one is which, you can use this  AI-generated rhyme (check out WorkersAI/LLama) to help to remember:

Tap is like a switch,
Ethernet headers it'll hitch.
Tun is like a tunnel,
VPN connections it'll funnel.
Ethernet headers it won't hold,
Tap uses, tun does not, we're told.

Listing devices

Tun/tap devices are natively supported by iproute2 tooling. Typically, one creates a device with ip tuntap add and lists it with ip tuntap list:

$ sudo ip tuntap add mode tap user marek group marek name tap0
$ ip tuntap list
tap0: tap persist user 1000 group 1000

Alternatively, it's possible to look for the /sys/devices/virtual/net/<ifr_name>/tun_flags files.

Tap device setup

To open or create a new device, you first need to open /dev/net/tun which is called a "clone device":

    /* First, whatever you do, the device /dev/net/tun must be
     * opened read/write. That device is also called the clone
     * device, because it's used as a starting point for the
     * creation of any tun/tap virtual interface. */
    char *clone_dev_name = "/dev/net/tun";
    int tap_fd = open(clone_dev_name, O_RDWR | O_CLOEXEC);
    if (tap_fd < 0) {
   	 error(-1, errno, "open(%s)", clone_dev_name);
    }

With the clone device file descriptor we can now instantiate a specific tap device by name:

    struct ifreq ifr = {};
    strncpy(ifr.ifr_name, tap_name, IFNAMSIZ);
    ifr.ifr_flags = IFF_TAP | IFF_NO_PI | IFF_VNET_HDR;
    int r = ioctl(tap_fd, TUNSETIFF, &ifr);
    if (r != 0) {
   	 error(-1, errno, "ioctl(TUNSETIFF)");
    }

If ifr_name is empty or with a name that doesn't exist, a new tap device is created. Otherwise, an existing device is opened. When opening existing devices, flags like IFF_MULTI_QUEUE must match with the way the device was created, or EINVAL is returned. It's a good idea to try to reopen the device with flipped multi queue setting on EINVAL error.

The ifr_flags can have the following bits set:

IFF_TAP / IFF_TUN

Already discussed.

IFF_NO_CARRIER

Holding an open tap device file descriptor sets the Ethernet interface CARRIER flag up. In some cases it might be desired to delay that until a TUNSETCARRIER call.

IFF_NO_PI

Historically each packet on tap had a "struct tun_pi" 4 byte prefix. There are now better alternatives and this option disables this prefix.

IFF_TUN_EXCL

Ensures a new device is created. Returns EBUSY if the device exists

IFF_VNET_HDR

Prepend "struct virtio_net_hdr" before the RX and TX packets, should be followed by setsockopt(TUNSETVNETHDRSZ).

IFF_MULTI_QUEUE

Use multi queue tap, see below.

IFF_NAPI / IFF_NAPI_FRAGS

See below.

You almost always want IFF_TAP, IFF_NO_PI, IFF_VNET_HDR flags and perhaps sometimes IFF_MULTI_QUEUE.

The curious IFF_NAPI

Judging by the original patchset introducing IFF_NAPI and IFF_NAPI_FRAGS, these flags were introduced to increase code coverage of syzkaller. However, later work indicates there were performance benefits when doing XDP on tap. IFF_NAPI enables a dedicated NAPI instance for packets written from an application into a tap. Besides allowing XDP, it also allows packets to be batched and GRO-ed. Otherwise, a backlog NAPI is used.

A note on buffer sizes

Internally, a tap device is just a pair of packet queues. It's exposed as a network interface towards the host, and a file descriptor, a character device, towards the application. The queue in the direction of application (tap TX queue) is of size txqueuelen packets, controlled by an interface parameter:

$ ip link set dev tap0 txqueuelen 1000
$ ip -s link show dev tap0
26: tap0: <BROADCAST,MULTICAST,UP,LOWER_UP> mtu 1500 ... qlen 1000
	RX:  bytes packets errors dropped  missed   mcast      	 
         	0   	0  	0   	0   	0   	0
	TX:  bytes packets errors dropped carrier collsns      	 
       	266   	3  	0  	66   	0   	0

In "ip link" statistics the column "TX dropped" indicates the tap application was too slow and the queue space exhausted.

In the other direction – interface RX queue –  from application towards the host, the queue size limit is measured in bytes and controlled by the TUNSETSNDBUF ioctl. The qemu comment discusses this setting, however it's not easy to cause this queue to overflow. See this discussion for details.

vnethdr size

After the device is opened, a typical scenario is to set up VNET_HDR size and offloads. Typically the VNETHDRSZ should be set to 12:

    len = 12;
    r = ioctl(tap_fd, TUNSETVNETHDRSZ, &(int){len});
    if (r != 0) {
   	 error(-1, errno, "ioctl(TUNSETVNETHDRSZ)");
    }

Sensible values are {10, 12, 20}, which are derived from virtio spec. 12 bytes makes room for the following header (little endian):

struct virtio_net_hdr_v1 {
#define VIRTIO_NET_HDR_F_NEEDS_CSUM  1    /* Use csum_start, csum_offset */
#define VIRTIO_NET_HDR_F_DATA_VALID  2    /* Csum is valid */
    u8 flags;
#define VIRTIO_NET_HDR_GSO_NONE      0    /* Not a GSO frame */
#define VIRTIO_NET_HDR_GSO_TCPV4     1    /* GSO frame, IPv4 TCP (TSO) */
#define VIRTIO_NET_HDR_GSO_UDP       3    /* GSO frame, IPv4 UDP (UFO) */
#define VIRTIO_NET_HDR_GSO_TCPV6     4    /* GSO frame, IPv6 TCP */
#define VIRTIO_NET_HDR_GSO_UDP_L4    5    /* GSO frame, IPv4& IPv6 UDP (USO) */
#define VIRTIO_NET_HDR_GSO_ECN       0x80 /* TCP has ECN set */
    u8 gso_type;
    u16 hdr_len;     /* Ethernet + IP + tcp/udp hdrs */
    u16 gso_size;    /* Bytes to append to hdr_len per frame */
    u16 csum_start;
    u16 csum_offset;
    u16 num_buffers;
};

offloads

To enable offloads use the ioctl:

    unsigned off_flags = TUN_F_CSUM | TUN_F_TSO4 | TUN_F_TSO6;
    int r = ioctl(tap_fd, TUNSETOFFLOAD, off_flags);
    if (r != 0) {
   	 error(-1, errno, "ioctl(TUNSETOFFLOAD)");
    }

Here are the allowed bit values. They confirm that the userspace application can receive:

TUN_F_CSUM

L4 packet checksum offload

TUN_F_TSO4

TCP Segmentation Offload – TSO for IPv4 packets

TUN_F_TSO6

TSO for IPv6 packets

TUN_F_TSO_ECN

TSO with ECN bits

TUN_F_UFO

UDP Fragmentation offload – UFO packets. Deprecated

TUN_F_USO4

UDP Segmentation offload – USO for IPv4 packets

TUN_F_USO6

USO for IPv6 packets

Generally, offloads are extra packet features the tap application can deal with. Details of the offloads used by the sender are set on each packet in the vnethdr prefix.

Checksum offload TUN_F_CSUM

Virtual networking 101: Bridging the gap to understanding TAP
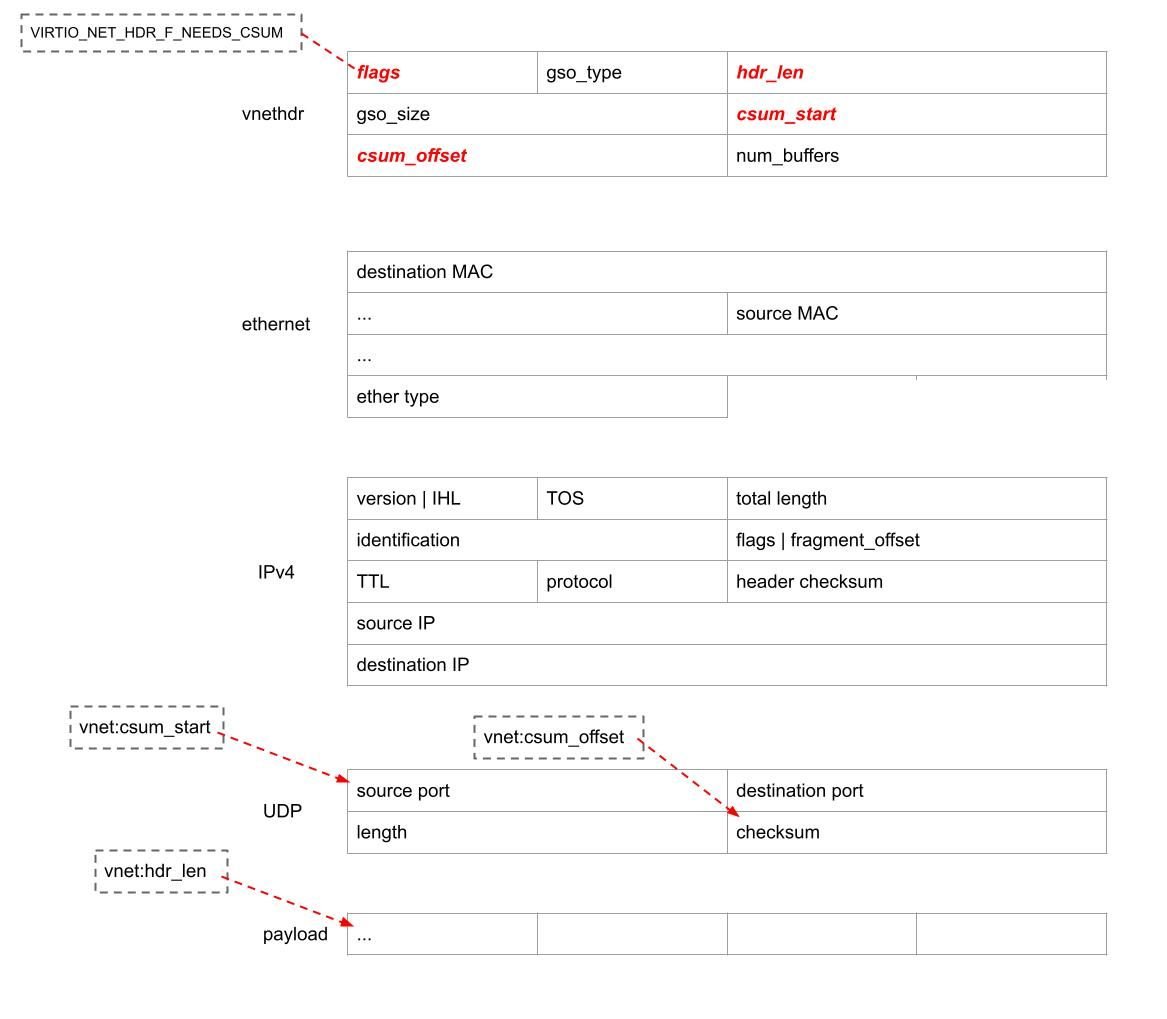
Structure of a typical UDP packet received over tap.

Let's start with the checksumming offload. The TUN_F_CSUM offload saves the kernel some work by pushing the checksum processing down the path. Applications which set that flag are indicating they can handle checksum validation. For example with this offload, for UDP IPv4 packet will have:

  • vnethdr flags will have VIRTIO_NET_HDR_F_NEEDS_CSUM set
  • hdr_len would be 42 (14+20+8)
  • csum_start 34 (14+20)
  • and csum_offset 6 (UDP header checksum is 6 bytes into L4)

This is illustrated above.

Supporting checksum offload is needed for further offloads.

TUN_F_CSUM is a must

Consider this code:

s = socket(AF_INET, SOCK_DGRAM)
s.setsockopt(SOL_UDP, UDP_SEGMENT, 1400)
s.sendto(b"x", ("10.0.0.2", 5201))     # Would you expect EIO ?

This simple code produces a packet. When directed at a tap device, this code will surprisingly yield an EIO "Input/output error". This weird behavior happens if the tap is opened without TUN_F_CSUM and the application is sending GSO / UDP_SEGMENT frames. Tough luck. It might be considered a kernel bug, and we're thinking about fixing that. However, in the meantime everyone using tap should just set the TUN_F_CSUM bit.

Segmentation offloads

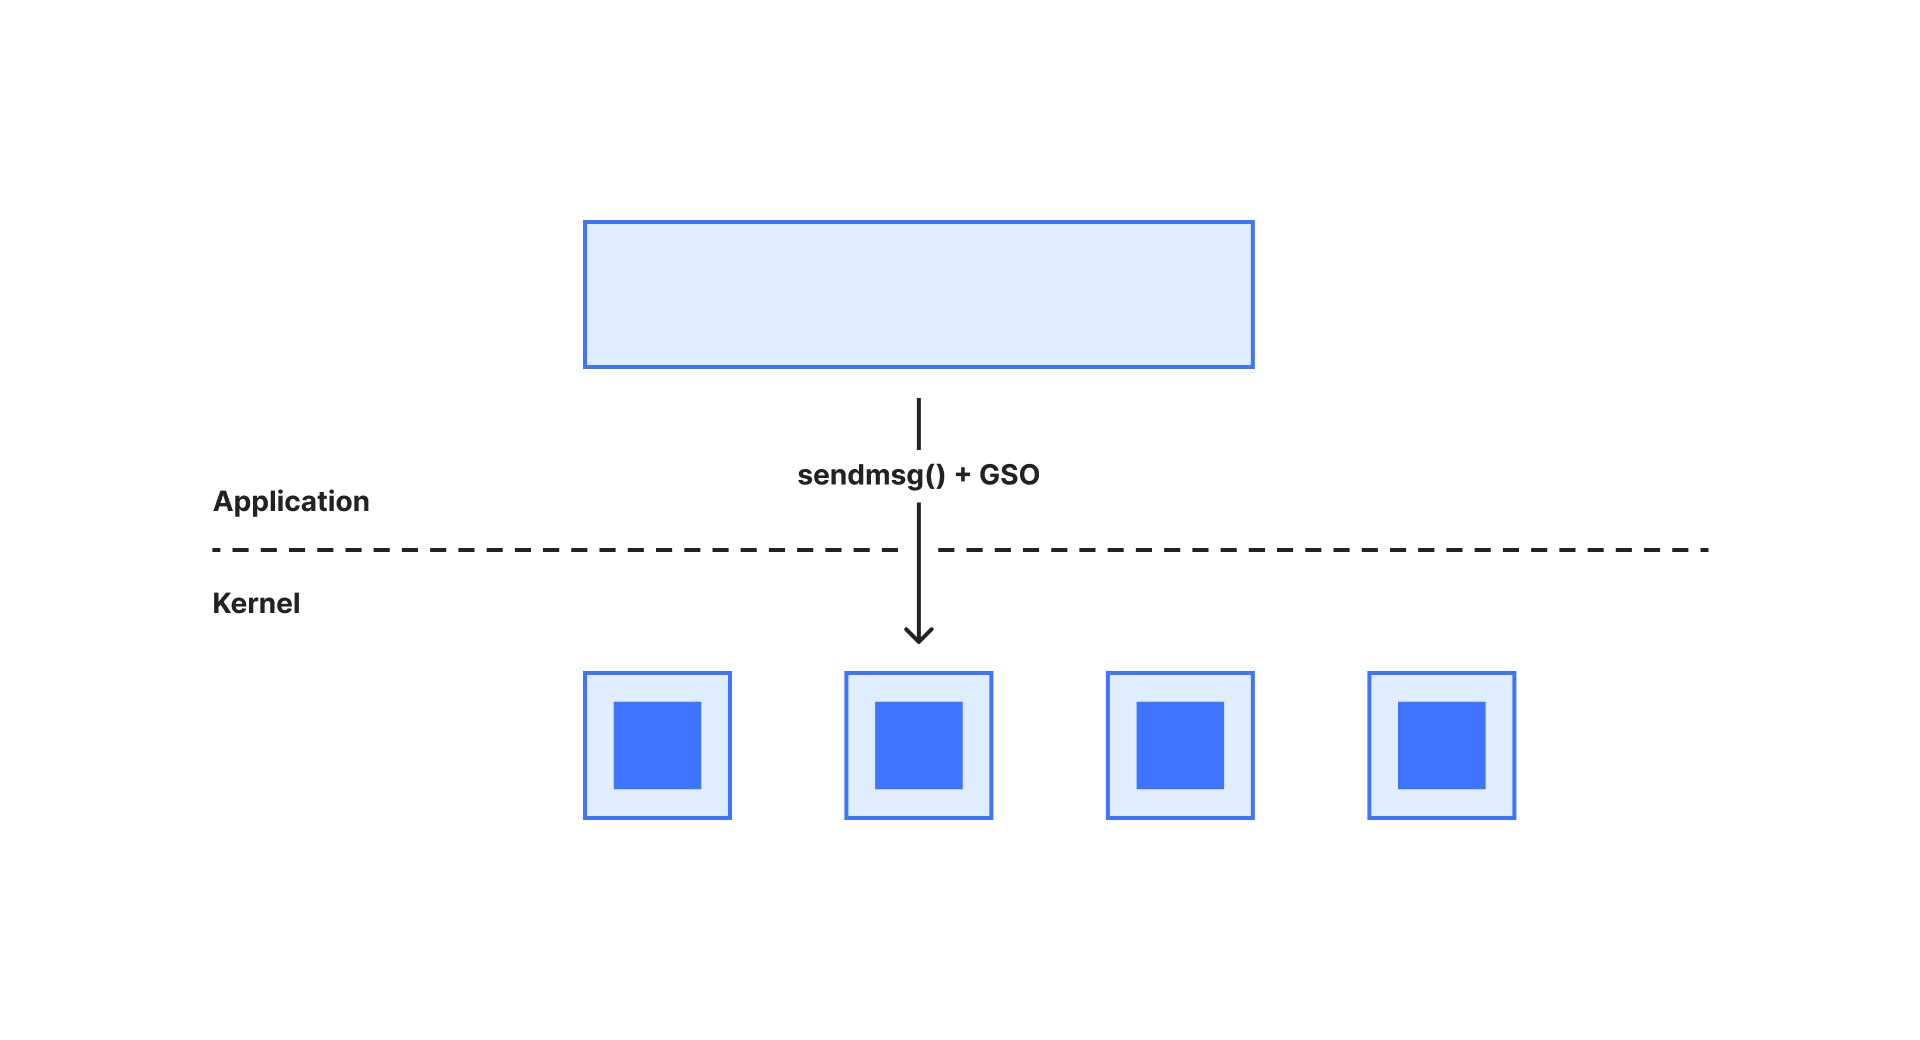
We wrote about UDP_SEGMENT in the past. In short: on Linux an application can handle many packets with a single send/recv, as long as they have identical length.

Virtual networking 101: Bridging the gap to understanding TAP
With UDP_SEGMENT a single send() can transfer multiple packets.

Tap devices support offloading which exposes that very functionality. With TUN_F_TSO4 and TUN_F_TSO6 flags the tap application signals it can deal with long packet trains. Note, that with these features the application must be ready to receive much larger buffers – up to 65507 bytes for IPv4 and 65527 for IPv6.

TSO4/TSO6 flags are enabling long packet trains for TCP and have been supported for a long time. More recently TUN_F_USO4 and TUN_F_USO6 bits were introduced for UDP. When any of these offloads are used, the gso_type contains the relevant offload type and gso_size holds a segment size within the GRO packet train.

TUN_F_UFO is a UDP fragmentation offload which is deprecated.

By setting TUNSETOFFLOAD, the application is telling the kernel which offloads it's able to handle on the read() side of a tap device. If the ioctl(TUNSETOFFLOAD) succeeds, the application can assume the kernel supports the same offloads for packets in the other direction.

Bug in rx-udp-gro-forwarding – TUN_F_USO4

When working with tap and offloads it's useful to inspect ethtool:

$ ethtool -k tap0 | egrep -v fixed
tx-checksumming: on
    tx-checksum-ip-generic: on
scatter-gather: on
    tx-scatter-gather: on
    tx-scatter-gather-fraglist: on
tcp-segmentation-offload: on
    tx-tcp-segmentation: on
generic-segmentation-offload: on
generic-receive-offload: on
tx-udp-segmentation: on
rx-gro-list: off
rx-udp-gro-forwarding: off

With ethtool we can see the enabled offloads and disable them as needed.

While toying with UDP Segmentation Offload (USO) I've noticed that when packet trains from tap are forwarded to a real network interface, sometimes they seem badly packetized. See the netdev discussion, and the proposed fix. In any case – beware of this bug, and maybe consider doing "ethtool -K tap0 rx-udp-gro-forwarding off".

Miscellaneous setsockopts

TUNGETFEATURES

Return vector of IFF_* constants that the kernel supports. Typically used to detect the host support of: IFF_VNET_HDR, IFF_NAPI and IFF_MULTI_QUEUE.

TUNSETIFF

Takes "struct ifreq", sets up a tap device, fills in the name if empty.

TUNGETIFF

Returns a "struct ifreq" containing the device's current name and flags.

TUNSETPERSIST

Sets TUN_PERSIST flag, if you want the device to remain in the system after the tap_fd is closed.

TUNSETOWNER, TUNSETGROUP

Set uid and gid that can own the device.

TUNSETLINK

Set the Ethernet link type for the device. The device must be down. See ARPHRD_* constants. For tap it defaults to ARPHRD_ETHER.

TUNSETOFFLOAD

As documented above.

TUNGETSNDBUF, TUNSETSNDBUF

Get/set send buffer. The default is INT_MAX.

TUNGETVNETHDRSZ, TUNSETVNETHDRSZ

Already discussed.

TUNSETIFINDEX

Set interface index (ifindex), useful in checkpoint-restore.

TUNSETCARRIER

Set the carrier state of an interface, as discussed earlier, useful with IFF_NO_CARRIER.

TUNGETDEVNETNS

Return an fd of a net namespace that the interface belongs to.

TUNSETTXFILTER

Takes "struct tun_filter" which limits the dst mac addresses that can be delivered to the application.

TUNATTACHFILTER, TUNDETACHFILTER, TUNGETFILTER

Attach/detach/get classic BPF filter for packets going to application. Takes "struct sock_fprog".

TUNSETFILTEREBPF

Set an eBPF filter on a tap device. This is independent of the classic BPF above.

TUNSETQUEUE

Used to set IFF_DETACH_QUEUE and IFF_ATTACH_QUEUE for multiqueue.

TUNSETSTEERINGEBPF

Set an eBPF program for selecting a specific tap queue, in the direction towards the application. This is useful if you want to ensure some traffic is sticky to a specific application thread. The eBPF program takes "struct __sk_buff" and returns an int. The result queue number is computed from the return value u16 modulo number of queues is the selection.

Single queue speed

Tap devices are quite weird — they aren't network sockets, nor true files. Their semantics are closest to pipes, and unfortunately the API reflects that. To receive or send a packet from a tap device, the application must do a read() or write() syscall, one packet at a time.

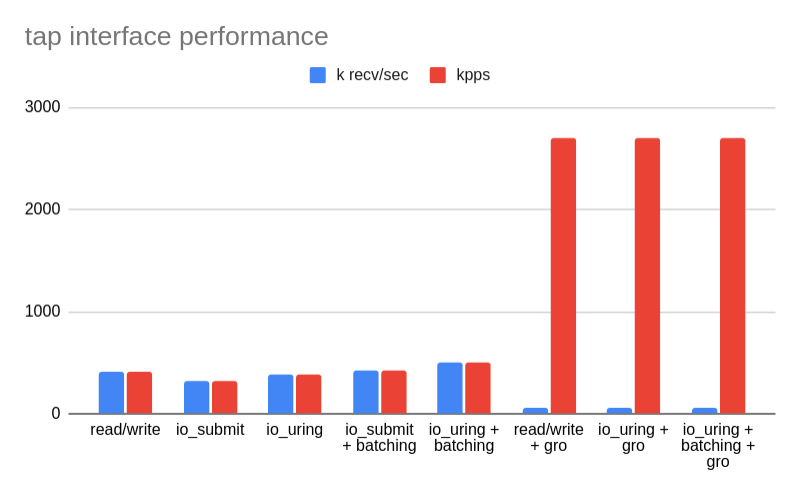
One might think that some sort of syscall batching would help. Sockets have sendmmsg()/recvmmsg(), but that doesn't work on tap file descriptors. The typical alternatives enabling batching are: an old io_submit AIO interface, or modern io_uring. Io_uring added tap support quite recently. However, it turns out syscall batching doesn't really offer that much of an improvement. Maybe in the range of 10%.

The Linux kernel is just not capable of forwarding millions of packets per second for a single flow or on a single CPU. The best possible solution is to scale vertically for elephant flows with TSO/USO (packet trains) offloads, and scale horizontally for multiple concurrent flows with multi queue.

Virtual networking 101: Bridging the gap to understanding TAP

In this chart you can see how dramatic the performance gain of offloads is. Without them, a sample "echo" tap application can process between 320 and 500 thousand packets per second on a single core. MTU being 1500. When the offloads are enabled it jumps to 2.7Mpps, while keeping the number of received "packet trains" to just 56 thousand per second. Of course not every traffic pattern can fully utilize GRO/GSO. However, to get decent performance from tap, and from Linux in general, offloads are absolutely critical.

Multi queue considerations

Multi queue is useful when the tap application is handling multiple concurrent flows and needs to utilize more than one CPU.

To get a file descriptor of a tap queue, just add the IFF_MULTI_QUEUE flag when opening the tap. It's possible to detach/reattach a queue with TUNSETQUEUE and IFF_DETACH_QUEUE/IFF_ATTACH_QUEUE, but I'm unsure when this is useful.

When a multi queue tap is created, it spreads the load across multiple tap queues, each one having a unique file descriptor. Beware of the algorithm selecting the queue though: it might bite you back.

By default, Linux tap driver records a symmetric flow hash of any handled flow in a flow table. It saves on which queue the traffic from the application was transmitted. Then, on the receiving side it follows that selection and sends subsequent packets to that specific queue. For example, if your userspace application is sending some TCP flow over queue #2, then the packets going into the application which are a part of that flow will go to queue #2. This is generally a sensible design as long as the sender is always selecting one specific queue. If the sender changes the TX queue, new packets will immediately shift and packets within one flow might be seen as reordered. Additionally, this queue selection design does not take into account CPU locality and might have minor negative effects on performance for very high throughput applications.

It's possible to override the flow hash based queue selection by using tc multiq qdisc and skbedit queue_mapping filter:

tc qdisc add dev tap0 root handle 1: multiq
tc filter add dev tap0 parent 1: protocol ip prio 1 u32 \
        match ip dst 192.168.0.3 \
        action skbedit queue_mapping 0

tc is fragile and thus it's not a solution I would recommend. A better way is to customize the queue selection algorithm with a TUNSETSTEERINGEBPF eBPF program. In that case, the flow tracking code is not employed anymore. By smartly using such a steering eBPF program, it's possible to keep the flow processing local to one CPU — useful for best performance.

Summary

Now you know everything I wish I had known when I was setting out on this journey!

To get the best performance, I recommend:

  • enable vnethdr
  • enable offloads (TSO and USO)
  • consider spreading the load across multiple queues and CPUs with multi queue
  • consider syscall batching for additional gain of maybe 10%, perhaps try io_uring
  • consider customizing the steering algorithm

References:

Deepfake Election Interference in Slovakia

Post Syndicated from Bruce Schneier original https://www.schneier.com/blog/archives/2023/10/deepfake-election-interference-in-slovakia.html

Well designed and well timed deepfake or two Slovakian politicians discussing how to rig the election:

Šimečka and Denník N immediately denounced the audio as fake. The fact-checking department of news agency AFP said the audio showed signs of being manipulated using AI. But the recording was posted during a 48-hour moratorium ahead of the polls opening, during which media outlets and politicians are supposed to stay silent. That meant, under Slovakia’s election rules, the post was difficult to widely debunk. And, because the post was audio, it exploited a loophole in Meta’s manipulated-media policy, which dictates only faked videos—­where a person has been edited to say words they never said­—go against its rules.

I just wrote about this. Countries like Russia and China tend to test their attacks out on smaller countries before unleashing them on larger ones. Consider this a preview to their actions in the US next year.

Българският Левиатан в сглобка

Post Syndicated from Емилия Милчева original https://www.toest.bg/bulgarskiyat-leviatan-v-sglobka/

Българският Левиатан в сглобка

Ако всичко в политиката върви, както върви – по мед, Пеевски и Борисов, – на 6 март догодина правителството с мандат на ПП–ДБ и премиер акад. Николай Денков (ПП) ще се ротира с кабинет с премиер Мария Габриел (ГЕРБ), (няколко) министри от ГЕРБ и подкрепа от парламентарно мнозинство, дирижирано от ГЕРБ и ДПС. Водачът на ГЕРБ Бойко Борисов вече изрече гласно онова, за което се догаждахме още при договарянето на ротацията – министри, които не са се справили, ще бъдат сменени.

Обществото имаше нужда от нов обществен договор, основан на върховенство на правото, морал в политиката и жизнеспособна демокрация с активни граждани, а получи Левиатан – лидера на ГЕРБ и лидера в сянка на ДПС, които не са в затвора.

Лозунги? Пропагандни внушения?

Избелване, официализиране, приемане

Ами ето го Борисов, необезпокояван от никого, който казва как

Пеевски проведе реално преговорите с протестиращите [миньори и енергетици – б.а.] и ги доведе до успешен край, колкото и да не се харесва на умнокрасивитета.

Три години по-рано го беше нарекъл „Шиши, който нареди [първия служебен – б.а.] кабинет на президента“, а допреди това изобщо избягваше да го назовава – въпреки че свързвани с Пеевски бизнеси печелеха многомилионни обществени поръчки. Имат и една и съща пъпна връв – политическият път и на двамата тръгна от НДСВ. На Пеевски – като учредител на младежкото НДСВ, на Борисов – като охранител на Царя и по-късно главен секретар на МВР.

Парламентарният съюз, придобил вицовия етикет „сглобка“, освен че избелва публичния образ на Борисов и Пеевски, публично узаконява и отдавнашната им връзка, за която първият отричаше, а вторият мълчеше. Стори и нещо повече от избелването – направи и двамата обществено приемливи заради значимостта, която придобиват в парламентарната власт, най-високата по конституция. Същата тази власт и двамата игнорираха дълги години – единият не стъпваше в парламента, макар и депутат, другият избягваше, макар и премиер.

Конституционното мнозинство, чийто формат официално ги съеши, досега е произвело промени с неясно бъдеще, критикувани от всички юридически общности и съюзи. От някои от тях, като 24 май за национален празник, ГЕРБ и ДПС дружно се отказаха. Засега е ясно, че след приемането им промените ще бъдат отнесени до Конституционния съд, който да се произнесе дали преструктурирането на Висшия съдебен съвет и др. могат да се извършат от Обикновено народно събрание.

А „умнокрасивитетът“ е същият, заради който Бойко Борисов се отказа от първия мандат след изборите на 2 април, подкрепи създаването на кабинет с втория и накрая се оказа, че го е вкарал във вълчи капан. Колкото повече се бориш с капана, толкова повече се забива в тялото. Дори и с факта, че управлението на кабинета „Денков“ приключва през март, но времето на бъдещото правителство с министър-председател Габриел не е лимитирано.

Сегашната ситуация е дори по-изгодна за ГЕРБ и ДПС, отколкото ако управляваха заедно в изпълнителната власт. Първо, не трупат публични негативи за едно или друго решение. Второ, не носят отговорност, но се сдобиват с позиции в регулатори. И трето, което е най-важното – тяхната сглобка в сглобката парира опитите за малки промени. (За по-значими няма нито политическа воля от всички страни, нито капацитет.)

Например отпадането на намалената ставка от 9% ДДС за ресторантьорите, въведена от ГЕРБ по време на пандемията от COVID-19, отшумяла преди повече от година. Или продължаването на забраната за внос на селскостопанска продукция от Украйна, основно слънчоглед, докато земеделци и преработватели в България не се разберат за квоти – а междувременно за зърнопроизводителите, най-субсидираните земеделци у нас, бяха излети нови милиони.

Съпротивата на ГЕРБ осуети и предложението на ПП–ДБ частните болници да провеждат обществени поръчки за доставка на лекарства и лекарствени средства, както го правят държавните и общинските. Тази неравнопоставеност, която дава конкурентни предимства на частните болници, е заложена от години и макар да е известна, не е поправена. Това позволява на големи частни болници, които използват собствени дистрибутори, да ценообразуват, както намерят за добре. НЗОК после заплаща лекарствата и на едните, и на другите със средствата от здравните осигуровки.

От години срещу България има наказателна процедура от ЕК, че не спазваме правото на Съюза, за което ние ще плащаме от нашите джобове като данъкоплатци съответните санкции.

Това обясни доц. Васил Пандов от ПП. Напразно – ГЕРБ с помощта на „Възраждане“ отхвърли предложението, зад което има бизнес за няколко милиарда.

В ситуация на висок геополитически риск ГЕРБ и ДПС вършат онова, което европейските и евроатлантическите партньори на България очакват – гласуват оръжие за Украйна и не кривват от ангажиментите към съюзниците. Все пак и двете партии са членове на европейски политически семейства, които недвусмислено осъждат руската агресия.

Но когато става въпрос за вътрешнополитически теми и свързаните с тях интереси, правят онова, което са правили и преди – брокери на влияние, защитници на статуквото и на мафиотизирано правораздаване. Пример за това са спецслужбите и демонстрираният отказ да се извършат каквито и да било промени, което означава, че ще ги оставят със селектираните от президента Румен Радев началници.

Има за какво да му се отблагодаряват – служебните кабинети на Радев върнаха немалко кадри на ГЕРБ във властта, а схеми на ДПС бяха запазени. Но и правителството на Денков запази президентски назначения, при това в ресурсни институции като ДФ „Земеделие“ (ДФЗ), който разпределя годишно над 3 милиарда. Така, след като избраният от „Промяната“ за шеф Камен Диков се оттегли, начело на ДФЗ е Георги Тахов, назначение на първото служебно правителство на Гълъб Донев. Един от заместниците му е бивш депутат от БСП – Димитър Горов, а друг – 37-годишната Ива Иванова, също е на поста още от служебното управление, при това запазвайки тогавашните си ресори – Програмата за развитие на селските райони 2014–2020 и Програмата за морско дело и рибарство 2014–2020, които са с най-много средства и интересите към тях са най-големи.

Неуспелият да оглави ДФЗ Диков, който е и бивш шеф на „Напоителни системи“, бе монтиран начело на Националната компания „Железопътна инфраструктура“ – макар и без опит в железниците. А от квотата на ДПС там влезе бившият военен контраразузнавач и щатен сътрудник на Държавна сигурност о.р. полк. Васко Балабанов.

Така, макар да се водят партньори „само“ в конституционното мнозинство, ДПС тихомълком се уреждат с места в бордове и регулатори като БНБ. Официално обяснение за това от лидерите на ПП–ДБ няма. Няма и регламент за назначенията, какъвто, по думите на Борисов, трябваше да изготви Христо Иванов.

Няма съмнение, че в тричленното ръководство на новата Комисия за противодействие на корупцията ще има представител на ДПС, освен на ГЕРБ и ПП. (Къде ли е ДБ…?)

Облекчена структура, трима човека да е управлението, изключително независим директор на дирекция с големи правомощия, да може да сезира директно двете прокуратури – и българската, и европейската без Комисията, което показва, че има независим човек и цедка – някой, който да може да обира сигналите.

Хвалебствията са откъм Пеевски за новоприетия закон, по който никой от ДБ не отрони дума при второто му четене в пленарната зала. Е, нищо чудно ДПС да се цели именно в този „изключително независим директор“ и да извади свой стаен кадър.

Денков – самотен бегач

Така Борисов и Пеевски управляват, без да управляват, при това в любимата на почетния председател на ДПС Ахмед Доган „заедност“. Паралелно с това ГЕРБ обстрелват правителството на ПП–ДБ с повече от приятелски огън, а вместо парламентарната група на ПП–ДБ да подкрепи активно министрите си, се е снишила. При протестите на зърнопроизводителите парламентарната група на ПП–ДБ и нейните лидери, което ще рече председателите на партиите в коалицията, оставиха на правителството и персонално на премиера Денков да се справя с първата сериозна криза. Разбира се, „подпомогнат“ от Борисов и неговия апарат в лицето на бившия земеделски министър Десислава Танева, която оглавява и парламентарната Земеделска комисия, а заместници са ѝ депутати от ДПС и от ПП.

Зърнопроизводителите плашеха с „хляба на България“, миньорите и енергетиците – със „загуба на енергийната независимост“. „Хляб и ток“, ключови послания, както отбеляза по БНР социоложката Елена Дариева, а „нещата се форматираха много добре“ – както обобщи Пеевски след срещата с енергетиците в парламента.

Неслучайно мястото на срещата, променяно няколко пъти, в крайна сметка бе определено да е там – при Пеевски и Борисов, управляващи диалога за българския енергиен преход и „услужливо самопоканили се, за да покажат, че ще ги решат“ (по евродепутата Радан Кънев). Единствено Кънев публично заяви по националното радио, че за никого не са тайна влиянието на Пеевски и кръга край него върху ТЕЦ „Марица-изток 2“, назначенията там и обществените поръчки, както и връзките между друг мастит собственик във въглищната енергетика – Христо Ковачки, и ДПС. Затова и Ковачки и офшорките – собственици на бизнеса му, са големият печеливш от протестите.

На правителството на Денков се падна да решава проблем, голям колкото няколко хиляди човешки съдби, гарниран с опасен за дишане въздух и хиляди декари за рекултивация, нерешен от предишните управления на ГЕРБ и съучастниците им от ДПС. Приносът на енергийния министър Румен Радев в преговорите с протестиращите обаче не се открои, независимо че самият Радев е от Стара Загора, работил е като координатор на проекта за водородна долина (ZAHYR) и е участвал в развитието и популяризирането на водородните технологии в България.

Но балансираният подход на премиера Денков при сблъсъка с толкова социални трусове и протести беше оценен. Министър-председателят говори сдържано и честно, независимо от цената, която плаща. Не той обаче, а парламентарната сглобка определя назначенията и посоката на развитие на протести и каквито и да било реформи.

Изявлението на Борисов, че няма да сваля правителството (тоест ГЕРБ няма да оттегли подкрепата си), означава, че до ротацията ще има контролирани трусове. По-силни от приятелски огън, но по-слаби от разрушения. Ако ГЕРБ и ДПС не пропускат законодателни предложения, като обществените поръчки за частните болници, какво ли ще сполети конституционните промени? Чака се ротацията – дали ще надделее реалната, или формалната сглобка и това ще покаже колко дълго още ще живее българският Левиатан. В един руски филм не успяха да го убият.

Архитектура и климатични промени: От Венеция, през Атланта, до Ню Йорк

Post Syndicated from Анета Василева original https://www.toest.bg/arhitektura-i-klimatichni-promeni-ot-venetsiya-prez-atlanta-do-nyu-york/

Архитектура и климатични промени: От Венеция, през Атланта, до Ню Йорк

Пиша този текст в Бруклин по време на потоп. На 29 септември сутринта в Ню Йорк само за три часа падна едномесечно количество дъжд, който наводни метрото и улиците на Манхатън, Бруклин, Куинс, спря влакове, блокира улици и летища, канализацията преля, а губернаторът на щата обяви извънредно положение. Тропическата буря „Офелия“ продължава вече няколко дни по Източното крайбрежие на САЩ.

Това се случва след катастрофалните наводнения на 10 и 11 септември в Либия с хиляди жертви, както и след поройните дъждове, съсипали Северна Гърция, Турция и Югоизточна България. Град Аризона в щата Финикс, САЩ, преживя 31 последователни дни с температури над 43ºС – нечуван рекорд, а в щата Джорджия, където прекарах по-голямата част от месец август, бяха отбелязани най-горещият юни и най-горещият юли изобщо в статистиката. Колко горещо беше във Финикс? Толкова, че беше опасно да се пипа метален парапет, а водата от градинския маркуч можеше да те изгори. Тротоарите се нагряваха до над 70ºС, а децата получаваха изгаряния втора степен, ако излезеха боси на балкона.

След екстремните горещини и пожарите очаквано дойдоха и наводненията.

Небето е като гъба,

коментираха още на 5 септември в подкаста The Ezra Klein Show на „Ню Йорк Таймс“. То поема изпаряващата се влага от горещата земя и затоплените океани и после я връща обратно не равномерно, а като катастрофални изливания.

Какво научихме обаче от това лято на рекордни температури и природни катаклизми?

В треперещия от жега въздух на август шестлентовите магистрали на американския Юг бяха пълни с коли, обикновено бензинови. Във всяка кола – не повече от един човек, запътил се към някоя тежко климатизирана сграда, в която живее или работи. Неизолираните къщи на американските предградия, със своите милиони квадратни метри застроена площ и лоша дограма, огромните халета на американските хипермаркети, малкото наличен градски транспорт, дори кината поддържаха изкуствено температури близо 20 градуса по-ниски от външните. Топлинните острови в корпоративния център бяха непоносими. А усещането беше, че въглеродният отпечатък на град Атланта примерно за ден е колкото този на България, и то преди у нас да са спрели въглищните централи. Впрочем това потвърди пред мен и Джоузеф Хийткот, декан на Факултета по урбанизъм и околна среда на The New School в Ню Йорк.

Имат ли какво да кажат архитектурата и изкуствата по темата?

За климата от Венеция

Линеен климатизиран град в пустинята, „Ловци в снега“ на Брьогел или традицията за охлаждане чрез зеленина и водни огледала на андалуските вътрешни дворове – има много начини, по които да говорим за климатичните промени през изкуство и архитектура. А Венеция е добър декор за подобен разговор – град, застинал в крехката си красота, фатално заплашен от постоянно повишаващите се водни нива, ужасно горещ през лятото.

В края на ноември приключва 18-тото Архитектурно биенале във Венеция. Климатът не е основна тема тази година, но присъства осезаемо в няколко ярко контрастни изложби и си струва да бъде обсъден именно след лятото на 2023-та с най-горещите средни температури, измерени на Земята, откогато се води статистика.

През май британската архитектка от ганайски произход Лесли Локо стана първата цветнокожа жена куратор на този най-престижен архитектурен форум в света и призова целия свят да мисли за бъдещето през темата Африка – най-младия континент, който може да се окаже една „Лаборатория на бъдещето“. Доколко биеналето успя да постигне това (по-скоро не), е тема за друг текст. Но съдбата на планетата, а и на обществото ни, включително през дебатите за климата, също е незаобиколима част от тази лаборатория, от общото ни бъдеще.

Everybody talks about the weather

Така че не е лошо да поговорим за времето – както правим всъщност всеки ден и както ни предлага кураторът Дитер Ролщрете в едноименната изложба в палацо Ca’ Corner della Regina – пространството на Фондация „Прада“ във Венеция.

Сградата сама по себе си е великолепен експонат – бароков венециански дворец, построен между 1724 и 1728 г. за фамилия Корнер от Сан Касиано. За изложбите си Фондация „Прада“ използва първите три етажа след внимателна реставрация, включително на всички детайли, мазилки и стенописи.

Венеция е обречена. До 75 години града вече няма да го има и всичко ще е под вода, включително тази сграда тук,

казва обаче Ролщрете. Надвисналият риск и неизбежността на разрухата ясно се четат като умишлено послание в цялата изложба. Въпросът е как през изкуството да осъзнаем огромното влияние на климата не само за ежедневието ни, но и исторически, глобално и за развитието на цивилизацията въобще.

На входа ни посреща стена от екрани, на които се излъчват телевизионни прогнози за времето по цял свят. На първия етаж преминаваме през лабиринт от табла, където статистически данни за екстремни изменения на климата на планетата през вековете са сложени редом до известни картини, които всъщност ги изобразяват. През 1565 г. Брьогел рисува вече споменатите „Ловци в снега“ по време на т.нар. малка ледникова епоха, когато температурите на Земята падат рязко с няколко градуса. Това води до особено тежки зими, поредица от лоши реколти, глад и в крайна сметка до драматична глобална криза, която бележи времето между средата на XVI и средата на XVII век.

Немският романтик Каспар Давид Фридрих рисува прословутата си картина „Море от лед“ като отражение на общото мрачно настроение, обхванало Европа след т.нар. година без лято. През 1815 г. избухването на вулкана Тамбора в Индонезия изпраща такова голямо количество вулканичен прах в атмосферата на Земята, че небето потъмнява за една година, температурите падат, а мрачното време и валежите бележат цялото лято на 1816 г. Същото лято, в което Мери Шели пише „Франкенщайн“ като отговор на предизвикателството на Байрон кой ще измисли най-мрачната призрачна история, докато цялата компания стои затворена с месеци в къща на брега на Женевското езеро в непрестанен дъжд.

Изложбата продължава с повече от 500 книги, видеоматериали и интервюта за климата и климатичните промени. Както и с няколко антиутопични сценария, които всеки трябва да види, прочете и изживее сам за себе си.

Град на бъдещето или антиутопичен кошмар

Всъщност именно една антиутопия, представена като успешна рецепта за бъдещето, е контрапункт на изложбата във Фондация „Прада”.

The Line е проект за 170-километров линеен град, който вече се изгражда в пустините на Саудитска Арабия и се рекламира като бъдещето на урбанизма. На места изцяло климатизираната структура достига 500 метра височина и предлага суперкомпактен модел на обитаване, при който в даден момент 80 000 души ще бъдат на 5 минути пешеходно разстояние от всичко необходимо. The Line може да събере 9 млн. души върху 2% от обичайната градска територия, която би била необходима за такова население. Така земята остава свободна – а хората оставят минимален отпечатък, скрити зад половинкилометрови стени в едно от най-горещите места на планетата. Разбира се, според авторите на проекта животът в града ще бъде поддържан от възобновяема енергия и ще произвежда водата и храната си изцяло устойчиво.

Изложбата на проекта във Венеция се проведе отново успоредно с Биеналето в Abbazia di San Gregorio и показа колко много и все големи световни архитекти са склонни да захвърлят доброто си име и да работят за материализирането на една рециклирана визия за бъдещето, продукт на архитектурните утопии на ХХ в., която през XXI в. изглежда абсурдно безотговорно. Устойчивото бъдеще на градовете на Земята със сигурност няма да се построи, спонсорирано от петролни долари и с очевидно спекулативни инвестиционни намерения. А животът в този линеен град, визуализиран с макети и видеа, генерирани сякаш от AI, изглежда плашещо антиутопичен. Живот на една планета, в която природата е тотално разрушена и човечеството се е спасило в изкуствена, абсолютно климатизирана среда.

За климата от Америка

В добрите галерии на САЩ изложбите на тема климат, екология и климатични промени са навсякъде тази есен. В Hirschhorn Museum във Вашингтон се намира изключително впечатляващата видеоинсталация Purple на Джон Акомфра, която на шест екрана смесва натрапчив разказ за влиянието на човека върху природата и климата на Земята през кадри от Аляска, Гренландия, тихоокеански острови.

В MoMA в Ню Йорк до януари 2024 г. ще може да се разгледа изложбата Emerging Ecologies. Architecture and the Rise of Environmentalism, която проследява екологичните тревоги на архитектите в САЩ още от 60-те години на ХХ в. и умишлено приключва с проекти от началото на 90-те, за да покаже кога „екология“ става клиширана дума, лишена от първоначалния си тревожен заряд.

Струва ми се обаче, че няма да стане само с изкуство и говорене. През септември десетки хиляди протестираха по улиците на Манхатън за пълна забрана на изкопаемите горива, а в речта си пред тълпата лявата конгресменка Александрия Окасио-Кортес каза, че „движението трябва да стане прекалено голямо и радикално, за да бъде игнорирано“. Но Ню Йорк, както всички знаем, не е Америка.

Няма време да разчитаме на малки архитектурни намеси, на пилотни проекти, на изграждане на мрежи (каквито се опитва да прави Новият европейски Баухаус) или на внимателно образоване на едно много разделено общество (както се опитват да правят галериите в Америка). Дошъл е моментът да се паникьосаме, да спрем просто да говорим и да действаме решително и заедно – отвъд икономически интереси и политически пристрастия. Това ще бъдат трудни и непопулярни мерки, които трябва да се прилагат едновременно и глобално. Въпросът е: можем ли?

На второ четене: „Макгахански блусове и балади“

Post Syndicated from original https://www.toest.bg/na-vtoro-chetene-makgahanski-blusove-i-baladi/

„Макгахански блусове и балади“ от Юли Шумарев

На второ четене: „Макгахански блусове и балади“

ИК „Жанет 45“, 2022

Блусът се ражда като музика на бедните, разчитайки на „синята нота“ (blue note) и повторимостта на фразите, на ритмичното вдълбаване в суровите емоции, в тъгата и носталгията под далечния зноен дъх на спиричуъла. Тъкмо това прави и Юли Шумарев в „Макгахански блусове и балади“ –

сборник с разкази от етюден тип, който всъщност може да се чете и като поетичен роман за израстването.

Роман, изсвирен по грифа не на американската делта, а на спомена за една малка, вече напълно променена и джентрифицирана пловдивска уличка, затворена някога между стръмното на Стария град и началото на циганската махала.

„Макгахан“ е уличка на градската беднота, уличка на малките хора и съдби.

В тези автобиографични истории авторът разказвач пътува с така наречената от него „времевръщачка“ в детството си на ул. „Макгахан“ 10 – в присъствието на своите брат, баба и най-вече дядо, може би централния герой в тази книга. Той прави това по един типично прустовски, или по-скоро господиновски начин. Също като при Господинов, и тук миналото бива страстно инвентаризирано, опредметено, капсулирано преди всичко във вещи и предмети, както и в звуци, миризми и ритуали. Паметта се вкопчва в чисто сетивното, във физическото, в онова, което – като при неверния Тома – ни убеждава в съществуващото, в съществувалото.

Да, Юли Шумарев признава крехкостта и ненадеждността на тази памет – а следователно и нейното сродство с въображението, което идва да запълни празнините ѝ, но всъщност може би е самата нея.

Едва ли мога да си спомня тези неща. Сигурно си измислям. Аз съм лъжец.

Тази памет-въображение има нужда от патерица, от мадленка: стария дядов куфар, коланчето от роклята на баба, черницата на двора, запазеното билетче, запалката „Зипо“. Тя се рее над някогашните звуци и миризми: шляпането на гумените чехли, съскането на кибритената клечка, дъха на липовия цвят и риванола. Всичко това са не просто неща, а насъщна част от състояния и действия, които в детството (а може би чак в спомена за него?) придобиват смисъла на мистични, повтарящи се ритуали, съвсем буквално крепящи света.

Всяко нещо е важно и ненарушимо.

И така ритуалите по ежедневното курдисване на часовниците, боядисването напролет, запалването на печката, поправянето на повреденото се превръщат в част от донкихотовската битка на дядото на разказвача с ентропията и разпада. Същата обречена и неравна битка, която той води и със забравата, записвайки си на куп бели листчета имената на хора, места и предмети, започнали да му се изплъзват с напредването на деменцията.

Помнен, дори и само на хартия, светът ще остане цял.

Не е случайно, че едно от имената върху белите листчета е на кораба „Титаник“, който се споменава на много места из страниците. Старата къща на ул. „Макгахан“ 10, която разказвачът определя като „целия фундамент в живота ми“, е обречена пред айсберга на времето, който ще я разруши физически, слагайки край на детството. Тя е Шумаревият титаник, потънал насред океана на модернизиращия се град и порастването. Опитът на малкия Юли да излъже веднъж времето, размествайки стрелките на всички часовници у дома, така и не сработва.

И все пак машината на времето, за която мечтае авторът, вече е изобретена от самия него – чрез разказването.

Ще построя кораб срещу времето. Корпуса ще скова от дъските на дядовата ограда, ребрата ще направя от старите дворни плочи, килът ще е от вехтите греди, които подпират тавана. В сърцето му ще забия ръждивия цигански пирон, който крепи света ми. За мачти ще отсека любимите си макгахански дървета. Ще ги изправя да стърчат гордо, после ще ги превържа с такелаж, изплетен от бабината червена нишка. Ще връзвам здраво и няма да забравя парче за себе си.

И ето. Конецът от червеното кълбо се превръща в нишката на Ариадна, която не отвежда извън, а до самото сърце в лабиринта на детството. А потъващият „Титаник“ се издига в кораба на Ноевия ковчег. Така че може би финалната четвърта фраза на този макгахански блус се римува с възклицанието на разказвача, че „истинска загуба няма“. Най-малкото защото всяко изгубено от някого нещо е откритие за другиго, точно като изпадналите двайсет стотинки. Сума огромна впрочем…

… защото детството е лупата на живота.

Малката къщичка и дворчето на Юли са с размерите на „поле и катедрала“, хралупата на дървото е „светилище“, качването на тавана е равносилно на стъпването на Луната или поне на покоряването на Еверест. А куп пространства придобиват статута на убежища – такова само по себе си е детството, където криенето от света е част от преживяването му.

На второ четене: „Макгахански блусове и балади“

„Макгахански блусове и балади“ е не по-малко и книга за братството и връзката през поколенията. За сметка на бабите и дядовците, родителите почти липсват в наратива (те може би се нуждаят от собствена книга). В българското детство това е „изконна“ традиция, която максимално приближава детето до емоционалното преживяване на смъртта. Детството в крайна сметка е свикване с кръвта и смъртта. Включително тази на любимите домашни животни, заклани, за да бъдат изядени – както в дългата сцена с обезглавеното петле, спасително задигнато от котарака – страшилище на махалата.

Всъщност Юли Шумарев е преди всичко художник – от тези, израснали покрай Античния театър, учили се от платната на Слона, Кольо Карамфилов и други знакови артисти на града. Може би затова в дебютната си книга е способен да види небето в „цвят на изтъркани дънки“. Привидно семпъл, езикът на историите е силно образен и метафоричен, сетивен, поетично красив в носталгията си.

Фабулирането се случва и през езика, придавайки на всеки разказ почти библейски, епични измерения. На места историите звучат като притчи, в чиито архетипни образи поне няколко поколения ще разпознаят собственото си детство. Всичко там все още ще е преводимо в нещо друго – точно както всяка вещ от натуриите в бараката-убежище-светилище може да бъде употребявана за куп други неща, та да бъде светът самодостатъчен и самозакрепим. И в крайна сметка разказването е колкото сбогуване, толкова и отказът от него, както признава Юли Шумарев:

Не знам кога ще се сбогувам с миналото си. Не знам кога ще си простя. Не знам кога ще освободя баба и дядо от мислите си и ще ги оставя да се реят между звездите. Знам, че времето е жива материя. Мога да се върна по него, да видя старите места и липсващите любими хора.


Активните дарители на „Тоест“ получават постоянна отстъпка в размер на 20% от коричната цена на всички заглавия от каталога на „Жанет 45“, както и на няколко други български издателства в рамките на партньорската програма Читателски клуб „Тоест“. За повече информация прочетете на toest.bg/club.

Никой от нас не чете единствено най-новите книги. Тогава защо само за тях се пише? „На второ четене“ е рубрика, в която отваряме списъците с книги, публикувани преди поне година, четем ги и препоръчваме любимите си от тях. Рубриката е част от партньорската програма Читателски клуб „Тоест“. Изборът на заглавия обаче е единствено на авторите – Стефан Иванов и Севда Семер, които биха ви препоръчали тези книги и ако имаше как веднъж на две седмици да се разходите с тях в книжарницата.

Simplify data transfer: Google BigQuery to Amazon S3 using Amazon AppFlow

Post Syndicated from Kartikay Khator original https://aws.amazon.com/blogs/big-data/simplify-data-transfer-google-bigquery-to-amazon-s3-using-amazon-appflow/

In today’s data-driven world, the ability to effortlessly move and analyze data across diverse platforms is essential. Amazon AppFlow, a fully managed data integration service, has been at the forefront of streamlining data transfer between AWS services, software as a service (SaaS) applications, and now Google BigQuery. In this blog post, you explore the new Google BigQuery connector in Amazon AppFlow and discover how it simplifies the process of transferring data from Google’s data warehouse to Amazon Simple Storage Service (Amazon S3), providing significant benefits for data professionals and organizations, including the democratization of multi-cloud data access.

Overview of Amazon AppFlow

Amazon AppFlow is a fully managed integration service that you can use to securely transfer data between SaaS applications such as Google BigQuery, Salesforce, SAP, Hubspot, and ServiceNow, and AWS services such as Amazon S3 and Amazon Redshift, in just a few clicks. With Amazon AppFlow, you can run data flows at nearly any scale at the frequency you choose—on a schedule, in response to a business event, or on demand. You can configure data transformation capabilities such as filtering and validation to generate rich, ready-to-use data as part of the flow itself, without additional steps. Amazon AppFlow automatically encrypts data in motion, and allows you to restrict data from flowing over the public internet for SaaS applications that are integrated with AWS PrivateLink, reducing exposure to security threats.

Introducing the Google BigQuery connector

The new Google BigQuery connector in Amazon AppFlow unveils possibilities for organizations seeking to use the analytical capability of Google’s data warehouse, and to effortlessly integrate, analyze, store, or further process data from BigQuery, transforming it into actionable insights.

Architecture

Let’s review the architecture to transfer data from Google BigQuery to Amazon S3 using Amazon AppFlow.

architecture

  1. Select a data source: In Amazon AppFlow, select Google BigQuery as your data source. Specify the tables or datasets you want to extract data from.
  2. Field mapping and transformation: Configure the data transfer using the intuitive visual interface of Amazon AppFlow. You can map data fields and apply transformations as needed to align the data with your requirements.
  3. Transfer frequency: Decide how frequently you want to transfer data—such as daily, weekly, or monthly—supporting flexibility and automation.
  4. Destination: Specify an S3 bucket as the destination for your data. Amazon AppFlow will efficiently move the data, making it accessible in your Amazon S3 storage.
  5. Consumption: Use Amazon Athena to analyze the data in Amazon S3.

Prerequisites

The dataset used in this solution is generated by Synthea, a synthetic patient population simulator and opensource project under the Apache License 2.0. Load this data into Google BigQuery or use your existing dataset.

Connect Amazon AppFlow to your Google BigQuery account

For this post, you use a Google account, OAuth client with appropriate permissions, and Google BigQuery data. To enable Google BigQuery access from Amazon AppFlow, you must set up a new OAuth client in advance. For instructions, see Google BigQuery connector for Amazon AppFlow.

Set up Amazon S3

Every object in Amazon S3 is stored in a bucket. Before you can store data in Amazon S3, you must create an S3 bucket to store the results.

Create a new S3 bucket for Amazon AppFlow results

To create an S3 bucket, complete the following steps:

  1. On the AWS Management console for Amazon S3, choose Create bucket.
  2. Enter a globally unique name for your bucket; for example, appflow-bq-sample.
  3. Choose Create bucket.

Create a new S3 bucket for Amazon Athena results

To create an S3 bucket, complete the following steps:

  1. On the AWS Management console for Amazon S3, choose Create bucket.
  2. Enter a globally unique name for your bucket; for example, athena-results.
  3. Choose Create bucket.

User role (IAM role) for AWS Glue Data Catalog

To catalog the data that you transfer with your flow, you must have the appropriate user role in AWS Identity and Access Management (IAM). You provide this role to Amazon AppFlow to grant the permissions it needs to create an AWS Glue Data Catalog, tables, databases, and partitions.

For an example IAM policy that has the required permissions, see Identity-based policy examples for Amazon AppFlow.

Walkthrough of the design

Now, let’s walk through a practical use case to see how the Amazon AppFlow Google BigQuery to Amazon S3 connector works. For the use case, you will use Amazon AppFlow to archive historical data from Google BigQuery to Amazon S3 for long-term storage an analysis.

Set up Amazon AppFlow

Create a new Amazon AppFlow flow to transfer data from Google Analytics to Amazon S3.

  1. On the Amazon AppFlow console, choose Create flow.
  2. Enter a name for your flow; for example, my-bq-flow.
  3. Add necessary Tags; for example, for Key enter env and for Value enter dev.

appflow-flow-setup­­­­

  1. Choose Next.
  2. For Source name, choose Google BigQuery.
  3. Choose Create new connection.
  4. Enter your OAuth Client ID and Client Secret, then name your connection; for example, bq-connection.

­bq-connection

  1. In the pop-up window, choose to allow amazon.com access to the Google BigQuery API.

bq-authentication

  1. For Choose Google BigQuery object, choose Table.
  2. For Choose Google BigQuery subobject, choose BigQueryProjectName.
  3. For Choose Google BigQuery subobject, choose DatabaseName.
  4. For Choose Google BigQuery subobject, choose TableName.
  5. For Destination name, choose Amazon S3.
  6. For Bucket details, choose the Amazon S3 bucket you created for storing Amazon AppFlow results in the prerequisites.
  7. Enter raw as a prefix.

appflow-source-destination

  1. Next, provide AWS Glue Data Catalog settings to create a table for further analysis.
    1. Select the User role (IAM role) created in the prerequisites.
    2. Create new database for example, healthcare.
    3. Provide a table prefix setting for example, bq.

glue-crawler-config

  1. Select Run on demand.

appflow-trigger-setup

  1. Choose Next.
  2. Select Manually map fields.
  3. Select the following six fields for Source field name from the table Allergies:
    1. Start
    2. Patient
    3. Code
    4. Description
    5. Type
    6. Category
  4. Choose Map fields directly.

appflow-field-mapping

  1. Choose Next.
  2. In the Add filters section, choose Next.
  3. Choose Create flow.

Run the flow

After creating your new flow, you can run it on demand.

  1. On the Amazon AppFlow console, choose my-bq-flow.
  2. Choose Run flow.

sppflow-run--status

For this walkthrough, choose run the job on-demand for ease of understanding. In practice, you can choose a scheduled job and periodically extract only newly added data.

Query through Amazon Athena

When you select the optional AWS Glue Data Catalog settings, Data Catalog creates the catalog for the data, allowing Amazon Athena to perform queries.

If you’re prompted to configure a query results location, navigate to the Settings tab and choose Manage. Under Manage settings, choose the Athena results bucket created in prerequisites and choose Save.

  1. On the Amazon Athena console, select the Data Source as AWSDataCatalog.
  2. Next, select Database as healthcare.
  3. Now you can select the table created by the AWS Glue crawler and preview it.

athena-results

  1. You can also run a custom query to find the top 10 allergies as shown in the following query.

Note: In the below query, replace the table name, in this case bq_appflow_mybqflow_1693588670_latest, with the name of the table generated in your AWS account.

SELECT type,
category,
"description",
count(*) as number_of_cases
FROM "healthcare"."bq_appflow_mybqflow_1693588670_latest"
GROUP BY type,
category,
"description"
ORDER BY number_of_cases DESC
LIMIT 10;

  1. Choose Run query.

athena-custom-query-results

This result shows the top 10 allergies by number of cases.

Clean up

To avoid incurring charges, clean up the resources in your AWS account by completing the following steps:

  1. On the Amazon AppFlow console, choose Flows in the navigation pane.
  2. From the list of flows, select the flow my-bq-flow, and delete it.
  3. Enter delete to delete the flow.
  4. Choose Connections in the navigation pane.
  5. Choose Google BigQuery from the list of connectors, select bq-connector, and delete it.
  6. Enter delete to delete the connector.
  7. On the IAM console, choose Roles in the navigation page, then select the role you created for AWS Glue crawler and delete it.
  8. On the Amazon Athena console:
    1. Delete the tables created under the database healthcare using AWS Glue crawler.
    2. Drop the database healthcare
  9. On the Amazon S3 console, search for the Amazon AppFlow results bucket you created, choose Empty to delete the objects, then delete the bucket.
  10. On the Amazon S3 console, search for the Amazon Athena results bucket you created, choose Empty to delete the objects, then delete the bucket.
  11. Clean up resources in your Google account by deleting the project that contains the Google BigQuery resources. Follow the documentation to clean up the Google resources.

Conclusion

The Google BigQuery connector in Amazon AppFlow streamlines the process of transferring data from Google’s data warehouse to Amazon S3. This integration simplifies analytics and machine learning, archiving, and long-term storage, providing significant benefits for data professionals and organizations seeking to harness the analytical capabilities of both platforms.

With Amazon AppFlow, the complexities of data integration are eliminated, enabling you to focus on deriving actionable insights from your data. Whether you’re archiving historical data, performing complex analytics, or preparing data for machine learning, this connector simplifies the process, making it accessible to a broader range of data professionals.

If you’re interested to see how the data transfer from Google BigQuery to Amazon S3 using Amazon AppFlow, take a look at step-by-step video tutorial. In this tutorial, we walk through the entire process, from setting up the connection to running the data transfer flow. For more information on Amazon AppFlow, visit Amazon AppFlow.


About the authors

Kartikay Khator is a Solutions Architect on the Global Life Science at Amazon Web Services. He is passionate about helping customers on their cloud journey with focus on AWS analytics services. He is an avid runner and enjoys hiking.

Kamen SharlandjievKamen Sharlandjiev is a Sr. Big Data and ETL Solutions Architect and Amazon AppFlow expert. He’s on a mission to make life easier for customers who are facing complex data integration challenges. His secret weapon? Fully managed, low-code AWS services that can get the job done with minimal effort and no coding.

Ferrocene released as open source

Post Syndicated from corbet original https://lwn.net/Articles/946732/

Ferrous Systems has announced
that its Ferrocene Rust compiler will be released under the Apache-2.0 and
MIT licenses.

Ferrocene is the main Rust compiler – rustc – but quality managed
and qualified for use in automotive and industrial environments
(currently by ISO 26262 and IEC 61508) by Ferrous Systems. It
operates as a downstream to the Rust project, further increasing
its testing and quality on specific platforms.

The license is free, but this is not being run as an open-source project;
specifically, contributions from the “general public” are not accepted.

Enhancing Resource Isolation in AWS CDK with the App Staging Synthesizer

Post Syndicated from Jehu Gray original https://aws.amazon.com/blogs/devops/enhancing-resource-isolation-in-aws-cdk-with-the-app-staging-synthesizer/

AWS Cloud Development Kit (CDK) has become a powerful tool for defining and provisioning AWS cloud resources. While CDK simplifies the process of infrastructure as code, managing resources across different projects and environments can still present challenges. In this blog post, we’ll explore a new experimental library, the App Staging Synthesizer, that enhances resource isolation and provides finer control over staging resources in CDK applications.

Background: The CDK Bootstrapping Model

Let’s consider a scenario where a company has two projects in the same account, Project A and Project B. Both projects are developed using the AWS CDK and deploy various AWS resources. However, the company wants to ensure that resources used in Project A are not discoverable or accessible to Project B. Prior to the introduction of the App Staging Synthesizer library in CDK, the default bootstrapping process created shared staging resources, such as a single Amazon S3 bucket and Amazon ECR repository, which are used by all CDK applications deployed in the CDK environment. In AWS CDK, a combination of region and an account is considered to be an environment. The traditional CDK bootstrapping method offers simplicity and consistency by providing a standardized set of shared staging resources for all CDK applications in an environment, which can be cost-effective for multiple applications. This shared model makes it challenging to control access and visibility between the projects in the same account, particularly in scenarios where resource isolation is crucial between different projects. In such scenarios, AWS recommends a best practice of separating projects that need critical isolation into different AWS accounts. However, it is recognized that there might be organizational or practical reasons preventing the immediate adoption of this recommendation. In such cases, mechanisms like the App Staging Synthesizer can provide a valuable workaround.

Introducing the App Staging Synthesizer:

Today, a growing trend among customers is the consolidation of their cloud accounts driven by the desire to optimize costs, bolster security and enhance compliance control. However, while consolidation offers several advantages, it can sometimes limit the flexibility to align ownership and decision making with individual accounts. This can lead to dependencies and conflicts in how workloads across accounts are secured and managed. The App Staging Synthesizer which is an experimental library designed to provide a more flexible approach to resource management and staging in CDK applications was designed to address these challenges. The AppStagingSynthesizer enhances resource isolation and cleanup control by creating separate staging resources for each application, reducing the risk of conflicts between resources and providing more granular management. It also enables better asset lifecycle management and customization of roles and resource handling, offering CDK developers a flexible and organized approach to resource deployment. Let’s delve into some of the advantages and key features of this library.

Advantages and Outcomes:

  1. Isolation and Access Control: The resources created for Project A are now completely isolated from Project B. Project B doesn’t have visibility or access to the staging resources of Project A, and vice versa. This ensures a higher level of data and resource security.
  2. Easier Resource Cleanup: When cleaning up or deleting resources, the Staging Stack specific to each project can be removed independently. This allows for a more streamlined and controlled cleanup process, mitigating the risk of inadvertently affecting other projects.
  3. Lifecycle Management: With separate ECR repositories for each CDK application, the company can apply lifecycle rules independently for retention and cost management. For example, they can configure each ECR repository to retain only the most recent 5 images, effectively cutting down on storage costs.
  4. Reduced Bootstrapping Complexity: As the only shared resources required are global Roles, the company now only needs to bootstrap every account in one Region instead of bootstrapping every Region. This simplifies the bootstrapping process, making it easier to manage with CloudFormation StackSets.

Key Features of the App Staging Synthesizer:

  • IStagingResources Interface: The App Staging Synthesizer introduces the IStagingResources interface, offering a framework to manage app-level bootstrap stacks. These stacks handle file assets and Docker assets for CDK applications.
  • DefaultStagingStack: Included in the library, the DefaultStagingStack is a pre-built implementation of the IStagingResources It comes with default configurations for staging resources, making it easier to get started.
  • AppStagingSynthesizer: This is a new CDK synthesizer that orchestrates the creation of staging resources for each CDK application. It seamlessly integrates with the application deployment process.
  • Deployment Roles: In addition to creating staging resources, the CDK App Staging Synthesizer also manages deployment roles. These roles are crucial for secure and controlled resource deployment, ensuring that only authorized processes can modify or access the resources.

 Implementation:

Let’s explore practical examples of using the App Staging Synthesizer within a CDK application.

Prerequisite:

For this walkthrough, you should have the following prerequisites:

  • An AWS account
  • Install AWS CDK version 2.73.0 or later
  • A basic understanding of CDK. Please go through cdkworkshop.com to get hands-on learning about CDK and related concepts.
  • NOTE: To utilize the AppStagingSynthesizer, you should have an existing CDK application or should be working on a CDK application.

Using Default Staging Resources:

When configuring your CDK application to use deployment identities with the old bootstrap stack, it’s important to note that the existing staging resources, including the global S3 bucket and ECR repository, will still be created as part of the bootstrapping process. However, they will remain unused by this specific application, thanks to the App Staging Synthesizer.
While we won’t delve into the removal of these unused resources in this blogpost, it’s worth mentioning that for a more streamlined resource setup, you have the option to customize the bootstrap template to remove these resources if desired. This can help reduce clutter and ensure that only the necessary resources are retained within your CDK environment.

To get started, update your CDK App with the following code snippet:

const app = new App({
defaultStackSynthesizer: AppStagingSynthesizer.defaultResources({
appId: 'my-app-id',
// The following line is optional. By default, it is assumed you have bootstrapped in the same region(s) as the stack(s) you are deploying.
deploymentIdentities: DeploymentIdentities.defaultBootstrapRoles({ bootstrapRegion: 'us-east-1' }),
}),
});

This code snippet creates a DefaultStagingStack for a CDK App, allowing you to manage staging resources more effectively.

Customizing Roles:

You can customize roles for the synthesizer, which can be useful for several reasons such as:

  • Reuse of existing roles: In many AWS environments, organizations have existing IAM roles with specific permissions and policies that are aligned with their security and compliance requirements. Rather than creating new roles from scratch, you might want to leverage these existing roles to maintain consistency and adhere to established security practices.
  • Compatibility: In scenarios where you have pre-existing IAM roles that are being used across various AWS services or applications, customizing roles within the CDK App Staging Synthesizer allows you to seamlessly integrate CDK deployments into your existing IAM role management strategy.

Overall, customizing roles provides flexibility and control over resources used during CDK application deployments, enabling you to align CDK-based infrastructure with the organization’s policies. An example is:

const app = new App({
defaultStackSynthesizer: AppStagingSynthesizer.defaultResources({
appId: 'my-app-id',
deploymentIdentities: DeploymentIdentities.specifyRoles({
cloudFormationExecutionRole: BootstrapRole.fromRoleArn('arn:aws:iam::123456789012:role/Execute'),
deploymentRole: BootstrapRole.fromRoleArn('arn:aws:iam::123456789012:role/Deploy'),
}),
}),
});

This code snippet illustrates how you can specify custom roles for different stages of the deployment process.

Deploy Time S3 Assets:

Deploy-time S3 assets can be classified into two categories, each serving a distinct purpose:

  • Assets Used Only During Deployment: These assets are instrumental in handing off substantial data to other services for private copying during deployment. They play a vital role during initial deployment, and afterwards are retained solely for potential future rollbacks
  • Assets Accessed Throughout Application Lifespan: In contrast, some assets are accessed continuously throughout the runtime of your application. These could include script files utilized in CodeBuild projects, startup scripts for EC2 instances, or, in the case of CDK applications, ECR images that persist throughout the application’s life.

Marking Lambda Assets as Deploy-Time:

By default, Lambda assets are marked as deploy-time assets in the CDK App Staging Synthesizer. This means they fall into the first category mentioned above, serving as essential components during deployment. For instance, consider the following code snippet:

declare const stack: Stack;
new lambda.Function(stack, 'lambda', {
code: lambda.AssetCode.fromAsset(path.join(__dirname, 'assets')), // Lambda code bundle marked as deploy-time
handler: 'index.handler',
runtime: lambda.Runtime.PYTHON_3_9,
});

In this example, the Lambda code bundle is automatically identified as a deploy-time asset. This distinction ensures that it’s cleaned up after the configurable rollback window.

Creating Custom Deploy-Time Assets:

CDK offers the flexibility needed to create custom deploy-time assets. This can be achieved by utilizing the Asset construct from the AWS CDK library:

import { Asset } from 'aws-cdk-lib/aws-s3-assets';
declare const stack: Stack;
const asset = new Asset(stack, 'deploy-time-asset', {
deployTime: true, // Marking the asset as deploy-time
path: path.join(__dirname, './deploy-time-asset'),
});

By setting deployTime to true, the asset is explicitly marked as deploy-time. This allows you to maintain control over the lifecycle of these assets, ensuring they are retained for as long as needed. However, it is important to note that deploy-time assets eventually become eligible for cleanup.

Configuring Asset Lifecycles:
By default, the CDK retains deploy-time assets for a period of 30 days. However, there is flexibility to adjust this duration according to custom requirements. This can be achieved by specifying deployTimeFileAssetLifetime. The value set here determines how long you can roll back to a previous application version without the need for rebuilding and republishing assets:

const app = new App({
defaultStackSynthesizer: AppStagingSynthesizer.defaultResources({
appId: 'my-app-id',
deployTimeFileAssetLifetime: Duration.days(100), // Adjusting the asset retention period to 100 days
}),
});

By fine-tuning the lifecycle of deploy-time S3 assets, you gain more control over CDK deployments and ensure that CDK applications are equipped to handle rollbacks and updates with ease.

Optimizing ECR Repository Management with Lifecycle Rules:

The AWS CDK App Staging Synthesizer provides you with the capability to control the lifecycle of container images by leveraging lifecycle rules within ECR repositories. Let’s explore how this feature can help streamline your CDK workflows.

ECR repositories can accumulate numerous versions of Docker images over time. While retaining some historical versions is essential for rollback scenarios and reference, an unregulated growth of image versions can lead to increased storage costs and management complexity.

The AWS CDK App Staging Synthesizer offers a default configuration that stores a maximum of 3 revisions for a given Docker image asset. This ensures that you maintain access to previous image versions, facilitating seamless rollback operations. When more than 3 revisions of an asset exist in the ECR repository, the oldest one is purged.

Although by default, it’s set to 3, you can also adjust this value using the imageAssetVersionCount property:

const app = new App({
defaultStackSynthesizer: AppStagingSynthesizer.defaultResources({
appId: 'my-app-id',
imageAssetVersionCount: 10, // Customizing the image version count to retain up to 10 revisions
}),
});

By increasing or decreasing the imageAssetVersionCount, you can strike a balance between storage efficiency and the need to access historical image versions. This ensures that ECR repositories are optimized to the CDK application’s requirements.

Streamlining Cleanup: Auto Delete Staging Assets on Stack Deletion

Efficiently managing resources throughout the lifecycle of your CDK applications is essential, and this includes handling the cleanup of staging assets when stacks are deleted. The AWS CDK App Staging Synthesizer simplifies this process by providing an auto-delete feature for staging resources. In this section, we’ll explore how this feature works and how you can customize it according to your needs.

The Default Cleanup Behavior:
By default, the AWS CDK App Staging Synthesizer is designed to facilitate the cleanup of staging resources automatically when a stack is deleted. This means that associated resources, such as S3 buckets and ECR repositories, are configured with a RemovalPolicy.DESTROY and have autoDeleteObjects (for S3 buckets) or autoDeleteImages (for ECR repositories) turned on. Under the hood, custom resources are created to ensure a seamless cleanup process.

Customizing Cleanup Behavior:
While automatic cleanup is convenient for many scenarios, there may be situations where you want to retain staging resources even after stack deletion. This can be useful when you intend to reuse these resources or when you have specific cleanup processes outside of the default behavior. To retain staging assets and disable the auto-delete feature, you can specify autoDeleteStagingAssets: as false when configuring the AWS CDK App Staging Synthesizer:

const app = new App({
defaultStackSynthesizer: AppStagingSynthesizer.defaultResources({
appId: 'my-app-id',
autoDeleteStagingAssets: false, // Disabling auto-delete of staging assets
}),
});

By setting autoDeleteStagingAssets to false, you have full control over the cleanup of staging resources. This allows you to retain and manage these resources independently, giving you the flexibility to align CDK workflows with the organization’s specific practices.

Using an Existing Staging Stack:

While the AWS CDK App Staging Synthesizer offers powerful tools for managing staging resources, there may be scenarios where you already have a meticulously crafted staging stack in place. In such cases, you can seamlessly integrate the existing stack with the AppStagingSynthesizer using the customResources() method. Let’s explore how you can make the most of your pre-existing staging infrastructure.

The process is straightforward—supply your existing staging stack as a resource to the AppStagingSynthesizer using the customResources() method. It’s crucial to ensure that the custom stack adheres to the requirements of the IStagingResources interface for smooth integration.

Here’s an example:

// Create a new CDK App
const resourceApp = new App();

//Instantiate your custom staging stack (make sure it implements IstagingResources)
const resources = new CustomStagingStack(resourceApp, 'CustomStagingStack', {});

//Configure your CDK App to use the App Staging Synthesizer with your custom staging stack
const app = new App({
defaultStackSynthesizer: AppStagingSynthesizer.customResources({
resources,
}),
});

In this example, CustomStagingStack represents the pre-existing staging infrastructure. By providing it as a resource to the App Staging Synthesizer, you seamlessly integrate it into the CDK application’s deployment workflow.

Crafting Custom Staging Stacks for Environment Control:

For those seeking precise control over resource management in different environments, the AWS CDK App Staging Synthesizer offers a robust solution – custom staging stacks. This feature allows you to tailor resource configurations, permissions, and behaviors to meet the unique demands of each environment within the CDK application.

Subclassing DefaultStagingStack for a Quick Start:

If your customization requirements align with the available properties, you can start by subclassing DefaultStagingStack. This streamlined approach lets you inherit existing functionalities while tweaking specific behaviors as needed. Here’s how you can dive right in:

//Define custom staging stack
interface CustomStagingStackOptions extends DefaultStagingStackOptions {}

//Subclass DefaultStagingStack to create the custom stgaing stack
class CustomStagingStack extends DefaultStagingStack {
// Implement customizations here
}

Building Staging Resources from Scratch:

For more granular control, consider building the staging resources entirely from scratch. This approach allows you to define every aspect of the staging stack, from the ground up, by implementing the “IStagingResources” interface. Here’s an example:

// Define custom staging stack properties(if needed)
interface CustomStagingStackProps extends StackProps {}

//Create your custom staging stack that implements IStagingResources
class CustomStagingStack extends Stack implements IStagingResources {
constructor(scope: Construct, id: string, props: CustomStagingStackProps) {
super(scope, id, props);
}

// Implement methods to define your custom staging resources
public addFile(asset: FileAssetSource): FileStagingLocation {
return {
bucketName: 'myBucket',
assumeRoleArn: 'myArn',
dependencyStack: this,
};
}
public addDockerImage(asset: DockerImageAssetSource): ImageStagingLocation {
return {
repoName: 'myRepo',
assumeRoleArn: 'myArn',
dependencyStack: this,
};
}
}

Creating Custom Staging Resources:

Implementing custom staging resources also involves crafting a CustomFactory class to facilitate the creation of these resources in every environment where your CDK App is deployed. This approach offers a high level of customization while ensuring consistency across deployments. Here’s how it works:

// Define a custom factory for your staging resources
class CustomFactory implements IStagingResourcesFactory {
public obtainStagingResources(stack: Stack, context: ObtainStagingResourcesContext) {
const myApp = App.of(stack);

// Create a custom staging stack instance for the current environment
return new CustomStagingStack(myApp!, `CustomStagingStack-${context.environmentString}`, {});
}
}

//Incorporate your custom staging resources into the Application using the customer factory
const app = new App({
defaultStackSynthesizer: AppStagingSynthesizer.customFactory({
factory: new CustomFactory(),
oncePerEnv: true, // by default
}),
});

With this setup, you can create custom staging stacks for each environment, ensuring resource management tailored to your specific needs. Whether you choose to subclass DefaultStagingStack for a quick start or build resources from scratch, custom staging stacks empower you to achieve fine-grained control and consistency across CDK deployments.

Conclusion:

The App Staging Synthesizer introduces a powerful approach to managing staging resources in AWS CDK applications. With enhanced resource isolation and lifecycle control, it addresses the limitations of the default bootstrapping model. By integrating the App Staging Synthesizer into CDK applications, you can achieve better resource management, cleaner cleanup processes, and more control over cloud infrastructure.
Explore this experimental library and unleash the potential of fine-tuned resource management in CDK projects.

For more information and code examples, refer to the official documentation provided by AWS.

About the Authors:

Jehu Gray

Jehu Gray is an Enterprise Solutions Architect at Amazon Web Services where he helps customers design solutions that fits their needs. He enjoys exploring what’s possible with IaC.

Abiola Olanrewaju

Abiola Olanrewaju is an Enterprise Solutions Architect at Amazon Web Services where he helps customers design and implement scalable solutions that drive business outcomes. He has a keen interest in Data Analytics, Security and Automation.

Little Crumbs Can Lead To Giants

Post Syndicated from Christiaan Beek original https://blog.rapid7.com/2023/10/05/little-crumbs-can-lead-to-giants/

Little Crumbs Can Lead To Giants

This week is the Virus Bulletin Conference in London. Part of the conference is the Cyber Threat Alliance summit, where CTA members like Rapid7 showcase their research into all kinds of cyber threats and techniques.

Traditionally, when we investigate a campaign, the focus is mostly on the code of the file, the inner workings of the malware, and communications towards threat actor-controlled infrastructure. Having a background in forensics, and in particular data forensics, I’m always interested in new ways of looking at and investigating data. New techniques can help proactively track, detect, and hunt for artifacts.

In this blog, which highlights my presentation at the conference, I will dive into the world of Shell Link files (LNK) and Virtual Hard Disk files (VHD). As part of this research, Rapid7 is releasing a new feature in Velociraptor that can parse LNK files and will be released with the posting of this blog.

VHD files

VHD and its successor VHDX are formats representing a virtual hard disk. They can contain contents usually found on a physical hard drive, such as disk partitions and files. They are typically used as the hard disk of a virtual machine, are built into modern versions of Windows, and are the native file format for Microsoft’s hypervisor, Hyper-V. The format was created by Connectix for their Virtual PC, known as Microsoft Virtual since Microsoft acquired Connectix in 2003. As we will see later, the word “Connectix” is still part of the footer of a VHD file.

Why would threat actors use VHD files in their campaigns? Microsoft has a security technology that is called “Mark of the Web” (MOTW). When files are downloaded from the internet using Windows, they are marked with a secret Zone.Identifier NTFS Alternate Data Stream (ADS) with a particular value called the MOTW. MOTW-tagged files are restricted and unable to carry out specific operations. Windows Defender SmartScreen, which compares files with an allowlist of well-known executables, will process executables marked with the MOTW. SmartScreen will stop the execution of the file if it is unknown or untrusted and will alert the user not to run it. Since VHD files are a virtual hard-disk, they can contain files and folders. When files are inside a VHD container, they will not receive the MOTW and bypass the security restrictions.

Depending on the underlying operating system, the VHD file can be in FAT or NTFS. The great thing about that is that traditional file system forensics can be applied. Think about Master-File_Table analysis, Header/Footer analysis and data carving, to name a few.

Example case:

In the past we investigated a case where a threat-actor was using a VHD file as part of their campaign. The flow of the campaign demonstrates how this attack worked:

Little Crumbs Can Lead To Giants

After sending a spear-phishing email with a VHD file, the victim would open up the VHD file that would auto-mount in Windows. Next, the MOTW is bypassed and a PDF file with backdoor is opened to download either the Sednit or Zebrocy malware. The backdoor would then establish a connection with the command-and-control (C2) server controlled by the threat actor.

After retrieving the VHD file, first it is mounted as ‘read-only’ so we cannot change anything about the digital evidence. Secondly, the Master-File-Table (MFT) is retrieved and analyzed:

Little Crumbs Can Lead To Giants

Besides the valuable information like creation and last modification times (always take into consideration that these can be altered on purpose), two of the files were copied from a system into the VHD file. Another interesting discovery here is that the VHD disk contained a RECYCLE.BIN file that contained deleted files. That’s great since depending on the filesize of the VHD (the bigger, the more chance that files are not overwritten), it is possible to retrieve these deleted files by using a technique called “data carving.”

Using Photorec as one of the data carving tools, again the VHD file is mounted read-only and the tool pointed towards this share to attempt to recover the deleted files.

Little Crumbs Can Lead To Giants

After running for a short bit, the deleted files could be retrieved and used as part of the investigation. Since this is not relevant for this blog, we continue with the footer analysis.

Footer analysis of a VHD file

The footer, which is often referred to as the trailer, is an addition to the original header that is appended to the end of a file. It is a data structure that resembles a header.

A footer is never located at a fixed offset from the beginning of an image file unless the image data is always the same size because by definition it comes after the image data, which is typically of variable length. It is often situated a certain distance from the end of a picture file. Similar to headers, footers often have a defined size. A rendering application can use a footer’s identification field or magic number, like a header’s, to distinguish it from other data structures in the file.

When we look at the footer of the VHD file, certain interesting fields can be observed:

Little Crumbs Can Lead To Giants

These values are some of the examples of the data structures that are specified for the footer of a VHD file, but there are also other values like “type of disk” that can be valuable during comparisons of multiple campaigns by an actor.

From the screenshot, we can see that “conectix” is the magic number value of the footer of a VHD file, you can compare it to a small fingerprint. From the other values, we can determine that the actor used a Windows operating system, and we can derive from the HEX value the creation time of the VHD file.

From a threat hunting or tracking perspective, these values can be very useful. In the below example, a Yara rule was written to identify the file as a VHD file and secondly the serial number of the hard drive used by the actor:

Little Crumbs Can Lead To Giants

Shell link files (LNK), aka Shortcut files

A Shell link, also known as a Shortcut, is a data object in this format that houses data that can be used to reach another data object. Windows files with the “LNK” extension are in a format known as the Shell Link Binary File Format. Shell links can also be used by programs that require the capacity to store a reference to a destination file. Shell links are frequently used to facilitate application launching and linking scenarios, such as Object Linking and Embedding (OLE).

LNK files are massively abused in multiple cybercrime campaigns to download next stage payloads or contain code hidden in certain data fields. The data structure specification of LNK files mentions that LNK files store various information, including “optional data” in the “extra data” sections. That is an interesting area to focus on.

Below is a summarized overview of the Extra Data structure:

Little Crumbs Can Lead To Giants

The ‘Header’ LinkInfo part contains interesting data on the type of drive used, but more importantly it contains the SerialNumber of the hard drive used by the actor when creating the LNK file:

Little Crumbs Can Lead To Giants

Other interesting information can be found; for example, around a value with regards to the icon used and in this file used, it contains an interesting string.

Little Crumbs Can Lead To Giants

Combining again that information, a simple Yara rule can be written for this particular LNK file which might have been used in multiple campaigns:

Little Crumbs Can Lead To Giants

One last example is to look for the ‘Droids’ values in the Extra Data sections. Droids stands for Digital Record Object Identification. There are two values present in the example file:

Little Crumbs Can Lead To Giants

The value in these fields translates to the MAC address of the attacker’s system… yes, you read this correctly and may close your open mouth now…

Little Crumbs Can Lead To Giants

Also this can be used to build upon the previous LNK Yara rule, where you could replace the “.\\3.jpg” part with the MAC address value to hunt for LNK files that were created on that particular device with that MAC address.

In a recent campaign called “Raspberry Robin”, LNK files were used to distribute the malware. Analyzing the LNK files and using the above investigation technique, the following Yara rule was created:

Little Crumbs Can Lead To Giants

Velociraptor LNK parser

Based on our research into LNK files, an updated LNK parser was developed by Matt Green from Rapid7 for Velociraptor, our advanced open-source endpoint monitoring, digital forensics, and cyber response platform.

With the parser, multiple LNK files can be processed and information can be extracted to use as an input for Yara rules that can be pushed back into the platform to hunt.

Little Crumbs Can Lead To Giants

Windows.Forensics.Lnk parses LNK shortcut files using Velociraptor’s built-in binary parser. The artifact outputs fields aligning to Microsoft’s ms-shllink protocol specification and some analysis hints to assist review or detection use cases. Users have the option to search for specific indicators in key fields with regex, or control the definitions for suspicious items to bubble up during parsing.

Some of the default targeted suspicious attributes include:

  • Large size
  • Startup path location for auto execution
  • Environment variable script — environment variable with a common script configured to execute
  • No target with an environment variable only execution
  • Suspicious argument size — large sized arguments over 250 characters as default
  • Arguments have ticks — ticks are common in malicious LNK files
  • Arguments have environment variables — environment variables are common in malicious LNKs
  • Arguments have rare characters — look for specific rare characters that may indicate obfuscation
  • Arguments that have leading space. Malicious LNK files may have many leading spaces to obfuscate some tools
  • Arguments that have http strings — LNKs are regularly used as a download cradle
  • Suspicious arguments — some common malicious arguments observed in field
  • Suspicious trackerdata hostname
  • Hostname mismatch with trackerdata hostname

Due to the use of Velociraptor’s binary parser, the artifact is significantly faster than other analysis tools. It can be deployed as part of analysis or at scale as a hunting function using the IOCRegex and/or SuspiciousOnly flag.

Summary

It is worth investigating the characteristics of file types we tend to skip in threat actor campaigns. In this blog I provided a few examples of how artifacts can be retrieved from VHD and LNK files and then used for the creation of hunting logic. As a result of this research, Rapid7 is happy to release a new LNK parser feature in Velociraptor and we welcome any feedback.

Define per-team resource limits for big data workloads using Amazon EMR Serverless

Post Syndicated from Gaurav Sharma original https://aws.amazon.com/blogs/big-data/define-per-team-resource-limits-for-big-data-workloads-using-amazon-emr-serverless/

Customers face a challenge when distributing cloud resources between different teams running workloads such as development, testing, or production. The resource distribution challenge also occurs when you have different line-of-business users. The objective is not only to ensure sufficient resources be consistently available to production workloads and critical teams, but also to prevent adhoc jobs from using all the resources and delaying other critical workloads due to mis-configured or non-optimized code. Cost controls and usage tracking across these teams is also a critical factor.

In the legacy big data and Hadoop clusters as well as Amazon EMR provisioned clusters, this problem was overcome by Yarn resource management and defining what were called Yarn queues for different workloads or teams. Another approach was to allocate independent clusters for different teams or different workloads.

Amazon EMR Serverless is a serverless option in Amazon EMR that makes it straightforward to run your big data workloads using open-source analytics frameworks such as Apache Spark and Hive without the need to configure, manage, or scale the clusters. With EMR Serverless, you don’t have to configure, optimize, secure, or operate clusters to run your workloads. You continue to get the benefits of Amazon EMR, such as open-source compatibility, concurrency, and optimized runtime performance for popular bigdata frameworks. EMR Serverless provides shorter job startup latency, automatic resource management and effective cost controls.

In this post, we show how to define per-team resource limits for big data workloads using EMR serverless.

Solution overview

EMR Serverless comes with a concept called an  EMR Serverless application, which is an isolated environment with the option to choose one of the open source analytics applications(Spark, Hive) to submit your workloads. You can include your own custom libraries, specify your EMR release version, and most importantly define the resource limits for the compute and memory resources. For instance, if your production Spark jobs run on Amazon EMR 6.9.0 and you need to test the same workload on Amazon EMR 6.10.0, you could use EMR Serverless to define EMR 6.10.0 as your version and test your workload using a predefined limit on resources.

The following diagram illustrates our solution architecture. We see that two different teams namely Prod team and Dev team are submitting their jobs independently to two different EMR Applications (namely ProdApp and DevApp respectively ) having dedicated resources.

EMR Serverless provides controls at the account, application and job level to limit the use of resources such as CPU, memory or disk. In the following sections, we discuss some of these controls.

Service quotas at account level

Amazon EMR Serverless has a default quota of 16 for maximum concurrent vCPUs per account. In other words, a new account can have a maximum of 16 vCPUs running at a given point in time in a particular Region across all EMR Serverless applications. However, this quota is auto-adjustable based on the usage patterns, which are monitored at the account and Region levels.

Resource limits and runtime configurations at the application level

In addition to quotas at the account levels, administrators can limit the use of resources at the application level using a feature known as “maximum capacity” which defines the maximum total vCPU, memory and disk capacity that can be consumed collectively by all the jobs running under this application.

You also have an option to specify common runtime and monitoring configurations at the application level which you would otherwise put in the specific job configurations. This helps create a standardized runtime environment for all the jobs running under an application. This can include settings like defining common connection setting your jobs need access to, log configurations that all your jobs will inherit by default, or Spark resource settings to help balance ad-hoc workloads. You can override these configurations at the job level, but defining them at the application can help reduce the configuration necessary for individual jobs.

For further details, refer to Declaring configurations at application level.

Runtime configurations at Job level

After you have set service, application quotas and runtime configurations at application level, you also have an option to override or add new configurations at the job level as well. For example, you can use different Spark job parameters to define how many maximum executors can be run by that specific job. One such parameter is spark.dynamicAllocation.maxExecutors which defines an upper bound for the number of executors in a job and therefore controls the number of workers in an EMR Serverless application because each executor runs within a single worker. This parameter is part of the dynamic allocation feature of Apache Spark, which allows you to dynamically scale the number of executors(workers) registered with the job up and down based on the workload. Dynamic allocation is enabled by default on EMR Serverless. For detailed steps, refer to Declaring configurations at application level.

With these configurations, you can control the resources used across accounts, applications, and jobs. For example, you can create applications with a predefined maximum capacity to constrain costs or configure jobs with resource limits in order to allow multiple ad hoc jobs to run simultaneously without consuming too many resources.

Best practices and considerations

Extending these usage scenarios further, EMR Serverless provides features and capabilities to implement the following design considerations and best practices based on your workload requirements:

  • To make sure that the users or teams submit their jobs only to their approved applications, you could use tag based AWS Identity and Access Management (IAM) policy conditions. For more details, refer to Using tags for access control.
  • You can use custom images as applications belonging to different teams that have distinct use-cases and software requirements. Using custom images is possible EMR 6.9.0 and onwards. Custom images allows you to package various application dependencies into a single container. Some of the important benefits of using custom images include the ability to use your own JDK and Python versions, apply your organization-specific security policies and integrate EMR Serverless into your build, test and deploy pipelines. For more information, refer to Customizing an EMR Serverless image.
  • If you need to estimate how much a Spark job would cost when run on EMR Serverless, you can use the open-source tool EMR Serverless Estimator. This tool analyzes Spark event logs to provide you with the cost estimate. For more details, refer to Amazon EMR Serverless cost estimator
  • We recommend that you determine your maximum capacity relative to the supported worker sizes by multiplying the number of workers by their size. For example, if you want to limit your application with 50 workers to 2 vCPUs, 16 GB of memory and 20 GB of disk, set the maximum capacity to 100 vCPU, 800 GB of memory, and 1000 GB of disk.
  • You can use tags when you create the EMR Serverless application to help search and filter your resources, or track the AWS costs using AWS Cost Explorer. You can also use tags for controlling who can submit jobs to a particular application or modify its configurations. Refer to Tagging your resources for more details.
  • You can configure the pre-initialized capacity at the time of application creation, which keeps the resources ready to be consumed by the time-sensitive jobs you submit.
  • The number of concurrent jobs you can run depends on important factors like maximum capacity limits, workers required for each job, and available IP address if using a VPC.
  • EMR Serverless will setup elastic network interfaces (ENIs) to securely communicate with resources in your VPC. Make sure you have enough IP addresses in your subnet for the job.
  • It’s a best practice to select multiple subnets from multiple Availability Zones. This is because the subnets you select determine the Availability Zones that are available to run the EMR Serverless application. Each worker uses an IP address in the subnet where it is launched. Make sure the configured subnets have enough IP addresses for the number of workers you plan to run.

Resource usage tracking

EMR Serverless not only allows cloud administrators to limit the resources for each application, it also enables them to monitor the applications and track the usage of resources across these applications. For more details, refer to  EMR Serverless usage metrics .

You can also deploy an AWS CloudFormation template to build a sample CloudWatch Dashboard for EMR Serverless which would help visualize various metrics for your applications and jobs. For more information, refer to EMR Serverless CloudWatch Dashboard.

Conclusion

In this post, we discussed how EMR Serverless empowers cloud and data platform administrators to efficiently distribute as well as restrict the cloud resources at different levels, for different organizational units, users and teams, as well as between critical and non-critical workloads. EMR Serverless resource limiting features make sure cloud cost is under control and resource usage is tracked effectively.

For more information on EMR Serverless applications and resource quotas, please refer to EMR Serverless User Guide and Configuring an application.


About the Authors

Gaurav Sharma is a Specialist Solutions Architect(Analytics) at Amazon Web Services (AWS), supporting US public sector customers on their cloud journey. Outside of work, Gaurav enjoys spending time with his family and reading books.

Damon Cortesi is a Principal Developer Advocate with Amazon Web Services. He builds tools and content to help make the lives of data engineers easier. When not hard at work, he still builds data pipelines and splits logs in his spare time.

Overload to Overhaul: How We Upgraded Drive Stats Data

Post Syndicated from David Winings original https://www.backblaze.com/blog/overload-to-overhaul-how-we-upgraded-drive-stats-data/

A decorative image showing the words "overload to overhaul: how we upgraded Drive Stats data."

This year, we’re celebrating 10 years of Drive Stats. Coincidentally, we also made some upgrades to how we run our Drive Stats reports. We reported on how an attempt to migrate triggered a weeks-long recalculation of the dataset, leading us to map the architecture of the Drive Stats data. 

This follow-up article focuses on the improvements we made after we fixed the existing bug (because hey, we were already in there), and then presents some of our ideas for future improvements. Remember that those are just ideas so far—they may not be live in a month (or ever?), but consider them good food for thought, and know that we’re paying attention so that we can pass this info along to the right people.

Now, onto the fun stuff. 

Quick Refresh: Drive Stats Data Architecture

The podstats generator runs on every Storage Pod, what we call any host that holds customer data, every few minutes. It’s a C++ program that collects SMART stats and a few other attributes, then converts them into an .xml file (“podstats”). Those are then pushed to a central host in each datacenter and bundled. Once the data leaves these central hosts, it has entered the domain of what we will call Drive Stats.  

Now let’s go into a little more detail: when you’re gathering stats about drives, you’re running a set of modules with dependencies to other modules, forming a data-dependency tree. Each time a module “runs”, it takes information, modifies it, and writes it to a disk. As you run each module, the data will be transformed sequentially. And, once a quarter, we run a special module that collects all the attributes for our Drive Stats reports, collecting data all the way down the tree. 

Here’s a truncated diagram of the whole system, to give you an idea of what the logic looks like:

A diagram of the mapped logic of the Drive Stats modules.
An abbreviated logic map of Drive Stats modules.

As you move down through the module layers, the logic gets more and more specialized. When you run a module, the first thing the module does is check in with the previous module to make sure the data exists and is current. It caches the data to disk at every step, and fills out the logic tree step by step. So for example, drive_stats, being a “per-day” module, will write out a file such as /data/drive_stats/2023-01-01.json.gz when it finishes processing. This lets future modules read that file to avoid repeating work.

This work deduplication process saves us a lot of time overall—but it also turned out to be the root cause of our weeks-long process when we were migrating Drive Stats to our new host. We fixed that by implementing versions to each module.  

While You’re There… Why Not Upgrade?

Once the dust from the bug fix had settled, we moved forward to try to modernize Drive Stats in general. Our daily report still ran quite slowly, on the order of several hours, and there was some low-hanging fruit to chase.

Waiting On You, failures_with_stats

First things first, we saved a log of a run of our daily reports in Jenkins. Then we wrote an analyzer to see which modules were taking a lot of time. failures_with_stats was our biggest offender, running for about two hours, while every other module took about 15 minutes.

An image showing runtimes for each module when running a Drive Stats report.
Not quite two hours.

Upon investigation, the time cost had to do with how the date_range module works. This takes us back to caching: our module checks if the file has been written already, and if it has, it uses the cached file. However, a date range is written to a single file. That is, Drive Stats will recognize “Monday to Wednesday” as distinct from “Monday to Thursday” and re-calculate the entire range. This is a problem for a workload that is essentially doing work for all of time, every day.  

On top of this, the raw Drive Stats data, which is a dependency for failures_with_stats, would be gzipped onto a disk. When each new query triggered a request to recalculate all-time data, each dependency would pick up the podstats file from disk, decompress it, read it into memory, and do that for every day of all time. We were picking up and processing our biggest files every day, and time continued to make that cost larger.

Our solution was what I called the “Date Range Accumulator.” It works as follows:

  • If we have a date range like “all of time as of yesterday” (or any partial range with the same start), consider it as a starting point.
  • Make sure that the version numbers don’t consider our starting point to be too old.
  • Do the processing of today’s data on top of our starting point to create “all of time as of today.”

To do this, we read the directory of the date range accumulator, find the “latest” valid one, and use that to determine the delta (change) to our current date. Basically, the module says: “The last time I ran this was on data from the beginning of time to Thursday. It’s now Friday. I need to run the process for Friday, and then add that to the compiled all-time.” And, before it does that, it double checks the version number to avoid errors. (As we noted in our previous article, if it doesn’t see the correct version number, instead of inefficiently running all data, it just tells you there is a version number discrepancy.) 

The code is also a bit finicky—there are lots of snags when it comes to things like defining exceptions, such as if we took a drive out of the fleet, but it wasn’t a true failure. The module also needed to be processable day by day to be usable with this technique.

Still, even with all the tweaks, it’s massively better from a runtime perspective for eligible candidates. Here’s our new failures_with_stats runtime: 

An output of module runtime after the Drive Stats improvements were made.
Ahh, sweet victory.

Note that in this example, we’re running that 60-day report. The daily report is quite a bit quicker. But, at least the 60-day report is a fixed amount of time (as compared with the all-time dataset, which is continually growing). 

Code Upgrade to Python 3

Next, we converted our code to Python 3. (Shout out to our intern, Anath, who did amazing work on this part of the project!) We didn’t make this improvement just to make it; no, we did this because I wanted faster JSON processors, and a lot of the more advanced ones did not work with Python 2. When we looked at the time each module took to process, most of that was spent serializing and deserializing JSON.

What Is JSON Parsing?

JSON is an open standard file format that uses human readable text to store and transmit data objects. Many modern programming languages include code to generate and parse JSON-format data. Here’s how you might describe a person named John, aged 30, from New York using JSON: 

{ 
“firstName”: “John”, 
“age”: 30,
“State”: “New York”
}

You can express those attributes into a single line of code and define them as a native object:

x = { 'name':'John', 'age':30, 'city':'New York'}

“Parsing” is the process by which you take the JSON data and make it into an object that you can plug into another programming language. You’d write your script (program) in Python, it would parse (interpret) the JSON data, and then give you an answer. This is what that would look like: 

import json

# some JSON:
x = '''
{ 
	"firstName": "John", 
	"age": 30,
	"State": "New York"
}
'''

# parse x:
y = json.loads(x)

# the result is a Python object:
print(y["name"])

If you run this script, you’ll get the output “John.” If you change print(y["name"]) to print(y["age"]), you’ll get the output “30.” Check out this website if you want to interact with the code for yourself. In practice, the JSON would be read from a database, or a web API, or a file on disk rather than defined as a “string” (or text) in the Python code. If you are converting a lot of this JSON, small improvements in efficiency can make a big difference in how a program performs.

And Implementing UltraJSON

Upgrading to Python 3 meant we could use UltraJSON. This was approximately 50% faster than the built-in Python JSON library we used previously. 

We also looked at the XML parsing for the podstats files, since XML parsing is often a slow process. In this case, we actually found our existing tool is pretty fast (and since we wrote it 10 years ago, that’s pretty cool). Off-the-shelf XML parsers take quite a bit longer because they care about a lot of things we don’t have to: our tool is customized for our Drive Stats needs. It’s a well known adage that you should not parse XML with regular expressions, but if your files are, well, very regular, it can save a lot of time.

What Does the Future Hold?

Now that we’re working with a significantly faster processing time for our Drive Stats dataset, we’ve got some ideas about upgrades in the future. Some of these are easier to achieve than others. Here’s a sneak peek of some potential additions and changes in the future.

Data on Data

In keeping with our data-nerd ways, I got curious about how much the Drive Stats dataset is growing and if the trend is linear. We made this graph, which shows the baseline rolling average, and has a trend line that attempts to predict linearly.

A graph showing the rate at which the Drive Stats dataset has grown over time.

I envision this graph living somewhere on the Drive Stats page and being fully interactive. It’s just one graph, but this and similar tools available on our website would be 1) fun and 2) lead to some interesting insights for those who don’t dig in line by line. 

What About Changing the Data Module?

The way our current module system works, everything gets processed in a tree approach, and they’re flat files. If we used something like SQLite or Parquet, we’d be able to process data in a more depth-first way, and that would mean that we could open a file for one module or data range, process everything, and not have to read the file again. 

And, since one of the first things that our Drive Stats expert, Andy Klein, does with our .xml data is to convert it to SQLite, outputting it in a queryable form would save a lot of time. 

We could also explore keeping the data as a less-smart filetype, but using something more compact than JSON, such as MessagePack.

Can We Improve Failure Tracking and Attribution?

One of the odd things about our Drive Stats datasets is that they don’t always and automatically agree with our internal data lake. Our Drive Stats outputs have some wonkiness that’s hard to replicate, and it’s mostly because of exceptions we build into the dataset. These exceptions aren’t when a drive fails, but rather when we’ve removed it from the fleet for some other reason, like if we were testing a drive or something along those lines. (You can see specific callouts in Drive Stats reports, if you’re interested.) It’s also where a lot of Andy’s manual work on Drive Stats data comes in each month: he’s often comparing the module’s output with data in our datacenter ticket tracker.

These tickets come from the awesome data techs working in our data centers. Each time a drive fails and they have to replace it, our techs add a reason for why it was removed from the fleet. While not all drive replacements are “failures”, adding a root cause to our Drive Stats dataset would give us more confidence in our failure reporting (and would save Andy comparing the two lists). 

The Result: Faster Drive Stats and Future Fun

These two improvements (the date range accumulator and upgrading to Python 3) resulted in hours, and maybe even days, of work saved. Even from a troubleshooting point of view, we often wouldn’t know if the process was stuck, or if this was the normal amount of time the module should take to run. Now, if it takes more than about 15 minutes to run a report, you’re sure there’s a problem. 

While the Drive Stats dataset can’t really be called “big data”, it provides a good, concrete example of scaling with your data. We’ve been collecting Drive Stats for just over 10 years now, and even though most of the code written way back when is inherently sound, small improvements that seem marginal become amplified as datasets grow. 

Now that we’ve got better documentation of how everything works, it’s going to be easier to keep Drive Stats up-to-date with the best tools and run with future improvements. Let us know in the comments what you’d be interested in seeing.

The post Overload to Overhaul: How We Upgraded Drive Stats Data appeared first on Backblaze Blog | Cloud Storage & Cloud Backup.

The collective thoughts of the interwebz

By continuing to use the site, you agree to the use of cookies. more information

The cookie settings on this website are set to "allow cookies" to give you the best browsing experience possible. If you continue to use this website without changing your cookie settings or you click "Accept" below then you are consenting to this.

Close