Creating fair governance models for open-source projects is not
easy; defining criteria for participants to receive membership and
voting rights is a particularly thorny problem for projects that have
elections for representative bodies. The Fedora
Council, the project’s top-level governance body, is wrestling
with that conundrum now. This was triggered by a Fedora special-interest
group (SIG) granting temporary membership to at least one person for the
sole purpose of allowing them to vote in the most recent Fedora
Engineering Steering Council (FESCo) election. That opened a large can
of worms about what it means to be a contributor and how contributors
can be identified for voting purposes.
On January 28, 2026, SolarWinds published an advisory for multiple new vulnerabilities affecting their Web Help Desk product. Web Help Desk is an IT help desk ticketing and asset management software solution. Of the six new CVEs disclosed in the advisory, four are critical, and allow a remote attacker to either achieve unauthenticated remote code execution (RCE) or bypass authentication.
As of this writing, there is currently no known in-the-wild exploitation occurring. However, we expect this to change as and when technical details become available. Notably, this product has been featured on CISA’s Known Exploited Vulnerabilities (KEV) list twice in the past, circa 2024, indicating that it is a target for real-world attackers.
Both CVE-2025-40551 and CVE-2025-40553 are critical deserialization of untrusted data vulnerabilities that allow a remote unauthenticated attacker to achieve RCE on a target system and execute payloads such as arbitrary OS command execution. RCE via deserialization is a highly reliable vector for attackers to leverage, and as these vulnerabilities are exploitable without authentication, the impact of either of these two vulnerabilities is significant.
The other two critical vulnerabilities, CVE-2025-40552 and CVE-2025-40554, are authentication bypasses that allow a remote unauthenticated attacker to execute actions or methods on a target system which are intended to be gated by authentication. Based upon the vendor supplied CVSS scores for these two authentication bypass vulnerabilities, the impact is equivalent to the two RCE deserialization vulnerabilities, likely meaning they can also be leveraged for RCE.
In addition to the four critical vulnerabilities, two high severity vulnerabilities were also disclosed. CVE-2025-40536 is an access control bypass vulnerability, allowing an attacker to access functionality on the target system that is intended to be restricted to authenticated users. Separately, CVE-2025-40537 may, under certain conditions, allow access to some administrative functionality on the target system due to the existence of hardcoded credentials.
SolarWinds Web Help Desk versions 12.8.8 Hotfix 1 and below.
Customers are advised to update to the latest Web Help Desk version, 2026.1, on an urgent basis outside of normal patching cycles.
For the latest mitigation guidance for SolarWinds Web Help Desk, please refer to the vendor’s security advisory.
Rapid7 customers
Exposure Command, InsightVM, and Nexpose customers can assess their exposure to CVE-2025-40551, CVE-2025-40552, CVE-2025-40553 and CVE-2025-40554 with remote vulnerability checks expected to be available in today’s (28 Jan) content release.
AWS CloudFormation enables you to model and provision your cloud application infrastructure as code-base templates. Whether you prefer writing templates directly in JSON or YAML, or using programming languages like Python, Java, and TypeScript with the AWS Cloud Development Kit (CDK), CloudFormation and CDK provide the flexibility you need. For organizations adopting multi-account strategies, CloudFormation StackSets offers a powerful capability to deploy resources across multiple regions and accounts in parallel.
In 2025, we delivered a comprehensive set of major enhancements focused on three core areas: reducing dev-test cycle through early validation, improving deployment safety with improved configuration drift management, and integrating IaC context to AI-powered development tools.
These launches address common pain points in infrastructure development workflows, from catching deployment errors before resource provisioning to managing configuration drift systematically. The features span the entire development lifecycle, from template authoring in your IDE to multi-account deployments at scale.
This blog provides an overview of the key capabilities we launched in 2025 and how they improve your infrastructure development workflow.
Accelerating Development Cycles
Early Validation & Enhanced Troubleshooting: Pre-Deployment Error Detection
CloudFormation now validates your templates during change set (preview of infrastructure changes before deployment) creation, catching common deployment errors before resource provisioning begins. The validation checks for invalid property syntax, resource name conflicts with existing resources in your account, and S3 bucket emptiness constraints on delete operations.
Figure 1: Pre-deployment validations view
When validation fails, the change set status shows ‘FAILED’ with detailed information about each issue, including the property path where problems occur. This early feedback helps you fix issues faster rather than waiting for deployment failures.
Figure 2: Validation of Invalid ENUM value for nested property
Improved Deployment troubleshooting
For runtime errors that occur during deployment, every stack operation now receives a unique operation ID. You can filter stack events by operation ID to quickly identify root causes, reducing troubleshooting time from minutes to seconds. The new describe-events API provides grouped access to events. You can query events for a specific operation, filter to FAILED status events, and extract the root cause without parsing through the entire stack event history.
CloudFormation IDE Experience: Language Server Protocol Integration
We launched the AWS CloudFormation Language Server, bringing end-to-end infrastructure development directly into your IDE. Available through the AWS Toolkit for Visual Studio Code, Kiro, and other compatible IDEs, this capability transforms how you author CloudFormation templates.
Figure 1: Initializing a CloudFormation project with environment configuration
The Language Server provides context-aware auto-completion that understands CloudFormation semantics. When you define resources, it suggests only required properties automatically, while optional properties appear on hover. Built-in validation catches issues before deployment integrating early validation capabilities, flagging invalid resource properties, missing IAM permissions, and security policy violations using CloudFormation Guard.
Figure 2: Hover information displaying optional properties and their documentation
The drift-aware deployment view highlights differences between your template and deployed infrastructure, helping you spot configuration changes made outside CloudFormation. The Language Server also provides semantic navigation features, go-to-definition for logical IDs, find-all-references for resource dependencies, and hover documentation that pulls from the CloudFormation resource specification. These features work across intrinsic functions like !Ref, !GetAtt, and !Sub, understanding the CloudFormation template structure. By integrating validation and real-time feedback directly into your authoring experience, the Language Server keeps you in flow state, reducing context switching between your IDE, AWS Console, and documentation.
Figure 3: Type-aware completions for intrinsic functions like !GetAtt & !Ref
Stack Refactoring: Adapt your infrastructure to your organization evolution
Stack Refactoring enables you to reorganize your CloudFormation and CDK infrastructure without disrupting deployed resources. You can move resources between stacks, rename logical IDs, and decompose monolithic stacks into focused components while maintaining resource stability and operational state.
Whether you’re modernizing legacy stacks, aligning infrastructure with evolving architectural patterns, or improving long-term maintainability, Stack Refactoring adapts your CloudFormation and CDK organization to changing requirements. The console and CDK experience, launched this year, extends the earlier CLI capability, making refactoring accessible through your preferred interface.
Configuration drift occurs when infrastructure managed by CloudFormation is modified through the AWS Console, SDK, or CLI. Drift-aware change sets address this challenge by providing a three-way comparison between your new template, last-deployed template, and actual infrastructure state.
Figure 4: Examine the drift-aware change set to see the dangerous memory reduction that would occur
This capability helps you prevent unexpected overwrites of drift. If your change set preview shows unintended changes, you can update your template values and recreate the change set before deployment. During execution, CloudFormation matches resource properties with template values and recreates resources deleted outside of CloudFormation.
Drift-aware change sets enable you to systematically revert drift and keep infrastructure in sync with templates, strengthening reproducibility for testing and disaster recovery while maintaining your security posture.
AWS CloudFormation Hooks now supports managed proactive controls, enabling customers to validate resource configurations against AWS best practices without writing custom Hooks logic. Customers can select controls from the AWS Control Tower Controls Catalog and apply them during CloudFormation operations. When using CloudFormation, customers can configure these controls to run in warn mode, allowing teams to test controls without blocking deployments and giving them the flexibility to evaluate control behavior before enforcing policies in production. This significantly reduces setup time, eliminates manual errors, and ensures comprehensive governance coverage across your infrastructure.
AWS also introduced a new Hooks Invocation Summary page in the CloudFormation console. This centralized view provides a complete historical record of Hooks activity, showing which controls were invoked, their execution details, and outcomes such as pass, warn, or fail. This simplifies compliance reporting issues faster.
With this launch, customers can now leverage AWS-managed controls as part of their provisioning workflows, eliminating the overhead of writing and maintaining custom logic. These controls are curated by AWS and aligned with industry best practices, helping teams enforce consistent policies across all environments. The new summary page delivers essential visibility into Hook invocation history, enabling faster issue resolution and streamlined compliance reporting.
CloudFormation StackSets now supports deployment ordering for auto-deployment mode, enabling you to define the sequence in which stack instances automatically deploy across accounts and regions. This capability coordinates complex multi-stack deployments where foundational infrastructure must be provisioned before dependent application components.
When creating or updating a StackSet, you can specify up to 10 dependencies per stack instance using the DependsOn parameter in the AutoDeployment configuration. StackSets automatically orchestrates deployments based on your defined relationships. For example, you can ensure networking and security stack instances complete deployment before application stack instances begin, preventing deployment failures due to missing dependencies.
StackSets includes built-in cycle detection to prevent circular dependencies and provides error messages to help resolve configuration issues. This feature is available at no additional cost in all AWS Regions where CloudFormation StackSets is available.
We introduced the AWS Infrastructure-as-Code (IaC) MCP Server, bridging AI assistants with your AWS infrastructure development workflow. Built on the Model Context Protocol (MCP), this server enables AI assistants like Kiro CLI, Claude, or Cursor to help you search CloudFormation and CDK documentation, validate templates, troubleshoot deployments, and follow best practices, all while maintaining the security of local execution.
Figure 1: Kiro-CLI with AWS IaC MCP server
The IaC MCP Server provides nine specialized tools organized into two categories. Remote documentation search tools connect to AWS knowledge bases to retrieve up-to-date information about CloudFormation resources, CDK APIs, and implementation guidance. Local validation and troubleshooting tools run entirely on your machine, performing syntax validation with cfn-lint, security checks with CloudFormation Guard, and deployment failure analysis with integrated CloudTrail events.
Figure 4: Validate my CloudFormation template with AWS IaC MCP Server
Key Use Cases
Intelligent Documentation Assistant
Instead of manually searching through documentation, ask your AI assistant natural language questions:
“How do I create an S3 bucket with encryption enabled in CDK?”
The server searches CDK best practice and samples, returning relevant code examples and explanations.
2. Proactive Template Validation
Before deploying infrastructure changes:
User: “Validate my CloudFormation template and check for security issues”
AI Agent: [Uses validate_cloudformation_template and check_cloudformation_template_compliance]
“Found 2 issues: Missing encryption on EBS volumes,
and S3 bucket lacks public access block configuration”
3. Rapid Deployment Troubleshooting
When a stack deployment fails:
User: “My stack ‘stack_03’ in us-east-1 failed to deploy. What happened?”
AI Agent: [Uses troubleshoot_stack_deployment with CloudTrail integration]
“The deployment failed due to insufficient IAM permissions.
CloudTrail shows AccessDenied for ec2:CreateVpc.
You need to add VPC permissions to your deployment role.”
4. Learning and Exploration
New to AWS CDK? The server helps you discover constructs and patterns:
User: “Show me how to build a serverless API”
AI Agent: [Searches CDK constructs and samples]
“Here are three approaches using API Gateway + Lambda…”
As we begin 2026, our focus remains on making infrastructure deployment faster, safer, and more manageable. The launches in 2025 reflect our commitment to solving real customer challenges and improving the CloudFormation developer experience. From intelligent IDE integrations to AI-powered assistance, these capabilities help you build infrastructure with greater confidence and efficiency.
We encourage you to try these features and share your feedback. For detailed information about any of these launches, visit our documentation or check out the AWS DevOps Blog.
Data teams today struggle with fragmented tools, complex infrastructure provisioning, and hours spent writing boilerplate code to connect to data sources. This forces analysts, data scientists, and engineers to work in separate environments, which slows collaboration and time to insight. Since our launch of Amazon SageMaker Unified Studio in March 2025, leading companies such as Bayer, NatWest, and Carrier have adopted it to bring their data teams into one collaborative workspace with unified tools, straightforward infrastructure provisioning, and fast connections to data sources.
Continuing our mission to provide faster time-to-value for customers, in November 2025, we announced Amazon SageMaker notebooks, a serverless workspace with a built-in AI agent in Amazon SageMaker Unified Studio. You can now launch a notebook in seconds, generate code from natural language prompts, and connect automatically to data across Amazon Simple Storage Service (Amazon S3), Amazon Redshift, third-party databases, and more from a single environment without needing to pre-provision or tune data processing infrastructure. Inside these serverless notebooks, analysts can perform SQL queries, data scientists can execute Python code, and data engineers can process large-scale data jobs in Spark within a single workspace. Together with the new one-click onboarding available for SageMaker Unified Studio, customers can go from their existing AWS data to running analytics and machine learning workloads much faster, spending their time on analysis rather than setup and configuration.
In this post, we walk you through how these new capabilities in SageMaker Unified Studio can help you consolidate your fragmented data tools, reduce time to insight, and collaborate across your data teams. Here’s a short demo of the new capabilities:
One-click onboarding of existing AWS datasets
Get started exploring your data with one-click onboarding that provisions and configures environments in minutes instead of weeks. The new onboarding experience can reuse existing AWS Identity and Access Management (IAM) roles to provide access to SageMaker Unified Studio, automatically connecting to data sources across S3 buckets, S3 Tables, AWS Glue Data Catalog, and AWS Lake Formation policies, removing the need for additional data permission setup. Under the covers, a new IAM-based domain and project are created with default notebook and compute resources preconfigured. When complete, you enter SageMaker Unified Studio with all your tools available in the left-side navigation along with built-in samples to accelerate first use, as seen in the following screenshot.
“New features with Amazon Sagemaker will unlock a new paradigm of innovation, allowing Codex to significantly accelerate time-to-value for our customers, and transform them from aging to agentic in weeks, not months.“
– Abhinav Sharma, Chief Data Officer, Codex
You can start directly from Amazon SageMaker, Amazon Athena, Amazon Redshift, or Amazon S3 Tables, giving them a fast path from their existing tools and data to the unified experience in SageMaker Unified Studio. After you choose Get Started and specify an IAM role, SageMaker automatically creates a project with the existing data permissions intact from Data Catalog, Lake Formation, and Amazon S3. As a result, teams can immediately discover and act on their data using the existing data permissions and infrastructure.
The fully managed, web-based notebooks in SageMaker Unified Studio support multiple programming languages, letting you write Python, SQL, and Spark code in the same notebook. The infrastructure adjusts automatically based on your workload, while built-in libraries create charts and insights directly in your workflow. When your analysis scales beyond interactive queries to large-scale data processing, Amazon Athena for Apache Spark engine delivers optimized performance, integrating with the serverless notebook experience to execute analytical workloads efficiently. This serverless approach eliminates the need to provision clusters or maintain servers, reducing the time from question to insight.
“The new SageMaker interface brings clarity and speed to the entire ML lifecycle. Its developer-friendly design has made our experimentation and delivery significantly faster,“
– Sachin Mittal, Product Manager at Deloitte.
As shown in the preceding image, the notebook gives data engineers, analysts, and data scientists one place to perform SQL queries, execute Python code, process large-scale data jobs, run machine learning workloads, and create visualizations without having to switch between tools.
AI-assisted development with Data Agent
To accelerate development further, the new SageMaker Data Agent helps create SQL, Python, or Spark code using natural language prompts. Instead of spending hours writing boilerplate code to connect to your data sources and understand schemas, you can describe what you want to accomplish. The agent analyzes data catalog metadata about your available datasets, schemas, and relationships to provide context-aware assistance.
In the preceding example image, if you prompt Build and analyze a complete sales forecast based on the sample retail data, the agent helps identify the relevant tables and suggests the appropriate joins and analysis approach, transforming what might take hours into minutes. To try this yourself, navigate to the Overview tab in your SageMaker Studio environment and look for the Retail Sales Forecasting with SageMaker XGBoost notebook in the sample notebooks collection—these examples are automatically available when you first set up SageMaker Studio. The agent breaks down complex analytical workflows into manageable, executable steps, so you can move from question to insight faster.
Learn more about SageMaker
In this post, we focused on three new SageMaker Unified Studio capabilities recently made available, but they’re a fraction of the more than 40 launches last year. Here’s a list of videos of re:Invent sessions and the measurable results from leading organizations adopting SageMaker Unified Studio, including:
NatWest Group plans to scale to 72,000 employees having federated data access using SageMaker Unified Studio. Watch their presentation.
Commonwealth Bank of Australia migrated 10 petabytes and 61,000 pipelines into AWS and has setup SageMaker Unified Studio to provide unified access to 40 different lines of business in their ongoing data transformation journey. Watch their presentation.
Carrier Global Corporation improved natural language to SQL agent accuracy by 38% through the SageMaker Catalog’s governed metadata and business glossary. Watch their presentation.
Bayer is now positioned to onboard over 300 TB of biomarker data and integrate siloed omics, clinical, and chemistry data repositories into a cohesive environment built on Amazon SageMaker. Read their story.
Conclusion
Using Amazon SageMaker Unified Studio serverless notebooks, AI-assisted development, and unified governance, you can speed up your data and AI workflows across data team functions while maintaining security and compliance. To learn more visit the SageMaker product page or get started in the SageMaker console.
Customers need solutions to track inventory data such as files and software across Amazon Elastic Compute Cloud (Amazon EC2) instances, detect unauthorized changes, and integrate alerts into their existing security workflows.
In this blog post, I walk you through a highly scalable serverless file integrity monitoring solution. It uses AWS Systems Manager Inventory to collect file metadata from Amazon EC2 instances. The metadata is sent through the Systems Manager Resource Data Sync feature to a versioned Amazon Simple Storage Service (Amazon S3) bucket, storing one inventory object for each EC2 instance. Each time a new object is created in Amazon S3, an Amazon S3 Event Notification triggers a custom AWS Lambda function. This Lambda function compares the latest inventory version with the previous one to detect file changes. If a file that isn’t expected to change has been created, modified, or deleted, the function creates an actionable finding in AWS Security Hub. Findings are then ingested by Amazon Security Lake in a standard OCSF format, which centralizes and normalizes the data. Finally, the data can be analyzed using Amazon Athena for one-time queries, or by building visual dashboards with Amazon QuickSight and Amazon OpenSearch Service. Figure 1 summarizes this flow:
Figure 1: File integrity monitoring workflow
This integration offers an alternative to the default AWS Config and Security Hub integration, which relies on limited data (for example, no file modification timestamps). The solution presented in this post provides control and flexibility to implement custom logic tailored to your operational needs and support security-related efforts.
This flexible solution can also be used with other Systems Manager Inventory metadata, such as installed applications, network configurations, or Windows registry entries, enabling custom detection logic across a wide range of operational and security use cases.
Now let’s build the file integrity monitoring solution.
Prerequisites
Before you get started, you need an AWS account with permissions to create and manage AWS resources such as Amazon EC2, AWS Systems Manager, Amazon S3, and Lambda.
Step 1: Start an EC2 instance
Start by launching an EC2 instance and creating a file that you will later modify to simulate an unauthorized change.
Open the AWS Management Console and go to IAM, choose Roles from the navigation pane, and then choose Create role.
Under Trusted entity type, select AWS service, select EC2 as the use case, and choose Next.
On the Add permissions page, search for and select the AmazonSSMManagedInstanceCore IAM policy, then choose Next.
Enter SSMAccessRole as the role name and choose Create role.
The new SSMAccessRole should now appear in your list of IAM roles:
Figure 2: Create an IAM role for communication with Systems Manager
Start an EC2 instance:
Open the Amazon EC2 console and choose Launch Instance.
Enter a Name, keep the default Linux Amazon Machine Image (AMI), and select an Instance type (for example, t3.micro).
Under Advanced details:
IAM instance profile, select the previously created SSMAccessRole
Create a fictitious payment application configuration file in the /etc/paymentapp/ folder on the EC2 instance. Later, you will modify it to demonstrate a file-change event for integrity monitoring. To create this file during EC2 startup, copy and paste the following script into User data.
Figure 3: Adding the application configuration file
Leave the remaining settings as default, choose Proceed without key pair, and then select Launch Instance. A key pair isn’t required for this demo because you use Session Manager for access.
Step 2: Enable Security Hub and Security Lake
If Security Hub and Security Lake are already enabled, you can skip to Step 3. To start, enable Security Hub, which collects and aggregates security findings. AWS Security Hub CSPM adds continuous monitoring and automated checks against best practices.
Open the Security Hub console.
Choose Security Hub CSPM from the navigation pane and then select Enable AWS Security Hub CSPM and choose Enable Security Hub CSPM at the bottom of the page.
Note: For this demo, you don’t need the Security standards options and can clear them.
Figure 4: Enable Security Hub CSP
Next, activate Security Lake to start collecting actionable findings from Security Hub:
Open the Amazon Security Lake console and choose Get Started.
Under Data sources, select Ingest specific AWS sources.
Under Log and event sources, select Security Hub (you will use this only for this demo):
Figure 5: Select log and event sources
Under Select Regions, choose Specific Regions and make sure you select the AWS Region that you’re using.
Use the default option to Create and use a new service role.
Choose Next and Next again, then choose Create.
Step 3: Configure Systems Manager Inventory and sync to Amazon S3
With Security Hub and Security Lake enabled, the next step is to enable Systems Manager Inventory to collect file metadata and configure a Resource Data Sync to export this data to S3 for analysis.
After you created the bucket, enable versioning in the Amazon S3 console by opening the bucket’s Properties tab, choosing Edit under Bucket Versioning, selecting Enable, and saving your changes. Versioning causes each new inventory snapshot to be saved as a separate version, so that you can track file changes over time.
The next step is to enable Systems Manager Inventory and set up the resource data sync:
In the Systems Manager console, go to Fleet Manager, choose Account management, and select Set up inventory.
Keep the default values but deselect every inventory type except File. Set a Path to limit collection to the files relevant for this demo and your security requirements. Under File, set the Path to: /etc/paymentapp/.
Figure 6: Set the parameters and path
Choose Setup Inventory.
In Fleet Manager, choose Account management and select Resource Data Syncs.
Choose Create resource data sync, enter a Sync name, and enter the name of the versioned S3 bucket you created earlier.
Select This Region and then choose Create.
Step 4: Implement the Lambda function
Next, complete the setup to detect changes and create findings. Each time Systems Manager Inventory writes a new object to Amazon S3, an S3 Event Notification triggers a Lambda function that compares the latest and previous object versions. If it finds created, modified, or deleted files, it creates a security finding. To accomplish this, you will create the Lambda function, set its environment variables, add the helper layer, and attach the required permissions.
The following is an example finding generated in AWS Security Finding Format (ASFF) and sent to Security Hub. In this example, you see a notification about a file change on the EC2 instance listed under the Resources section.
This function detects file changes, reports findings, and removes unused Amazon S3 object versions to reduce costs.
Open the Lambda console and choose Create function in the navigation pane.
For Function Name enter fim-change-detector.
Select Author from scratch, enter a function name, select the latest Python runtime, and choose Create function.
On the Code tab, paste the following main function and choose Deploy.
import boto3, os, json, re
from datetime import datetime, UTC
from urllib.parse import unquote_plus
from helpers import is_critical, load_file_metadata, is_modified, extract_instance_id

s3 = boto3.client('s3')
securityhub = boto3.client('securityhub')

CRITICAL_FILE_PATTERNS = os.environ["CRITICAL_FILE_PATTERNS"].split(",")
SEVERITY_LABEL = os.environ["SEVERITY_LABEL"]

def lambda_handler(event, context):
	# Safe event handling
	if "Records" not in event or not event["Records"]:
		return

	# Extract S3 event
	record = event['Records'][0]
	bucket = record['s3']['bucket']['name']
	key = unquote_plus(record['s3']['object']['key'])
	current_version = record['s3']['object'].get('versionId')
	if not current_version:
		return

	# Fetching the region name
	account_id = context.invoked_function_arn.split(":")[4]
	region = boto3.session.Session().region_name

	# Get object versions (latest first)
	versions = s3.list_object_versions(Bucket=bucket, Prefix=key).get('Versions', [])
	versions = sorted(versions, key=lambda v: v['LastModified'], reverse=True)

	# Find previous version
	idx = next((i for i,v in enumerate(versions) if v["VersionId"] == current_version), None)
	if idx is None or idx + 1 >= len(versions):
		return
	prev_version = versions[idx+1]["VersionId"]

	# Load both versions
	current = load_file_metadata(bucket, key, current_version)
	previous = load_file_metadata(bucket, key, prev_version)

	# Compare
	created = {p for p in set(current) - set(previous) if is_critical(p)}
	deleted = {p for p in set(previous) - set(current) if is_critical(p)}
	modified = {p for p in set(current) & set(previous) if is_critical(p) and is_modified(p, current, previous)}

	# Report if changes were found
	if created or deleted or modified:
		instance_id = extract_instance_id(bucket, key, current_version)
		now = datetime.now(UTC).isoformat(timespec='milliseconds').replace('+00:00', 'Z')
		finding = {
			"SchemaVersion": "2018-10-08",
			"Id": f"fim-{instance_id}-{now}",
			"ProductArn": f"arn:aws:securityhub:{region}:{account_id}:product/{account_id}/default",
			"AwsAccountId": account_id,
			"GeneratorId": "ssm-inventory-fim",
			"CreatedAt": now,
			"UpdatedAt": now,
			"Types": ["Software and Configuration Checks/File Integrity Monitoring"],
			"Severity": {"Label": SEVERITY_LABEL},
			"Title": "File changes detected via SSM Inventory",
			"Description": (
				f"{len(created)} created, {len(modified)} modified, "
				f"{len(deleted)} deleted file(s) on instance {instance_id}"
			),
			"Resources": [{"Type": "AwsEc2Instance", "Id": instance_id}]
		}
		securityhub.batch_import_findings(Findings=[finding])

	# No change – delete older S3 version
	else:
		if prev_version != current_version:
			try:
				s3.delete_object(Bucket=bucket, Key=key, VersionId=prev_version)
			except Exception as e:
				print(f"Delete previous S3 object version failed: {e}")
Configure the two required environment variables in the Lambda console. These two variables (one for critical paths to monitor and one for security finding severity) must be set or the function will fail.
Open the Lambda console and choose Configuration and then select Environment variables.
Choose Edit and then choose Add environment variable.
Under Key, choose CRITICAL_FILE_PATTERNS
Enter ^/etc/paymentapp/config.*$ as the value.
Set the SEVERITY_LABEL to MEDIUM.
Figure 7: CRITICAL_FILE_PATTERNS and SEVERITY_LABEL configuration
Set up permissions
The next step is to attach permissions to the Lambda function
In your Lambda function, choose Configuration and then select Permissions.
Under Execution role, select the role name that will lead to the role in IAM.
Paste the following policy, and make sure to replace <bucket-name> with the name of your S3 bucket, and you also update <region> and <account-id> with your AWS Region and Account ID:
To finalize, enter a Policy name and choose Create policy.
Add functions to the Lambda layer
For better modularity, add some helper functions to a Lambda layer. These functions are already referenced in the import section of the preceding Lambda function’s Python code. The helper functions check critical paths, load file metadata, compare modification times, and extract the EC2 instance ID.
Open AWS CloudShell from the top-right corner of the AWS console header, then copy and paste the following script and press Enter. It creates the helper layer and attaches it to your Lambda function.
#!/bin/bash
set -e
FUNCTION_NAME="fim-change-detector"
LAYER_NAME="fim-change-detector-layer"

mkdir -p python
cat > python/helpers.py << 'EOF'
import json, re, os
from dateutil.parser import parse as parse_dt
import boto3
s3 = boto3.client('s3')
CRITICAL_FILE_PATTERNS = os.environ.get("CRITICAL_FILE_PATTERNS", "").split(",")

def is_critical(path):
	return any(re.match(p.strip(), path) for p in CRITICAL_FILE_PATTERNS if p.strip())

def load_file_metadata(bucket, key, version_id):
	obj = s3.get_object(Bucket=bucket, Key=key, VersionId=version_id)
	data = {}
	for line in obj['Body'].read().decode().splitlines():
		if line.strip():
			i = json.loads(line)
			n, d, m = i.get("Name","").strip(), i.get("InstalledDir","").strip(), i.get("ModificationTime","").strip()
			if n and d and m: data[f"{d.rstrip('/')}/{n}"] = m
	return data

def is_modified(path, current, previous):
	try: return parse_dt(current[path]) != parse_dt(previous[path])
	except: return current[path] != previous[path]

def extract_instance_id(bucket, key, version_id):
	obj = s3.get_object(Bucket=bucket, Key=key, VersionId=version_id)
	for line in obj['Body'].read().decode().splitlines():
		if line.strip():
			r = json.loads(line)
			if "resourceId" in r: return r["resourceId"]
	return None
EOF

zip -r helpers_layer.zip python >/dev/null
LAYER_VERSION_ARN=$(aws lambda publish-layer-version \
	--layer-name "$LAYER_NAME" \
	--description "Helper functions for File Integrity Monitoring" \
	--zip-file fileb://helpers_layer.zip \
	--compatible-runtimes python3.13 \
	--query 'LayerVersionArn' \
	--output text)

aws lambda update-function-configuration \
	--function-name "$FUNCTION_NAME" \
	--layers "$LAYER_VERSION_ARN" >/dev/null
echo "Layer created and attached to the Lambda function."
Step 5: Set up S3 Event Notifications
Finally, set up S3 Event Notifications to trigger the Lambda function when new inventory data arrives.
Open the S3 console and select the Systems Manager Inventory bucket that you created.
Choose Properties and select Event notifications.
Choose Create event notification.
Enter an Event name.
In the Prefix field, enter AWS%3AFile/ to limit Lambda triggers to file inventory objects only. Note: The prefix contains a : character, which must be URL-encoded as %3A.
Under Event types, select Put.
At the bottom, select your newly created Lambda function, and choose Save changes.
In this example, inventory collection runs every 30 minutes (48 times each day) but can be adjusted based on security requirements to optimize costs. The Lambda function is triggered once for each instance whenever a new inventory object is created. You can further reduce event volume by filtering EC2 instances through S3 Event Notification prefixes, enabling focused monitoring of high-value instances.
Step 6: Test the file change detection flow
Now that the EC2 instance is running and the sample configuration file /etc/paymentapp/config.yaml has been initialized, you’re ready to simulate an unauthorized change to test the file integrity monitoring setup.
Open the Systems Manager console.
Go to Session Manager and choose Start session.
Select your EC2 instance and choose Start Session.
Run the following command to modify the file:
echo “db_password=hacked456" | sudo tee /etc/paymentapp/config.yaml
This simulates a configuration tampering event. During the next Systems Manager Inventory run, the updated metadata will be saved to Amazon S3.
To manually trigger this:
Open the Systems Manager consoleand choose State Manager.
Select your association and choose Apply association now to start the inventory update.
After the association status changes to Success, check your SSM Inventory S3 bucket in the AWS:File folder and review the inventory object and its versions.
Open the Security Hub console and choose Findings. After a short delay, you should see a new finding like the one shown in Figure 8:
Figure 8: View file change findings
Step 7: Query and visualize findings
While Security Hub provides a centralized view of findings, you can deepen your analysis using Amazon Athena to run SQL queries directly on the normalized Security Lake data in Amazon S3. This data follows the Open Cybersecurity Schema Framework (OCSF), which is a vendor-neutral standard that simplifies integration and analysis of security data across different tools and services.
The following is an example Athena query:
SELECT
	finding_info.desc AS description,
	class_uid AS class_id,
	severity AS severity_label,
	type_name AS finding_type,
	time_dt AS event_time,
	region,
	accountid
FROM amazon_security_lake_table_us_east_1_sh_findings_2_0
Note: Be sure to adjust the FROM clause for other Regions. Security Lake processes findings before they appear in Athena, so expect a short delay between ingestion and data availability. You will see a similar result for the preceding query, shown in Figure 9:
Figure 9: Athena query result in the Amazon Athena query editor
In Part I, we introduced the business background behind Log Lake. In this post, we describe how to build it, and how to add model invocation logs from Amazon Bedrock.
The original use case of Log Lake was to join AWS CloudTraillogs (with StartSession API calls) with Amazon CloudWatch logs (with session keystrokes from within Session Manager, a capability of AWS Systems Manager), to help a manager review an employee’s use of elevated permissions to determine if the use was appropriate. Because there might be only one event of elevated privileges in millions or billions of rows of log data, finding the right row to review was like looking for a needle in a haystack.
Log Lake is not just for Session Manager, but also general purpose CloudTrail and CloudWatch logs. After adding CloudWatch and CloudTrail logs to raw tables at scale, you can set up AWS Glue jobs to process the many tiny JSON files of raw tables into bigger binary files for “readready” tables. Then, these readready tables could be queried with different filters to answer questions for many use cases, such as legal or regulatory reviews for compliance, deep forensic investigations for security, or auditing. Log Lake is an answer to the question “Are there logs, and if so, how do I get them?”
Solution overview
Log Lake is a data lake for compliance-related use cases, uses CloudTrail and CloudWatch as data sources, has separate tables for writing (original in raw JSON file format) and reading (read-optimized readready in transformed Apache ORC file format), and gives you control over the components so you can customize it for yourself.
The following diagram shows the system architecture.
The workflow consists of the following steps:
An employee uses Session Manager to access Amazon Elastic Compute Cloud (Amazon EC2). Sessions might include sessionContext.sourceIdentity if a principal provided it while assuming a role (requires sts:SetSourceIdentity in the role trust policy). Our AWS Glue jobs filtered on this field to reduce cost and improve performance.
Logging in to an EC2 instance using Session Manager and performing actions during a session triggers two kinds of logs: CloudTrail records API activity (StartSession) and CloudWatch records session data from within the service (sessionData). Sample CloudTrail and CloudWatch log files are in the GitHub repository, generated from a real Systems Manager session. We recommend you upload these files in your first deployment, but alternatively, you can generate your own data files.
Optionally, replication rules copy files to consolidated S3 buckets.
The AddAPart AWS Lambda function associates many tiny JSON files with raw Hive tables in the Data Catalog using the AWS Glue API, triggered by S3 event notifications.
The AWS Glue job reads raw tables and writes to bigger binary ORC files, a columnar file format suitable for analytics. Amazon Athena needs JSON documents on separate lines for processing. In our benchmarking using CloudWatch and CloudTrail workloads, ORC ZLIB had the fastest (lowest) query duration, and was half the file size of Parquet Snappy (1246 MB ORC ZLIB vs 2.4GB Parquet Snappy). Also, ORC is used by AWS CloudTrail Lake. To test file formats, logs from CloudTrail Systems Manager (eventsource='ssm.amazonaws.com') were copied to generate a total population of JSON files over 500 GB. First, a JSON table was created. Then two additional tables were created using Athena CTAS: one for ORC ZLIB, and one for Parquet Snappy. Tests compared three subsequent query durations for three different workloads across ORC vs. Parquet.
The AddAPart Lambda function associates ORC files with Hive readready tables. AddAPart for readready is created using the same stack as for raw, but different parameters (bucket, table, and so on). Hive table format was used for raw because incoming files were JSON, and readready used Hive (not Iceberg) for consistency and append only operations.
Users can query readready tables using the Athena API.
Log Lake uses multiple services together:
CloudTrail logs for StartSession API activity (required for auditing, compliance, legal purposes)
CloudWatch logs to extend and add keystrokes from Session Manager, so what happened within a session can be reviewed for appropriate use
Lambda and Amazon Simple Queue Service (Amazon SQS) for asynchronous invocation of S3 event notifications, for serverless event-driven processing to associate data files with metadata tables
The Data Catalog as a metastore to register table metadata, either standalone or as part of a data mesh architecture
AWS Glue Spark jobs to transform data from original raw format to read-optimized tables
Athena for one-time queries
The architecture of Log Lake includes the following design choices:
Separate tables for writing (raw) and reading (readready).
AWS Glue jobs with Spark SQL and views (“many view”).
AWS services designed to do one thing well, such as Amazon S3 for storage and Amazon SQS for message queueing. This gives data engineers control over components for cost or customization.
Separate tables for reading (readready) and writing (raw)
The concept of raw and readready tables represents two distinct approaches to data storage and processing, each serving different purposes in a data architecture:
Raw tables – Source-aligned and write-optimized. They are backed by many tiny files (KB in size) in original format. For CloudWatch and CloudTrail, this means JSON file format.
ReadReady tables – Source-aligned and read-optimized. They are backed by bigger binary files, usually larger than 10 MB, in columnar file format.
Part I contains our comparison of performance, cost, and convenience of both table layers.
Add partition Lambda functions (AddAPart)
Log Lake uses an event-based, asynchronous invocation approach to add partitions to raw tables. We call this approach “AddAPart with LoLLs” (Lots of Little Lambdas). It is optimized for adding new incoming files in text format to existing Hive tables as fast as possible, with the following assumptions:
Incoming raw files are in JSON or CSV and must be stored and queried in original format (can’t be changed to Iceberg-compatible formats such as Parquet or ORC). Append only, not merge or update.
Partition management must be automatic.
File-based, no dependency on a job (files can be landed by different pipelines in different ways, and handled consistently by the same AddAPart function).
No dependency on Athena partition projection (Data Catalog only).
The AddAPart function consists of five steps:
An S3 event notification triggers the AddAPart producer Lambda function.
The AddAPart producer sends messages to a first-in-first-out (FIFO) SQS queue.
The following are some ways we have used AddAPart:
Minimizing the time it takes to associate new data (JSON files) with new partitions (table in Hive).
Reducing the cost of partition adding (duplicate S3 prefixes are ignored).
Altering file names (Data Firehose postprocessing Lambda functions are an alternative).
Customization, such as ignoring files with certain regex patterns in the S3 prefix or file name. If you want to exclude a data source or do an emergency power off, you can do it from within AddAPart without modifying other resources.
“Many view” AWS Glue jobs
Both Log Lake jobs are what we call “many view” AWS Glue jobs, which use createOrReplaceTempView from Spark, using code like the following:
from pyspark.sql import DataFrame, SparkSession
# code
def create_view_from_sqlstatement(
    logger: logging.Logger, spark: SparkSession, sqlstatement: str, name_of_view: str
) -> None:
    """
    Create a view from a SQL statement.
    """
    result_as_df = spark.sql(sqlstatement)
    result_as_df.createOrReplaceTempView(name_of_view)
    logger.info(f"created view {name_of_view} from sqlstatement...")
# code
name_of_view = "some_step_as_view"
sql_statement = some_statement_for_step
create_view_from_sqlstatement(
logger,
spark,
sql_statement,
name_of_view,
)
sql_statement_for_job="select * from some_step_as_view"
returned_df = spark.sql(sql_statement_for_job)
We have used this approach to address the following antipatterns:
Trying to do everything in one step – Trying to do all operations and relational algebra in a single Spark SQL statement can become too complex to troubleshoot, understand, or maintain. For us, when we see a single statement with at least 200 lines and 2 subqueries, we prefer to break it down into smaller statements.
Code that is not standardized (inconsistent APIs and approaches) that is harder to maintain, support, and enhance – We have seen the freedom of Spark to mix API approaches (Spark SQL API, RDD API, DataFrame API) result in inconsistency and complexity in large code bases with many contributors.
Mixing business logic with Spark environment (such as session settings) – Business logic should be separate and portable.
AWS Glue jobs with custom bounded execution and tables that support workload partitioning
You can tell AWS Glue jobs to look at a maximum of n days or n rows with custom bounds, which we implement using Spark Data Frames as follows:
Also, jobs can prune data using table partitions (and use partition indexes). This helps you prepare routine mechanisms up front that are ready to run and recover from missing data by running relative backfill jobs until data is up to date.
Prerequisites
Complete the following prerequisite steps to implement this solution:
Create or identify an S3 bucket to use during the walkthrough. This will be used for storing the AWS Glue job scripts, Lambda Python files, and AWS CloudFormation stacks.
Copy all files under log_lake to the S3 bucket.
If the S3 bucket is encrypted using an AWS Key Management Service (AWS KMS) key, note the Amazon Resource Name (ARN) of the key.
Build Log Lake
To build Log Lake, follow the deployment steps in the how_to_deploy.md file in the repo.
After deployment is complete, you can upload demo data files and run the AWS Glue jobs to demo how to answer the question, “Who did what in session manager?” For this, switch over to the how_to_demo.md file and follow the steps.
When you are done, you should see the following tables in the Data Catalog:
from_cloudtrail_readready – Contains processed CloudTrail session data
You can view them on the AWS Glue console or query them directly in Athena. The following is a sample query from the repository that shows how to join both tables to get API activity from CloudTrail and join it to session data (keystrokes) from CloudWatch:
SELECT t.eventsource
,t.eventname
,t.eventtime
,w.logaccountid
,w.loggroup
,w.subscriptionfilters
,w.eventtime as eventtime_from_cloudwatch
,w."session" as session_from_cloudwatch
 FROM loglakeblog.from_cloudwatch_readready w
 inner join loglakeblog.from_cloudtrail_readready t
on  w.f_sessionid=t.f_sessionid
Add Amazon Bedrock model invocation logs
Adding Bedrock model invocation logs to Log Lake is important to enable human review of agent actions with elevated permissions. Some examples of the need for human oversight are tool use, computer use, agentic misalignment, and high impact AI in federal agencies. If you have not considered this use case and are using LLMs, we urge you to review Amazon Bedrock logs and consider either a managed product or a self-built data lake like Log Lake.
In this post, we use “agentic” and “agent” to refer to a large language model (LLM) using tools with some autonomy to iterate toward a goal.
To generate model invocation logs for this post, we created a custom Lambda function to ask Anthropic’s Claude 4.5 to list files in a bucket using a tool. We used this as a plausible future scenario where a human might need to review an agent’s actions and logs to decide if an agent’s tool use was appropriate.
The following diagram shows the components involved.
We have included examples of the CloudTrail and CloudWatch files from Amazon Bedrock model invocation logs in the repository.
Before you create the model invocation logs, make sure you have created the from_cloudtrail_readready table from the previous steps.
Follow the steps in the GItHub repo to add Amazon Bedrock model invocation logs to Log Lake. When done, you should have the tablereplace_me_with_your_database.from_bedrock_readready.
You can query this table using Athena and join it to from_cloudtrail_readready, using SQL like the following example from the repo:
SELECT
t.useridentity_arn
,t.eventtime
,t.eventsource
,t.eventname
,b.request_time
,b.modelid
,regexp_extract(b.input_messages, '^(.*)({"input":{.*"type":"tool_use"})(.*)$', 2) as input_message_with_tool_use
,b.input_messages
,b.input_inputtokencount
,b.output_outputbodyjson_content
,b.output_outputtokencount
FROM loglakeblog.from_cloudtrail_readready t
left outer join loglakeblog.from_bedrock_readready b
on t.requestid = b.requestid
where t.logcalendarday>20240601
Use an agent to review an agent
The predefined query we used in our demo is what we used when we knew the needle in the haystack (tool_use in input messages), but this approach wouldn’t work for new, unknown patterns that require running SQL queries in multiple steps to understand complex data.
Our solution includes a method for an agent in Amazon Bedrock to review an agent in Amazon Bedrock. In this post’s repository, we include a Log Lake Looker Lambda function, which uses an LLM (Anthropic’s Claude) to talk to a database (the Log Lake AWS Glue database).
This pattern is not new. It has been described in 2024 in the paper DB-GPT: Empowering Database Interactions with Private Large Language Models as “a paradigm shift in database interactions, offering a more natural, efficient, and secure way to engage with data repositories.” This is an extension of an older idea from 1998: an interface to data was described in the Distributed Computing Manifesto as “the client is no longer dependent on the underlying data structure or even where the data is located.”
Using an agent to query Log Lake has multiple benefits:
An engineered agent can deliver consistent, reliable, high-quality answers during stressful situations, such as a time-sensitive incident response or high-visibility investigation
Users don’t have to write their own queries and can reduce their cognitive load (“What was that long column name?”)
It can reduce onboarding and training time (the agent implements the training and specialized knowledge of the data structures)
You can ask Log Lake Looker an open-ended question and get an answer without writing a query. Log Lake Looker performs the following actions for you:
Create a valid SQL query from a natural language user prompt. Log Lake Looker is optimized for the from_bedrock_readready table using a system prompt, like the Anthropic SQL sorcerer example.
Run the query in Athena using a custom tool.
Review tool results (rows) and replies with a simple summary. When using input and output that can be verbose, like query results, you might need to manage tokens in your context window. For example, if the sum of input and output tokens exceeds the model’s context window, newer Claude models return a validation error, such as the following error we saw during testing:
Unexpected ClientError: err=ValidationException('An error occurred (ValidationException) when calling the InvokeModel operation: Input is too long for requested model.') type(err)= error_code='ValidationException' error_message='Input is too long for requested model.'
Compact context by removing tool results. This improves time to answer performance, quality of answer, and reduces proliferation of potentially sensitive data to model invocation logs.
Either run a follow-up query or suggest next steps for the human user.
Log Lake Looker looks at small samples from from_bedrock_readready using more than one try. This means the model reflects on its output and can create a follow-up query based on query results. To learn more about this, we recommend reading about reflection and iterative refinement. We have seen useful responses from agents using iterative approaches, especially when context is managed (for example, a specific system prompt using one table only or a limit on conversational turns) and tool results are compacted.
We’ve seen the agent answer simple questions like “can you query my table and tell me what you find?” in less than 60 seconds more than 50% of the time, without optimizing for any specific question. The following are snippets of CloudWatch logs to show you what’s possible, using Anthropic’s Claude Sonnet 4.5:
2025-12-02 06:05:47 lambda_function lambda_handler INFO Event received: {
"prompt_from_user": "Can you query my bedrock logs and tell me what you find?"
}
…
2025-12-02 06:06:20 lambda_function lambda_handler INFO     final_response after all loops:
## Short Summary
Your Bedrock logs show AI model activity with **tool_use functionality enabled**, specifically a tool called "list_files_in_s3" that can access S3 bucket contents. This represents a security and compliance concern that requires human review to ensure the tool is being used appropriately and accessing only authorized resources.
## More Details
Security
Log Lake Looker should be reviewed by a human for appropriate tool use, because it has the same risks as the other agents using tools or a human with elevated privileges. Looker can review its own tool use, but human review is still needed.
There are security implications of allowing an agent to review model invocation logs: these logs can contain system prompts, sensitive data in responses, and user input in requests. Also, allowing an agent to generate SQL statements based on user input has additional risks specific to access to structured data, such as prompt injection, improper content, and proliferation of sensitive data.
We recommend a defense in depth (more than one layer) approach for tool use by a model. Log Lake Looker uses multiple layers of defensive measures:
The application code requires the SQL statement to begin with select prior to sending to Athena. Because the query is from an assistant response to a user input (request), this relates to sanitizing and validating user inputs and model responses.
The AWS Identity and Access Management (IAM) role used by the function has glue:Get* actions only (no mutation, such as create, update, delete tables, partitions, or databases), for least-privilege permissions.
It’s only used interactively as part of ad-hoc human-in-the-loop review (not in bulk or systemic).
System prompting to steer behavior, like this example from the repo:
The first word MUST be "select". If asked to do any statement other than select, say that you will not mutate state, and suggest that the user can create their own sql or you can help with a query using "select".
The bucket storing model invocation logs is secure and follows least privilege practices. Logs can contain proliferation of sensitive data, such as tool results, user inputs, model outputs, and system prompts. If a system prompt contains sensitive information (such as metadata or query information not otherwise available) and is saved to logs in an unsecure bucket, this can result in a system prompt leak.
Stripping tool results to reduce proliferation, using code to truncate content:
        if (
            message_mutated["role"] == "user"
            and "content" in message_mutated
            and isinstance(message_mutated["content"], list)
        ):
            for item in message_mutated["content"]:
                if isinstance(item, dict) and item.get("type") == "tool_result":
                    if not isinstance(item["content"], str):
                        item["content"] = json.dumps(item["content"])
                    char_to_keep = 50
                    content_length = len(item["content"])
                    if content_length > char_to_keep:
                        logger.info(
                            f"content length {content_length} exceeds {char_to_keep}, truncating..."
                        )
                        item["content"] = item["content"][:char_to_keep]
        messages_compacted.append(message_mutated)
To avoid incurring future charges, delete the stacks. The repository has shell scripts you can use to delete files in buckets, which is required before deleting buckets.
Conclusion
In this post, we showed you how to deploy Log Lake in a new AWS account to create two tables, from_cloudtrail_readready and from_cloudwatch_readready. These tables can answer the question “What did an employee do in Session Manager?” across large data volumes in seconds using Athena.
Additionally, we showed how to add a data source to an existing Log Lake: Amazon Bedrock model invocation logs in the form of from_bedrock_readready. This shows how Log Lake can be extended to answer questions such as “What tools did an agent use?” and “Was there inappropriate use, and why?”
Finally, we showed how to create and use Log Lake Looker, an agent using Lambda and Amazon Bedrock. Looker can query Log Lake for new unknown patterns as part of human-in-the-loop review, without writing SQL or remembering column names. You can make Log Lake your way. We encourage you to look through the repository and use it as inspiration for your own Log Lake. If you have questions or comments, please let us know!
When processing data at scale, many organizations use Apache Spark on Amazon EMR to run shared clusters that handle workloads across tenants, business units, or classification levels. In such multi-tenant environments, different datasets often require distinct AWS Key Management Service (AWS KMS) keys to enforce strict access controls and meet compliance requirements. At the same time, operational efficiency might drive these organizations to consolidate their data pipelines. Instead of running separate Spark jobs for each dataset, it could be more efficient to run a single job on Amazon EMR that processes inputs once and writes multiple outputs to Amazon Simple Storage Service (Amazon S3), each encrypted with its own KMS key.
Although consolidating multiple datasets in one Spark job reduces orchestration overhead and simplifies code maintenance, you might encounter challenges with encryption configurations. By default, the EMRFS and S3A file system clients cache their settings, which can cause encryption keys to persist incorrectly across writes. This means if you change the encryption key between writes to Amazon S3 in an Apache Hadoop environment, some output files can end up encrypted with unintended keys, leading to possible security and compliance concerns.
In this post, we show how to securely write data to Amazon S3 from Spark jobs running on Amazon EMR, while dynamically managing different KMS keys for encryption. We discuss three approaches to solve this challenge and how to choose the right solution for your use case.
Amazon S3 server-side encryption options with Amazon EMR
When writing data to Amazon S3 from Amazon EMR, you can choose from multiple server-side encryption options. The two most commonly used options are:
Server-side encryption with Amazon S3 managed keys (SSE-S3) – Amazon S3 manages the encryption keys for you
Server-side encryption with KMS keys (SSE-KMS) – AWS KMS manages the keys, and you can use custom KMS keys with fine-grained access control
When running Spark jobs on Amazon EMR, data writes to Amazon S3 occur through one of the following file system implementations:
EMRFS – The default implementation for Amazon EMR versions below 7.10.0
S3A – The default implementation starting from Amazon EMR 7.10.0
Both implementations provide configuration properties to control server-side encryption. The following tables show how to specify the KMS key for SSE-KMS encryption.
For EMRFS (default in Amazon EMR versions below 7.10.0), refer to the following table.
Property
Description
fs.s3.enableServerSideEncryption
Enables server-side encryption. Defaults to SSE-S3 if no KMS key is provided.
fs.s3.serverSideEncryption.kms.keyId
Specifies the KMS key ID or ARN for SSE-KMS encryption.
For S3A (default in Amazon EMR starting from 7.10.0), refer to the following table.
Property
Description
fs.s3a.encryption.algorithm
Specifies the encryption algorithm.
fs.s3a.encryption.key
Specifies the KMS key ID or ARN for SSE-KMS encryption.
Starting from the Amazon EMR 7.10.0 release, the S3A file system has replaced EMRFS as the default EMR S3 connector. For more information, refer to Migration Guide: EMRFS to S3A Filesystem.
Challenges to prevent encryption key reuse due to file system caching
In practice, a unified Spark job might write outputs for multiple tenants or classifications in a single run. In this situation, applying the correct encryption key for each output is critical to maintaining compliance and enforcing isolation in multi-tenant S3 buckets without the complexity of managing separate Spark jobs for each dataset.
When Spark executors write to Amazon S3, they use a file system (EMRFS or S3A) client that is cached and reused for performance optimization. The problem is that each file system instance keeps the encryption settings it was first created with. Each executor’s Java Virtual Machine (JVM) creates and caches a file system (and its underlying S3 client) for a given S3 bucket. This cached instance, along with its encryption configuration, persists throughout the executor’s lifecycle. If you change the encryption key in Spark after some data has been written, the existing cached client can’t pick up the new key.
For example, the following PySpark code first creates a Spark session with S3 server-side encryption enabled. It then writes a DataFrame to two different folders within the same S3 bucket amzn-s3-demo-bucket1, but with different KMS keys. The first write operation writes the data to folder1 using kmsKey1 for encryption, and the second write operation writes to folder2 using kmsKey2.
# Pseudo-code: setting different keys for successive writes to different folders within the same S3 bucket

spark = SparkSession.builder \
.appName("Write data to S3 with KMS") \
.config("spark.hadoop.fs.s3.enableServerSideEncryption", "true") \
.getOrCreate()

df.write.option('fs.s3.serverSideEncryption.kms.keyId', kmsKey1).save("s3://amzn-s3-demo-bucket1/folder1/")
df.write.option('fs.s3.serverSideEncryption.kms.keyId', kmsKey2).save("s3://amzn-s3-demo-bucket1/folder2/")
You might expect files in folder1/ to use kmsKey1 and files in folder2/ to use kmsKey2. But due to caching, the second write can still use the client configured with kmsKey1. This leads to mixed or incorrect encryption key usage across outputs.
Solution overview
Our objective is to achieve correct encryption of each output S3 object with its intended KMS key, even when a single Spark job writes multiple outputs. To implement this, you can use one of the following approaches:
Disable file system cache – Turn off S3 client caching so a new client is created for each write, picking up the current key
Separate Spark applications or sessions – Run a separate Spark application (or session) for each distinct encryption key, so each client is initialized fresh
Use S3 bucket default encryption – Configure bucket-level SSE-KMS with the desired key so Amazon S3 automatically applies the correct encryption key
Each method offers a different balance of implementation complexity, performance, and flexibility. The following sections provide detailed implementation steps and considerations for each approach.
Method 1: Disable file system cache
Disabling the file system cache forces Spark to create a new S3 client for each write, which applies the updated encryption settings. This can be done using a Spark configuration or EMR cluster settings.
The property name for disabling the cache depends on your URI scheme (s3:// or s3a://), not on your choice of file system (EMRFS or S3A). The following table summarizes which configuration property name you should use to disable the cache.
Properties for s3:// URI scheme
Properties for s3a:// URI scheme
fs.s3.impl.disable.cache
fs.s3a.impl.disable.cache
spark.hadoop.fs.s3.impl.disable.cache
spark.hadoop.fs.s3a.impl.disable.cache
To use this method, complete the following steps:
Disable the file system cache in Spark configuration. For s3:// scheme, you can manually set spark.hadoop.fs.s3.impl.disable.cache=true, for example (PySpark):
# PySpark example for "s3://"
# Create Spark session
spark = SparkSession.builder \
.appName("Write data to S3 with KMS") \
.config("spark.hadoop.fs.s3.impl.disable.cache", "true") \
.getOrCreate()
Alternatively, you can use the following spark-defaults configuration classification:
For s3a:// scheme, you can manually set spark.hadoop.fs.s3a.impl.disable.cache=true, for example (PySpark):
# PySpark example for "s3a://"
# Create Spark session
spark = SparkSession.builder \
.appName("Write data to S3 with KMS") \
.config("spark.hadoop.fs.s3a.impl.disable.cache", "true") \
.getOrCreate()
Alternatively, you can use the following spark-defaults configuration classification:
Instead of disabling the cache specifically for Spark applications, you can optionally configure the EMR cluster’s core-site.xml to disable the file system cache globally at cluster level. You must configure the /etc/hadoop/conf/core-site.xml file on the primary nodes of your EMR cluster. For example, when creating or modifying the cluster, use the following configuration. For s3:// scheme:
Enable SSE-KMS encryption. For EMRFS, set spark.hadoop.fs.s3.enableServerSideEncryption=true for Spark applications only or use the following configuration to enable encryption at cluster level:
For S3A, set spark.hadoop.fs.s3a.encryption.algorithm=SSE-KMS for Spark applications only or use the following configuration to enable encryption at cluster level:
When using EMRFS with fs.s3.impl.disable.cache=true, you must also disable the EMRFS S3-optimized committer to avoid errors. You can do this by either manually setting spark.sql.parquet.fs.optimized.committer.optimization-enabled=false or using the following spark-defaults configuration classification:
Use this method when you need to write data to an S3 bucket using multiple KMS keys within a single Spark application. This is a quick, straightforward implementation that works well for the following use cases:
Testing environments and debugging sessions
Proof-of-concept demonstrations
Low-volume or one-time jobs where write performance is not critical
Workloads that frequently switch encryption keys to write data to different S3 prefixes within the same bucket
Before implementation, consider the following performance impacts:
Increased latency for each write
Additional S3 API operations
Extra connection overhead
Although this method provides a pragmatic solution when splitting work into separate Spark applications isn’t feasible, we don’t recommend it for high-throughput or latency-sensitive production workloads. The increased API traffic can lead to higher costs and potential throttling. For production implementations, consider Method 2 and Method 3.
Method 2: Use separate Spark applications or sessions
When writing data with multiple encryption keys, use a separate Spark application (or Spark session) for each distinct key. The file system needs to be initialized with the correct encryption key in a fresh JVM context when writing data with different keys. You can achieve this by either submitting a separate Spark application or starting a new Spark session. This enables the S3 client to be created with the intended encryption key.
Complete the following steps:
Divide the write tasks by KMS key. For example, prepare separate DataFrames or filter logic for each key.
Submit separate jobs. Choose either of the following options:
# For EMRFS
for kmsKey in [kmsKey1, kmsKey2]:
    spark = SparkSession.builder \
        .appName("Write data to S3 with KMS") \
        .config("spark.hadoop.fs.s3.enableServerSideEncryption", "true") \
        .config("spark.hadoop.fs.s3.serverSideEncryption.kms.keyId", kmsKey) \
        .getOrCreate()
    write_df_for_key(kmsKey)  # Pseudocode for writing data for this key
    spark.stop()

# For S3A
for kmsKey in [kmsKey1, kmsKey2]:
    spark = SparkSession.builder \
        .appName("Write data to S3 with KMS") \
        .config("spark.hadoop.fs.s3a.encryption.algorithm", "SSE-KMS") \
        .config("spark.hadoop.fs.s3a.encryption.key", kmsKey) \
        .getOrCreate()
    write_df_for_key(kmsKey)  # Pseudocode for writing data for this key
    spark.stop()
Use your preferred workflow (such as AWS Step Functions, Apache Airflow, or a wrapper script) to launch jobs in sequence or parallel.
Considerations
Use this method when you need a production-grade solution for applying different KMS keys at scale. This approach maintains file system caching benefits and works well for the following use cases:
High-throughput or latency-sensitive workloads with frequent write operations
Scenarios requiring strong isolation between different KMS keys
Multi-tenant environments with separate compliance boundaries
This method creates fresh S3 clients with each new Spark application or session. Compared to Method 1, it offers several advantages:
Enforces credential boundaries between workloads and improves operational and compliance isolation by assigning each Spark application or session a dedicated key
Before implementation, consider the following trade-offs:
Requires orchestration of multiple Spark applications and sessions or clusters
Involves higher resource overhead
Increases operational complexity
Choose this method when performance, cost predictability, and security isolation are more important than single-process simplicity.
On the Amazon S3 console or using the AWS Command Line Interface (AWS CLI), enable default SSE-KMS for the bucket with the desired key. For instructions on enabling SSE-KMS for S3 buckets, refer to Configuring default encryption.
With default encryption enabled for the S3 bucket, you can write without specifying a KMS key in Spark. Amazon S3 can encrypt each object with the bucket’s key. Your Spark code only needs standard write operations.
Considerations
Use this method when your workloads can use a single KMS key per bucket. This approach works well for the following use cases:
Production environments prioritizing operational simplicity
Workloads where all data in a bucket shares the same security requirements
Scenarios where encryption configuration should be managed at the bucket level
Use cases that map naturally to per-bucket separation
This method provides several advantages:
Alleviates the need to configure encryption in Spark applications
Automatically applies the default KMS key for all writes
Simplifies encryption management
Before implementation, consider the following limitations:
You must have all data in one bucket to use the same encryption key
You can’t apply different keys to different prefixes within the same bucket
Choose this method when you need a simple, reliable approach that provides strong security while simplifying operational management.
Choosing the right approach
Choose the method based on your workload’s security requirements, performance needs, and operational constraints:
Method 1 – Use when you need to apply multiple KMS keys within a single Spark job and can accept some performance impact
Method 2 – Use for production workloads that require different encryption keys within the same bucket and need optimal performance
Method 3 – Use when a single KMS key per bucket meets your encryption requirements and you want simplified operations
Conclusion
In this post, we demonstrated how to handle multiple KMS keys when writing to Amazon S3 from Spark jobs on Amazon EMR. When encrypting multiple outputs with different encryption keys in a single Spark application, it’s important to consider the file system caching behavior. We presented several practical solutions with their respective trade-offs. You can start implementing these solutions in your environment by first testing the file system cache-disable method, which provides a straightforward approach to handling multiple encryption keys. As your workload grows, consider evolving to separate Spark sessions or S3 bucket default encryption based on your specific requirements. After implementing a solution, verify that each S3 object’s SSE-KMS key is the intended one (for example, by checking S3 object metadata). We also recommend measuring job performance and S3 API usage, especially for the cache-disable approach.
At Rapid7, we track a wide range of threats targeting cloud environments, where a frequent objective is hijacking victim infrastructure to host phishing or spam campaigns. Beyond the obvious security risks, this approach allows threat actors to offload their operational costs onto the target company, often resulting in significant, unwanted bills for services the victim never intended to use.
Rapid7 recently investigated a cloud abuse incident in which threat actors leveraged compromised AWS credentials to deploy phishing and spam infrastructure using AWS WorkMail, bypassing the anti-abuse controls normally enforced by AWS Simple Email Service (SES). AWS SES is a general-purpose, API-driven email platform intended for application-generated email such as transactional notifications and marketing messages. This allows the threat actor to leverage Amazon’s high sender reputation to masquerade as a valid business entity, with the ability to send email directly from victim-owned AWS infrastructure. Generating minimal service-attributed telemetry also makes threat actor activity difficult to distinguish from routine activity. Any organization with exposed AWS credentials and permissive Identity and Access Management (IAM) policies are potentially at risk, particularly those without guardrails or monitoring around WorkMail and SES configuration.
In this post, we analyzed a real-world incident observed by our MDR team in which threat actors abused native AWS email services to build phishing and spam infrastructure inside a compromised cloud environment. We will reconstruct the attacker’s progression from credential validation and IAM reconnaissance to bypassing Amazon SES safeguards by pivoting to AWS WorkMail. Along the way, we highlight how legitimate service abstractions can be leveraged to evade detection, examine the resulting logging and attribution gaps, and outline practical detection and prevention strategies defenders can use to identify and disrupt similar cloud-native abuse.
Background: AWS WorkMail and its key components
AWS WorkMail is a fully managed business email and calendaring service that allows organizations to operate corporate mailboxes without deploying or maintaining their own mail servers. It supports standard email protocols such as IMAP and SMTP, as well as common desktop and mobile clients, making it a lightweight, pay-as-you-go alternative for teams already operating within AWS.
To understand the activities performed by threat actors in the incident, it’s important to first introduce several core concepts within AWS WorkMail.
Organization
An Organization is the top-level container in WorkMail. It represents an isolated email environment that holds all users, groups, and domains. Each WorkMail organization is region-specific and operates independently, which allows attackers to create disposable, self-contained email infrastructures with minimal setup.
Users
Users represent individual mail-enabled identities within a WorkMail organization. After a user is created using the “workmail:CreateUser” API call, a mailbox can be assigned via a “workmail:RegisterToWorkMail”API call. Once registered, the user can authenticate to the AWS WorkMail web client or connect via standard email protocols and immediately begin sending and receiving email.
Groups
Groups are collections of users that can receive email on behalf of multiple members. They are typically used for distribution lists or shared inboxes and can simplify bulk message delivery or internal coordination within a WorkMail organization.
Domains
Domains define the email address namespace used by a WorkMail organization ([email protected]). Before a domain can be used, ownership must be verified. This verification process leverages the standard domain verification mechanism of Amazon Simple Email Service, typically via DNS records. Once verified, the domain can be actively used for sending and receiving email, enabling threat actors to operate from attacker-controlled, but seemingly legitimate, domains.
Attack analysis
The diagram below contains a graphical representation of the key events carried out by the attackers throughout the attack, starting with initial access actions, continuing through privilege escalation, and ending with the achievement of objectives.
Figure 1: Graphical visualization of the attack
Initial access
The compromise began with the exposure of long-term AWS access keys. The first indication of malicious activity was an “sts:GetCallerIdentity” API call with the User-Agent set to “TruffleHog Firefox.” This strongly suggests the use of TruffleHog, a tool commonly leveraged by adversaries to discover and validate leaked credentials from sources such as GitHub, GitLab, and public S3 buckets. Rapid7 has frequently observed TruffleHog usage in active campaigns, including activity attributed to groups such as the Crimson Collective.
Several days after this initial credential validation, we observed suspicious activity involving a second IAM user authenticated via long-term access keys. While we cannot conclusively prove that both users were accessed by the same operator, multiple factors suggest they were part of the same intrusion activity. Notably, both authentications originated from the same geographic region, which was anomalous for the victim’s normal operating patterns. Throughout the incident window, access to both accounts was conducted through a rotating set of IP addresses associated primarily with cloud service providers such as Amazon and DigitalOcean. This infrastructure choice is consistent with common adversary tradecraft used to obfuscate true origin and blend into legitimate cloud-to-cloud traffic.
⠀
Figure 2: Example TruffleHog output showing discovered credentials for Google Cloud Platform (GCP)
Discovery phase and privilege escalation
Following initial access, the first compromised user was used to perform basic environment discovery via native AWS APIs. These attempts repeatedly resulted in AccessDenied errors, indicating that the exposed credentials were constrained by limited permissions. The activity was conducted using the AWS command-line interface (CLI), suggesting hands-on, interactive exploration by the threat actor rather than automated tooling.
After encountering these limitations, the adversary shifted activity to the second set of compromised credentials, which possessed significantly broader permissions. With this user, enumeration became more deliberate and structured. The actor began with iam:ListUsers API calls to understand the identity landscape and then used a technique of intentionally triggering API errors to confirm specific permissions without making persistent changes.
As part of this broader discovery effort, the actor also queried Amazon SES to assess its current configuration and readiness for abuse. Specifically, they executed ses:GetAccountand ses:ListIdentities. These calls allowed the adversary to quickly map the operational status of SES within the account. The ses:ListIdentities API call was used to determine whether any verified identities (domains or email addresses) already existed that could be immediately leveraged for sending mail; none were present at the time. In parallel, ses:GetAccountwas used to identify whether the account was operating in the SES sandbox, which would impose strict sending limits and require additional steps before large-scale email campaigns could be launched.
This SES-focused reconnaissance indicates early intent to abuse email-sending capabilities and demonstrates how attackers can efficiently evaluate service readiness using only a small number of low-noise management API calls.
For example, the actor attempted to create an IAM user that already existed. The resulting error response confirmed possession of iam:CreateUserpermissions without successfully creating a new entity:
⠀
{
"userAgent": "aws-cli/1.22.34 Python/3.10.12 Linux/5.15.0-113-generic botocore/1.23.34",
"errorCode": "EntityAlreadyExistsException",
"errorMessage": "User with name xxxx already exists."
}
Listing 1: Part of the iam:CreateUser CloudTrail log
⠀
A similar validation was performed using iam:CreateLoginProfile. By supplying a password that violated the account’s password policy, the actor received a PasswordPolicyViolationException, confirming their ability to create console login profiles:
⠀
{
"userAgent": "aws-cli/1.22.34 Python/3.10.12 Linux/5.15.0-113-generic botocore/1.23.34",
"errorCode": "PasswordPolicyViolationException",
"errorMessage": "Password should have at least one uppercase letter"
}
Listing 2: Part of the iam:CreateLoginProfile CloudTrail log
⠀
After validating the scope of their privileges, the adversary created a new IAM user, attached the AWS managed policy “AdministratorAccess”, and established a login profile to enable AWS Management Console access. This marked a transition from CLI-based reconnaissance to full GUI-based control, providing unrestricted access and setting the stage for subsequent operational activity.
Action on objectives: Preparing email infrastructure for abuse
By the end of the discovery phase, the threat actor had established two critical facts:
No verified identities existed in Amazon Simple Email Service (SES).
The account remained restricted by the SES sandbox.
The SES sandbox is explicitly designed to limit fraud and abuse, and its restrictions effectively prevent meaningful phishing or spam campaigns. While an account remains in the sandbox, the following controls apply:
Emails can only be sent to verified identities (email addresses or domains) or the SES mailbox simulator.
A maximum of 200 messages per 24-hour period.
A maximum sending rate of 1 message per second.
These constraints made SES unsuitable for immediate abuse at scale. Rather than abandoning the service, the attacker initiated a process to legitimize higher-volume email sending.
First, they opened a support case with AWS requesting removal from the SES sandbox. In parallel, they requested a substantial increase to the daily sending quota— setting it to 100,000 emails per day —using the servicequotas:RequestServiceQuotaIncreaseAPI call.
Listing 3: Request parameters from RequestServiceQuotaIncrease API call
⠀
During this waiting period, the actor focused on persistence and stealth. Multiple IAM users were created.. These usernames were deliberately chosen to resemble region- or service-scoped automation accounts rather than human operators. To further reduce suspicion during IAM audits, the attacker attached narrowly scoped, SES-only policies to these users instead of broad administrative permissions. This approach allowed them to preserve operational access while minimizing obvious indicators of compromise such as over-privileged identities.
At this stage, the attacker had effectively prepared the account for large-scale email abuse-but they did not wait for AWS approval to proceed.
Bypassing SES controls by abusing AWS WorkMail
Rather than remaining idle while SES sandbox removal and quota increases were pending, the attacker pivoted to AWS WorkMail, which offers an alternative email-sending pathway with significantly fewer upfront restrictions.
Using the workmail:CreateOrganizationAPI, the threat actor created multiple WorkMail organizations. They then initiated domain verification workflows for domains designed to appear legitimate and business-like, including:
cloth-prelove[.]me
ipad-service-london[.]com
Domain verification was performed through ses:VerifyDomainIdentity and ses:VerifyDomainDkim, with the calls originating from workmail.amazonaws.com. This highlights an important nuance for defenders: although SES APIs are involved, the activity is driven by WorkMail provisioning rather than traditional SES email campaigns.
Once domain verification was completed, the actor created multiple mailbox users directly within WorkMail, such as:
service@ipad-service-london[.]com
marketing@ipad-service-london[.]com
These accounts served two purposes. First, they established persistence at the application layer, independent of IAM. Second, they provided credible sender identities for phishing and spam operations, closely resembling legitimate corporate email addresses.
There were also AWS directory service events logged by CloudTrail that show new aliases created for the new sender domains, using the victim’s directory tenant:
CreateAlias
AuthorizeAppication
This pivot is particularly impactful because AWS WorkMail does not implement a sandbox model comparable to SES. Emails can be sent immediately to external, unverified recipients. Additionally, WorkMail supports significantly higher sending volumes than SES sandbox limits. While Rapid7 has not empirically validated the maximum throughput, AWS documentation cites a default upper limit of 100,000 external recipients per day per organization, aggregated across all users.
Email sending methods and logging gaps
The attacker had two viable options for sending email through WorkMail:
1. Web interface Emails sent through the AWS WorkMail web client may surface indirectly in CloudTrail as “ses:SendRawEmail” events. These events are generated because WorkMail uses Amazon Simple Email Service (SES) as its underlying mail transport, even though the messages are composed and sent entirely through the WorkMail application.
While these events are not attributed to an IAM principal, they do expose several pieces of valuable metadata within the “requestParameters” field — most notably the sender’s email address and associated SES identity. This allows defenders to link outbound email activity to specific WorkMail users and recently verified domains, even in the absence of traditional application or message-level logs.
One notable limitation of these “ses:SendRawEmail” events is the absence of a true client source IP address. Because emails sent via the WorkMail web interface are executed by an AWS-managed service on behalf of the mailbox user, CloudTrail records the “sourceIPAddress” as “workmail.<region>.amazonaws.com” rather than the originating IP address of the actor’s browser session. This effectively obscures the attacker’s true network origin and prevents defenders from correlating email-sending activity with suspicious IP ranges, TOR exit nodes, or previously observed intrusion infrastructure.
Listing 4: SendRawEmail event logged after an email is sent via AWS WorkMail web interface⠀
⠀
While limited, this telemetry can still be valuable for correlating suspicious sending behavior with recently created WorkMail users or newly verified domains.
2. SMTP access Alternatively, the attacker can authenticate directly to WorkMail’s SMTP endpoint and send messages programmatically. Emails sent via SMTPdo not generate CloudTrail events, even when SES data events are enabled, creating a significant blind spot for defenders.
An example Python script used to send email through WorkMail SMTP is shown below:
⠀
import smtplib
from email.message import EmailMessage

# Configuration
SMTP_SERVER = "smtp.mail.us-east-1.awsapps.com"
SMTP_PORT = 465
EMAIL_ADDRESS = "[email protected]"
EMAIL_PASSWORD = "****"

# Create the message
msg = EmailMessage()
msg["Subject"] = "WorkMail SMTP"
msg["From"] = EMAIL_ADDRESS
msg["To"] = "<unverified_email>"
msg.set_content("Email Delivered to an Unverified Email via AWS WorkMail")

# Send the email
try:
with smtplib.SMTP_SSL(SMTP_SERVER, SMTP_PORT) as smtp:
smtp.login(EMAIL_ADDRESS, EMAIL_PASSWORD)
smtp.send_message(msg)
print("Email sent successfully!")
except Exception as e:
print(f"Error: {e}")
Listing 5: Example script sending messages via AWS WorkMail via SMTP
⠀
From an attacker’s perspective, this method is ideal: higher volume, immediate external reach, and minimal centralized logging. From a defender’s perspective, it underscores the importance of monitoring WorkMail organization creation, domain verification events, and mailbox provisioning, as these actions often precede phishing activity that will never be visible in CloudTrail.
Conclusion
This incident illustrates how threat actors can abuse higher-level AWS services to deploy phishing and spam infrastructure closely resembling legitimate enterprise usage. While AWS WorkMail is not designed to support bulk email operations, attackers can still leverage it as an interim capability alongside Amazon SES. By abusing WorkMail’s authenticated mailboxes and relaxed upfront controls, adversaries can begin sending lower volumes of email immediately — well before SES is moved out of the sandbox and higher sending quotas are approved. This staged approach allows attackers to establish sender reputation, validate infrastructure, and maintain operational momentum while bypassing many of the friction points intentionally built into SES.
To mitigate this class of abuse, organizations should combine preventive guardrails with focused detection. Where AWS WorkMail is not required, its use should be explicitly blocked using AWS Organizations Service Control Policies (SCPs) to prevent organization creation and mailbox provisioning. In environments where WorkMail is needed, IAM policies should enforce strict least-privilege access and treat WorkMail and SES administration as privileged operations subject to monitoring and approval. Finally, organizations should reduce the likelihood of initial access by implementing secure development and operational practices — such as secret scanning in code repositories, regular key rotation, and minimizing long-term access keys — to limit the impact of credential leakage and prevent attackers from converting compromised credentials into scalable email abuse.
MITRE ATT&CK techniques
Tactic
Technique
Details
Initial Access
Valid Accounts: Cloud Accounts (T1078.004)
The attacker authenticated to AWS using exposed long-term access keys validated with sts:GetCallerIdentity
Persistence
Create Account: Cloud Account (T1136.003)
The attacker created multiple IAM users and AWS WorkMail mailbox users to maintain persistent access
The attacker attached the AdministratorAccess managed policy to a newly created IAM user
Discovery
Cloud Infrastructure Discovery (T1580)
The attacker enumerated IAM users and assessed Amazon SES configuration and sandbox status via API calls
Impact
Resource Hijacking: Cloud Service Hijacking (T1496.004)
The attacker abused AWS WorkMail and SES to send high-volume phishing and spam emails from the victim account
Indicators of compromise (IOCs)
139.59.117[.]125
3.0.205[.]202
54.151.176[.]0
Note: IP addresses 3.0.205[.]202 and 54.151.176[.]0 are Amazon owned IP addresses so care should be taken when applying IP blocks.
Rapid7 customers
InsightIDR and Managed Detection and Response (MDR) customers have existing detection coverage through Rapid7’s expansive library of detection rules. These detections are deployed and will alert on the behaviors described in this technical analysis.
There is a new GnuPG update for a “critical security bug” in recent
GnuPG releases.
A crafted CMS (S/MIME) EnvelopedData message carrying an oversized
wrapped session key can cause a stack buffer overflow in gpg-agent
during the PKDECRYPT–kem=CMS handling. This can easily be used
for a DoS but, worse, the memory corruption can very likley also be
used to mount a remote code execution attack. The bug was
introduced while changing an internal API to the FIPS required KEM
API.
GNU C Library maintainer Carlos O’Donell has announced
that the project will be moving its core services away from Sourceware in favor of services hosted
at the Linux Foundation.
While it was clear to the GNU Toolchain leadership that
requirements were coming to improve the toolchain cyber-security
posture, these requirements were not clear to all project
developers. As part of receiving this feedback we have worked to
document and define a secure development policy for glibc and at a
higher level the GNU Toolchain. While Sourceware has started
making some critical technical changes, the GNU Toolchain still
faces serious, systemic concerns about securing a global, highly
available service and building a sustainable, diverse sponsorship
model.
This has been a long-running discussion; see this 2022 article for some background.
The kernel’s “kfunc” mechanism is a way of exporting kernel functions so
that they can be called directly from BPF programs. There are over 300
kfuncs in current kernels, ranging in functionality from string processing
(bpf_strnlen())
to custom schedulers (scx_bpf_kick_cpu())
and beyond. Sometimes these kfuncs need access to context information that
is not directly available to BPF programs, and which thus cannot be passed
in as arguments. The implicit
arguments patch set from Ihor Solodrai is the latest attempt to solve
this problem.
Usually, it is enough to simply look at the Zabbix proxy administration page or proxy health metrics to perform basic proxy troubleshooting. However, there are situations when a deeper look is required.
Today, we will examine the Zabbix server proxy communication and learn how to interpret the internal communication protocol.
Understanding the protocol
Zabbix communication protocol
Zabbix components use TCP for communication, and information is encoded in JSON. How do you distinguish Zabbix communication packets? There are a few main filters you need to apply:
Protocol: TCP
Port: 10051 or 10050 (depending on whether components are active or passive)
Packet: Starts with ZBXD or 5A 42 58 44 in HEX
On older versions, it was simple to capture and read Zabbix packets in plain text. Starting with Zabbix 4.0.0, mandatory traffic compression was implemented. This greatly reduces network traffic – roughly by 10× with negligible CPU overhead, but it also makes the traffic unreadable to humans.
A modern Zabbix communication packet looks like this:
Not very human-friendly, right? In the following sections we will capture and decompress this communication packet step by step.
Capturing traffic
There are multiple tools available for this purpose, but we will use Wireshark – one of the most popular and widely used packet analysis tools. It provides a nice graphical interface for Windows and Linux, but we will use the command-line version, since most troubleshooting is performed over an SSH session. The system used in this example is CentOS Stream 9, but the commands should work on other Linux distributions with only minor syntax adjustments.
First, install the tool:
dnf install wireshark-cli
This installs the tshark command-line utility. After that, change your working directory to a location where you can write files. In this example, we will use /tmp:
cd /tmp
Next, let’s capture some traffic between the Zabbix server and an active proxy:
tshark -i eth0 -f "host <ZABBIX SERVER IP> and host <ZABBIX PROXY IP> \
and tcp port 10051" -w zabbix_stream.pcap
Explanation of parameters:
-i eth0 – listen on interface eth0 (specify a different interface if needed)
<ZABBIX SERVER IP> – replace with the Zabbix server IP address
<ZABBIX PROXY IP> – replace with the Zabbix proxy IP address
tcp port 10051 – capture TCP packets on port 10051 (Zabbix trapper)
-w zabbix_stream.pcap – write captured output to a file
Let this run for a couple of minutes to collect some raw traffic data. Press CTRL + C to stop the capture.
Analyzing capture file
Now we have captured a *.pcap file that contains multiple TCP streams. A TCP stream represents a single TCP connection. Since Zabbix proxies do not keep persistent connections and instead open a new connection whenever needed, a Zabbix active proxy typically produces the following streams:
Data sender – sends collected values every second (by default)
Not all frames contain payload — the empty ones represent TCP handshakes and other control packets. We are interested only in frames containing payload, because this is where Zabbix data lives.
Analyzing payload
If you take a closer look, each payload starts with a sequence of 5a 42 58 44 – or “ZBXD” in ASCII. This is the Zabbix packet signature and confirms that we have captured the correct traffic.
The next header is: 78 9c which indicates zlib compression. After this comes the compressed JSON data we are interested in. More information can be found within Zabbix documentation here.
#!/usr/bin/python3
import zlib
hex_file = "zabbix_payload.hex"
ZBXD_HEADER_LEN = 26 # 13 bytes * 2 hex chars per byte
with open(hex_file, "r") as f:
for line_number, line in enumerate(f, 1):
line = line.strip()
if not line:
continue
# Remove Zabbix header
if line.startswith("5a425844"):
payload_hex = line[ZBXD_HEADER_LEN:]
else:
payload_hex = line
# Convert hex to bytes
try:
payload_bytes = bytes.fromhex(payload_hex)
except ValueError as e:
print(f"Line {line_number}: Invalid hex, skipping ({e})")
continue
# Decompress using zlib
try:
decompressed = zlib.decompress(payload_bytes)
except zlib.error as e:
print(f"Line {line_number}: Decompression error ({e})")
continue
print(f"Line {line_number}: {decompressed}")
Make the file executable:
chmod +x decompress.py
Execute the file:
./decompress.py
The script will output decompressed Zabbix traffic:
Line 59: b'{"request":"proxy data","host":"Zabbix proxy active","session":"fbdb545d8250bb4c9b2341cc8ca055f1","history data":[{"id":13,"itemid":50454,"clock":1764172374,"ns":946257883,"value":"[{\\"{#IFNAME}\\":\\"lo\\"},{\\"{#IFNAME}\\":\\"eth0\\"}]"}],"version":"7.4.5","clock":1764172375,"ns":432069960}'
Line 60: b'{"upload":"enabled","response":"success","tasks":[{"type":6,"clock":1764172373,"ttl":3600,"itemid":50454}]}'
Line 61: b'{"request":"proxy data","host":"Zabbix proxy active","session":"fbdb545d8250bb4c9b2341cc8ca055f1","version":"7.4.5","clock":1764172375,"ns":438122213}'
Line 62: b'{"upload":"enabled","response":"success"}'
Line 63: b'{"request":"proxy config","host":"Zabbix proxy active","version":"7.4.5","session":"fbdb545d8250bb4c9b2341cc8ca055f1", "config_revision":18611,"proxy_secrets_provider":0}'
Line 64: b'{"data":{},"config_revision":18613}'
Here every line represents a request from a Zabbix active proxy or Zabbix server response. It is easy to distinguish two communication types:
Request proxy data – Proxy sends collected values
Request proxy config – Proxy checks its configuration revision and downloads configuration changes if required
Recap
It is required to run only three commands in this setup to read uncompressed communications:
tshark -i eth0 -f "host <ZABBIX SERVER IP> and host <ZABBIX PROXY IP> \
and tcp port 10051" -w zabbix_stream.pcap
tshark -r zabbix_stream.pcap -T fields -e tcp.payload -E occurrence=f \
| grep -v '^$' > zabbix_payload.hex
./decompress.py
A more human-readable format
Can we improve it? Absolutely! Let’s pair requests with their corresponding responses for easier parsing, and then output the data as formatted JSON. First, capture the data:
tshark -i eth0 -f "host <ZABBIX SERVER IP> and host <ZABBIX PROXY IP> \
and tcp port 10051" -w zabbix_stream.pcap
Next, extract the data into a CSV while keeping the stream number:
You’ll notice that typical communication produces two entries per stream – one request from the Zabbix proxy and one response from the Zabbix server. With this approach, it’s much easier to understand and troubleshoot the communication – all traffic is now grouped into request-response pairs and presented in a clean, formatted way.
Live data
And finally — can we make all of this run live? Absolutely, with a little help from our third Python script. The previous two examples walked through the workflow step by step: capture → extract payload → decompress. Now everything comes together in a single script that handles the entire process for you.
Create a new file named live.py:
#!/usr/bin/python3

import subprocess
import zlib
import json
from datetime import datetime

ZBXD_HEADER_LEN = 26 # 13 bytes * 2 hex chars

# === Configurable parameters ===
SRC_IP = "161.35.217.186"
DST_IP = "134.209.233.72"
TCP_PORT = "10051"
INTERFACE = "eth0"

tshark_cmd = [
  "tshark",
  "-i", INTERFACE,
  "-l",
  "-f", f"host {SRC_IP} and host {DST_IP} and tcp port {TCP_PORT}",
  "-T", "fields",
  "-e", "tcp.stream",
  "-e", "tcp.payload",
  "-E", "separator=,",
  "-E", "quote=d",
  "-E", "occurrence=f",
  "-Y", "tcp.payload && tcp.payload != \"\""
]

proc = subprocess.Popen(
  tshark_cmd,
  stdout=subprocess.PIPE,
  stderr=subprocess.DEVNULL,
  text=True
)

seen_streams = set() # track streams we've already printed

for line in proc.stdout:
  line = line.strip()
  if not line:
    continue

  # Split CSV (stream_number, payload_hex)
  try:
    stream_num, payload_hex = line.split(",", 1)
    payload_hex = payload_hex.strip('"')
  except ValueError:
    continue

  # Only print timestamp once per stream
  if stream_num not in seen_streams:
    timestamp = datetime.now().strftime("%Y-%m-%d %H:%M:%S.%f")[:-3]
    print(f"\n=== [{timestamp}] Stream {stream_num} ===")
    seen_streams.add(stream_num)

  # Remove Zabbix header
  if payload_hex.startswith("5a425844"):
    payload_hex = payload_hex[ZBXD_HEADER_LEN:]

  # Convert hex to bytes
  try:
    payload_bytes = bytes.fromhex(payload_hex)
  except ValueError:
    continue

  # Decompress
  try:
    decompressed = zlib.decompress(payload_bytes)
  except zlib.error:
    continue

  # Pretty print JSON if possible
  try:
    json_obj = json.loads(decompressed)
    pretty = json.dumps(json_obj, indent=2)
    print(pretty)
  except json.JSONDecodeError:
    print(decompressed)
Make the file executable:
chmod +x live.py
Execute the file:
./live.py
And that’s it – your script now watches live proxy traffic and streams the output as JSON. Pretty cool, right?
The example scripts provided here are for demonstration purposes only, tested in a small demo environment. While the same principles apply to larger setups, keep in mind that proxies in production can handle hundreds or even thousands of new values per second (NVPS), which significantly increases the payload volume. Also, all examples assume a Zabbix proxy running in active mode – passive proxies communicate slightly differently. A similar approach can be used to monitor Zabbix Agent communications.
So, what valuable information can you actually gather from Zabbix proxy ⇄ Zabbix Server communication?
The types of data sent from proxy to server
Configuration updates and their contents
Test and Execute Now tasks
Discovery and Autoregistration data
If you’re interested in exploring discovery, autoregistration, encryption, or other aspects of Zabbix’s internal communication, feel free to leave a comment!
The Xfce team has announced that
it will be providing funding to Brian Tarricone to work on xfwl4,
a Wayland compositor for Xfce:
Xfwl4 will not be based on the existing xfwm4 code. Instead, it
will be written from scratch in rust, using smithay building
blocks.
The first attempt at creating an Xfce Wayland compositor involved
modifying the existing xfwm4 code to support both X11 and Wayland in
parallel. However, this approach turned out to be the wrong path
forward for several reasons:
Xfwm4 is architected in a way that makes it very difficult to put the window management behavior behind generic interfaces that don’t include X11 specifics.
Refactoring Xfwm4 is risky, since it might introduce new bugs to X11. Having two parallel code bases will allow for rapid development and experimentation with the Wayland compositor, with zero risk to break xfwm4.
Some X11 window management concepts just aren’t available or supported by Wayland protocols at this time, and dealing with those differences can be difficult in an X11-first code base.
Using the existing codebase would require us to use C and
wlroots, even if a better alternative is available.
Work has already commenced on the project, and the project hopes to
share a development release in mid-2026.
The collective thoughts of the interwebz
Manage Consent
To provide the best experiences, we use technologies like cookies to store and/or access device information. Consenting to these technologies will allow us to process data such as browsing behavior or unique IDs on this site. Not consenting or withdrawing consent, may adversely affect certain features and functions.
Functional
Always active
The technical storage or access is strictly necessary for the legitimate purpose of enabling the use of a specific service explicitly requested by the subscriber or user, or for the sole purpose of carrying out the transmission of a communication over an electronic communications network.
Preferences
The technical storage or access is necessary for the legitimate purpose of storing preferences that are not requested by the subscriber or user.
Statistics
The technical storage or access that is used exclusively for statistical purposes.The technical storage or access that is used exclusively for anonymous statistical purposes. Without a subpoena, voluntary compliance on the part of your Internet Service Provider, or additional records from a third party, information stored or retrieved for this purpose alone cannot usually be used to identify you.
Marketing
The technical storage or access is required to create user profiles to send advertising, or to track the user on a website or across several websites for similar marketing purposes.
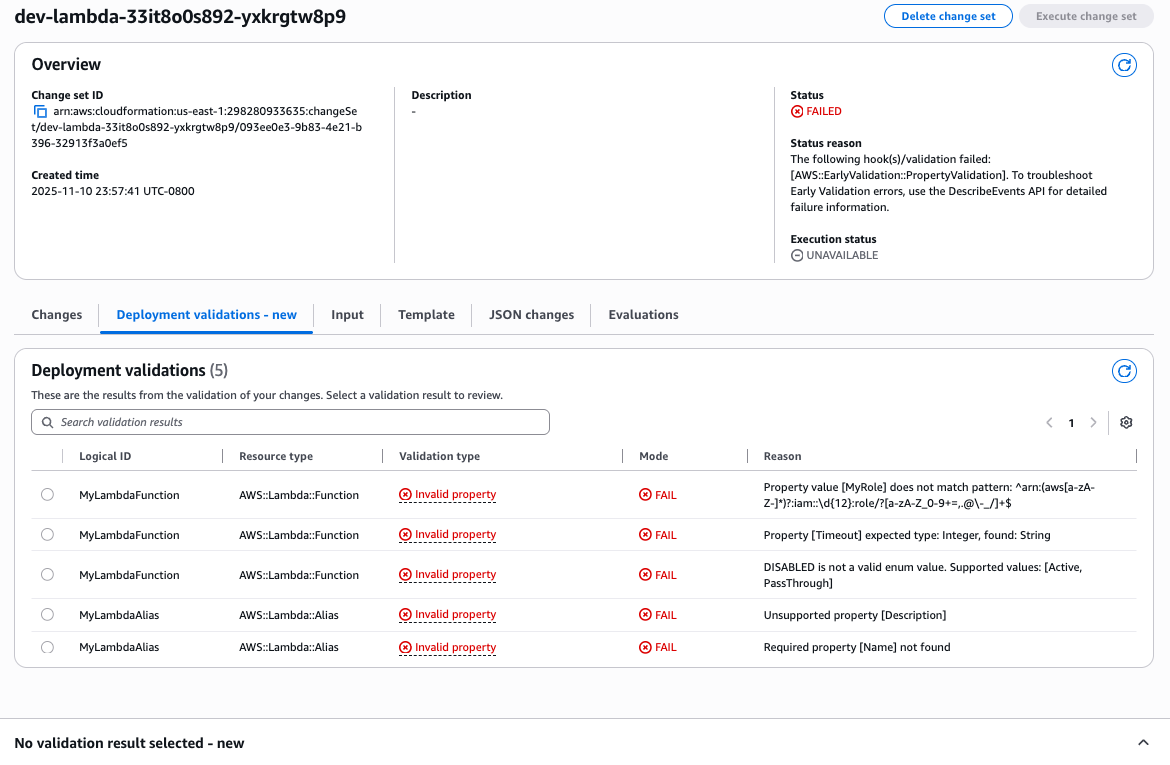
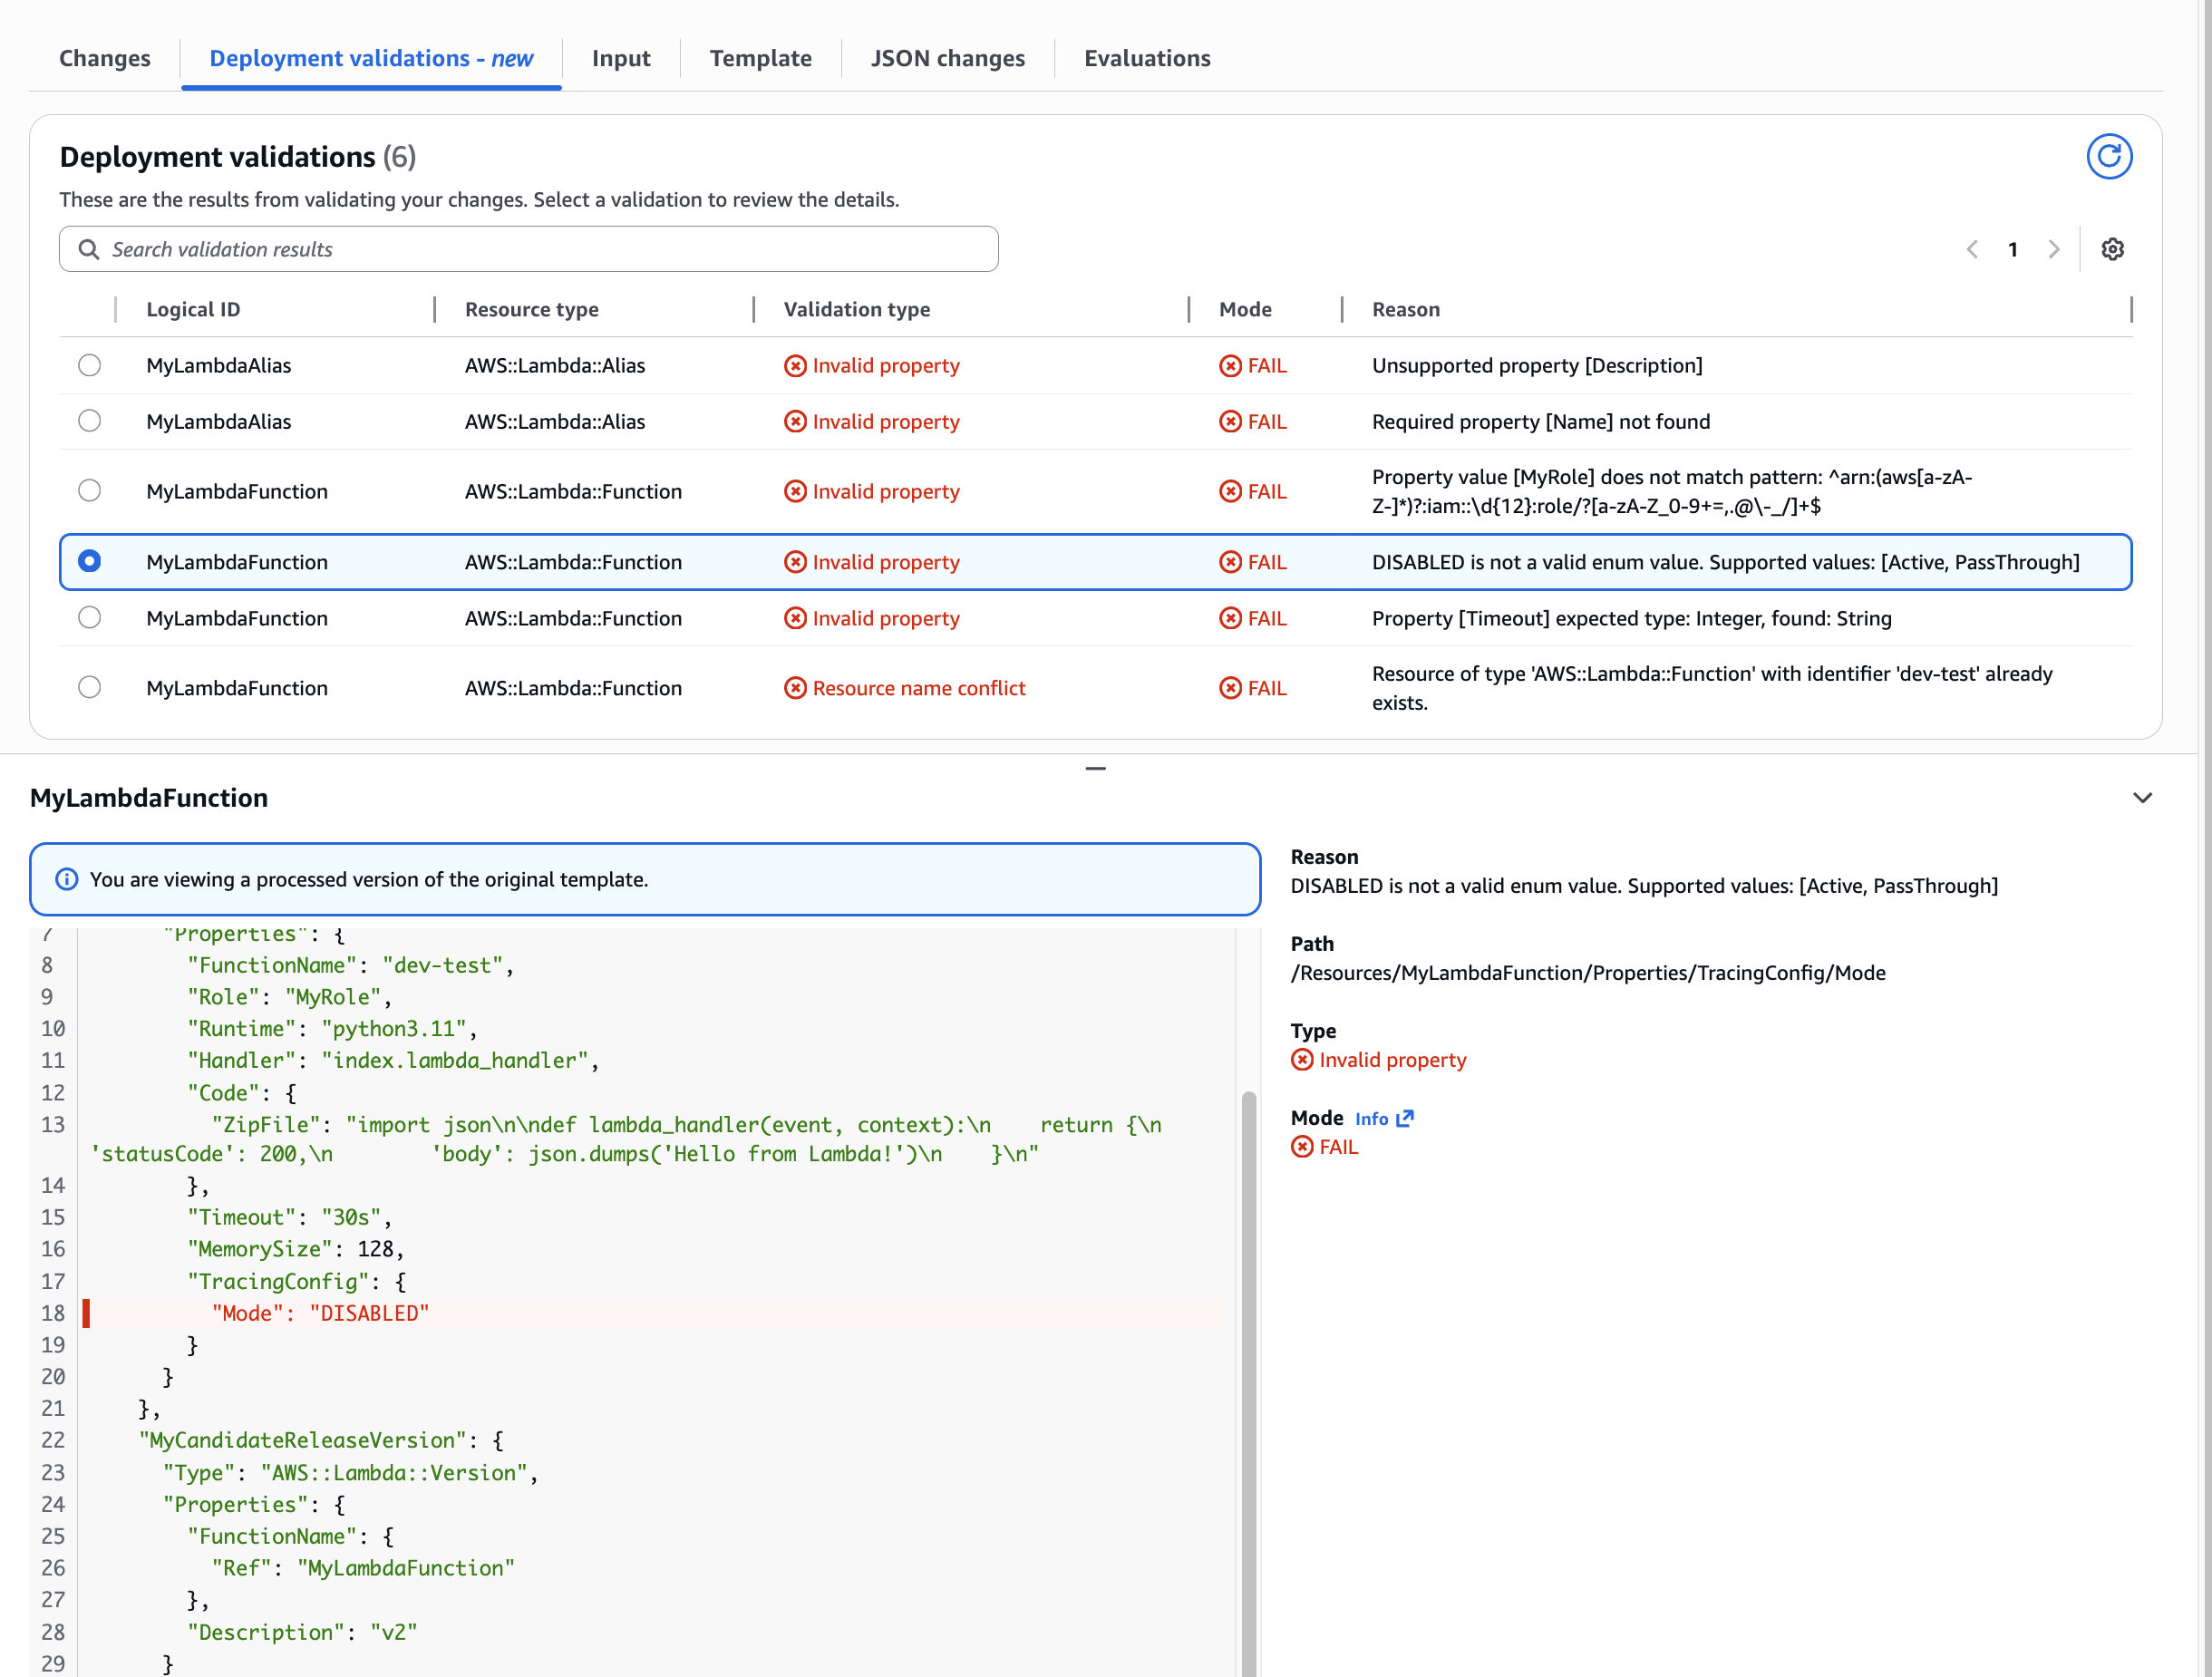
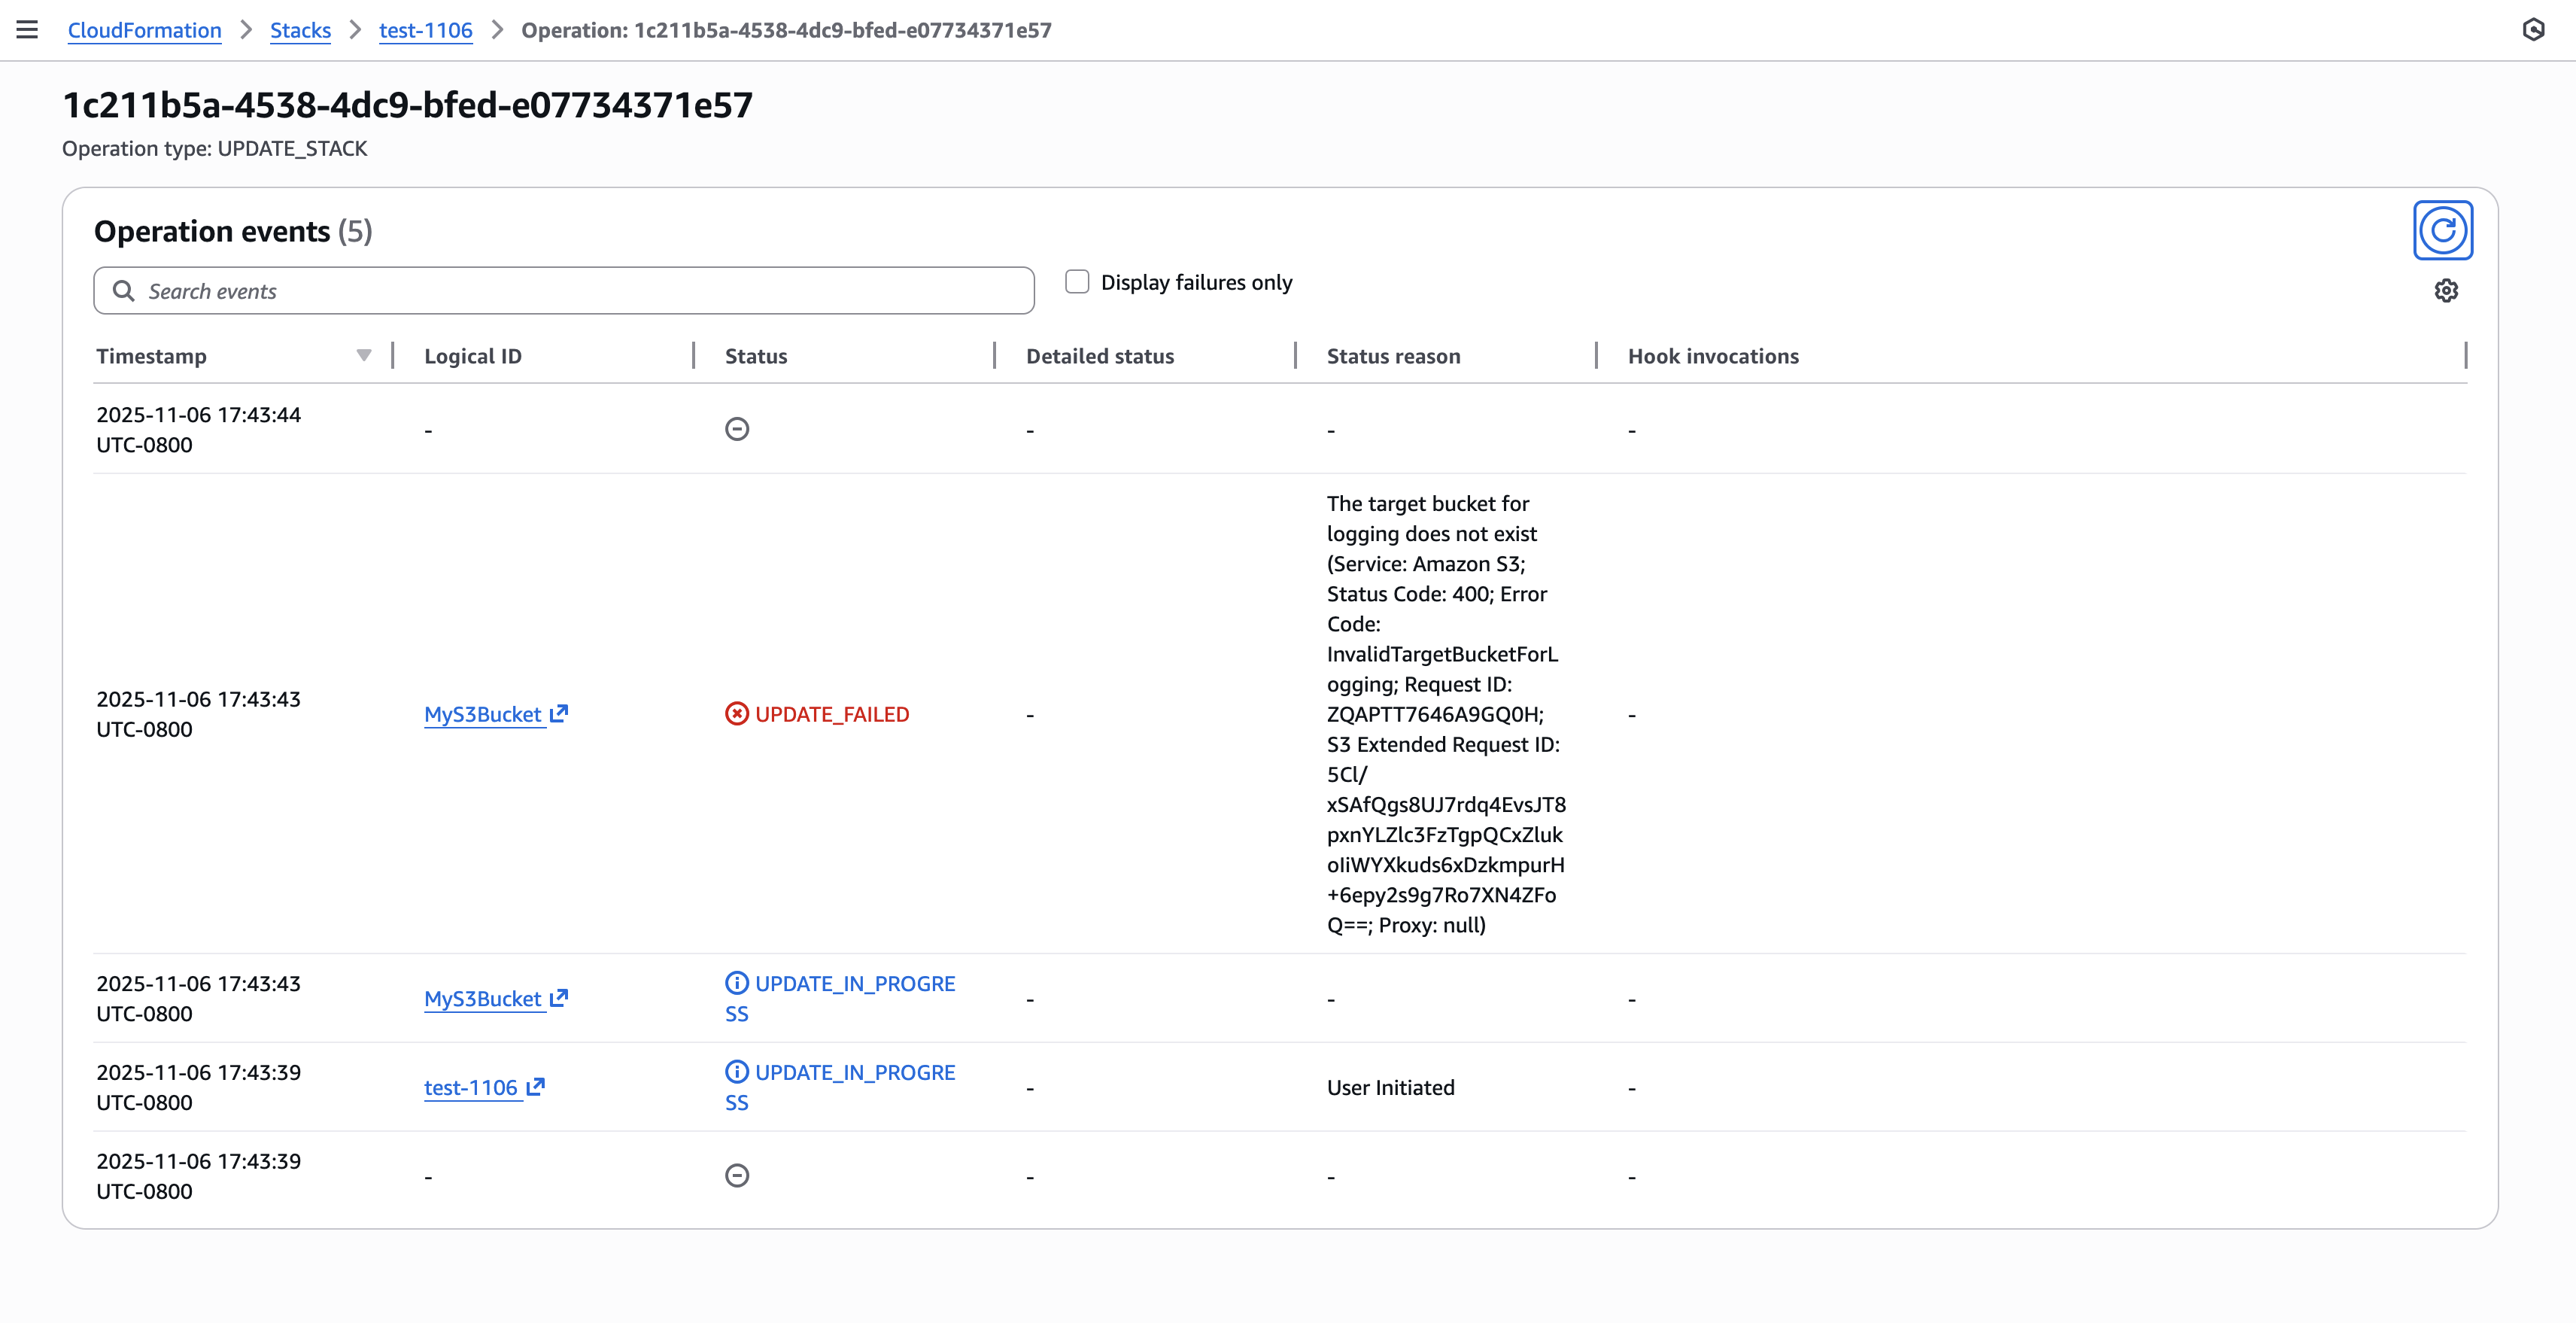 Figure 3: New CloudFormation stack operation page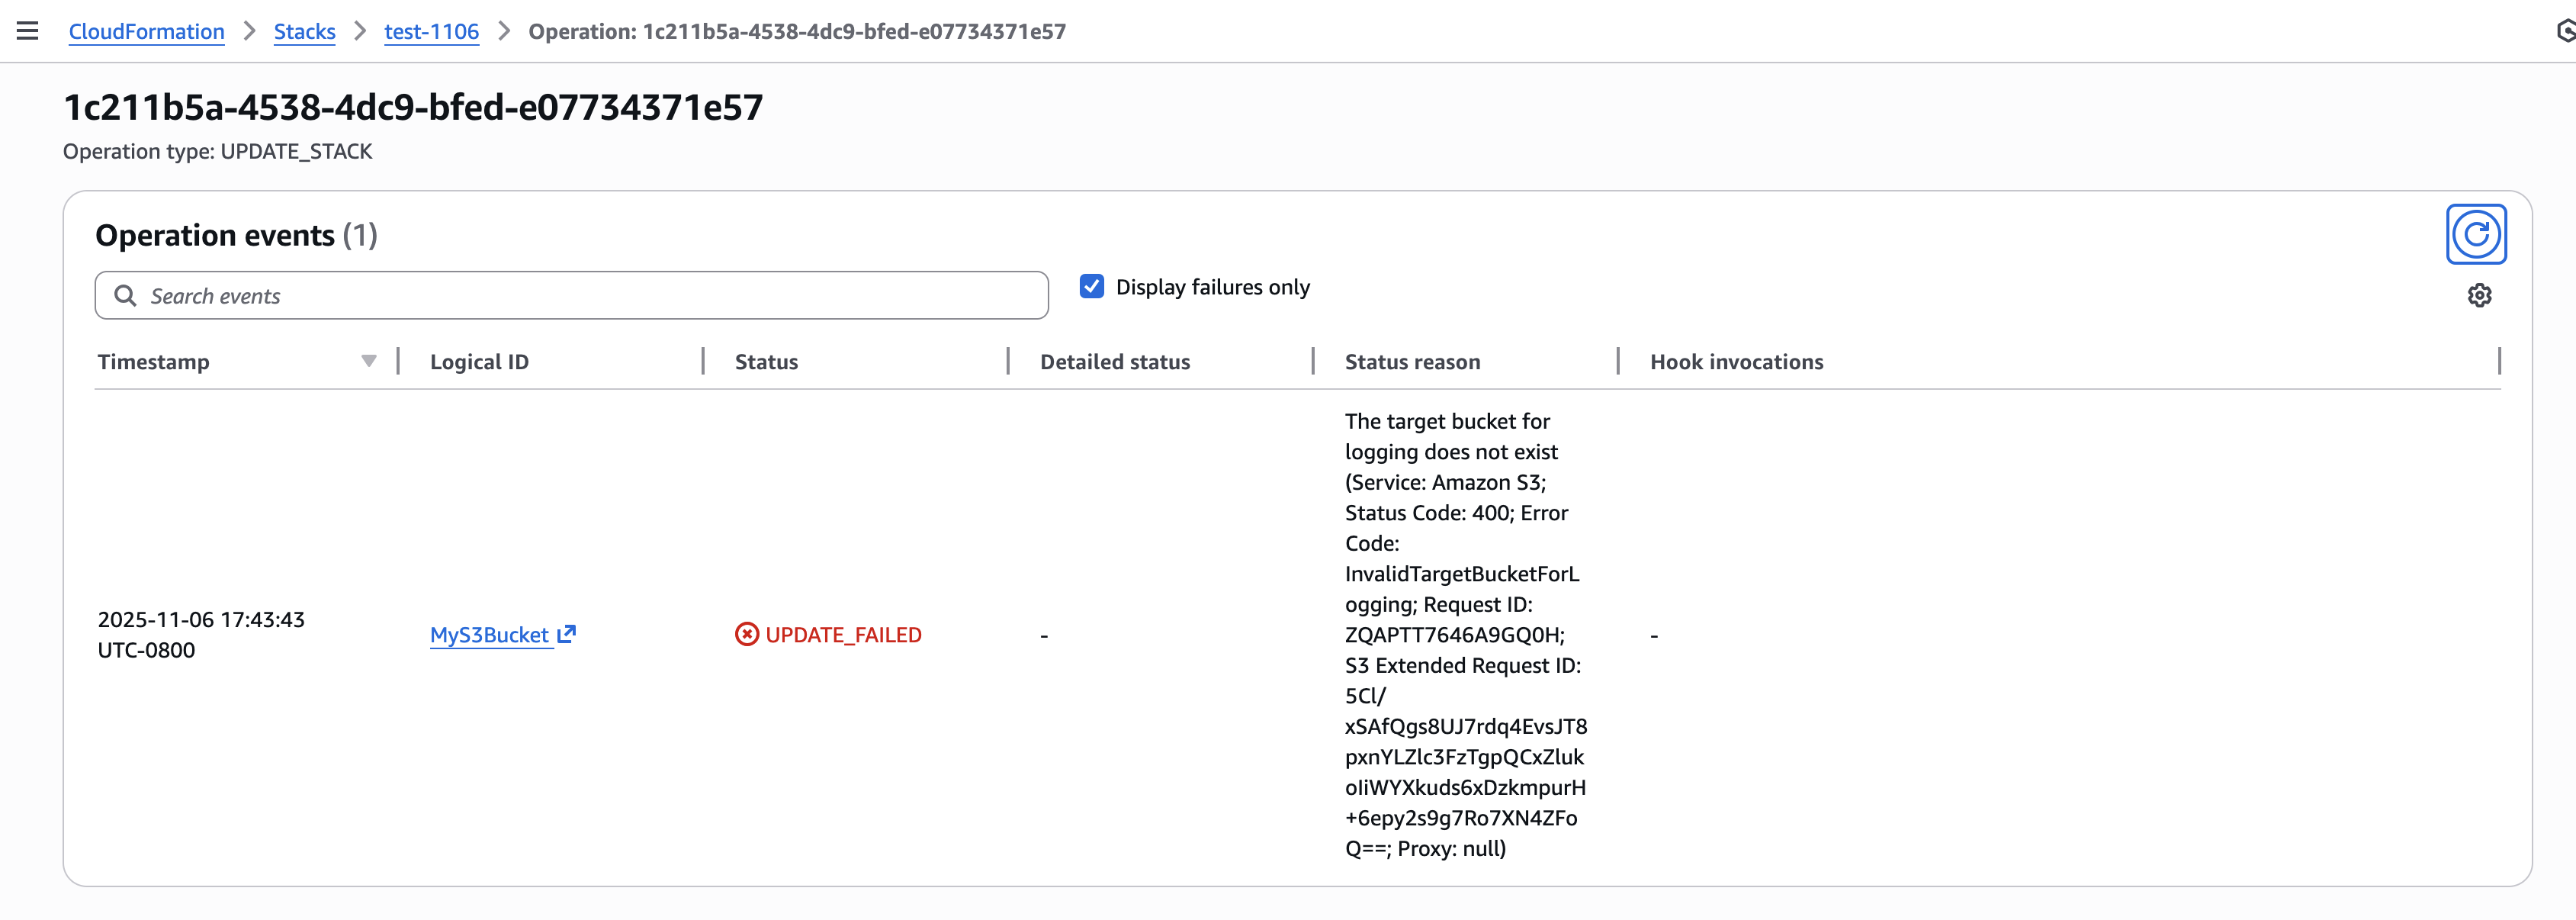
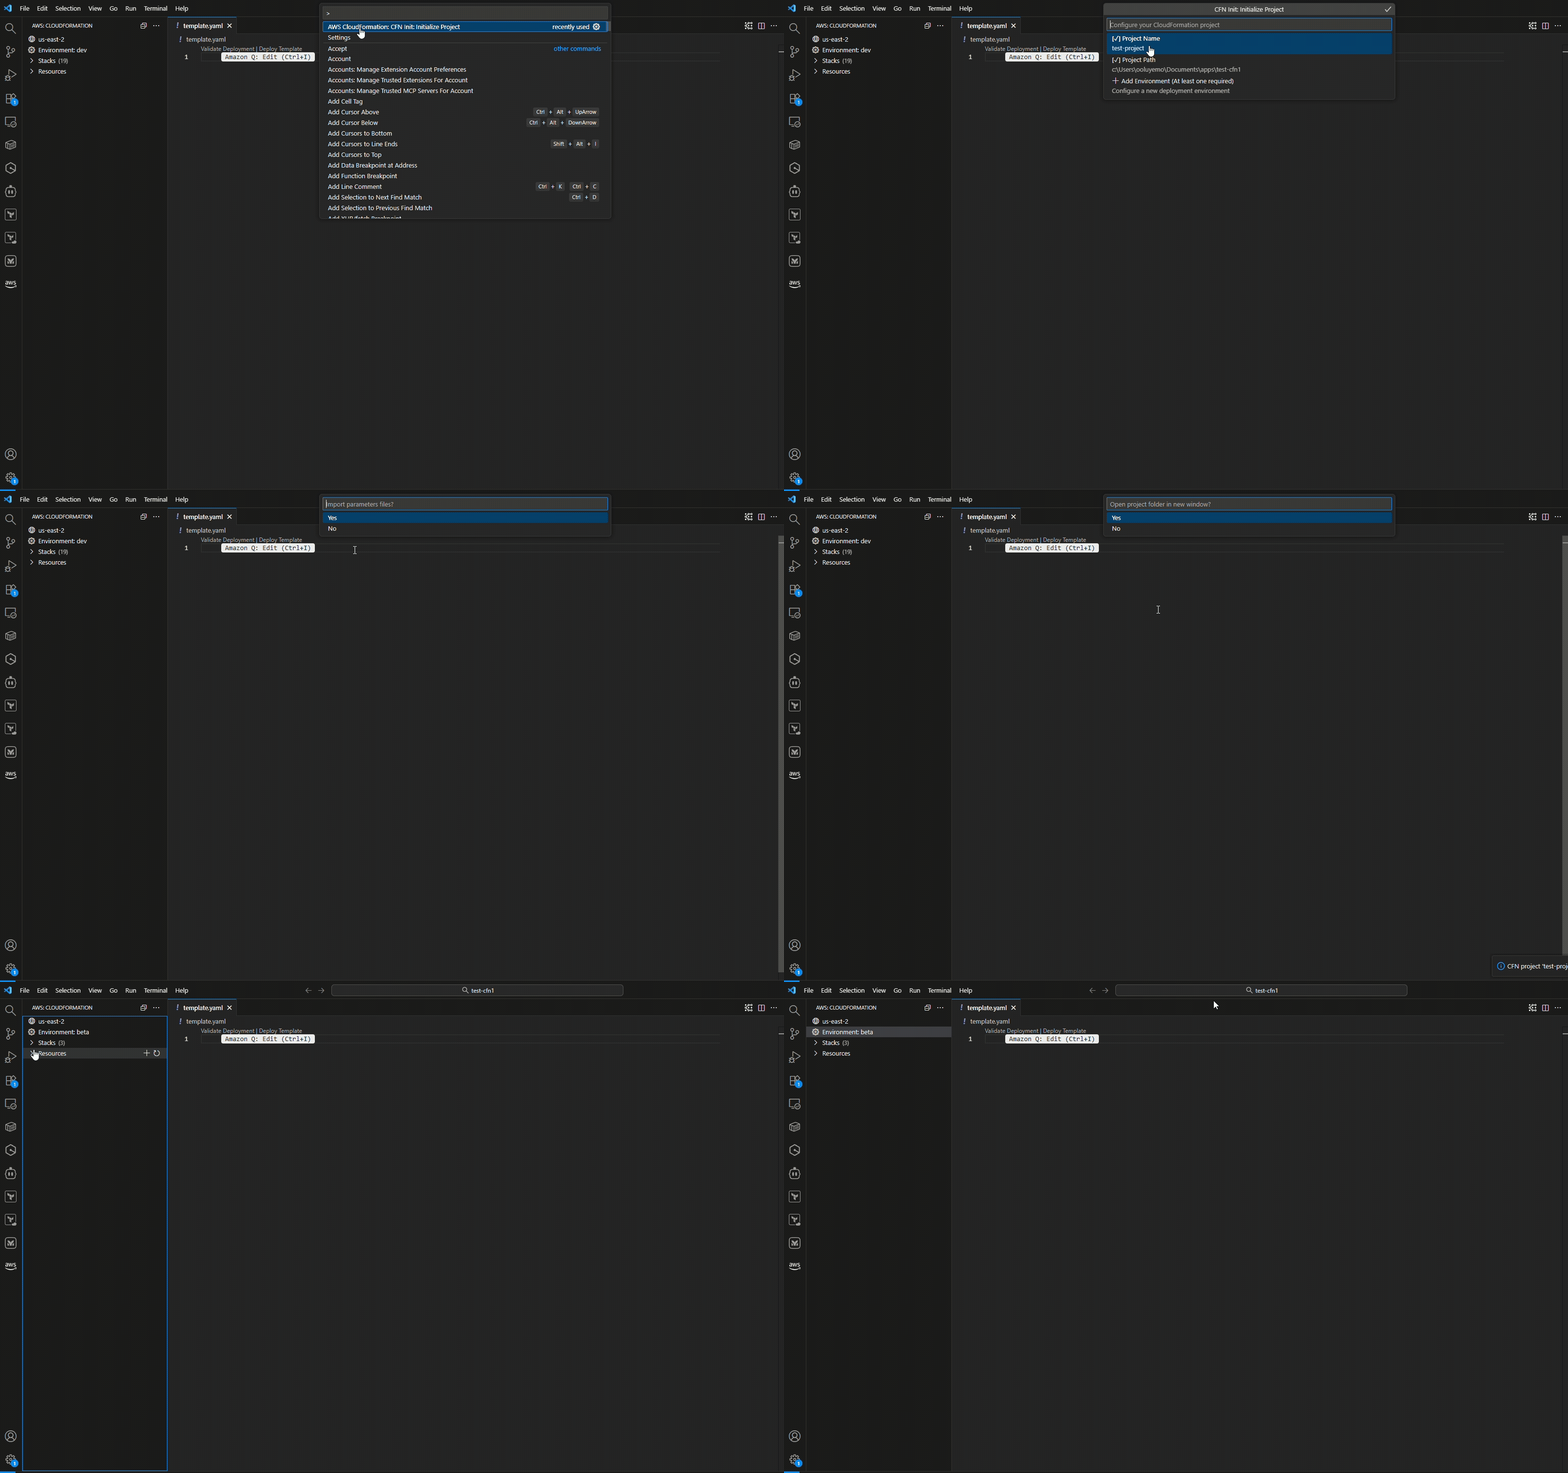
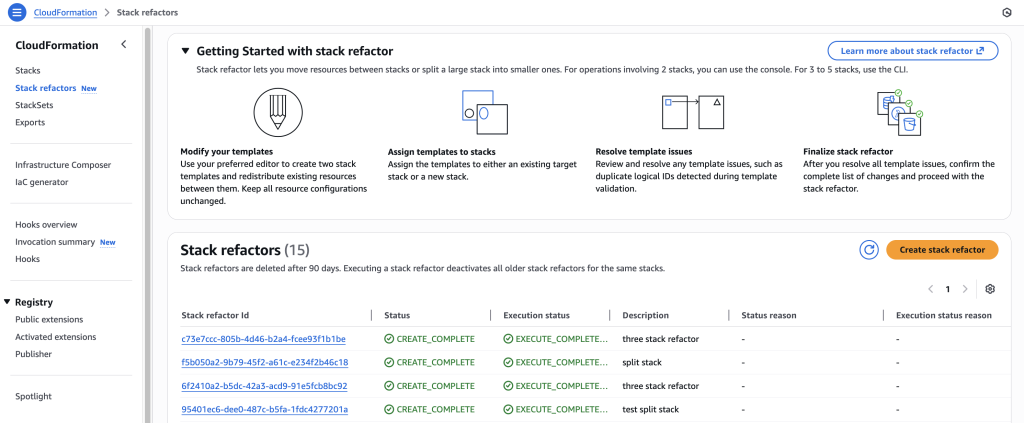
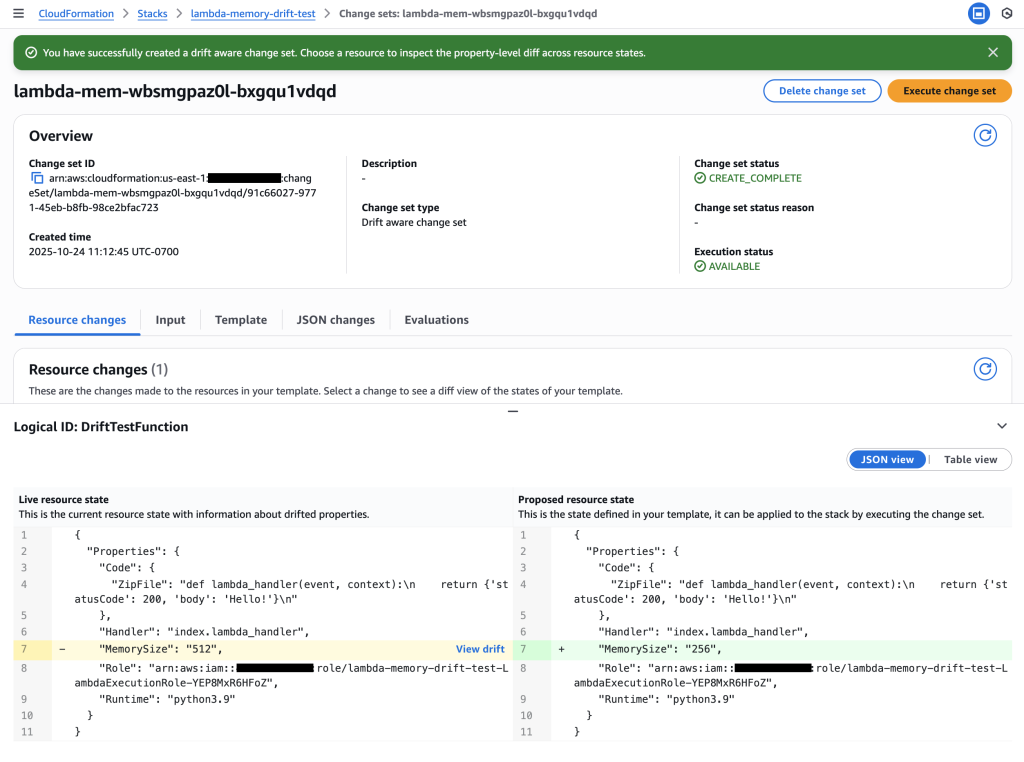
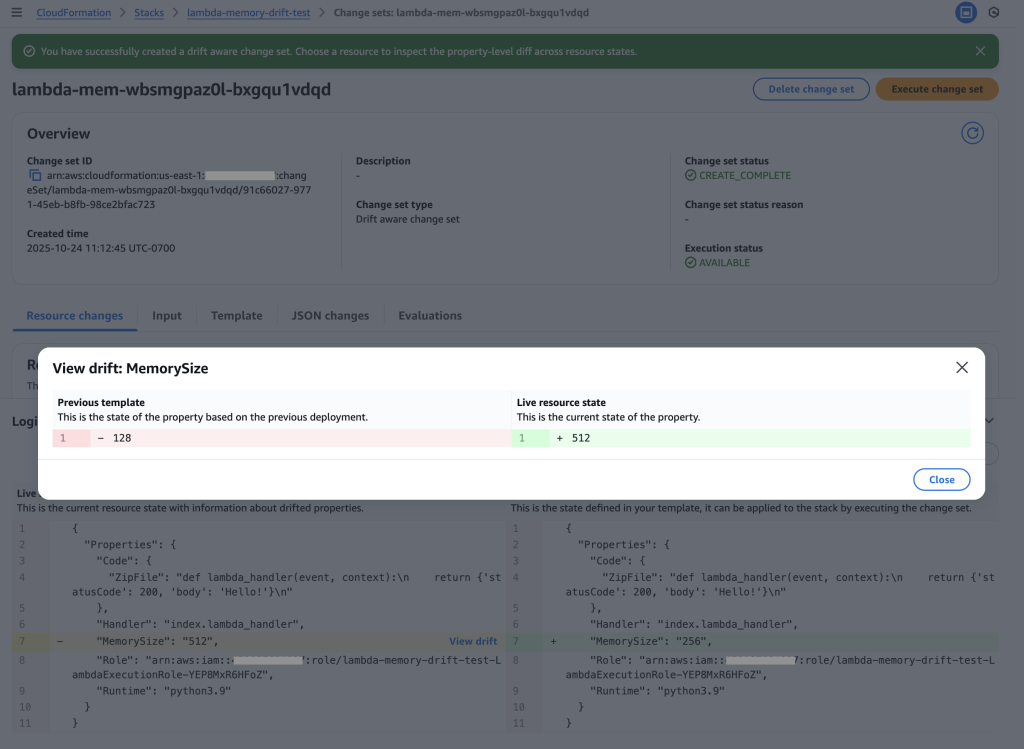
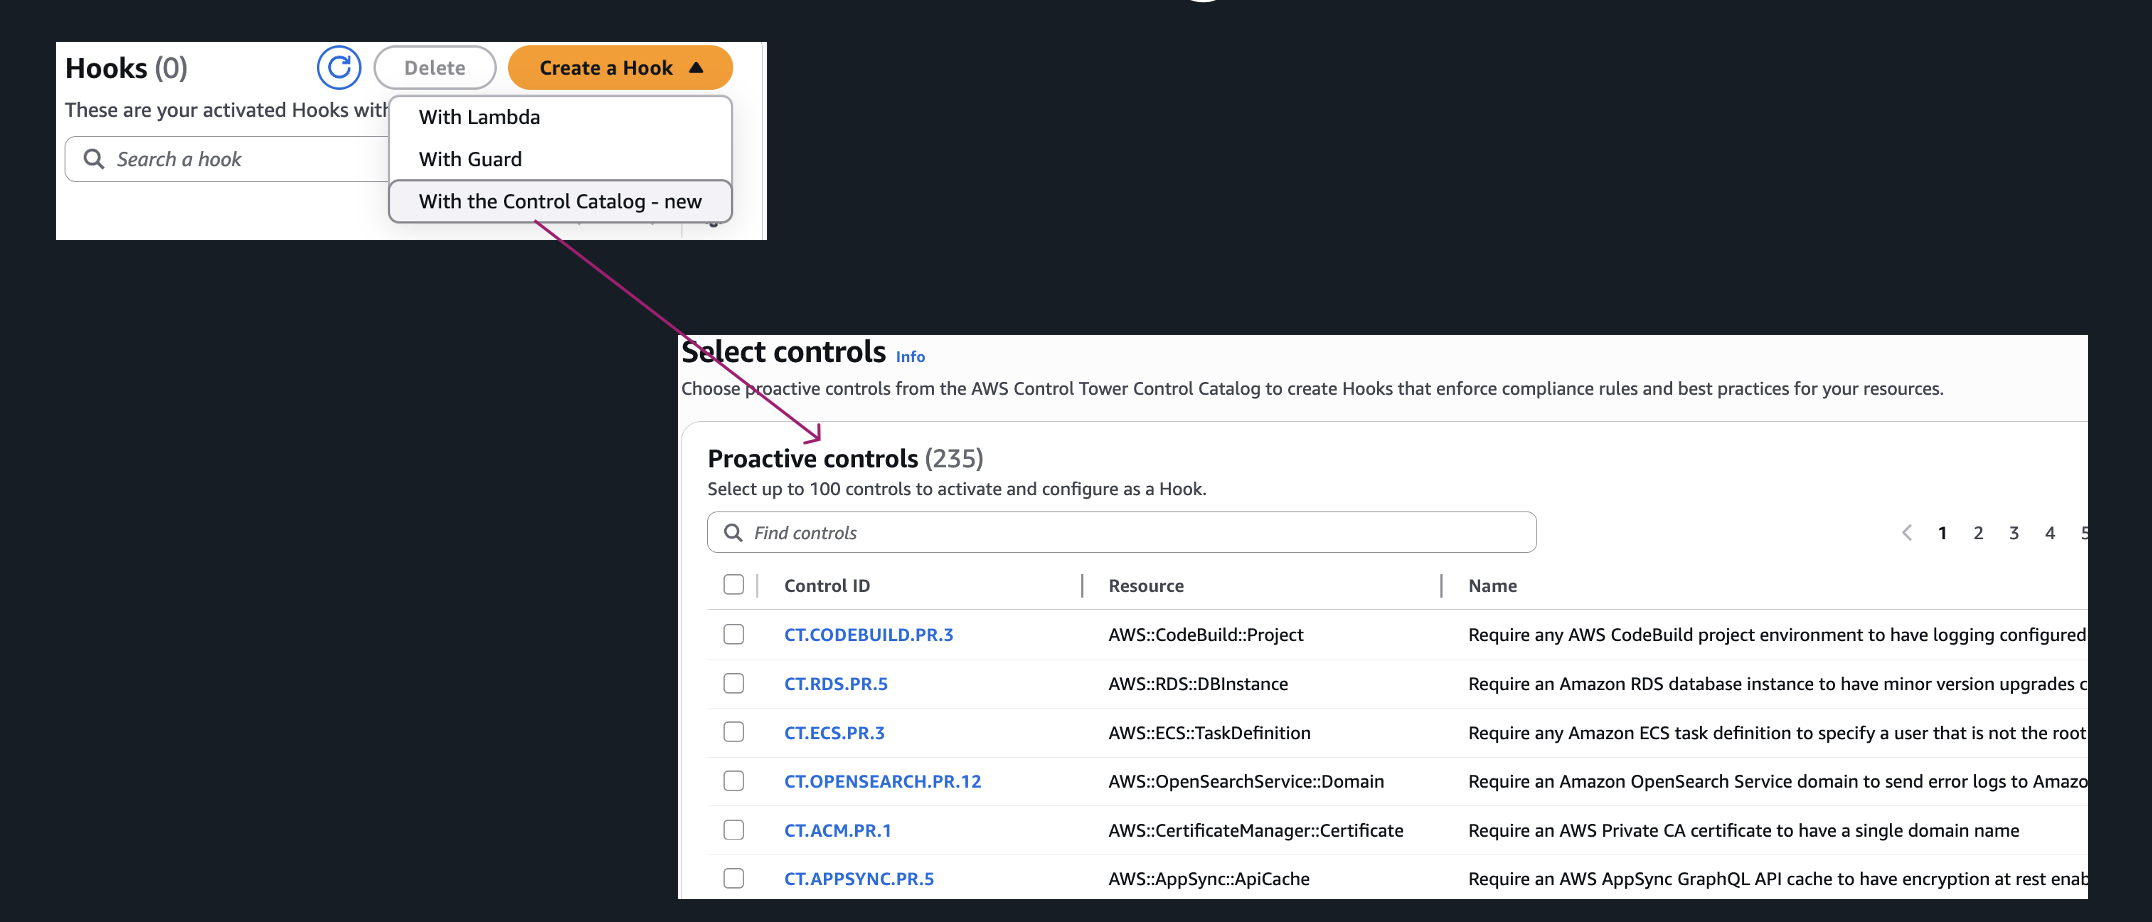
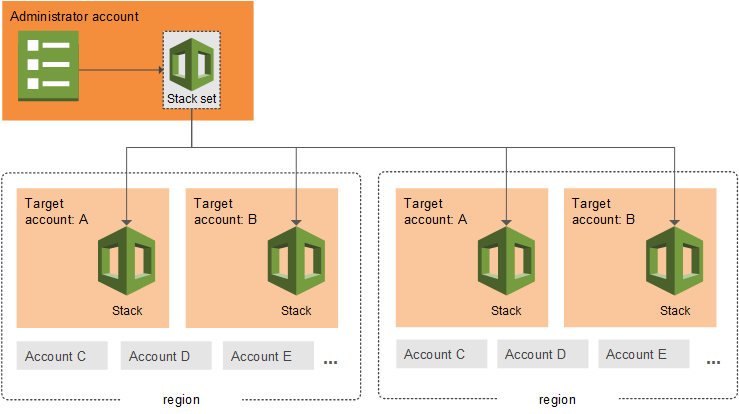
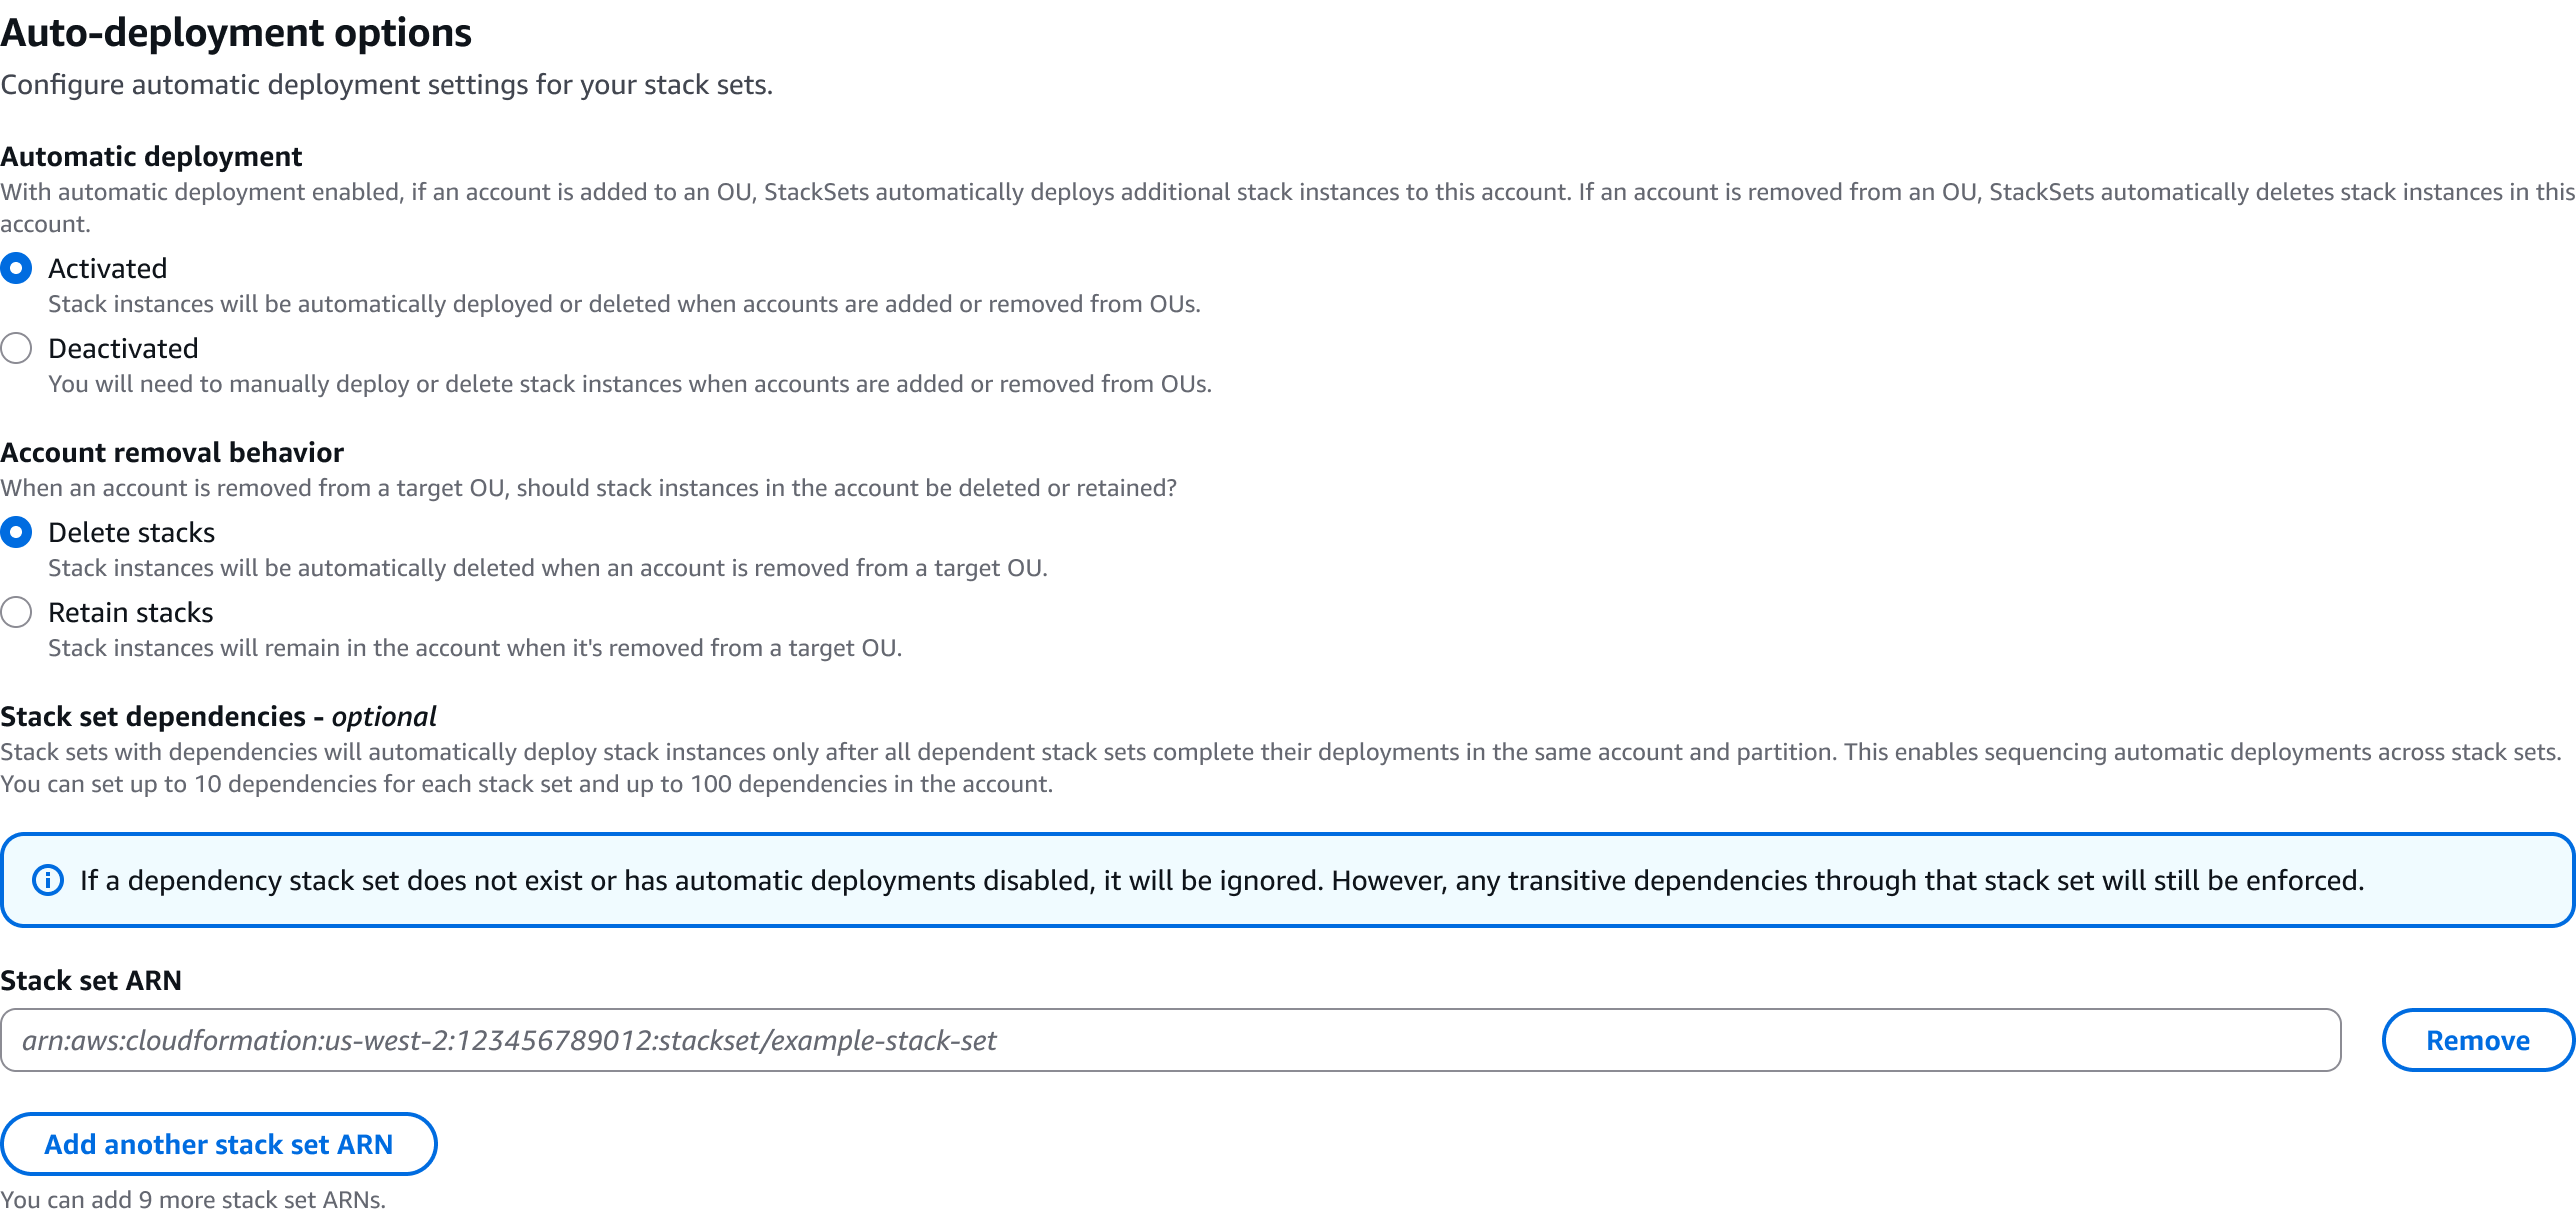
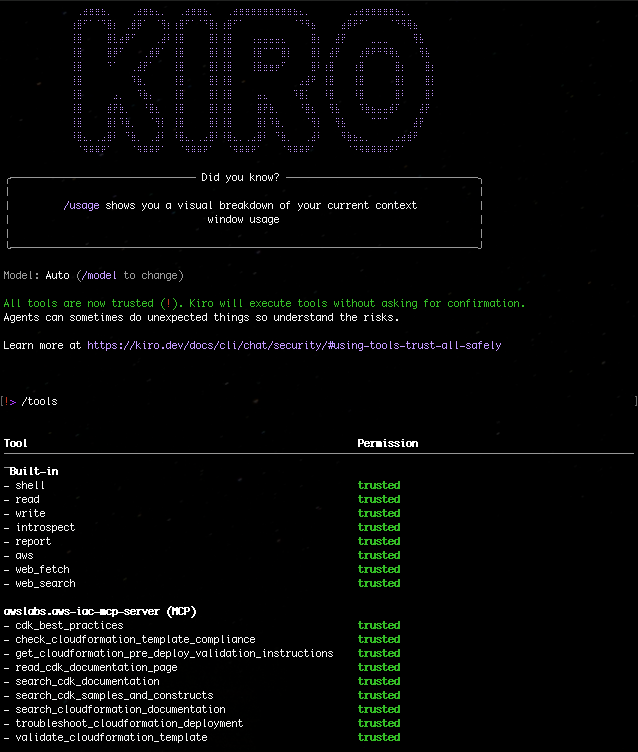
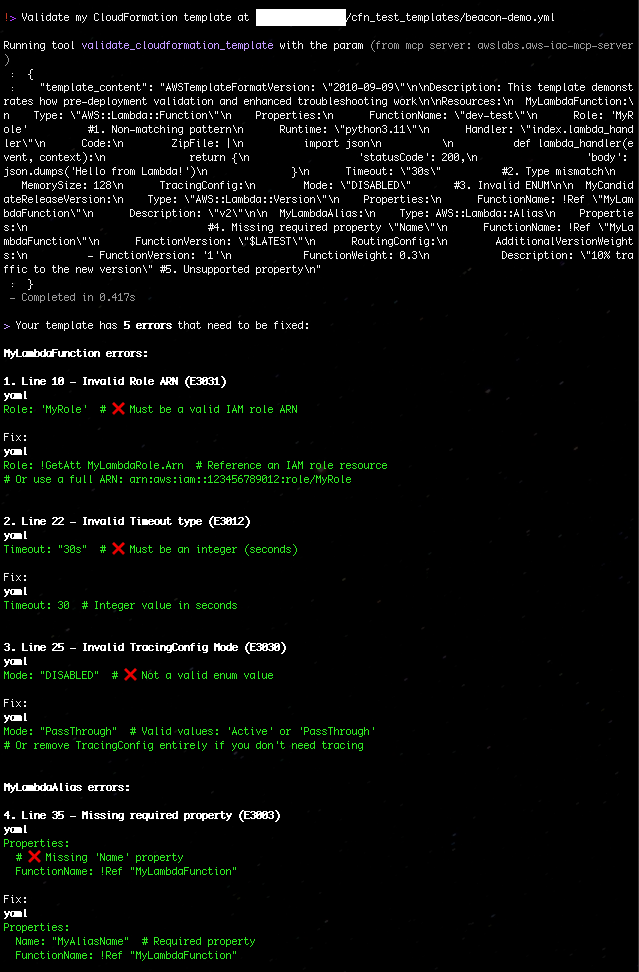

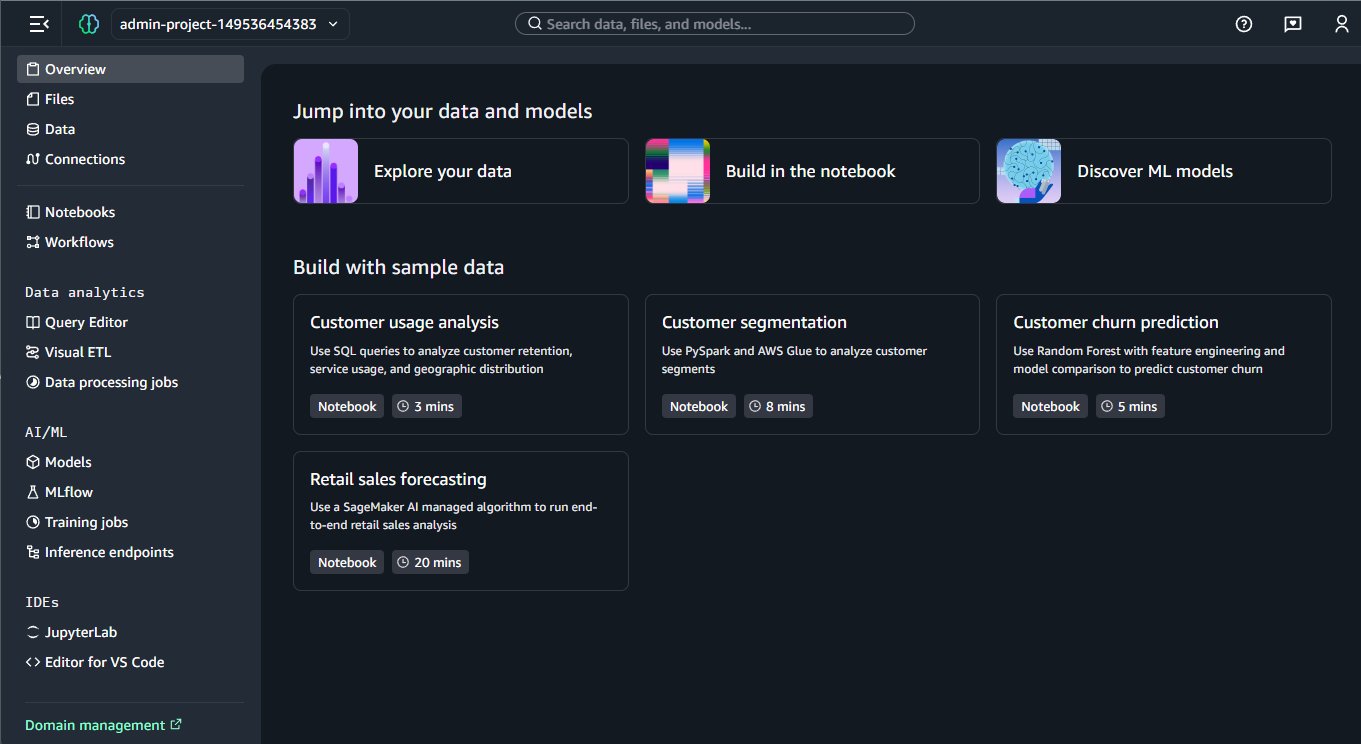
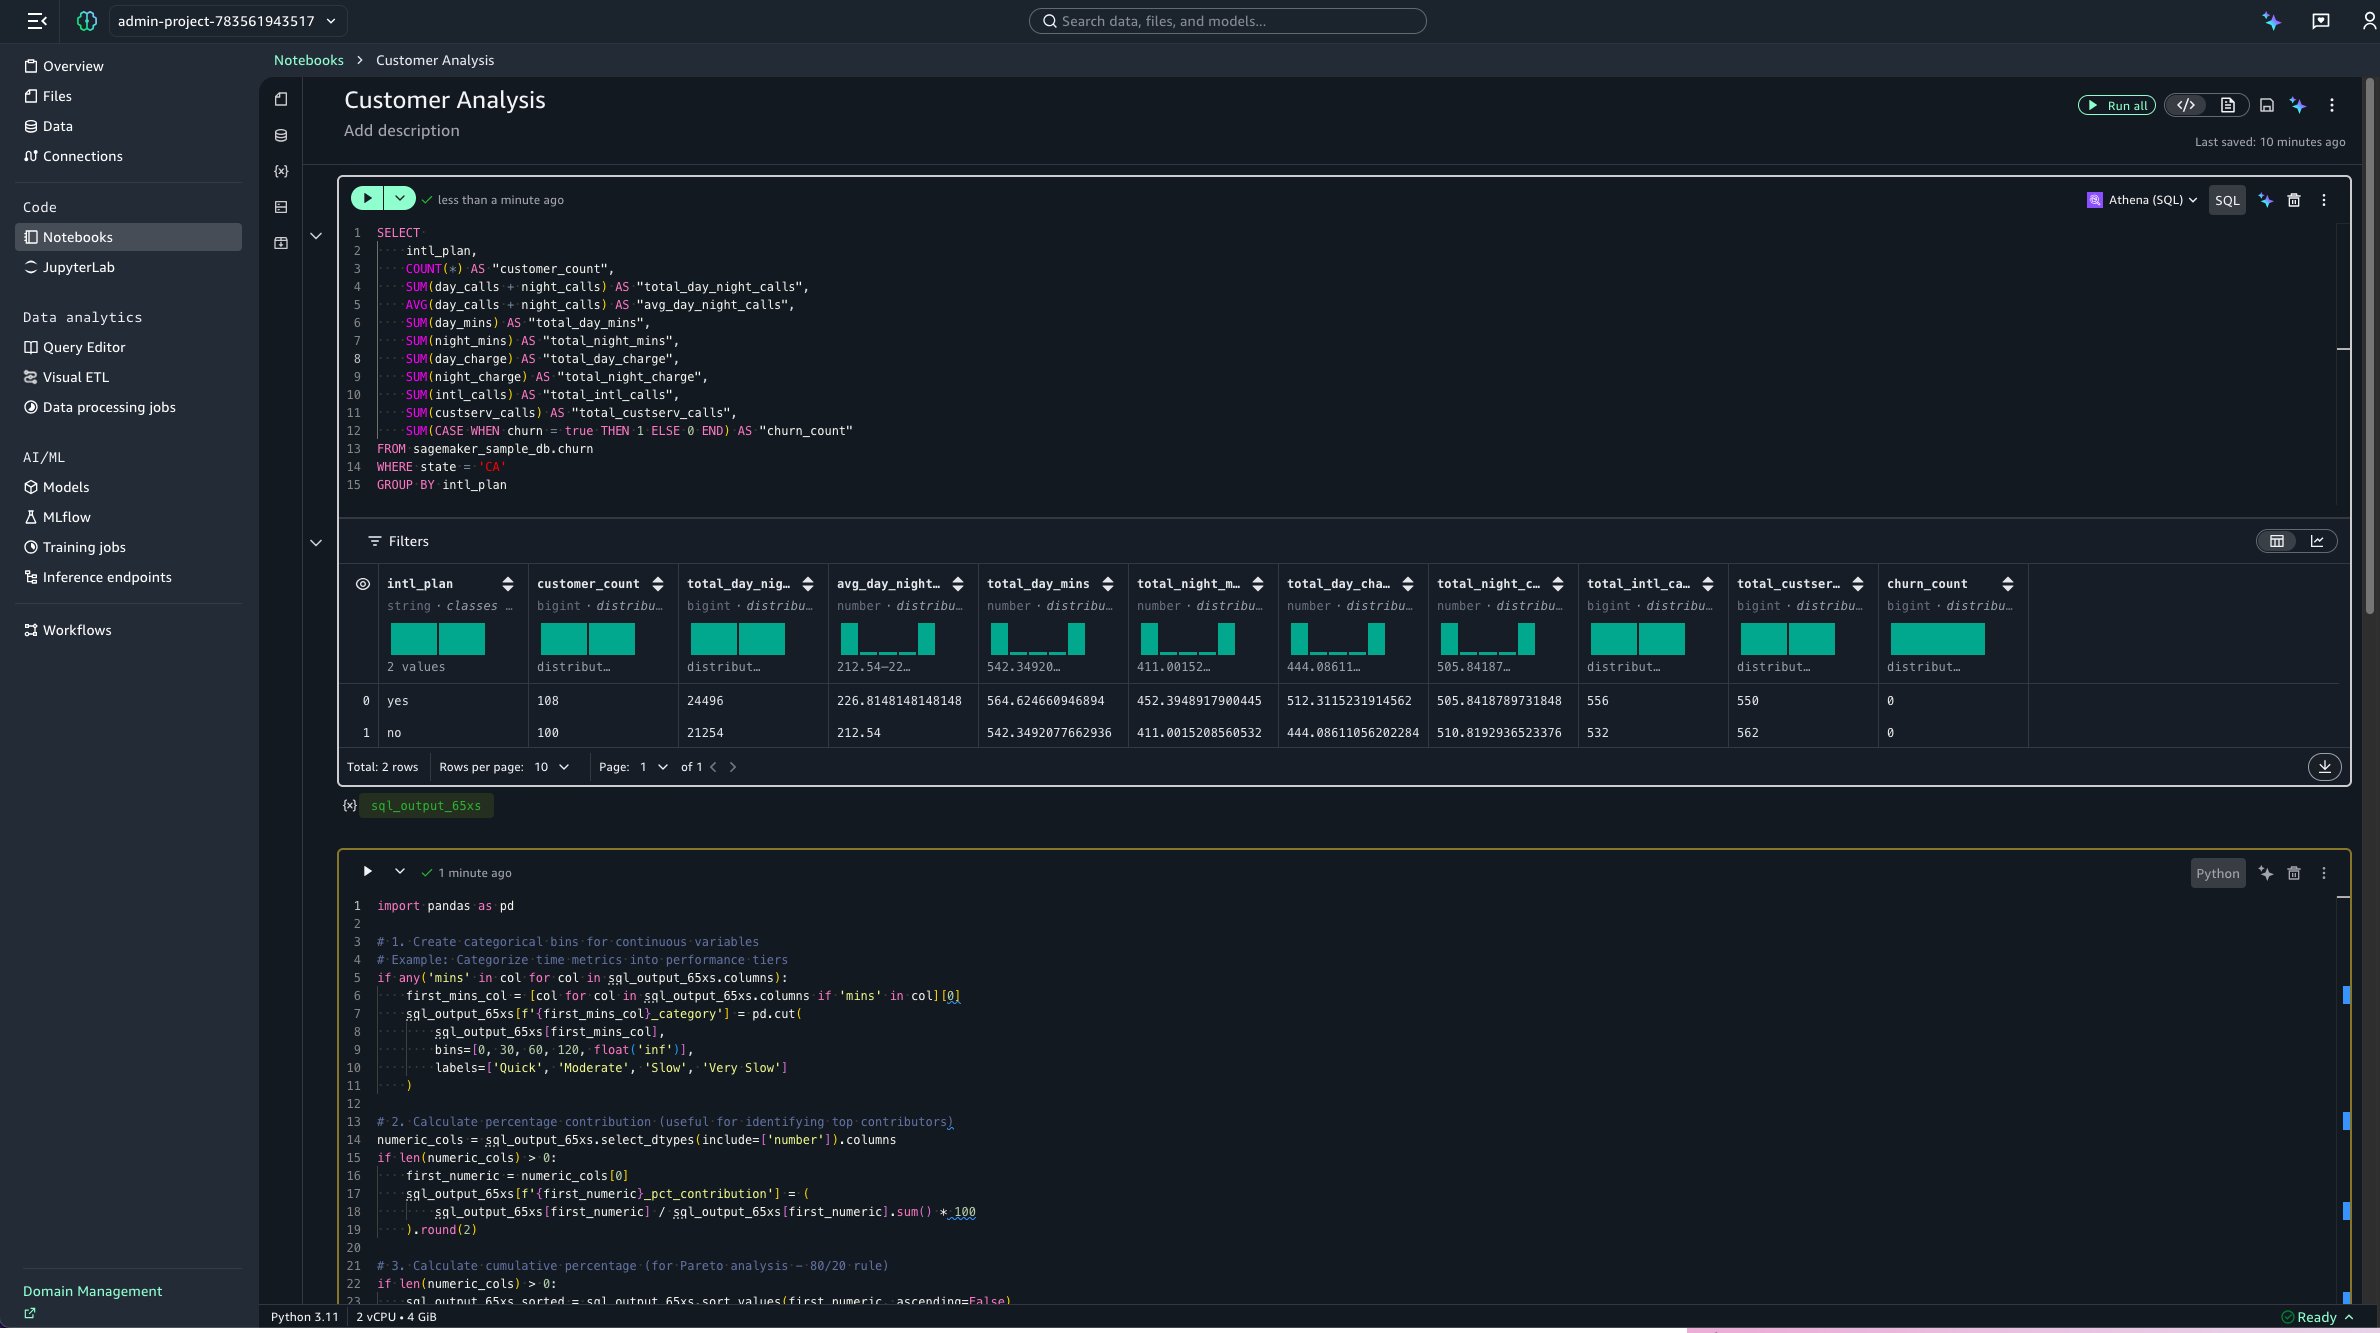
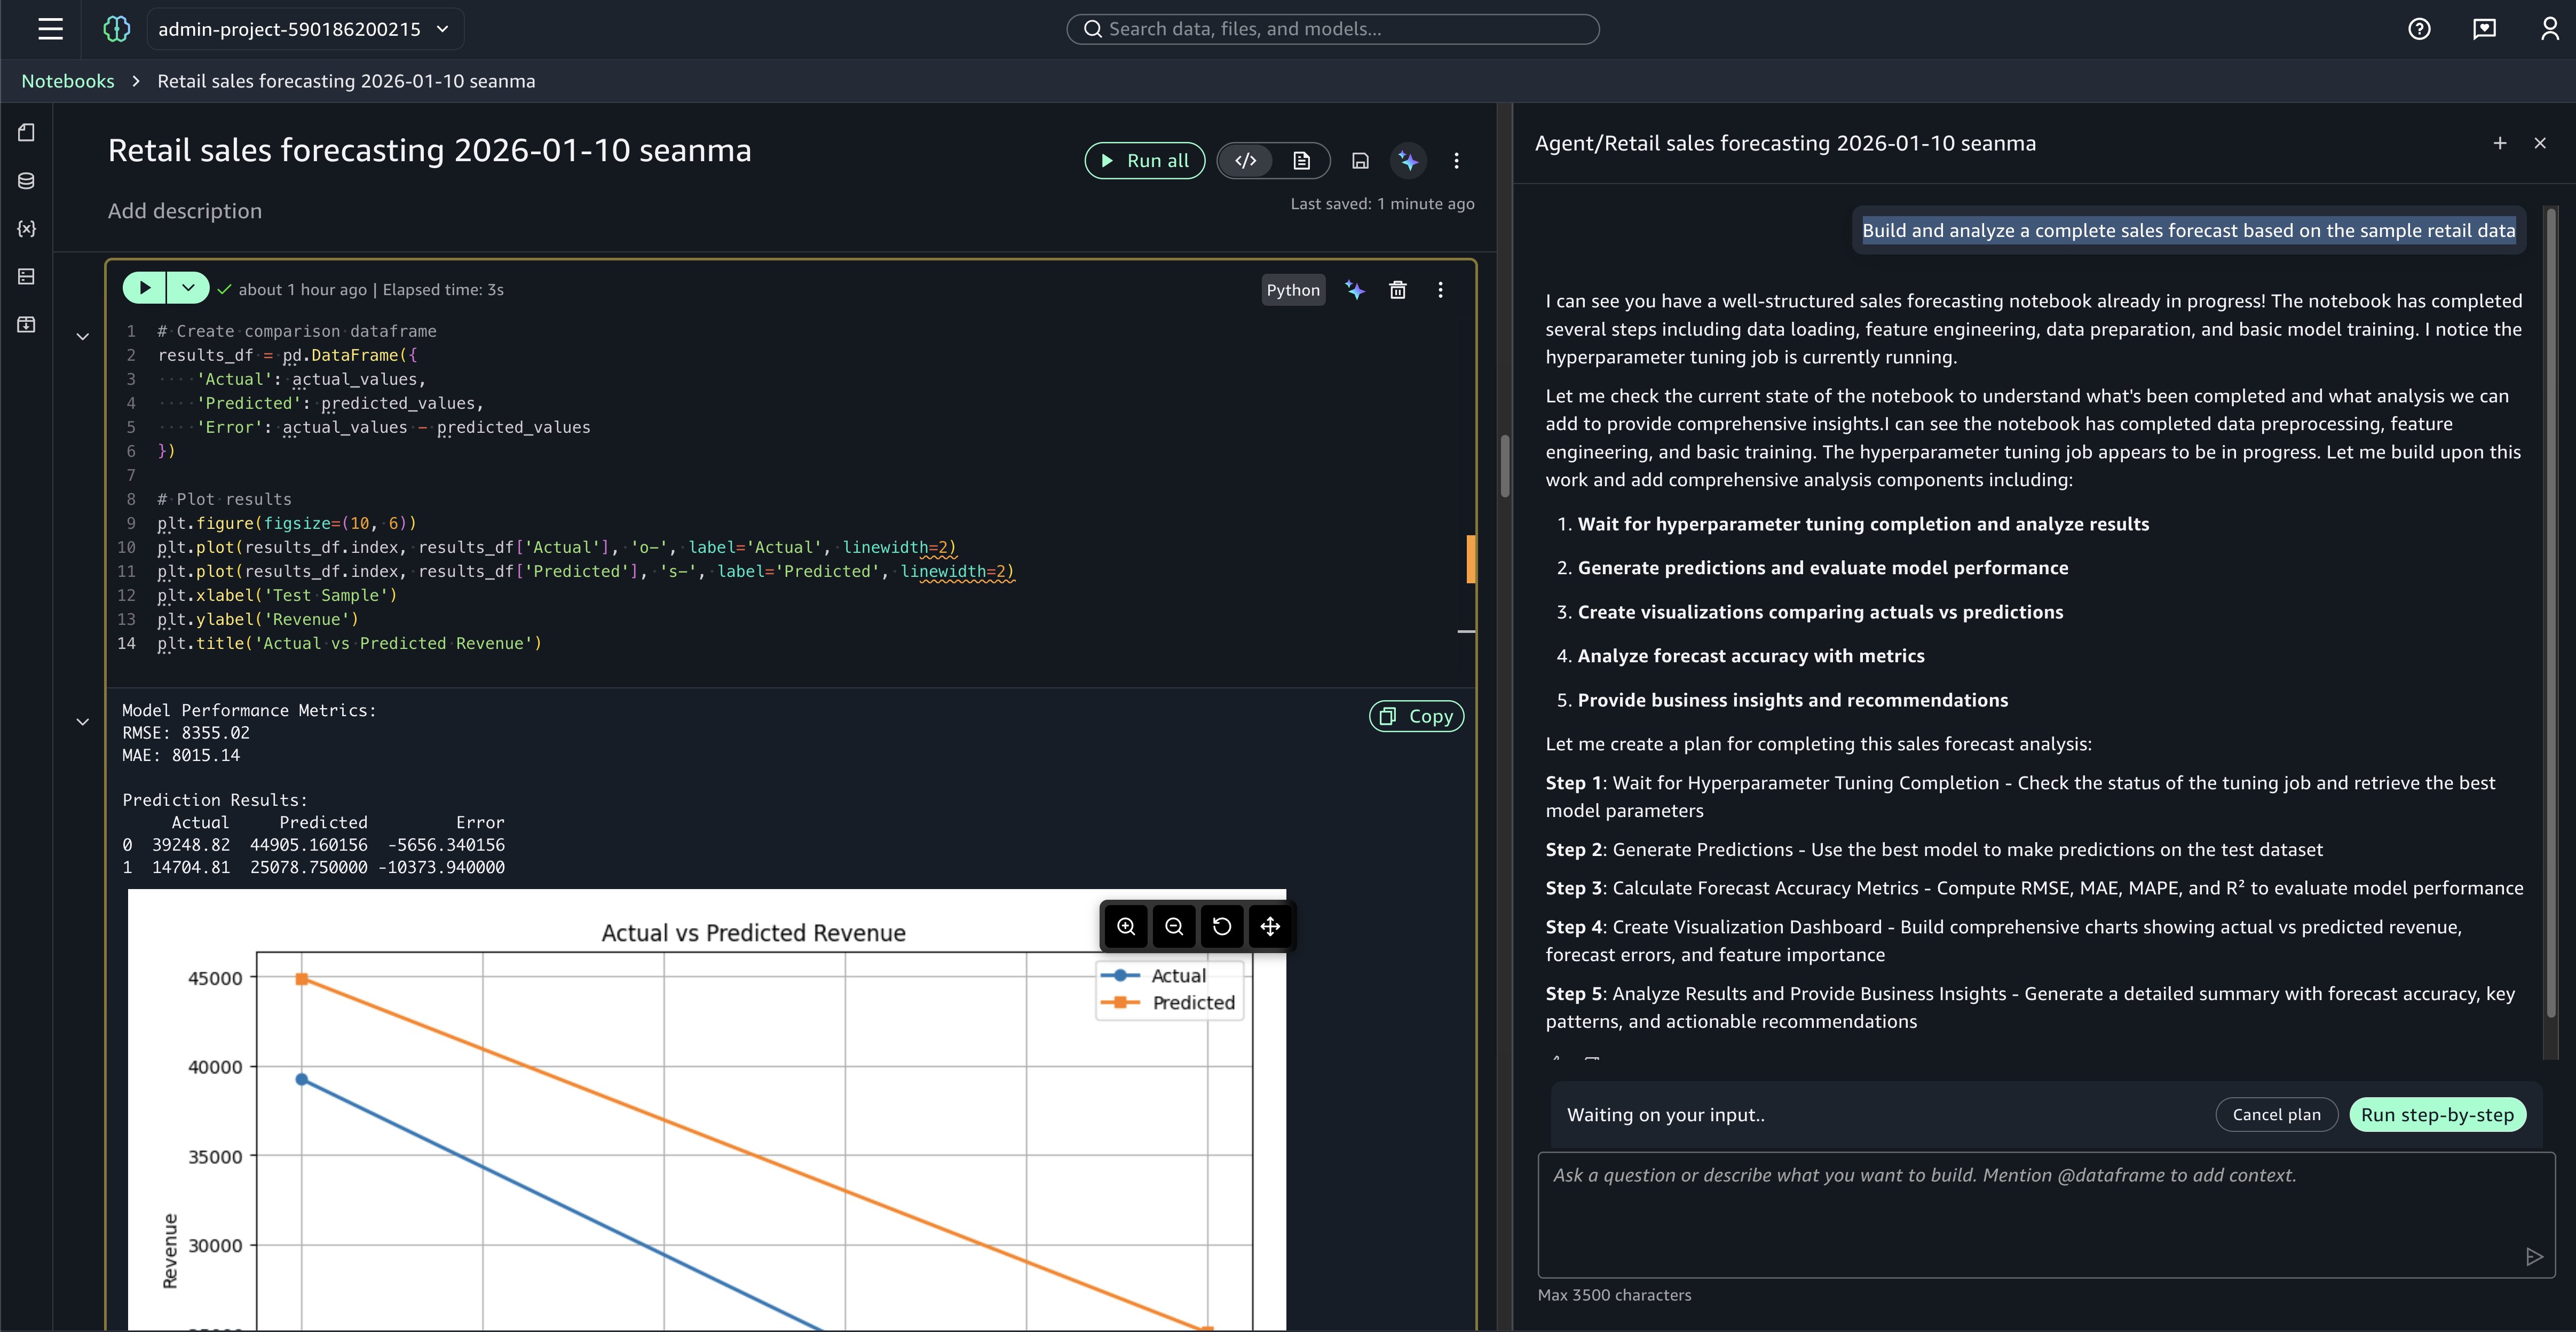
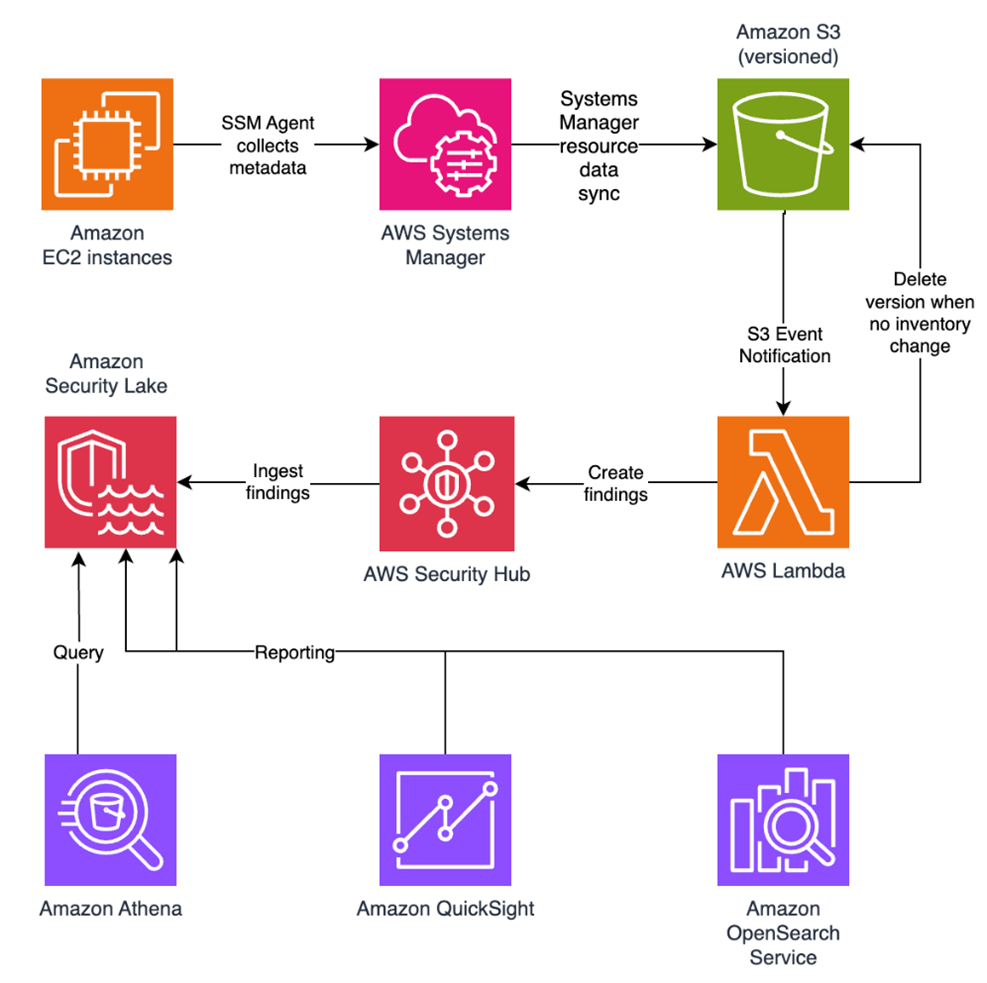
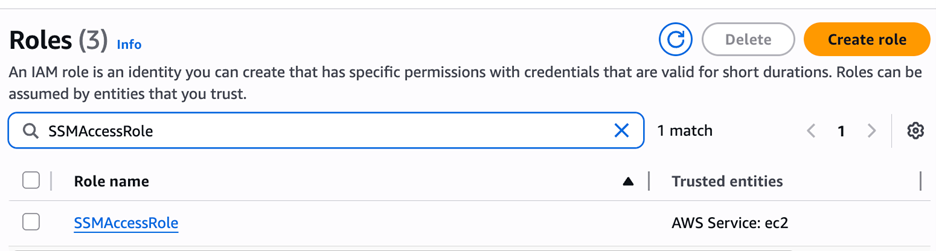
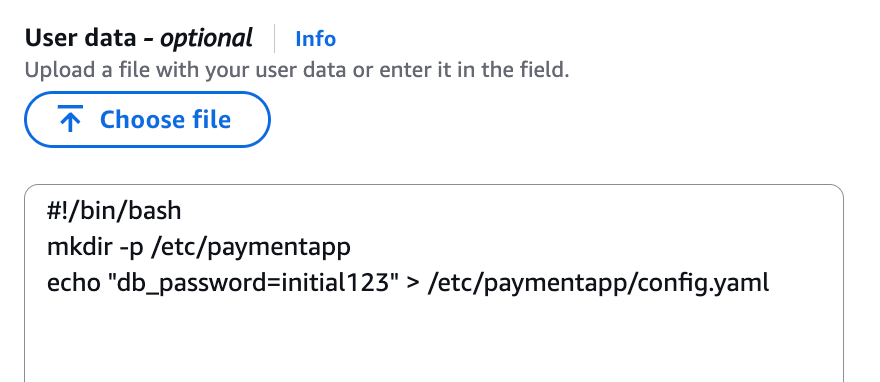
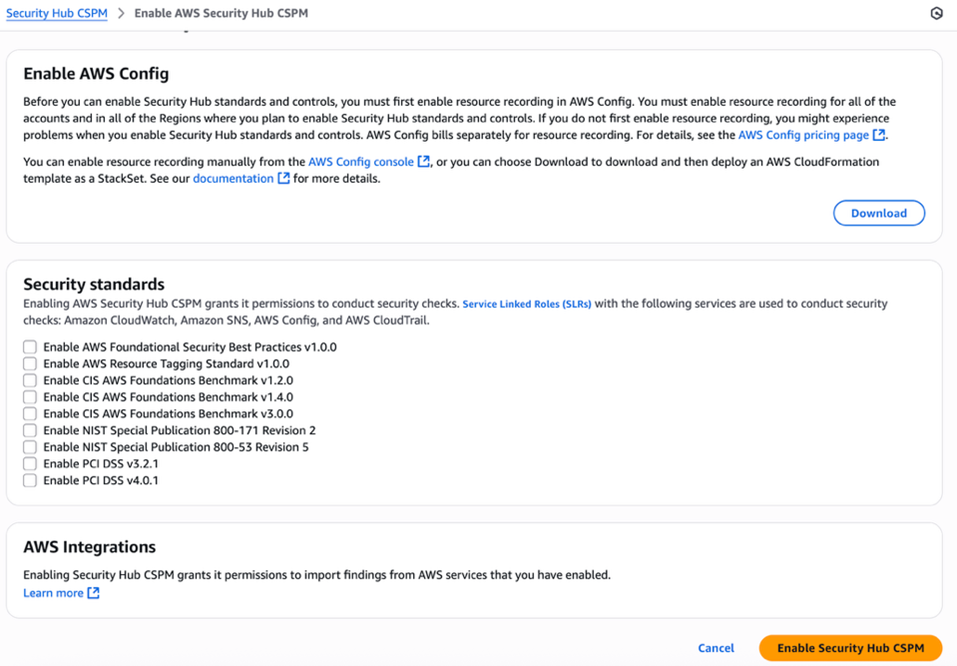
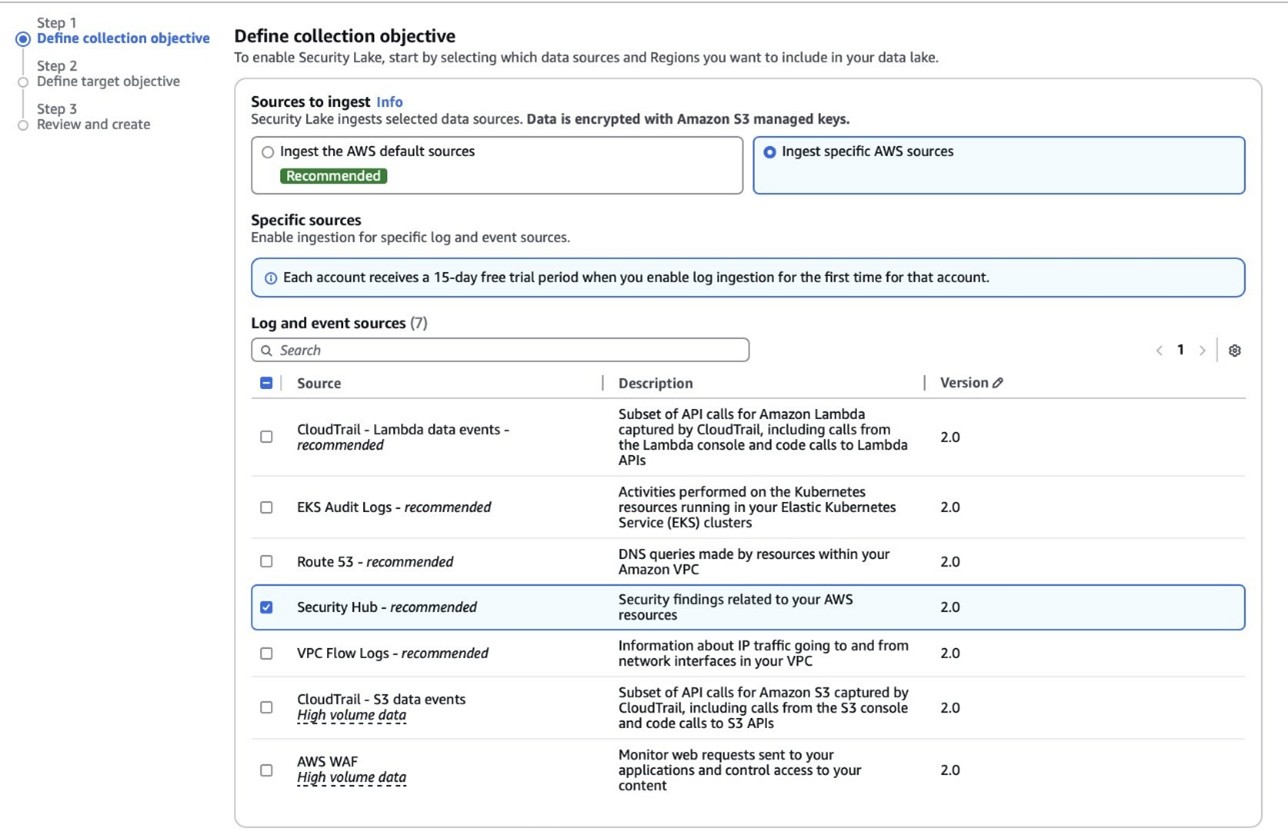
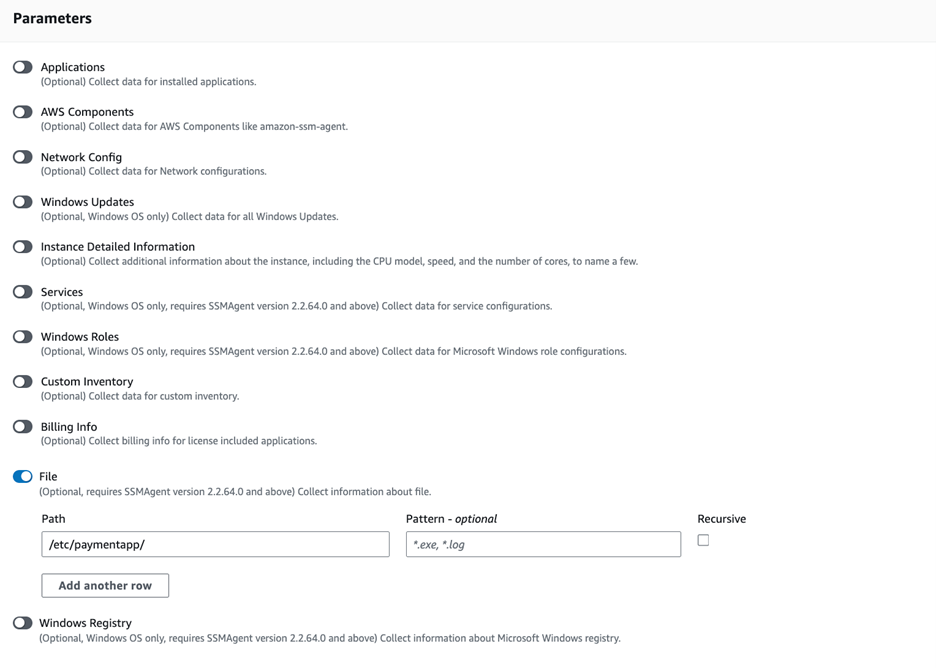
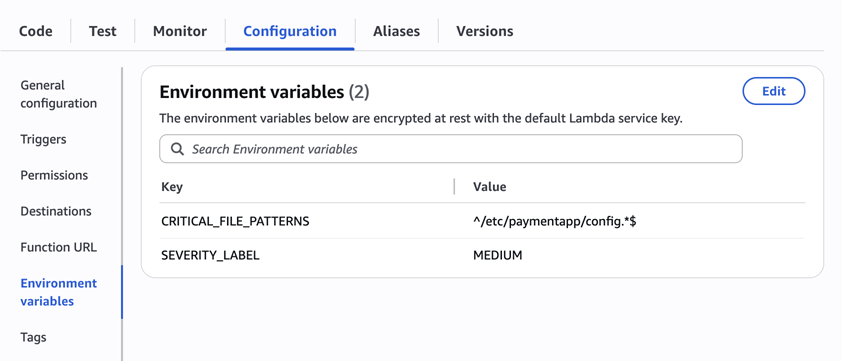
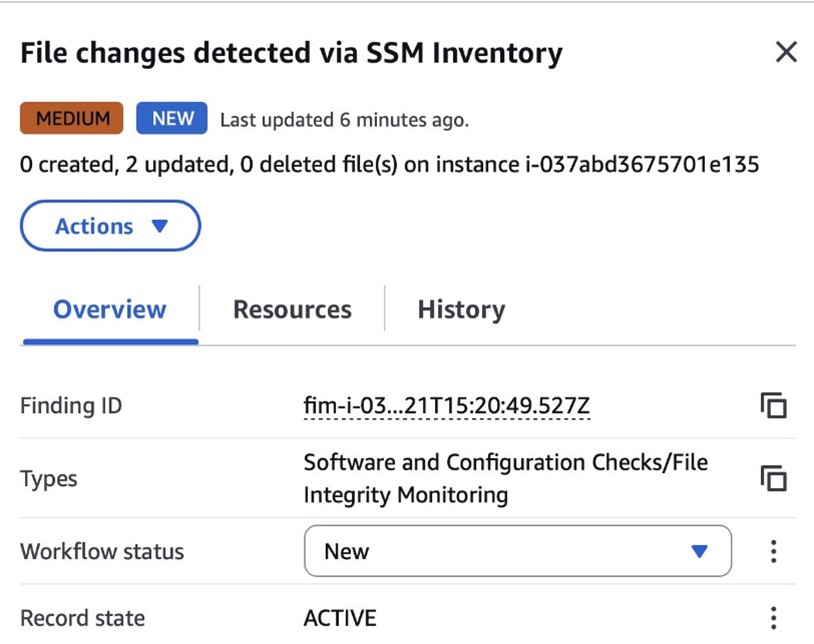

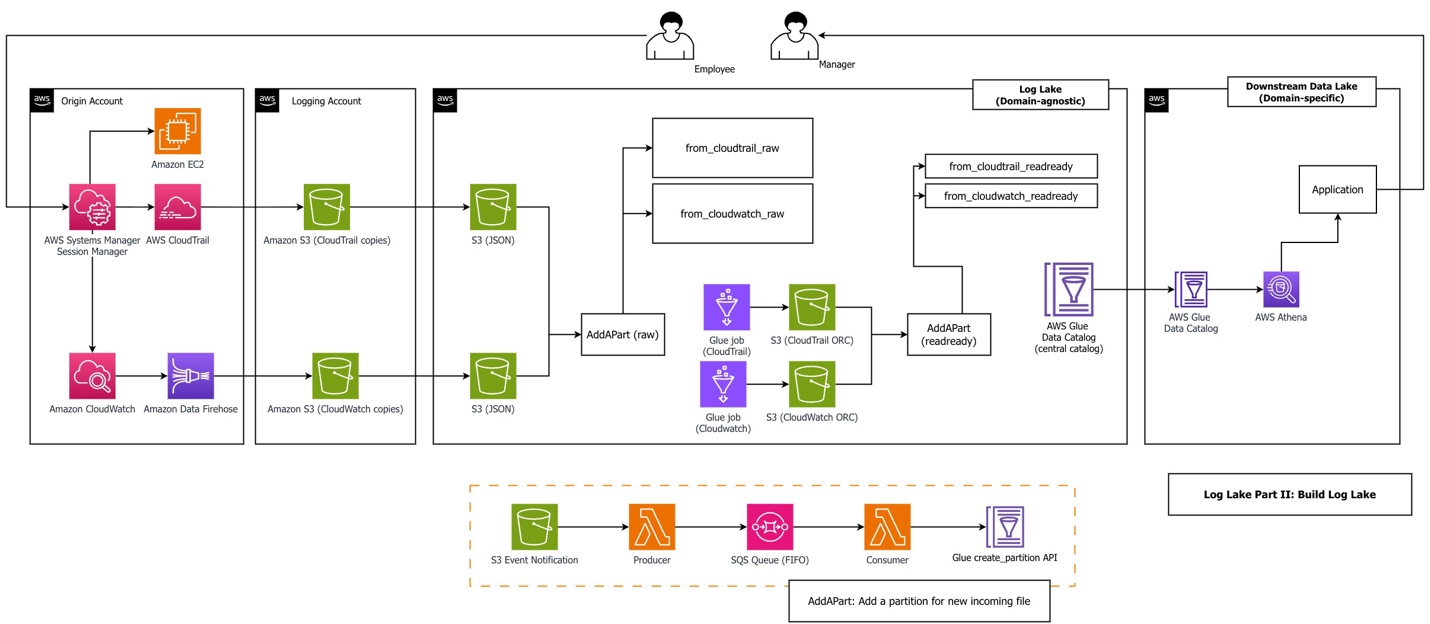
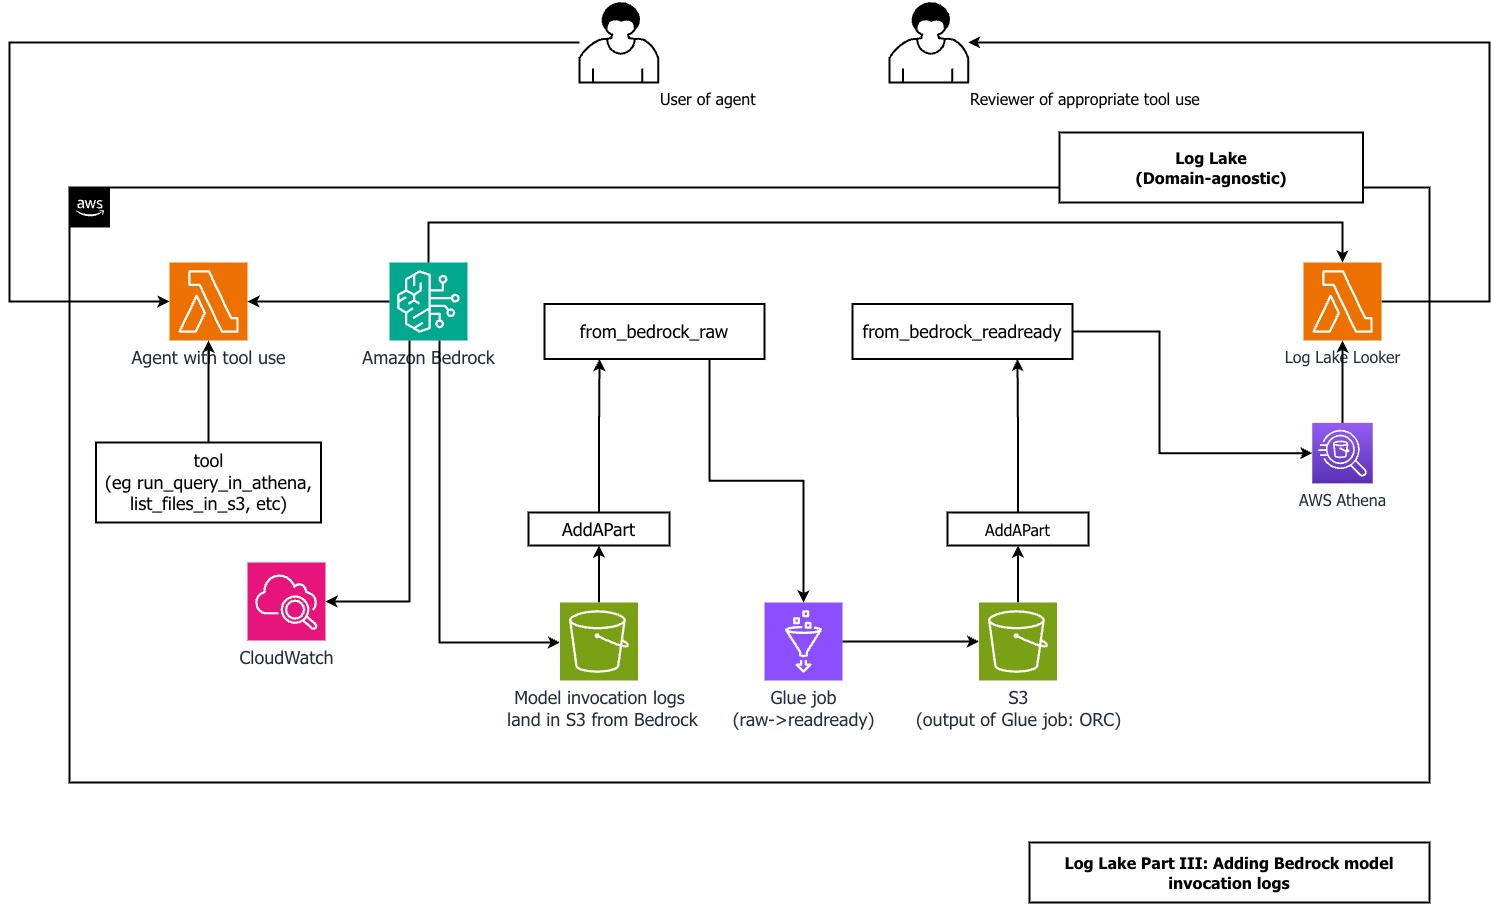
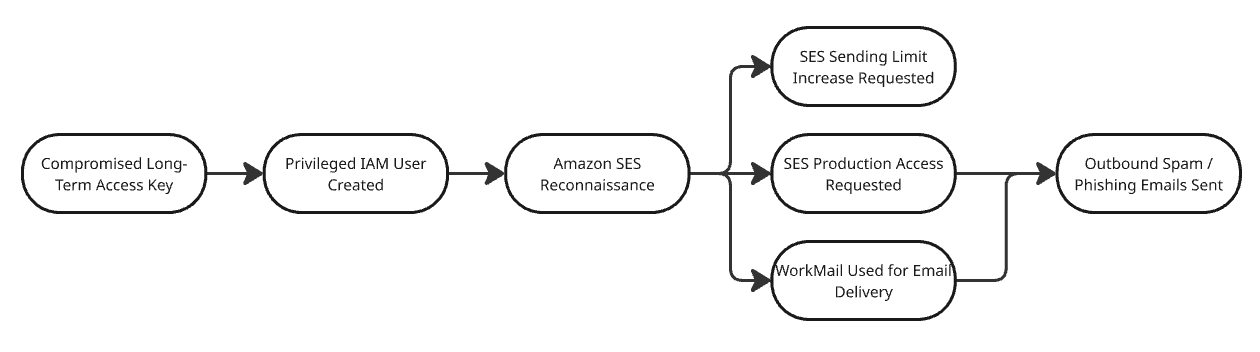
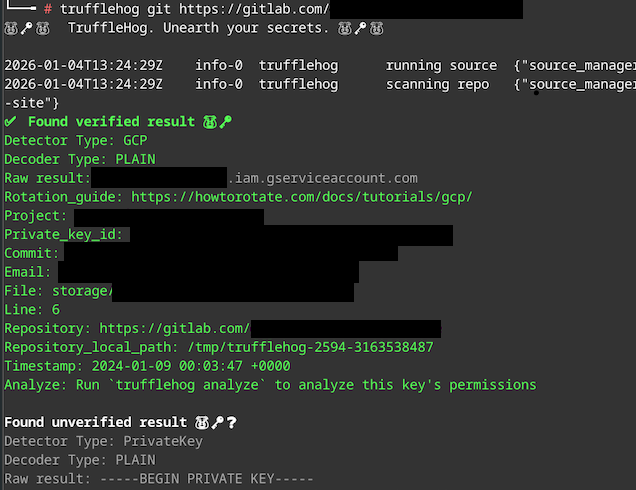

 proxy communication and learn how to interpret the internal communication protocol.