Тротоари (на цени) като в Германия

Post Syndicated from Боян Юруков original https://yurukov.net/blog/2026/trotoari/
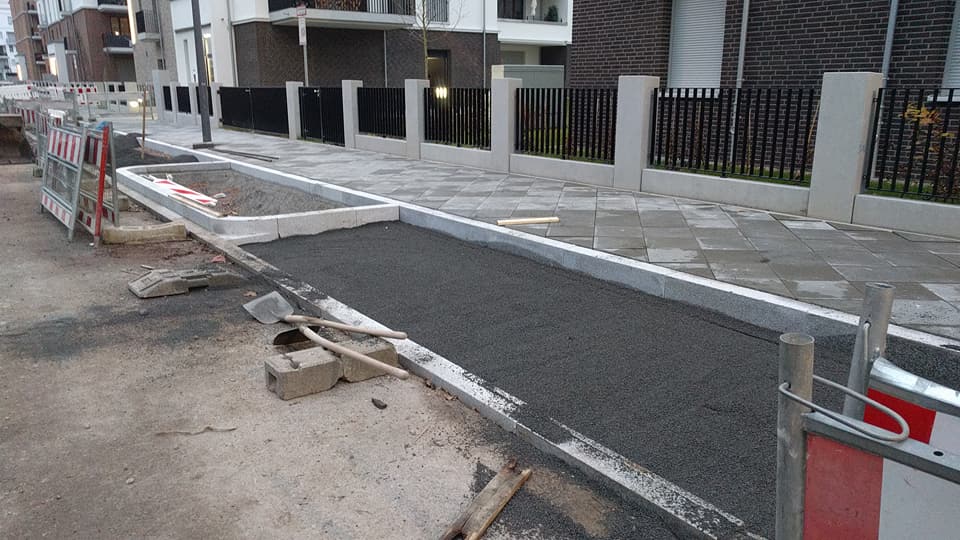

Попаднах на мой стар пост от преди 8 години показващ как правят тротоар в тогавашния ми квартал във Франкфурт, Германия. Тогава го сравних с оплакванията на ремонтите на Дондуков и Цариградско. В продължение на темата от вчера реших да проверя, колко всъщност е струвал да се направи така. Намерих аналогичен тротоар в съседно село, който миналата година е бил направен за около 120 евро на кв.м. Това включва основа, бордьори, подобни очертания на зелени площи без осветление.

За сравнение, цената на тротоарите, които виждаме да се правят в София, при последните поръчки излиза около 100 евро на кв. м. Имайки предвид, че разходите за труд са по-ниски, цените са почти идентични Разликите в качеството на изпълнение, плочите и елементите се виждат с просто око. Бях във Франкфурт пет години след като завършиха този тротоар и не беше мръднал. Някои от тези в София вече ги виждам как пропадат.

По социалки и групи се възмущаваме на общината и липсата на контрол когато нещо е нескопосано. „Ремонт на ремонта“ стана нарицателно по време на Фандъкова за лошо свършена работа и криво-ляво закърпена след това. Доколкото си мислим, че това става само когато държавата и общината плаща, показах как частни компании правят път и се налага поне четири пъти да го поправят защото пропада. В случая това беше по поръчка и под зоркото око на Артекс, но важи с пълна сила при изпълнение на всякакви сгради и инфраструктура. При тротоарите обаче, особено ремонтите, наистина голяма отговорност носи общината в целия процес.

Има обаче поне седем фактора, които влияят дори повече на тези ремонти. Някои от тях оскъпяват работата значително, други блокират налагането на контрол, а трети в най-добрия случай удължават времето за изпълнение.

Подземна инфраструктура

В София и практически всеки български град който не е коп’нал, той не е направил шахта или прекарал нещо под земята. Понякога кабели, тръби и оптика са на сантиметри под краката на хората. Понякога са дори опасни. Спомняте си смъртта на детето, което го хвана ток. Столичния общински съвет обеща да се захване с решаване на проблема и създаване на структура, която да отговаря. Това не се случи.

Преди две години пуснах карта на шахтите на София. Това са поне тези, за които общината знае и са в ГИС системата на НАГ. Има още много кабели и трасета между тях и още доста, за които не се знае. Всички следва да са достатъчно дълбоко, за да не пречат на тротоари и улици. Проблемът е, че понякога са буквално сантиметри под плочки, корени и бордюри. Това се установява едва когато започне ремонта, т.е. когато работата е планирана, бюджетирана и поръчката е спечелена.

Дори когато са незаконни не могат просто да се отрежат. Когато са законни обаче, но не на правилната дълбочина, проблемът възниква когато някой чиновник някога е подписал, че приема обекта както си е. Дали е било въпрос на корупция или нехайство, факт е, че сега разходът за преместването им на правилна дълбочина е на общината години по-късно. Това оскъпява значително нещата.

Лошо или липса на планиране на улици и тротоари

ПУП-овете на парче, позволяването улиците да са с намалена широчина оставяйки никакво място за тротоарите, приватизирането на места за паркиране или повече ленти на булевардите за сметка на тротоари и велоалеи, странните архитектурни чупки по сградите усложнявайки достъпа до гаражи, входове и съседни сгради, липсата на отчуждаване на достатъчно от частните имоти преди урегулирането им години назад във времето за нормална инфраструктура и редица други проблеми около хаоса в презастрояването в София и редица други градове води до там, че тротоарите не са просто 2.5 метра широки алеи подходящи за хора с проблеми с придвижването, незрящи или родители с колички, а криволичеща какафония от неравности и абсурди.

Дори при липса на подземни „мини“, най-съвестно изпълнение на строителя и контрол от общината, каквото и да бъде направено на определени места ще е абсурдно. В Изгрев видях тротоар широк една педя с бордюр още 10 см. Опитах и сам не мога да стъпя на него. Но имаше знак „мини на отсрещния тротоар“, т.е. на тия 30 см., защото се строеше поредният голям комплекс наблизо.

Дори когато се ремонтират улиците, се прави единствено смяна на горния слой на асфалта. Не се преосмисля концепцията на улицата, новата натовареност, дали следва да има издадени части на тротоара за по-лесно преминаване на учениците по пътеките, дали трябва да се обособят паркоместа и стесни на места платното, за да се намали скоростта и шума. Именно това очаквах при поръчката за ремонт на улицата в най-лошо състояние в район Изгрев – Тинтява. Районният кмет се хвалеше години наред, че работи над промяната ѝ, че мисли и готови всичко и подава предложения как да е в общината. Накрая като излезе поръчката се оказа, че нищо не е подал като предложения, а се използва остарели и вече неверни скици и планове от преди 10 години. Това е пример как не се прави и накрая плащаме много по-вече от данъците си за нещо по-лошо.

Строителен надзор

При такива проекти се взима строителен надзор, който би следвало да е независим. Проблемът е, че често става въпрос за свързани фирми. Независимият надзор трябва да следи за изпълнението на параметрите и изискванията за качество. Както добре виждаме обаче, това почти никога не се случва. Общините често нямат експертен капацитет да преценят дали нещо следва да е така или не и чисто естетическата им оценка и това, че някои неща са очевидни не издържат в съда. Становището на „независимия“ надзор натежава.

Непостоянни съдебни практики с дъх на корупция

Всяка обществена поръчка, всяко искане за поправка, всяка наложена глоба за несвършена работа или лошо изпълнение, всичко може и често се обжалва пред административните съдилища. Те имат крайно противоречива практика. Отчасти това е заради неспазен процес от страна на общината въпреки наличието на нарушения. По-често е защото става дума за сериозни пари и съдиите или не им пука, защото „ма то така си беше“, или са заставени да не им пука. Аналогични проблеми има при отказите за разрешения за строеж или ПУП-ове.

В тази среда административните съдилища в България носят със себе си един от най-негативните ефекти на градската среда. Несигурността, че законът и публичният интерес ще бъдат запазени води до там, че общините масово не се възползват от възможността да рестарвират или поне укрепят разпадащи се паметници на културата и да заставят собствениците да платят, ако ще със самия имот. Страх ги е, че никога няма да си върнат парите, защото е по-евтино да подариш апартамент във Витоша на сина на съдийка в Административния съд, отколкото да върнеш парите, които сме дали от данъците си.

При поръчките за тротоарите ситуацията е подобна. Затова винаги се гледа да се разберат с добро, ако ще да е на база компромиси и ниско качество на резултатът. Най-лошото е, че следващия път най-вероятно същите хора ще спечелят поръчката отново и ще трябва да се работи с тях отново

Липса на конкуренция и некачествена работа

Доколкото има страшно много строителни фирми в България покрай манията за крипто-бетона, всъщност много малко фирми кандидатстват за подобни поръчки. Отчасти това е заради изискванията за опит и мащаб, отчасти защото много от фирмите работят на черно и не могат да докажат доходи от подобна работа, отчасти, защото хора като Вълка и Таки извиват оркестрират кой да кандидатства къде. Така разпределят територия и сфери и дори общините да не са „в кюпа“ и да се стараят да получат качество на разумна цена, често са изправени пред свършен факт. Пример за това беше боклука в София, където изведнъж всички камиони за смет в страната потънаха в дън земя, когато община София искаше да наеме такива.

Липсва конкуренция заради такива мафиотски тактики и малкия брой фирми по принцип. Отделно качеството на работата е изключително лошо. Въпреки възторгът на инфлуенсъри и брокери, ако се наблюдавате строежите преди да сложат фасадата виждате с просто око невъзможни неща. Залепят ли фасадата и покрият бетона на гаражите с боядисан в зелено тънък слой трева вече изглежда готино като за снимки.


При тротоарите това го забелязваме по-бързо, защото е пред нас. При първият лек дъжд се виждат и проблемите в основата като се разкривят и започнат да плюят плочките. Бордюрите започват да се чупят от качващи се коли. Плочите и бордюрите не са изрязани правилно, а се пълнят с малко бетон ронещ се на втората седмица. Липсват хора, но дори тези служители не са обучени, нямат достъп до правилната техника и не им се плаща достатъчно. Твърде малък пазар сме, че фирми да дойдат за няколко тротоара от други държави, а и мафиотските схеми по-горе ги гонят. Материалите не са достатъчно добри, дори да има сложени изисквания.

Специфични изисквания, схеми и планове

За да може да се аргументира използването на 5 см. тежки плочи вместо 1.5 см. или специални бордюри с изрязани плочи около тях или многослойна основа от точно определен чакъл, а не каквито строителни отпадъци фирмата не е успяла да изхвърли вероятно нелегално някъде, трябва да е разписано ясно и недвусмислено в стандарт и схеми за тротоарите. Предложения за такива е имало доста през времето, но или не са били технически издържани отвъд шарените картини, или просто не са били придвижвани в Столичния общински съвет.

Именно тяхна е отговорността за приемане на такива изисквания, схеми и планове. Аналогично могат да изискат разработването и да приемат разписана единна визия на фасадите в централната част или да засилят вместо да зачеркват, както явно се готви икономическото мнозинство, изискванията за озеленяване на нови сгради. За да може да се изисква качество като описаното горе, трябва да се стъпи на такава схема. Именно това имат във Франкфурт в различни варианти и всеки район си избира специфика и дори цветове.

Паркиране върху тротоарите

Никой тротоар не се прави с идеята да може да се паркира върху него. Това би оскъпило значително процеса, особено предвид увеличения брой тежки джипове из града. У нас всеки паркира където си иска и се кара като му направят забележка „ма къде да паркирам другаде“. Новите тротоари в София масово се използват за паркоместа. Това се вижда дори и особено когато тротоарите са пред училища и детски градини точно когато десетки деца трябва да минат точно от там. Доколкото изпълнението е лошо като цяло, именно паркирането е основна причина за скапването им.

В Германия за паркиране като този горе се плаща 100 евро глоба на момента. Няма нужда от катаджия на място – просто снимка от някой, където се вижда номера и мястото. Дори да стъпиш с гума на бордюра, което неизменно го чупи с времето, значи глоба. У нас имаме изключително странна нарочно бюрократизирана система с предразполагаща към корупция и отказ от отговорност, в която практически не се глобяват повечето нарушения, а събираемостта е плачевна. Столична община няма право да налага глоби, за това, че им чупи някой тротоарите. Само ако са паркирали в зона. СДВР не приема да използва камерите на общината, не следи за минаване на червено или престрояване на кръстовище и масово не налага глоби. Никога не са взимали подписаните с електронен подпис сигнали от Гражданите или собственият им мейл за сигнали, например, за разлика от останалата част от страната.

И не, колчетата не решават нищо. Тротоарите и без това са крайно тесни с всички лампи, стълбове, дървета, кофи за боклук, стълби на нечий магазин или щъркели на някой бар или направо маси на заведение наблъскани така че и сам човек да не може да мине, а какво остава за детска или инвалидна количка. Тук се налагат законодателни промени даващи повече лостове на общината и възможности за гражданско участие, както и автоматизация на процеса както на установяване, така и на връчване и налагане на глобите.

Какви други причини смятате, че са замесени тук? Ще ми е интересно да го обсъдим в коментарите.

[$] Questions for the Technical Advisory Board

Post Syndicated from daroc original https://lwn.net/Articles/1051768/

The nature and role of the Linux Foundation’s Technical Advisory Board (TAB) is
not well-understood, though
a recent LWN article shed some light on its
role and
history. At the 2025

Linux Plumbers Conference
(LPC), the TAB held a question and
answer session to address whatever it was the community wanted to know
(video).
Those questions ended up covering the role of large language models in kernel
development, what it is like to be on the TAB, how the TAB can help grease the
wheels of corporate bureaucracy, and more.

[$] The difficulty of safe path traversal

Post Syndicated from daroc original https://lwn.net/Articles/1050887/

Aleksa Sarai, as the maintainer of the
runc container runtime, faces a
constant battle against security problems. Recently, runc has seen

another
instance
of a security vulnerability that can be traced back to the difficulty
of handling file paths on Linux. Sarai spoke at the 2025
Linux Plumbers Conference
(slides;
video)
about
some of the problems runc has had with path-traversal vulnerabilities, and to
ask people to please use

libpathrs
, the library that he has been developing for
safe path traversal.

A Cyberattack Was Part of the US Assault on Venezuela

Post Syndicated from Bruce Schneier original https://www.schneier.com/blog/archives/2026/01/a-cyberattack-was-part-of-the-us-assault-on-venezuela.html

We don’t have many details:

President Donald Trump suggested Saturday that the U.S. used cyberattacks or other technical capabilities to cut power off in Caracas during strikes on the Venezuelan capital that led to the capture of Venezuelan President Nicolás Maduro.

If true, it would mark one of the most public uses of U.S. cyber power against another nation in recent memory. These operations are typically highly classified, and the U.S. is considered one of the most advanced nations in cyberspace operations globally.

Security updates for Tuesday

Post Syndicated from jzb original https://lwn.net/Articles/1052955/

Security updates have been issued by AlmaLinux (kernel, ruby, and thunderbird), Debian (libsodium and ruby-rmagick), Fedora (gnupg2 and proxychains-ng), Oracle (gcc-toolset-14-binutils, rsync, tar, and thunderbird), Red Hat (buildah, mariadb, mariadb10.11, podman, and tar), SUSE (alloy, apache2, buildah, erlang26, glib2, ImageMagick, kernel, libsoup, pgadmin4, python-tornado6, python3, python312, python313, qemu, webkit2gtk3, and xen), and Ubuntu (webkit2gtk).

A research-led framework for teaching about models in AI and data science

Post Syndicated from Manni Cheung original https://www.raspberrypi.org/blog/a-research-led-framework-for-teaching-about-models-in-ai-and-data-science/

Research indicates that teaching learners to use and create with data-driven technologies such as AI and machine learning (ML) requires an entirely different approach for solving problems compared to traditional programming activities.

Learner in a computing classroom.

In this blog, we share the new data paradigms framework that we have developed through research and used to help improve our understanding about how to teach and learn about AI and data science. We also invite you to register your interest in participating in our next collaborative study on the topic.

Knowledge-based approaches to systems design

Let’s start by highlighting an important distinction between different approaches to designing systems. In a knowledge-based approach to system design, a set of rules (e.g., if-then statements) are written for the system to execute. Every rule is explicitly defined. This approach is called ‘rule-based’, ‘symbolic’, or ‘logic-based’. For example, a developer could create a program that simulates dialogue by writing specific lines of code to handle a greeting, such as “IF user says “Hello” THEN output “Hi!”. If the user types “Greetings!” instead, the program fails because it has no rule for that specific word. 

An educator helps students with a coding task.

Knowledge-based models are often said to be explainable by design. This means the logic is accessible and interpretable and developers can trace the exact steps taken to produce an output. For example, if developers manually classify restaurant reviews as positive or negative using a pre-defined set of criteria, the rules their restaurant classifying system follows are entirely explicit, and the path from input to output is clear and explainable.

Data-driven approaches to systems design

By contrast, in a data-driven approach to system design developers do not write specific rules. Instead, they collect lots of data and train a model. In the dialogue simulator example, they would collect hundreds of examples of greetings and train a model to the pattern of a greeting. If the user types “Greetings!”, the system generates a response based on the patterns in its training data.

Photo focused on a young person working on a computer in a classroom.

Data-driven models are often opaque. In other words, the internal workings of these ML models are hidden. While we can see our input and the system’s output, the internal mathematical process is so complex — often involving layers of calculations and abstractions — that we cannot simply “explain” why a specific output was produced. For example, developers can create a classification model by training a neural network using thousands of images. Due to the large quantity of data used to train the model, and complex internal parameters and hidden layers, developers and users of the system cannot understand or explain the logic or features that lead to a specific output. These kinds of models are often referred to as a “black box” (as opposed to a “glass” or “clear” box).

Comparing knowledge-based and data-driven approaches

Researchers have argued that the move from knowledge-based (or rule-based) programming to data-driven system design represents a paradigm shift and creates unique challenges for educators. The challenge is helping students shift from the expectation that a system produces a single ‘right’ answer — characteristic of traditional rule-based programming — toward an understanding that systems trained on large quantities of data produce outcomes that aren’t always fixed or explainable. If the current instruction in the classroom still relies heavily on traditional rule-based programming approaches, we might be setting students up for misconceptions.

Data paradigms: A framework for analysing data science education approaches

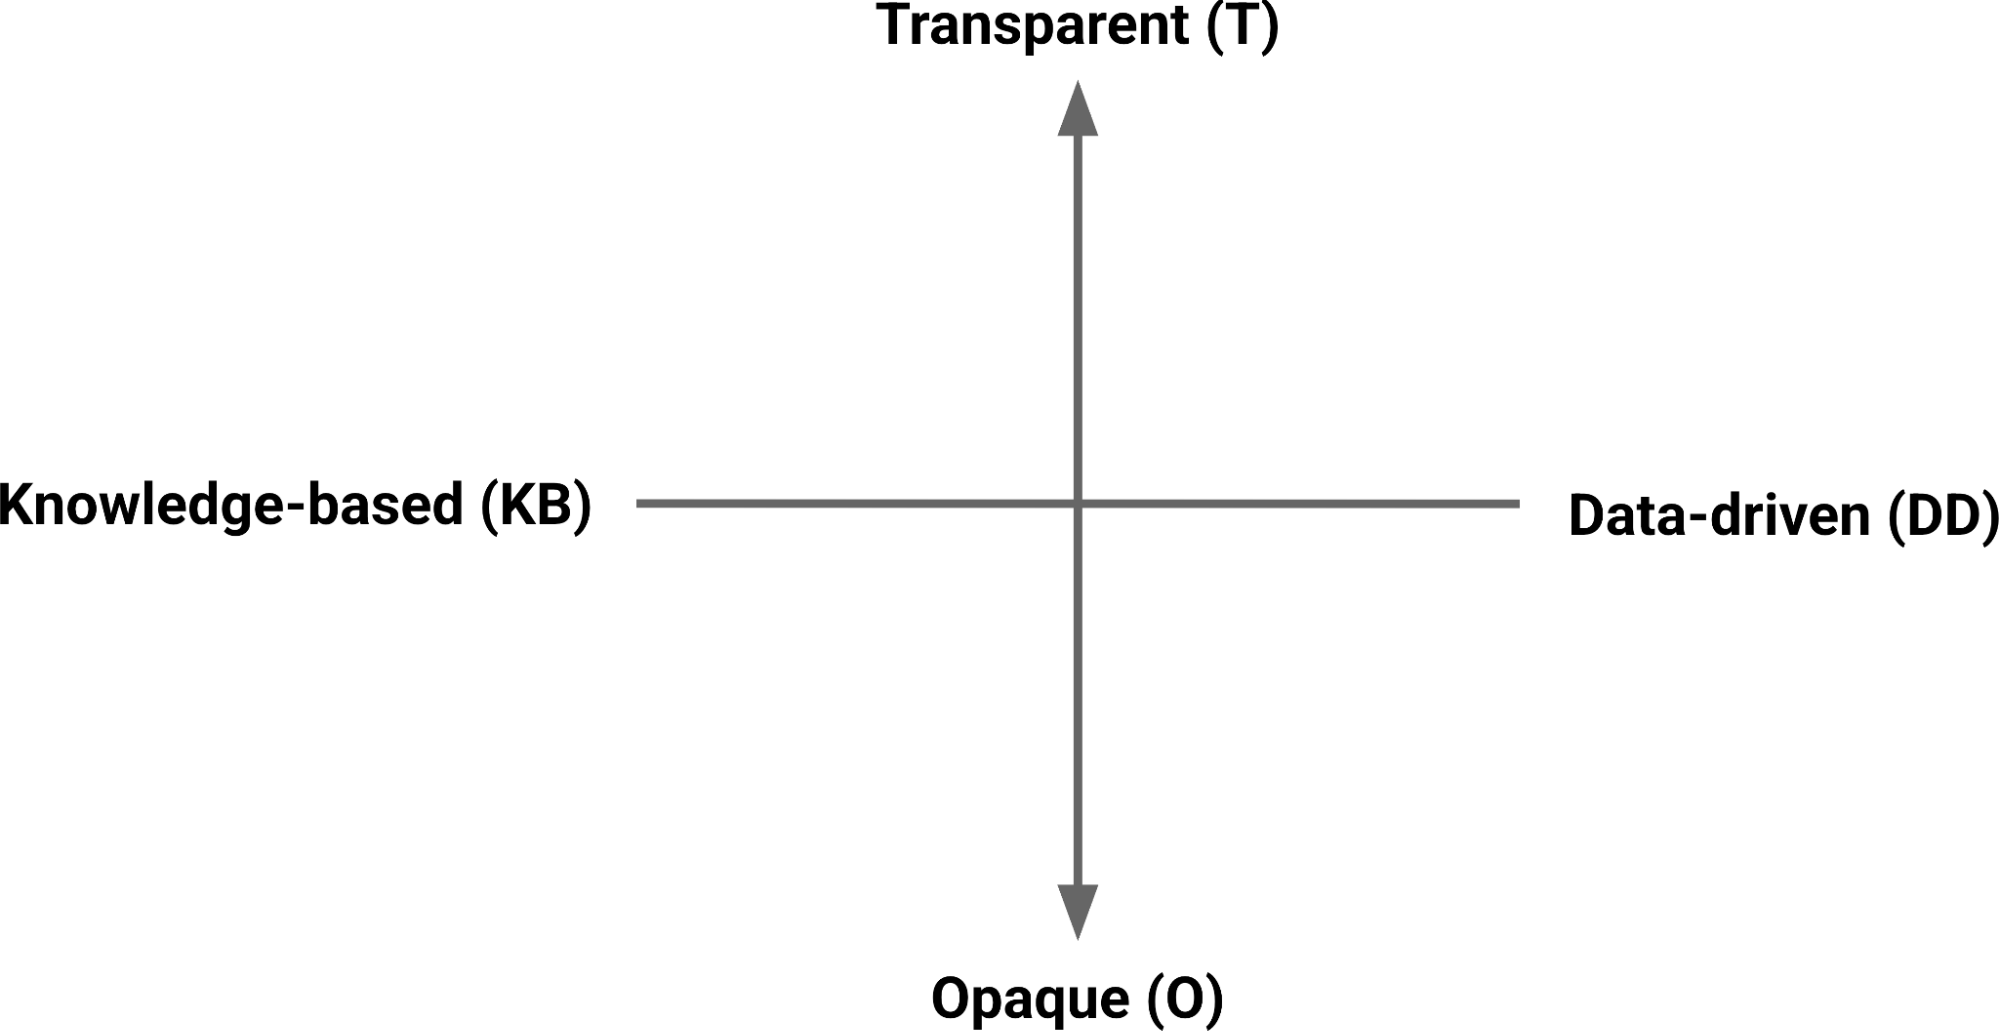
In our research work on AI and data science at the Raspberry Pi Computing Education Research Centre, we analysed 84 research studies about the teaching and learning of data science. We categorised learning activities used in the studies to understand whether they were (i) knowledge-based or data-driven, and (ii) the extent to which the underlying models used were transparent or opaque. This led us to define four distinct data paradigms:

The data paradigms framework
  1. Knowledge-based and transparent (KB + T): Activities in this paradigm are ones where students write rules for systems, or work with systems that use rules, where the logic is fully explainable by design. For example, if students manually classify data (e.g. creating simple ‘if-then’ statements to predict an outcome), the path from input to output is clear.
  2. Data-driven + Transparent (DD + T): In this paradigm, activities involve students working with models trained on data, but the trained model’s logic remains explainable and interpretable. For example these could be models using k-nearest neighbors (KNN) algorithm to group data points based on proximity, or using linear regression to predict a trend. Even though the model produces an output, the student can look at the inner workings of the model and see how the decision is made.
  3. Data-driven + Opaque (DD + O): This paradigm’s activities require students to work with data-driven ML models where the models’ internal logic is hidden, for example an image classification model using a type of neural network (e.g. CNN). The model produces an output (e.g. classifying an image as ‘This is a dog’), but the student cannot inspect the system to find a rule or clear path explaining why that specific output was produced. To understand these systems, it’s necessary to use additional testing and evaluation tools.
  4. Knowledge-based + Opaque (KB + O): Activities in this paradigm would involve systems with human-written rules that are not explainable. In our review of K–12 activities, we found no examples of activities within this paradigm.

The data paradigms framework helps us to distinguish between different kinds of modeling activities students take part in and how instructional approaches could be classified across one or more paradigms. For instance, we found that most data-driven activities were also opaque (DD + O), usually meaning that students collected and used data to train a model, but how the system worked was opaque. This pattern, where the data is visible but the model is not explainable, risks students forming misconceptions about the capabilities and limitations of data-driven systems. Without understanding how outputs are generated, students may expect data-driven ML systems to operate like fully explainable (or transparent) ones.

Learners at a Code Club.

We think that lessons are needed in the data-driven opaque (DD + O) quadrant to explicitly teach students about how data-driven systems work and the role they play in everyday contexts. However, when teaching data-driven opaque (DD + O) activities, learners’ attention needs to be directed to concepts such as model confidence, data quality, and model evaluation. Since an ML model is not inherently explainable, we need to teach students to use post-hoc explanation methods, such as testing different inputs to see how a system’s output changes. To prepare students for this learning experience, we think that first introducing activities about rule-based systems (knowledge-based + transparent; KB + T) or simple data exploration, such as linear regression or data visualisation (data-driven + transparent; DD + T) may serve as a ‘bridge’ to understanding data-driven modeling by helping students to distinguish between systems built from specific logical rules and systems trained on data.

We believe the idea of data paradigms can serve as a way of framing teaching activities about data science and help educators and students to consider the transition between different paradigms when engaging with the systems we interact with every day.

Teachers in England, participate in our new study

We’re launching a new study to explore how to teach learners aged 9 to 11 about data-driven computing. The study will take place in collaboration with upper key stage 2 teachers in England and look at:

  • What key ideas pupils need to understand
  • How teachers currently approach topics related to data-driven computing
  • How pupils make sense of data and probability

Our goal is to find practical ways to help teachers build children’s confidence in working with data in computing lessons. The study will be collaborative, with two workshops held throughout 2026, and we’re inviting upper KS2 teachers in England to take part.

You can express your interest in participating by filling in this form:

The post A research-led framework for teaching about models in AI and data science appeared first on Raspberry Pi Foundation.

Европис за отличници

Post Syndicated from original https://www.toest.bg/evropis-za-otlichnitsi/

Европис за отличници

Нова година – нова валута, казва народът. Поговорката, както знаем, е за деня и късмета, но защо да не погледнем малко по-ведро на промяната и ей така, за разнообразие да загърбим страховете, песимизма, инерцията, отгръщайки ненаписаната още страница на 2026 година.

Еврото вече е в портфейлите ни, в банковите сметки, монетите подрънкват в джоба ни – и да, все по-често ще присъства и в официалната, и в разговорната реч. Затова да видим на какви затруднения може да се натъкнем при употребата на тази, а и на други думи от финансовата сфера.

Има ли евро форма за множествено число?

Дори и от филолози ще чуете, че няма такава форма. Това според мен е некоректен отговор и бих призовала колегите поне малко да се замислят, преди да кажат категорично „не“. Всеки, който владее добре български, веднага може да образува тази форма – евра. Тя обаче не е приета в книжовната реч и

когато говорим или пишем публично, трябва да употребяваме формата за ед.ч. във всички случаи: едно евро, шест евро, няколко евро, много евро.

Добре е да обясним и защо мнозина са склонни да грешат в тези случаи. Причината е в системността на езика. Повечето съществителни нарицателни имена имат количествено измерение и съответно форми за единствено и множествено число¹. Това се отнася и за названията на повечето валути: лев – левове; долар – долари; паунд – паунди; крона – крони. Ето защо е логично да имаме и евро – евра².

В книжовната реч обаче сме ограничени и според мен е възможно за това решение да е повлиял и английският модел: (one) euro – (many) euro, макар логиката и в този език да предполага разлика във формите: (one) euro – (many) euros. Интересно е, че отделните европейски книжовни езици се справят по различен начин с приспособяването на думата към граматичната им система. Немският, италианският и полският например се държат като английския и българския – обща форма за двете числа, но френският, испанският и португалският в по-голяма степен са интегрирали съществителното и формите за ед. и мн.ч. се различават.

Докато сме все още на тази граматична тема, е добре да обърнем внимание на една грешка, за която мнозина дори не подозират, защото на практика е кажи-речи нормализирана. Изрази като ресто в лева, плащам в лева, сметка в лева са неправилни. Формата лева е бройна и най-общо се употребява след числително бройно име (по-просто казано, след число), както и след местоименията колко, няколко и николко: 20 лева, колко лева, няколко лева, николко лева. В останалите случаи се използва обикновената форма за мн.ч.: ресто в левове, плащам в левове, сметка в левове. Тези употреби – съответно и грешките – ще намалеят по естествен път, но в преходния месец януари със сигурност ще ги срещаме често.

Символът €

Дори и онези българи, които не са пътували много-много из Европа, вече би трябвало да са свикнали с него и да го разпознават – от половин година е на етикетите с цените на стоките в магазините. Допреди няколко дни не бях проучвала символиката на знака € и го асоциирах с първата буква на евро, а допълнителната хоризонтална черта – с пресечната черта в символите на други валути: $, £, ¥ (юан, йена). Оказва се, че в основата на € е гръцката буква ε (епсилон), а двете успоредни линии символизират стабилност.

При употребата на знака трябва да внимаваме за две неща.

Първо, поставяме € след, а не пред цифрите, с които означаваме сумата. Второ, оставяме интервал между цифрите и €.

Ето примери за правилна употреба: 25,73 €, 400 000 €. Вариантите €25,73, €400 000, 25,73€, 400 000€ са грешни.

С прилагането на тези две правила е лесно да се справим, но известни затруднения ще срещнем при самото изписване на знака. На мобилните си телефони би трябвало да имате € на клавиша за $, ако сте избрали като регион държава от еврозоната (вкл. България).

На компютрите е малко по-трудно. В интернет ще намерите съвети с различни начини за изписване на €, които не са универсални, за съжаление. Ако сте под Windows, пробвайте по следния начин: 1) уверете се, че сте на латиница; 2) активирайте нумлоковата част на клавиатурата (групата клавиши с цифри най-вдясно); 3) натиснете левия Alt и задръжте клавиша; 4) наберете 0128 на нумлоковата част; 5) пуснете левия Alt. Вече би трябвало на екрана да се е появил символът €.

Работещите под MacOS може да използват клавишната комбинация Option + 1 (ако са на кирилица) или Option + Shift + 2 (ако са на латиница).

А как да съкращаваме евро и евроцентове?

Съкращенията лв. и ст. ни вършеха много добра работа, защото бяха общоприети, но по отношение на новата валута все още се чудим дали да пишем евро, €, евроцент, цент, или да съкращаваме думите.

Ето какви начини за съкращаване посочва Институтът за български език на БАН в отговор на запитване на Министерството на образованието и науката:

евро – е.
цент – ц.
евроцент – е.ц.
стотинка – ст.

Не смея да прогнозирам как и доколко тези съкращения ще се установят в езиковата практика. Все пак ще отбележа, че това е. ми е доста странно – може би защото глаголната форма е се среща често в писмени текстове и поне в началото (ако изобщо съкращението е. започне да се употребява) би било озадачаващо да виждаме например Блузата струва 34 е. Всякак бих предпочела € пред е., ако опрем до краткостта.

Ще наблюдавам установяването на съкращенията с интерес, също както и борбата между центовете и стотинките – кой кого? От една страна, възможно е да оставим подразделенията на лева в миналото поради неразривната им връзка с предишната валута, но от друга, кой знае, може я носталгията, я пуризмът да заговори у нас, а защо не и да се вгледаме в нашите евромонети и да си кажем: ама тук си пише стотинки! Препоръката на ИБЕ е за назоваване на монетите с номинал, по-малък от 1 евро, да се използва тъкмо тази дума, а не (евро)центове.

Правописни неволи с други „финансови“ думи

С евроцентовете правим плавен преход към слятото и разделното писане на евронещата. По-голямата част от тези думи се пишат само слято – еврофонд, европрограма, еврокомисар, тъй като първата част е съкращение на прилагателното европейски. При евроцент, евровалута, еврозона ситуацията е друга – първата част представлява съществително име, което се употребява самостоятелно и пояснява втората част, също съществително име. В тези случаи е позволено думите да се пишат и слято, и разделно: евроцент/евро цент. В езиковата практика обаче по-често се среща слятото писане, вероятно под влияние на първия тип думи, които са по-многобройни и се пишат само по този начин. Ето защо ви препоръчвам да не се занимавате с тънки разграничения, а да пишете евродумите слято³.

Покрай евровалутата се сещам и за криптовалутите, които имат немалко почитатели, а самото съществително име се пише единствено слято. Използването на средства от еврофондовете пък често върви със съфинансиране. То може и да означава същото като co-financing, но английският правопис не бива да ни въвежда в заблуждение, защото в нашата дума съ- е представка и затова не се отделя с дефис (малко тире).

Рискувам да обидя четящите тази статия с бележката, че съществителното финанси се употребява само в тази форма и тя е за мн.ч. Да, редица думи, като лекции, технологии завършват на -ии в мн.ч., но срещу тях стоят лекция, технология в ед.ч., а финансия категорично липсва в българския език, така че финансиите няма откъде да се вземат. Факт е също така, че в граматично отношение съществителното е „дефектно“ – липсва му форма за ед.ч., подобно на еврото в книжовния език, което си няма специфична форма за мн.ч. Изключенията предразполагат към грешки и с това далеч не оправдавам грешащите, а се опитвам да разбера причините.

Останаха не една и две „финансови“ думи с колебаещ се правопис, но е време да си пожелаем безпроблемно обращение (не обръщение) на еврото в България, винаги да има какво да превеждаме (не да привеждаме) от своите сметки в други, тоест да сме платежоспособни (не платежноспособни), а най-малката купюра (не купюр) в портмонето ни да е от 100 евро!

1 Изключение правят абстрактни съществителни (доброта, егоизъм), названия на газове, метали, вещества (кислород, калций) и др., които имат само форма за ед.ч. Други съществителни се употребяват само с формата си за мн.ч., например названия на предмети от две части (очила, гащи), на вещества и други същности, които се мислят само като множества (въглища, джибри).

2 Факт е, че в момента в обращение е и друга парична единица, чието название е от среден род – песо, и книжовната формата за мн.ч. също е песо. От друга страна обаче, тази дума се среща рядко в нашата реч и съответно е трудно да се направи заключение доколко стабилна и безпроблемна е употребата на песо в мн.ч., още повече че в академичния тълковен речник са отбелязани формите песоси и песи.

3 Правописът на прилагателното евро-атлантически е изключение.

Езикът може да е вкусен и извън блюдото – онзи, българският език, на който говорим от малки и на който около 24 май се кълнем в обич. А той в същността си е средство за общуване и за да ни служи добре, непрекъснато се променя. Да го погледнем в неговата динамика и да се опитаме да разберем какво става и защо, кои са движещите механизми и как те са свързани с обществените процеси. И тъй като задачата не е лека, ще го правим постепенно – на порции.

Building an “Academy of Uptime” with Kristine Lamberte

Post Syndicated from Michael Kammer original https://blog.zabbix.com/building-an-academy-of-uptime-with-kristine-lamberte/31773/

If you’ve been working with Zabbix (or are planning to), you’re in luck – we’ve recently launched Zabbix Academy, a new learning platform designed to empower IT professionals and monitoring enthusiasts with self-paced, expert-led training.

Zabbix Academy is the brainchild of Kristine Lamberte, Head of Training at Zabbix. Kristine was gracious enough to participate in a short interview where she shares the vision behind it, goes into detail about who it’s targeted at (spoiler alert – everyone!), and ruminates about the future of learning and development at Zabbix.

In the beginning: The vision behind Zabbix Academy

Was there anything in particular that inspired the creation of Zabbix Academy, and how does it fit into Zabbix’s long-term vision for community and professional development?

Zabbix itself is an extremely flexible tool, so we want to offer the same level of flexibility in our professional services. At that moment, we had enough variety in the training offer in terms of different courses for different experience levels, and we no doubt had (and still have) a great level of quality as well as theory and hands-on balance, so this was a natural next step in how we can offer even more for our users.

As for the long-term vision, Zabbix Academy supports the growth of the Zabbix ecosystem, it strengthens our training portfolio without replacing live courses, and it also demonstrates our ongoing investment in the community.

Do you see a primary audience for Zabbix Academy (beginners, professionals, enterprise clients, etc.) or is it meant to be universal?

We are ready to meet you at any stage of your Zabbix journey. The Academy has free quick-start guides in the form of free courses and webinars for those who are just starting, as well as a variety of courses on different levels – introduction, fundamental, intermediate, and advanced. And we will add new paid and free material on a regular basis for all levels.

The Zabbix Academy learning experience

How does Zabbix Academy go about keeping learning hands-on and practical for complicated monitoring scenarios?

All the people involved in the creation of training materials are Zabbix Certified Trainers and Zabbix Certified Experts with multiple years of experience. We have a deep understanding that no training material is complete without good-quality real-life use cases and practical tasks. So, it is natural that in Zabbix Academy, for all the paid courses, you will get not only high-quality theory, but also an option to do labs. Learners can experiment in a safe sandbox setting — so they’re not just reading about Zabbix, they’re actually using it.

Instructors and expertise

How do you ensure consistency and quality across so many different topics and courses?

Practice makes perfect, doesn’t it? It all comes down to the people who are behind the course creation. As I already mentioned, they are experienced Zabbix trainers and experts, but most importantly, they have hands-on experience with Zabbix.

But it is not only about our training content creators; we have close collaboration with other teams, for example, internally, support, developers, integrators, etc., and we also have extremely knowledgeable training partners who are very much involved in the review of new courses and suggestions for what’s coming.

Additionally, learner feedback plays a key role — we continuously refine and update materials based on real-world experience and community input.

Career impact

Can you give a hypothetical scenario of how Zabbix Academy could help an IT professional advance their career or an organization strengthen their monitoring practices?

Personally, I put more emphasis on what knowledge brings to the company. Knowing how to work smarter, more efficiently, use effective automations, troubleshoot faster, and come up with new ways of what and how to monitor is something that everyone should want for their business, and these things come with knowledge. What we offer is structured knowledge, packed and passed down to Zabbix users in the most effective way.

The future

What are your goals for the first year of Zabbix Academy, and how will you measure its success?

In the first year, it is crucial to continuously grow and shape Zabbix Academy. The measure of success? I mean, we created this platform for our users, so the measure of success is based on their satisfaction, engagement, and the impact this platform will have on their day-to-day tasks.

What future expansions or features can learners expect?

We aim to continuously expand the course catalogue, both free and paid content, and establish Zabbix Academy as a trusted source of knowledge for both new and existing users. In short, our goal is for Zabbix Academy to evolve into a dynamic, living resource that grows alongside Zabbix itself.

A final thought

From your perspective as Head of Training, what has been the most rewarding or challenging part of launching Zabbix Academy?

There were no challenges worth mentioning, but when it comes to the most rewarding thing, I can name a few.
First thing is that we established right from the beginning that Zabbix Academy will have all kinds of content, including free content. This once again supports our effort in strengthening our community.

Secondly, we did not compromise on the course quality; we took our classroom-quality courses and transformed them for the self-paced training.

But the most rewarding part has been seeing how excited our community is about Zabbix Academy. The feedback from early users and our partners has been overwhelmingly positive. That shows me that we are on the right track, and now we just need to keep on delivering things we are good at – great quality, hands-on content that allows Zabbix users to reach and exceed their monitoring goals.

Continue reading Building an “Academy of Uptime” with Kristine Lamberte →

A closer look at a BGP anomaly in Venezuela

Post Syndicated from Bryton Herdes original https://blog.cloudflare.com/bgp-route-leak-venezuela/

As news unfolds surrounding the U.S. capture and arrest of Venezuelan leader Nicolás Maduro, a cybersecurity newsletter examined Cloudflare Radar data and took note of a routing leak in Venezuela on January 2.

We dug into the data. Since the beginning of December there have been eleven route leak events, impacting multiple prefixes, where AS8048 is the leaker. Although it is impossible to determine definitively what happened on the day of the event, this pattern of route leaks suggests that the CANTV (AS8048) network, a popular Internet Service Provider (ISP) in Venezuela, has insufficient routing export and import policies. In other words, the BGP anomalies observed by the researcher could be tied to poor technical practices by the ISP rather than malfeasance.

In this post, we’ll briefly discuss Border Gateway Protocol (BGP) and BGP route leaks, and then dig into the anomaly observed and what may have happened to cause it. 

Background: BGP route leaks

First, let’s revisit what a BGP route leak is. BGP route leaks cause behavior similar to taking the wrong exit off of a highway. While you may still make it to your destination, the path may be slower and come with delays you wouldn’t otherwise have traveling on a more direct route.

Route leaks were given a formal definition in RFC7908 as “the propagation of routing announcement(s) beyond their intended scope.” Intended scope is defined using pairwise business relationships between networks. The relationships between networks, which in BGP we represent using Autonomous Systems (ASes), can be one of the following: 

  • customer-provider: A customer pays a provider network to connect them and their own downstream customers to the rest of the Internet

  • peer-peer: Two networks decide to exchange traffic between one another, to each others’ customers, settlement-free (without payment)

In a customer-provider relationship, the provider will announce all routes to the customer. The customer, on the other hand, will advertise only the routes from their own customers and originating from their network directly.

In a peer-peer relationship, each peer will advertise to one another only their own routes and the routes of their downstream customers. 


These advertisements help direct traffic in expected ways: from customers upstream to provider networks, potentially across a single peering link, and then potentially back down to customers on the far end of the path from their providers. 

A valid path would look like the following that abides by the valley-free routing rule: 


A route leak is a violation of valley-free routing where an AS takes routes from a provider or peer and redistributes them to another provider or peer. For example, a BGP path should never go through a “valley” where traffic goes up to a provider, and back down to a customer, and then up to a provider again. There are different types of route leaks defined in RFC7908, but a simple one is the Type 1: Hairpin route leak between two provider networks by a customer. 


In the figure above, AS64505 takes routes from one of its providers and redistributes them to their other provider. This is unexpected, since we know providers should not use their customer as an intermediate IP transit network. AS64505 would become overwhelmed with traffic, as a smaller network with a smaller set of backbone and network links than its providers. This can become very impactful quickly. 

Route leak by AS8048 (CANTV)

Now that we have reminded ourselves what a route leak is in BGP, let’s examine what was hypothesized  in the newsletter post. The post called attention to a few route leak anomalies on Cloudflare Radar involving AS8048. On the Radar page for this leak, we see this information:


We see the leaker AS, which is AS8048 — CANTV, Venezuela’s state-run telephone and Internet Service Provider. We observe that routes were taken from one of their providers AS6762 (Sparkle, an Italian telecom company) and then redistributed to AS52320 (V.tal GlobeNet, a Colombian network service provider). This is definitely a route leak. 

The newsletter suggests “BGP shenanigans” and posits that such a leak could be exploited to collect intelligence useful to government entities. 

While we can’t say with certainty what caused this route leak, our data suggests that its likely cause was more mundane. That’s in part because BGP route leaks happen all of the time, and they have always been part of the Internet — most often for reasons that aren’t malicious.

To understand more, let’s look closer at the impacted prefixes and networks. The prefixes involved in the leak were all originated by AS21980 (Dayco Telecom, a Venezuelan company):


The prefixes are also all members of the same 200.74.224.0/20 subnet, as noted by the newsletter author. Much more intriguing than this, though, is the relationship between the originating network AS21980 and the leaking network AS8048: AS8048 is a provider of AS21980. 

The customer-provider relationship between AS8048 and AS21980 is visible in both Cloudflare Radar and bgp.tools AS relationship interference data. We can also get a confidence score of the AS relationship using the monocle tool from BGPKIT, as you see here: 

➜  ~ monocle as2rel 8048 21980
Explanation:
- connected: % of 1813 peers that see this AS relationship
- peer: % where the relationship is peer-to-peer
- as1_upstream: % where ASN1 is the upstream (provider)
- as2_upstream: % where ASN2 is the upstream (provider)

Data source: https://data.bgpkit.com/as2rel/as2rel-latest.json.bz2

╭──────┬───────┬───────────┬──────┬──────────────┬──────────────╮
│ asn1 │ asn2  │ connected │ peer │ as1_upstream │ as2_upstream │
├──────┼───────┼───────────┼──────┼──────────────┼──────────────┤
│ 8048 │ 21980 │ 9.9%   │ 0.6% │ 9.4%    │ 0.0%         │
╰──────┴───────┴───────────┴──────┴──────────────┴──────────────╯

While only 9.9% of route collectors see these two ASes as adjacent, almost all of the paths containing them reflect AS8048 as an upstream provider for AS21980, meaning confidence is high in the provider-customer relationship between the two.

Many of the leaked routes were also heavily prepended with AS8048, meaning it would have been potentially less attractive for routing when received by other networks. Prepending is the padding of an AS more than one time in an outbound advertisement by a customer or peer, to attempt to switch traffic away from a particular circuit to another. For example, many of the paths during the leak by AS8048 looked like this: “52320,8048,8048,8048,8048,8048,8048,8048,8048,8048,23520,1299,269832,21980”. 

You can see that AS8048 has sent their AS multiple times in an advertisement to AS52320, because by means of BGP loop prevention the path would never actually travel in and out of AS8048 multiple times in a row. A non-prepended path would look like this: “52320,8048,23520,1299,269832,21980”. 

If AS8048 was intentionally trying to become a man-in-the-middle (MITM) for traffic, why would they make the BGP advertisement less attractive instead of more attractive? Also, why leak prefixes to try and MITM traffic when you’re already a provider for the downstream AS anyway? That wouldn’t make much sense. 

The leaks from AS8048 also surfaced in multiple separate announcements, each around an hour apart on January 2, 2026 between 15:30 and 17:45 UTC, suggesting they may have been having network issues that surfaced in a routing policy issue or a convergence-based mishap. 


It is also noteworthy that these leak events begin over twelve hours prior to the U.S. military strikes in Venezuela. Leaks that impact South American networks are common, and we have no reason to believe, based on timing or the other factors I have discussed, that the leak is related to the capture of Maduro several hours later.

In fact, looking back the past two months, we can see plenty of leaks by AS8048 that are just like this one, meaning this is not a new BGP anomaly:


You can see above in the history of Cloudflare Radar’s route leak alerting pipeline that AS8048 is no stranger to Type 1 hairpin route leaks. Since the beginning of December alone there have been eleven route leak events where AS8048 is the leaker.

From this we can draw a more innocent possible explanation about the route leak: AS8048 may have configured too loose of export policies facing at least one of their providers, AS52320. And because of that, redistributed routes belong to their customer even when the direct customer BGP routes were missing. If their export policy toward AS52320 only matched on IRR-generated prefix list and not a customer BGP community tag, for example, it would make sense why an indirect path toward AS6762 was leaked back upstream by AS8048. 

These types of policy errors are something RFC9234 and the Only-to-Customer (OTC) attribute would help with considerably, by coupling BGP more tightly to customer-provider and peer-peer roles, when supported by all routing vendors. I will save the more technical details on RFC9234 for a follow-up blog post.

The difference between origin and path validation

The newsletter also calls out as “notable” that Sparkle (AS6762) does not implement RPKI (Resource Public Key Infrastructure) Route Origin Validation (ROV). While it is true that AS6762 appears to have an incomplete deployment of ROV and is flagged as “unsafe” on isbgpsafeyet.com because of it, origin validation would not have prevented this BGP anomaly in Venezuela. 

It is important to separate BGP anomalies into two categories: route misoriginations, and path-based anomalies. Knowing the difference between the two helps to understand the solution for each. Route misoriginations, often called BGP hijacks, are meant to be fixed by RPKI Route Origin Validation (ROV) by making sure the originator of a prefix is who rightfully owns it. In the case of the BGP anomaly described in this post, the origin AS was correct as AS21980 and only the path was anomalous. This means ROV wouldn’t help here.

Knowing that, we need path-based validation. This is what Autonomous System Provider Authorization (ASPA), an upcoming draft standard in the IETF, is going to provide. The idea is similar to RPKI Route Origin Authorizations (ROAs) and ROV: create an ASPA object that defines a list of authorized providers (upstreams) for our AS, and everyone will use this to invalidate route leaks on the Internet at various vantage points. Using a concrete example, AS6762 is a Tier-1 transit-free network, and they would use the special reserved “AS0” member in their ASPA signed object to communicate to the world that they have no upstream providers, only lateral peers and customers. Then, AS52320, the other provider of AS8048, would see routes from their customer with “6762” in the path and reject them by performing an ASPA verification process.

ASPA is based on RPKI and is exactly what would help prevent route leaks similar to the one we observed in Venezuela.

A safer BGP, built together 

We felt it was important to offer an alternative explanation for the BGP route leak by AS8048 in Venezuela that was observed on Cloudflare Radar. It is helpful to understand that route leaks are an expected side effect of BGP historically being based entirely on trust and carefully-executed business relationship-driven intent. 

While route leaks could be done with malicious intent, the data suggests this event may have been an accident caused by a lack of routing export and import policies that would prevent it. This is why to have a safer BGP and Internet we need to work together and drive adoption of RPKI-based ASPA, for which RIPE recently released object creation, on the wide Internet. It will be a collaborative effort, just like RPKI has been for origin validation, but it will be worth it and prevent BGP incidents such as the one in Venezuela. 

In addition to ASPA, we can all implement simpler mechanisms such as Peerlock and Peerlock-lite as operators, which sanity-checks received paths for obvious leaks. One especially promising initiative is the adoption of RFC9234, which should be used in addition to ASPA for preventing route leaks with the establishing of BGP roles and a new Only-To-Customer (OTC) attribute. If you haven’t already asked your routing vendors for an implementation of RFC9234 to be on their roadmap: please do. You can help make a big difference.

AMD Announces Zen 5-based Ryzen AI Embedded P100 Family of Chips

Post Syndicated from Ryan Smith original https://www.servethehome.com/amd-announces-zen-5-based-ryzen-ai-embedded-p100-family-of-chips/

Alongside AMD’s slew of consumer-related product announcements with desktop and mobile Ryzen processors, the company also took a moment of its time during its CES 2026 presentation to address the embedded market. The tangentially-related cousin to the consumer market, AMD’s embedded lineup of processors are aimed at the automotive and industrial markets, as well as […]

The post AMD Announces Zen 5-based Ryzen AI Embedded P100 Family of Chips appeared first on ServeTheHome.

AMD Reveals New Ryzen AI 400 Series, Ryzen AI Max+, and Ryzen 7 9850X3D Chips At CES 2026

Post Syndicated from Ryan Smith original https://www.servethehome.com/amd-reveals-new-ryzen-ai-400-series-ryzen-ai-max-and-ryzen-7-9850x3d-chips-at-ces-2026/

Kicking off AMD’s slate of consumer announcements for this year’s CES trade show, the company brought to the shows several new chip SKUs for the consumer market. Altogether the company is launching two new Ryzen AI Max+ processors for AI developers, a new desktop Ryzen 9000X3D chip for gamers, and for the mobile market a […]

The post AMD Reveals New Ryzen AI 400 Series, Ryzen AI Max+, and Ryzen 7 9850X3D Chips At CES 2026 appeared first on ServeTheHome.

AMD CES 2026 Keynote Live Coverage

Post Syndicated from Ryan Smith original https://www.servethehome.com/amd-ces-2026-keynote-live-coverage/

We’re down to our third and final chipmaker keynote of the day. Closing out a busy day for press conferences is AMD, who this year gets the honor of holding CES’s official opening keynote. The subject of AMD’s keynote, like so many others this year, will be a broad focus on AI, with CEO Dr. […]

The post AMD CES 2026 Keynote Live Coverage appeared first on ServeTheHome.

Kinabalu AI SRE – Leveraging AI for scalable diagnostics and alert management (Part 1)

Post Syndicated from Grab Tech original https://engineering.grab.com/kinabalu-ai-sre

Introduction

If you’ve ever been on-call during an outage, you know the drill: a flood of alerts, five dashboards open, logs streaming from different places, a dozen threads in Slack, and still no clear picture. Context-switching kills velocity, and “where do I even start?” becomes the default question.

Kinabalu AI Site Reliability Engineering (AI SRE for short) is our attempt to transform this experience. It consolidates the right context in one place, analyzes it with assistive AI agents, and helps us move from alert to action quickly.

Target audience:

  • On-call engineers and incident commanders.
  • Service owners validating health, dependencies, and changes.
  • SRE/platform teams standardizing triage and root cause analysis (RCA) quality.

Background

Incidents today suffer from several issues, including alert overload, fragmented context across tools, slow RCA, operational redundancy from tool-hopping, and scattered runbooks that are hard to find and apply under pressure.

AI SRE solves these issues by serving a unified view that streamlines diagnostics and correlates signals to recommend the best next actions. This approach accelerates response time, further reducing time-to-resolution (TTR), lowers the cognitive load on on-calls by keeping all relevant context in one place, and strengthens collaboration through evidence-backed updates and clear ownership.

A typical user journey

Kinabalu’s AI SRE is a 24/7 automator reachable via Slack and a Web UI. It takes input in the form of an automated alert or a direct question and responds with an evidence-backed, actionable insight.

In a hypothetical user journey with AI SRE, the process might begin with a trigger. For instance, if a monitoring alert is triggered by a fivefold increase in a Datadog report and increasing latency for a service, AI SRE initiates an incident thread and gathers the initial context.

The following components of AI SRE are then executed in sequence:

Component 1: Auto-triage with context from incident records, tagging on severity, priority, owner/oncall, as well as issue types.

Component 2: AI SRE (static diagnostics) establishes correlations by

  • Metrics and dashboards: analyzes recent deltas and compares against time-of-day/week baselines.
  • Dependencies: checks upstream/downstream services to separate causes from symptoms.
  • Changes: retrieves recent deployments, config updates, and feature-flag flips.
  • Logs: clusters error signatures and tracks frequency shifts.

Delivers an incident summary with actionable insights, aRCA draft, and concrete recommendations (queries to run, rollback/feature-flag options, runbook links).

Component 3: Dynamic conversation.

  • Conversational follow-up where user enters questions in Slack, such as “List owners for impacted services”, or “Compare p95 across top markets”. AI SRE replies with evidence-backed answers and provides links for further drill-down.

Architecture

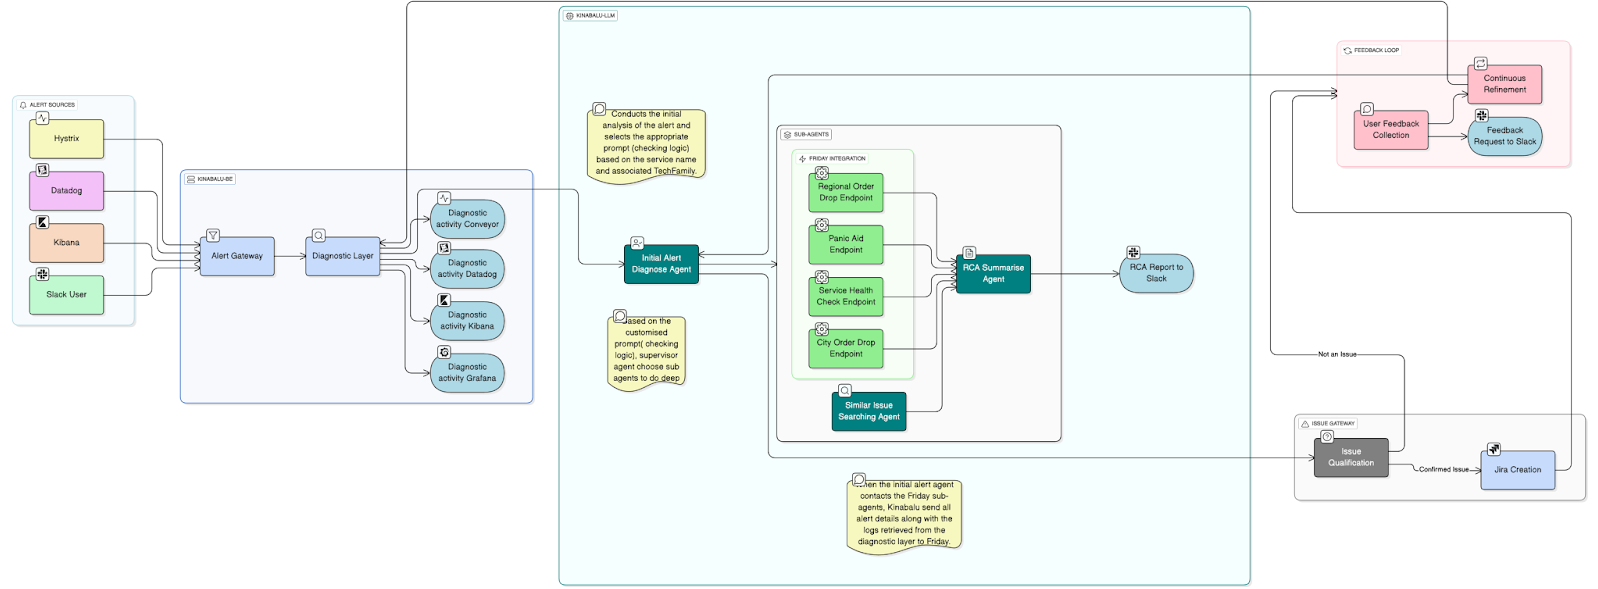
Under the hood, the backend combines a central signal aggregator with Model Context Protocol (MCP) servers for instant search, and a Large Language Model (LLM) powered intelligence layer that analyzes signals to auto-triage incidents and produce actionable insights.

Figure 1. SRE AI architecture.

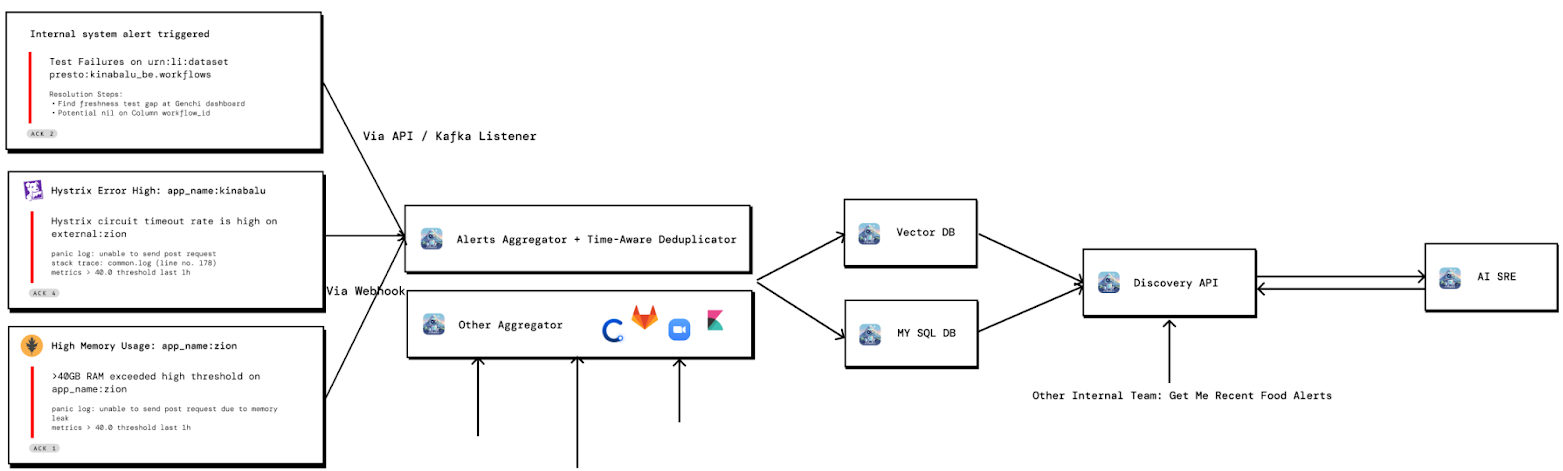
Signal aggregator: Context engineering

We follow a Retrieval Augmented Generation (RAG) approach and are building a knowledge graph that stitches together incident signals across the stack. The aggregator ingests the information as follows:

  • Datadog (metrics, monitors)
  • Kibana/Elasticsearch (logs)
  • Grafana (dashboards)
  • Hystrix (circuit state)
  • GitLab/Jira (changes/issues)
  • CI/CD and deployment metadata
  • Service/product catalog (ownership, dependencies)

With this context, AI SRE agents can provide a clear view of what changed, when it changed, and who owns it, making incident understanding and debugging faster and more reliable in a near-real-time manner.

Figure 2. Examples of signal aggregation for building context.

Unified intelligence: An agentic approach

Agents can basically “normalize” the alerts and signals, meaning they standardize and interpret them for better understanding. They can semantically search through historical changes that can explain current symptoms, correlate co-occurring signals, and surface likely causes.

AI SRE uses the SuperAgent and A2A multi-agent frameworks to analyze incidents using two workflows, which can coexist.

  • For static diagnosis, a separate flow collects all data and logs for services via the MCP toolkit and sends them to A2A multi-agents for a deep-dive investigation.
  • For dynamic analysis, SuperAgent uses the MCP toolkit to investigate and pull real-time data.

Static diagnosis

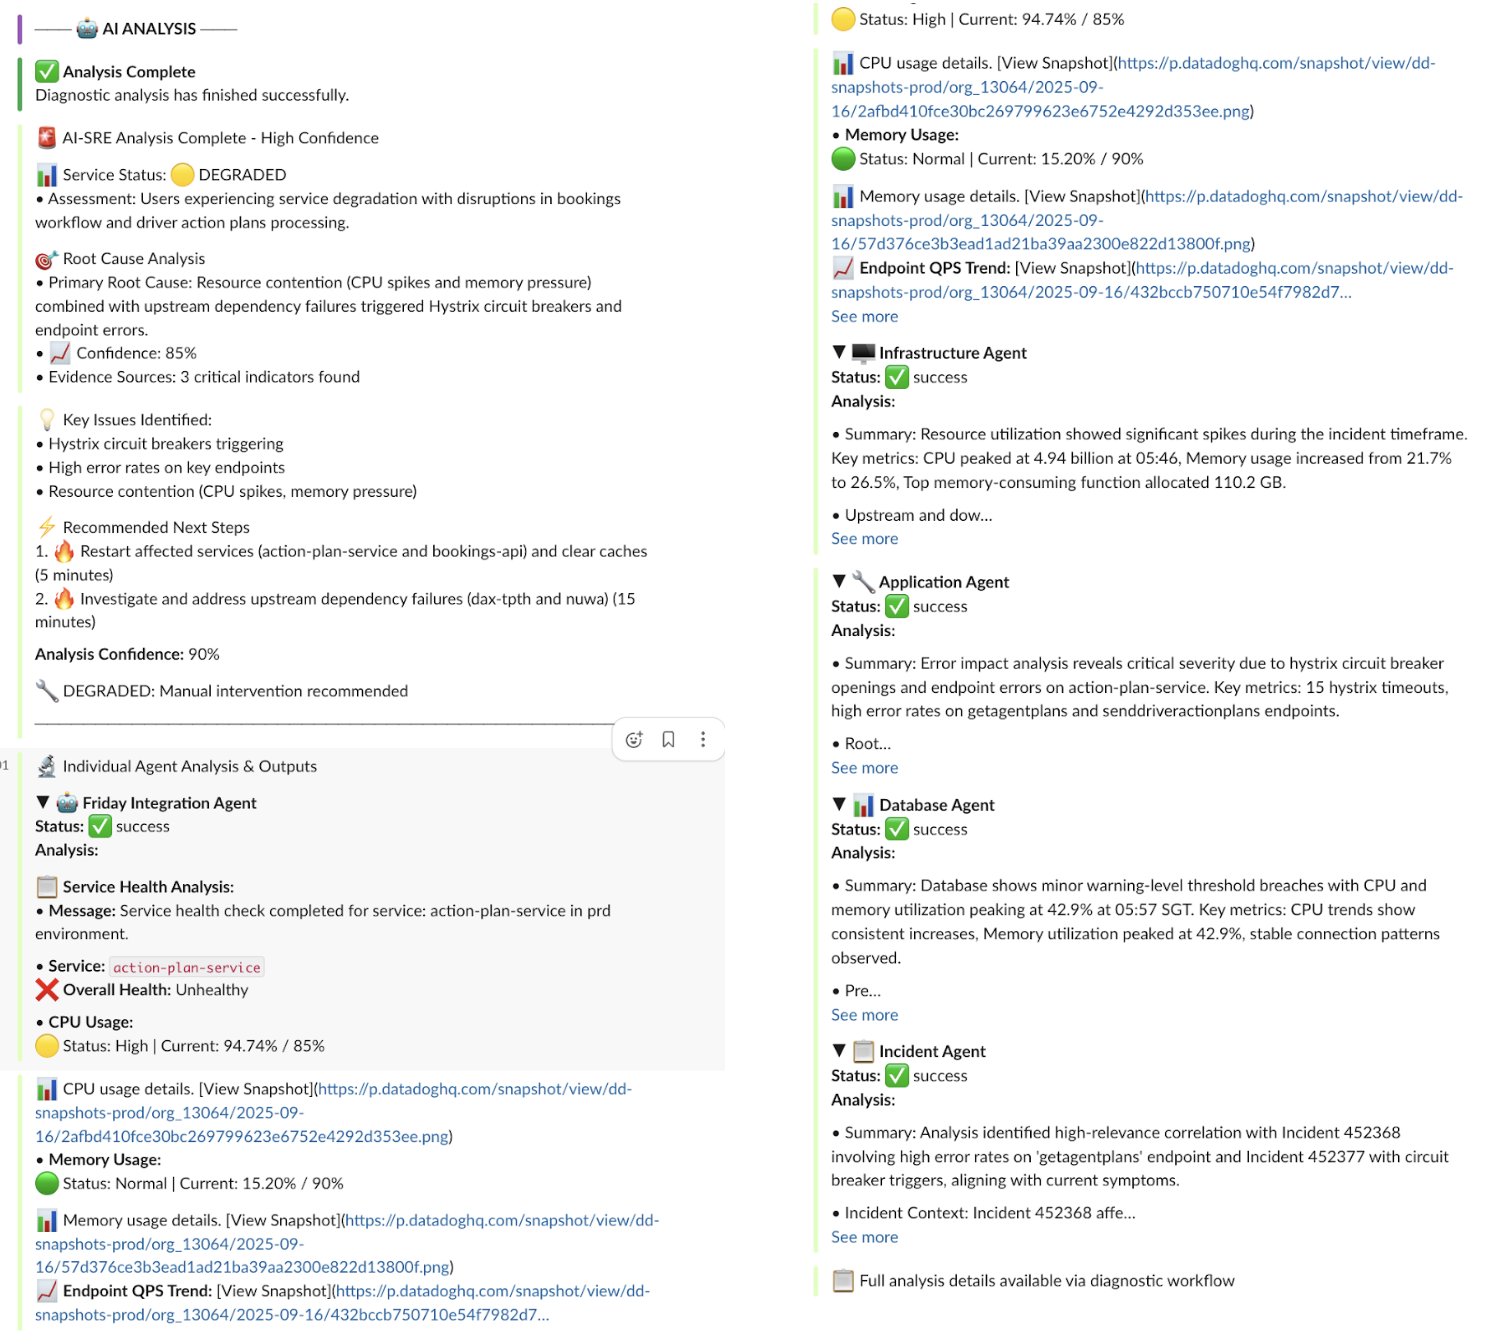
The static diagnostics workflow starts with a trigger from Slack or the Web UI and ends with a comprehensive service health report. It coordinates six domain-specific sub-agents encompassing the areas of incident management, deployment, application, database, infrastructure, and external APIs. Each sub-agent pulls the relevant signals and runs targeted checks, producing detailed findings. The supervisor then synthesizes these into an investigation-ready brief. The brief contains a concise summary of suspects and blast radius, timeline, and recommended next steps. The briefs are grounded in logs and metrics, so engineers can quickly understand the impact and move toward resolution.

Figure 3. Examples of static diagnosis by AI SRE.

Dynamic chat

Users can inquire via Slack or the Web UI to receive an immediate, evidence-supported action plan. Examples of such questions include:

  • “How many recent deployments touched the food service?”
  • “How many Terraform changes in the past 5 minutes?”

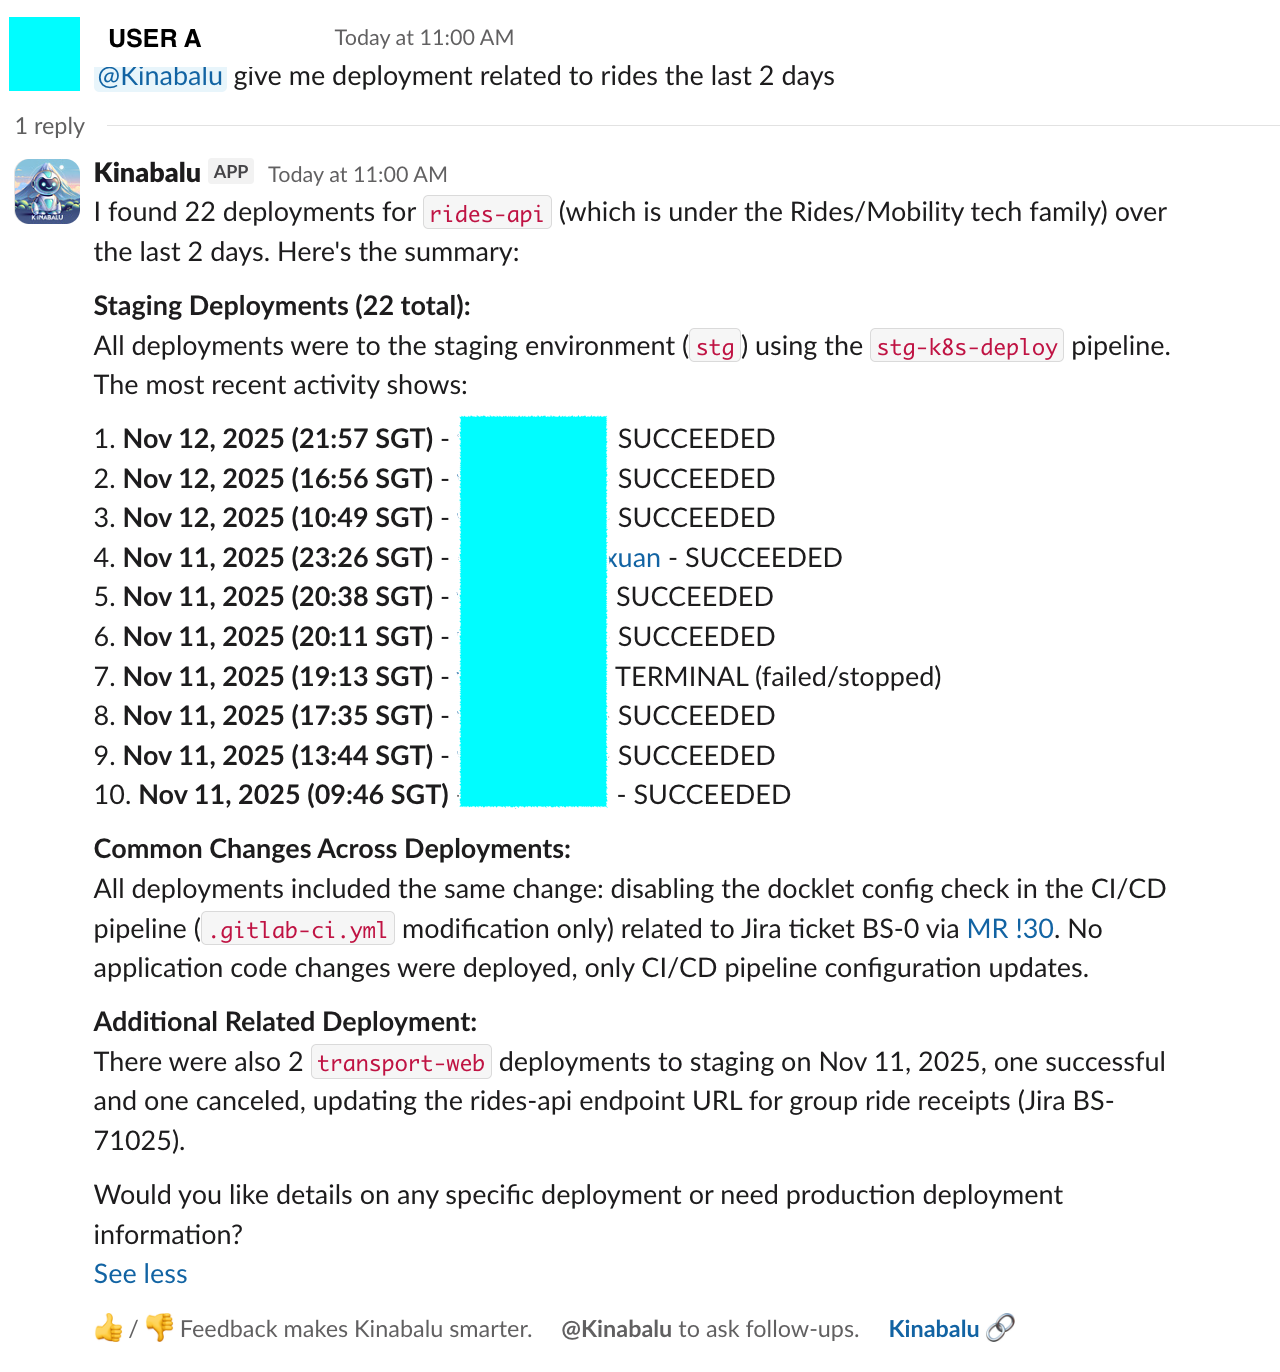
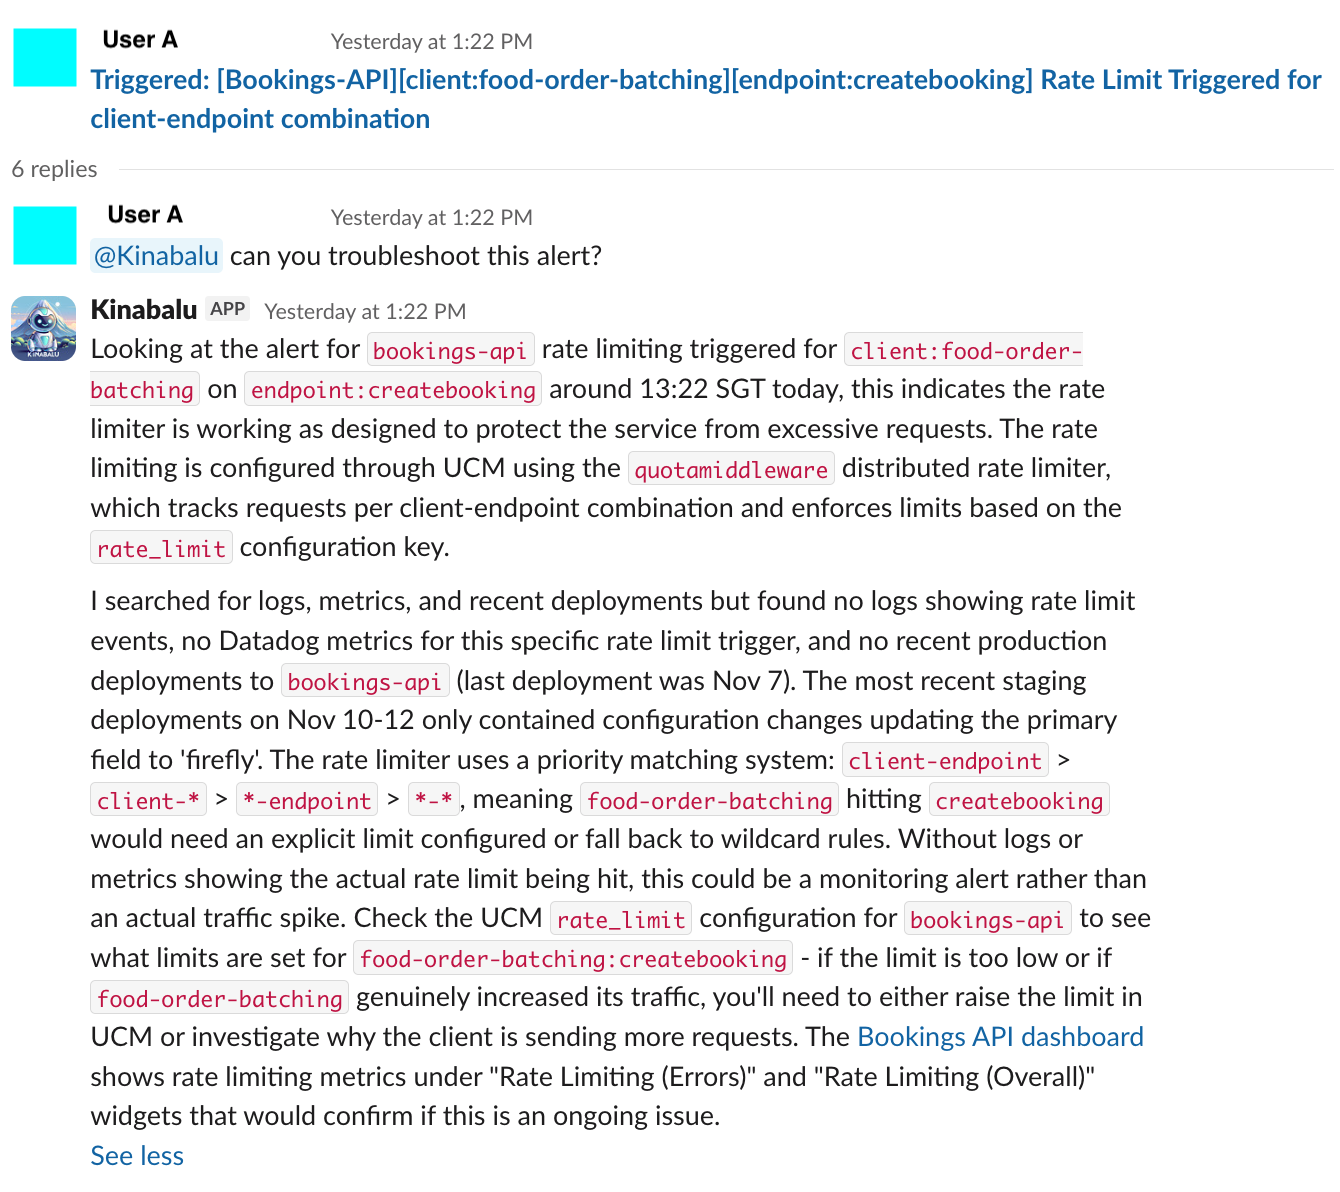
Powered by our SuperAgent and MCP tool layer, dynamic chat queries live systems such as metrics, logs, deploy history, and configs. It then returns cited data, comparisons, and next-best actions. On-call engineers can diagnose issues and pull logs on the fly, before escalating actions (e.g., open a ticket, compare regions, list owners, suggest rollbacks). It’s human-in-the-loop (HITL) by design.

Figure 4. Example of examining related deployments within the same time frame.
Figure 5. Example of analyzing Splunk or DataDog alerts to identify the root cause of an issue.

MCP toolkit

The Kinabalu MCP Toolkit serves as a universal integration layer that empowers AI SRE by unifying 25 operational tools into a single, consistent interface. This comprehensive toolkit spans six key domains:

  • Incident and communications: Manages historical incidents, Slack thread context, and ticketing.
  • Internal platforms: Includes changelogs, experiments, rollout history, and automated analyses.
  • Knowledge and AI: Facilitates enterprise document search/chat and unstructured data analysis.
  • Service and configuration: Offers topology and configuration introspection.
  • Observability: Provides insights through metrics, logs, and profiling.
  • Deployment: Tracks recent releases and commit history.

The Kinabalu MCP Toolkit is designed to provide AI SRE with a 360 degree view of incidents, significantly accelerating root-cause discovery and response.

Conclusion

Our journey highlights the importance of structured context, robust diagnostic layers, and hybrid AI models for dependable incident automation. With Kinabalu AI SRE, we’re moving toward an ecosystem where alerts are normalized, evidence is automatically synthesized, and engineers can focus on higher level decision-making rather than firefighting.

Stay tuned for part 2, where we will cover the challenges, design decisions, and lessons that shaped Kinabalu AI SRE.

Join us

Grab is a leading superapp in Southeast Asia, operating across the deliveries, mobility and digital financial services sectors. Serving over 800 cities in eight Southeast Asian countries, Grab enables millions of people everyday to order food or groceries, send packages, hail a ride or taxi, pay for online purchases or access services such as lending and insurance, all through a single app. Grab was founded in 2012 with the mission to drive Southeast Asia forward by creating economic empowerment for everyone. Grab strives to serve a triple bottom line – we aim to simultaneously deliver financial performance for our shareholders and have a positive social impact, which includes economic empowerment for millions of people in the region, while mitigating our environmental footprint.

Powered by technology and driven by heart, our mission is to drive Southeast Asia forward by creating economic empowerment for everyone. If this mission speaks to you, join our team today!

Intel CES 2026 Keynote Live Coverage

Post Syndicated from Ryan Smith original https://www.servethehome.com/intel-ces-2026-keynote-live-coverage/

After a brief break following NVIDIA’s enterprise-focused keynote, we’re back for our second chipmaker keynote of the day: Intel. Unlike NVIDIA’s presentation, Intel’s presentation promises to be far more on-brand for CES, with a focus on consumer electronics via their Core Ultra Series 3 processors – better known as Panther Lake. Intel CES 2026 Keynote […]

The post Intel CES 2026 Keynote Live Coverage appeared first on ServeTheHome.

NVIDIA Launches Next-Generation Rubin AI Compute Platform at CES 2026

Post Syndicated from Ryan Smith original https://www.servethehome.com/nvidia-launches-next-generation-rubin-ai-compute-platform-at-ces-2026/

CES may still informally be the Consumer Electronics Show. But that does not mean everyone got the memo – or at least, cares to pay attention to it. Case in point is NVIDIA, who in the first major chipmaker press conference of the day opted for nothing less than to announce the launch of Rubin, […]

The post NVIDIA Launches Next-Generation Rubin AI Compute Platform at CES 2026 appeared first on ServeTheHome.

Simplify multi-warehouse data governance with Amazon Redshift federated permissions

Post Syndicated from Satesh Sonti original https://aws.amazon.com/blogs/big-data/simplify-multi-warehouse-data-governance-with-amazon-redshift-federated-permissions/

Modern data architectures increasingly rely on multi-warehouse deployments to achieve workload isolation, cost optimization, and performance scaling. Amazon Redshift federated permissions simplify permissions management across multiple Redshift warehouses.

With federated permissions, you register Redshift warehouse namespaces with the AWS Glue Data Catalog, creating a unified catalog that spans your entire warehouse fleet in the account. Registered namespaces are automatically mounted in every warehouse, providing data discovery without manual configuration. You can define permissions on database objects using familiar Redshift SQL commands, specifying global identities through AWS Identity and Access Management (IAM) or AWS IAM Identity Center (IDC). These permissions are stored alongside the warehouse data and enforced consistently, regardless of which warehouse runs the query. This provides a unified and secure access control model across your Redshift environment.

In this post, we show you how to define data permissions one time and automatically enforce them across warehouses in your AWS account, removing the need to re-create security policies in each warehouse.

Key capabilities of Amazon Redshift federated permissions

Federated permissions in Amazon Redshift offer the following key capabilities:

  • Global identity integration – Federated permissions use IAM and IAM Identity Center to provide single sign-on (SSO) across all registered warehouses. Users authenticate one time through their existing identity provider (IdP) and receive consistent access based on their global identity, regardless of which warehouse they connect to. This alleviates the need to create and manage separate user accounts in each warehouse, reducing administrative overhead and improving the user experience.
  • Unified catalog with automatic mounting – When you register a Redshift namespace with the Data Catalog using federated permissions, it becomes automatically visible in all warehouses within your account. Analysts using the Amazon Redshift Query Editor v2 or their preferred SQL client can discover and query tables across registered warehouses without manual catalog configuration. This automatic mounting capability simplifies data discovery and enables cross-warehouse analytics.
  • Consistent fine-grained access control – Row-level security (RLS) policies, dynamic data masking (DDM) policies, and column-level security (CLS) defined on warehouses using Amazon Redshift federated permissions automatically enforce when data is queried from consuming warehouses. You can implement advanced access controls—such as AWS Region-based row filtering, role-based masking for sensitive columns like SSN or credit card numbers, and time-based access restrictions—with confidence that these policies apply across warehouses.
  • SQL-based permission management – Federated permissions use familiar Redshift SQL syntax for permission management. You create RLS policies with CREATE RLS POLICY, attach them to tables and roles with ATTACH RLS POLICY, define masking policies with CREATE MASKING POLICY, and grant permissions with standard GRANT statements. This SQL interface enables infrastructure as code (IaC) approaches, supports database administrators to use their existing skills, and integrates naturally with existing extract, transform, and load (ETL) and automation workflows that use IAM or IAM Identity Center authentication.

Multi-warehouse architecture with federated permissions

The multi-warehouse architecture with federated permissions in Amazon Redshift represents a data mesh approach where multiple independent compute resources operate on shared data with unified governance. The following diagram illustrates the Redshift federated permissions setup process with the Data Catalog.

The process consists of the following steps:

  1. Each Redshift warehouse (1,2…N) registers with the Data Catalog. Refer onboarding documentation on registering the warehouse.
  2. After you register your Redshift warehouses with the Data Catalog, you can query data across your warehouses. Registered catalogs are automatically mounted in every warehouse in the account, appearing in the database explorer of Query Editor v2, and SQL clients connected to Amazon Redshift. To query a table in a registered catalog, use the three-part naming convention: database@catalog_name.schema_name.table_name.
  3. When you run a cross-catalog query, Amazon Redshift propagates your global identity (IAM role or IAM Identity Center user) to the remote warehouse. The remote warehouse’s catalog instance validates your permissions against the grants and fine-grained access control policies defined on the queried tables. If you have the necessary permissions, the table metadata and any applicable RLS, DDM, or CLS policies are returned to the consuming warehouse. Your local warehouse’s compute instance integrates these security policies into the query execution plan and runs the query on Redshift Managed Storage (RMS).

The enforcement of fine-grained access controls on remote data is a key differentiator of federated permissions. Traditional Redshift data sharing doesn’t support RLS or DDM policies on shared tables. With federated permissions, the security policies defined on the remote warehouse automatically apply when data is queried from any consumer warehouse. This supports compliance with data governance requirements without requiring administrators to duplicate security policies across warehouses.

The multi-warehouse architecture scales horizontally without increasing governance complexity. When you add a new warehouse to your account and register it with federated permissions, it automatically inherits the appropriate permission model without manual configuration. Analysts connecting to the new warehouse immediately see all databases they have access to across the mesh, and all security policies apply automatically. This alleviates the N-squared problem of managing permissions across N warehouses, reducing the administrative burden from N separate configurations to a single unified governance model.

Query lifecycle

The following diagram illustrates the step-by-step flow of how a user query on Redshift Warehouse 1 accesses objects in Redshift Warehouse N with federated permissions.

Note: Steps 2, 3, and 4 will be skipped if permission details are available in the local cache

The workflow consists of the following steps:

  1. The user connects to Redshift Warehouse 1 and queries a table in Federated Catalog N.
  2. Redshift Warehouse 1 calls the Data Catalog GetTable API. This request includes the user’s token.
  3. The request routes to Redshift Warehouse N.
  4. Redshift Warehouse N verifies the user permissions. If it’s authorized, it returns the table metadata and security policy details such as RLS policies, DDM rules, and CLS settings.
  5. Redshift Warehouse 1 applies the security policies in the query plan and runs the query against Redshift Managed Storage (RMS), where Redshift stores data in an optimized format.
  6. The results are returned to the user.

Solution overview

The example in this post demonstrates how to define RLS and DDM policies on a data warehouse and verify that these policies are enforced when querying from another data warehouse.

We will create a table with credit card data and apply RLS and DDM policies to limit consumer cards data and mask credit card values for non-admin users. These policies will be applied across all the data warehouses consistently and mask the credit card details when non-admin users query the table.

Prerequisites

Create the following IAM roles:

Create table and load data

Run following steps to create a credit_card table and load sample data.

  1. Connect to the first Redshift data warehouse1 using the IAM Aadmin role
  2. Create a credit_cards table
    -- Create table
    CREATE TABLE credit_cards (
      customer_id INT,
      credit_card varchar(16),
      card_type varchar(10)
    );

  3. Insert sample data
    -- Insert sample data
    INSERT INTO credit_cards
    VALUES
      (100, '4532993817514842', 'consumer'),
      (100, '4716002041425888', 'corporate'),
      (102, '5243112427642649', 'consumer'),
      (102, '6011720771834675', 'consumer'),
      (102, '6011378662059710', 'corporate'),
      (103, '373611968625635', 'consumer');

Apply RLS and DDM policies

Run following steps to create and apply RLS and DDM policies.

  1. Create an RLS policy to filter only consumer card types:
    -- Create RLS policy
    CREATE RLS POLICY consumer_cards
    WITH (card_type VARCHAR(10))
    USING (card_type = 'consumer');

  2. Create a DDM policy that masks credit cards:
    -- Create masking policy
    CREATE MASKING POLICY mask_credit_card_full
    WITH (credit_card VARCHAR(256))
    USING ('000000XXXX0000'::TEXT);

  3. Attach RLS and DDM Policies to RedOnly role
    -- Attach RLS and DDM policies to ReadOnly role
    ATTACH RLS POLICY consumer_cards 
    ON credit_cards 
    TO "IAMR:ReadOnly";
    
    ATTACH MASKING POLICY mask_credit_card_full
    ON credit_cards(credit_card)
    TO "IAMR:ReadOnly";

  4. Enable Row Level Security on the table
    ALTER TABLE credit_cards ROW LEVEL SECURITY ON;

  5. Grant select on the table to Readonly role
    GRANT SELECT ON credit_cards TO "IAMR:ReadOnly";

Connect to data warehouse 2 as read-only user

Run following steps on data warehouse 2 to query the data.

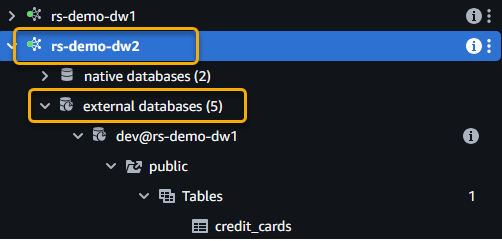
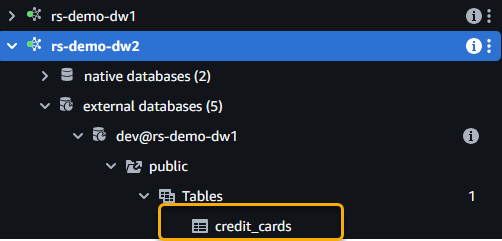
  1. Connect to data warehouse 2 as a read-only user and expand the external databases. The following screenshot shows an example using Query Editor V2.
  2. Notice the credit_cards table from data warehouse 1 when you expand the catalog.
  3. Run the following SQL to query the table. Replace rs-demo-dw1 in the following SQL with the catalog name you gave while registering data warehouse 1:
    -- SQL to query credit cards table in data warehouse1. 
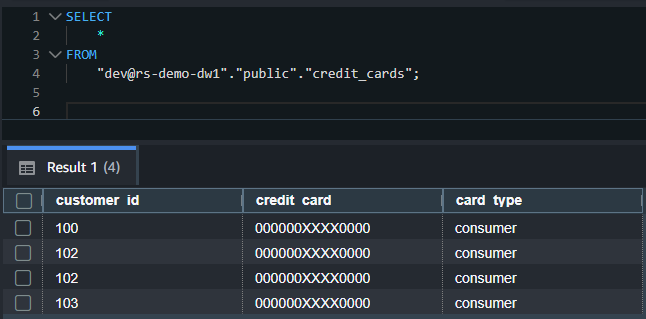
    SELECT * FROM "dev@rs-demo-dw1"."public"."credit_cards";

  4. You should see only consumer type credit cards with card details masked in the output. The RLS and DDM policies applied in data warehouse 1 on the IAMR:ReadOnly user are enforced even though you queried the table from a different data warehouse.
    The following screenshot shows an example output.
  5. For auditing, you can run SHOW commands to view the policies applied on the tables for the roles:
    -- Show all RLS policies in the database.
    SHOW RLS POLICIES FROM DATABASE "dev@rs-demo-dw1";
    -- Show all masking policies in the database.
    SHOW MASKING POLICIES FROM DATABASE "dev@rs-demo-dw1";

This example demonstrates the power of federated permissions: security policies defined one time on a warehouse automatically enforce across your warehouses, maintaining compliance without duplicating policy definitions.

Considerations

Keep in mind the following when using federated permissions:

Clean up

To avoid incurring future charges, delete the resources you created, including the Redshift data warehouses and IAM roles.

Conclusion

Amazon Redshift federated permissions transform multi-warehouse data governance into a streamlined, automated process. For organizations operating multiple Redshift warehouses, federated permissions deliver immediate value by reducing administrative time and supporting consistent security enforcement. The familiar SQL interface and backward compatibility with existing Redshift permissions enable rapid adoption without requiring teams to learn new governance models.

The integration with IAM and IAM Identity Center provides enterprise-grade identity management with SSO capabilities, and the automatic mounting of registered catalogs simplifies data discovery and cross-warehouse analytics. If you are currently using Amazon Redshift local permissions, refer to the tool described in Modernize Amazon Redshift authentication by migrating user management to AWS IAM Identity Center.

To learn more and get started, see Amazon Redshift Federated Permissions documentation.


About the authors

Satesh Sonti

Satesh Sonti

Satesh is a Principal Analytics Specialist Solutions Architect based out of Atlanta, specializing in building enterprise data platforms, data warehousing, and analytics solutions. He has over 20 years of experience in building data assets and leading complex data platform programs for banking and insurance clients across the globe.

Sandeep Adwankar

Sandeep Adwankar

Sandeep is a Senior Product Manager with Amazon SageMaker Lakehouse . Based in the California Bay Area, he works with customers around the globe to translate business and technical requirements into products that help customers improve how they manage, secure, and access data.

Abhishek Rai Sharma

Abhishek Rai Sharma

Abhishek is a Senior Software Engineer focused on Amazon Redshift Catalog and Governance. He is passionate about creating reliable, scalable infrastructure solutions for distributed analytics workloads and enterprise data mesh architectures.

Ramchandra Anil Kulkarni

Ramchandra Anil Kulkarni

Anil is a Senior Software Engineer at Amazon Redshift with expertise in the Governance and Query Processing areas. He is passionate about distributed systems and solving impactful problems for AWS customers.

Ning Di

Ning Di

Ning is a Senior Software Development Engineer at Amazon Redshift, driven by a genuine passion for exploring all aspects of technology.

The collective thoughts of the interwebz