How to accelerate security finding reviews using automated business context validation in AWS Security Hub

Post Syndicated from Reetesh Surjani original https://aws.amazon.com/blogs/security/how-to-accelerate-security-finding-reviews-using-automated-business-context-validation-in-aws-security-hub/

Security teams must efficiently validate and document exceptions to AWS Security Hub findings, while maintaining proper governance. Enterprise security teams need to make sure that exceptions to security best practices are properly validated and documented, while development teams need a streamlined process for implementing and verifying compensating controls.

In this blog post, we show you an automated solution that’s ideal for organizations using AWS Security Hub that need to manage security exceptions at scale while maintaining governance controls. It’s particularly valuable for enterprises that have complex compliance requirements and multiple development teams. By implementing this solution, you can accelerate the Security Hub findings review process while maintaining proper security governance and providing clear business context for security exceptions.

Note: The solution in this post is provided as a reference architecture and should not be implemented as-is in production environments. Organizations must thoroughly review, customize, and enhance this solution to align with their specific security requirements, compliance frameworks, governance policies, and risk tolerance. Engage with your security, compliance, and legal teams before deploying this automated security validation solution.

The challenge

Security Hub provides a comprehensive view of your AWS security posture across AWS accounts. However, in real-world scenarios, you’ll encounter legitimate business reasons for exceptions to security best practices. For example:

Managing exceptions to security best practices can be challenging and typically involve multiple steps. Security teams spend significant time reviewing exception requests and defining and validating compensating controls, and developers must then implement and validate those controls. Multiple teams must be included to create and manage documentation for compliance and audit purposes. Overall, this process, if done manually, is time intensive, error-prone (with a risk of missing implementation issues), and has a risk of poor visibility because of limited or missing documentation of the business context in the security findings.

Solution prerequisites

For this solution, you must have the following elements in place:

aws securityhub enable-security-hub

  • AWS Config is recommended for enhanced validation capabilities
aws configservice put-configuration-recorder \
    --configuration-recorder name=default,roleARN=arn:aws:iam::ACCOUNT_ID:role/aws-service-role/config.amazonaws.com/AWSServiceRoleForConfig

Automated validation

The solution includes a pre-deployment validation script (validate-environment.sh) that automatically verifies the following:

  • Tool versions and installations
  • AWS service enablement status
  • Resource conflicts

This validation runs automatically during deployment (Integrated in deploy.sh script) to help make sure that required prerequisites are met before infrastructure creation begins.

Additional resources

See the Cost Estimation Guide for a detailed pricing breakdown of prerequisites and the  Troubleshooting Guide for common setup issues and solutions.

Solution overview

This solution provides sample code and CloudFormation templates that organizations can deploy to automate the validation of compensating controls for suppressed Security Hub findings while maintaining proper segregation of duties between the security and development teams.

Architecture
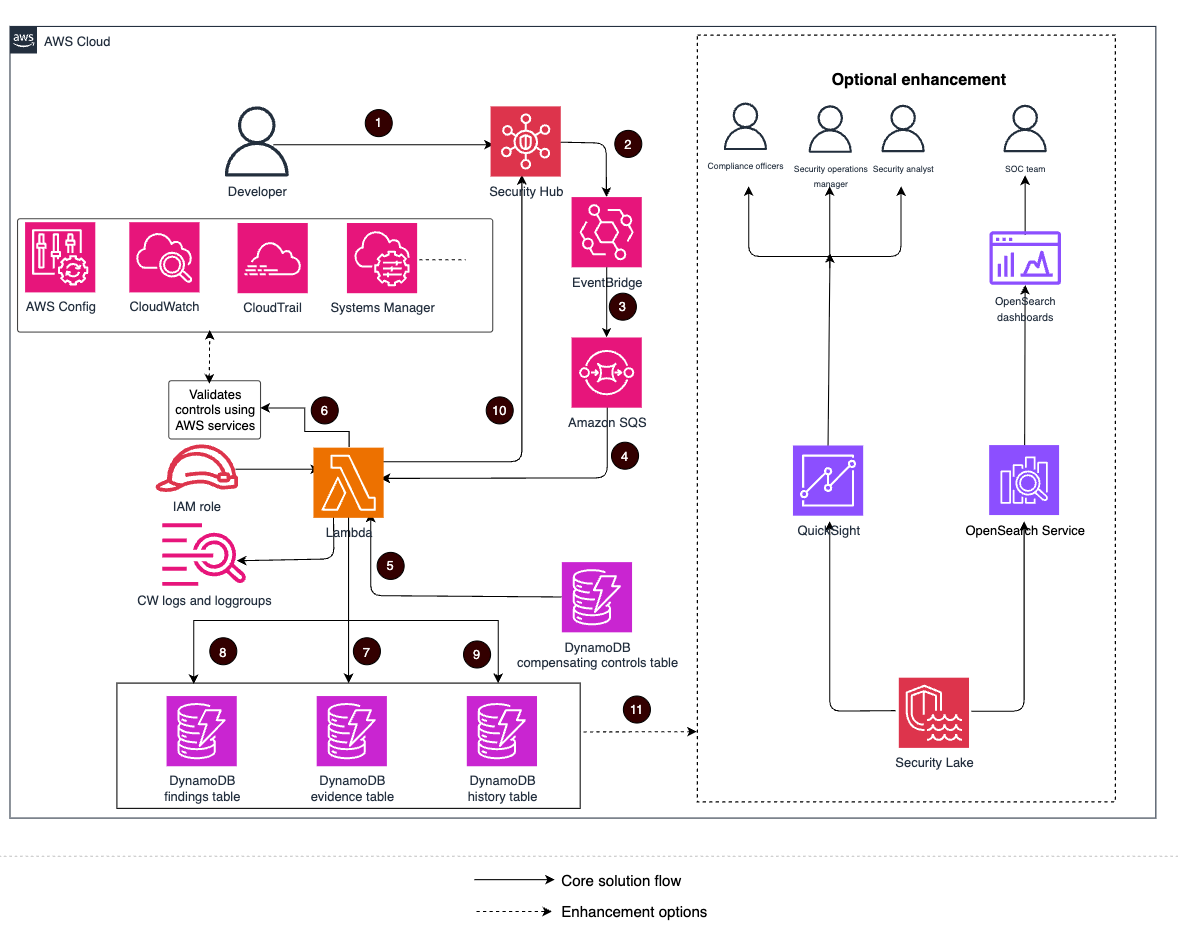
Figure 1: Solution architecture diagram

Figure 1: Solution architecture diagram

Figure 1 illustrates the solution workflow that’s initiated when a developer changes a Security Hub finding’s workflow status to SUPPRESSED to request a business-justified security exception. The process concludes with the solution adding validation results as notes to the respective Security Hub finding, maintaining a complete audit trail of the exception request and validation outcome.

Note: Before initiating this workflow, developers must first consult with their organization’s security team to explain their business justification for the exception. During this initial consultation, the security team defines required compensating controls for the finding type. The security team uses the add-controls-role-based.sh script to add controls to DynamoDB. A developer enables the required compensating controls before proceeding with the workflow status change.

The workflow shown in Figure 1 includes the following steps:

  1. A developer changes the Security Hub finding status to SUPPRESSED.
  2. EventBridge detects the status change to SUPPRESSED.
  3. An EventBridge rule sends an event to the Amazon SQS queue.
  4. A Lambda function retrieves messages from the Amazon SQS queue.
  5. The Lambda function fetches compensating controls from the DynamoDB compensating controls table.
  6. The Lambda function validates each control using the appropriate AWS services APIs.
  7. Evidence is collected for each validation and stored in DynamoDB.
  8. Findings validation results and timestamps are stored in the DynamoDB Findings table.
  9. A versioned history of finding validation attempts is stored in the DynamoDB History table.
  10. If the security team provided controls pass validation, the finding remains SUPPRESSED, and a note is added in the respective Security Hub finding with adjusted severity information (the original severity assigned by Security Hub isn’t changed by this solution). If one of these control fails validation, finding status is changed to NOTIFIED, and a note is added in the respective Security Hub finding of failed controls (the original severity assigned by Security Hub isn’t changed by this solution).
  11. OPTIONAL: Extend the solution with Amazon OpenSearch for SOC teams to perform advanced search, correlation, and visualization of validation evidence across findings, and historical trend analysis of compensating control effectiveness. Use Amazon QuickSight for visualization of compliance metrics, and AWS Security Lake to centralize validation data across multiple accounts and Regions, standardizing it in OCSF format for comprehensive cross-account analysis and long-term compliance reporting.

Note: This solution should be deployed in accordance with your organization’s security policies and the AWS Shared Responsibility Model. Review and test security controls before deploying in production environments.

How it works

This solution is designed exclusively for deployment and management by organizational security teams. Only security teams should have permissions to deploy the AWS CloudFormation stack, modify Lambda validation code, add/modify compensating controls, or access the four DynamoDB tables (Controls, Findings, History, Evidence).

Developers are restricted to two specific actions: suppressing Security Hub findings and reading compensating control requirements. This strict role separation facilitates proper governance and helps prevent bypass of security validation logic. Organizations must implement appropriate IAM policies to enforce these access restrictions in production environments.

Here’s how the solution works:

  1. The security team defines controls: A Security team establishes compensating controls for specific Security Hub finding types and stores them in a DynamoDB table. This helps make sure that approved exceptions follow security-approved guidelines and maintain compliance standards.
    • Key files for security teams:
    • File Purpose
      add-controls-role-based.sh

      Utility script for adding compensating controls
      /templates/findings/*.json

      Example compensating controls for reference
      /docs/guides/compensating-controls.md

      Guide for defining controls
    • Supported validation Types: The solution supports 13 validation methods to accommodate diverse security requirements:
    Validation type Description Example use case
    CONFIG_RULE

    Validates using AWS Config rules For GuardDuty not enabled finding: vpc-flow-logs-enabled Config rule helps make sure that network traffic is monitored
    API_CALL

    Validates using direct AWS API calls For Amazon S3 public access finding: API call to verify CloudFront distribution exists in front of the S3 bucket
    SECURITY_HUB_CONTROL

    Validates using Security Hub control status For GuardDuty not enabled finding: CloudTrail.1 control passing confirms comprehensive API logging
    CLOUDWATCH

    Validates using CloudWatch alarms For GuardDuty not enabled finding: Alarms monitoring for suspicious API calls and network traffic patterns
    CLOUDTRAIL

    Validates CloudTrail configuration For GuardDuty not enabled finding: Multi-Region CloudTrail with log validation and CloudWatch integration
    SYSTEMS_MANAGER

    Validates using Systems Manager parameters For GuardDuty not enabled finding: Parameter confirming custom threat detection solution is enabled
    PROCESS_CONTROL

    Validates process-based controls For GuardDuty not enabled finding: Documented incident response process for network security events
    INSPECTOR

    Validates Amazon Inspector configuration For vulnerability finding: Inspector EC2 scanning enabled with zero critical findings allowed
    ACCESS_ANALYZER

    Validates AWS IAM Access Analyzer For IAM permission finding: IAM Access Analyzer enabled with zero active findings allowed
    MACIE

    Validates Amazon Macie configuration For data protection finding: Macie enabled with sensitive data discovery and zero sensitive buckets allowed
    AUDIT_MANAGER

    Validates AWS Audit Manager frameworks For compliance finding: Custom security framework active with required control sets
    EVENTBRIDGE

    Validates EventBridge rules For GuardDuty not enabled finding: Rules monitoring AWS CloudTrail events with Lambda targets for automated response
    TRUSTED_ADVISOR

    Validates AWS Trusted Advisor checks For security best practice finding: S3 bucket permissions check passing with zero warnings or error resources

    Note: Only security team members have access to add or modify compensating controls. The solution enforces this through IAM permissions and runtime checks to maintain proper governance.

    Approved security exceptions must have an expiration date to facilitate periodic review. The solution automatically enforces these time limits based on the expiration date defined by the security team.

    For this post, we provide a utility script (add-controls-role-based.sh) to demonstrate adding compensating controls. However, in a production enterprise environment, organizations should integrate DynamoDB with their existing governance systems (such as Jira, ServiceNow, and so on) to automatically populate controls from authorized security team sources. This solution focuses on validating controls, not prescribing how they’re ingested.

    2. Developers implement controls: When Security Hub findings are suppressed, developers must implement the required compensating controls defined by the security team.

    How developers interact with the solution:

    1. View required controls: The solution provides clear requirements for each finding type.
    2. Implement compensating controls: Developers should implement the security team provided compensating controls in their AWS environment, referring to the compensating controls defined by Security team. The specific compensating controls depend on the finding type and security team requirements.
    3. Finding status change: Developers change the Security Hub finding status to SUPPRESSED in Security Hub.
    4. Automatic validation: The solution validates compensating controls when Security Hub findings workflow status is changed.
    5. Status updates: Findings remain SUPPRESSED if controls pass validation; they change to NOTIFIED with failure details if validation fails.

    Note: This solution doesn’t modify the original severity of findings in Security Hub. It adds business context with security-approved adjusted severity to findings based on security-approved compensating controls validation, helping security teams make informed decisions.

    For this solution, we’re simulating the developer workflow of addressing Security Hub findings by implementing and validating compensating controls. In a production environment, developers would receive notifications about findings that require attention, implement the necessary controls according to security team guidance, and use this validation system to verify their implementations. The solution focuses on the validation aspect but assumes organizations will integrate it with their existing developer workflows, ticketing systems, and continuous integration and delivery (CI/CD) pipelines to create a seamless process from finding detection to remediation verification.

    Evidence collection and audit trail

    The solution automatically captures comprehensive evidence for each validation activity. The key features of the solution are:

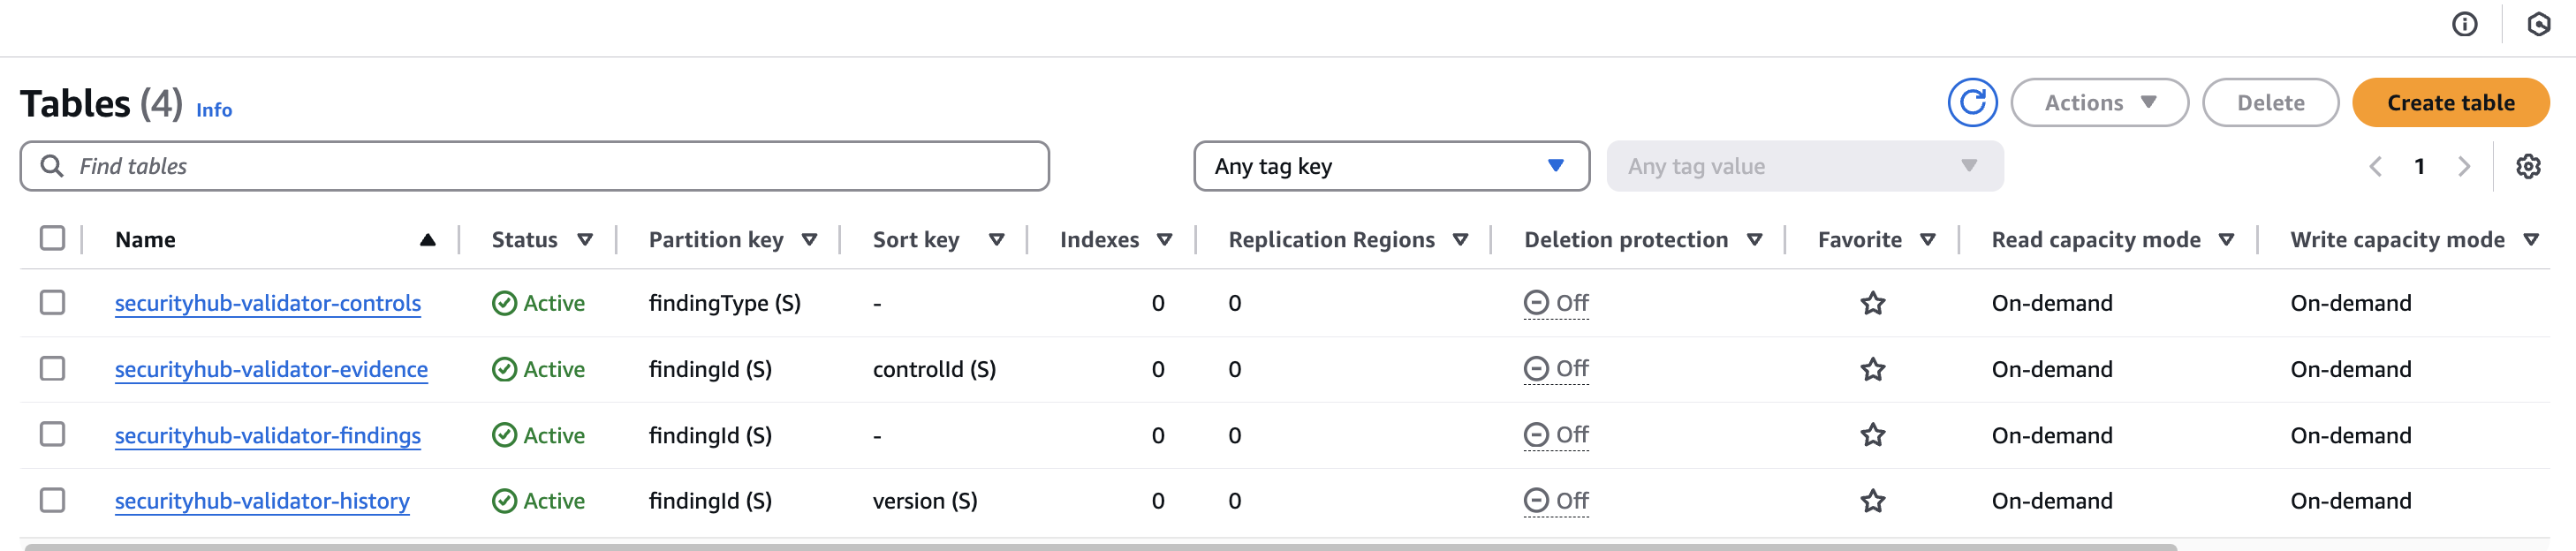
    1. Four-table design: Separate tables for Controls, Findings, History, and Evidence (shown in Figure 2) provide security through segregation while maintaining a complete audit trail
    2. Figure 2: The four-table design for storing compensating controls, evidence, findings, and history

      Figure 2: The four-table design for storing compensating controls, evidence, findings, and history

    3. Detailed evidence: Each validation stores specific evidence based on its type—from AWS Config rule compliance details to API responses and process documentation verification
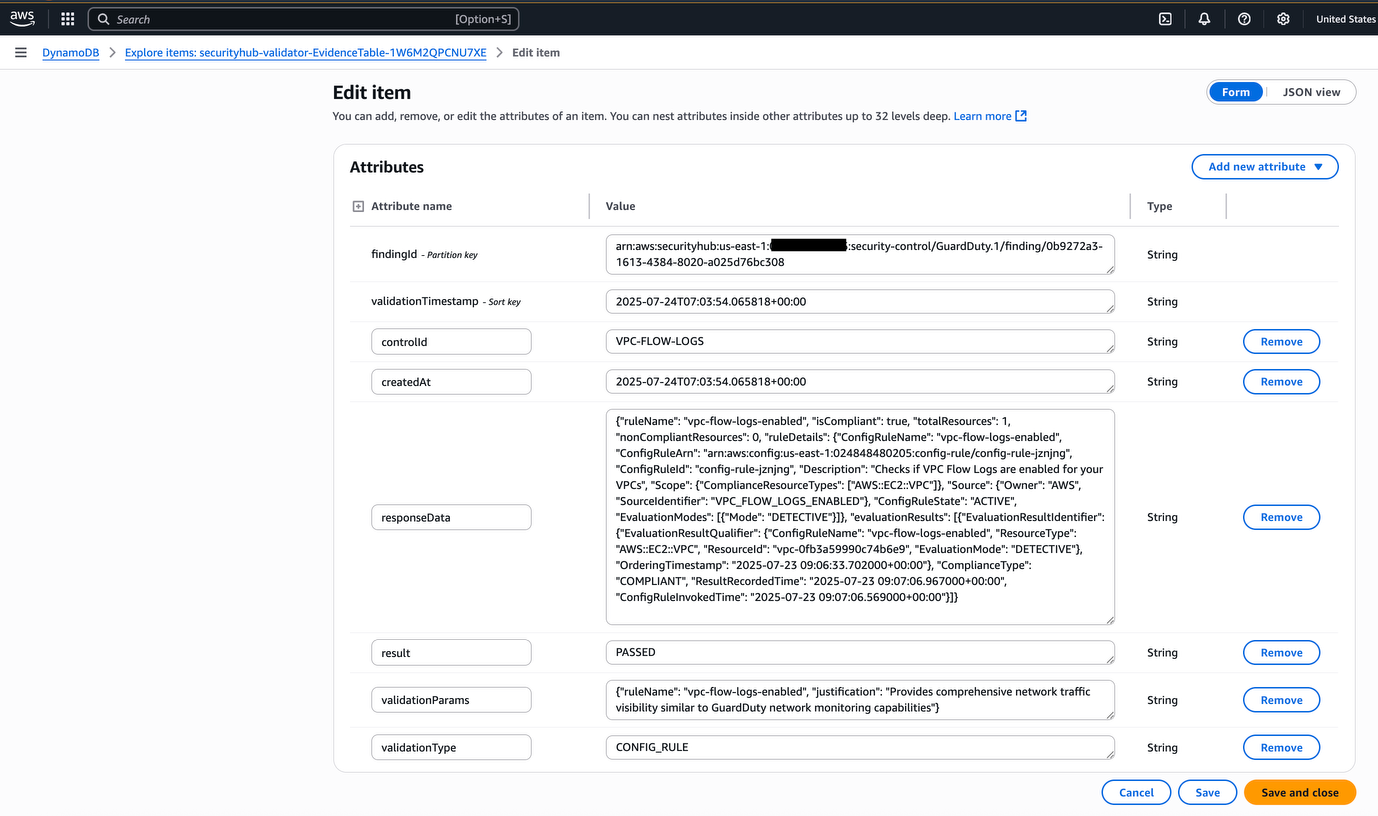
    4. Immutable records: Each evidence includes timestamps, validation context, and results that cannot be modified after collection (shown in Figure 3)
    5. Figure 3: Sample evidence collected for a CONFIG_RULE validation showing PASSED status

      Figure 3: Sample evidence collected for a CONFIG_RULE validation showing PASSED status

    6. Historical tracking: The solution maintains a complete history of each validation attempt, allowing organizations to demonstrate continuous compliance over time

    Deployment and configuration

    You can deploy the solution using the provided scripts.

    1. Use the following command to clone the repository:
    2. git clone https://github.com/aws-samples/sample-automated-securityhub-validator.git
      cd automated-securityhub-validator

    3. Use the following command to check service quotas and to create the security team and developer roles:
    4. cd scripts
      ./create-roles-quotas-check.sh

    5. Use the following command to assume the security team role:
    aws sts assume-role --role-arn arn:aws:iam:: ACCOUNT_ID:role/securityhub-validator-SecurityTeamRole --role-session-name SecurityTeamSession

    In the preceding command’s output, note the AccessKeyId, SecretAccessKey, and SessionToken. The timestamp in the expiration field is in the UTC time zone and shows when the IAM role’s temporary credentials expire. After the temporary credentials expire, the user must assume the role again.

    Note: For temporary credentials, you can use the DurationSeconds parameter to increase the maximum session duration for IAM roles.

    1. Create environment variables to assume the security team role and verify user assumed the IAM role:
      • Run the following commands to set the environment variables to assume the IAM role:
      export AWS_ACCESS_KEY_ID=RoleAccessKeyID
      export AWS_SECRET_ACCESS_KEY=RoleSecretKey
      export AWS_SESSION_TOKEN=RoleSessionToken

      Note: Replace the example values with the values that you noted when you assumed the IAM role. For Windows (OS, replace export with set.

      • Run the get-caller-identity command to verify that the user assumed the IAM role:

      aws sts get-caller-identity

      Note: In the preceding command’s output, confirm that the ARN is arn:aws:sts::ACCOUNT_ID:assumed-role/securityhub-validator-SecurityTeamRole/SecurityTeamSession instead of arn:aws:iam::ACCOUNT_ID:user/username.

      1. Use the following command to deploy the solution:
      cd scripts
      ./deploy.sh

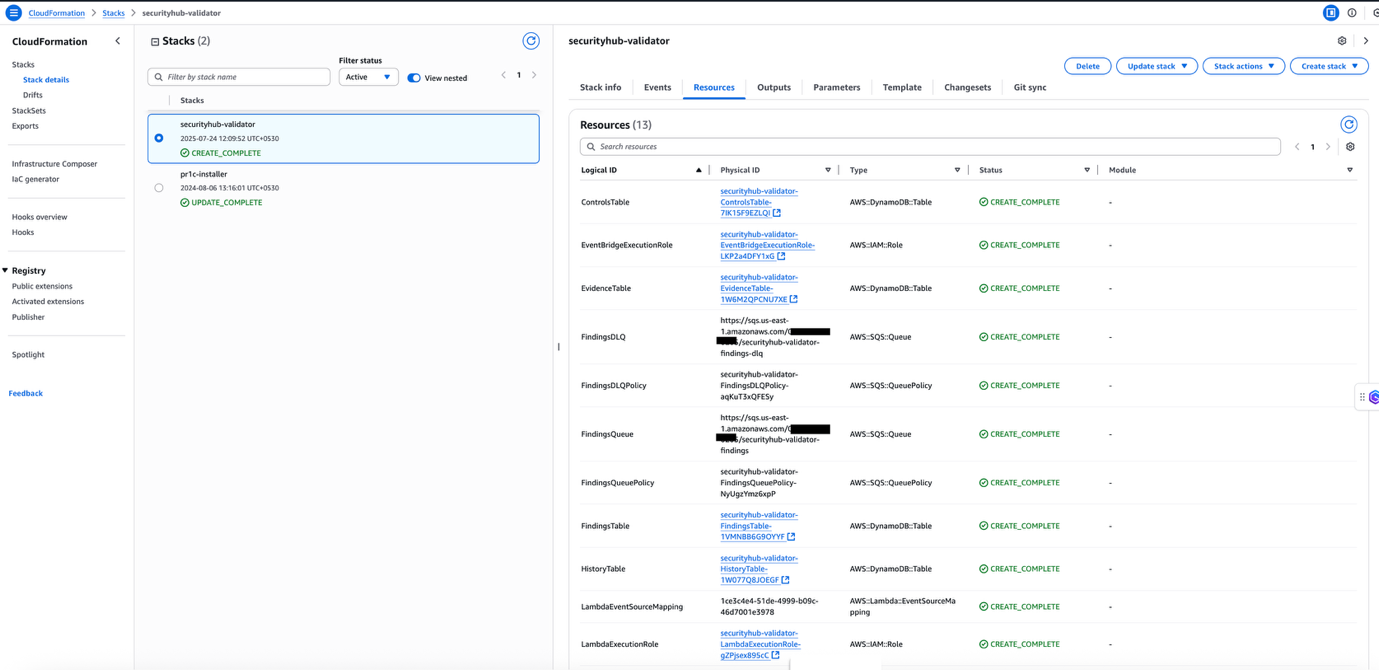
      1. You can verify that the stack has been created by going to the AWS Management Console for CloudFormation and using the following steps:
        1. In the CloudFormation console, choose Stacks and then Stack details in the navigation pane.
        2. Locate and select the stack securityhub-validator to open its details page.
        3. On the stack details page, select the Resources tab.
        4. In the Resources section, you’ll see a list of the resources that are part of the stack.
      Figure 4: Resources created using the CloudFormation stack

      Figure 4: Resources created using the CloudFormation stack

      The deployment script creates a CloudFormation stack with the necessary resources:

      • DynamoDB tables for controls, findings, history, and evidence
      • A Lambda function for validation and Security Hub updates
      • An EventBridge rule for capturing finding status changes
      • An Amazon SQS queue and dead letter queue (DLQ) for message processing
      • IAM roles with least privilege permissions
      1. Add compensating controls (security team):
      cd scripts
      ./add-controls-role-based.sh

      1. Implement controls (developers).

      Now, a developer will assume the developer role and implement the required controls based on the security team’s specifications. The solution automatically validates these implementations when the Security Hub finding workflow status is changed to SUPPRESSED by a developer.

      For an example implementations of common controls, see the example of compensating controls for GuardDuty.1 finding.

      Test the solution

      To test the solution, you can validate the compensating controls for a GuardDuty finding using the following example scenario:

      A developer wants a security exception for the Security Hub finding GuardDuty.1: GuardDuty should be enabled, and because of cost constraints, the developer’s organization hasn’t implemented GuardDuty and requested a security exception from their organization’s security team.

      Compensating controls provided by the security team include:

      Note: To simulate this finding, do not enable GuardDuty so that the GuardDuty should be enabled finding appears in the Security Hub console.

      Approximately 20–30 mins after enabling AWS Config and Security Hub, you can locate the finding in the console using the following steps and then add the compensating controls provided by the security team.

      For this use case, we’re using the GuardDuty should be enabled Security Hub finding:

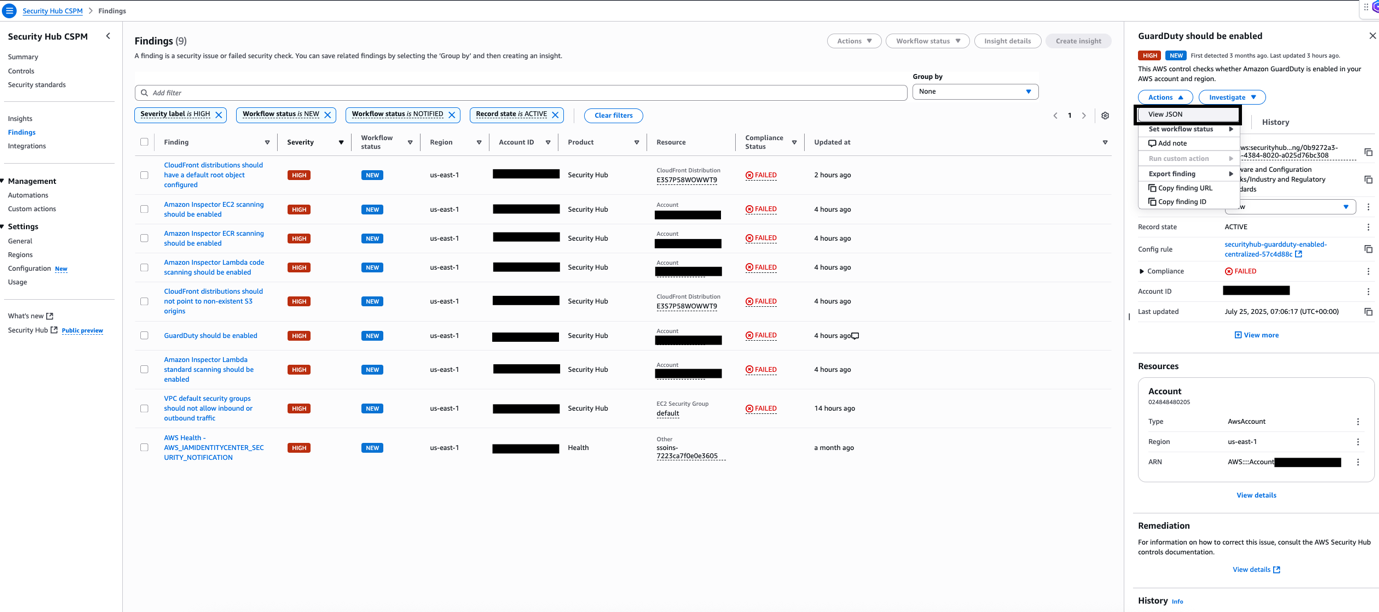
      1. Navigate to the AWS Security Hub console and choose Findings in the navigation pane.
      2. In the Add filter search bar at the top, select Severity label and set the is value to HIGH.
      3. After applying the filter, select GuardDuty should be enabled in the Finding column to view its details in the righthand pane.
      4. Choose Actions in the top-right corner and select View JSON.
      Figure 5: Security Hub findings

      Figure 5: Security Hub findings

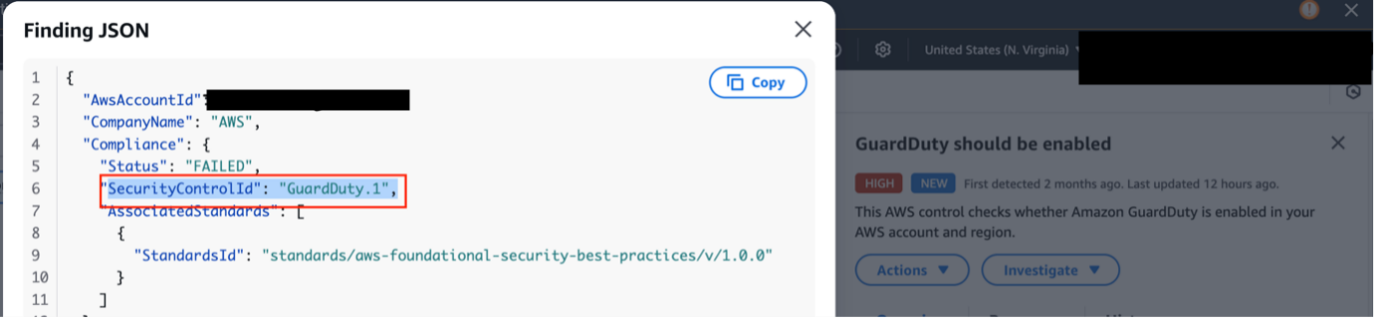
      1. In the JSON details window, locate the SecurityControlId field and note the value. You’ll be prompted to enter it by the add-controls-role-based.sh utility in the next step.

      Note: The SecurityControlId value is required by the add-controls-role-based.sh utility to properly associate your compensating control with the correct Security Hub finding.

      Figure 6: SecurityControlId from the GuardDuty finding

      Figure 6: SecurityControlId from the GuardDuty finding

      1. Use the following command to clone the repository:
      git clone https://github.com/aws-samples/sample-automated-securityhub-validator.git
      cd sample-automated-securityhub-validator

      1. For this demo, you will act as a member of the security team by assuming security team role and use the add-controls-role-based.sh utility to create compensating controls and push them to the compensating control DynamoDB table.
      cd sample-automated-securityhub-validator/scripts
      ./add-controls-role-based.sh

      1. Use the following prompt values in add-controls-role-based.sh to create compensating control table entries using four compensating controls given by the security team for the GuardDuty.1 finding type:
      ./add-controls-role-based.sh
      Security Team - Compensating Controls Management Utility
      --------------------------------------------------------
      SECURITY NOTICE: This utility is restricted to security team members only
      Validating security team role...
      ✓ Security team role validated: arn:aws:sts::xxxxxxxxxxx:assumed-role/securityhub-validator-SecurityTeamRole/SecurityTeamSession
      Using AWS Region: us-east-1
      Using stack: securityhub-validator
      Using controls table: securityhub-validator-ControlsTable-ARDQCU67CBCN
      Enter finding type (e.g., GuardDuty.1): GuardDuty.1
      Security approved adjusted risk level [CRITICAL/HIGH/MEDIUM/LOW/INFORMATIONAL]: MEDIUM
      Expiration date (YYYY-MM-DD): 2026-12-31
      Ticket reference: JIRA-SEC-1234
      Business justification: Alternative monitoring solution provides equivalent detection capabilities
      Adding Control #1
      Control ID: VPC-FLOW-LOGS
      Control description: VPC Flow logs must be enabled for network monitoring 
      Validation type [CONFIG_RULE/API_CALL/SECURITY_HUB_CONTROL/INSPECTOR/ACCESS_ANALYZER/CLOUDTRAIL/MACIE/AUDIT_MANAGER/CLOUDWATCH/SYSTEMS_MANAGER/EVENTBRIDGE/TRUSTED_ADVISOR/PROCESS_CONTROL]: CONFIG_RULE
      Config rule name (exact name): vpc-flow-logs-enabled
      Description of how this rule mitigates the finding: Provides comprehensive network traffic visibility similar to GuardDuty's network monitoring capabilities
      Add another control? [y/n]: y
      Adding Control #2
      Control ID: SECURITY-ALARMS
      Control description: CloudWatch alarms for suspicious activity
      Validation type [CONFIG_RULE/API_CALL/SECURITY_HUB_CONTROL/INSPECTOR/ACCESS_ANALYZER/CLOUDTRAIL/MACIE/AUDIT_MANAGER/CLOUDWATCH/SYSTEMS_MANAGER/EVENTBRIDGE/TRUSTED_ADVISOR/PROCESS_CONTROL]: CLOUDWATCH
      Alarm name pattern: SecurityMonitoring-
      Required metrics (comma-separated): UnauthorizedAPICalls,NetworkPortProbing
      Required alarm state [ALARM/OK/INSUFFICIENT_DATA/ANY]: ANY
      Minimum number of matching alarms required: 2
      Description of how these alarms mitigate the finding: Alarms detect suspicious API calls and network activity similar to GuardDuty's threat detection
      Add another control? [y/n]: n
      Generated controls:
      {
        "findingType": {
          "S": "GuardDuty.1"
        },
        "securityApprovedAdjustedRiskLevel": {
          "S": "MEDIUM"
        },
        "expirationDate": {
          "S": "2026-12-31T00:00:00Z"
        },
        "ticketReference": {
          "S": "JIRA-SEC-1234"
        },
        "businessJustification": {
          "S": "Alternative monitoring solution provides equivalent detection capabilities"
        },
        "auditInfo": {
          "S": "{\"createdBy\":\"arn:aws:sts::xxxxxxxxxxx:assumed-role/securityhub-validator-SecurityTeamRole/SecurityTeamSession\",\"createdAt\":\"2025-08-05T08:49:51Z\",\"lastModifiedBy\":\"arn:aws:sts::xxxxxxxxxxx:assumed-role/securityhub-validator-SecurityTeamRole/SecurityTeamSession\",\"lastModifiedAt\":\"2025-08-05T08:49:51Z\"}"
        },
        "securityControlHash": {
          "S": "a0b33a0a96a6b282bad1c093586d89cef832d40bb379abd4a004d00afdf603d1"
        },
        "requiredControls": {
          "S": "[{\"controlId\":\"VPC-FLOW-LOGS\",\"description\":\"VPC Flow logs must be enabled for network monitoring\",\"validationType\":\"CONFIG_RULE\",\"validationParams\":{\"ruleName\":\"vpc-flow-logs-enabled\",\"justification\":\"Provides comprehensive network traffic visibility similar to GuardDuty's network monitoring capabilities\"}},{\"controlId\":\"SECURITY-ALARMS\",\"description\":\"CloudWatch alarms for suspicious activity\",\"validationType\":\"CLOUDWATCH\",\"validationParams\":{\"alarmNamePattern\":\"SecurityMonitoring-\",\"requiredMetrics\":[\"UnauthorizedAPICalls\",\"NetworkPortProbing\"],\"requiredState\":\"ANY\",\"minimumAlarms\":2,\"justification\":\"Alarms detect suspicious API calls and network activity similar to GuardDuty's threat detection\"}}]"
        }
      }
      Save to DynamoDB? [y/n]: y
      Compensating controls saved to DynamoDB!
      This action has been logged for audit purposes.

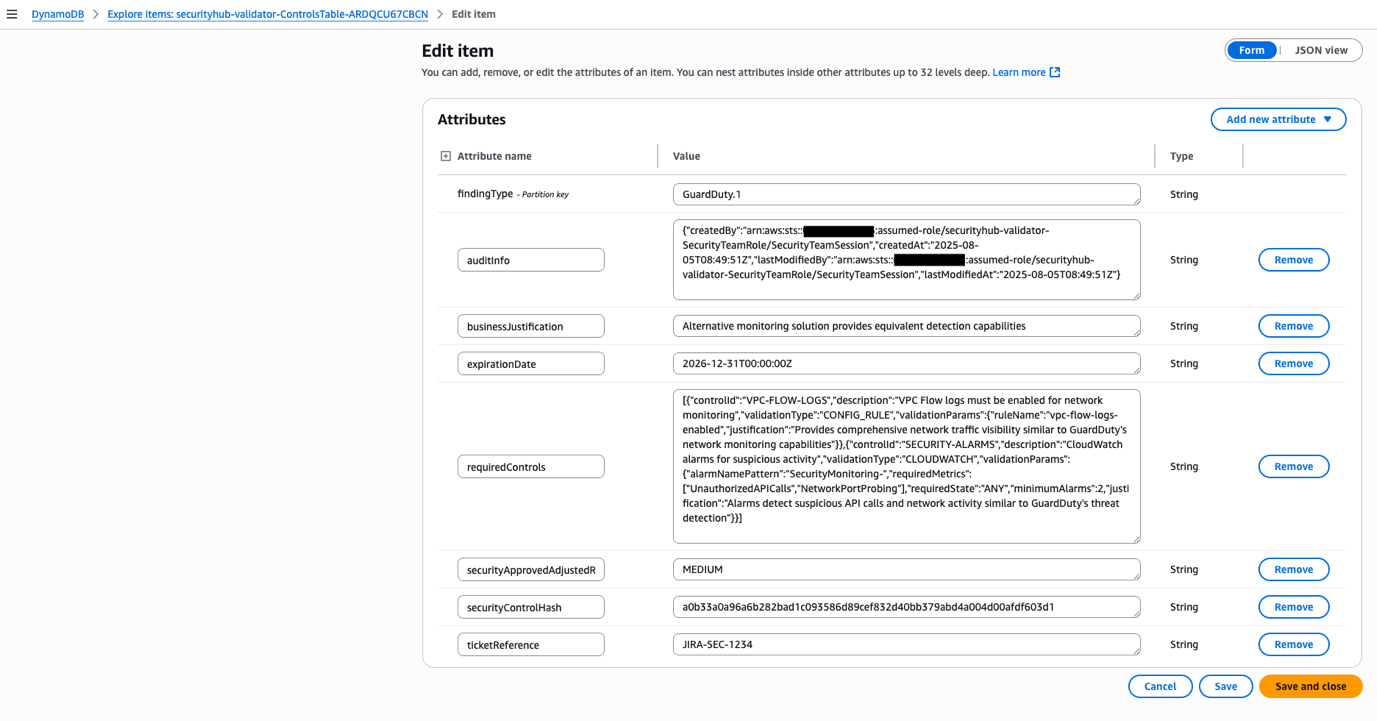
      1. When prompted to save to DynamoDB, enter Y. Compensating controls will be added to the DynamoDB compensating controls table.
      Figure 7: Compensating controls for GuardDuty.1 finding

      Figure 7: Compensating controls for GuardDuty.1 finding

      1. For this proof-of-concept demonstration, the compensating controls implementation requires additional AWS permissions beyond what the developer role provides. In a production environment, these controls would typically be implemented by infrastructure teams or through automated deployment pipelines.
      • Switch to administrative credentials.
      • For the demonstration, temporarily switch back to your administrative AWS credentials (the ones used to create the roles):

        Unset the security team role credentials

        unset AWS_ACCESS_KEY_ID AWS_SECRET_ACCESS_KEY AWS_SESSION_TOKEN

      • Implement the required controls

      Control 1: Enable VPC Flow Logs, starting by getting your VPC IDVPC_ID=$(aws ec2 describe-vpcs --query 'Vpcs[0].VpcId' --output text)

      Create flow logs:

      aws ec2 create-flow-logs \
          --resource-type VPC \
          --resource-ids $VPC_ID \
          --traffic-type ALL \
          --log-destination-type cloud-watch-logs \
          --log-group-name VPCFlowLogs

      Create the AWS Config Rule:

      aws configservice put-config-rule \
          --config-rule '{
              "ConfigRuleName": "vpc-flow-logs-enabled",
              "Source": {
                  "Owner": "AWS",
                  "SourceIdentifier": "VPC_FLOW_LOGS_ENABLED"
              }
          }'

      Control 2: Create security monitoring alarms starting with creating metric filters for CloudTrail Logs; start by creating a log group for CloudTrail (if none exists):aws logs create-log-group --log-group-name CloudTrail/SecurityEventsCreate a metric filter for unauthorized API calls:

      aws logs put-metric-filter \
          --log-group-name CloudTrail/SecurityEvents \
          --filter-name UnauthorizedAPICallsFilter \
          --filter-pattern '{ ($.errorCode = "*UnauthorizedOperation") || ($.errorCode = "AccessDenied*") }' \
          --metric-transformations metricName=UnauthorizedAPICalls,metricNamespace=SecurityMetrics,metricValue=1

      Create a filter for network port probing:

      aws logs put-metric-filter \
          --log-group-name CloudTrail/SecurityEvents \
          --filter-name NetworkPortProbingFilter \
          --filter-pattern '[version, account, eni, source, destination, srcport, destport="22" || destport="3389" || destport="1433", protocol, packets, bytes, windowstart, windowend, action="REJECT", flowlogstatus]' \
          --metric-transformations metricName=NetworkPortProbing,metricNamespace=SecurityMetrics,metricValue=1

      Create required CloudWatch alarms, starting with Alarm 1 for Unauthorized API calls:

      aws cloudwatch put-metric-alarm \
          --alarm-name "SecurityMonitoring-UnauthorizedAPICalls" \
          --alarm-description "Detects unauthorized API calls" \
          --metric-name "UnauthorizedAPICalls" \
          --namespace "SecurityMetrics" \
          --statistic Sum \
          --period 300 \
          --threshold 1 \
          --comparison-operator GreaterThanOrEqualToThreshold \
          --evaluation-periods 1

      Alarm 2: Network port probing:

      aws cloudwatch put-metric-alarm \
          --alarm-name "SecurityMonitoring-NetworkPortProbing" \
          --alarm-description "Detects network port probing activity" \
          --metric-name "NetworkPortProbing" \
          --namespace "SecurityMetrics" \
          --statistic Sum \
          --period 300 \
          --threshold 5 \
          --comparison-operator GreaterThanOrEqualToThreshold \
          --evaluation-periods 1

      1. Now assume the DeveloperRole to suppress the finding:
      aws sts assume-role \
          --role-arn arn:aws:iam::ACCOUNT_ID:role/securityhub-validator-DeveloperRole \
          --role-session-name DeveloperSession

      Configure the returned credentials:

      export AWS_ACCESS_KEY_ID=<from assume-role output>
      export AWS_SECRET_ACCESS_KEY=<from assume-role output>
      export AWS_SESSION_TOKEN=<from assume-role output>

      1. Change the workflow status of the Security Hub finding related to GuardDuty from NEW to SUPPRESSED.

      To change the workflow status using the AWS CLI (developer):

      # Get the finding ARN first (command shown for reference)
      aws securityhub get-findings \
          --filters '{"GeneratorId":[{"Value":"security-control/GuardDuty.1","Comparison":"EQUALS"}]}' \
          --query 'Findings[0].Id'
      # Get the product ARN (command shown for reference)
      aws securityhub get-findings \
          --filters '{"GeneratorId":[{"Value":"security-control/GuardDuty.1","Comparison":"EQUALS"}]}' \
          --query 'Findings[0].ProductArn' \
          --output text
      # Then suppress the finding
      aws securityhub batch-update-findings \
        --finding-identifiers '[{"Id":"finding-arn-from-above","ProductArn":"product-arn-from-above"}]' \
        --workflow '{"Status":"SUPPRESSED"}' \
        --note '{"Text":"Implemented compensating controls as per security team requirements","UpdatedBy":"[email protected]"}'

      To change the workflow status using the console (developer):

      1. Go to the Security Hub console.
      2. In the navigation pane, choose Findings.
      3. In the search bar, select Compliance Security Control ID filter and enter the value of Is as GuardDuty.1.
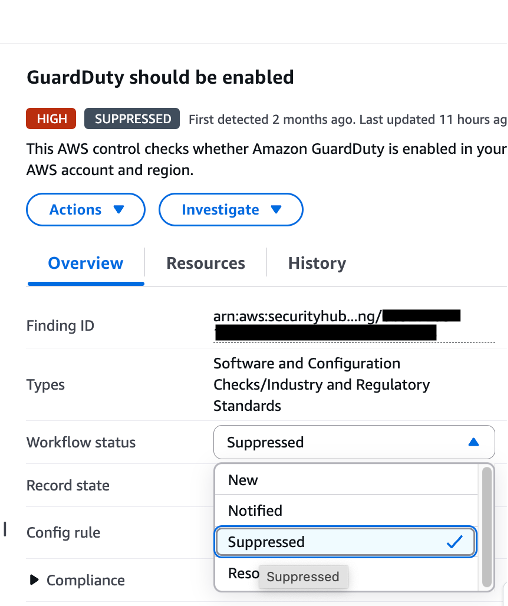
      4. Select the finding GuardDuty should be enabled and under Workflow status, select SUPPRESSED.
      5. In the Note field, enter Implemented compensating controls as per security team requirements.
      6. Choose Set status to save the note.
      Figure 8: GuardDuty.1 finding workflow status changed from NEW to SUPPRESSED

      Figure 8: GuardDuty.1 finding workflow status changed from NEW to SUPPRESSED

      Note: Only suppress findings after implementing the required compensating controls provided by the security team.

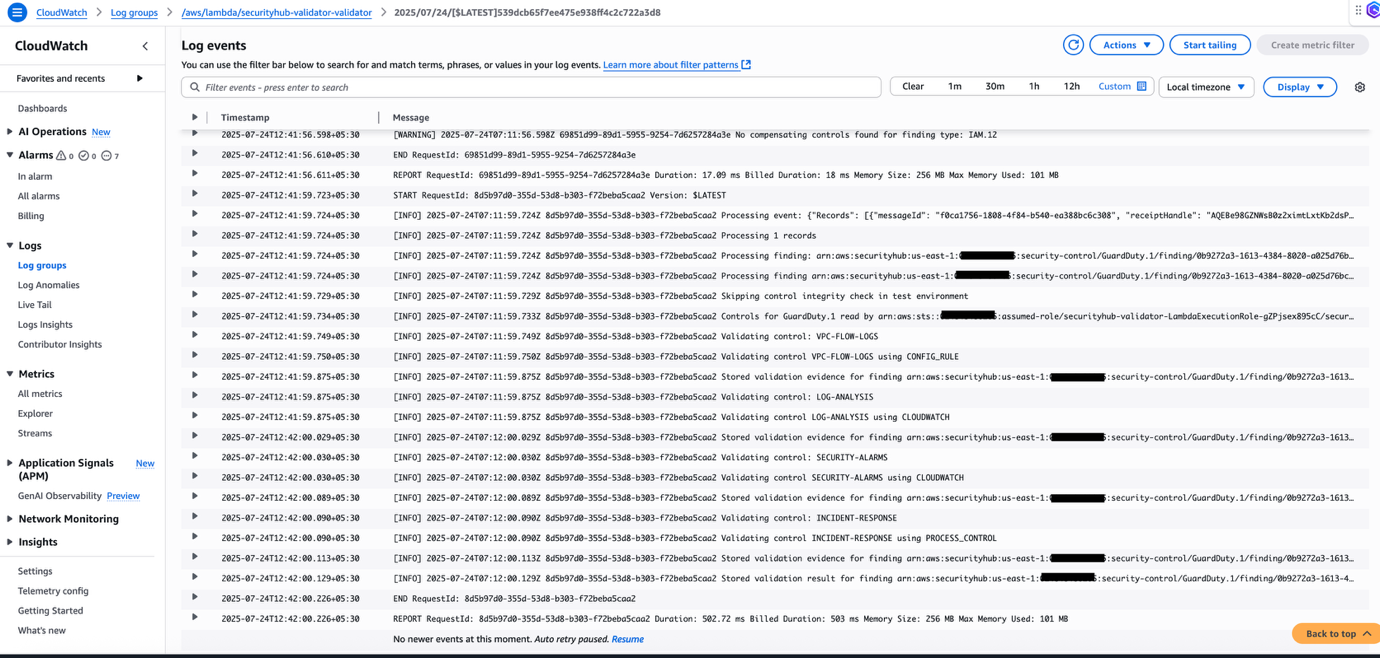
      1. After the Workflow status of the finding is SUPPRESSED, the automated validation process begins and you can see the Lambda function logs in the CloudWatch console related to different validations performed.

      To view Lambda function logs in the CloudWatch console:

      1. Go to the Amazon CloudWatch console.
      2. In the navigation pane, under Logs, choose Log groups.
      3. Select the log group with the Lambda function name.
      4. Select the most recent log stream to view the logs.
      Figure 9: Lambda function CloudWatch logs

      Figure 9: Lambda function CloudWatch logs

      The solution updates the note section of the findings in Security Hub with the validation results:

      If all controls pass:

      • Finding status remains SUPPRESSED.
      • A note is added with validation results and adjusted risk level.
      • Business context is added to the finding.

      If one of the controls fails:

      • Finding status changes to NOTIFIED.
      • A note is added with details about failed controls.
      • The security team reviews the changes as part of their standard process.

      To view the finding’s workflow status and updated note using the console (developer):

      1. Go to the Security Hub console.
      2. In the navigation pane, choose Findings.
      3. In the search bar, select Compliance Security Control ID filter and enter value of Is as GuardDuty.1.
      4. Select the finding GuardDuty should be enabled and check the Workflow status.
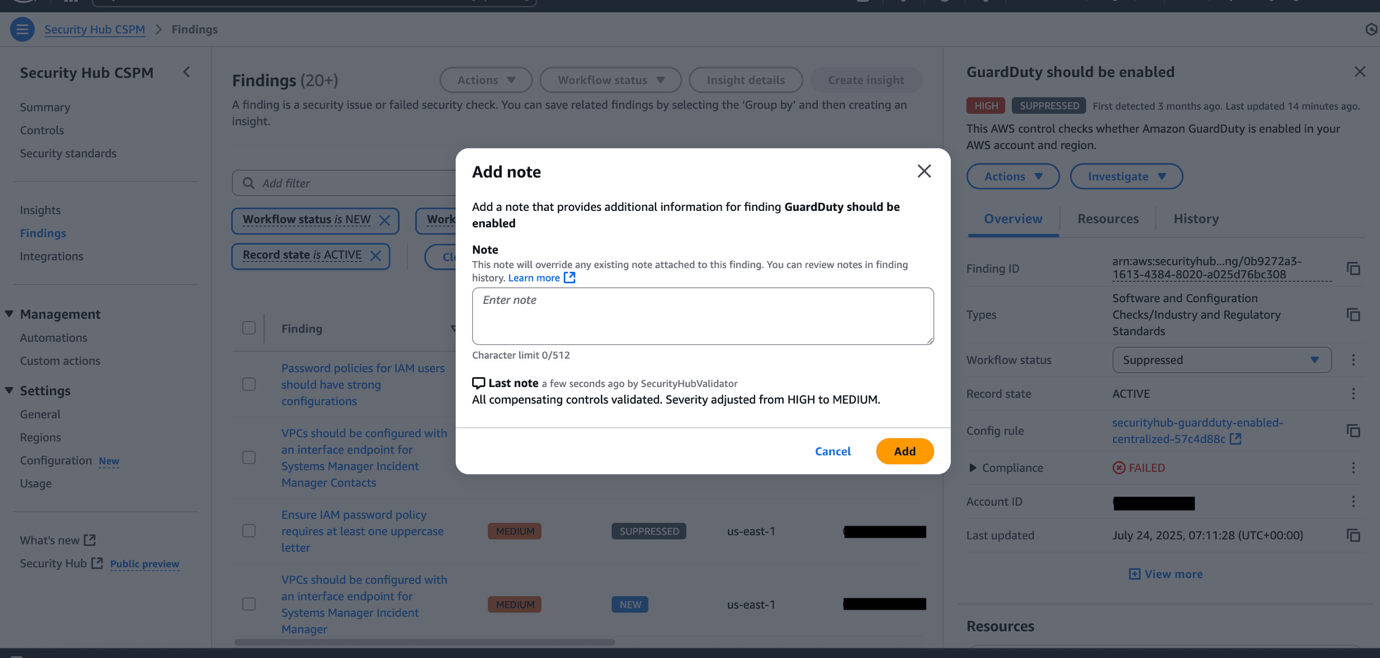
      5. For Actions, choose Add note.
      6. Check the Last note added.
      Figure 10: Security Hub updated finding note

      Figure 10: Security Hub updated finding note

      The finding note shows that automated validation has performed checks and documented the results, also note that the original severity of HIGH that was assigned by Security Hub is maintained and the adjusted severity of MEDIUM that was provided by the security team is added in the Note section and to the Evidence table, providing transparency and accountability while maintaining the original severity assigned by Security Hub.

      Clean up

      To avoid incurring ongoing charges, use the following command to clean up resources created for this post.

      ./cleanup.sh

      This deployment process is designed to be straightforward and to maintain security best practices such as encryption, least privilege, and segregation of duties.

      Conclusion

      In this post, we showed you how to implement a solution that security teams can use to define compensating controls for AWS Security Hub findings and automatically validate their implementation. We walked through the challenges of managing security exceptions and demonstrated how this solution helps to bridge the gap between security requirements and practical implementation.

      The solution provides a structured workflow where security teams define acceptable compensating controls, developers implement them, and an automated system validates their effectiveness. With support for 13 different validation types, from AWS Config rules to process documentation, the solution offers comprehensive coverage for various security scenarios.

      We also demonstrated the end-to-end process of adding compensating controls for a GuardDuty finding and showed how the solution maintains the original finding severity assigned by Security Hub while documenting the adjusted risk level approved by the security team. This approach helps maintain transparency and auditability while allowing for necessary exceptions.

      Give it a try and share your feedback in the comments section.

      Security Implication Disclaimer: The Amazon S3 configurations demonstrated in this post involve public access settings that expose data to the internet and should only be used for demonstration or non-sensitive content. Public S3 buckets carry significant risks including data exposure, unexpected costs from unauthorized usage, compliance violations, and potential security breaches. For production environments, use IAM roles, implement least privilege access policies, enable S3 Block Public Access settings, and consider CloudFront with Origin Access Control for public content delivery. Consult your security team and make sure of compliance with organizational policies before implementing public S3 configurations in production systems.
      Reetesh Surjani

      Reetesh Surjani

      Reetesh is a Delivery Consultant in Security Risk & Compliance at AWS Professional Services, based in Pune, India. He works closely with customers across diverse verticals to help strengthen their security infrastructure and achieve their security goals.

      Satish Kamat

      Satish Kamat

      Satish is a Senior Delivery Consultant in Application Development at AWS Professional Services, based in Pune, India. He works closely with customers in their cloud transformation and migration journeys across various verticals like BFSI, automotive, and telecom.

Scaling Muse: How Netflix Powers Data-Driven Creative Insights at Trillion-Row Scale

Post Syndicated from Netflix Technology Blog original https://netflixtechblog.com/scaling-muse-how-netflix-powers-data-driven-creative-insights-at-trillion-row-scale-aa9ad326fd77

By Andrew Pierce, Chris Thrailkill, Victor Chiapaikeo

At Netflix, we prioritize getting timely data and insights into the hands of the people who can act on them. One of our key internal applications for this purpose is Muse. Muse’s ultimate goal is to help Netflix members discover content they’ll love by ensuring our promotional media is as effective and authentic as possible. It achieves this by equipping creative strategists and launch managers with data-driven insights showing which artwork or video clips resonate best with global or regional audiences and flagging outliers such as potentially misleading (clickbait-y) assets. These kinds of applications fall under Online Analytical Processing (OLAP), a category of systems designed for complex querying and data exploration. However, enabling Muse to support new, more advanced filtering and grouping capabilities while maintaining high performance and data accuracy has been a challenge. Previous posts have touched on artwork personalization and our impressions architecture. In this post, we’ll discuss some steps we’ve taken to evolve the Muse data serving layer to enable new capabilities while maintaining high performance and data accuracy.

Muse application

An Evolving Architecture

Like many early analytics applications, Muse began as a simple dashboard powered by batch data pipelines (Spark¹) and a modest Druid² cluster. As the application evolved, so did user demands. Users wanted new features like outlier detection and notification delivery, media comparison and playback, and advanced filtering, all while requiring lower latency and supporting ever-growing datasets (in the order of trillions of rows a year). One of the most challenging requirements was enabling dynamic analysis of promotional media performance by “audience” affinities: internally defined, algorithmically inferred labels representing collections of viewers with similar tastes. Answering questions like “Does specific promotional media resonate more with Character Drama fans or Pop Culture enthusiasts?” required augmenting already voluminous impression and playback data. Supporting filtering and grouping by these many-to-many audience relationships led to a combinatorial explosion in data volume, pushing the limits of our original architecture.

To address these complexities and support the evolving needs of our users, we undertook a significant evolution of Muse’s architecture. Today’s Muse is a React app that queries a GraphQL layer served with a set of Spring Boot GRPC microservices. In the remainder of this post, we’ll focus on steps we took to scale the data microservice, its backing ETL, and our Druid cluster. Specifically, we’ve changed the data model to rely on HyperLogLog (HLL) sketches, used Hollow for access to in-memory, precomputed aggregates, and taken a series of steps to tune Druid. To ensure the accuracy of these changes, we relied heavily on internal debugging tools to validate pre- and post-changes.

Muse’s Current Architecture

Moving to HyperLogLog (HLL) Sketches for Distinct Counts

Some of the most important metrics we track are impressions, the number of times an asset is shown to a user within a time window, and qualified plays, which links a playback event with a minimum duration back to a specific impression. Calculating these metrics requires counting distinct users. However, performing distinct counts in distributed systems is resource-intensive and challenging. For instance, to determine how many unique profiles have ever seen a particular asset, we need to compare each new set of profile ids with those from all days before it, potentially spanning months or even years.

For performance, we can trade accuracy. The Apache Datasketches library allows us to get distinct count estimates that are within a 1–2% error. This is tunable with a precision parameter called logK (0.8% in our case with logK of 17). We build sketches in two places:

  1. During Druid ingest: we use the HLLSketchBuild aggregator with Druid rollup set to true to reduce our data in preparation for fast distinct counting
  2. During our Spark ETL: we persist precomputed aggregates like all-time impressions per asset in the form of HLL sketches. Each day, we merge a new HLL sketch into the existing one using a combination of hll_union and hll_union_agg (functions added by our very own Ryan Berti)
We use Datasketches in our ETL and serving systems

HLL has been a huge performance boost for us both within the serving and ETL layer. Across our most common OLAP query patterns, we’ve seen latencies reduce by approx 50%. Nevertheless, running APPROX_COUNT_DISTINCT over large date ranges on the Druid cluster for very large titles exhausts limited threads, especially in high-concurrency situations. To further offload Druid query volume and preserve cluster threads, we’ve also relied extensively on the Hollow library.

Hollow as a Read-Only Key Value Store for Precomputed Aggregates

Our in-house Hollow³ infrastructure allows us to easily create Hollow feeds — essentially highly compressed and performant in-memory key/value stores — from Iceberg⁴ tables. In this setup, dedicated producer servers listen for changes to Iceberg tables, and when updates occur, they push the latest data to downstream consumers. On the consumer side, our Spring Boot applications listen to announcements from these producers and automatically refresh in-memory caches with the latest dataset.

This architecture has enabled us to migrate several data access patterns from Druid to Hollow, specifically ones with a limited number of parameter combinations per title. One of these was fetching distinct filter dimensions. For example, while most Netflix-branded titles are released globally, licensed titles often have rights restrictions that limit their availability to specific countries and time windows. As a result, a particular licensed title might only be available to members in Germany and Luxembourg.

Distinct countries queried from a Hollow feed for the assets for Manta Manta

In the past, retrieving these distinct country values per asset required issuing a SELECT DISTINCT query to our Druid cluster. With Hollow, we maintain a feed of distinct dimension values, allowing us to perform stream operations like the one below directly on a cached dataset.

/**
* Returns the possible filter values for a dimension such as countries
*/
public List<Dimension> getDimensions(long movieId, String dimensionId) {
// Access in-memory Hollow feed with near instant query time
Map<String, List<Dimension>> dimensions = dimensionsHollowConsumer.lookup(movieId);
return dimensions.getOrDefault(dimensionId, List.of()).stream()
.sorted(Comparator.comparing(Dimension::getName))
.toList();
}

Although it adds complexity to our service by requiring more intricate request routing and a higher memory footprint, pre-computed aggregates have given us greater stability and performance. In the case of fetching distinct dimensions, we’ve observed query times drop from hundreds of milliseconds to just tens of milliseconds. More importantly, this shift has offloaded high concurrency demands from our Druid cluster, resulting in more consistent query performance. In addition to this use case, cached pre-computed aggregates also power features such as retrieving recently launched titles, accessing all-time asset metrics, and serving various pieces of title metadata.

Tuning Druid

Even with the efficiencies gained from HLL sketches and Hollow feeds, ensuring that our Druid cluster operates performantly has been an ongoing challenge. Fortunately, at Netflix, we are in the company of multiple Apache Druid PMC members like Maytas Monsereenusorn and Jesse Tuğlu who have helped us wring out every ounce of performance. Some of the key optimizations we’ve implemented include:

  • Increasing broker count relative to historical nodes: We aim for a broker-to-historical ratio close to the recommended 1:15, which helps improve query throughput.
  • Tuning segment sizes: By targeting the 300–700 MB “sweet spot” for segment sizes, primarily using the tuningConfig.targetRowsPerSegment parameter during ingestion — we ensure that each segment a single historical thread scans is not overly large.
  • Leveraging Druid lookups for data enrichment: Since joins can be prohibitively expensive in Druid, we use lookups at query time for any key column enrichment.
  • Optimizing search predicates: We ensure that all search predicates operate on physical columns rather than virtual ones, creating necessary columns during ingestion with transformSpec.transforms.
  • Filtering and slimming data sources at ingest: By applying filters within transformSpec.filter and removing all unused columns in dimensionsSpec.dimensions, we keep our data sources lean and improve the possibility of higher rollup yield.
  • Use of multi-value dimensions: Exploiting the Druid multi-value dimension feature was key to overcoming the “many-to-many” combinatorial quandary when integrating audience filtering and grouping functionality mentioned in the “An Evolving Architecture” section above.

Together, these optimizations, combined with previous ones, have decreased our p99 Druid latencies by roughly 50%.

Validation & Rollout

Rolling out these changes to our metrics system required a thorough validation and release strategy. Our approach prioritized both data integrity and user trust, leveraging a blend of automation, targeted tooling, and incremental exposure to production traffic. At the core of our strategy was a parallel stack deployment: both the legacy and new metric stacks operated side-by-side within the Muse Data microservice. This setup allowed us to validate data quality, monitor real-world performance, and mitigate risk by enabling seamless fallback at any stage.

We adopted a two-pronged validation process:

  • Automated Offline Validation: Using Jupyter Notebooks, we automated the sampling and comparison of key metrics across both the legacy and new stacks. Our sampling set included a representative mix: recently accessed titles, high-profile launches, and edge-case titles with unique handling requirements. This allowed us to catch subtle discrepancies in metrics early in the process. Iterative testing on this set guided fixes, such as tuning the HLL logK parameter and benchmarking end-to-end latency improvements.
  • In-App Data Comparison Tooling: To facilitate rapid triage, we built a developer-facing comparison feature within our application that displays data from both the legacy and new metric stacks side by side. The tool automatically highlights any significant differences, making it easy to quickly spot and investigate discrepancies identified during offline validation or reported by users.

We implemented several release best practices to mitigate risk and maintain stability:

  • Staggered Implementation by Application Segment: We developed and deployed the new metric stack in stages, focusing on specific application segments. This meant building out support for asset types like artwork and video separately and then further dividing by CEE phase (Explore, Exploit). By implementing changes segment by segment, we were able to isolate issues early, validate each piece independently, and reduce overall risk during the migration.
  • Shadow Testing (“Dark Launch”): Prior to exposing the new stack to end users, we mirrored production traffic asynchronously to the new implementation. This allowed us to validate real-world latency and catch potential faults in a live environment, without impacting the actual user experience.
  • Granular Feature Flagging: We implemented fine-grained feature flags to control exposure within each segment. This allowed us to target specific user groups or titles and instantly roll back or adjust the rollout scope if any issues were detected, ensuring rapid mitigation with minimal disruption.

Learnings and Next Steps

Our journey with Muse tested the limits of several parts of the stack: the ETL layer, the Druid layer, and the data serving layer. While some choices, like leveraging Netflix’s in-house Hollow infrastructure, were influenced by available resources, simple principles like offloading query volume, pre-filtering of rows and columns before Druid rollup, and optimizing search predicates (along with a bit of HLL magic) went a long way in allowing us to support new capabilities while maintaining performance. Additionally, engineering best practices like producing side-by-side implementations and backwards-compatible changes enabled us to roll out revisions steadily while maintaining rigorous validation standards. Looking ahead, we’ll continue to build on this foundation by supporting a wider range of content types like Live and Games, incorporating synopsis data, deepening our understanding of how assets work together to influence member choosing, and incorporating new metrics to distinguish between “effective” and “authentic” promotional assets, in service of helping members find content that truly resonates with them.

¹ Apache Spark is an open-source analytics engine for processing large-scale data, enabling tasks like batch processing, machine learning, and stream processing.

² Apache Druid is a high-performance, real-time analytics database designed for quickly querying large volumes of data.

³ Hollow is a Java library for efficient in-memory storage and access to moderately sized, read-only datasets, making it ideal for high-performance data retrieval.

⁴ Apache Iceberg is an open-source table format designed for large-scale analytical datasets stored in data lakes. It provides a robust and reliable way to manage data in formats like Parquet or ORC within cloud object storage or distributed file systems.


Scaling Muse: How Netflix Powers Data-Driven Creative Insights at Trillion-Row Scale was originally published in Netflix TechBlog on Medium, where people are continuing the conversation by highlighting and responding to this story.

A scalable, elastic database and search solution for 1B+ vectors built on LanceDB and Amazon S3

Post Syndicated from Audra Devoto original https://aws.amazon.com/blogs/architecture/a-scalable-elastic-database-and-search-solution-for-1b-vectors-built-on-lancedb-and-amazon-s3/

This post was co-authored with Owen Janson, Audra Devoto, and Christopher Brown of Metagenomi.

From CRISPR gene editing to industrial biocatalysis, enzymes power some of the most transformative technologies in healthcare, energy, and manufacturing. But discovering novel enzymes that can transform an industry — such as Cas9 for genome engineering — requires sifting through the billions of diverse enzymes encoded by organisms spanning the tree of life. Advances in DNA sequencing and metagenomics have enabled the growth of vast public and proprietary databases containing known protein sequences, but scanning through these collections to identify high value candidates is fundamentally a big data problem as well as a biological one.

At Metagenomi, we’re developing potentially curative therapeutics by using our extensive metagenomics database (MGXdb) to build a toolbox of novel gene editing systems. In this post, we highlight how Metagenomi is tackling the challenge of enzyme discovery at the billion protein scale by using the scalable infrastructure of Amazon Web Services (AWS) to build a high-performance protein database and search solution based on embeddings. By embedding every protein in our large proprietary database into a vector space, making the data accessible using LanceDB built on Amazon Simple Storage Service (Amazon S3), and accessed with AWS Lambda, we were able to transform enzyme discovery into a nearest neighbor search problem and rapidly access previously unexplored discovery space.

Solution overview

At the core of our solution is LanceDB. LanceDB is an open source vector database that enables rapid approximate nearest neighbor (ANN) searches on indexed vectors. LanceDB is particularly well suited for a serverless stack because it’s entirely file-based and is also compatible with Amazon S3 storage. As a result, we can store our database of embedded protein sequences on relatively low-cost Amazon S3, rather than a persistent disk storage such as Amazon Elastic Block Store (Amazon EBS). Instead of constantly running servers, all that is needed to rapidly query the database on-demand is a Lambda function that uses LanceDB to find nearest neighbors directly from the data on S3.

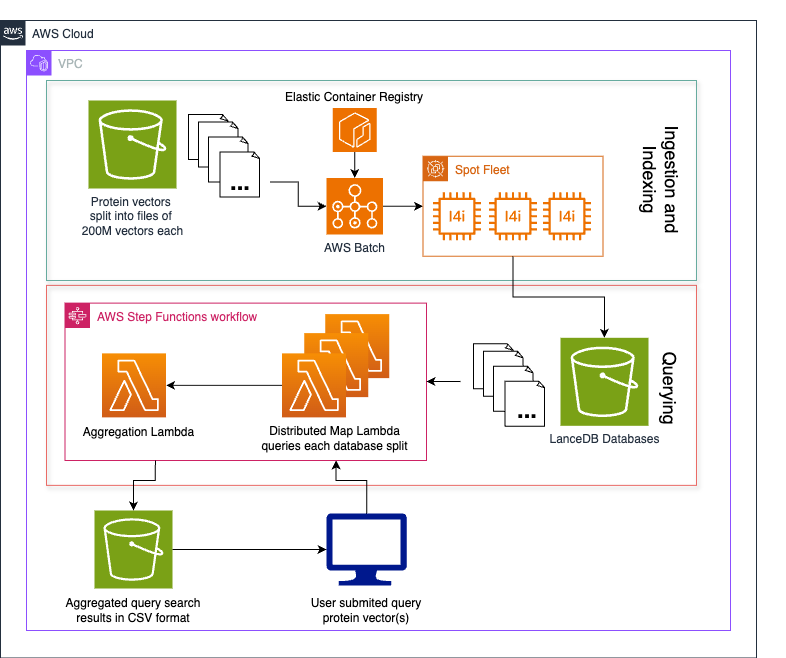
To overcome the challenge of ingesting and querying billions of vector embeddings representing Metagenomi’s large protein database, we devised a method for splitting the database into equal sized parts (folders) stored for low cost on Amazon S3 that can be indexed in parallel and searched with a map-reduce approach using Lambda. The following diagram illustrates this architecture.

AWS architecture showing protein vector processing workflow with ECR, Lambda, and LanceDB

The process follows four steps:

  1. Data vectorization
  2. Data bucketing
  3. Indexing and ingesting data
  4. Querying the database

Data vectorization

To make use of LanceDB’s fast ANN search capabilities, the data must be in vector form. Our metagenomics database consists of billions of proteins, each a string of amino acids. To convert each protein into a vector that captures biologically meaningful information, we run them through a protein language model (pLM), capturing the model’s hidden layers as a vector representation of that protein. Many pLMs can be used to generate protein embeddings, depending on the desired biological information and computational requirements. Here, we use the AMPLIFY_350M model, a transformer encoder model that is fast enough to scale to our entire protein database. We perform a mean-pool of the final hidden layer of the model to produce a 960-dimension vector for each protein. These vectors and their respective unique protein IDs are then stored in HDF5 files.

Data bucketing

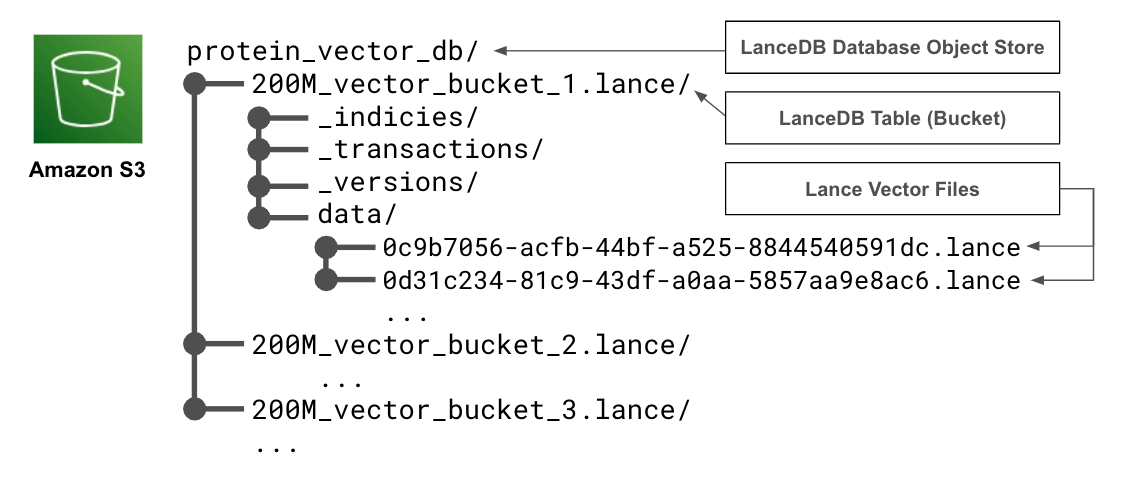
To turn our protein vectors into a searchable database, we use LanceDB to build an index suitable for quickly finding ANNs to a query. However, indexing can take a long time and is difficult to distribute across nodes. To speed up indexing, we first divide our data into roughly evenly sized buckets. We then assign each of our embedding HDF5 files to buckets of size roughly equal to 200 million total vectors using a best-fit bin packing algorithm. The exact size packing method used to bucket data depends on the number and dimension of the vectors, as well as their format. Each bucket is ingested into a separate table that will separately reside in a single LanceDB database object store on Amazon S3.

S3 bucket structure showing LanceDB database organization with vector buckets

By bucketing our data, we can produce several smaller databases that can be indexed on separate nodes in a much shorter amount of time. We can also add more data to our database incrementally as a new bucket, instead of reindexing all the existing data.

Ingesting and indexing bucketed data

After the vectorized data has been assigned to a bucket, it’s time to turn it into a LanceDB table and index it to enable fast ANN querying. The details on how to convert your specific data into a LanceDB table can be found in the LanceDB documentation. For each of our buckets of approximately 200 million vectors, we create a LanceDB table with an IVF-PQ index on the cosine distance. For indexing, we use several partitions equal to the square root of the number of inserted rows, and several sub vectors equal to the number of dimensions of our vectors divided by 16.

To make things smoother to query, we name each table after the bucket from which it was created and upload them to a single S3 directory such that their file structure indicates a single LanceDB database with multiple tables.

The following code snippet provides an example of how you might ingest vectors from an HDF5 file containing id and embedding columns into a LanceDB database and index for fast ANN searches based on cosine distance. The only requirements for running this snippet are python >= 3.9, as well as the lancedb, pyarrow, and h5py packages. It should be noted that this snippet was tested and developed using lancedb version 0.21.1 using the asynchronous LanceDB API.

from typing import List, Iterable
from itertools import islice
from math import sqrt
import pyarrow as pa
import datetime
import asyncio
import lancedb
import h5py

def batched(iterable: Iterable, n: int) -> Iterable[List]:
    """Yield batches of n items from iterable."""
    while batch := list(islice(iterable, n)):
        yield batch

async def vectors_to_db(
    vectors: str,
    db: str,
    table_name: str,
    vector_dim: int,
    ingestion_batch_size: int,
) -> int:
    """Ingest and index vectors from an HDF5 file into a LanceDB table.
    Args:
        vectors (str): An HDF5 file containing protein IDs and their
            960-dimension vector representations.
        db (str): Path to the LanceDB database.
        table_name (str): Name of the table to create.
        vector_dim (int): Dimension of the vectors.
    """
    # create db and table
    custom_schema = pa.schema(
        [
            pa.field("embedding", pa.list_(pa.float32(), vector_dim)),
            pa.field("id", pa.string()),
        ]
    )

    # count the total number of rows as they are added to the table
    total_rows = 0

    # open a connection to the new database and create a table
    with await lancedb.connect_async(db) as db_connection:
        with await db_connection.create_table(
            table_name, schema=custom_schema
        ) as table_connection:
            # open vectors file
            with h5py.File(vectors, "r") as vectors_handle:
                # create a generator over the rows
                rows = (
                    {"embedding": e, "id": i}
                    for e, i in zip(
                        vectors_handle["embedding"],
                        vectors_handle["id"],
                    )
                )

                # insert rows in batches to avoid memory issues
                for batch in batched(rows, ingestion_batch_size):
                    total_rows += len(batch)
                    await table_connection.add(batch)

            # optimize the table and remove old data
            await table_connection.optimize(
                cleanup_older_than=datetime.timedelta(days=0)
            )

            # configure the index for the table
            index_config = lancedb.index.IvfPq(
                distance_type="cosine",
                num_partitions=int(sqrt(total_rows)),
                num_sub_vectors=int(
                    vector_dim / 16
                ),
            )

            # index the table
            await table_connection.create_index(
                "embedding", config=index_config
            )

# ingest and index your data
asyncio.run(
    vectors_to_db(
        vectors="./my_vectors.h5",
        db="./test_db",
        table_name="bucket1",
        vector_dim=960,
        ingestion_batch_size=50000
    )
)

The task of vectorizing, ingesting, indexing each bucket could be parallelized over multiple AWS Batch jobs or run on a single Amazon Elastic Compute Cloud (Amazon EC2) instance.

Querying the database

After the data has been bucketed and ingested into a LanceDB database on Amazon S3, we need a way to query it. Because LanceDB can be queried directly from Amazon S3 using the LanceDB Python API, we can use Lambda functions to take a user-provided query vector and search for ANNs, then return the data to the user. However, because our data has been bucketed across several tables in the database, we need to search for nearest neighbors in each bucket and aggregate the results before passing them back to the user.

We implement the query workflow as an AWS Step Functions state machine that manages a query process for each bucket as Lambda processes, as well as a single Lambda process at the end that aggregates the data and writes the resulting ANNs to a .csv file on Amazon S3. However, this could also be implemented as a series of AWS Batch processes or even run locally. The following snippet shows how a process assigned to one bucket could run an ANN query against one of the database’s buckets, requiring only pandas and lancedb to run on python >= 3.9. As detailed before in the ingestion section, we use the asynchronous LanceDB API and lancedb package version 0.21.1.

from typing import List, Iterable
import asyncio
import lancedb
import pandas
import random

async def run_query_async(
    lancedb_s3_uri: str,
    table_name: str,
    q_vec: List[float],
    k: int,
    vec_col: str,
    n_probes: int,
    refine_factor: int,
) -> pandas.DataFrame:
    """Run a query on a LanceDB table.
    Args:
        lancedb_s3_uri (str): S3 URI of the LanceDB database.
        table_name (str): Name of the table to query.
        q_vec (List[float]): Query vector.
        k (int): Number of nearest neighbors to return.
        vec_col (str): Column name of the vector column.
        n_probes (int): Number of probes to use for the query.
        refine_factor (int): Refine factor for the query.
    Returns:
        pandas.DataFrame: DataFrame containing the approximate nearest
        neighbors to the query vector.
    """
    # open a connection to the database and table
    with await lancedb.connect_async(
        lancedb_s3_uri, storage_options={"timeout": "120s"}
    ) as db_connection:
        with await db_connection.open_table(table_name) as table_connection:
            # query the approximate nearest neighbors to the query vector
            df = (
                await table_connection.query()
                .nearest_to(q_vec)
                .column(vec_col)
                .nprobes(n_probes)
                .refine_factor(refine_factor)
                .limit(k)
                .distance_type("cosine")
                .to_pandas()
            )

    return df

# query the example bucket we produced in the last section
bucket1_df = asyncio.run(
    snippets.run_query_async(
        lancedb_s3_uri="s3://mg-analysis/owen/20250415_lancedb_snippet_testing/test_db/",
        table_name="bucket1",
        q_vec=[random.random() for _ in range(960)],
        k=3,
        vec_col="embedding",
        n_probes=1,
        refine_factor=1,
    )
)

The preceding query will return a panda DataFrame of the following structure:

embedding id _distance
[-5.124435, 4.242000, …] id_1 0.000000
[-5.783999, 4.340500, …] id_2 0.001000
[-6.932943, 3.394850, …] id_3 0.04020

Where the embedding column contains the vector representations of the nearest neighbors, the id column their IDs, and the _distance column their cosine distances to the queried vector.

After each bucket has been independently queried across nodes and each has returned a nearest neighbors DataFrame, the results must be merged and subset to return the user. The following snippet shows how you might do this.

def aggregate_nearest_neighbors(
    dfs: List[pandas.DataFrame], k: int
):
    """Aggregate the nearest neighbors for each query vector.
    Args:
        dfs (List[pandas.DataFrame]): A list of DataFrames containing the
            nearest neighbors queried from each bucket.
        k (int): The number of nearest neighbors to aggregate.
    Returns:
        pd.DataFrame: A DataFrame with the aggregated nearest neighbors.
    """
    # concatenate the DataFrames and get the top k nearest neighbors
    return (
        pandas.concat(dfs, ignore_index=True)
        .sort_values(by=["_distance"], ascending=True)
        .reset_index(drop=True)
        .head(k)
    )

# add the dataframes from querying each bucket to a list
dfs = [bucket1_df, bucket2_df, bucket3_df, bucket4_df, bucket_5]

# aggregate the nearest neighbors across all buckets
nearest_neighbors_all_buckets_df = aggregate_nearest_neighbors(dfs, 5)

Optimizing for large batches of queries

Though querying a LanceDB database directly from its S3 object store on Lambda works well for querying the ANNs of one or a few query vectors, some use cases might require querying thousands or even millions of vectors.

One solution we’ve found that scales well to large batches of queries is to modify the preceding query implementation such that it first downloads one of the database buckets to local storage, then queries it locally using the LanceDB API. Because database buckets can have a large storage footprint, this implementation is better suited for AWS Batch jobs than Lambda, and we recommend using optimized instance storage (for example, i4i instances) rather than EBS volumes. After all query Batch jobs finish, a final job can aggregate their results before returning to the user. Orchestration of parallel query jobs and the aggregation job can be done with Nextflow. Though this implementation will have significantly more overhead and latency from downloading the buckets to disk, it can handle larger batches of queries more efficiently and still requires no continuously running server-based database.

Benchmarking results

Indexing strategies and database split sizes depend on your personal need for performance. Consider the following general optimization guidance when customizing to your use case.

An example database created by Metagenomi consisted of 3.5 billion vector embeddings produced by AMPLIFY, of dimension 960. Ingesting and indexing these 3.5B vector embeddings in split sizes of 200M vectors on i4i.8xlarge instances took 108 total compute hours. Because this solution is serverless and can be queried directly from its S3 object store, the only fixed cost of this database is its storage footprint on Amazon S3 (for an indexed database of 3.5B vectors, this is approximately 12.9 TB). Lambda queries can be an exceptionally low-cost querying solution, with many queries costing fractions of a cent.

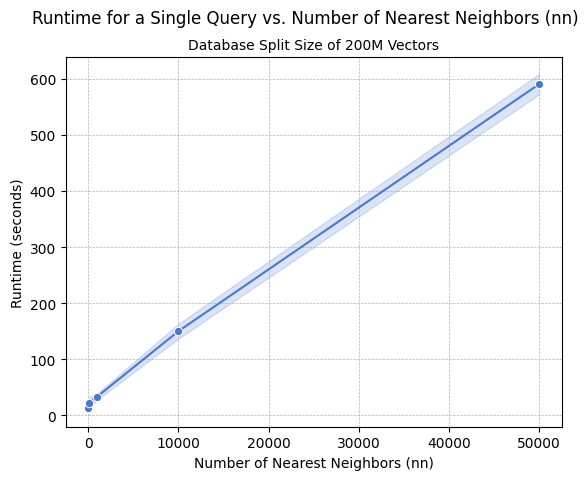
In general, larger database splits will be more cost effective to query but will result in longer runtimes and longer indexing times. We recommend scaling up database split sizes to the maximum size that results in an acceptable query return time for a single split while also considering limits of parallelization such as maximum concurrent Lambda functions running. Metagenomi identified database splits of 200M vectors each to yield an optimal trade-off in cost and runtime for both small and large queries. We recommend ingesting and indexing on storage-optimized instances, such as those in the i4i family, for optimal performance and cost savings. If querying is to be done on an instance using a disk-based database (as opposed to Lambda and Amazon S3), we also recommend using storage-optimized instances for queries. We found the Lambda implementation could quickly handle single queries requesting up to 50,000 ANNs, or multi queries of up to 100 sequences with fewer than 5 ANNs. Runtime increases linearly with the number of ANNs requested, as shown in the following graph.

Line graph showing query runtime increasing with number of nearest neighbors

Conclusion

In this post, we showed how Metagenomi was able to store and query billions of protein embeddings at low cost using LanceDB implemented with Amazon S3 and AWS Lambda. This work expands on Metagenomi’s patient-driven mission to create curative genetic medicines by accelerating our discovery and engineering platform. Having quick access to the ANN embedding space of a query protein in seconds has enabled the integration of rapid search methods in our extensive analysis pipelines, accelerated the discovery of several diverse and novel enzyme families, and enabled protein engineering efforts by providing scientists with methods to generate and search embeddings on the fly. As Metagenomi continues to rapidly scale protein and DNA databases, horizontal scaling enabled by database splits that can be indexed and searched in parallel facilitates an embedding database solution that scales to future needs.

The solution outlined in this post focuses on vectors produced by a protein large language model (LLM) but can be applied to other vectorized datasets. To learn more about LanceDB integrated with Amazon S3, refer to the LanceDB documentation.

References

  1. Fournier, Quentin, et al. “Protein language models: is scaling necessary?.” bioRxiv (2024): 2024-09.

About the authors

Use Apache Airflow workflows to orchestrate data processing on Amazon SageMaker Unified Studio

Post Syndicated from Vinod Jayendra original https://aws.amazon.com/blogs/big-data/use-apache-airflow-workflows-to-orchestrate-data-processing-on-amazon-sagemaker-unified-studio/

Orchestrating machine learning pipelines is complex, especially when data processing, training, and deployment span multiple services and tools. In this post, we walk through a hands-on, end-to-end example of developing, testing, and running a machine learning (ML) pipeline using workflow capabilities in Amazon SageMaker, accessed through the Amazon SageMaker Unified Studio experience. These workflows are powered by Amazon Managed Workflows for Apache Airflow (Amazon MWAA).

While SageMaker Unified Studio includes a visual builder for low-code workflow creation, this guide focuses on the code-first experience: authoring and managing workflows as Python-based Apache Airflow DAGs (Directed Acyclic Graphs). A DAG is a set of tasks with defined dependencies, where each task runs only after its upstream dependencies are complete, promoting correct execution order and making your ML pipeline more reproducible and resilient.We’ll walk through an example pipeline that ingests weather and taxi data, transforms and joins datasets, and uses ML to predict taxi fares—all orchestrated using SageMaker Unified Studio workflows.

If you prefer a simpler, low-code experience, see Orchestrate data processing jobs, querybooks, and notebooks using visual workflow experience in Amazon SageMaker.

Solution overview

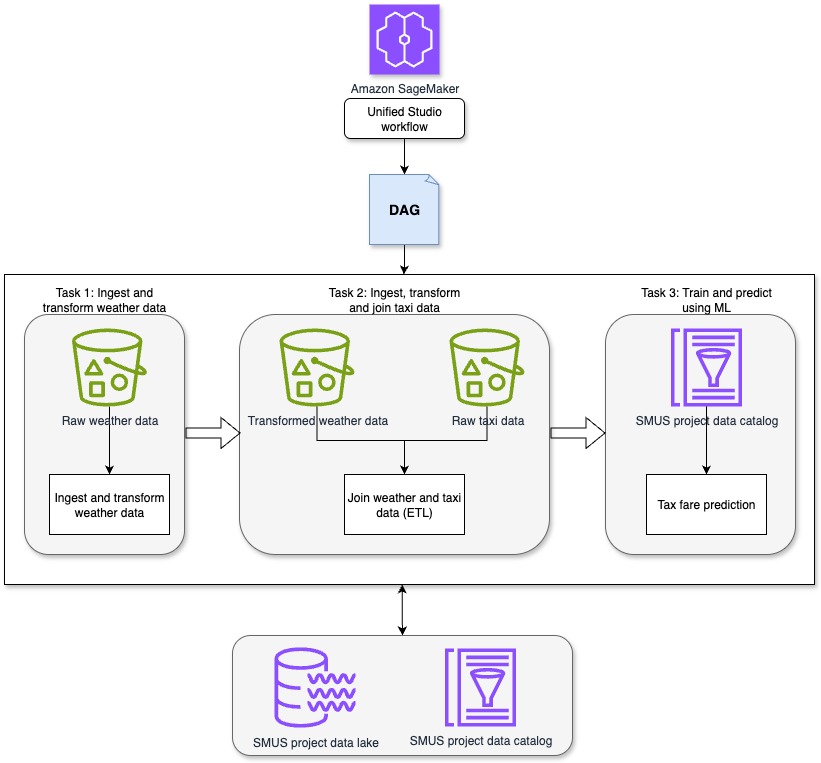
This solution demonstrates how SageMaker Unified Studio workflows can be used to orchestrate a complete data-to-ML pipeline in a centralized environment. The pipeline runs through the following sequential tasks, as shown in the preceding diagram.

  • Task 1: Ingest and transform weather data: This task uses a Jupyter notebook in SageMaker Unified Studio to ingest and preprocess synthetic weather data. The synthetic weather dataset includes hourly observations with attributes such as time, temperature, precipitation, and cloud cover. For this task, the focus is on time, temperature, rain, precipitation, and wind speed.
  • Task 2: Ingest, transform and join taxi data: A second Jupyter notebook in SageMaker Unified Studio ingests the raw New York City taxi ride dataset. This dataset includes attributes such as pickup time, drop-off time, trip distance, passenger count, and fare amount. The relevant fields for this task include pickup and drop-off time, trip distance, number of passengers, and total fare amount. The notebook transforms the taxi dataset in preparation for joining it with the weather data. After transformation, the taxi and weather datasets are joined to create a unified dataset, which is then written to Amazon S3 for downstream use.
  • Task 3: Train and predict using ML: A third Jupyter notebook in SageMaker Unified Studio applies regression techniques to the joined dataset to create a model to determine how attributes of the weather and taxi data such as rain and trip distance impact taxi fares and create a fare prediction model. The trained model is then used to generate fare predictions for new trip data.

This unified approach enables orchestration of extract, transform, and load (ETL) and ML steps with full visibility into the data lifecycle and reproducibility through governed workflows in SageMaker Unified Studio.

Prerequisites

Before you begin, complete the following steps:

  1. Create a SageMaker Unified Studio domain: Follow the instructions in Create an Amazon SageMaker Unified Studio domain – quick setup
  2. Sign in to your SageMaker Unified Studio domain: Use the domain you created in Step 1 sign in. For more information, see Access Amazon SageMaker Unified Studio.
  3. Create a SageMaker Unified Studio project: Create a new project in your domain by following the project creation guide. For Project profile, select All capabilities.

Set up workflows

You can use workflows in SageMaker Unified Studio to set up and run a series of tasks using Apache Airflow to design data processing procedures and orchestrate your querybooks, notebooks, and jobs. You can create workflows in Python code, test and share them with your team, and access the Airflow UI directly from SageMaker Unified Studio. It provides features to view workflow details, including run results, task completions, and parameters. You can run workflows with default or custom parameters and monitor their progress. Now that you have your SageMaker Unified Studio project set up, you can build your workflows.

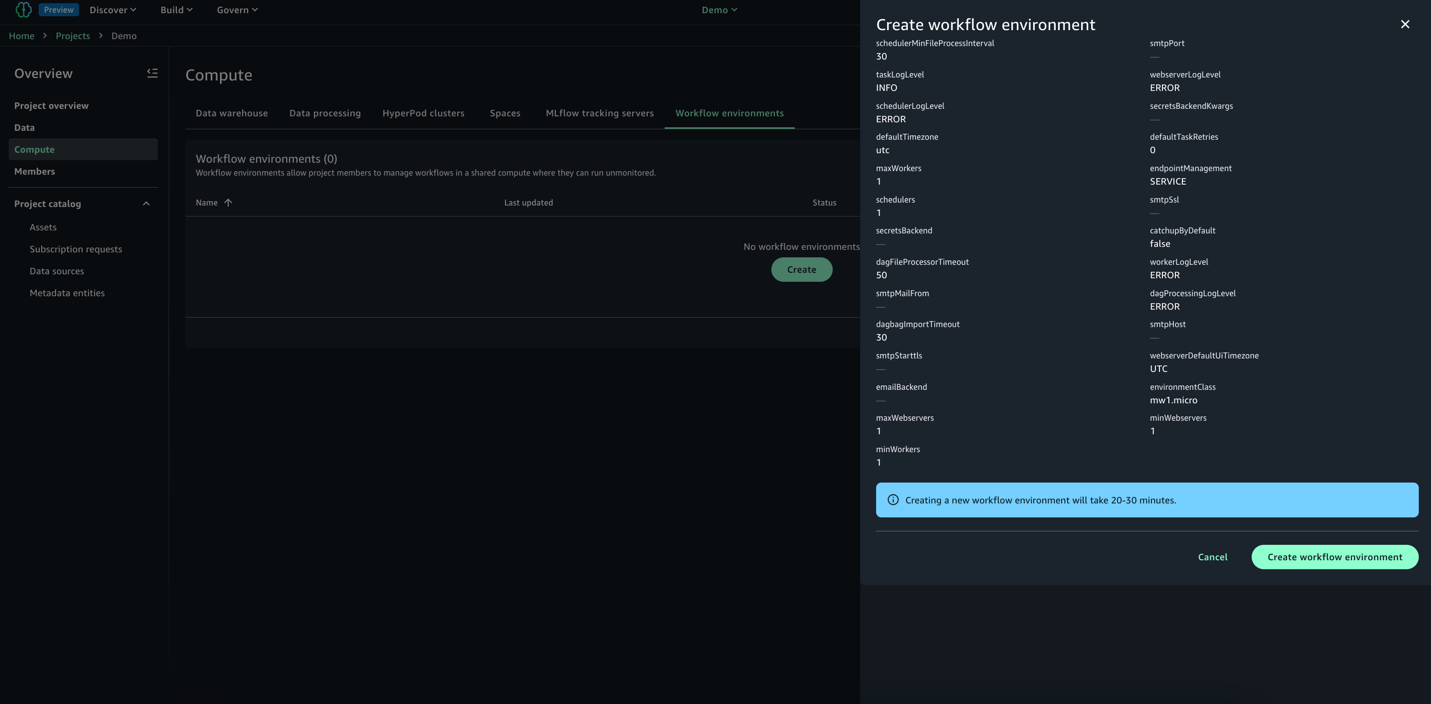
  1. In your SageMaker Unified Studio project, navigate to the Compute section and select Workflow environment.
  2. Choose Create environment to set up a new workflow environment.
  3. Review the options and choose Create environment. By default, SageMaker Unified Studio creates an mw1.micro class environment, which is suitable for testing and small-scale workflows. To update the environment class before project creation, navigate to Domain and select Project Profiles and then All Capabilities and go to OnDemand Workflows blueprint deployment settings. By using these settings, you can override default parameters and tailor the environment to your specific project requirements.

Develop workflows

You can use workflows to orchestrate notebooks, querybooks, and more in your project repositories. With workflows, you can define a collection of tasks organized as a DAG that can run on a user-defined schedule.To get started:

  1. Download Weather Data Ingestion, Taxi Ingest and Join to Weather, and Prediction notebooks to your local environment.
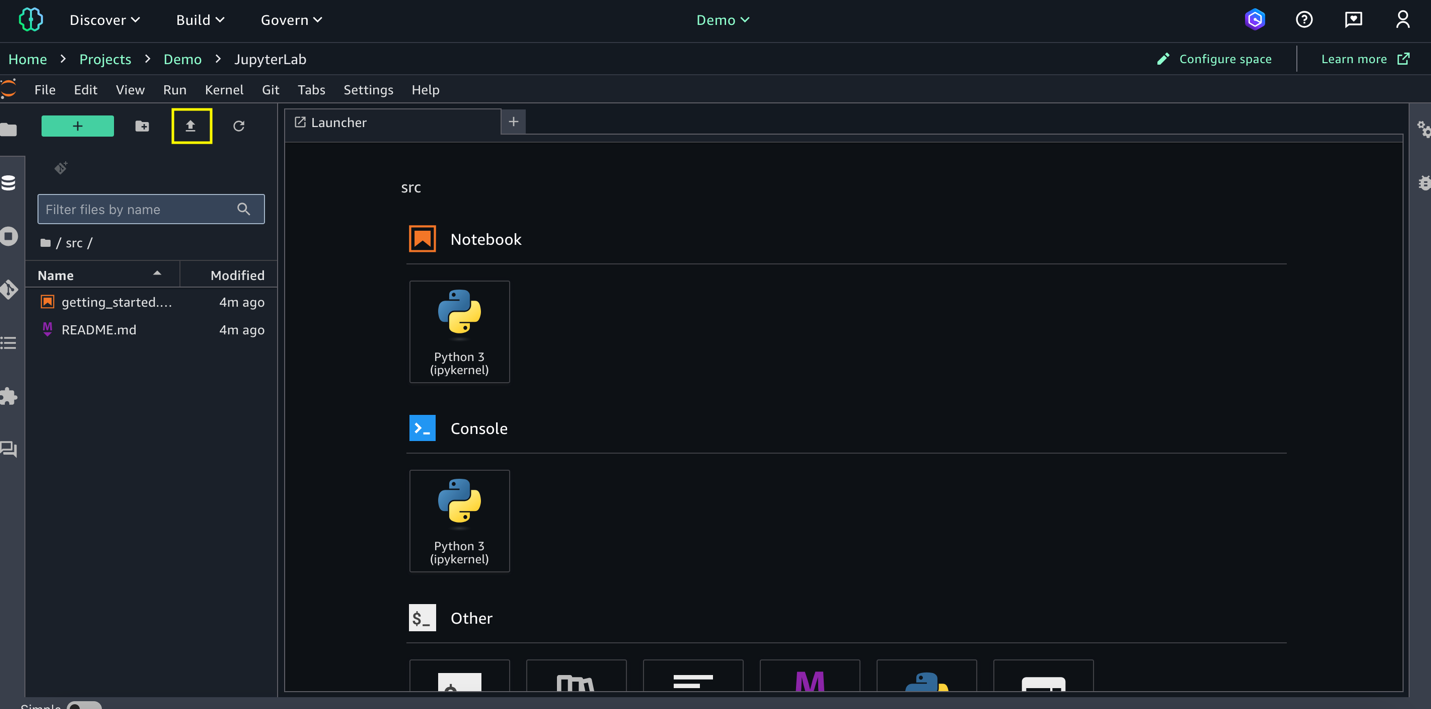
  2. Go to Build and select JupyterLab; choose Upload files and import the three notebooks you downloaded in the previous step.

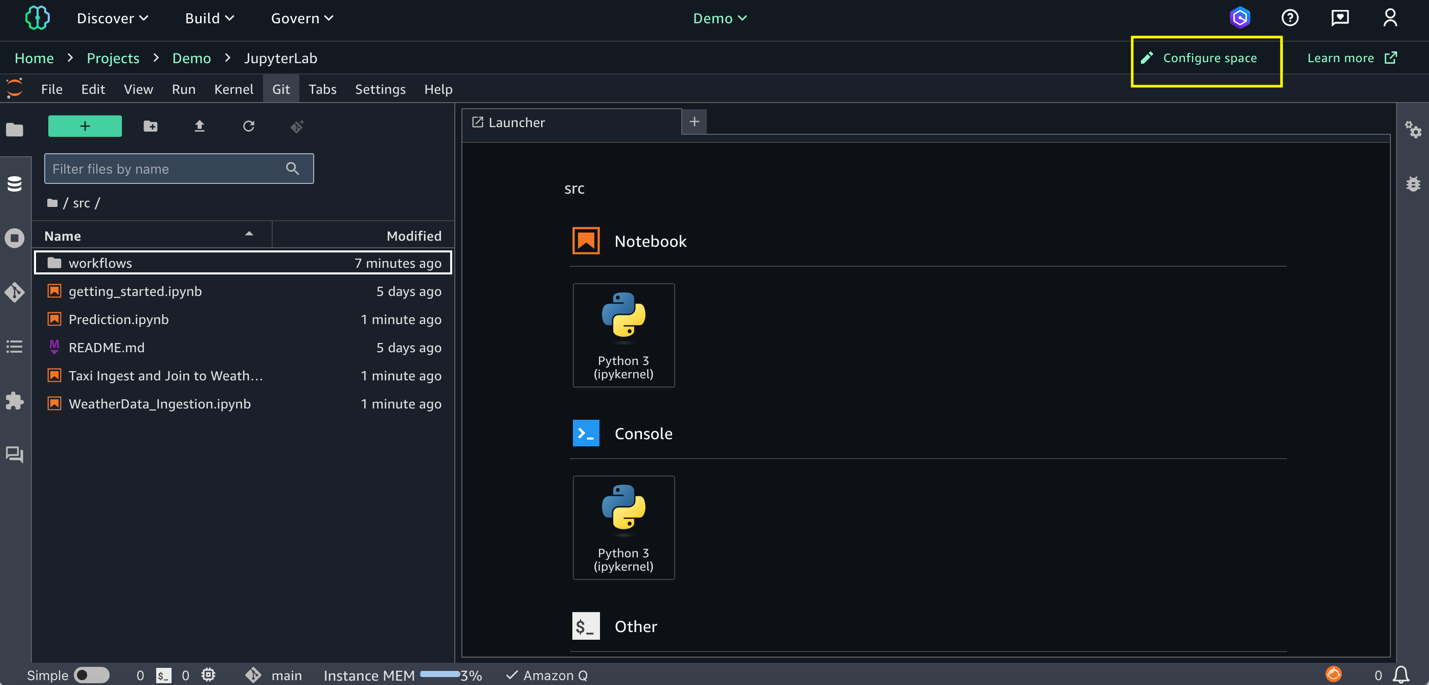
  1. Configure your SageMaker Unified Studio space: Spaces are used to manage the storage and resource needs of the relevant application. For this demo, configure the space with an ml.m5.8xlarge instance
    1. Choose Configure Space in the right-hand corner and stop the space.
    2. Update instance type to ml.m5.8xlarge and start the space. Any active processes will be paused during the restart, and any unsaved changes will be lost. Updating the workspace might take a take few minutes.
  2. Go to Build and select Orchestration and then Workflows.
  3. Select the down arrow (▼) next to Create new workflow. From the dropdown menu that appears, select Create in code editor.
  4. In the editor, create a new Python file named multinotebook_dag.py under src/workflows/dags. Copy the following DAG code, which implements a sequential ML pipeline that orchestrates multiple notebooks in SageMaker Unified Studio. Replace <REPLACE-OWNER> with your username. Update NOTEBOOK_PATHS to match your actual notebook locations.
from airflow.decorators import dag
from airflow.utils.dates import days_ago
from workflows.airflow.providers.amazon.aws.operators.sagemaker_workflows import NotebookOperator

WORKFLOW_SCHEDULE = '@daily'

NOTEBOOK_PATHS = [
'<REPLACE FULL PATH FOR Weather_Data_Ingestion.ipynb>',
'<REPLACE FULL PATH FOR Taxi_Weather_Data_Collection.ipynb>',
'<REPLACE FULL PATH FOR Prediction.ipynb>'
]

default_args = {
    'owner': '<REPLACE-OWNER>',
}

@dag(
    dag_id='workflow-multinotebooks',
    default_args=default_args,
    schedule_interval=WORKFLOW_SCHEDULE,
    start_date=days_ago(2),
    is_paused_upon_creation=False,
    tags=['MLPipeline'],
    catchup=False
)
def multi_notebook():
    previous_task = None

    for idx, notebook_path in enumerate(NOTEBOOK_PATHS, 1):
        current_task = NotebookOperator(
            task_id=f"Notebook{idx}task",
            input_config={'input_path': notebook_path, 'input_params': {}},
            output_config={'output_formats': ['NOTEBOOK']},
            wait_for_completion=True,
            poll_interval=5
        )

        # Ensure tasks run sequentially
        if previous_task:
            previous_task >> current_task

        previous_task = current_task  # Update previous task

multi_notebook()

The code uses the NotebookOperator to execute three notebooks in order: data ingestion for weather data, data ingestion for taxi data, and the trained model created by combining the weather and taxi data. Each notebook runs as a separate task, with dependencies to help ensure that they execute in sequence. You can customize with your own notebooks. You can modify the NOTEBOOK_PATHS list to orchestrate any number of notebooks in their workflow while maintaining sequential execution order.

The workflow schedule can be customized by updating WORKFLOW_SCHEDULE (for example: '@hourly', '@weekly', or cron expressions like ‘13 2 1 * *’) to match your specific business needs.

  1. After a workflow environment has been created by a project owner, and once you’ve saved your workflows DAG files in JupyterLab, they are automatically synced to the project. After the files are synced, all project members can view the workflows you have added in the workflow environment. See Share a code workflow with other project members in an Amazon SageMaker Unified Studio workflow environment.

Test and monitor workflow execution

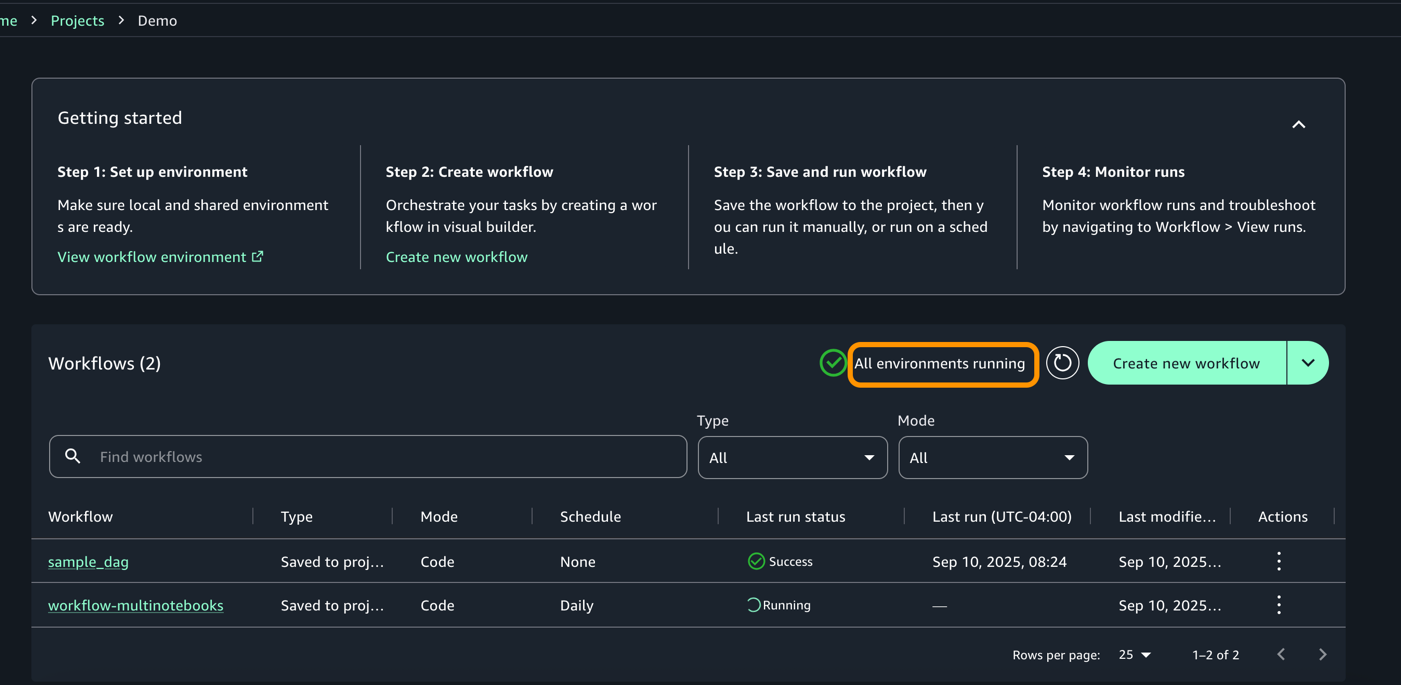
  1. To validate your DAG, Go to Build > Orchestration > Workflows. You should now see the workflow running in Local Space based on the Schedule.

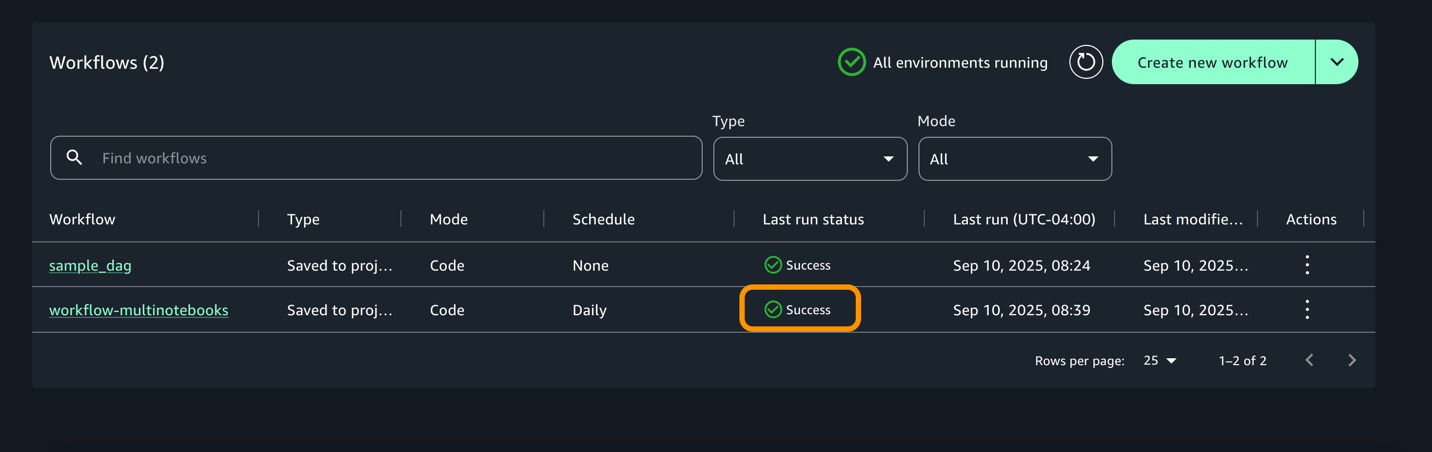
  1. Once the execution completes, workflow would change to success start as shown below.

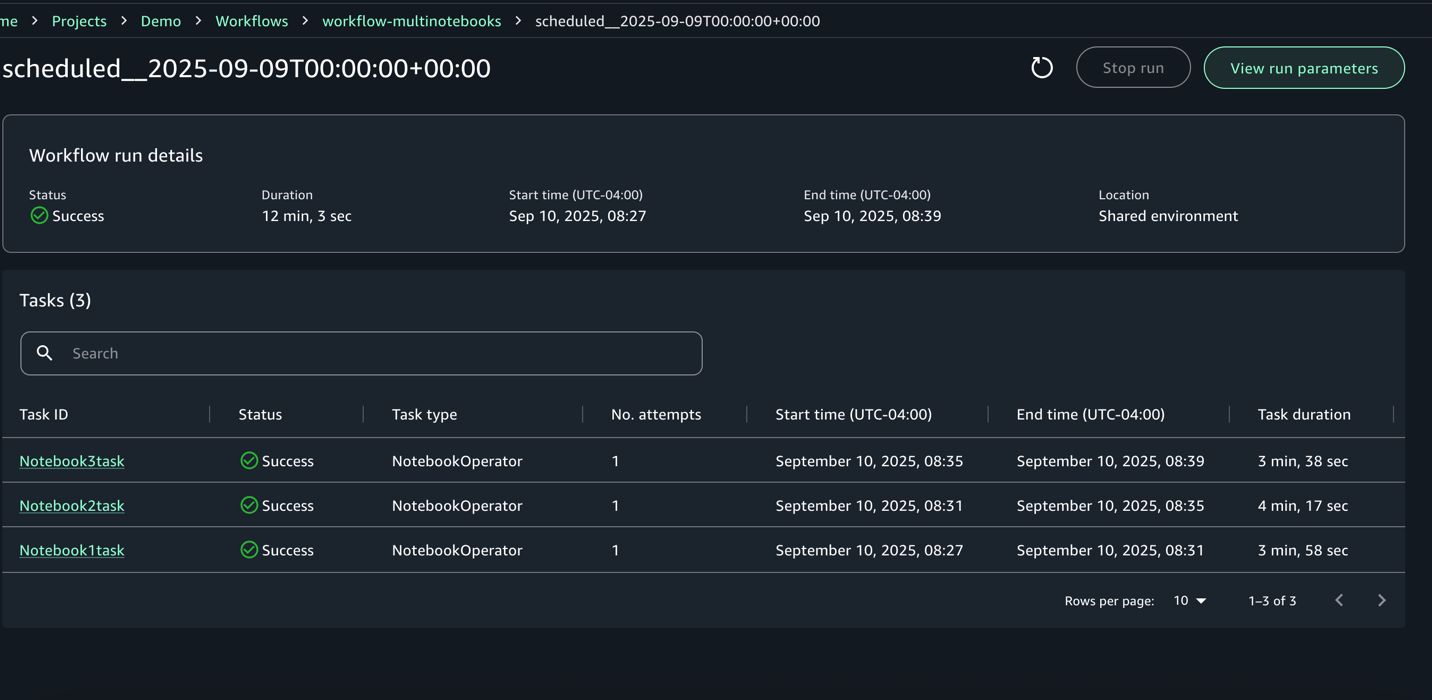
  1. For each execution, you can zoom in to get a detailed workflow run details and task logs

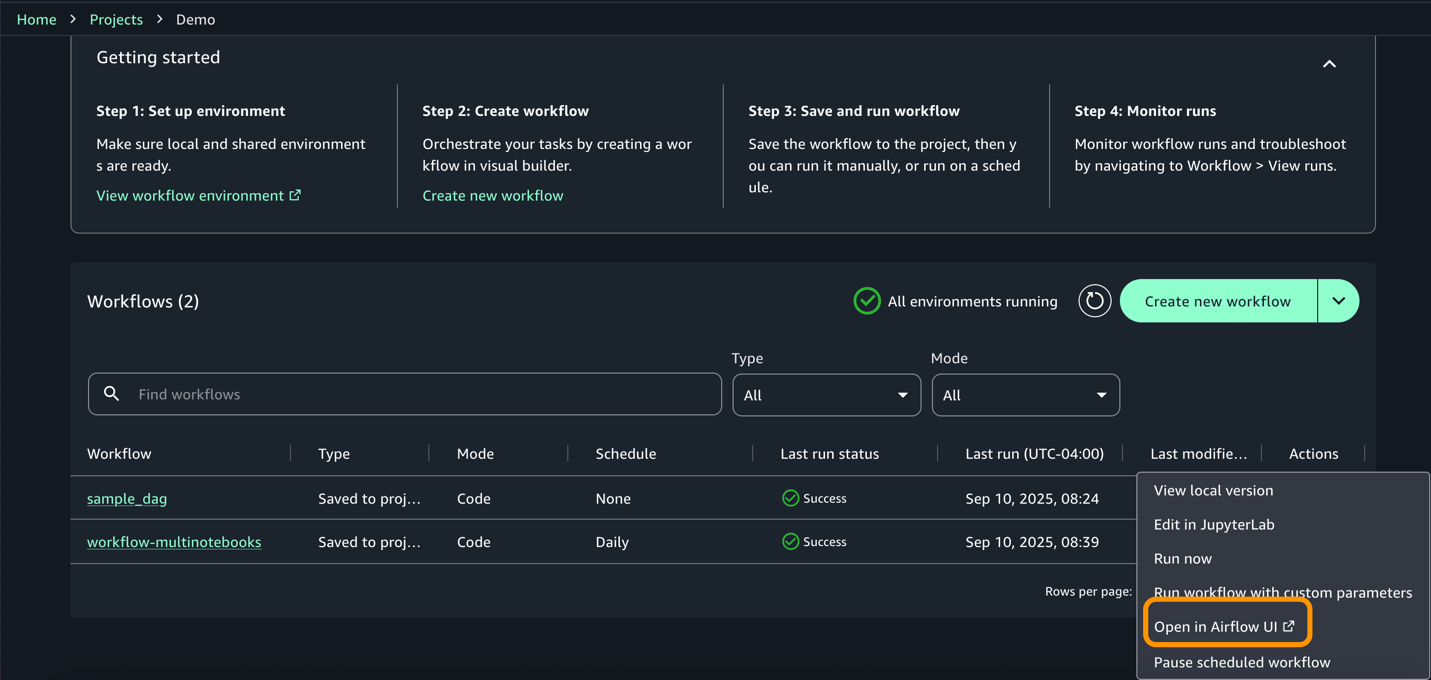
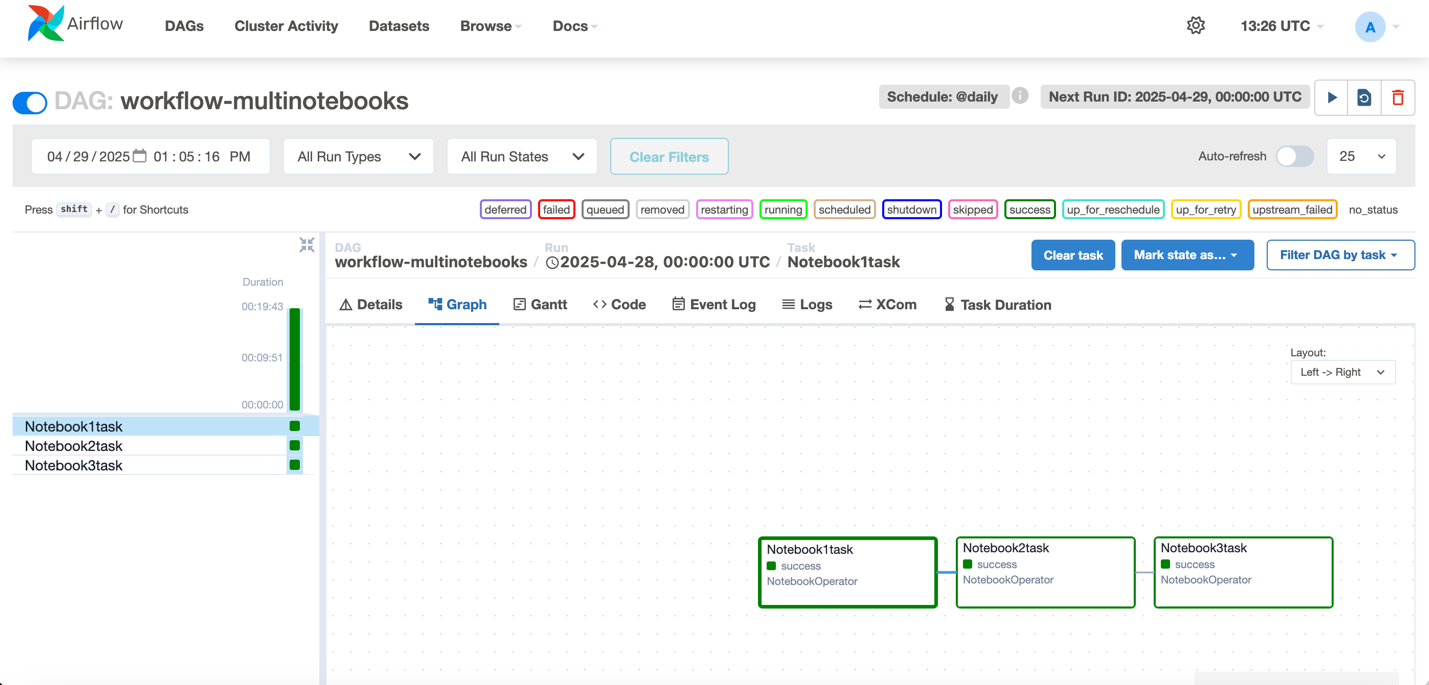
  1. Access the airflow UI from actions for more information on the dag and execution.

Results

The model’s output is written to the Amazon Simple Storage Service (Amazon S3) output folder as shown the following figure. These results should be evaluated for correctness of fit, prediction accuracy, and the consistency of relationships between variables. If any results appear unexpected or unclear, it is important to review the data, engineering steps, and model assumptions to verify that they align with the intended use case.

Clean up

To avoid incurring additional charges associated with resources created as part of this post, make sure you delete the items created in the AWS account for this post.

  1. The SageMaker domain
  2. The S3 bucket associated with the SageMaker domain

Conclusion

In this post, we demonstrated how you can use Amazon SageMaker to build powerful, integrated ML workflows that span the full data and AI/ML lifecycle. You learned how to create an Amazon SageMaker Unified Studio project, use a multi-compute notebook to process data, and use the built-in SQL editor to explore and visualize results. Finally, we showed you how to orchestrate the entire workflow within the SageMaker Unified Studio interface.

SageMaker offers a comprehensive set of capabilities for data practitioners to perform end-to-end tasks, including data preparation, model training, and generative AI application development. When accessed through SageMaker Unified Studio, these capabilities come together in a single, centralized workspace that helps eliminate the friction of siloed tools, services, and artifacts.

As organizations build increasingly complex, data-driven applications, teams can use SageMaker, together with SageMaker Unified Studio, to collaborate more effectively and operationalize their AI/ML assets with confidence. You can discover your data, build models, and orchestrate workflows in a single, governed environment.

To learn more, visit the Amazon SageMaker Unified Studio page.


About the authors

Suba Palanisamy

Suba Palanisamy

Suba is a Enterprise Support Lead, helping customers achieve operational excellence on AWS. Suba is passionate about all things data and analytics. She enjoys traveling with her family and playing board games.

Sean Bjurstrom

Sean Bjurstrom

Sean is a Enterprise Support Lead in ISV accounts at Amazon Web Services, where he specializes in Analytics technologies and draws on his background in consulting to support customers on their analytics and cloud journeys. Sean is passionate about helping businesses harness the power of data to drive innovation and growth. Outside of work, he enjoys running and has participated in several marathons.

Vinod Jayendra

Vinod Jayendra

Vinod is a Enterprise Support Lead in ISV accounts at Amazon Web Services, where he helps customers in solving their architectural, operational, and cost optimization challenges. With a particular focus on Serverless & Analytics technologies, he draws from his extensive background in application development to deliver top-tier solutions. Beyond work, he finds joy in quality family time, embarking on biking adventures, and coaching youth sports team.

Kamen Sharlandjiev

Kamen Sharlandjiev

Kamen is a Senior Worldwide Specialist SA, Big Data expert. He’s on a mission to make life easier for customers who are facing complex data integration and orchestration challenges. His secret weapon? Fully managed AWS services that can get the job done with minimal effort. Follow Kamen on LinkedIn to keep up to date with the latest MWAA and AWS Glue features and news!

AWS Weekly Roundup: Amazon Q Developer, AWS Step Functions, AWS Cloud Club Captain deadline, and more (September 22, 2025)

Post Syndicated from Donnie Prakoso original https://aws.amazon.com/blogs/aws/aws-weekly-roundup-amazon-q-developer-aws-step-functions-aws-cloud-club-captain-deadline-and-more-september-22-2025/

Three weeks ago, I published a post about the new AWS Region in New Zealand (ap-southeast-6). This led to an incredible opportunity to visit New Zealand, where I met passionate builders and presented at several events including Serverless and Platform Engineering meetup, AWS Tools and Programming meetup, AWS Cloud Clubs in Auckland, and AWS Community Day New Zealand.

During my content creation process for these presentations, I discovered a useful feature in Amazon Q CLI called tangent mode. This feature has transformed how I stay focused by creating conversation checkpoints that let you explore side topics without losing your main thread.

This feature is in experimental mode, and you can enable it with q settings chat.enableTangentMode true. Try it out and see if it helps you.

Last week’s launches
Here are some launches that got my attention:

  • New Foundation Models in Amazon Bedrock — Amazon Bedrock expands its model selection with Qwen model family, DeepSeek-V3.1, and Stability AI image services now generally available, giving developers access to powerful multilingual models and advanced image generation capabilities for text generation, code generation, image creation, and complex problem-solving tasks.
  • Amazon VPC Reachability Analyzer Expands to Seven New Regions — Network Access Analyzer capabilities are now available in additional regions, helping customers analyze and troubleshoot network connectivity issues across their VPC infrastructure with improved global coverage.
  • Amazon Q Developer Supports Remote MCP Servers — Amazon Q Developer now integrates with remote Model Context Protocol (MCP) servers, enabling developers to extend their AI assistant capabilities with custom tools and data sources for enhanced development workflows.
  • AWS Step Functions Enhances Distributed Map with New Data Source Options — Step Functions introduces additional data source options and improved observability features for Distributed Map, making it easier to process large-scale parallel workloads with better monitoring and debugging capabilities.
  • Amazon Corretto 25 Generally Available — Amazon’s no-cost, multiplatform distribution of OpenJDK 25 is now generally available, providing Java developers with long-term support, performance enhancements, and security updates for building modern applications.
  • Amazon SageMaker HyperPod Introduces Autoscaling — SageMaker HyperPod now supports automatic scaling capabilities, allowing machine learning teams to dynamically adjust compute resources based on workload demands, optimizing both performance and cost for distributed training jobs.

Additional Updates

  • AWS Named Leader in 2025 Gartner Magic Quadrant for AI Code Assistants – AWS has been recognized as a Leader in Gartner’s Magic Quadrant for AI Code Assistants, highlighting Amazon Q Developer’s capabilities in helping developers write code faster and more securely with AI-powered suggestions.
  • Become an AWS Cloud Club Captain – Only a couple of days before it closes! Join a growing network of student cloud enthusiasts by becoming an AWS Cloud Club Captain! As a Captain, you’ll get to organize events and build cloud communities while developing leadership skills. The application window is open September 1-28, 2025.

Upcoming AWS events
Check your calendars and sign up for these upcoming AWS events as well as AWS re:Invent and AWS Summits:

  • AWS AI Agent Global Hackathon – This is your chance to dive deep into our powerful generative AI stack and create something truly awesome. From September 8th to October 20th, you have the opportunity to create AI agents using AWS suite of AI services, competing for over $45,000 in prizes and exclusive go-to-market opportunities.
  • AWS Gen AI Lofts – You can learn AWS AI products and services with exclusive sessions and meet industry-leading experts, and have valuable networking opportunities with investors and peers. Register in your nearest city: Mexico City (September 30–October 2), Paris (October 7–21), London (Oct 13–21), and Tel Aviv (November 11–19).
  • AWS Community Days – Join community-led conferences that feature technical discussions, workshops, and hands-on labs led by expert AWS users and industry leaders from around the world: South Africa (September 20), Bolivia (September 20), Portugal (September 27), and Manila (October 4-5).

You can browse all upcoming AWS events and AWS startup events.

That’s all for this week. Check back next Monday for another Weekly Roundup!

Happy building!

— Donnie

[$] Revocable references for transient devices

Post Syndicated from corbet original https://lwn.net/Articles/1038523/

Computers were once relatively static devices; if a peripheral was present
at boot, it was unlikely to disappear while the system was operating.
Those days are far behind us, though; devices can come and go at any time,
often with no notice. That impermanence can create challenges for kernel
code, which may not be expecting resources it is managing to make an abrupt
exit. The revocable
resource management patch set
from Tzung-Bi Shih is meant to help with
the creation of more robust — and more secure — kernel subsystems in a
dynamic world.

Security updates for Monday

Post Syndicated from jake original https://lwn.net/Articles/1039053/

Security updates have been issued by Debian (ffmpeg, jetty12, jetty9, jq, and pam), Fedora (curl, libssh, podman-tui, and prometheus-podman-exporter), Oracle (firefox, gnutls, kernel, and thunderbird), and SUSE (bluez, cairo, chromium, cmake, cups, firefox, frr, govulncheck-vulndb, kernel, kubevirt, virt-api-container, virt-controller-container, virt-exportproxy-container, virt-exportserver-container, virt-handler-container, virt-launcher-container, virt-libguestfs-t, mariadb, mybatis, ognl, python-h2, and rke2).

Supporting the future of the open web: Cloudflare is sponsoring Ladybird and Omarchy

Post Syndicated from Mari Galicer original https://blog.cloudflare.com/supporting-the-future-of-the-open-web/

At Cloudflare, we believe that helping build a better Internet means encouraging a healthy ecosystem of options for how people can connect safely and quickly to the resources they need. Sometimes that means we tackle immense, Internet-scale problems with established partners. And sometimes that means we support and partner with fantastic open teams taking big bets on the next generation of tools.

To that end, today we are excited to announce our support of two independent, open source projects: Ladybird, an ambitious project to build a completely independent browser from the ground up, and Omarchy, an opinionated Arch Linux setup for developers. 

Two open source projects strengthening the open Internet 

Cloudflare has a long history of supporting open-source software – both through our own projects shared with the community and external projects that we support. We see our sponsorship of Ladybird and Omarchy as a natural extension of these efforts in a moment where energy for a diverse ecosystem is needed more than ever.  

Ladybird, a new and independent browser 

Most of us spend a significant amount of time using a web browser –  in fact, you’re probably using one to read this blog! The beauty of browsers is that they help users experience the open Internet, giving you access to everything from the largest news publications in the world to a tiny website hosted on a Raspberry Pi.  

Unlike dedicated apps, browsers reduce the barriers to building an audience for new services and communities on the Internet. If you are launching something new, you can offer it through a browser in a world where most people have absolutely zero desire to install an app just to try something out. Browsers help encourage competition and new ideas on the open web.

While the openness of how browsers work has led to an explosive growth of services on the Internet, browsers themselves have consolidated to a tiny handful of viable options. There’s a high probability you’re reading this on a Chromium-based browser, like Google’s Chrome, along with about 65% of users on the Internet. However, that consolidation has also scared off new entrants in the space. If all browsers ship on the same operating systems, powered by the same underlying technology, we lose out on potential privacy, security and performance innovations that could benefit developers and everyday Internet users. 


A screenshot of Cloudflare Workers developer docs in Ladybird 

This is where Ladybird comes in: it’s not Chromium based – everything is built from scratch. The Ladybird project has two main components: LibWeb, a brand-new rendering engine, and LibJS, a brand-new JavaScript engine with its own parser, interpreter, and bytecode execution engine. 

Building an engine that can correctly and securely render the modern web is a monumental task that requires deep technical expertise and navigating decades of specifications governed by standards bodies like the W3C and WHATWG. And because Ladybird implements these standards directly, it also stress-tests them in practice. Along the way, the project has found, reported, and sometimes fixed countless issues in the specifications themselves, contributions that strengthen the entire web platform for developers, browser vendors, and anyone who may attempt to build a browser in the future.

Whether to build something from scratch or not is a perennial source of debate between software engineers, but absent the pressures of revenue or special interests, we’re excited about the ways Ladybird will prioritize privacy, performance, and security, potentially in novel ways that will influence the entire ecosystem.


A screenshot of the Omarchy development environment

Omarchy, an independent development environment 

Developers deserve choice, too. Beyond the browser, a developer’s operating system and environment is where they spend a ton of time – and where a few big players have become the dominant choice. Omarchy challenges this by providing a complete, opinionated Arch Linux distribution that transforms a bare installation into a modern development workstation that developers are excited about.

Perfecting one’s development environment can be a career-long art, but learning how to do so shouldn’t be a barrier to beginning to code. The beauty of Omarchy is that it makes Linux approachable to more developers by doing most of the setup for them, making it look good, and then making it configurable. Omarchy provides most of the tools developers need – like Neovim, Docker, and Git – out of the box, and tons of other features.

At its core, Omarchy embraces Linux for all of its complexity and configurability, and makes a version of it that is accessible and fun to use for developers that don’t have a deep background in operating systems. Projects like this ensure that a powerful, independent Linux desktop remains a compelling choice for people building the next generation of applications and Internet infrastructure. 

Our support comes with no strings attached  

We want to be very clear here: we are supporting these projects because we believe the Internet can be better if these projects, and more like them, succeed. No requirement to use our technology stack or any arrangement like that. We are happy to partner with great teams like Ladybird and Omarchy simply because we believe that our missions have real overlap.

Notes from the teams

Ladybird is still in its early days, with an alpha release planned for 2026, but we encourage anyone who is interested to consider contributing to the open source codebase as they prepare for launch.

“Cloudflare knows what it means to build critical web infrastructure on the server side. With Ladybird, we’re tackling the near-monoculture on the client side, because we believe it needs multiple implementations to stay healthy, and we’re extremely thankful for their support in that mission.”

– Andreas Kling, Founder, Ladybird  

Omarchy 3.0 was released just last week with faster installation and increased Macbook compatibility, so if you’ve been Linux-curious for a while now, we encourage you to try it out!

“Cloudflare’s support of Omarchy has ensured we have the fastest ISO and package delivery from wherever you are in the world. Without a need to manually configure mirrors or deal with torrents. The combo of a super CDN, great R2 storage, and the best DDoS shield in the business has been a huge help for the project.”

– David Heinemeier Hansson, Creator of Omarchy and Ruby on Rails

A better Internet is one where people have more choice in how they browse and develop new software. We’re incredibly excited about the potential of Ladybird, Omarchy, and other audacious projects that support a free and open Internet.

Come build with us: Cloudflare’s new hubs for startups

Post Syndicated from Christopher Rotas original https://blog.cloudflare.com/new-hubs-for-startups/

Cloudflare’s offices bring together builders in some of the world’s most popular technology hubs. We have a long history of using those spaces for one-off events and meet ups over the last fifteen years, but we want to do more. Starting in 2026, we plan to open the doors of our offices routinely to startups and builders from outside of our team who need the space to collaborate, meet new people, or just type away at a keyboard in a new (and beautiful) location.

What are our offices meant to be?

Prior to 2020, we expected essentially every team member of Cloudflare to be present in one of our offices five days a week. That worked well for us and helped facilitate the launch of dozens of technologies as well as a community and culture that defined who we are.

Like every other team on the planet, the COVID pandemic forced us to revisit that approach. We used the time to think about what our offices could be, in a world where not every team member showed up every day of the week. While we decided we would be open to remote and hybrid work, we still felt like some of our best work was done in person together. The goal became building spaces that encouraged team members to be present.

Several hard hats and a few leases later, we’ve created a network of offices around the world designed to evolve with the way people work. These spaces aren’t just places to sit — they’re environments that empower people to do their best work — whether that means quiet focus, creative problem-solving, or lively collaboration. From a library tucked into a quiet zone in our waterfront Lisbon office, to the high-ceilinged collaboration areas in the heart of Austin, each office reflects our belief that great spaces support diverse working styles and help teams thrive together.

Our offices are meant to connect our teams, and we believe that by opening our doors to the wider community, we can foster even more innovation and help new companies collaborate better. Cloudflare has always been a hub for builders, and now we’re making that commitment official by welcoming startups into our physical spaces.

Why make them even more open to the community?

Our spaces have served as hosts to community events since the earliest days of Cloudflare. We have brought together just about every group from hackathons to language meet-ups to university orientation sessions. Cloudflare exists to help build a better Internet and in many cases a better digital environment starts with relationships built in a real life environment.

One of the most common pieces of feedback we have received in the last few years after hosting these events is “I really miss connecting with people like this.” And we hear that most often from small teams in the earliest stages of their journey. In the last few years as the start-ups we support with our platform increasingly begin remote-first and only open dedicated spaces in later stages of their growth.

We know that building a company can be a lonely path. We have helped over the last several years by providing a robust free plan and a comprehensive start-up program, but we think we can do more.

Cloudflare’s network supports a significant percentage of the Internet and, as you would expect, the Internet follows the sun. More people use it during the daytime than at night, meaning our data center utilization peaks in specific times of the day. We take advantage of that pattern to run services that are less latency-sensitive in regions overnight.

Our physical locations follow a similar pattern. Utilization resembles a bell curve with Tuesdays, Wednesdays, and Thursdays seeing a lot of traffic while Mondays and Fridays tend to be quieter. Like our CPUs at night, we think we can use that excess capacity to help build a better Internet by giving builders a space to congregate and helping our team connect with more of our users.

How will this work?

Beginning in January of 2026, we plan to make our office locations available to a capped number of external visitors as all-day coworking spaces on select days of each week. We will provide a registration process (more on that below) and set some ground rules. To start, we plan to expand this offering to San Francisco, Austin, London, and Lisbon.

When external visitors arrive, they’ll have access to our common spaces to bring together their teams or just get some work done by themselves. No mandatory talks or obligations. Just fantastic working spaces available to use at no cost.

How can you participate?

We will provide more details in the next few weeks, but the general structure will be based on the following steps.

  1. Enroll in the Cloudflare for Startups Program. Bonus if you are a Workers Launchpad participant or alumni.

  2. Sit tight for now. We will email participating Startup Program customers first to participate with a form requesting office access.

  3. Once the form is filled out, a member of our team will reach out after. If you want to get a head start, fill out the form here.

  4. We plan to roll this out on a cohort basis. Once approved and all requirements are met, register your visit (and that of any additional team members) at least three business days prior to the date requested.

  5. Respect our working spaces as you would your own.

What’s next?

We hope to expand to other locations in the future. Want to get to the front of the line? Sign up for our Startup program here today and we will reach out to Startup Program participants before we roll out the program.

Free access to Cloudflare developer services for non-profit and civil society organizations

Post Syndicated from Patrick Day original https://blog.cloudflare.com/expanding-startups-for-nonprofits/

We are excited to announce that non-profit, civil society, and public interest organizations are now eligible to join Cloudflare for Startups. Under this new program, participating organizations will be eligible to receive up to $250,000 in Cloudflare credits — these can be used for a variety of our developer and core products, including databases & storage, compute services, AI, media, and performance and security.

Non-profit organizations and startups have a lot in common. In addition to being powered by small groups of dedicated, resilient, and creative people, they are constantly navigating funding shortages, staffing challenges, and insufficient tools. Most importantly, both are unrelenting in their efforts to do more with less; maximizing the impact of every dollar spent and hour invested.

Cloudflare’s developer services and our startup programs were designed for exactly these challenges. Our goal is to make it easier for anyone to write code, build applications, and launch new ideas anywhere in the world. Put another way, we want to help small teams have a global impact.

All are welcome to apply. The application period for this new program will open today and runs until December 1. After the closing of the application period, Cloudflare will review the applications we’ve received and make award decisions based on project description, requirements, and impact. 

If you are a non-profit organization interested in working with Cloudflare to build new, innovative full-stack applications that are secure, performant, near-infinite scale, and optimized for AI training, inference, and security for free, apply today!

Coming together in a challenging year

2025 has been a difficult year for non-profits. According to a recent survey of non-profit leaders, decreased government funding, an uncertain economic environment, and greater demand for services have made it increasingly difficult for many organizations to operate. Although some private foundations have responded by increasing their grant making and other contributions, significant gaps remain. 

We also know that the non-profit sector has significant tech needs. The Nonprofit Technology Network (NTEN) reports that almost half of non-profits surveyed believed that they spent too little on technology, with 77% reporting the primary barrier was lack of available budget. Only 14% reported receiving grants to specifically help with technology projects. 

Many organizations are facing difficult choices. And, sadly, many have been forced to discontinue operations.

However, we have also seen remarkable resilience and determination first-hand. Many of the organizations we work with regularly are doing the incredibly difficult work of diversifying their funding, reshaping their organizations, and finding new ways to accomplish their missions — including greater emphasis on and investment in new technologies. We also continue to see dynamic growth of new non-profit startups working to step in and fill gaps to help solve problems in new, innovative ways.

We want to help. 

Cloudflare is the place for startups

Cloudflare is the best place on the Internet to build and launch a startup. In part because our developer tools were designed to help small teams build big things. Building on Cloudflare’s network provides direct access to scalable computing power, storage, media, and AI needed to build full-stack applications. And, because applications built with Cloudflare are automatically deployed to our global network, developers can spend less time worrying about infrastructure and performance and more time on their ideas.

More than 4,000 startups have received free credits since Cloudflare launched its startup program during 2024’s Birthday Week. Since 2024, 175 startups in 23 countries have also participated in Cloudflare’s Workers Launchpad Program, which provides even more support and resources including hands-on assistance and training from Cloudflare engineers, introductions to our venture capital partners, and opportunities to present at Cloudflare Demo Days.

Impact organizations are often start-ups, too

Regardless of their size, non-profits and startups often share a similar mentality. They tend to be mission-driven, operate with limited resources, and are constantly forced to innovate and adapt to survive. 

Above all, they rely on small teams to make an outsized impact.

We understand these challenges. Our developer services were designed to allow small teams to focus on ideas and code instead of the time-consuming aspects of managing a global network, security, and scaling. Building directly on the Cloudflare Network allows developers to instantly scale and deploy new technologies all over the world. 

One example of a non-profit organization already building on Cloudflare is Kendraio. An independent non-profit organization that has built an open source, integration platform designed to help others solve problems. Kendraio creates user-friendly tools with customizable interfaces and no-code logic, allowing anyone to build complex functions across different applications. Their work on pilot projects demonstrates this, including a knowledge graph for diplomats working on nuclear disarmament, a shared wholesale database for independent bookstores, and a dashboard to simplify news subscriptions for readers and publishers.

Interested? Here’s how to apply 

The application period to join Cloudflare’s first class of non-profit organizations participating in Cloudflare for Startups is open now, and will close on December 1, 2025.

Cloudflare’s Impact and Startup teams will review the applications and select a cohort of non-profit, civil society, and public interest organizations to participate in the program.  These organizations will have the opportunity to receive up to $250,000 in Cloudflare credits, which can be used for certain usage-based services including databases & storage, compute services, AI, media, and performance & security tools. For full details, visit cloudflare.com/startups. 

To qualify, organizations should meet the following criteria:

  • Be a registered 501(c)(3) non-profit organization or equivalent

  • Provide a description of the tool you plan to build or scale with Cloudflare. 

Applications for Cloudflare’s first class of non-profit startup participants are open until December 1, 2025. This will be our first non-profit class to join our Startups program. However, we hope there will be more to follow. Keep checking the Cloudflare blog for more updates.

To apply, simply visit our application page and select the non-profit checkbox.

Introducing free access to Cloudflare developer features for students

Post Syndicated from Veronica Marin original https://blog.cloudflare.com/workers-for-students/

I can recall countless late nights as a student spent building out ideas that felt like breakthroughs. My own thesis had significant costs associated with the tools and computational resources I needed. The reality for students is that turning ideas into working applications often requires production-grade tools, and having to pay for them can stop a great project before it even starts. We don’t think that cost should stand in the way of building out your ideas.

Cloudflare’s Developer Platform already makes it easy for anyone to go from idea to launch. It gives you all the tools you need in one place to work on that class project, build out your portfolio, and create full-stack applications. We want students to be able to use these tools without worrying about the cost, so starting today, students at least 18 years old in the United States with a verified .edu email can receive 12 months of free access to Cloudflare’s developer features. This is the first step for Cloudflare for Students, and we plan to continue expanding our support for the next generation of builders.


What’s included

12 months of our paid developer features plan at no upfront cost

Eligible student accounts will receive increased usage allotments for our developer features compared to our free plan. That includes Workers, Pages Functions, KV, Containers, Vectorize, Hyperdrive, Durable Objects, Workers Logpush, and Queues. With these, you can build everything from APIs and full-stack apps to data pipelines and websites.

After 12 months, you can easily renew your subscription by upgrading to our Workers Paid plan. If you choose not to, your account will automatically revert to the free plan, and you won’t be charged.

Here’s a look at the increased usage allotments students can receive today. Above those free allotments, our standard usage rates will apply.

Free Plan

Student Accounts (Paid developer features)

Workers

100,000 requests/day

10 million requests/month

+ $.30 per additional million requests

Workers KV

100,000 read operations/day

1,000 write, delete, list operations per day

10 million read operations/month

1 million write, delete, and list operations per month

Hyperdrive

100,000 database queries/day

Unlimited database queries / day

Durable Objects

100,000 requests/day

1 million requests / day

+ $0.15 / per additional million requests

Workers Logs

200,000 log events / day

3 Days of retention

20 million log events / month 

7 Days of retention

+$0.60 per additional million events

Workers Logpush

Not Included

10 million log events / month

+$0.05 per additional million log events

Queues

Not Included

1 million operations/month included 

+$0.40 per additional million operations

Access to a dedicated student developer community

You’ll also have access to a dedicated Discord channel just for students. We want to see what you’re building! This is a place to connect with peers, get support, and share ideas in a community of student developers.

What others have built with Cloudflare’s Developer Platform

Curious about what’s possible with Cloudflare’s developer features? Here are some projects from our community:

by Daniel Foldi


Adventure is a text-based adventure game running on Cloudflare Workers that uses Workers AI to generate the stories with the @cf/google/gemma-3-12b-it model. 

The project’s developer chose Workers AI with the OpenNext adapter because it made deployment simple and handled scaling automatically. It uses the Workers Paid plan mainly to enable Workers Logpush and get access to detailed logs for better monitoring and analysis.

When a new game starts, the server gives the AI a custom prompt to set the scene and explain how the adventure should work. From there, each time the player makes a choice, their story history is sent back to the server, which asks the AI to continue the narrative, allowing the story to evolve dynamically based on the player’s choices.

The code below shows how this logic is implemented:

"use server";
import { getCloudflareContext } from "@opennextjs/cloudflare";

async function prime(env: CloudflareEnv) {
  const id = Math.floor(Math.random() * 1000000);//unique ID for each game run
  const messages = [
    {
      role: "user",
      content:
        `The user is playing a text-based adventure game. Each game is different, this is game ${id}. Your first job is to create a short background story in 3-4 sentences. Scenarios may include interesting locations such as jungles, deserts, caves.
        After the first message, each of your messages will be responses to the user interaction. State three short options (A, B, C). The user responses will be the chosen action. Your responses should end by asking the user about their choice.
        Your message will be shown to the user directly, so avoid "Certainly", "Great", "Let's get started", and other filler content, and avoid bringing up technical details such as "this is game #id".
        The games should have a win condition that is actually feasible given the story, and if the player loses, the message should end with "Try again.".
        `,
    },
  ];
  //Call Workers AI to generate the first response (story intro)
  const { response } = await env.AI.run("@cf/google/gemma-3-12b-it", { messages });

  return [
    ...messages,
    { role: "assistant", content: response }
  ];
}

/**
 * Main server action for the adventure game.
 * If no input yet, it primes the game with the opening story
 * If there is input, it continues the story based on the full history
 * Uses getCloudflareContext from @opennextjs/cloudflare to access env.
 */
export async function adventureAction(input: any[]) {
  let { env } = await getCloudflareContext({ async: true });

  return input.length === 0
  ? await prime(env)
  : [...input,
      { role: "assistant", content: (await env.AI.run("@cf/google/gemma-3-12b-it", { messages: input })).response }
  ];
}

by Matt Cowley


DNS over Discord is a bot that lets you run DNS lookups right inside Discord. Instead of switching to a terminal or online tool, you can use simple slash commands to check records like A, AAAA, MX, TXT, and more.

The developer behind the project chose Cloudflare Workers because it’s a great platform for running small JavaScript apps that handle requests, which made it a good fit for Discord’s slash commands. Since every command translates into a request and the bot sees a lot of traffic, the free tier wasn’t enough, so it now runs on Workers Paid to keep up reliably without hitting request limits.

In this project, the Worker checks if the request is a Discord interaction, and if so, it sends it to the right command (e.g., /dig, /multi-dig, etc.), using a handler that calls out to a custom framework for Discord slash commands. If it’s not from Discord, it can also serve routes like the privacy page or terms of service.

Here’s what that looks like in code:

export default {
  // Process all requests to the Worker
  fetch: async (request, env, ctx) => {
    try {
      // Include the env in the context we pass to the handler
      ctx.env = env;

      // Check if it's a Discord interaction (or a health check)
      const resp = await handler(request, ctx);
      if (resp) return resp;

      // Otherwise, process the request
      const url = new URL(request.url);

      if (request.method === 'GET' && url.pathname === '/privacy')
        return new textResponse(Privacy);

      if (request.method === 'GET' && url.pathname === '/terms')
        return new textResponse(Terms);

      // Fallback if nothing matches
      return new textResponse(null, { status: 404 });
    } catch (err) {
      // Log any errors
      captureException(err);

      // Re-throw the error
      throw err;
    }
  },
};

by James Ross


placeholders.dev is a service that generates placeholder images, making it easy for developers to prototype and scaffold websites without dealing with hosting or asset management. Users can generate placeholders instantly with a simple URL, such as: https://images.placeholders.dev/350x150

Since placeholders are typically used in early development, speed and consistency matter, and images need to load instantly so the workflow isn’t interrupted. Running on Cloudflare Workers makes the service fast and consistent no matter where developers are.

This project uses the Workers Paid plan because it regularly exceeds the free-tier limits on requests and compute time. The Worker below shows the core of how the service works. When a request comes in, it looks at the URL path (like /300x150) to determine the size of the placeholder, applies some defaults for style, and then returns an SVG image on the fly.

export default {
  async fetch(request: Request, env: Env, ctx: ExecutionContext) {
    try {
      const url = new URL(request.url);
      const cache = caches.default;

      // Handle requests for the placeholder API
      if (url.host === 'images.placeholders.dev' || url.pathname.startsWith('/api')) {
        // Try edge cache first
        const cached = await cache.match(url, { ignoreMethod: true });
        if (cached) return cached;

        // Default placeholder options
        const imageOptions: Options = {
   dataUri: false, // always return an unencoded SVG source
          width: 300,
          height: 150,
          fontFamily: 'sans-serif',
          fontWeight: 'bold',
          bgColor: '#ddd',
          textColor: 'rgba(0,0,0,0.5)',
        };

        // Parse sizes from path (e.g. /350 or /350x150)
        const sizeParts = url.pathname.replace('/api', '').replace('/', '').split('x');
        if (sizeParts[0]) {
          const width = sanitizeNumber(parseInt(sizeParts[0], 10));
          const height = sizeParts[1] ? sanitizeNumber(parseInt(sizeParts[1], 10)) : width;
          imageOptions.width = width;
          imageOptions.height = height;
        }

        // Generate SVG placeholder
        const response = new Response(simpleSvgPlaceholder(imageOptions), {
          headers: { 'content-type': 'image/svg+xml; charset=utf-8' },
        });

        // Cache result
        response.headers.set('Cache-Control', 'public, max-age=' + cacheTtl);
        ctx.waitUntil(cache.put(url, response.clone()));

        return response;
      }

      return new Response('Not Found', { status: 404 });
    } catch (err) {
      console.error(err);
      return new Response('Internal Error', { status: 500 });
    }
  },
};

Check out Built With Workers to see what other developers are building with our developer platform.


How do I get started?

This offering is available to United States students at least 18 years old with a verified .edu billing email address.

Based on when your account was created, you can redeem this offer either by signing up for a free Cloudflare account with your .edu email or by filling out a form to request access for your existing .edu account. Just make sure your verified .edu email address is your billing email address.

New .edu accounts

Existing .edu accounts

Creation Date 

Created on/after September 22, 2025

Created prior to September 22, 2025

How to Redeem

Sign up for a free Cloudflare account, add your credit card and ensure your verified .edu email address is added to your billing details.

Ensure your verified .edu email address is added to your billing details.

Fill out our form and a member of our team will help you get access

Note: in order to receive the credit, your verified .edu email address needs to be your billing email address 

Expanding Cloudflare for Students coverage

While our first offering is primarily for institutions in the US, we’re working on expanding support for our students in other countries and plan to add additional higher education domain names after launch. If you’re at an educational institution outside of the United States, please reach out to us and apply for your educational/academic domain to be added. We’ll let you know as soon as it becomes available in your region. Check our Cloudflare for Students page for updates and keep an eye out for emails if you have an account with a newly supported domain.

Whether you’re gearing up for your first hackathon, launching a side project, or looking to build the next big thing, you can get started today with free access and join a global developer community already building on Cloudflare.

Get started by signing up or requesting access today.


Cap’n Web: a new RPC system for browsers and web servers

Post Syndicated from Kenton Varda original https://blog.cloudflare.com/capnweb-javascript-rpc-library/

Allow us to introduce Cap’n Web, an RPC protocol and implementation in pure TypeScript.

Cap’n Web is a spiritual sibling to Cap’n Proto, an RPC protocol I (Kenton) created a decade ago, but designed to play nice in the web stack. That means:

  • Like Cap’n Proto, it is an object-capability protocol. (“Cap’n” is short for “capabilities and”.) We’ll get into this more below, but it’s incredibly powerful.

  • Unlike Cap’n Proto, Cap’n Web has no schemas. In fact, it has almost no boilerplate whatsoever. This means it works more like the JavaScript-native RPC system in Cloudflare Workers.

  • That said, it integrates nicely with TypeScript.

  • Also unlike Cap’n Proto, Cap’n Web’s underlying serialization is human-readable. In fact, it’s just JSON, with a little pre-/post-processing.

  • It works over HTTP, WebSocket, and postMessage() out-of-the-box, with the ability to extend it to other transports easily.

  • It works in all major browsers, Cloudflare Workers, Node.js, and other modern JavaScript runtimes.

  • The whole thing compresses (minify+gzip) to under 10 kB with no dependencies.

  • It’s open source under the MIT license.

Cap’n Web is more expressive than almost every other RPC system, because it implements an object-capability RPC model. That means it:

  • Supports bidirectional calling. The client can call the server, and the server can also call the client.

  • Supports passing functions by reference: If you pass a function over RPC, the recipient receives a “stub”. When they call the stub, they actually make an RPC back to you, invoking the function where it was created. This is how bidirectional calling happens: the client passes a callback to the server, and then the server can call it later.

  • Similarly, supports passing objects by reference: If a class extends the special marker type RpcTarget, then instances of that class are passed by reference, with method calls calling back to the location where the object was created.

  • Supports promise pipelining. When you start an RPC, you get back a promise. Instead of awaiting it, you can immediately use the promise in dependent RPCs, thus performing a chain of calls in a single network round trip.

  • Supports capability-based security patterns.

In short, Cap’n Web lets you design RPC interfaces the way you’d design regular JavaScript APIs – while still acknowledging and compensating for network latency.

The best part is, Cap’n Web is absolutely trivial to set up.

A client looks like this:

import { newWebSocketRpcSession } from "capnweb";

// One-line setup.
let api = newWebSocketRpcSession("wss://example.com/api");

// Call a method on the server!
let result = await api.hello("World");

console.log(result);

And here’s a complete Cloudflare Worker implementing an RPC server:

import { RpcTarget, newWorkersRpcResponse } from "capnweb";

// This is the server implementation.
class MyApiServer extends RpcTarget {
  hello(name) {
    return `Hello, ${name}!`
  }
}

// Standard Workers HTTP handler.
export default {
  fetch(request, env, ctx) {
    // Parse URL for routing.
    let url = new URL(request.url);

    // Serve API at `/api`.
    if (url.pathname === "/api") {
      return newWorkersRpcResponse(request, new MyApiServer());
    }

    // You could serve other endpoints here...
    return new Response("Not found", {status: 404});
  }
}

That’s it. That’s the app.

  • You can add more methods to MyApiServer, and call them from the client.

  • You can have the client pass a callback function to the server, and then the server can just call it.

  • You can define a TypeScript interface for your API, and easily apply it to the client and server.

It just works.

Why RPC? (And what is RPC anyway?)

Remote Procedure Calls (RPC) are a way of expressing communications between two programs over a network. Without RPC, you might communicate using a protocol like HTTP. With HTTP, though, you must format and parse your communications as an HTTP request and response, perhaps designed in REST style. RPC systems try to make communications look like a regular function call instead, as if you were calling a library rather than a remote service. The RPC system provides a “stub” object on the client side which stands in for the real server-side object. When a method is called on the stub, the RPC system figures out how to serialize and transmit the parameters to the server, invoke the method on the server, and then transmit the return value back.

The merits of RPC have been subject to a great deal of debate. RPC is often accused of committing many of the fallacies of distributed computing.

But this reputation is outdated. When RPC was first invented some 40 years ago, async programming barely existed. We did not have Promises, much less async and await. Early RPC was synchronous: calls would block the calling thread waiting for a reply. At best, latency made the program slow. At worst, network failures would hang or crash the program. No wonder it was deemed “broken”.

Things are different today. We have Promise and async and await, and we can throw exceptions on network failures. We even understand how RPCs can be pipelined so that a chain of calls takes only one network round trip. Many large distributed systems you likely use every day are built on RPC. It works.

The fact is, RPC fits the programming model we’re used to. Every programmer is trained to think in terms of APIs composed of function calls, not in terms of byte stream protocols nor even REST. Using RPC frees you from the need to constantly translate between mental models, allowing you to move faster.

When should you use Cap’n Web?

Cap’n Web is useful anywhere where you have two JavaScript applications speaking to each other over a network, including client-to-server and microservice-to-microservice scenarios. However, it is particularly well-suited to interactive web applications with real-time collaborative features, as well as modeling interactions over complex security boundaries.

Cap’n Web is still new and experimental, so for now, a willingness to live on the cutting edge may also be required!

Features, features, features…

Here’s some more things you can do with Cap’n Web.

HTTP batch mode

Sometimes a WebSocket connection is a bit too heavyweight. What if you just want to make a quick one-time batch of calls, but don’t need an ongoing connection?

For that, Cap’n Web supports HTTP batch mode:

import { newHttpBatchRpcSession } from "capnweb";

let batch = newHttpBatchRpcSession("https://example.com/api");

let result = await batch.hello("World");

console.log(result);

(The server is exactly the same as before.)

Note that once you’ve awaited an RPC in the batch, the batch is done, and all the remote references received through it become broken. To make more calls, you need to start over with a new batch. However, you can make multiple calls in a single batch:

let batch = newHttpBatchRpcSession("https://example.com/api");

// We can call make multiple calls, as long as we await them all at once.
let promise1 = batch.hello("Alice");
let promise2 = batch.hello("Bob");

let [result1, result2] = await Promise.all([promise1, promise2]);

console.log(result1);
console.log(result2);

And that brings us to another feature…

Chained calls (Promise Pipelining)

Here’s where things get magical.

In both batch mode and WebSocket mode, you can make a call that depends on the result of another call, without waiting for the first call to finish. In batch mode, that means you can, in a single batch, call a method, then use its result in another call. The entire batch still requires only one network round trip.

For example, say your API is:

class MyApiServer extends RpcTarget {
  getMyName() {
    return "Alice";
  }

  hello(name) {
    return `Hello, ${name}!`
  }
}

You can do:

let namePromise = batch.getMyName();
let result = await batch.hello(namePromise);

console.log(result);

Notice the initial call to getMyName() returned a promise, but we used the promise itself as the input to hello(), without awaiting it first. With Cap’n Web, this just works: The client sends a message to the server saying: “Please insert the result of the first call into the parameters of the second.”

Or perhaps the first call returns an object with methods. You can call the methods immediately, without awaiting the first promise, like:

let batch = newHttpBatchRpcSession("https://example.com/api");

// Authencitate the API key, returning a Session object.
let sessionPromise = batch.authenticate(apiKey);

// Get the user's name.
let name = await sessionPromise.whoami();

console.log(name);

This works because the promise returned by a Cap’n Web call is not a regular promise. Instead, it’s a JavaScript Proxy object. Any methods you call on it are interpreted as speculative method calls on the eventual result. These calls are sent to the server immediately, telling the server: “When you finish the call I sent earlier, call this method on what it returns.”

Did you spot the security?

This last example shows an important security pattern enabled by Cap’n Web’s object-capability model.

When we call the authenticate() method, after it has verified the provided API key, it returns an authenticated session object. The client can then make further RPCs on the session object to perform operations that require authorization as that user. The server code might look like this:

class MyApiServer extends RpcTarget {
  authenticate(apiKey) {
    let username = await checkApiKey(apiKey);
    return new AuthenticatedSession(username);
  }
}

class AuthenticatedSession extends RpcTarget {
  constructor(username) {
    super();
    this.username = username;
  }

  whoami() {
    return this.username;
  }

  // ...other methods requiring auth...
}

Here’s what makes this work: It is impossible for the client to “forge” a session object. The only way to get one is to call authenticate(), and have it return successfully.

In most RPC systems, it is not possible for one RPC to return a stub pointing at a new RPC object in this way. Instead, all functions are top-level, and can be called by anyone. In such a traditional RPC system, it would be necessary to pass the API key again to every function call, and check it again on the server each time. Or, you’d need to do authorization outside of the RPC system entirely.

This is a common pain point for WebSockets in particular. Due to the design of the web APIs for WebSocket, you generally cannot use headers nor cookies to authorize them. Instead, authorization must happen in-band, by sending a message over the WebSocket itself. But this can be annoying for RPC protocols, as it means the authentication message is “special” and changes the state of the connection itself, affecting later calls. This breaks the abstraction.

The authenticate() pattern shown above neatly makes authentication fit naturally into the RPC abstraction. It’s even type-safe: you can’t possibly forget to authenticate before calling a method requiring auth, because you wouldn’t have an object on which to make the call. Speaking of type-safety…

TypeScript

If you use TypeScript, Cap’n Web plays nicely with it. You can declare your RPC API once as a TypeScript interface, implement in on the server, and call it on the client:

// Shared interface declaration:
interface MyApi {
  hello(name: string): Promise<string>;
}

// On the client:
let api: RpcStub<MyApi> = newWebSocketRpcSession("wss://example.com/api");

// On the server:
class MyApiServer extends RpcTarget implements MyApi {
  hello(name) {
    return `Hello, ${name}!`
  }
}

Now you get end-to-end type checking, auto-completed method names, and so on.

Note that, as always with TypeScript, no type checks occur at runtime. The RPC system itself does not prevent a malicious client from calling an RPC with parameters of the wrong type. This is, of course, not a problem unique to Cap’n Web – JSON-based APIs have always had this problem. You may wish to use a runtime type-checking system like Zod to solve this. (Meanwhile, we hope to add type checking based directly on TypeScript types in the future.)

An alternative to GraphQL?

If you’ve used GraphQL before, you might notice some similarities. One benefit of GraphQL was to solve the “waterfall” problem of traditional REST APIs by allowing clients to ask for multiple pieces of data in one query. For example, instead of making three sequential HTTP calls:

GET /user
GET /user/friends
GET /user/friends/photos

…you can write one GraphQL query to fetch it all at once.

That’s a big improvement over REST, but GraphQL comes with its own tradeoffs:

  • New language and tooling. You have to adopt GraphQL’s schema language, servers, and client libraries. If your team is all-in on JavaScript, that’s a lot of extra machinery.

  • Limited composability. GraphQL queries are declarative, which makes them great for fetching data, but awkward for chaining operations or mutations. For example, you can’t easily say: “create a user, then immediately use that new user object to make a friend request, all-in-one round trip.”

  • Different abstraction model. GraphQL doesn’t look or feel like the JavaScript APIs you already know. You’re learning a new mental model rather than extending the one you use every day.

How Cap’n Web goes further

Cap’n Web solves the waterfall problem without introducing a new language or ecosystem. It’s just JavaScript. Because Cap’n Web supports promise pipelining and object references, you can write code that looks like this:

let user = api.createUser({ name: "Alice" });
let friendRequest = await user.sendFriendRequest("Bob");

What happens under the hood? Both calls are pipelined into a single network round trip:

  1. Create the user.

  2. Take the result of that call (a new User object).

  3. Immediately invoke sendFriendRequest() on that object.

All of this is expressed naturally in JavaScript, with no schemas, query languages, or special tooling required. You just call methods and pass objects around, like you would in any other JavaScript code.

In other words, GraphQL gave us a way to flatten REST’s waterfalls. Cap’n Web lets us go even further: it gives you the power to model complex interactions exactly the way you would in a normal program, with no impedance mismatch.

But how do we solve arrays?

With everything we’ve presented so far, there’s a critical missing piece to seriously consider Cap’n Web as an alternative to GraphQL: handling lists. Often, GraphQL is used to say: “Perform this query, and then, for every result, perform this other query.” For example: “List the user’s friends, and then for each one, fetch their profile photo.”

In short, we need an array.map() operation that can be performed without adding a round trip.

Cap’n Proto, historically, has never supported such a thing.

But with Cap’n Web, we’ve solved it. You can do:

let user = api.authenticate(token);

// Get the user's list of friends (an array).
let friendsPromise = user.listFriends();

// Do a .map() to annotate each friend record with their photo.
// This operates on the *promise* for the friends list, so does not
// add a round trip.
// (wait WHAT!?!?)
let friendsWithPhotos = friendsPromise.map(friend => {
  return {friend, photo: api.getUserPhoto(friend.id))};
}

// Await the friends list with attached photos -- one round trip!
let results = await friendsWithPhotos;

Wait… How!?

.map() takes a callback function, which needs to be applied to each element in the array. As we described earlier, normally when you pass a function to an RPC, the function is passed “by reference”, meaning that the remote side receives a stub, where calling that stub makes an RPC back to the client where the function was created.

But that is NOT what is happening here. That would defeat the purpose: we don’t want the server to have to round-trip to the client to process every member of the array. We want the server to just apply the transformation server-side.

To that end, .map() is special. It does not send JavaScript code to the server, but it does send something like “code”, restricted to a domain-specific, non-Turing-complete language. The “code” is a list of instructions that the server should carry out for each member of the array. In this case, the instructions are:

  1. Invoke api.getUserPhoto(friend.id).

  2. Return an object {friend, photo}, where friend is the original array element and photo is the result of step 1.

But the application code just specified a JavaScript method. How on Earth could we convert this into the narrow DSL?

The answer is record-replay: On the client side, we execute the callback once, passing in a special placeholder value. The parameter behaves like an RPC promise. However, the callback is required to be synchronous, so it cannot actually await this promise. The only thing it can do is use promise pipelining to make pipelined calls. These calls are intercepted by the implementation and recorded as instructions, which can then be sent to the server, where they can be replayed as needed.

And because the recording is based on promise pipelining, which is what the RPC protocol itself is designed to represent, it turns out that the “DSL” used to represent “instructions” for the map function is just the RPC protocol itself. 🤯

Implementation details

JSON-based serialization

Cap’n Web’s underlying protocol is based on JSON – but with a preprocessing step to handle special types. Arrays are treated as “escape sequences” that let us encode other values. For example, JSON does not have an encoding for Date objects, but Cap’n Web does. You might see a message that looks like this:

{
  event: "Birthday Week",
  timestamp: ["date", 1758499200000]
}

To encode a literal array, we simply double-wrap it in []:

{
  names: [["Alice", "Bob", "Carol"]]
}

In other words, an array with just one element which is itself an array, evaluates to the inner array literally. An array whose first element is a type name, evaluates to an instance of that type, where the remaining elements are parameters to the type.

Note that only a fixed set of types are supported: essentially, “structured clonable” types, and RPC stub types.

On top of this basic encoding, we define an RPC protocol inspired by Cap’n Proto – but greatly simplified.

RPC protocol

Since Cap’n Web is a symmetric protocol, there is no well-defined “client” or “server” at the protocol level. There are just two parties exchanging messages across a connection. Every kind of interaction can happen in either direction.

In order to make it easier to describe these interactions, I will refer to the two parties as “Alice” and “Bob”.

Alice and Bob start the connection by establishing some sort of bidirectional message stream. This may be a WebSocket, but Cap’n Web also allows applications to define their own transports. Each message in the stream is JSON-encoded, as described earlier.

Alice and Bob each maintain some state about the connection. In particular, each maintains an “export table”, describing all the pass-by-reference objects they have exposed to the other side, and an “import table”, describing the references they have received. Alice’s exports correspond to Bob’s imports, and vice versa. Each entry in the export table has a signed integer ID, which is used to reference it. You can think of these IDs like file descriptors in a POSIX system. Unlike file descriptors, though, IDs can be negative, and an ID is never reused over the lifetime of a connection.

At the start of the connection, Alice and Bob each populate their export tables with a single entry, numbered zero, representing their “main” interfaces. Typically, when one side is acting as the “server”, they will export their main public RPC interface as ID zero, whereas the “client” will export an empty interface. However, this is up to the application: either side can export whatever they want.

From there, new exports are added in two ways:

  • When Alice sends a message to Bob that contains within it an object or function reference, Alice adds the target object to her export table. IDs assigned in this case are always negative, starting from -1 and counting downwards.

  • Alice can send a “push” message to Bob to request that Bob add a value to his export table. The “push” message contains an expression which Bob evaluates, exporting the result. Usually, the expression describes a method call on one of Bob’s existing exports – this is how an RPC is made. Each “push” is assigned a positive ID on the export table, starting from 1 and counting upwards. Since positive IDs are only assigned as a result of pushes, Alice can predict the ID of each push she makes, and can immediately use that ID in subsequent messages. This is how promise pipelining is achieved.

After sending a push message, Alice can subsequently send a “pull” message, which tells Bob that once he is done evaluating the “push”, he should proactively serialize the result and send it back to Alice, as a “resolve” (or “reject”) message. However, this is optional: Alice may not actually care to receive the return value of an RPC, if Alice only wants to use it in promise pipelining. In fact, the Cap’n Web implementation will only send a “pull” message if the application has actually awaited the returned promise.

Putting it together, a code sequence like this:

{
  names: [["Alice", "Bob", "Carol"]]
}

Might produce a message exchange like this:

// Call api.getByName(). `api` is the server's main export, so has export ID 0.
-> ["push", ["pipeline", 0, "getMyName", []]
// Call api.hello(namePromise). `namePromise` refers to the result of the first push,
// so has ID 1.
-> ["push", ["pipeline", 0, "hello", [["pipeline", 1]]]]
// Ask that the result of the second push be proactively serialized and returned.
-> ["pull", 2]
// Server responds.
<- ["resolve", 2, "Hello, Alice!"]

For more details about the protocol, check out the docs.

Try it out!

Cap’n Web is new and still highly experimental. There may be bugs to shake out. But, we’re already using it today. Cap’n Web is the basis of the recently-launched “remote bindings” feature in Wrangler, allowing a local test instance of workerd to speak RPC to services in production. We’ve also begun to experiment with it in various frontend applications – expect more blog posts on this in the future.

In any case, Cap’n Web is open source, and you can start using it in your own projects now.

Check it out on GitHub.


Help build the future: announcing Cloudflare’s goal to hire 1,111 interns in 2026

Post Syndicated from Kelly Russell original https://blog.cloudflare.com/cloudflare-1111-intern-program/

At Cloudflare, our mission is to help build a better Internet. That mission is ambitious, long-term, and requires constant innovation. But building for the future isn’t just about the technology we create — it’s also about investing in the people who will create it. That’s why today, we are incredibly excited to announce our most ambitious intern program yet: Cloudflare aims to hire as many as 1,111 interns over the course of 2026. This effort to grow our number of interns next year will happen in hub locations around the world. 

Why is Cloudflare doing this? 

We view internships as a vital pipeline for talent and a source of new energy and ideas. The number of our intern goal, a nod to our 1.1.1.1 public DNS resolver, is intentional. It represents our deep technical roots and our focus on building foundational infrastructure for the Internet. Now, we stand at the cusp of a new technological revolution: the age of AI.

To win in this new era, we can’t just rely on established methods. We need new ways of thinking, unconstrained by the “way things have always been done.” That’s why this significantly increased class of interns will have a special focus: to ramp up the creative and widespread application of AI with a fresh approach.

We want this group to challenge our assumptions. They will be tasked with looking at our customers’ needs, our products and features, our network, and our operations to find novel ways to utilize AI. How can AI make our network even smarter? How can it help our customers be more secure and efficient? How can it transform our own business processes? We believe that by empowering a large, diverse cohort of bright minds who have grown up as digital and now AI natives, we will unlock innovations we haven’t even imagined yet.

This is the exact right time to expand our intern program 

Like you, we have seen numerous reports that more and more firms are capping their total headcount in favor of leaning on more AI tools, leading to downsizing their intern and new-graduate hiring. This is resulting in increased sidelining of new college graduates. But we think this misreads the moment completely, so we’re heading in the opposite direction. 

While we are excited about what AI tools can help do, we have a different philosophy about their role. AI tools make great team members even better, and allow firms to set more ambitious goals. They are not replacements for new hires — but ways to multiply how new hires can contribute to a team.

The next phase of Cloudflare’s success will be driven by considerable change in almost everything we do. And although we have an amazing team, we are humble enough to realize that we don’t possess everything we need to envision and implement that radical change. We need the innovation and fresh approach of a talented new generation of leaders. And we can’t press “pause” on bringing aboard that talent. 

This isn’t the first time we’ve made a counter-cultural commitment to interns. Back in the 2020, as the world faced unprecedented uncertainty, many companies made the difficult decision to scale back or cancel their internship programs. We went in the opposite direction. Believing that investing in talent was more critical than ever, we doubled the size of our intern class. We knew that these students represented the future, and abandoning them was not an option. That decision reinforced our culture of long-term thinking and our responsibility to foster emerging talent, especially during the toughest of times. And we’ve benefitted from it — some of our most promising young employees emerged from this batch.

Interns ship at Cloudflare

Interns at Cloudflare do real, meaningful work — they ship. They join active teams, and are expected to contribute to the problems that we solve everyday. Our interns don’t merely get a feel for the place and fetch coffee. This isn’t a “test drive.” We want every member of our intern program to take ownership of and conclude their time being able to point to a concrete deliverable that solved a real customer or internal problem at Cloudflare. 

From day one, interns are embedded in teams across the company — from engineering and product to marketing, legal, and finance. They work alongside seasoned experts on critical projects, contributing code that ships to millions, launching marketing campaigns, and helping to shape the policies that govern the Internet. Our goal is not just to provide an internship experience; it’s to provide the foundation for a career. We are committed to training the people who will one day lead our company, our industry, and the future of the Internet.

The challenges we address will vary by intern and by team. You can review examples of intern projects from last year in this post here and real, dedicated, announcements from interns who launched new technologies here and here. Some of our interns operate as if they were just one more engineer or staff member on an existing team, helping contribute to its mission. Others are tasked with more exploratory projects where we ask them to go research and prototype new ideas.

Aside from impactful project work, our internship program offers a deep dive into our culture, while providing interns with practical experience and leadership skills. They’ll build a valuable professional network, from engaging in social events and coffee chats to gaining direct access to executives through exclusive Q&A sessions. Every intern is paired with a dedicated mentor, and they’ll get the chance to present their final work to the entire company. By the end of the program, interns will not only have enhanced their skills but also built lasting relationships to benefit their future careers.

What do we look for in an intern?

We are looking for talented, curious, empathetic, and hard working team members who are inspired by our mission to help build a better Internet. Come with the attitude to learn, and we will handle the rest. We do not expect interns to be immediate experts in the fields they are joining. The Internet is full of enough jokes about companies posting a job for an internship and asking for ten years of work experience.

We do try to match opportunities with the applicant’s study areas and relevant skills. We want to equip our interns for success and prefer, for example, finding software engineering opportunities for computer science students or accounting opportunities for finance majors. Each internship role posted will specify any specific preferences we have for areas of study. We recognize that many students have robust portfolios, GitHub projects, or open-source contributions. We’ll optimize our matching process to connect you with a relevant team where you can immediately apply your skills and elevate your work.

Thousands of candidates apply for our internships each year. We expect this expansion to increase that level of interest significantly. To help identify the kinds of builders we want to recruit, we are going to fast track engineering and other candidates who complete an assignment to build a type of AI-powered application on Cloudflare (more details on that below).


How does the internship program work?

Working in Hub Offices

As part of this program, we will only be hiring interns who can be present multiple days each week in one of our hub offices (generally 3-4 days depending on the team). Cloudflare has adopted a hybrid approach to work centered in “hub” locations around the world. The various hybrid approaches adopted by different teams are based on experimentation and their unique functions. For interns, we think it is important for new and early career team members here for a brief tenure to connect with each other as well as more senior leaders in our organization. We believe that mentorship and coaching is best done in person. 

We expect to post internship opportunities in the following Cloudflare office locations:

  • Austin, USA

  • New York City, USA

  • San Francisco, USA

  • Bengaluru, India

  • Lisbon, Portugal

  • London, UK

Year Round

Our internships generally last for 12 weeks. While we plan to prioritize summer internships, we expect to hire significant numbers of interns in the spring and fall of 2026 as well.

Summer internships give students an opportunity to get experience without interrupting a school semester. The seasonal approach also makes it possible for us to create cohorts of interns who support each other on projects. That said, we know that education has changed a bit since we were in school. An increasing number of universities have developed programs for students to work with companies as part of a normal school semester, and others are more flexible in their approach to letting students choose to reduce hours or take a semester away from classwork to support an internship. 

Real pay for real work

We pay our interns. This means a competitive rate that is generally akin to the prorated salary of an entry-level position. And if you have to relocate temporarily to a city where we have an office, we will give you a stipend to support your travel and housing needs. Since we expect interns at Cloudflare to contribute immediately to real problem solving, it’s only fair to pay them accordingly. 

And we believe it’s incredibly important to pay interns. Many long-term employment opportunities arise through internship programs, so it’s unfair to limit those programs to those who can afford to relocate and work full time for little or no pay. 

How to apply

  1. Keep an eye on our career site, and specifically our internship opportunities listed here. We will start posting more internship opportunities for 2026 starting on October 15th. 

  2. The intern opportunities page will link to our internship application portal that will streamline the application process. We plan to review applications in batches until all positions are filled. Our interview process will take 3-4 weeks.

  3. Want a leg up? For the Software Engineering internship, we plan to fast track review of candidates who complete an assignment to build a type of AI-powered application on Cloudflare. Submit directly with your application.

We look forward to hearing from you.

A Lookback at Workers Launchpad and a Warm Welcome to Cohort #6

Post Syndicated from Christopher Rotas original https://blog.cloudflare.com/workers-launchpad-006/

Imagine you have an idea for an AI application that you’re really excited about — but the cost of GPU time and complex infrastructure stops you in your tracks before you even write a line of code. This is the problem founders everywhere face: balancing high infrastructure costs with the need to innovate and scale quickly.

Our startup programs remove those barriers, so founders can focus on what matters the most: building products, finding customers, and growing a business. Cloudflare for Startups launched in 2018 to provide enterprise-level application security and performance services to growing startups. As we built out our Developer Platform, we pivoted last year to offer founders up to $250,000 in cloud credits to build on our Developer Platform for up to one year.

During Birthday Week 2022, we announced our Cloudflare Workers Launchpad Program with an initial $1.25 billion in potential funding for startups building on Cloudflare Workers, made possible through partnerships with 26 leading venture capital (VC) firms. Within months, we expanded VC-backed funding to $2 billion.

Since 2022, we’ve welcomed 145 startups from 23 countries. These startups are solving problems across verticals such as AI and machine learning, developer tools, 3D design, cloud infrastructure, data tools, ad tech, media, logistics, finance, and other industries. We’re especially proud of the female founder representation in recent cohorts — with nearly a third of companies in Cohort #5 run by a female founder. 

Participants engaged in bootcamp sessions with Cloudflare leadership and product teams, covering key topics like product pricing and scaling sales. Startups received hands-on design support from our Solutions Architecture team, empowering these builders to build and scale their full-stack applications on the Cloudflare network. We facilitate countless introductions across the VC network, and are happy to see funding and M&A activity as these startups scale. Cloudflare also identified direct opportunities and acquired Nefeli Networks (Cohort #2) and Outerbase (Cohort #4).

Check out what Launchpad alumni have to say about their experience in the program:

Langbase (Cohort #3)
Ship hyper-personalized AI apps to any LLM, any data, any developer in seconds


“For Langbase, the best part about Workers Launchpad was the incredible support from Cloudflare’s internal teams. It wasn’t just about access to infrastructure; it was the hands-on migration help, rapid feedback loops, and genuine partnership from engineers, product folks, and the broader Cloudflare community. That human support empowered us to iterate faster, solve hard problems, and truly feel like we were building something impactful together. 

Langbase has quickly become one of the most powerful serverless AI clouds for building and deploying AI agents. We process 700 TB of agent memory and 1.2 billion AI agent runs a month. Langbase is an agent lab, and we’ve also launched a coding agent called Command.new, an “agent of agents” that can take your prompts and turn them into production-ready agents by provisioning infrastructure and writing the agent’s code in TypeScript.

My advice for anyone joining future Workers Launchpad cohorts is to use every resource offered. Engage deeply with the Cloudflare teams, ask for feedback early and often, and be open to sharing your challenges and wins, especially in the Discord community, which is super helpful. Cloudflare listens closely to participant feedback and genuinely wants to help startups succeed. Treat it as a two-way conversation and a collaborative growth opportunity. This mindset is what unlocks the real power of the program.”

-Ahmad Awais, Founder & CEO of Langbase

Sherpo.io (Cohort #4)
AI-first no-code platform to build and sell digital content


“Since joining Cohort #4, we’ve exited closed beta and expanded our product suite for content creators. Today, more than 3,000 creators worldwide power their digital product stores with Sherpo, while we continue building and scaling.

We learned as much from fellow startups as from Cloudflare during office hours and sessions, and we got to meet incredible people along the way, including Cloudflare’s CSO, Stephanie Cohen.

For anyone joining, attend every session, listen closely, and ask questions—they’re incredibly valuable. Building on Workers has given us a real advantage, and the team’s pace of innovation only compounds it.”

-Giacomo Di Pinto, Co-Founder & CEO of Sherpo.io

Tightknit AI (Cohort #4)
Embedded community engagement platform built for SaaS


“Beyond the cloud credits that Launchpad provided us to play with every Cloudflare product, the most important aspect of the program we found was our ability to access (and even contribute) to the product roadmap. We were able to connect with product managers and solutions architects that have helped us take our work to the next level.

We’ve recently passed half a million users on the platform and have started to close not just the top Saas businesses in the world, but the top AI companies in the world, including Clay, Gamma, Lindy, beehiiv, Amplitude, Mixpanel, and so many more. The best part is that 100% of application logic is still powered by Cloudflare!

The biggest piece of advice for anyone starting the cohort is attend office hours as much as you can. I can’t tell you how many times we were able to unblock ourselves or even provide real product feedback/bug reports. It was amazing to meet the rest of the cohort and solve problems together that ordinary Cloudflare developers just do not face. So my advice is don’t miss the office hours. They were by far the most valuable part of our experience.”

-Zach Hawtof, Co-Founder & CEO of Tightknit.ai

Render Better (Cohort #4)
Increase e-commerce revenue by automatically optimizing your site speed


“My favorite part of the Launchpad was the community and the leaders who brought us together. The startup and product teams provided expert advice on both business and technical questions through meetings, 1-on-1s, and Discord. Many of them were former founders, so they understood what we were going through and helped us get what we needed. They were crucial in helping us get unstuck, whether we were using obscure Cloudflare features or needed connections to the right people.

I met a lot of great founders who are on the same journey and face the same struggles. Watching them grow was motivating and gave us a morale boost to keep up the fast pace a startup needs.

Since Launchpad, Render Better has scaled to 60 automated site speed optimizations, helping e-commerce sites convert 20% higher powered by Cloudflare Workers. Our growth accelerated after the program, and we’re now optimizing traffic for some of the biggest e-commerce brands like PSD, Polywood, and Self-Portrait. Render Better now processes 5 billion requests each month, made possible by Cloudflare’s global edge network and Workers platform.

Launchpad is truly just that: Cloudflare gives you the resources and attention to help you grow from an idea into something big. Build fast and take as much advantage of the fuel they give you to fly your startup rocket!”

-James Koshigoe, Founder & CEO of Render Better

Launchpad is growing into more than just a program. It is a community of builders and innovators showing what is possible with Cloudflare’s network behind them. With that foundation, we are excited to introduce the next group of entrepreneurs taking the stage in Cohort #6.

Introducing Cohort #6

Before introducing Cohort #6, we want to give one last shout out to Cohort #5. As Launchpad alumni, we cannot wait to see what you achieve. If you didn’t get a chance to check out Cohort #5’s demo day, watch  the recording here.

With that, help us give a warm welcome to the participants of Workers Launchpad Cohort #6:


We’re excited to see what Cohort #6 accomplishes. Follow @CloudflareDev on X and join our Developer Discord to stay updated on their progress. If you’re a startup interested in joining Workers Launchpad, applications for Cohort #7 are now open.

Company

About

Allegory

AI-Powered platform connecting impact to funding

Apgio

Mobile app localization platform with smart AI translations and workflow tooling

Atlas

Building the operating system for restaurants

Bloctave

Configurable rights management platform with instantaneous royalty distribution

Byte

AI code auditor that translates codebases into natural language

Calljmp

Agentic AI backend for apps

Centian

MCP-powered AI Agent middleware for successful and compliant operations

Divinci AI

Release management and quality assurance for custom LLMs

DXOS

An extensible open-core super-app designed to be your team’s brain

Fidsy

AI-native, code-free orchestration platform providing automated data privacy for all AI & Data workflows

Fluentos

Create popups your customers won’t hate

Framebird

Media sharing solution for creatives featuring modern galleries and client review tools

GoPersonal

AI to build, personalize, and manage your ecommerce business

Horizon

Short-form & agentic experiences for apps and websites

Kenobi

Personalizing the Internet with custom web experiences

MonetizationOS

Intelligent decisioning at the edge, for monetising the human and machine web

Natively.dev

Build your dream mobile app using AI, enabling users to take directly to App Stores

Outhire

AI agent automating phone screens without bias

Outsession

Privacy-first AI tools that preserve the therapeutic relationship

Phleid

Direct-to-wallet mobile passes and notifications platform

PlaySafe (By Doge Labs)

Makes voice-chat communities safer by detecting and blocking harassment in real time

Ploton

Help small business businesses grow by building workflows through natural conversation, not complex tools

Project Karna

Multimodal, continuous identity for the post-GenAI enterprise

Schematic

Simplify monetization for GTM teams, allowing them to control pricing, packaging, and entitlements without code changes

SonicLinker

Turn AI-agent visits into revenue

SuiteOp

All-in-one platform to streamline hospitality operations and guest services

SuprSend

Multi-channel notification engine for product and platform teams

Yara AI

Ethical, memory-rich AI for mental health at scale

Zephyr Cloud

Fastest way to go from idea to production

Zero Email

AI native email client that manages your inbox so you don’t have to

The collective thoughts of the interwebz