Pools across the sea: how Hyperdrive speeds up access to databases and why we’re making it free

Post Syndicated from Andrew Repp original https://blog.cloudflare.com/how-hyperdrive-speeds-up-database-access/

Free as in beer

In acknowledgement of its pivotal role in building distributed applications that rely on regional databases, we’re making Hyperdrive available on the free plan of Cloudflare Workers!

Hyperdrive enables you to build performant, global apps on Workers with your existing SQL databases. Tell it your database connection string, bring your existing drivers, and Hyperdrive will make connecting to your database faster. No major refactors or convoluted configuration required.

Over the past year, Hyperdrive has become a key service for teams that want to build their applications on Workers and connect to SQL databases. This includes our own engineering teams, with Hyperdrive serving as the tool of choice to connect from Workers to our own Postgres clusters for many of the control-plane actions of our billing, D1, R2, and Workers KV teams (just to name a few). 

This has highlighted for us that Hyperdrive is a fundamental building block, and it solves a common class of problems for which there isn’t a great alternative. We want to make it possible for everyone building on Workers to connect to their database of choice with the best performance possible, using the drivers and frameworks they already know and love.

Performance is a feature

To illustrate how much Hyperdrive can improve your application’s performance, let’s write the world’s simplest benchmark. This is obviously not production code, but is meant to be reflective of a common application you’d bring to the Workers platform. We’re going to use a simple table, a very popular OSS driver (postgres.js), and run a standard OLTP workload from a Worker. We’re going to keep our origin database in London, and query it from Chicago (those locations will come back up later, so keep them in mind).

// This is the test table we're using
// CREATE TABLE IF NOT EXISTS test_data(userId bigint, userText text, isActive bool);

import postgres from 'postgres';

let direct_conn = '<direct connection string here!>';
let hyperdrive_conn = env.HYPERDRIVE.connectionString;

async function measureLatency(connString: string) {
	let beginTime = Date.now();
	let sql = postgres(connString);

	await sql`INSERT INTO test_data VALUES (${999}, 'lorem_ipsum', ${true})`;
	await sql`SELECT userId, userText, isActive FROM test_data WHERE userId = ${999}`;

	let latency = Date.now() - beginTime;
	ctx.waitUntil(sql.end());
	return latency;
}

let directLatency = await measureLatency(direct_conn);
let hyperdriveLatency = await measureLatency(hyperdrive_conn);

The code above

  1. Takes a standard database connection string, and uses it to create a database connection.

  2. Loads a user record into the database.

  3. Queries all records for that user.

  4. Measures how long this takes to do with a direct connection, and with Hyperdrive.

When connecting directly to the origin database, this set of queries takes an average of 1200 ms. With absolutely no other changes, just swapping out the connection string for env.HYPERDRIVE.connectionString, this number is cut down to 500 ms (an almost 60% reduction). If you enable Hyperdrive’s caching, so that the SELECT query is served from cache, this takes only 320 ms. With this one-line change, Hyperdrive will reduce the latency of this Worker by almost 75%! In addition to this speedup, you also get secure auth and transport, as well as a connection pool to help protect your database from being overwhelmed when your usage scales up. See it for yourself using our demo application.
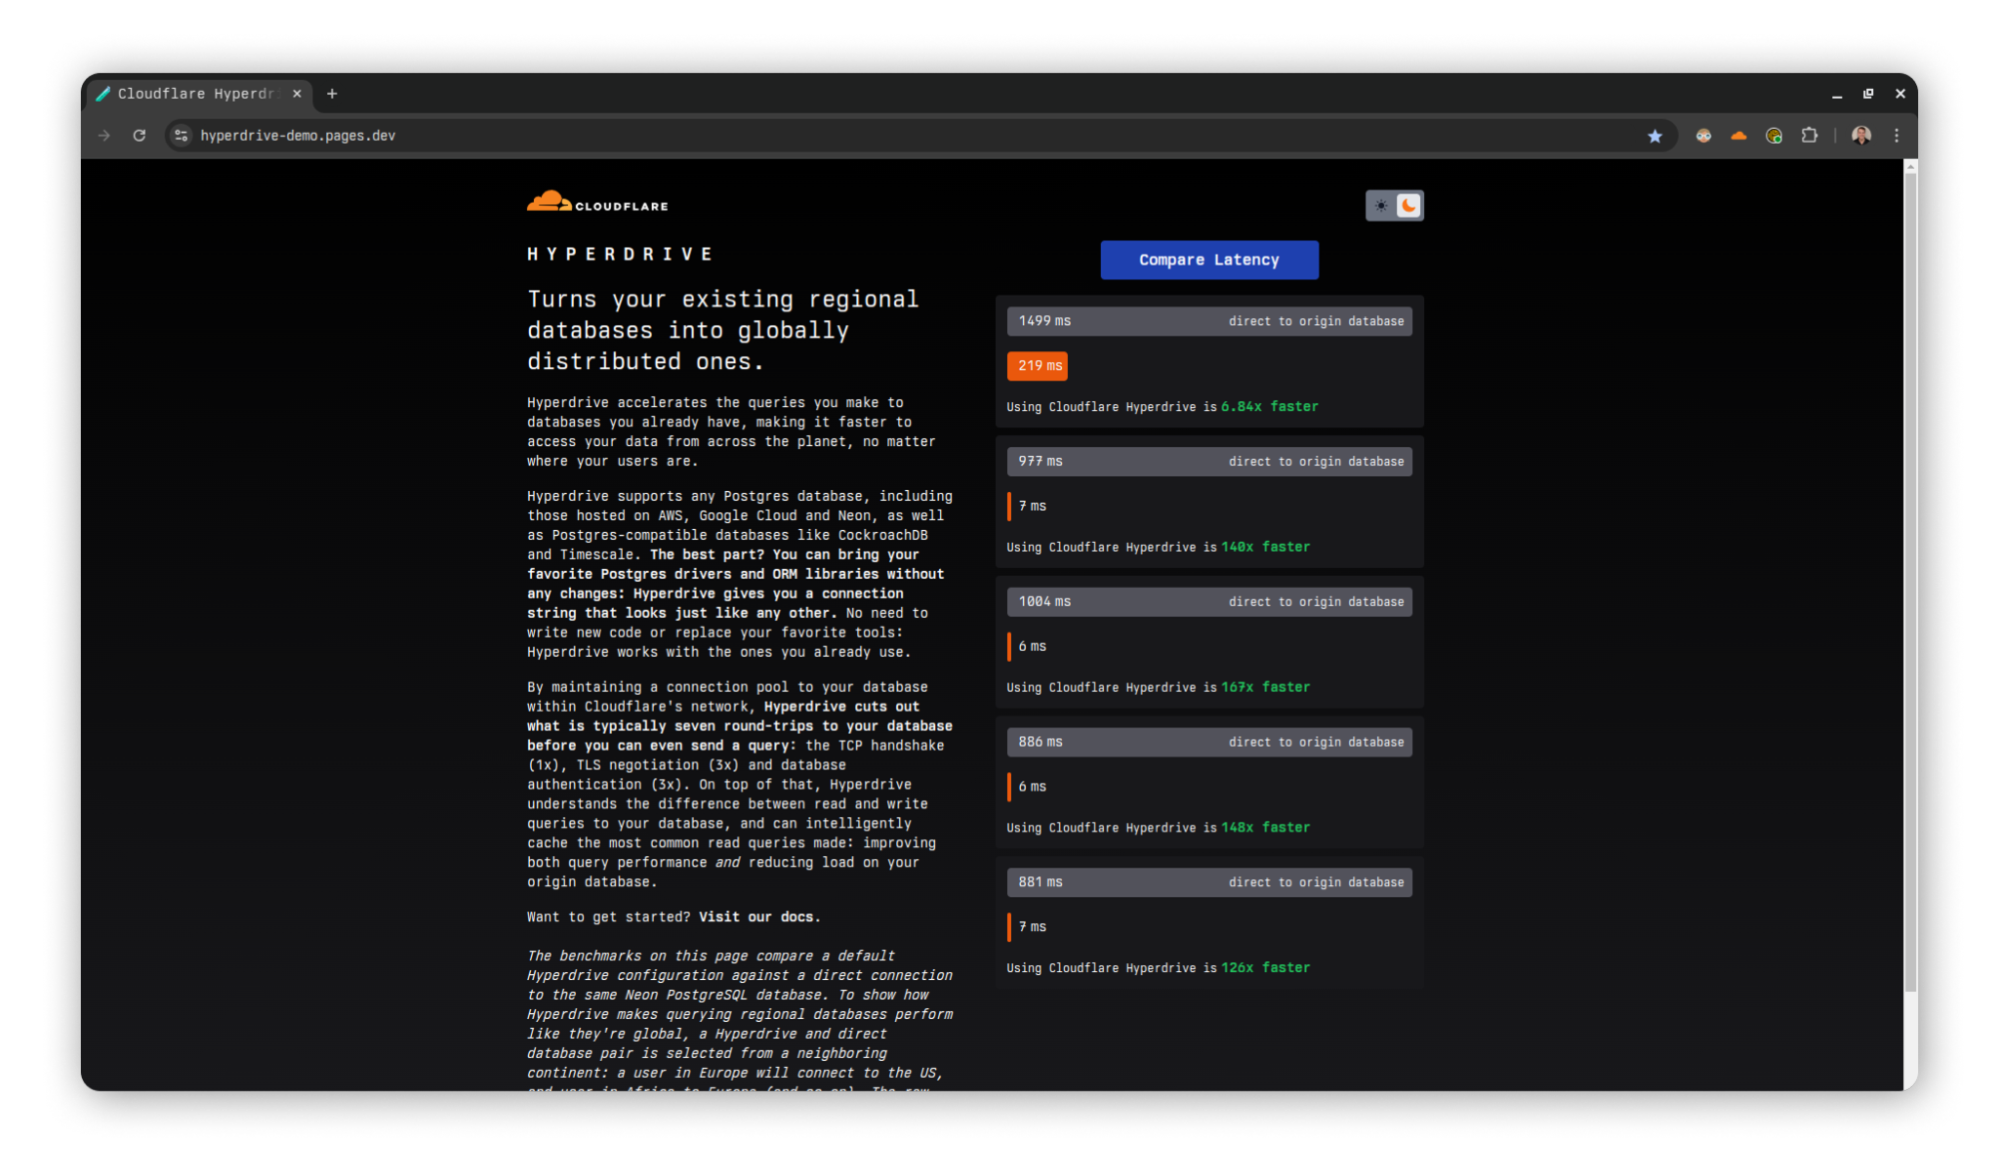

A demo application comparing latencies between Hyperdrive and direct-to-database connections.

Traditional SQL databases are familiar and powerful, but they are designed to be colocated with long-running compute. They were not conceived in the era of modern serverless applications, and have connection models that don’t take the constraints of such an environment into account. Instead, they require highly stateful connections that do not play well with Workers’ global and stateless model. Hyperdrive solves this problem by maintaining database connections across Cloudflare’s network ready to be used at a moment’s notice, caching your queries for fast access, and eliminating round trips to minimize network latency.

With this announcement, many developers are going to be taking a look at Hyperdrive for the first time over the coming weeks and months. To help people dive in and try it out, we think it’s time to talk about how Hyperdrive actually works.

Staying warm in the pool

Let’s talk a bit about database connection poolers, how they work, and what problems they already solve. They are hardly a new technology, after all. 

The point of any connection pooler, Hyperdrive or others, is to minimize the overhead of establishing and coordinating database connections. Every new database connection requires additional memory and CPU time from the database server, and this can only scale just so well as the number of concurrent connections climbs. So the question becomes, how should database connections be shared across clients? 

There are three commonly-used approaches for doing so. These are:

  • Session mode: whenever a client connects, it is assigned a connection of its own until it disconnects. This dramatically reduces the available concurrency, in exchange for much simpler implementation and a broader selection of supported features

  • Transaction mode: when a client is ready to send a query or open a transaction, it is assigned a connection on which to do so. This connection will be returned to the pool when the query or transaction concludes. Subsequent queries during the same client session may (or may not) be assigned a different connection.

  • Statement mode: Like transaction mode, but a connection is given out and returned for each statement. Multi-statement transactions are disallowed.

When building Hyperdrive, we had to decide which of these modes we wanted to use. Each of the approaches implies some fairly serious tradeoffs, so what’s the right choice? For a service intended to make using a database from Workers as pleasant as possible we went with the choice that balances features and performance, and designed Hyperdrive as a transaction-mode pooler. This best serves the goals of supporting a large number of short-lived clients (and therefore very high concurrency), while still supporting the transactional semantics that cause so many people to reach for an RDBMS in the first place.

In terms of this part of its design, Hyperdrive takes its cues from many pre-existing popular connection poolers, and manages operations to allow our users to focus on designing their full-stack applications. There is a configured limit to the number of connections the pool will give out, limits to how long a connection will be held idle until it is allowed to drop and return resources to the database, bookkeeping around prepared statements being shared across pooled connections, and other traditional concerns of the management of these resources to help ensure the origin database is able to run smoothly. These are all described in our documentation.

Round and round we go

Ok, so why build Hyperdrive then? Other poolers that solve these problems already exist — couldn’t developers using Workers just run one of those and call it a day? It turns out that connecting to regional poolers from Workers has the same major downside as connecting to regional databases: network latency and round trips.

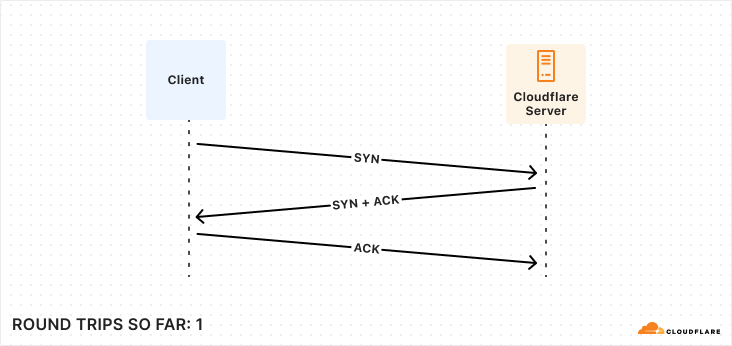
Establishing a connection, whether to a database or a pool, requires many exchanges between the client and server. While this is true for all fully-fledged client-server databases (e.g. MySQL, MongoDB), we are going to focus on the PostgreSQL connection protocol flow in this post. As we work through all of the steps involved, what we most want to keep track of is how many round trips it takes to accomplish. Note that we’re mostly concerned about having to wait around while these happen, so “half” round trips such as in the first diagram are not counted. This is because we can send off the message and then proceed without waiting.

The first step to establishing a connection between Postgres client and server is very familiar ground to anyone who’s worked much with networks: a TCP startup handshake. Postgres uses TCP for its underlying transport, and so we must have that connection before anything else can happen on top of it.

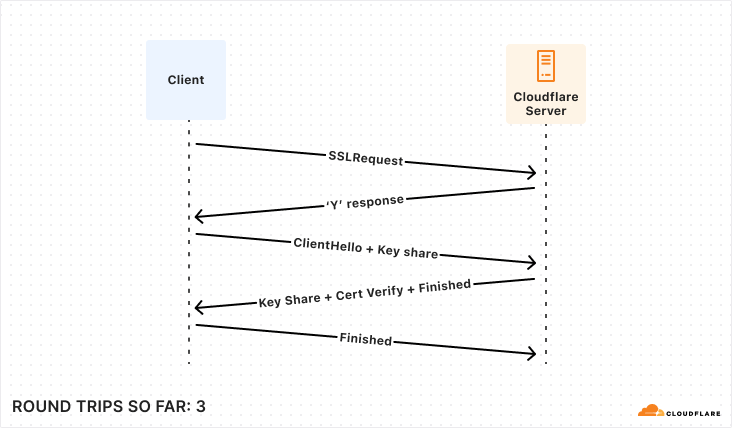
With our transport layer in place, the next step is to encrypt the connection. The TLS Handshake involves some back-and-forth in its own right, though this has been reduced to just one round trip for TLS 1.3. Below is the simplest and fastest version of this exchange, but there are certainly scenarios where it can be much more complex.

After the underlying transport is established and secured, the application-level traffic can actually start! However, we’re not quite ready for queries, the client still needs to authenticate to a specific user and database. Again, there are multiple supported approaches that offer varying levels of speed and security. To make this comparison as fair as possible, we’re again going to consider the version that offers the fastest startup (password-based authentication).
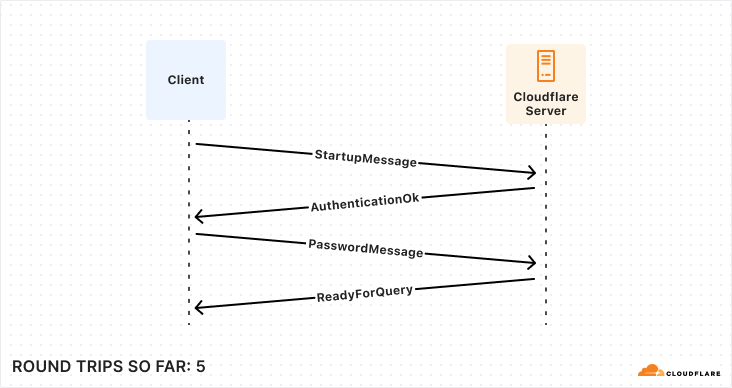

So, for those keeping score, establishing a new connection to your database takes a bare minimum of 5 round trips, and can very quickly climb from there. 

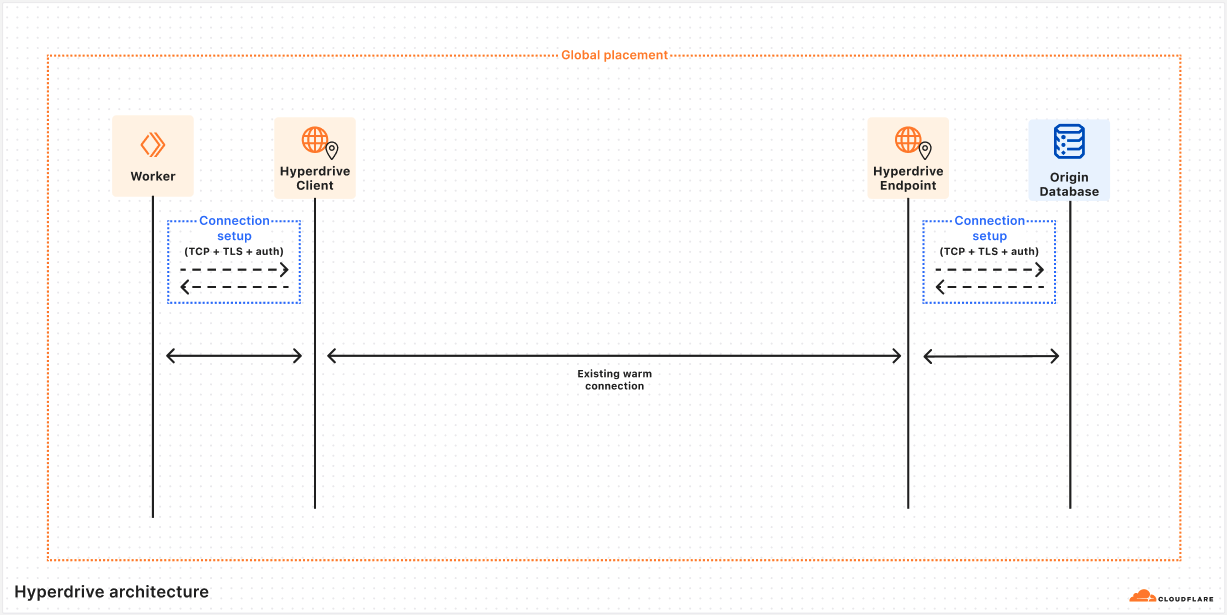
While the latency of any given network round trip is going to vary based on so many factors that “it depends” is the only meaningful measurement available, some quick benchmarking during the writing of this post shows ~125 ms from Chicago to London. Now multiply that number by 5 round trips and the problem becomes evident: 625 ms to start up a connection is not viable in a distributed serverless environment. So how does Hyperdrive solve it? What if I told you the trick is that we do it all twice? To understand Hyperdrive’s secret sauce, we need to dive into Hyperdrive’s architecture.

Impersonating a database server

The rest of this post is a deep dive into answering the question of how Hyperdrive does what it does. To give the clearest picture, we’re going to talk about some internal subsystems by name. To help keep everything straight, let’s start with a short glossary that you can refer back to if needed. These descriptions may not make sense yet, but they will by the end of the article.

Hyperdrive subsystem name

Brief description

Client

Lives on the same server as your Worker, talks directly to your database driver. This caches query results and sends queries to Endpoint if needed.

Endpoint

Lives in the data center nearest to your origin database, talks to your origin database. This caches query results and houses a pool of connections to your origin database.

Edge Validator

Sends a request to a Cloudflare data center to validate that Hyperdrive can connect to your origin database at time of creation.

Placement

Builds on top of Edge Validator to connect to your origin database from all eligible data centers, to identify which have the fastest connections.

The first subsystem we want to dig into is named Client. Client’s first job is to pretend to be a database server. When a user’s Worker wants to connect to their database via Hyperdrive, they use a special connection string that the Worker runtime generates on the fly. This tells the Worker to reach out to a Hyperdrive process running on the same Cloudflare server, and direct all traffic to and from the database client to it.

import postgres from "postgres";

// Connect to Hyperdrive
const sql = postgres(env.HYPERDRIVE.connectionString);

// sql will now talk over an RPC channel to Hyperdrive, instead of via TCP to Postgres

Once this connection is established, the database driver will perform the usual handshake expected of it, with our Client playing the role of a database server and sending the appropriate responses. All of this happens on the same Cloudflare server running the Worker, and we observe that the p90 for all this is 4 ms (p50 is 2 ms). Quite a bit better than 625 ms, but how does that help? The query still needs to get to the database, right?

Client’s second main job is to inspect the queries sent from a Worker, and decide whether they can be served from Cloudflare’s cache. We’ll talk more about that later on. Assuming that there are no cached query results available, Client will need to reach out to our second important subsystem, which we call Endpoint.

In for the long haul

Before we dig into the role Endpoint plays, it’s worth talking more about how the Client→Endpoint connection works, because it’s a key piece of our solution. We have already talked a lot about the price of network round trips, and how a Worker might be quite far away from the origin database, so how does Hyperdrive handle the long trip from the Client running alongside their Worker to the Endpoint running near their database without expensive round trips?

This is accomplished with a very handy bit of Cloudflare’s networking infrastructure. When Client gets a cache miss, it will submit a request to our networking platform for a connection to whichever data center Endpoint is running on. This platform keeps a pool of ready TCP connections between all of Cloudflare’s data centers, such that we don’t need to do any preliminary handshakes to begin sending application-level traffic. You might say we put a connection pooler in our connection pooler.

Over this TCP connection, we send an initialization message that includes all of the buffered query messages the Worker has sent to Client (the mental model would be something like a SYN and a payload all bundled together). Endpoint will do its job processing this query, and respond by streaming the response back to Client, leaving the streaming channel open for any followup queries until Client disconnects. This approach allows us to send queries around the world with zero wasted round trips.

Impersonating a database client

Endpoint has a couple different jobs it has to do. Its first job is to pretend to be a database client, and to do the client half of the handshake shown above. Second, it must also do the same query processing that Client does with query messages. Finally, Endpoint will make the same determination on when it needs to reach out to the origin database to get uncached query results.

When Endpoint needs to query the origin database, it will attempt to take a connection out of a limited-size pool of database connections that it keeps. If there is an unused connection available, it is handed out from the pool and used to ferry the query to the origin database, and the results back to Endpoint. Once Endpoint has these results, the connection is immediately returned to the pool so that another Client can use it. These warm connections are usable in a matter of microseconds, which is obviously a dramatic improvement over the round trips from one region to another that a cold startup handshake would require.

If there are no currently unused connections sitting in the pool, it may start up a new one (assuming the pool has not already given out as many connections as it is allowed to). This set of handshakes looks exactly the same as the one Client does, but it happens across the network between a Cloudflare data center and wherever the origin database happens to be. These are the same 5 round trips as our original example, but instead of a full Chicago→London path on every single trip, perhaps it’s Virginia→London, or even London→London. Latency here will depend on which data center Endpoint is being housed in.

Distributed choreography

Earlier, we mentioned that Hyperdrive is a transaction-mode pooler. This means that when a driver is ready to send a query or open a transaction it must get a connection from the pool to use. The core challenge for a transaction-mode pooler is in aligning the state of the driver with the state of the connection checked out from the pool. For example, if the driver thinks it’s in a transaction, but the database doesn’t, then you might get errors or even corrupted results.

Hyperdrive achieves this by ensuring all connections are in the same state when they’re checked out of the pool: idle and ready for a query. Where Hyperdrive differs from other transaction-mode poolers is that it does this dance of matching up the states of two different connections across machines, such that there’s no need to share state between Client and Endpoint! Hyperdrive can terminate the incoming connection in Client on the same machine running the Worker, and pool the connections to the origin database wherever makes the most sense.

The job of a transaction-mode pooler is a hard one. Database connections are fundamentally stateful and keeping track of that state is important to maintain our guise when impersonating either a database client or a server. As an example, one of the trickier pieces of state to manage are prepared statements. When a user creates a new prepared statement, the prepared statement is only created on whichever database connection happened to be checked out at that time. Once the user finishes the transaction or query they are processing, the connection holding that statement is returned to the pool. From the user’s perspective they’re still connected using the same database connection, so a new query or transaction can reasonably expect to use that previously prepared statement. If a different connection is handed out for the next query and the query wants to make use of this resource, the pooler has to do something about it. We went into some depth on this topic in a previous blog post when we released this feature, but in sum, the process looks like this:
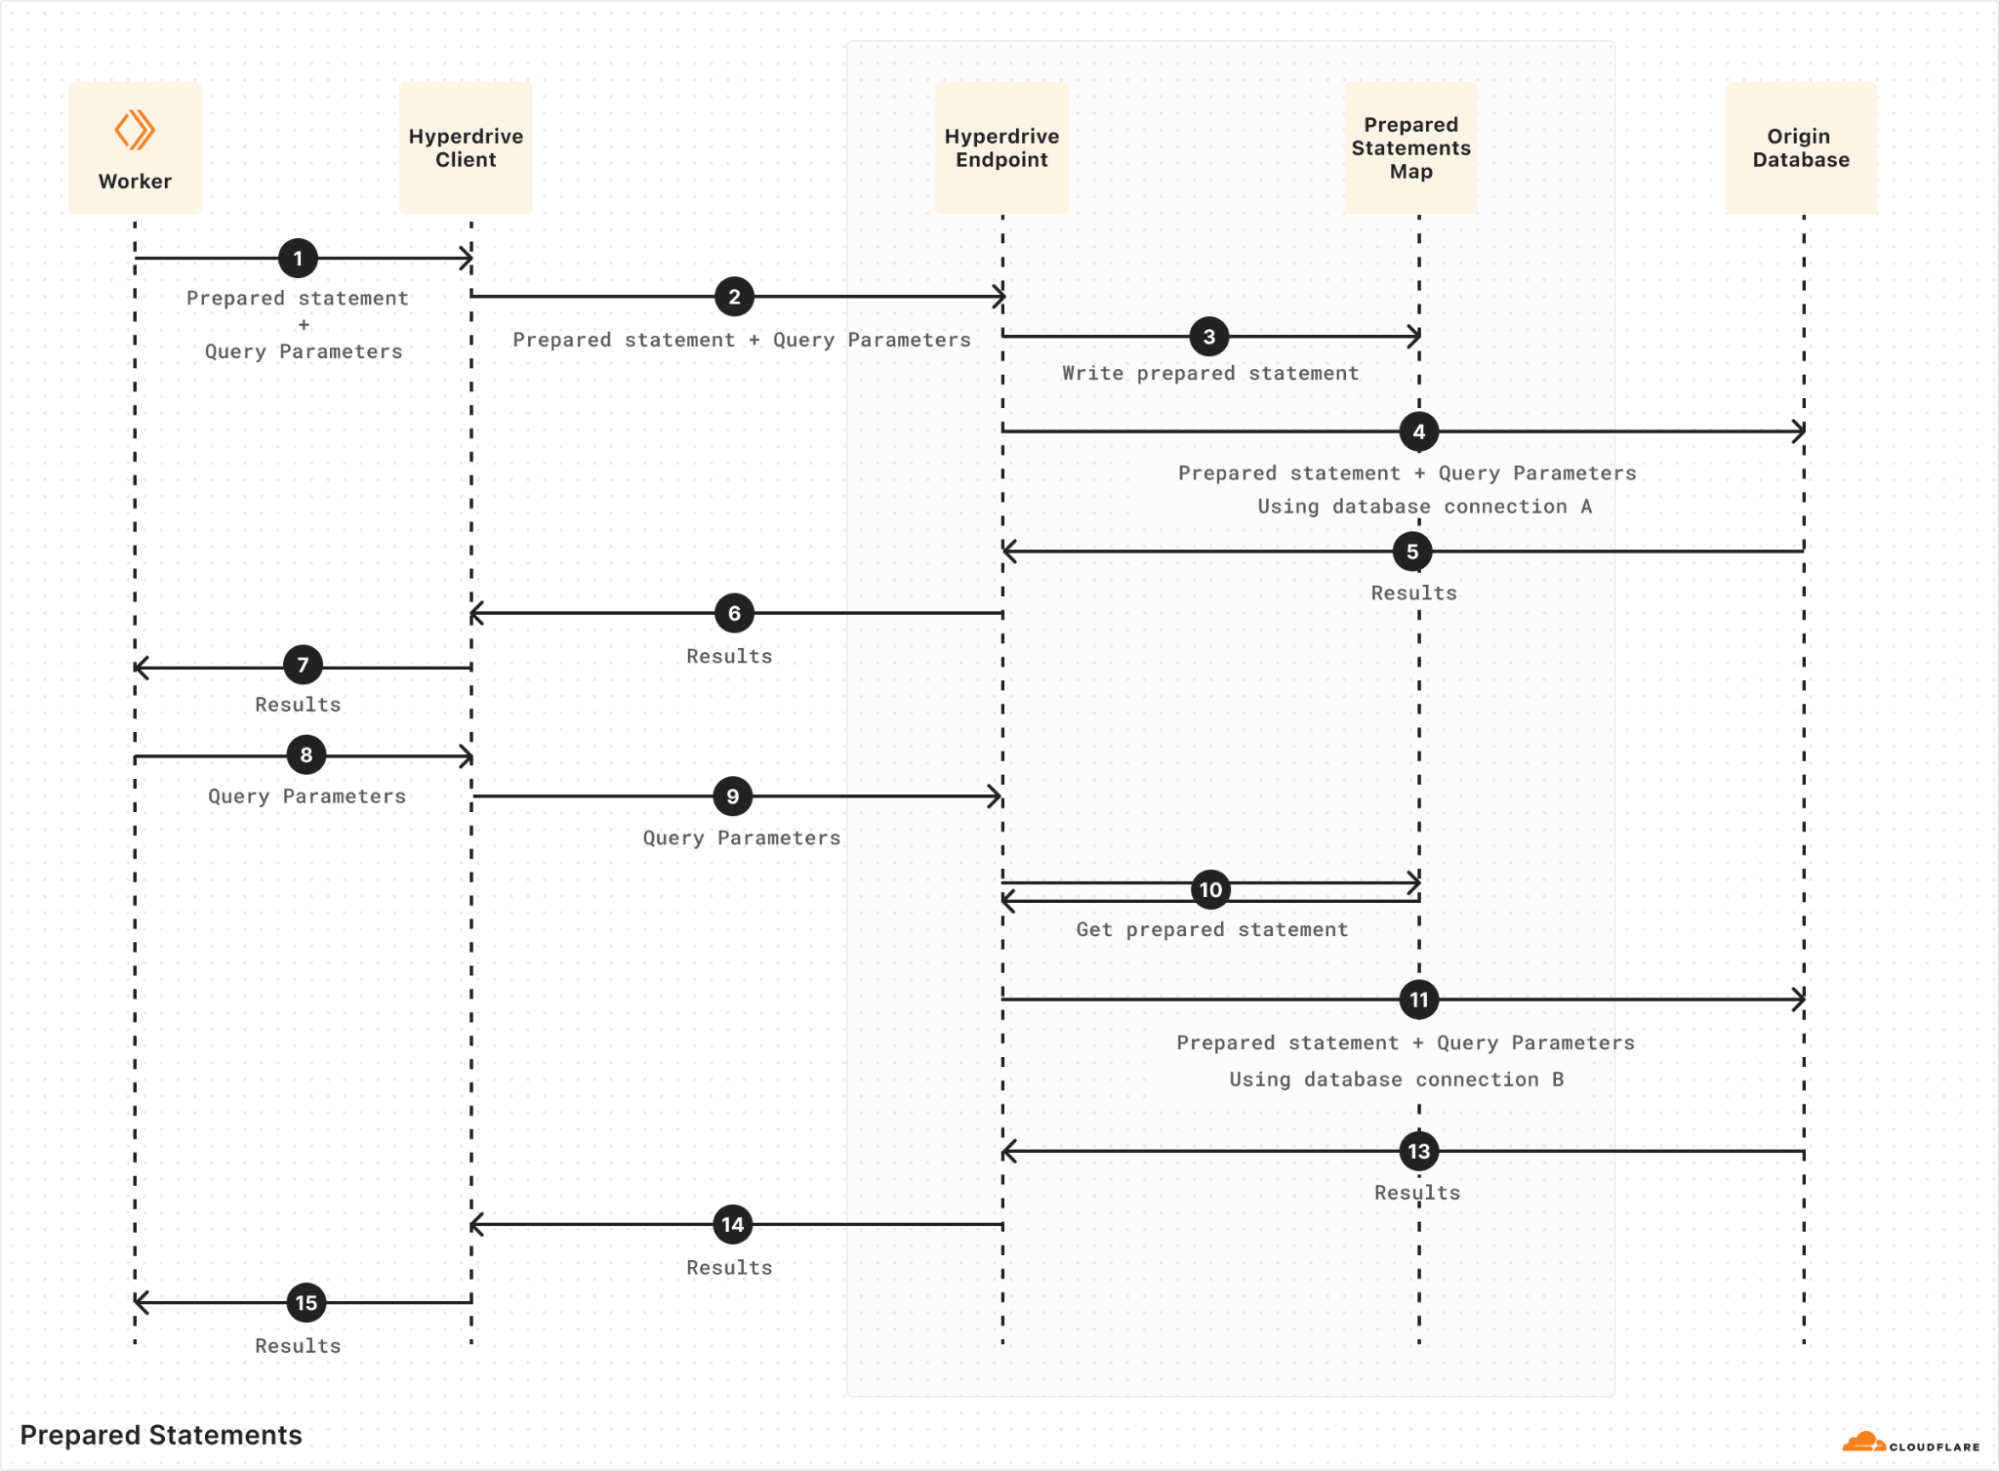

Hyperdrive implements this by keeping track of what statements have been prepared by a given client, as well as what statements have been prepared on each origin connection in the pool. When a query comes in expecting to re-use a particular prepared statement (#8 above), Hyperdrive checks if it’s been prepared on the checked-out origin connection. If it hasn’t, Hyperdrive will replay the wire-protocol message sequence to prepare it on the newly-checked-out origin connection (#10 above) before sending the query over it. Many little corrections like this are necessary to keep the client’s connection to Hyperdrive and Hyperdrive’s connection to the origin database lined up so that both sides see what they expect.

Better, faster, smarter, closer

This “split connection” approach is the founding innovation of Hyperdrive, and one of the most vital aspects of it is how it affects starting up new connections. While the same 5+ round trips must always happen on startup, the actual time spent on the round trips can be dramatically reduced by conducting them over the smallest possible distances. This impact of distance can be so big that there is still a huge latency reduction even though the startup round trips must now happen twice (once each between the Worker and Client, and Endpoint and your origin database). So how do we decide where to run everything, to lean into that advantage as much as possible?

The placement of Client has not really changed since the original design of Hyperdrive. Sharing a server with the Worker sending the queries means that the Worker runtime can connect directly to Hyperdrive with no network hop needed. While there is always room for microoptimizations, it’s hard to do much better than that from an architecture perspective.  By far the bigger piece of the latency puzzle is where to run Endpoint.

Hyperdrive keeps a list of data centers that are eligible to house Endpoints, requiring that they have sufficient capacity and the best routes available for pooled connections to use. The key challenge to overcome here is that a database connection string does not tell you where in the world a database actually is. The reality is that reliably going from a hostname to a precise (enough) geographic location is a hard problem, even leaving aside the additional complexity of doing so within a private network. So how do we pick from that list of eligible data centers?

For much of the time since its launch, Hyperdrive solved this with a regional pool approach. When a Worker connected to Hyperdrive, the location of the Worker was used to infer what region the end user was connecting from (e.g. ENAM, WEUR, APAC, etc. — see a rough breakdown here). Data centers to house Endpoints for any given Hyperdrive were deterministically selected from that region’s list of eligible options using rendezvous hashing, resulting in one pool of connections per region.

This approach worked well enough, but it had some severe shortcomings. The first and most obvious is that there’s no guarantee that the data center selected for a given region is actually closer to the origin database than the user making the request. This means that, while you’re getting the benefit of the excellent routing available on Cloudflare’s network, you may be going significantly out of your way to do so. The second downside is that, in the scenario where a new connection must be created, the round trips to do so may be happening over a significantly larger distance than is necessary if the origin database is in a different region than the Endpoint housing the regional connection pool. This increases latency and reduces throughput for the query that needs to instantiate the connection.

The final key downside here is an unfortunate interaction with Smart Placement, a feature of Cloudflare Workers that analyzes the duration of your Worker requests to identify the data center to run your Worker in. With regional Endpoints, the best Smart Placement can possibly do is to put your requests close to the Endpoint for whichever region the origin database is in. Again, there may be other data centers that are closer, but Smart Placement has no way to do better than where the Endpoint is because all Hyperdrive queries must route through it.
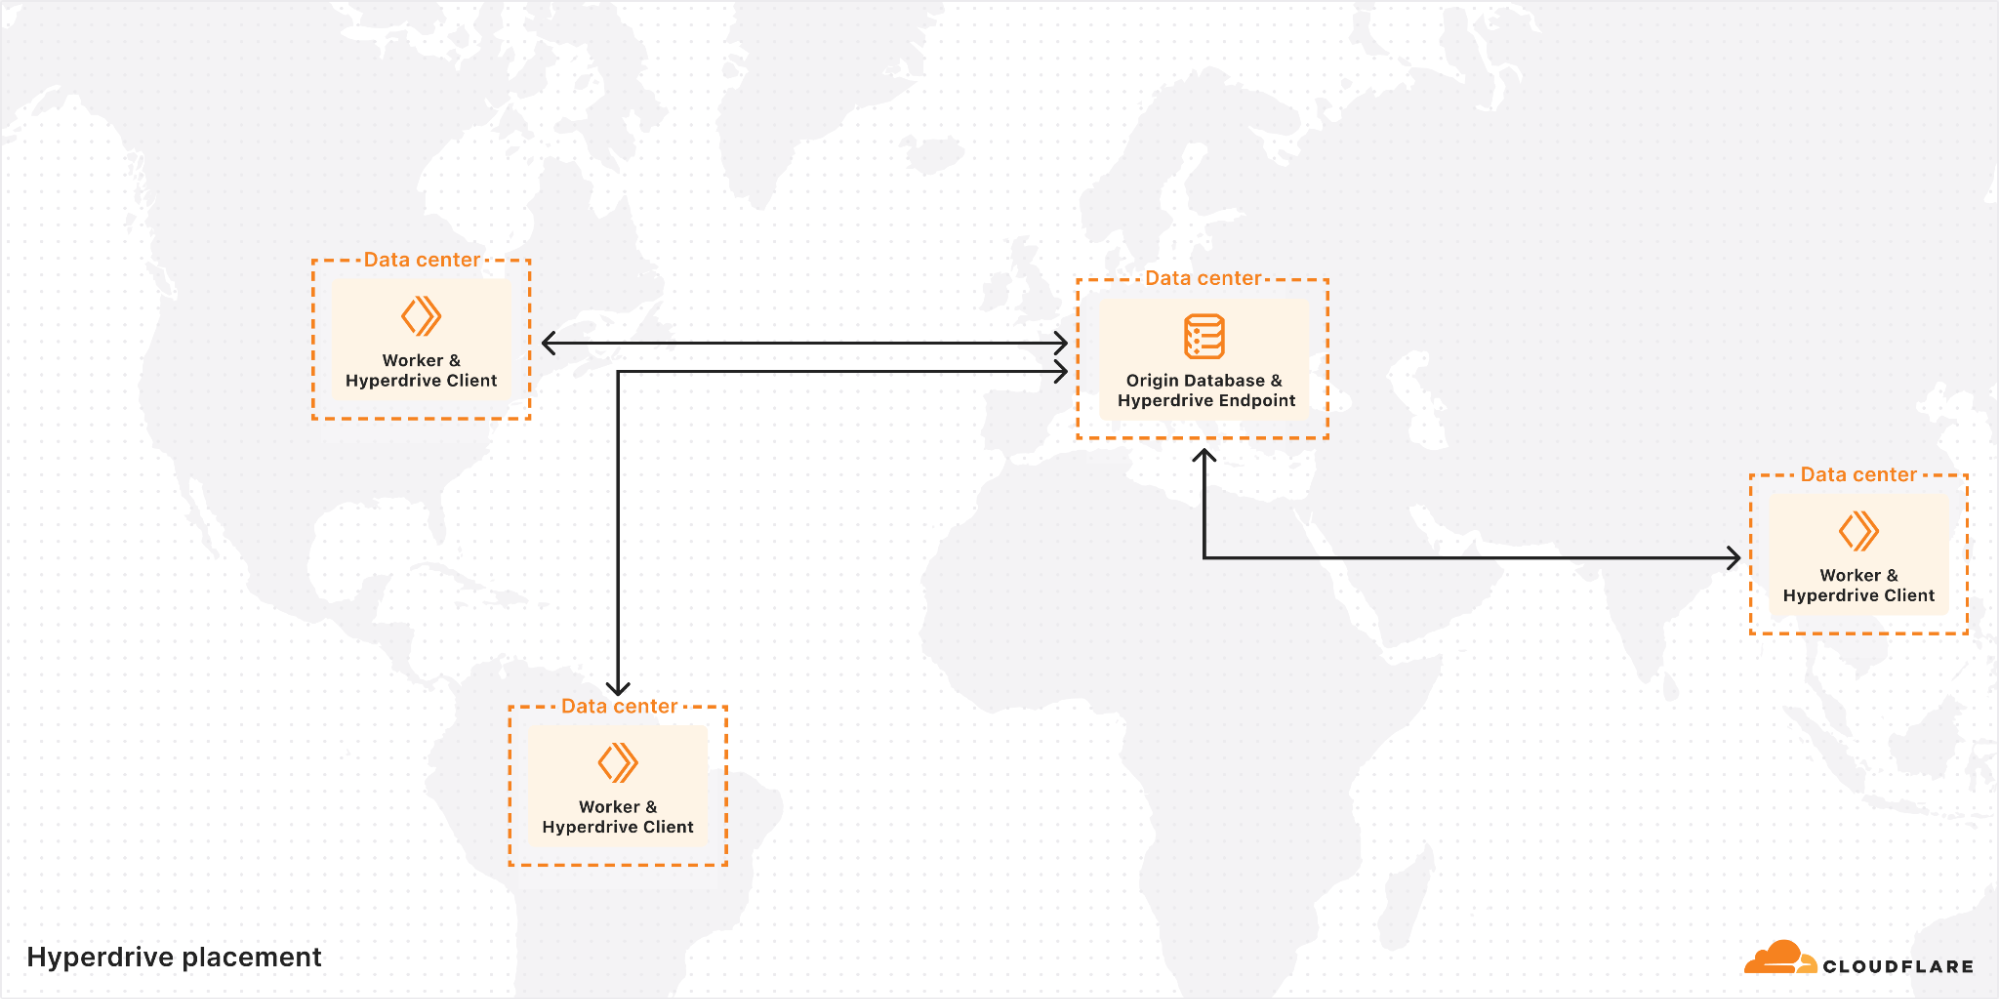

We recently shipped some improvements to this system that significantly enhanced performance. The new system discards the concept of regional pools entirely, in favor of a single global Endpoint for each Hyperdrive that is in the eligible data center as close as possible to the origin database.

The way we solved locating the origin database such that we can accomplish this was ultimately very straightforward. We already had a subsystem to confirm, at the time of creation, that Hyperdrive could connect to an origin database using the provided information. We call this subsystem our Edge Validator.

It’s bad user experience to allow someone to create a Hyperdrive, and then find out when they go to use it that they mistyped their password or something. Now they’re stuck trying to debug with extra layers in the way, with a Hyperdrive that can’t possibly work. Instead, whenever a Hyperdrive is created, the Edge Validator will send a request to an arbitrary data center to use its instance of Hyperdrive to connect to the origin database. If this connection fails, the creation of the Hyperdrive will also fail, giving immediate feedback to the user at the time it is most helpful.

With our new subsystem, affectionately called Placement, we now have a solution to the geolocation problem. After Edge Validator has confirmed that the provided information works and the Hyperdrive is created, an extra step is run in the background. Placement will perform the exact same connection routine, except instead of being done once from an arbitrary data center, it is run a handful of times from every single data center that is eligible to house Endpoints. The latency of establishing these connections is collected, and the average is sent back to a central instance of Placement. The data centers that can connect to the origin database the fastest are, by definition, where we want to run Endpoint for this Hyperdrive. The list of these is saved, and at runtime is used to select the Endpoint best suited to housing the pool of connections to the origin database.

Given that the secret sauce of Hyperdrive is in managing and minimizing the latency of establishing these connections, moving Endpoints right next to their origin databases proved to be pretty impactful.
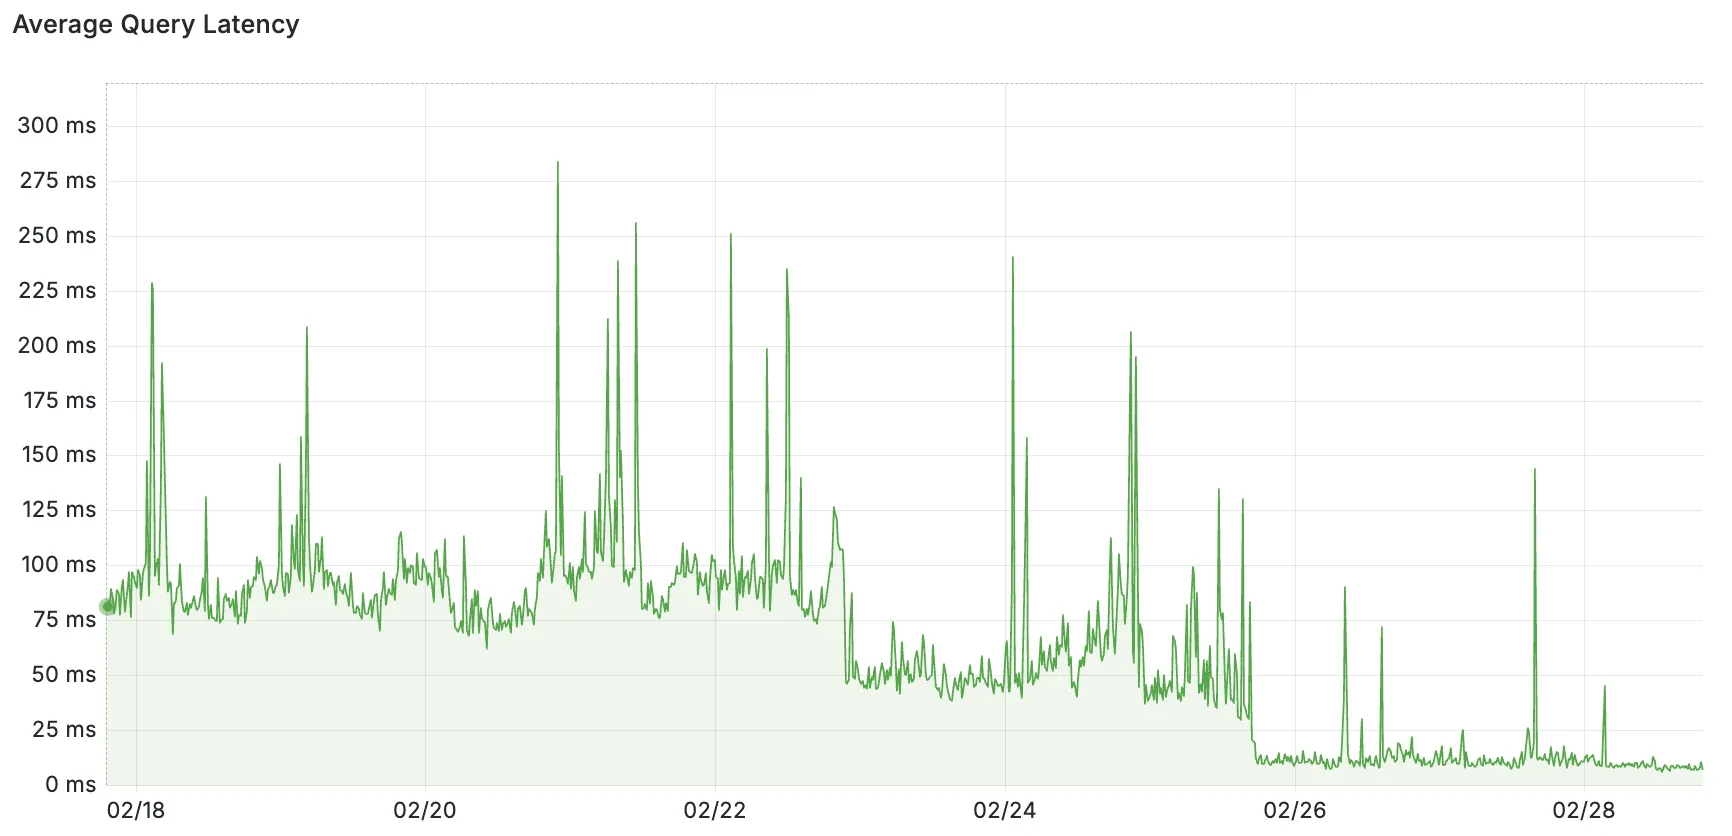

Pictured: query latency as measured from Endpoint to origin databases. The backfill of Placement to existing customers was done in stages on 02/22 and 02/25.

Serverless drivers exist, though?

While we went in a different direction, it’s worth acknowledging that other teams have solved this same problem with a very different approach. Custom database drivers, usually called “serverless drivers”, have made several optimization efforts to reduce both the number of round trips and how quickly they can be conducted, while still connecting directly from your client to your database in the traditional way. While these drivers are impressive, we chose not to go this route for a couple of reasons.

First off, a big part of the appeal of using Postgres is its vibrant ecosystem. Odds are good you’ve used Postgres before, and it can probably help solve whichever problem you’re tackling with your newest project. This familiarity and shared knowledge across projects is an absolute superpower. We wanted to lean into this advantage by supporting the most popular drivers already in this ecosystem, instead of fragmenting it by adding a competing one.

Second, Hyperdrive also functions as a cache for individual queries (a bit of trivia: its name while still in Alpha was actually sql-query-cache). Doing this as effectively as possible for distributed users requires some clever positioning of where exactly the query results should be cached. One of the unique advantages of running a distributed service on Cloudflare’s network is that we have a lot of flexibility on where to run things, and can confidently surmount challenges like those. If we’re going to be playing three-card monte with where things are happening anyway, it makes the most sense to favor that route for solving the other problems we’re trying to tackle too.

Pick your favorite cache pun

As we’ve talked about in the past, Hyperdrive buffers protocol messages until it has enough information to know whether a query can be served from cache. In a post about how Hyperdrive works it would be a shame to skip talking about how exactly we cache query results, so let’s close by diving into that.

First and foremost, Hyperdrive uses Cloudflare’s cache, because when you have technology like that already available to you, it’d be silly not to use it. This has some implications for our architecture that are worth exploring.

The cache exists in each of Cloudflare’s data centers, and by default these are separate instances. That means that a Client operating close to the user has one, and an Endpoint operating close to the origin database has one. However, historically we weren’t able to take full advantage of that, because the logic for interacting with cache was tightly bound to the logic for managing the pool of connections.

Part of our recent architecture refactoring effort, where we switched to global Endpoints, was to split up this logic such that we can take advantage of Client’s cache too. This was necessary because, with Endpoint moving to a single location for each Hyperdrive, users from other regions would otherwise have gotten cache hits served from almost as far away as the origin.

With the new architecture, the role of Client during active query handling transitioned from that of a “dumb pipe” to more like what Endpoint had always been doing. It now buffers protocol messages, and serves results from cache if possible. In those scenarios, Hyperdrive’s traffic never leaves the data center that the Worker is running in, reducing query latencies from 20-70 ms to an average of around 4 ms. As a side benefit, it also substantially reduces the network bandwidth Hyperdrive uses to serve these queries. A win-win!

In the scenarios where query results can’t be served from the cache in Client’s data center, all is still not lost. Endpoint may also have cached results for this query, because it can field traffic from many different Clients around the world. If so, it will provide these results back to Client, along with how much time is remaining before they expire, such that Client can both return them and store them correctly into its own cache. Likewise, if Endpoint does need to go to the origin database for results, they will be stored into both Client and Endpoint caches. This ensures that followup queries from that same Client data center will get the happy path with single-digit ms response times, and also reduce load on the origin database from any other Client’s queries. This functions similarly to how Cloudflare’s Tiered Cache works, with Endpoint’s cache functioning as a final layer of shielding for the origin database.

Come on in, the water’s fine!

With this announcement of a Free Plan for Hyperdrive, and newly armed with the knowledge of how it works under the hood, we hope you’ll enjoy building your next project with it! You can get started with a single Wrangler command (or using the dashboard):

wrangler hyperdrive create postgres-hyperdrive 
--connection-string="postgres://user:[email protected]:5432/defaultdb"

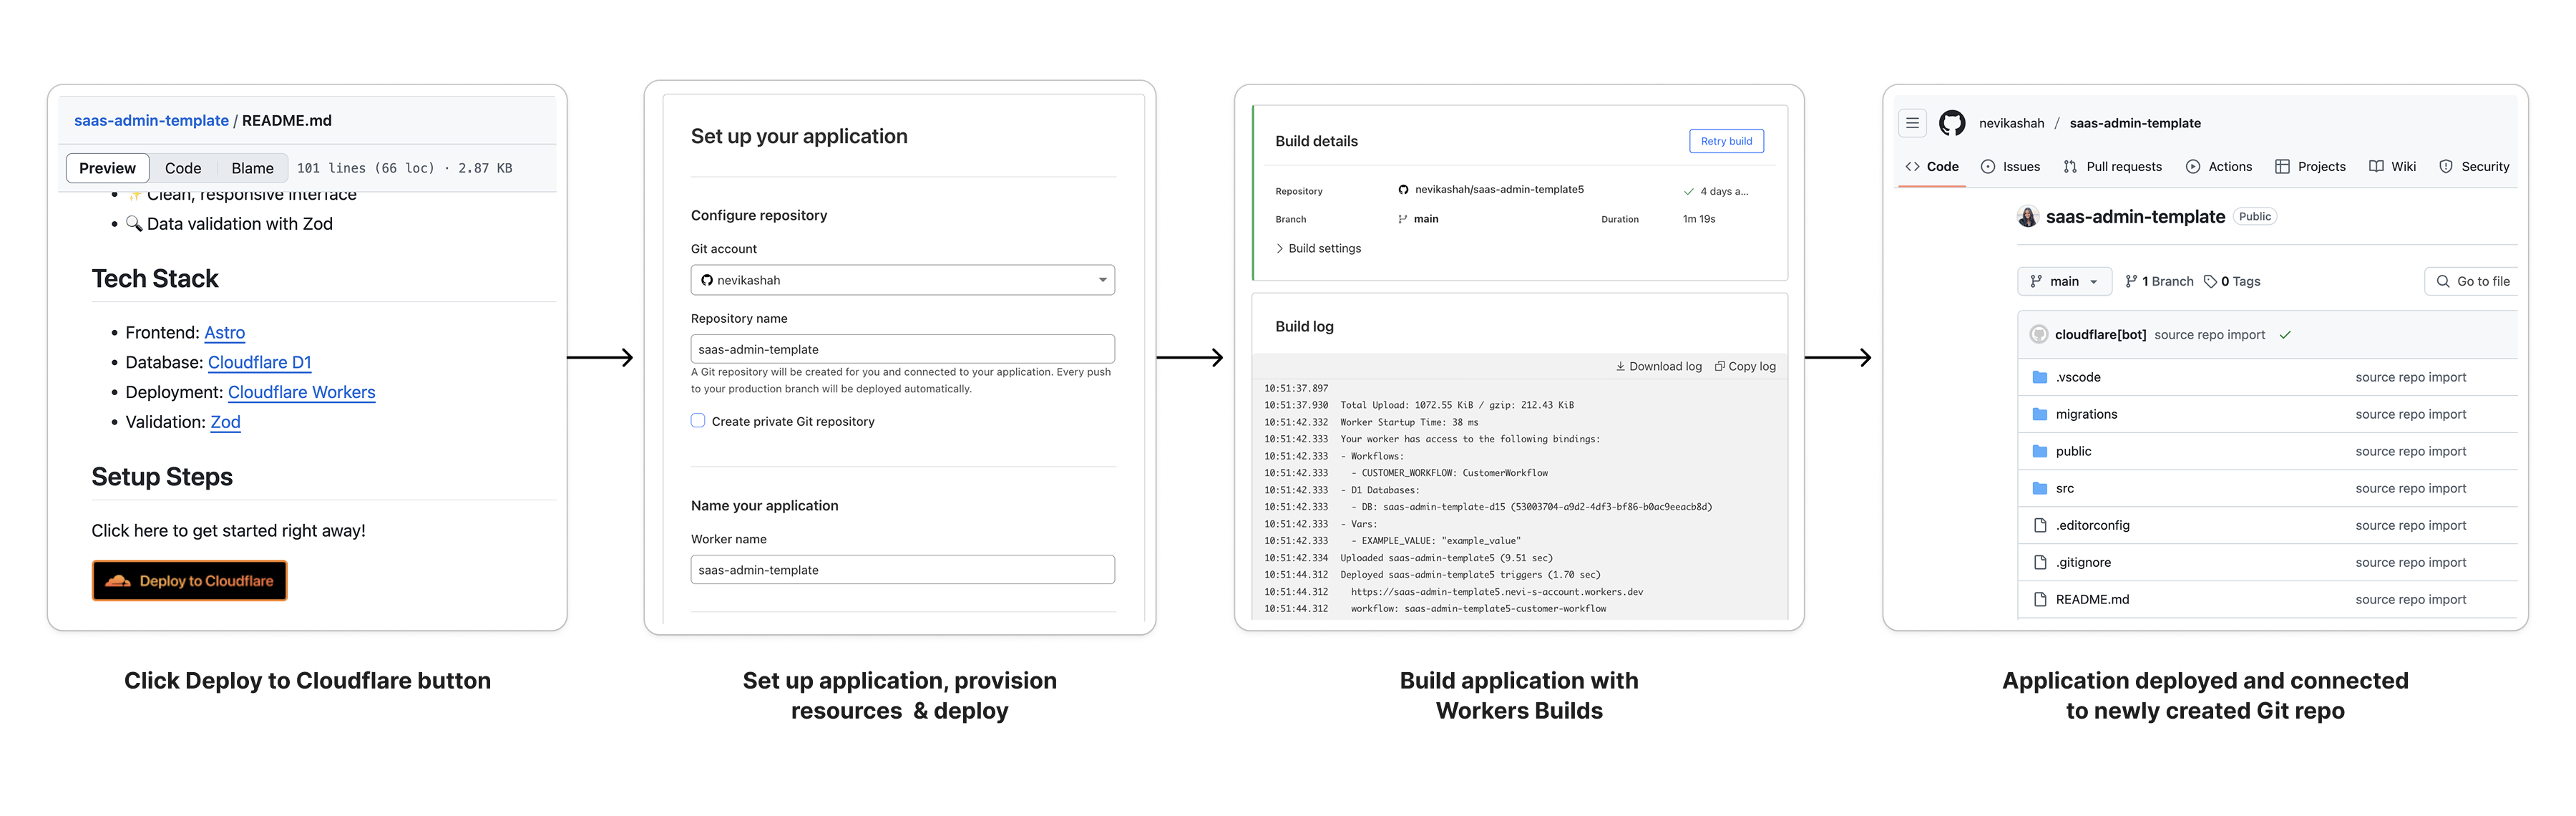
We’ve also included a Deploy to Cloudflare button below to let you get started with a sample Worker app using Hyperdrive, just bring your existing Postgres database! If you have any questions or ideas for future improvements, please feel free to visit our Discord channel!

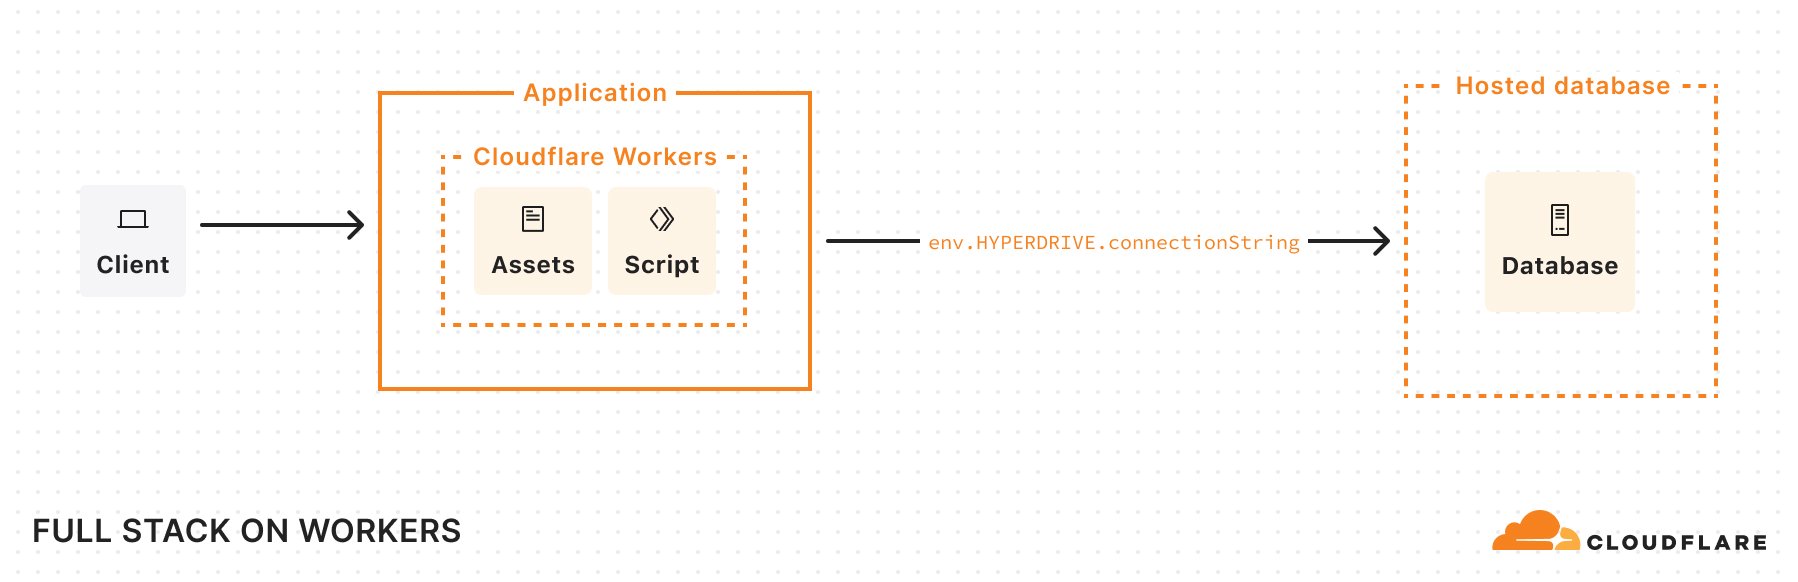
Your frontend, backend, and database — now in one Cloudflare Worker

Post Syndicated from Korinne Alpers original https://blog.cloudflare.com/full-stack-development-on-cloudflare-workers/

In September 2024, we introduced beta support for hosting, storing, and serving static assets for free on Cloudflare Workers — something that was previously only possible on Cloudflare Pages. Being able to host these assets — your client-side JavaScript, HTML, CSS, fonts, and images — was a critical missing piece for developers looking to build a full-stack application within a single Worker. 

Today we’re announcing ten big improvements to building apps on Cloudflare. All together, these new additions allow you to build and host projects ranging from simple static sites to full-stack applications, all on Cloudflare Workers:

These improvements allow you to build both simple static sites and more complex server-side rendered applications. Like Pages, you only get charged when your Worker code runs, meaning you can host and serve static sites for free. When you want to do any rendering on the server or need to build an API, simply add a Worker to handle your backend. And when you need to read or write data in your app, you can connect to an existing database with Hyperdrive, or use any of our storage solutions: Workers KV, R2, Durable Objects, or D1. 

If you’d like to dive straight into code, you can deploy a single-page application built with Vite and React, with the option to connect to a hosted database with Hyperdrive, by clicking this “Deploy to Cloudflare” button: 


Start with Workers

Previously, you needed to choose between building on Cloudflare Pages or Workers (or use Pages for one part of your app, and Workers for another) just to get started. This meant figuring out what your app needed from the start, and hoping that if your project evolved, you wouldn’t be stuck with the wrong platform and architecture. Workers was designed to be a flexible platform, allowing developers to evolve projects as needed — and so, we’ve worked to bring pieces of Pages into Workers over the years.  

Now that Workers supports both serving static assets and server-side rendering, you should start with Workers. Cloudflare Pages will continue to be supported, but, going forward, all of our investment, optimizations, and feature work will be dedicated to improving Workers. We aim to make Workers the best platform for building full-stack apps, building upon your feedback of what went well with Pages and what we could improve. 

Before, building an app on Pages meant you got a really easy, opinionated on-ramp, but you’d eventually hit a wall if your application got more complex. If you wanted to use Durable Objects to manage state, you would need to set up an entirely separate Worker to do so, ending up with a complicated deployment and more overhead. You also were limited to real-time logs, and could only roll out changes all in one go. 

When you build on Workers, you can immediately bind to any other Developer Platform service (including Durable Objects, Email Workers, and more), and manage both your front end and back end in a single project — all with a single deployment. You also get the whole suite of Workers observability tooling built into the platform, such as Workers Logs. And if you want to rollout changes to only a certain percentage of traffic, you can do so with Gradual Deployments.  

These latest improvements are part of our goal to bring the best parts of Pages into Workers. For example, we now support static  _headers and _redirects config files, so that you can easily take an existing project from Pages (or another platform) and move it over to Workers, without needing to change your project. We also directly integrate with GitHub and GitLab with Workers Builds, providing automatic builds and deployments. And starting today, Preview URLs are posted back to your repository as a comment, with feature branch aliases and environments coming soon. 

To learn how to migrate an existing project from Pages to Workers, read our migration guide. 

Next, let’s talk about how you can build applications with different rendering modes on Workers.  

Building static sites, SPAs, and SSR on Workers

As a quick primer, here are all the architectures and rendering modes we’ll be discussing that are supported on Workers: 

  • Static sites: When you visit a static site, the server immediately returns pre-built static assets — HTML, CSS, JavaScript, images, and fonts. There’s no dynamic rendering happening on the server at request-time. Static assets are typically generated at build-time and served directly from a CDN, making static sites fast and easily cacheable. This approach works well for sites with content that rarely changes.

  • Single-Page Applications (SPAs):  When you load an SPA, the server initially sends a minimal HTML shell and a JavaScript bundle (served as static assets). Your browser downloads this JavaScript, which then takes over to render the entire user interface client-side. After the initial load, all navigation occurs without full-page refreshes, typically via client-side routing. This creates a fast, app-like experience. 

  • Server-Side Rendered (SSR) applications: When you first visit a site that uses SSR, the server generates a fully-rendered HTML page on-demand for that request. Your browser immediately displays this complete HTML, resulting in a fast first page load. Once loaded, JavaScript “hydrates” the page, adding interactivity. Subsequent navigations can either trigger new server-rendered pages or, in many modern frameworks, transition into client-side rendering similar to an SPA.

Next, we’ll dive into how you can build these kinds of applications on Workers, starting with setting up your development environment. 

Setup: build and dev

Before uploading your application, you need to bundle all of your client-side code into a directory of static assets. Wrangler bundles and builds your code when you run wrangler dev, but we also now support Vite with our new Vite plugin. This is a great option for those already using Vite’s build tooling and development server — you can continue developing (and testing with Vitest) using Vite’s development server, all using the Workers runtime. 

To get started using the Cloudflare Vite plugin, you can scaffold a React application using Vite and our plugin, by running: 

npm create cloudflare@latest my-react-app -- --framework=react

When you open the project, you should see a directory structure like this: 

...
├── api
│   └── index.ts
├── public
│   └── ...
├── src
│   └── ...
...
├── index.html
├── package.json
├── vite.config.ts
└── wrangler.jsonc

If you run npm run build, you’ll see a new folder appear, named /dist. 

...
├── api
│   └── index.ts
├── dist
│   └── ...
├── public
│   └── ...
├── src
│   └── ...
...
├── index.html
├── package.json
├── vite.config.ts
└── wrangler.jsonc

The Vite plugin informs Wrangler that this /dist directory contains the project’s built static assets — which, in this case, includes client-side code, some CSS files, and images. 

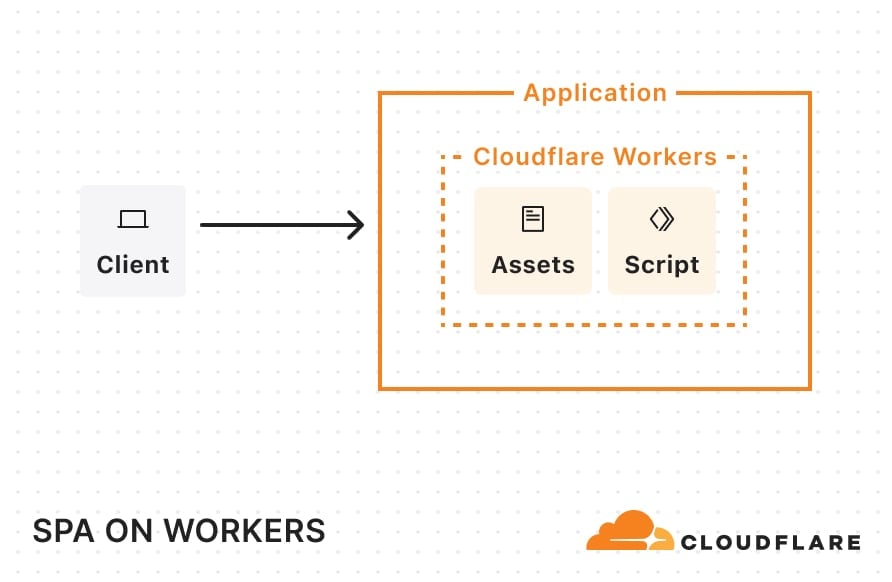
Once deployed, this single-page application (SPA) architecture will look something like this: 


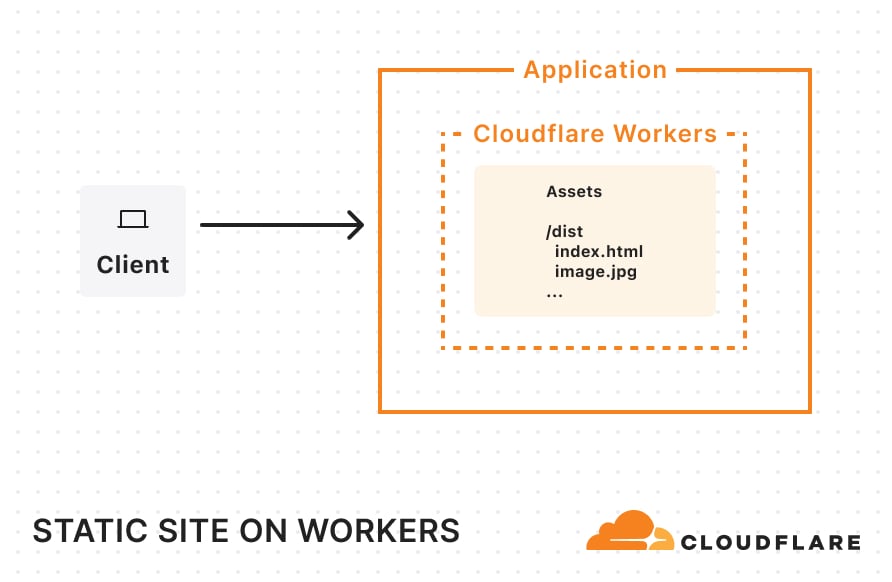
When a request comes in, Cloudflare looks at the pathname and automatically serves any static assets that match that pathname. For example, if your static assets directory includes a blog.html file, requests for example.com/blog get that file. 

Static sites

If you have a static site created by a static site generator (SSG) like Astro, all you need to do is create a wrangler.jsonc file (or wrangler.toml) and tell Cloudflare where to find your built assets: 

// wrangler.jsonc 

{
  "name": "my-static-site",
  "compatibility_date": "2025-04-01",
  "assets": {
    "directory": "./dist",
  }
}

Once you’ve added this configuration, you can simply build your project and run wrangler deploy.  Your entire site will then be uploaded and ready for traffic on Workers. Once deployed and requests start flowing in, your static site will be cached across Cloudflare’s network.


You can try starting a fresh Astro project on Workers today by running:

npm create cloudflare@latest my-astro-app -- --framework=astro

You can see our other supported Frameworks and how to get started in our framework guides. 

Single-page applications (SPAs) 

If you have a single-page application, you can explicitly enable single-page-application mode in your Wrangler configuration: 

{
 "name": "example-spa-worker-hyperdrive",
 "main": "api/index.js",
 "compatibility_flags": ["nodejs_compat"],
 "compatibility_date": "2025-04-01",
 },
 "assets": {
   "directory": "./dist",
   "binding": "ASSETS",
   "not_found_handling": "single-page-application"
 },
 "hyperdrive": [
   {
     "binding": "HYPERDRIVE",
     "id": "d9c9cfb2587f44ee9b0730baa692ffec",
     "localConnectionString": "postgresql://myuser:mypassword@localhost:5432/mydatabase"
   }
 ],
 "placement": {
   "mode": "smart"
 }
}

By enabling this, the platform assumes that any navigation request (requests which include a Sec-Fetch-Mode: navigate header) are intended for static assets and will serve up index.html whenever a matching static asset match cannot be found. For non-navigation requests (such as requests for data) that don’t match a static asset, Cloudflare will invoke the Worker script. With this setup, you can render the frontend with React, use a Worker to handle back-end operations, and use Vite to help stitch the two together. This is a great option for porting over older SPAs built with create-react-app, which was recently sunset. 

Another thing to note in this Wrangler configuration file: we’ve defined a Hyperdrive binding and enabled Smart Placement. Hyperdrive lets us use an existing database and handles connection pooling. This solves a long-standing challenge of connecting Workers (which run in a highly distributed, serverless environment) directly to traditional databases. By design, Workers operate in lightweight V8 isolates with no persistent TCP sockets and a strict CPU/memory limit. This isolation is great for security and speed, but it makes it difficult to hold open database connections. Hyperdrive addresses these constraints by acting as a “bridge” between Cloudflare’s network and your database, taking care of the heavy lifting of maintaining stable connections or pools so that Workers can reuse them.  By turning on Smart Placement, we also ensure that if requests to our Worker originate far from the database (causing latency), Cloudflare can choose to relocate both the Worker—which handles the database connection—and the Hyperdrive “bridge” to a location closer to the database, ​​reducing round-trip times. 

SPA example: Worker code

Let’s look at the “Deploy to Cloudflare” example at the top of this blog. In api/index.js, we’ve defined an API (using Hono) which connects to a hosted database through Hyperdrive. 

import { Hono } from "hono";
import postgres from "postgres";
import booksRouter from "./routes/books";
import bookRelatedRouter from "./routes/book-related";

const app = new Hono();

// Setup SQL client middleware
app.use("*", async (c, next) => {
 // Create SQL client
 const sql = postgres(c.env.HYPERDRIVE.connectionString, {
   max: 5,
   fetch_types: false,
 });

 c.env.SQL = sql;

 // Process the request
 await next();

 // Close the SQL connection after the response is sent
 c.executionCtx.waitUntil(sql.end());
});

app.route("/api/books", booksRouter);
app.route("/api/books/:id/related", bookRelatedRouter);


export default {
 fetch: app.fetch,
};

When deployed, our app’s architecture looks something like this: 


If Smart Placement moves the placement of my Worker to run closer to my database, it could look like this: 

Server-Side Rendering (SSR)

If you want to handle rendering on the server, we support a number of popular full-stack frameworks. 

Here’s a version of our previous example, now using React Router v7’s server-side rendering:

You could also use Next.js with the OpenNext adapter, or any other framework listed in our framework guides. 

Deploy to Workers, with as few changes as possible

Node.js compatibility

We’ve also continued to make progress supporting Node.js APIs, recently adding support for the crypto, tls, net, and dns modules. This allows existing applications and libraries that rely on these Node.js modules to run on Workers. Let’s take a look at an example:

Previously, if you tried to use the mongodb package, you encountered the following error:

Error: [unenv] dns.resolveTxt is not implemented yet!
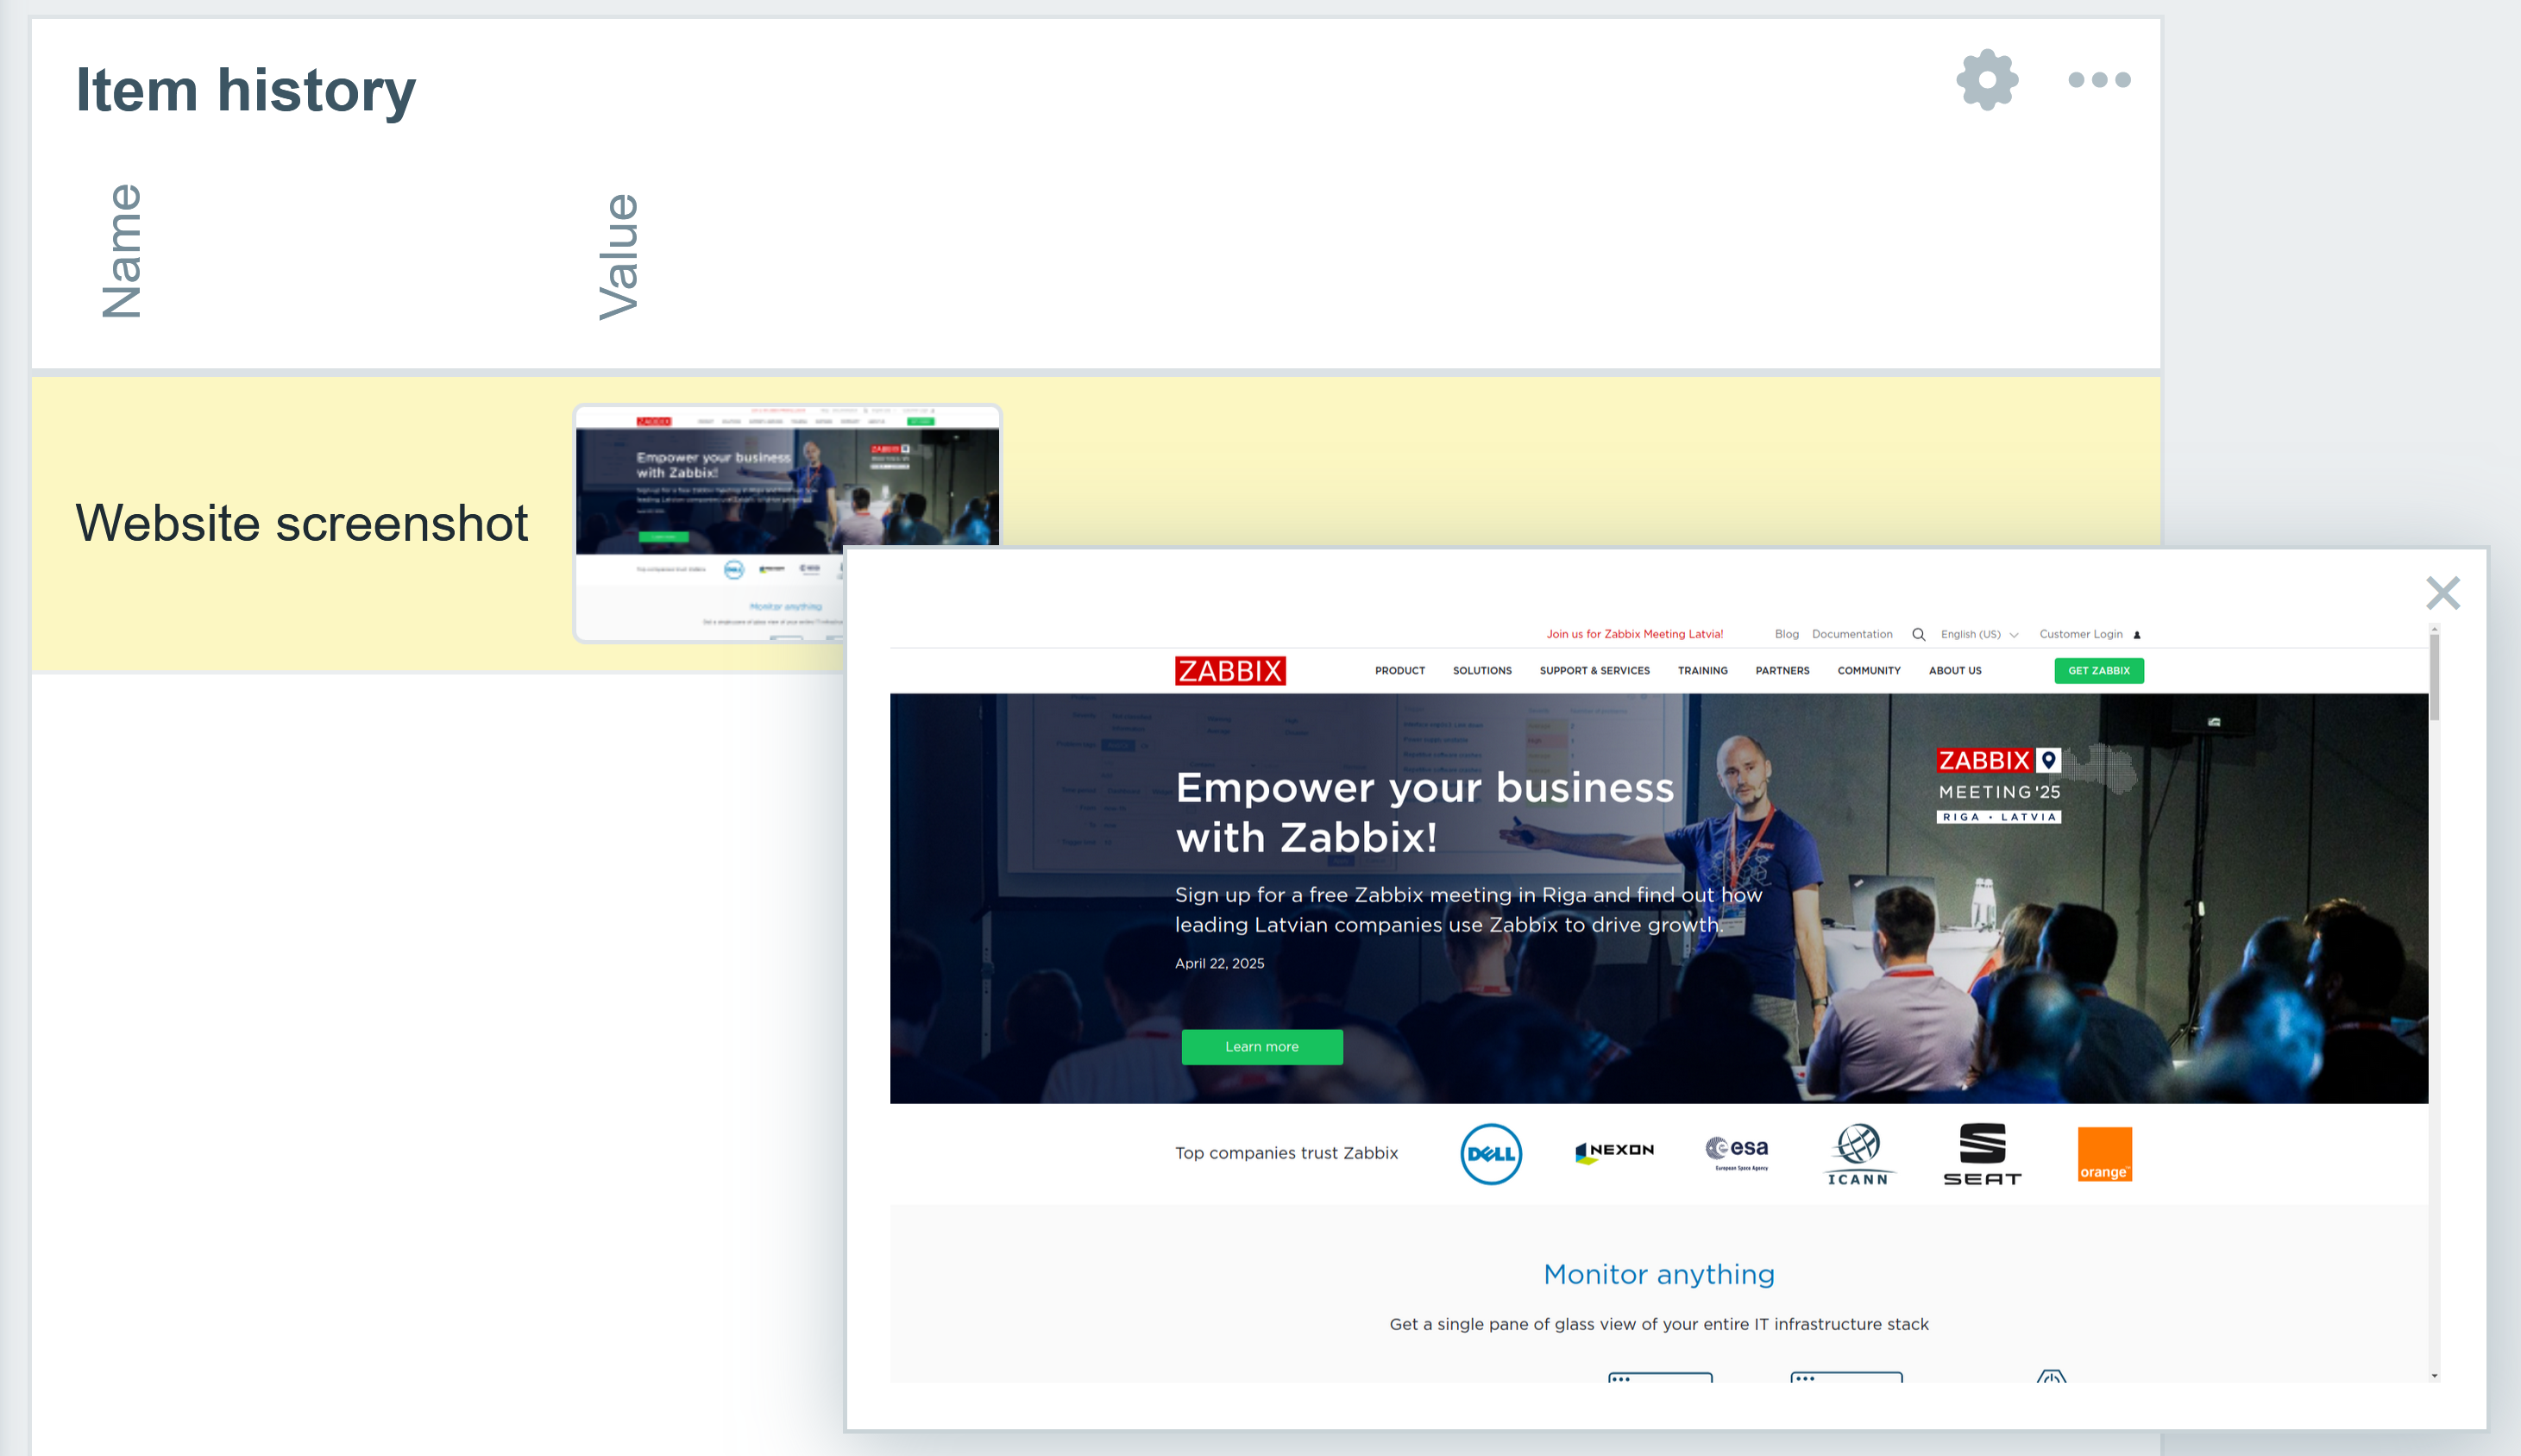
This occurred when mongodb used the node:dns module to do a DNS lookup of a hostname. Even if you avoided that issue, you would have encountered another error when mongodb tried to use node:tls to securely connect to a database.

Now, you can use mongodb as expected because node:dns and node:tls are supported. The same can be said for libraries relying on node:crypto and node:net.

Additionally, Workers now expose environment variables and secrets on the process.env object when the nodejs_compat compatibility flag is on and the compatibility date is set to 2025-04-01 or beyond. Some libraries (and developers) assume that this object will be populated with variables, and rely on it for top-level configuration. Without the tweak, libraries may have previously broken unexpectedly and developers had to write additional logic to handle variables on Cloudflare Workers.

Now, you can just access your variables as you would in Node.js.

const LOG_LEVEL = process.env.LOG_LEVEL || "info";

Additional Worker CPU time

We have also raised the maximum CPU time per Worker request from 30 seconds to 5 minutes. This allows for compute-intensive operations to run for longer without timing out. Say you want to use the newly supported node:crypto module to hash a very large file, you can now do this on Workers without having to rely on external compute for CPU-intensive operations.

Workers Builds 

We’ve also made improvements to Workers Builds, which allows you to connect a Git repository to your Worker, so that you can have automatic builds and deployments on every pushed change. Workers Builds was introduced during Builder Day 2024, and initially only allowed you to connect a repository to an existing Worker. Now, you can bring a repository and immediately deploy it as a new Worker, reducing the amount of setup and button clicking needed to bring a project over. We’ve improved the performance of Workers Builds by reducing the latency of build starts by 6 seconds — they now start within 10 seconds on average. We also boosted API responsiveness, achieving a 7x latency improvement thanks to Smart Placement. 

  • Note: On April 2, 2025, Workers Builds transitioned to a new pricing model, as announced during Builder Day 2024. Free plan users are now capped at 3,000 minutes of build time, and Workers Paid subscription users will have a new usage-based model with 6,000 free minutes included and $0.005 per build minute pricing after. To better support concurrent builds, Paid plans will also now get six (6) concurrent builds, making it easier to work across multiple projects and monorepos. For more information on pricing, see the documentation.

You can also set up Workers Builds to run on non-production branches, and preview URLs will be posted back to GitHub as a comment. 

Bind the Images API to your Worker

Last week, we wrote a blog post that covers how the Images binding enables more flexible, programmatic workflows for image optimization.

Previously, you could access image optimization features by calling fetch() in your Worker. This method requires the original image to be retrievable by URL. However, you may have cases where images aren’t accessible from a URL, like when you want to compress user-uploaded images before they are uploaded to your storage. With the Images binding, you can directly optimize an image by operating on its body as a stream of bytes.

To learn more, read our guide on transforming an image before it gets uploaded to R2.

Start building today

We’re excited to see what you’ll build, and are focused on new features and improvements to make it  easier to create any application on Workers. Much of this work was made even better by community feedback, and we encourage everyone to join our Discord to participate in the discussion. 

Helpful resources to get you started:

Build global MySQL apps using Cloudflare Workers and Hyperdrive

Post Syndicated from Thomas Gauvin original https://blog.cloudflare.com/building-global-mysql-apps-with-cloudflare-workers-and-hyperdrive/

Today, we’re announcing support for MySQL in Cloudflare Workers and Hyperdrive. You can now build applications on Workers that connect to your MySQL databases directly, no matter where they’re hosted, with native MySQL drivers, and with optimal performance. 

Connecting to MySQL databases from Workers has been an area we’ve been focusing on for quite some time. We want you to build your apps on Workers with your existing data, even if that data exists in a SQL database in us-east-1. But connecting to traditional SQL databases from Workers has been challenging: it requires making stateful connections to regional databases with drivers that haven’t been designed for the Workers runtime. 

After multiple attempts at solving this problem for Postgres, Hyperdrive emerged as our solution that provides the best of both worlds: it supports existing database drivers and libraries while also providing best-in-class performance. And it’s such a critical part of connecting to databases from Workers that we’re making it free (check out the Hyperdrive free tier announcement).

With new Node.js compatibility improvements and Hyperdrive support for the MySQL wire protocol, we’re happy to say MySQL support for Cloudflare Workers has been achieved. If you want to jump into the code and have a MySQL database on hand, this “Deploy to Cloudflare” button will get you setup with a deployed project and will create a repository so you can dig into the code. 

Read on to learn more about how we got MySQL to work on Workers, and why Hyperdrive is critical to making connectivity to MySQL databases fast.

Getting MySQL to work on Workers

Until recently, connecting to MySQL databases from Workers was not straightforward. While it’s been possible to make TCP connections from Workers for some time, MySQL drivers had many dependencies on Node.js that weren’t available on the Workers runtime, and that prevented their use.

This led to workarounds being developed. PlanetScale provided a serverless driver for JavaScript, which communicates with PlanetScale servers using HTTP instead of TCP to relay database messages. In a separate effort, a fork of the mysql package was created to polyfill the missing Node.js dependencies and modify the mysql package to work on Workers. 

These solutions weren’t perfect. They required using new libraries that either did not provide the level of support expected for production applications, or provided solutions that were limited to certain MySQL hosting providers. They also did not integrate with existing codebases and tooling that depended on the popular MySQL drivers (mysql and mysql2). In our effort to enable all JavaScript developers to build on Workers, we knew that we had to support these drivers.


Package downloads from npm for mysql and mysql2

Improving our Node.js compatibility story was critical to get these MySQL drivers working on our platform. We first identified net and stream as APIs that were needed by both drivers. This, complemented by Workers’ nodejs_compat to resolve unused Node.js dependencies with unenv, enabled the mysql package to work on Workers:

import { createConnection } from 'mysql';

export default {
 async fetch(request, env, ctx): Promise<Response> {
    const result = await new Promise<any>((resolve) => {

       const connection = createConnection({
         host: env.DB_HOST,
         user: env.DB_USER,
         password: env.DB_PASSWORD,
         database: env.DB_NAME,
	  port: env.DB_PORT
       });

       connection.connect((error: { message : string }) => {
          if(error) {
            throw new Error(error.message);
          }
          
          connection.query("SHOW tables;", [], (error, rows, fields) => {
          connection.end();
         
          resolve({ fields, rows });
        });
       });

      });

     return new Response(JSON.stringify(result), {
       headers: {
         'Content-Type': 'application/json',
       },
     });
 },
} satisfies ExportedHandler<Env>;

Further work was required to get mysql2 working: dependencies on Node.js timers and the JavaScript eval API remained. While we were able to land support for timers in the Workers runtime, eval was not an API that we could securely enable in the Workers runtime at this time. 

mysql2 uses eval to optimize the parsing of MySQL results containing large rows with more than 100 columns (see benchmarks). This blocked the driver from working on Workers, since the Workers runtime does not support this module. Luckily, prior effort existed to get mysql2 working on Workers using static parsers for handling text and binary MySQL data types without using eval(), which provides similar performance for a majority of scenarios. 

In mysql2 version 3.13.0, a new option to disable the use of eval() was released to make it possible to use the driver in Cloudflare Workers:

import { createConnection  } from 'mysql2/promise';

export default {
 async fetch(request, env, ctx): Promise<Response> {
    const connection = await createConnection({
     host: env.DB_HOST,
     user: env.DB_USER,
     password: env.DB_PASSWORD,
     database: env.DB_NAME,
     port: env.DB_PORT

     // The following line is needed for mysql2 to work on Workers (as explained above)
     // mysql2 uses eval() to optimize result parsing for rows with > 100 columns
     // eval() is not available in Workers due to runtime limitations
     // Configure mysql2 to use static parsing with disableEval
     disableEval: true
   });

   const [results, fields] = await connection.query(
     'SHOW tables;'
   );

   return new Response(JSON.stringify({ results, fields }), {
     headers: {
       'Content-Type': 'application/json',
       'Access-Control-Allow-Origin': '*',
     },
   });
 },
} satisfies ExportedHandler<Env>;

So, with these efforts, it is now possible to connect to MySQL from Workers. But, getting the MySQL drivers working on Workers was only half of the battle. To make MySQL on Workers performant for production uses, we needed to make it possible to connect to MySQL databases with Hyperdrive.

Supporting MySQL in Hyperdrive

If you’re a MySQL developer, Hyperdrive may be new to you. Hyperdrive solves a core problem: connecting from Workers to regional SQL databases is slow. Database drivers require many roundtrips to establish a connection to a database. Without the ability to reuse these connections between Worker invocations, a lot of unnecessary latency is added to your application. 

Hyperdrive solves this problem by pooling connections to your database globally and eliminating unnecessary roundtrips for connection setup. As a plus, Hyperdrive also provides integrated caching to offload popular queries from your database. We wrote an entire deep dive on how Hyperdrive does this, which you should definitely check out. 


Getting Hyperdrive to support MySQL was critical for us to be able to say “Connect from Workers to MySQL databases”. That’s easier said than done. To support a new database type, Hyperdrive needs to be able to parse the wire protocol of the database in question, in this case, the MySQL protocol. Once this is accomplished, Hyperdrive can extract queries from protocol messages, cache results across Cloudflare locations, relay messages to a datacenter close to your database, and pool connections reliably close to your origin database. 

Adapting Hyperdrive to parse a new language, MySQL protocol, is a challenge in its own right. But it also presented some notable differences with Postgres. While the intricacies are beyond the scope of this post, the differences in MySQL’s authentication plugins across providers and how MySQL’s connection handshake uses capability flags required some adaptation of Hyperdrive. In the end, we leveraged the experience we gained in building Hyperdrive for Postgres to iterate on our support for MySQL. And we’re happy to announce MySQL support is available for Hyperdrive, with all of the performance improvements we’ve made to Hyperdrive available from the get-go!

Now, you can create new Hyperdrive configurations for MySQL databases hosted anywhere (we’ve tested MySQL and MariaDB databases from AWS (including AWS Aurora), GCP, Azure, PlanetScale, and self-hosted databases). You can create Hyperdrive configurations for your MySQL databases from the dashboard or the Wrangler CLI:

wrangler hyperdrive create mysql-hyperdrive 
--connection-string="mysql://user:[email protected]:3306/defaultdb"

In your Wrangler configuration file, you’ll need to set your Hyperdrive binding to the ID of the newly created Hyperdrive configuration as well as set Node.js compatibility flags:

{
 "$schema": "node_modules/wrangler/config-schema.json",
 "name": "workers-mysql-template",
 "main": "src/index.ts",
 "compatibility_date": "2025-03-10",
 "observability": {
   "enabled": true
 },
 "compatibility_flags": [
   "nodejs_compat"
 ],
 "hyperdrive": [
   {
     "binding": "HYPERDRIVE",
     "id": "<HYPERDRIVE_CONFIG_ID>"
   }
 ]
}

From your Cloudflare Worker, the Hyperdrive binding provides you with custom connection credentials that connect to your Hyperdrive configuration. From there onward, all of your queries and database messages will be routed to your origin database by Hyperdrive, leveraging Cloudflare’s network to speed up routing.

import { createConnection  } from 'mysql2/promise';

export interface Env {
 HYPERDRIVE: Hyperdrive;
}

export default {
 async fetch(request, env, ctx): Promise<Response> {
  
   // Hyperdrive provides new connection credentials to use with your existing drivers
   const connection = await createConnection({
     host: env.HYPERDRIVE.host,
     user: env.HYPERDRIVE.user,
     password: env.HYPERDRIVE.password,
     database: env.HYPERDRIVE.database,
     port: env.HYPERDRIVE.port,

     // Configure mysql2 to use static parsing (as explained above in Part 1)
     disableEval: true 
   });

   const [results, fields] = await connection.query(
     'SHOW tables;'
   );

   return new Response(JSON.stringify({ results, fields }), {
     headers: {
       'Content-Type': 'application/json',
       'Access-Control-Allow-Origin': '*',
     },
   });
 },
} satisfies ExportedHandler<Env>;

As you can see from this code snippet, you only need to swap the credentials in your JavaScript code for those provided by Hyperdrive to migrate your existing code to Workers. No need to change the ORMs or drivers you’re using! 

Get started building with MySQL and Hyperdrive

MySQL support for Workers and Hyperdrive has been long overdue and we’re excited to see what you build. We published a template for you to get started building your MySQL applications on Workers with Hyperdrive:

As for what’s next, we’re going to continue iterating on our support for MySQL during the beta to support more of the MySQL protocol and MySQL-compatible databases. We’re also going to continue to expand the feature set of Hyperdrive to make it more flexible for your full-stack workloads and more performant for building full-stack global apps on Workers.

Finally, whether you’re using MySQL, PostgreSQL, or any of the other compatible databases, we think you should be using Hyperdrive to get the best performance. And because we want to enable you to build on Workers regardless of your preferred database, we’re making Hyperdrive available to the Workers free plan. 

We want to hear your feedback on MySQL, Hyperdrive, and building global applications with Workers. Join the #hyperdrive channel in our Developer Discord to ask questions, share what you’re building, and talk to our Product & Engineering teams directly.

Thank you to Weslley Araújo, Andrey Sidorov, Shi Yuhang, Zhiyuan Liang, Nora Söderlund and other open-source contributors who helped push this initiative forward.

“Just use Vite”… with the Workers runtime

Post Syndicated from James Opstad original https://blog.cloudflare.com/introducing-the-cloudflare-vite-plugin/

Today, we are announcing the 1.0 release of the Cloudflare Vite plugin, as well as official support for React Router v7!

Over the past few years, Vite’s meteoric rise has seen it become one of the most popular build tools for web development, with a large ecosystem and vibrant community. The Cloudflare Vite plugin brings the Workers runtime right into its beating heart! Previously, the Vite dev server would always run your server code in Node.js, even if you were deploying to Cloudflare Workers. By using the new Environment API, released experimentally in Vite 6, your Worker code can now run inside the native Cloudflare Workers runtime (workerd). This means that the dev server matches the production behavior as closely as possible, and provides confidence as you develop and deploy your applications.

Vite 6 includes the most significant changes to Vite’s architecture since its inception and unlocks many new possibilities for the ecosystem. Fundamental to this is the Environment API, which enables the Vite dev server to interact with any number of custom runtime environments. This means that it is now possible to run server code in alternative JavaScript runtimes, such as our own workerd.

We are grateful to have collaborated closely with the Vite team on its design and implementation. When you see first-hand the thoughtful and generous way in which they go about their work, it’s no wonder that Vite and its ecosystem are in such great shape!


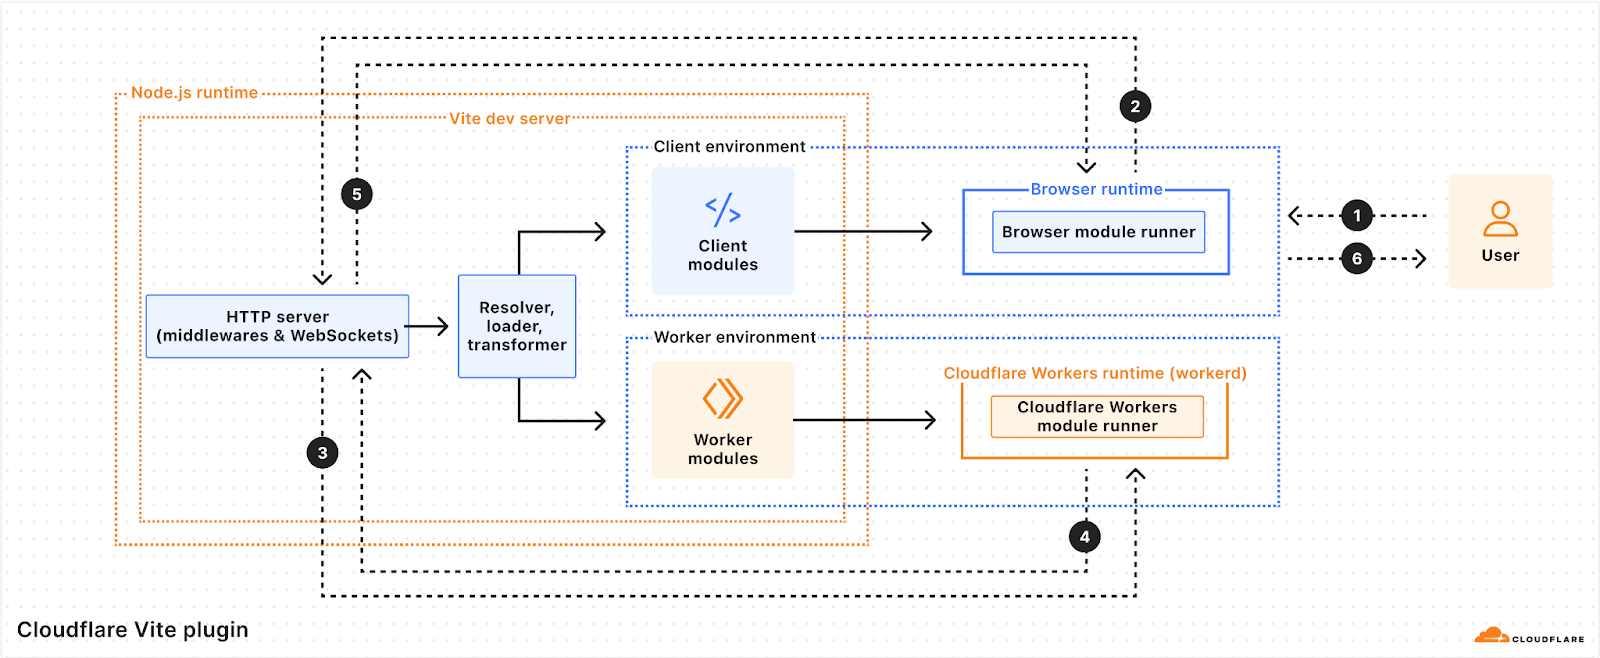
Vite 6 with a Cloudflare Worker environment

Here you can see how it all fits together. The user views a page in the browser (1), which triggers a request to the Vite Dev Server (2). Vite processes the request, resolving, loading, and transforming source files into modules that are added to the client and Worker environments. The client modules are downloaded to the browser to be run as client-side JavaScript, and the Worker modules are sent to the Cloudflare Workers runtime to handle server-side requests. The request is handled by the Worker (3 and 4) and the Vite Dev Server returns the response to the browser (5), which displays the result to the user (6).

Single-page applications

Vite has become the go-to choice for developing single-page applications (SPAs), whether your preferred frontend framework is React, Vue, Svelte, or one of many others.

Create a new app

Let’s try out the new Cloudflare Vite plugin by creating a new React SPA using the create-cloudflare CLI.

npm create cloudflare@latest my-react-app -- --framework=react --platform=workers

This command runs create-vite and then makes the necessary changes to incorporate the Cloudflare Vite plugin.

Using the button below, you can also create a React SPA project on Cloudflare Workers, connected to a git repository of your choice, configured with Cloudflare Workers Builds to automatically deploy, and set up to use the new Vite plugin for local development.

Update an existing app

If you would instead like to update an existing Vite SPA project in the same way, you can follow these two steps:

Add the @cloudflare/vite-plugin dependency to the list of plugins:

import { defineConfig } from "vite";
import react from "@vitejs/plugin-react";
import { cloudflare } from "@cloudflare/vite-plugin";

// https://vite.dev/config/
export default defineConfig({
  plugins: [react(), cloudflare()],
});

Add a wrangler.jsonc configuration file alongside your Vite config:

{
  "$schema": "node_modules/wrangler/config-schema.json",
  "name": "my-react-app",
  "compatibility_date": "2025-04-01",
  "assets": {
    "not_found_handling": "single-page-application",
  },
}

For a purely front-end application, the Cloudflare plugin integrates the Vite dev server with Workers Assets to ensure that settings such as html_handling and not_found_handling behave the same way as they do in production. This is just the beginning, however. The real magic happens when you add a Worker backend that is seamlessly integrated into your development and deployment workflow.

Develop the app

To see this in action, start the Vite development server, which will run your Worker in the Cloudflare Workers runtime:

npm run dev

In your browser, click the first displayed button a few times to increment the counter. This is a classic SPA running JavaScript in your browser. Next, click the second button to fetch the response from the API. Notice that it displays Name from API is: Cloudflare. This is making an API request to a Cloudflare Worker running inside Vite.

Have a look at api/index.ts. This file contains a Worker that is invoked for any request not matching a static asset. It returns a JSON response if the pathname starts with /api/.

Edit api/index.ts by changing the name it returns to ’Cloudflare Workers’ and save your changes. If you click the second button in the browser again, it will now display the new name while preserving the previously set counter value. Vite tracked your changes and updated the Worker environment without affecting the client environment. With Vite and the Cloudflare plugin, you can iterate on the client and server parts of your app together, without losing UI state between edits.

The Cloudflare Vite integration doesn’t end with the dev server. vite build outputs the client and server parts of your application with a single command. vite preview allows you to preview your build output in the Workers runtime prior to deployment. Finally, wrangler deploy recognises that you have generated a Vite build and deploys your application directly without any additional bundling.

React Router v7

While Vite began its life primarily as a build tool for single-page applications, it has since become the foundation for the current generation of full-stack frameworks. Astro, Qwik, React Router, SvelteKit and others have all adopted Vite, drawing on its development server, build pipeline, and phenomenal developer experience. In addition to working with the Vite team on the Environment API, we have also partnered closely with the Remix team on their adoption of Vite Environments. Today, we are announcing first-class support for React Router v7 (the successor to Remix) in the Cloudflare Vite plugin.

You can use the create-cloudflare CLI to create a new React Router application configured with the Cloudflare Vite plugin.

npm create cloudflare@latest my-react-router-app -- --framework=react-router

Run npm run dev to start the dev server. You can also try building (npm run build), previewing (npm run preview), and deploying (npm run deploy) your application.

Have a look at the code below, taken from workers/app.ts. This is the file referenced in the main field in wrangler.jsonc:

const requestHandler = createRequestHandler(
  () => import("virtual:react-router/server-build"),
  import.meta.env.MODE
);

export default {
  async fetch(request, env, ctx) {
    return requestHandler(request, {
      cloudflare: { env, ctx },
    });
  },
} satisfies ExportedHandler<CloudflareEnvironment>;

This single file defines your Worker at both dev and build time and puts you in full control. No more build-time adapters! Notice how the env and ctx are passed down directly in the request handler. These are then accessible in your loaders and actions, which are running inside the Workers runtime along with the rest of your server code. You can add other exports to this file to suit your needs and then reference them in your Worker config. Want to add a Durable Object or a Workflow? Go for it!

This will be the first in a series of full-stack frameworks to be supported and we look forward to continuing discussion and collaboration with a range of teams over the coming months. If you are a framework contributor looking to improve integration with Cloudflare and/or the Vite Environment API, then please feel free to explore the code and reach out on GitHub or Discord.

Workers

While this post has focused thus far on using Vite to build web applications, the Cloudflare plugin enables you to use Vite to build anything you can build with Workers. The full Cloudflare Developer Platform is supported, including KV, D1, Service Bindings, RPC, Durable Objects, Workflows, Workers AI, etc. In fact, in most cases, taking an existing Worker and developing it with Vite is as simple as following these two steps:

Install the dependencies:

npm install –save-dev vite @cloudflare/vite-plugin

And add a Vite config:

// vite.config.ts

import { defineConfig } from "vite";
import { cloudflare } from "@cloudflare/vite-plugin";

export default defineConfig({
  plugins: [cloudflare()],
});

That’s it! By default, the plugin will look for a wrangler.json, wrangler.jsonc, or wrangler.toml config file in the root of your Vite project. By using Vite, you can draw on its rich ecosystem of plugins and integrations and easily customize your build output.

Wrapping up

In 2024, we announced getPlatformProxy() as a way to access Cloudflare bindings from development servers running in Node. At the end of that post, we imagined a future where it would instead be possible to develop directly in the Workers runtime. This would eliminate the many subtle ways that development and production behavior could differ. Today, that future is a reality, and we can’t wait for you to try it out!

Start a new project with our React Router, React, or Vue templates using the create-cloudflare CLI, use the “Deploy to Cloudflare” button below, or try adding @cloudflare/vite-plugin to your existing Vite applications. We’re excited to see what you build!

Read more in our Cloudflare Vite Plugin documentation.

[$] Using large folios for text areas

Post Syndicated from corbet original https://lwn.net/Articles/1016416/

Quite a bit of work has been done in recent years to allow the kernel to
make more use of large folios. That progress has not yet reached the
handling of text (executable code) areas, though. During the
memory-management track of the 2025 Linux Storage, Filesystem,
Memory-Management, and BPF Summit, Ryan Roberts ran a session on how that
situation might be improved. It would be a relatively small and contained
operation, but can give a measurable performance improvement.

[$] Per-CPU memory for user space

Post Syndicated from corbet original https://lwn.net/Articles/1016408/

The kernel makes extensive use of per-CPU data as a way to avoid contention
between processors and improve scalability. Using the same technique in
user space is harder, though, since there is little control over which CPU
a process may be running on at any given time. That hasn’t stopped Mathieu
Desnoyers from trying, though; in the memory-management track of the 2025
Linux Storage, Filesystem, Memory-Management, and BPF Summit, he presented
a proposal for how user-space per-CPU memory could work.

Security updates for Tuesday

Post Syndicated from corbet original https://lwn.net/Articles/1016774/

Security updates have been issued by AlmaLinux (gimp, libxslt, python3.11, python3.12, and tomcat), Debian (ghostscript and libnet-easytcp-perl), Fedora (openvpn, perl-Data-Entropy, and webkitgtk), Red Hat (python-jinja2), SUSE (giflib, pam, and xen), and Ubuntu (apache2, binutils, expat, fis-gtm, linux-azure, linux-azure-6.8, linux-nvidia-lowlatency, linux-azure, linux-azure-fde, linux-azure-5.15, linux-azure-fde-5.15, linux-azure-fips, linux-gcp-fips, linux-hwe-5.4, linux-nvidia, linux-nvidia-tegra-igx, ruby2.7, ruby3.0, ruby3.2, ruby3.3, and vim).

2025 Ransomware: Business as Usual, Business is Booming

Post Syndicated from Chris Boyd original https://blog.rapid7.com/2025/04/08/2025-ransomware-business-as-usual-business-is-booming/

2025 Ransomware: Business as Usual, Business is Booming

Getting an edge on your adversaries involves understanding their behaviors and their mindset. Rapid7 Labs took a look at internal and publicly-available ransomware data for Q1 2025 and added our own insights to provide a picture of the year thus far—and what you can do now to reduce your attack surface against ransomware.

The data highlights that businesses can’t afford to take their foot off the gas pedal when it comes to proactively tackling ransomware. Established threat actors and relative newcomers are taking an “if it ain’t broke, don’t fix it” approach, shunning unpredictability for proven revenue generation techniques. And, in almost all cases, the name of the game is data exfiltration and blackmail via leak site posts.

At a glance

The heavy hitters of the current ransomware landscape are a mixture of new and familiar faces, largely leaning into the affiliate model or announcing partnerships with well-known groups for a visibility boost. There were 80 active groups in Q1, 16 of them new since January 1. There are also 13 groups that were active in Q4, 2024, but have thus far been silent in 2025.

2025 Ransomware: Business as Usual, Business is Booming

New ransomware groups active since the start of 2025 include (but are not limited to): Ailock, Belsen Group, CrazyHunter, Cs-137, D0Glun, GD LockerSec, Linkc, NightSpire, Ox Thief, Run Some Wares, SECP0, Sonshi, and VanHelsing.

Popular targets in Q1:

  • Manufacturing, business services, healthcare, and construction were the top industries under siege by a variety of established and newly emerging threat actors. Of the 618 leak site posts we reviewed containing victims’ industry information, 22% were manufacturing organizations. Business services was a distant second at 11%, followed by healthcare services and construction, both at 10%.
  • Top regional targets included traditional favorites such as the U.S., Canada, the UK, Germany, and Australia, as well as a fair share of victims in Taiwan, Singapore, and Japan. We also saw an increase of victims in unusual locations such as Colombia and Thailand.

Reinvested ransoms

The Black Basta chat leaks that occurred in February provided an insightful look into not only the group’s infighting, but also its inner workings. And while the group’s activity stopped dead in its tracks (the last leak site post was on January 11, 2025), we would be remiss if we didn’t give mention to a significant trend we have suspected was happening, but were only able to verify with these chat logs: Ransomware groups are reinvesting the ransoms they’re paid to purchase zero days.

Within the Black Basta chat logs, we observed that on November 23, 2023, the group was offered a zero-day exploit targeting Ivanti Connect Secure for their purchase. The exploit came with an asking price of $200,000, and is described by the seller as an unauthenticated RCE exploit, leveraging an unknown memory corruption vulnerability.

While it’s unclear if a purchase was ever made, we can speculate as to what this vulnerability may or may not have been, based on recently published Ivanti Connect Secure CVEs. There were three notable CVEs exploited in the wild as zero days circa late 2023: CVE-2023-46805, CVE-2024-21887, and CVE-2024-21893. However, the seller describes the zero day as a memory corruption vulnerability, which none of those three were. It was also not CVE-2024-21893, which was an SSRF vulnerability. A more recent CVE affecting Ivanti Connect Secure, which was both a memory corruption vulnerability, and exploited in the wild as a zero day, was CVE-2025-0282; however, the affected version ranges of this CVE don’t line up with the zero day being offered in the Black Basta logs. It is possible the zero day being offered for sale to the Black Basta group remains a zero day, as there is no evidence to suggest that it has been patched.

Separate from the Ivanti discussion, however, we observed that Black Basta did indeed buy a Juniper firewall exploit. This followed a comparison between a public, authenticated remote code execution (RCE) exploit (which only gives user-mode access) and the purchased one that provides full root access.

Repackaged offerings

Several groups are making a name for themselves by simply dragging out the classics. Most recently, a supposedly resurrected Babuk ransomware group was not all it seemed, with old data taken from RansomHub, FunkSec and LockBit repurposed as their own. Rapid7 analysis highlights the challenges of groups reforming or collaborating under new identities, such as “Babuk 2.0” just being LockBit 3.0 / LockBit Black with a different name applied.

Elsewhere, FunkSec is not above repurposing old leak data, and LockBit was found to be posting a mixture of old data and faked attacks after global arrests of suspected LockBit developers and affiliates. Visibly weakened by the trilateral law enforcement action, what was left of LockBit turned to fakery as a way of making it seem as though things were still business as usual.

Restructured groups

When ransomware groups go silent, others are there to take their place. Part of this dynamic is a continuously circulating affiliate network that keeps defenders and cybersecurity analysts on their toes. Rebrands aside, Rapid7 observed what appears to be a “changing of the guard” within the Akira ransomware group.

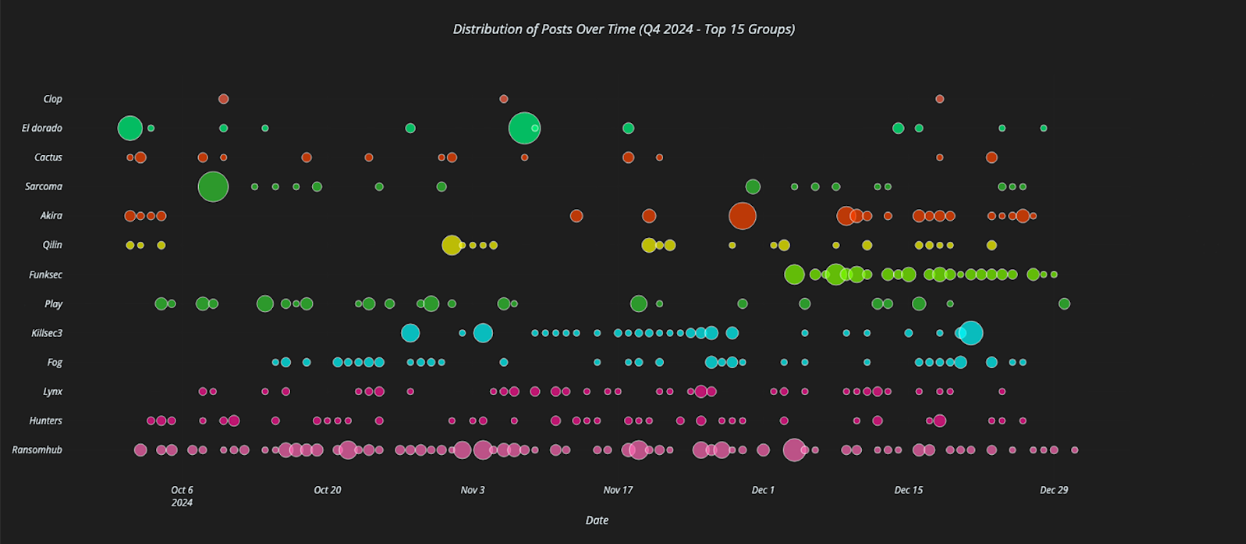
In the scatterplot below, we see Q4 2024 leak site post activity for the top 15 ransomware groups, where the dots indicate individual posts and the dot sizes indicate the amount of data being posted. Looking at Akira’s (5th from top) posting distribution, we can see that it is sporadic but its pace begins to increase around mid December. By way of comparison, RansomHub’s (bottom line) posting distribution is consistent and strong throughout the quarter.

2025 Ransomware: Business as Usual, Business is Booming

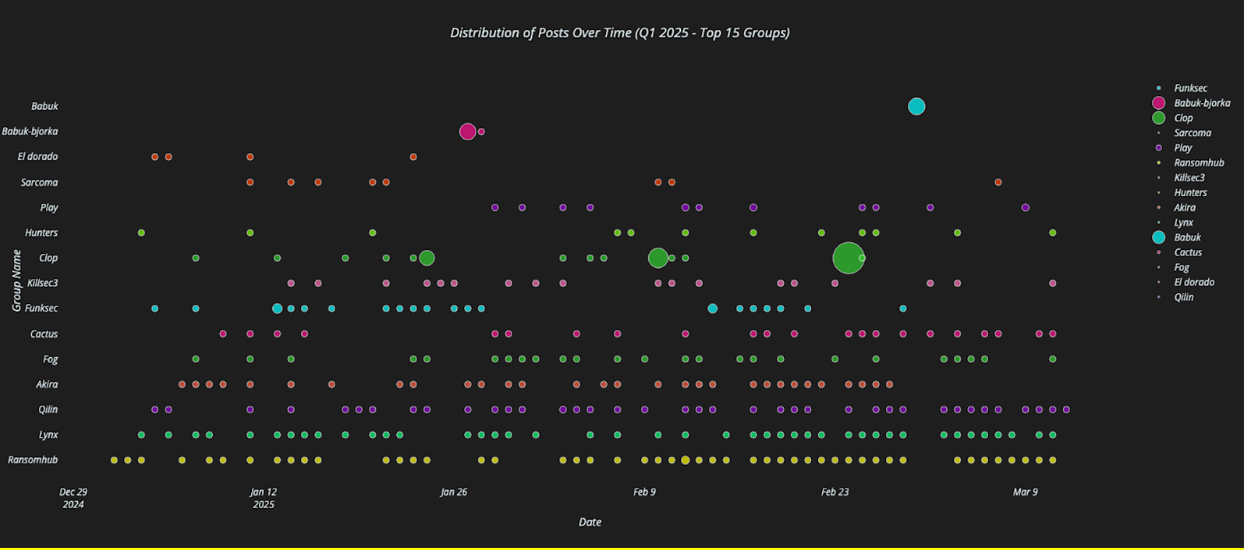
In the following scatterplot, which is Q1 2025, we see Akira (4th from bottom) operating much more in line with other leading players (Qilin, Lynx, etc.). Rather than sporadic, often large data dumps, Akira has begun to make regular postings of similar size. Further trends analysis shows that Akira’s postings shifted from happening primarily on Fridays to being anytime throughout the week.

2025 Ransomware: Business as Usual, Business is Booming

Ones to watch

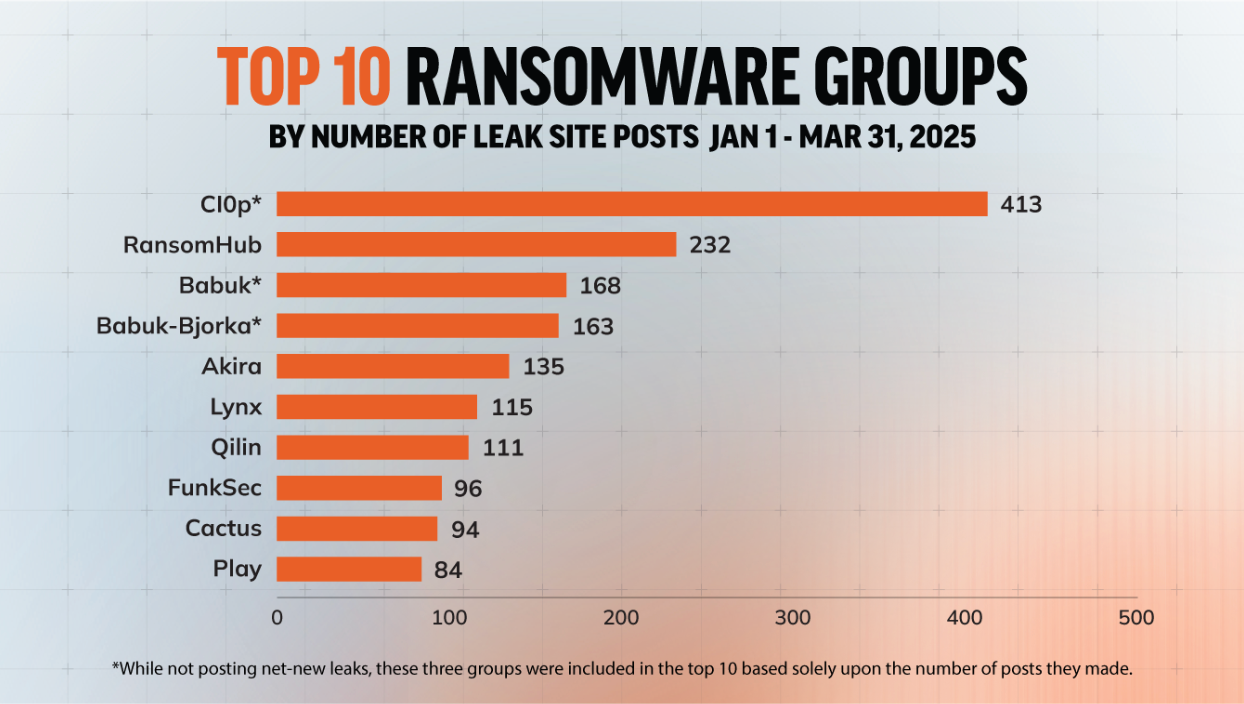
As noted above, the most prolific ransomware groups for Q1 2025, ranked by the number of posts on their dedicated leak sites, are Cl0p and RansomHub by a considerable margin. Along with these two groups, several others are disrupting businesses of varying sizes and industries. In this section we’ll discuss groups of particular concern due to their reach and/or negative organizational impacts.

RansomHub

RansomHub burst onto the scene in February 2024, combining data encryption and exfiltration from a minimum of 210 organizations across a 6-month period. Affiliates are known to use vulnerability exploitation and phishing for initial access, along with double extortion to force victims into paying a ransom or face leaked data and reputational damage. RansomHub was the most prolific leak group operator we saw in 2024, and based on current trends displays no sign of slowing down.

Cl0p

Cl0p is one of the most well known Ransomware-as-a-Service (RaaS) groups. First seen in 2019, Cl0p has a long history of using exploits to propagate ransomware and leans heavily into double extortion. Cl0p is also known for its involvement in devastating supply-chain incidents, most notably claiming to have stolen data from hundreds of MOVEit Transfer customers. Initial access vectors include phishing emails, social engineering, and malicious attachments.

The group has made a torrent of leak site posts since the start of the year, with an astonishing 345 leak site posts in February alone and 413 for Q1 overall. While some of these posts represent fresh attacks, the majority are drip-fed leaks related to their exploitation of an older vulnerability in Cleo’s file transfer software.

Anubis

A new RaaS group active since at least November 2024 with a strong focus on data extortion, Anubis has possibly redefined the double extortion approach into something best described as malevolence as a service. It’s not enough to exfiltrate and then leak victim data; Anubis presents findings in a format resembling citizen journalism, exposing the alleged wrongdoings of those they target. The Robin Hood approach, hoping to curry favor with the public, is a well-worn one.

All of this, wrapped up in a slick format of nice graphics and hype-generating announcements on social media.

2025 Ransomware: Business as Usual, Business is Booming

It feels more like buying into membership of an airline loyalty program, as opposed to some kind of ruthless extortion. Already well into the “Watch out for our next exciting leak” promotional activity stage, this is a group making waves and has claimed at least five public victims so far, mainly in the healthcare and engineering sectors. Of note is that Anubis itself has stated it is looking to exclude education, government and non-profit sectors from its list of potential targets. Thus far, targeted regions appear to be the U.S., Canada, Europe, and Australia.

Lynx

First observed in July 2024, this now-established RaaS group combines phishing and malicious downloads alongside double extortion tactics. Lynx targets a variety of sectors including utilities, construction, and manufacturing, with victims located in a wide variety of locations including the U.S., Australia, and Romania.

Lynx offers a slick and professional affiliate panel, allowing affiliates to micromanage almost all aspects of a campaign and its unfortunate targets. The panel includes victim profile pages, news and updates, and an “all-in-one” archive of executables targeting multiple architectures. It’s the kind of setup which lowers the bar to entry for newcomers, and only becomes more popular over time.

Qilin

Although not as visible as some other ransomware groups in Q1 2025, RaaS operator Qilin has achieved some notable success. First observed in 2022, Qilin ransomware has been used to target a wide variety of industries which includes the healthcare, financial, and manufacturing sectors. Known for spear phishing and making use of compromised credentials, Qilin attacks tend to specialize in double extortion and data exfiltration on a large scale—their leaks can range from a few hundred gigabytes to their most recently publicized attack, which is allegedly a haul of 1.1 terabytes of data. Alarmingly, Microsoft has observed North Korean group Moonstone Sleet deploying Qilin ransomware at “a limited number of organizations”, the first time this group has been known to make use of ransomware developed by a RaaS threat actor.

Tactics

Ransomware groups tend to follow a specific pattern: Initial access, reconnaissance, credential theft and lateral movement, exfiltration, and finally encryption. There are divergences, however. Some groups avoid ransomware deployment and file encryption, instead choosing to compromise the network via unsecured VPNs and Remote Desktop Protocol (RDP). From there, they move straight to data exfiltration. This is known as “extortionware.”

Other threat actors, notably LockBit, use Living off the Land (LOTL) tactics to infiltrate networks with legitimate tools and management software already in place. As no malware files are deployed, it becomes increasingly difficult to detect these attacks in motion and threat actors can sit undetected for weeks or even months.

Here are some of the key elements of ransomware tactics across this first quarter of 2025:

  • RaaS is firmly established as a key tactic for prominent ransomware groups. The ease with which affiliates can buy into a ransomware group of choice and immediately begin attacks (see example below) ensures a steady flow of profit for the criminals at the top of the food chain.
2025 Ransomware: Business as Usual, Business is Booming
  • Double extortion is also a firm favorite. FunkSec made inroads into this realm with ransoms as low as $10,000, perhaps designed to be more enticing to victims than the often unreachable demands for totals ranging from $600,000 to a cool million plus.
  • The deadline to pay a ransom, or just make initial contact with the threat actor, varies greatly between groups. RansomHub has previously handed out ransoms with deadlines ranging between 72 hours and 90 days. Cl0p has been known to apply varying degrees of pressure to encourage targets to get in touch. In December 2024, the group gave uncommunicative victims 48 hours to make contact or risk having their organization’s names disclosed publicly. Other Cl0p notes, such as the one below, reuse the 48-hour tactic but exclude mention of public exposure. Regardless of the tactics used, there’s no guarantee files will be unencrypted or stolen documents deleted from leak sites should the victims pay up. These supposed deadlines create a sense of urgency while potentially offering victims little beyond false hope.
2025 Ransomware: Business as Usual, Business is Booming

Five things you can do now

Unfortunately, there is no escaping the business reality of ransomware; it is a pervasive problem and it impacts every business at some level sooner or later. A solid defense plan can help to lower risk and prevent a disastrous outcome.

Here are five things you can do now that will make an immediate impact on reducing your attack surface:

  1. Take a fresh look at your MFA — If your organization has deployed multi-factor authentication (MFA), take the time now to review any policy exceptions that have been made over time and remove as many as possible. In addition, ensure that your MFA settings are properly configured (this is critical!). If your organization has not yet deployed MFA, see number 2.
  2. Deploy and configure MFA the right way — Multi-factor authentication is a must to avoid giving attackers an easy win from unsecured VPNs and RDP. Combine with geolocational restrictions, strong, unique passwords, and number matching in MFA applications to help ward off additional threats like MFA fatigue.
  3. Practice continuous patch management, especially for edge devices — Over the last couple of years, network edge devices have become a favorite way for attackers to gain initial access and then pivot elsewhere in the victim’s network. It’s critical that your patch management program accounts for this by prioritizing fixes to these devices as they are released. Prioritization of fixes should also be based on known exploits, their potential impacts to your business, and how these align with your business’s risk tolerance.
  4. Hold a ransomware attack simulation — Activate your incident response plan as if the organization has just been made aware of a breach. Who in the organization is involved and what are their immediate tasks? Are payment policies and outside resources pre-determined so there are no panic-driven mistakes and critical time isn’t lost? Note your learnings and schedule regular simulations every 6 months thereafter.
  5. Investigate your attack surface — Threat actors and their tools are poking and prodding your attack surface in search of vulnerabilities, and you must be proactive in doing the same. Resolve to speak with us regularly about Rapid7’s latest innovations in attack surface management.

Conclusion

Ransomware groups large and small have ushered in 2025 with a clear statement of intent: business as usual, and business is booming. The significant volume of leak posts and the heavy lean toward double extortion would indicate we can expect more of the same as the year progresses. In addition, the first glimmer of reportage-style commentary on their victim’s alleged failings suggests a bumpy road ahead for organizations unlucky enough to end up in the ransomware spotlight.

Newer groups hungry for publicity and affiliate network building will potentially look to emulate the Anubis approach, and do a little reportage style journalism of their own. Gimmicks sell and grab publicity, and reputational damage from data leaks may well go hand in hand with regulatory embarrassment and bad publicity. If that wasn’t bad enough, ransomware groups stand revealed through exposed chat logs as being in the market for purchasing zero days.

Businesses need to do everything they can to minimize the risk of easy network access and data exfiltration. Victims continue to pay the price for poor MFA coverage and inadequate patch management, which is why we heavily stressed these basics in our recommendations section above.

If there is a brave new world of ransomware to speak of, it largely resembles the old one with a few streamlined tweaks to a very well-oiled machine.

Skip the setup: deploy a Workers application in seconds

Post Syndicated from Nevi Shah original https://blog.cloudflare.com/deploy-workers-applications-in-seconds/

You can now add a Deploy to Cloudflare button to the README of your Git repository containing a Workers application — making it simple for other developers to quickly set up and deploy your project! 

The Deploy to Cloudflare button: 

  1. Creates a new Git repository on your GitHub/ GitLab account: Cloudflare will automatically clone and create a new repository on your account, so you can continue developing. 

  2. Automatically provisions resources the app needs: If your repository requires Cloudflare primitives like a Workers KV namespace, a D1 database, or an R2 bucket, Cloudflare will automatically provision them on your account and bind them to your Worker upon deployment. 

  3. Configures Workers Builds (CI/CD): Every new push to your production branch on your newly created repository will automatically build and deploy courtesy of Workers Builds. 

  4. Adds preview URLs to each pull request: If you’d like to test your changes before deploying, you can push changes to a non-production branch and preview URLs will be generated and posted back to GitHub as a comment.   


There is nothing more frustrating than struggling to kick the tires on a new project because you don’t know where to start. Over the past couple of months, we’ve launched some improvements to getting started on Workers, including a gallery of Git-connected templates that help you kickstart your development journey. 

But we think there’s another part of the story. Everyday, we see new Workers applications being built and open-sourced by developers in the community, ranging from starter projects to mission critical applications. These projects are designed to be shared, deployed, customized, and contributed to. But first and foremost, they must be simple to deploy.

Ditch the setup instructions

If you’ve open-sourced a new Workers application before, you may have listed in your README the following in order to get others going with your repository:

  1. “Clone this repo” 

  2. “Install these packages”

  3. “Install Wrangler” 

  4. “Create this database”

  5. “Paste the database ID back into your config file” 

  6. “Run this command to deploy” 

  7. “Push to a new Git repo” 

  8. “Set up CI” 

And the list goes on the more complicated your application gets, deterring other developers and making your project feel intimidating to deploy. Now, your project can be up and running in one shot — which means more traction, more feedback, and more contributions.

Self-hosting made easy 

We’re not just talking about building and sharing small starter apps but also complex pieces of software. If you’ve ever self-hosted your own instance of an application on a traditional cloud provider before, you’re likely familiar with the pain of tedious setup, operational overhead, or hidden costs of your infrastructure. 

Self-hosting with traditional cloud provider

Self-hosting with Cloudflare 

Setup a VPC

Install tools and dependencies  

Set up and provision storage 

Manually configure CI/CD pipeline to automate deployments 

Scramble to manually secure your environment if a runtime vulnerability is discovered

Configure autoscaling policies and manage idle servers

✅Serverless

✅Highly-available global network

✅Automatic provisioning of datastores like D1 databases and R2 buckets

✅Built-in CI/CD workflow configured out of the box

✅Automatic runtime updates to keep your environment secure

✅Scale automatically and only pay for what you use.

By making your open-source repository accessible with a Deploy to Cloudflare button, you can allow other developers to deploy their own instance of your app without requiring deep infrastructure expertise. 

From starter projects to full-stack applications

We’re inviting all Workers developers looking to open-source their project to add Deploy to Cloudflare buttons to their projects and help others get up and running faster. We’ve already started working with open-source app developers! Here are a few great examples to explore: 

Test and explore your APIs with Fiberplane 

Fiberplane helps developers build, test and explore Hono APIs and AI Agents in an embeddable playground. This Developer Week, Fiberplane released a set of sample Worker applications built on the ‘HONC‘ stack — Hono, Drizzle ORM, D1 Database, and Cloudflare Workers — that you can use as the foundation for your own projects. With an easy one-click Deploy to Cloudflare, each application comes preconfigured with the open source Fiberplane API Playground, making it easy to generate OpenAPI docs, test your handlers, and explore your API, all within one embedded interface.

Deploy your first remote MCP server 

You can now build and deploy remote Model Context Protocol (MCP) servers on Cloudflare Workers! MCP servers provide a standardized way for AI agents to interact with services directly, enabling them to complete actions on users’ behalf. Cloudflare’s remote MCP server implementation supports authentication, allowing users to login to their service from the agent to give it scoped permissions. This gives users the ability to interact with services without navigating dashboards or learning APIs — they simply tell their AI agent what they want to accomplish.

Start building your first agent 

AI agents are intelligent systems capable of autonomously executing tasks by making real-time decisions about which tools to use and how to structure their workflows. Unlike traditional automation (which follows rigid, predefined steps), agents dynamically adapt their strategies based on context and evolving inputs. This template serves as a starting point for building AI-driven chat agents on Cloudflare’s Agent platform. Powered by Cloudflare’s Agents SDK, it provides a solid foundation for creating interactive AI chat experiences with a modern UI and tool integrations capabilities.

Try it now

You can start using Deploy to Cloudflare buttons today!

Add a Deploy to Cloudflare button to your README

Be sure to make your Git repository public and add the following snippet including your Git repository URL.

[![Deploy to Cloudflare](https://deploy.workers.cloudflare.com/button)](https://deploy.workers.cloudflare.com/?url=<YOUR_GIT_REPO_URL>)

When another developer clicks your Deploy to Cloudflare button, Cloudflare will parse the Wrangler configuration file, provision any resources detected, and create a new repo on their account that’s updated with information about newly created resources. For example:

{
  "compatibility_date": "2024-04-03",

  "d1_databases": [
    {
      "binding": "MY_D1_DATABASE",

	//will be updated with newly created database ID
      "database_id": "1234567890abcdef1234567890abcdef"
    }
  ]
}

Check out our documentation for more information on how to set up a deploy button for your application and best practices to ensure a successful deployment for other developers. 

Start building 

For new Cloudflare developers, keep an eye out for “Deploy to Cloudflare” buttons across the web, or simply paste the URL of any public GitHub or GitLab repository containing a Workers application into the Cloudflare dashboard to get started.


During Developer Week, tune in to our blog as we unveil new features and announcements — many including Deploy to Cloudflare buttons — so you can jump right in and start building!

Deploying Zabbix Components with Docker and Docker Compose

Post Syndicated from Janis Eidaks original https://blog.zabbix.com/deploying-zabbix-components-with-docker-and-docker-compose/30025/

Installing Zabbix from packages can feel overwhelming, due to the availability of different configuration options. The detailed and comprehensive documentation certainly helps to check the purpose of these multiple options, what values can be set in their fields, and if one is required for your planned deployment. There are quite a few official Zabbix blog posts about Zabbix in containers, and this post is aimed at showcasing how additional Zabbix components can be easily set up in a docker environment, along with docker run and docker compose examples.

For those who would prefer to use Zabbix in a containerized environment such as Docker, or who want to try out Zabbix quickly, this guide is for you (you can also check out the other Zabbix Docker blog posts). You can also mix and match Zabbix components installed from packages or built from source with those running in containers.

Please follow the official guide on how to set up the docker here.

To better understand the Zabbix architecture for those who are trying out Zabbix for the first time, I will give you an overview that should make it much easier to follow and understand Zabbix.

Zabbix consists of 3 main components (the bare minimum to get started):

  • Zabbix Server – responsible for everything related to data collection, trigger evaluation, event generation, and alerting.
  • Zabbix Frontend – responsible for the configuration (modifying or changing the configuration of the monitoring targets) and visualization (dashboards, graphs, tables, and widgets).
  • Database – this is where the Zabbix configuration and monitoring history data are stored.

You can monitor your targets with the bare minimum setup; however, more comprehensive and complete monitoring can be achieved by using the C-based Zabbix-agent or GO-based Zabbix-agent2 in combination with templates, user parameters, and more. To set up the minimum necessary Zabbix components, you can use this example in the guide.

There are also official guides available on the Zabbix documentation page (for both: the docker run and docker compose) or the Docker/Github.

As of this writing , these official Zabbix docker components are available from the docker hub page:

  • Zabbix Server (with MySQL/PostgreSQL database)
  • Zabbix Proxy (with MySQL/SQLite3 database)
  • Zabbix Frontend (Apache/Nginx with MySQL/PostgreSQL DB)
  • Zabbix Agent (TLS encryption)
  • Zabbix Agent2 (TLS encryption)
  • Zabbix Java Gateway
  • Zabbix SNMP traps
  • Zabbix Web Service

Tags are used to select which OS container an image will be based on, as well as which Zabbix component version you wish to employ. If you only specify tag value – latest, you will get the latest Zabbix version based on the Alpine Linux. The images based on Linux Alpine are more lightweight than the other distros.

When something does not work as expected or fails, check the container error logs! This will be useful for debugging purposes and will help to narrow down the cause of an issue. Additionally, when debugging you can also specify additional options, such as specific lines of log, timestamp since or until, or following the log file content.

# docker logs --tail 50 container_name_or_id
    --details        Show extra details provided to logs
-f, --follow         Follow log output
    --since string   Show logs since timestamp (e.g. "2013-01-02T13:23:37Z") or relative (e.g. "42m" for 42 minutes)
-n, --tail string    Number of lines to show from the end of the logs (default "all")
-t, --timestamps     Show timestamps
    --until string   Show logs before a timestamp (e.g. "2013-01-02T13:23:37Z") or relative (e.g. "42m" for 42 minutes)

In some rare cases, when there is a container issue (everything else is correct, worked before, etc.), restarting the docker service can sometimes solve the issue.

So, what is different if you have only used Zabbix installed from packages?  The examples below illustrate the differences in configuration options based on different Zabbix deployment methods: a) package-based/compiled installation, b) docker run command, and c) docker compose file example. First of all, you will have to specify environment variables in the docker run command or docker compose file. The list of available environment variables for each docker image is available in both docker hub and Github.

A). Package-based config

# vi /etc/zabbix/zabbix_server.conf
...
DBName=zabbix
DBUser=zabbix_usr
DBPassword=zabbix_pwd
...

B).Docker run config

docker run --name zbxsrv -t \
...
-e MYSQL_DATABASE=zabbix\
-e MYSQL_USER=zabbix_usr \
-e MYSQL_PASSWORD=zabbix_pwd\
...

C). Docker compose config

# vi /../...yaml
...
  environment:
   MYSQL_DATABASE=zabbix
   MYSQL_USER=zabbix_usr
   MYSQL_PASSWORD=zabbix_pwd

The environment variables are represented as key-value pairs, e.g., VAR=VAL. The values can optionally be unquoted or double-quoted. If some environment variable value contains special characters, you will need to escape them. To properly escape them, check out the docker documentation page.

You can create custom, user-defined networks to connect multiple containers to the same network. On such networks, containers can resolve each other by name or alias. If needed, you can assign a specific IP address to a container (if the address is already used, you will get an error).

# docker network create --subnet 172.20.0.0/16 --ip-range 172.20.240.0/20 zabbix-net

Docker run

In this section, we have an example of docker run commands for two Zabbix components: Zabbix proxy and Java gateway. When using custom, user-defined networks, you can use container names for communication between containers instead of using IP addresses. Here, instead of defining the IP address for Zabbix Java gateway, the container name is used. You can set a static IP address for your container or let docker do it for you, but confirm if the change of the IP address will not cause issues in case your container gets a different IP address. This can become an issue if you use an IP address in some configuration fields instead of a container name.

A lot of parameters are specified using environment variables with the option -e. Also, 3 different ports are exposed on your host machine. To keep the SQLite3 database file upon container deletion, the container directory containing database file is mounted to host directory (the proxy DB is usually used as a buffer storage before sending data to Zabbix server and usually is not used to store data beyond the moment when the data is sent).

docker run --name zabbix-proxy-active-01 \
-e ZBX_HOSTNAME="Zabbix-proxy-active-01" \
-e ZBX_SERVER_HOST=46.101.140.98 \
-e ZBX_PROXYMODE="0" \
-e ZBX_JAVAGATEWAY_ENABLE=true \
-e ZBX_JAVAGATEWAY=zabbix-java-gateway-proxy \
-e ZBX_JAVAGATEWAYPORT=10052 \
-e ZBX_STARTJAVAPOLLERS=5 \
--network=zabbix-net \
-e ZBX_LISTENPORT=10101  \
-p 10101:10101 \
-p 10050:10050 \
-p 10051:10051 \
-v /var/lib/zabbix/db_data:/var/lib/zabbix/db_data \
--restart unless-stopped \
--init -d zabbix/zabbix-proxy-sqlite3:alpine-7.2.4
docker run --name zabbix-java-gateway-proxy \
--network=zabbix-net \
--restart unless-stopped \
-d zabbix/zabbix-java-gateway:alpine-7.2.4

You can start each of these Zabbix components using the docker run command, however, any change to the container configuration will require you to stop the container, delete it, and execute the docker run command again. You also have another option – you could create a docker compose file and write the necessary configuration in yaml format. When you need to add some changes to the container configuration, run the docker compose down command to remove containers, edit the docker compose file, and run docker compose up command to start them up again with the new configuration:

  • docker compose -f ./docker_compose_v3_proxy.yaml down
  • docker compose -f ./docker_compose_v3_proxy.yaml up -d

If you have not mounted volume or directory to container for the data you want to keep, you can copy the data from the container to your host. Otherwise, that data will be gone if you delete the container or use the docker compose down command. So, it is important to set up the persistent storage/volume for the data that needs retaining, so you don’t lose important data from the container when container configuration is changed. You also need to expose the ports for the necessary services for the appropriate components (if they are set up on on separate hosts): zabbix-server, zabbix-proxy, zabbix-agent/zabbix-agent2 (default ports: 10050 for Zabbix agent passive mode, 10051 for Zabbix-agent active mode, some different port for proxy, 10052 for Java gateway).

Here we have the same docker run options written to docker compose file, including the environment variables, mounted directories and exposed ports. You can specify as many services as needed and start them just with docker compose command.

docker_compose_v3_proxy.yaml

services:
  zabbix-proxy-active-01:
    image: "${PROXY_SQLITE3_IMAGE}:${ALPINE_IMAGE_TAG}"
    environment:
      ZBX_HOSTNAME: Zabbix-proxy-active-01
      ZBX_SERVER_HOST: ${ZBX_SERVER_HOST}
      ZBX_PROXYMODE: 0
      ZBX_LISTENPORT: 10101
      ZBX_JAVAGATEWAY_ENABLE: true
      ZBX_JAVAGATEWAY: zabbix-java-gateway-proxy
      ZBX_JAVAGATEWAYPORT: 10052
      ZBX_STARTJAVAPOLLERS: 5
    volumes:
      - /var/lib/zabbix/db_data:/var/lib/zabbix/db_data:rw
    networks:
      - backend
    ports:
      - 10101:10101
      - 10050:10050
      - 10051:10051
    restart: unless-stopped

  zabbix-java-gateway-proxy:
    image: "${JAVA_GW_IMAGE}:${ALPINE_IMAGE_TAG}"
    networks:
      - backend
    restart: unless-stopped

networks:
  backend:
    name: zabbix-net
    external: true

.env

PROXY_SQLITE3_IMAGE=zabbix/zabbix-proxy-sqlite3
JAVA_GW_IMAGE = zabbix/zabbix-java-gateway
ALPINE_IMAGE_TAG=alpine-7.2.4
ZBX_SERVER_HOST=46.101.140.98

You can also use official Zabbix-supplied docker compose files, try them out, and modify them as needed.

You can read more about the official docker compose files here.

Containerized Zabbix components allow us to use test different scenarios within the docker:

  • Creating HA Zabbix-server nodes
  • Creating multiple proxies
  • Creating multiple agents
  • Adding more Java gateways
  • Creating multiple frontends
  • Easily configure Browser monitoring
  • Configure SNMP traps
  • Easily make scheduled reports

Deploying multiple redundant Zabbix servers

To enable HA Zabbix server mode, modify both the Zabbix-server container and Zabbix-frontend container configuration environment variables.

For the HA Zabbix server mode, add 2 environment variables:

  • ZBX_HANODENAME
  • ZBX_NODEADDRESS

All of the containers are set with the user-defined network, therefore I will use the container name in the ZBX_HANODENAME option instead of the static address, as it will be resolved by docker. If you need to use a different listen port for the trapper, you need to define it using the environment variable ZBX_LISTENPORT. You can omit the port in variable ZBX_HANODENAME, as the ZBX_LISTENPORT (default is 10051) will be applied automatically.

Here is the docker run example for the Zabbix-server HA mode.

docker run --name zabbix-server-mysql-ha1 -t \
-e DB_SERVER_HOST="mysql-server" \
-e MYSQL_DATABASE="zabbix" \
-e MYSQL_USER="zabbix" \
-e MYSQL_PASSWORD="zabbix_pwd" \
-e MYSQL_ROOT_PASSWORD="root_pwd" \
-e ZBX_HANODENAME="zabbix-server-HA1" \
-e ZBX_NODEADDRESS="zabbix-server-mysql-ha1" \
--network=zabbix-net \
-p 10151:10051 \
--restart unless-stopped \
-d zabbix/zabbix-server-mysql:alpine-7.2.4
docker run --name zabbix-server-mysql-ha2 -t \
-e DB_SERVER_HOST="mysql-server" \
-e MYSQL_DATABASE="zabbix" \
-e MYSQL_USER="zabbix" \
-e MYSQL_PASSWORD="zabbix_pwd" \
-e MYSQL_ROOT_PASSWORD="root_pwd" \
-e ZBX_HANODENAME="zabbix-server-HA2" \
-e ZBX_NODEADDRESS="zabbix-server-mysql-ha2" \
--network=zabbix-net \
-p 10251:10051 \
--restart unless-stopped \
-d zabbix/zabbix-server-mysql:alpine-7.2.4

From the frontend container, remove these two environment variables:

  • ZBX_SERVER_HOST
  • ZBX_SERVER_PORT
docker run --name zabbix-web-nginx-mysql -t \
-e ZBX_SERVER_HOST="zabbix-server-mysql" \
-e ZBX_SERVER_PORT=10051
-e DB_SERVER_HOST="mysql-server" \
-e MYSQL_DATABASE="zabbix" \
-e MYSQL_USER="zabbix" \
-e MYSQL_PASSWORD="zabbix_pwd" \
-e MYSQL_ROOT_PASSWORD="root_pwd" \
--network=zabbix-net \
-p 80:8080 \
--restart unless-stopped \
-d zabbix/zabbix-web-nginx-mysql:alpine-7.2.4

Once both container configurations are modified, you should be able to see the currently added HA server nodes and their states without issues.

Fig. 1. Containers of HA Zabbix server containers

Fig. 2. Dashboard – system information

You can also execute commands on the container:

# docker exec -it container_name_or_id sh -c "zabbix_server -R ha_status"

Fig. 3. Executing command on container

Containers of HA Zabbix server containers

I’t’s possible to allocate an interactive pseudo-TTY shell, by adding option -ti and specifying shell after the container name or id.

# docker exec -ti container_name_or_id /bin/bash

Fig. 4. Executing command from within container

You can also start multiple proxies at once in docker. This can help to offload preprocessing to the proxy, gather data from the targets behind the firewall, and send collected data back to the Zabbix server, only requiring one port.

Fig. 5.Overall block diagram of Zabbix monitoring opportunities

Deploying multiple Zabbix proxies

First, you must choose the proxy mode and set the environment variable ZBX_PROXYMODE.

For active mode proxy, please define the server host address for a single server or addresses separated by a semicolon in the case of HA Zabbix server configuration (example shown below).

docker run --name zabbix-proxy-active-01 \
-e ZBX_HOSTNAME="Zabbix-proxy-active-01" \
-e ZBX_SERVER_HOST="zabbix-server-mysql-ha1;zabbix-server-mysql-ha2;zabbix-server-mysql-ha3" \
-e ZBX_PROXYMODE="0" \
--network=zabbix-net \
-e ZBX_LISTENPORT=10101  \
-p 10101:10101 \
-v /var/lib/zabbix/db_data:/var/lib/zabbix/db_data \
--restart unless-stopped \
--init -d zabbix/zabbix-proxy-sqlite3:alpine-7.2.4

For passive mode proxy, define the server host address for a single server or addresses separated by a comma in the case of HA Zabbix server configuration (example shown below).

docker run --name zabbix-proxy-passive-01 \
-e ZBX_HOSTNAME="Zabbix-proxy-passive-01" \
-e ZBX_SERVER_HOST="zabbix-server-mysql-ha1,zabbix-server-mysql-ha2,zabbix-server-mysql-ha3" \
-e ZBX_PROXYMODE="1" \
--network=zabbix-net \
-e ZBX_LISTENPORT=10102 \
-p 10102:10102 \
-v /var/lib/zabbix/db_data:/var/lib/zabbix/db_data \
--restart unless-stopped \
--init -d zabbix/zabbix-proxy-sqlite3:alpine-7.2.4

docker_compose_v3_proxies.yaml

services:
  zabbix-proxy-active-01:
    image: "${PROXY_SQLITE3_IMAGE}:${ALPINE_IMAGE_TAG}"
    environment:
      ZBX_HOSTNAME: zabbix-proxy-active-01
      ZBX_SERVER_HOST: zabbix-server-mysql-ha1;zabbix-server-mysql-ha2;zabbix-server-mysql-ha3
      ZBX_PROXYMODE: 0
      ZBX_LISTENPORT: 10101
    volumes:
      - /var/lib/zabbix/db_data:/var/lib/zabbix/db_data:rw
    networks:
      - backend
    ports:
      - 10101:10101
    restart: unless-stopped

  zabbix-proxy-passive-01:
    image: "${PROXY_SQLITE3_IMAGE}:${ALPINE_IMAGE_TAG}"
    environment:
      ZBX_HOSTNAME: zabbix-proxy-passive-01
      ZBX_SERVER_HOST: zabbix-server-mysql-ha1,zabbix-server-mysql-ha2,zabbix-server-mysql-ha3
      ZBX_PROXYMODE: 1
      ZBX_LISTENPORT: 10102
    volumes:
      - /var/lib/zabbix/db_data:/var/lib/zabbix/db_data:rw
    networks:
      - backend
    ports:
      - 10102:10102
    restart: unless-stopped
networks:
  backend:
    name: zabbix-net
    external: true

.env

PROXY_SQLITE3_IMAGE=zabbix/zabbix-proxy-sqlite3
JAVA_GW_IMAGE = zabbix/zabbix-java-gateway
ALPINE_IMAGE_TAG=alpine-7.2.4
ZBX_SERVER_HOST=46.101.140.98

The proxy name in the frontend must be the same as the value set in proxy environment variable ZBX_HOSTNAME! Also, in frontend for active proxies, you don’t need to add the proxy address.

Next, you can set hosts to be monitored by Zabbix-proxies, but make sure to update the agent configuration, so agents accept connections from proxy.

Fig. 6. Hosts monitored by proxy

Fig. 7.List of proxies and hosts monitored by them

Configuring Proxy groups

You can create as many proxy containers as necessary in Docker, and you can also create proxy groups for load balancing (it is based on the number of hosts per proxy).

First, create a proxy group in the frontend:

  • Set proxy group name
  • Select failover period
  • Minimum number of proxies

Fig. 8.Creating a new proxy group

Next, add proxies to the proxy group, and specify the address for active agents and port for the active agents.

Fig. 9. Adding proxy to proxy group

Do not forget to change Zabbix agent configuration for hosts now monitored through the proxy group (add proxy groups IPs/DNS to Server and ServerActive options).

Fig. 10. Creating a new host and monitoring it through proxy group

You can see additional information regarding the proxies in the Frontend section: Administration/ Proxies.

Fig. 11. List of all configured proxies and those belonging to proxy group

Adding more Java gateways

Zabbix server or proxy can communicate with only one Zabbix java gateway, however, you are not limited tin how many Zabbix proxies you create together with Zabbix Java Gateway. You can make an unlimited number of pairs, consisting of Zabbix proxy with Zabbix Java Gateway.

For the containerized Zabbix server, you will need to add these 4 environment variables:

ZBX_JAVAGATEWAY_ENABLE=true
ZBX_JAVAGATEWAY=zabbix-java-gateway-server
ZBX_JAVAGATEWAYPORT=10052
ZBX_STARTJAVAPOLLERS=5

And start the Java gateway for the zabbix-server in docker:

docker run --name zabbix-java-gateway-server -t \
--network=zabbix-net \
--restart unless-stopped \
-d zabbix/zabbix-java-gateway:alpine-7.2.4

Or if you want to add java gateway to the Zabbix proxy, then add these 4 environment variables to Zabbix proxy in docker:

ZBX_JAVAGATEWAY_ENABLE=true
ZBX_JAVAGATEWAY=zabbix-java-gateway-proxy
ZBX_JAVAGATEWAYPORT=10052
ZBX_STARTJAVAPOLLERS=5

And start the java gateway as a container:

docker run --name zabbix-java-gateway-proxy -t \
--network=zabbix-net \
--restart unless-stopped \
-d zabbix/zabbix-java-gateway:alpine-7.2.4

And here we have a host, monitored by zabbix-agent2 through zabbix-proxy-active-02

Fig. 12. Host monitored by proxy with configured Java gateway

Upgrading docker proxies with SQLite3 database

If you have older Zabbix components already running in docker and you have upgraded the server, you will also need to upgrade the proxies.

If you have a container created from the proxy zabbix-proxy-sqlite3 image and want to upgrade it, you will lose the existing data stored in the SQLite3 database. For most users, the database functions as a buffer to temporarily keep the data until it’s sent to Zabbix server and the loss of the proxy database file data is of no consequence.

Once you have updated the image for the container, the proxy will detect the existing old database version on startup. If the directory is mounted to database file, it will delete the database file and create a new one. This will impact those who keep data after sending it to Zabbix server and use the data from the proxy database for other purposes.

Fig. 13. Database upgrade for proxy container with SQLite3 database

Upgrading docker proxies with MySQL database

To upgrade the MySQL database for proxy, log in in the MySQL database, set the log_bin_trust_function_creators flag to 1. Change the proxy image version to a newer one and start the container.

mysql> set global log_bin_trust_function_creators = 1;

If you have not set the flag, you will receive an error of database upgrade.

Fig. 14. Failed database upgrade for proxy with MySQL database

Replace the previous version of the proxy image with the new one, check the log file, and check the docker logs to see when the database schema upgrade has finished. After the upgrade, set the flag back to 0.

mysql> set global log_bin_trust_function_creators = 0;

The upgrade has been successful, and the proxy service has started after that.

Fig. 15. Successful database upgrade for proxy with MySQL database

An official docker image for the proxy with Postgresql database support is not available due to the extensive number of existing images and different versions.

Deploying multiple frontends

You can launch as many frontends as you need if you are experiencing a sudden surge in Zabbix users. Just specify which port to assign for it and you are good to go (don’t forget to also open the port in the firewall).

docker run --name zabbix-web-nginx-mysql1 -t \
-e DB_SERVER_HOST="mysql-server" \
-e MYSQL_DATABASE="zabbix" \
-e MYSQL_USER="zabbix" \
-e MYSQL_PASSWORD="zabbix_pwd" \
-e MYSQL_ROOT_PASSWORD="root_pwd" \
--network=zabbix-net \
-p 80:8080 \
--restart unless-stopped \
-d zabbix/zabbix-web-nginx-mysql:alpine-7.2.4

Fig. 16. One started Zabbix frontend container in docker

docker run --name zabbix-web-nginx-mysql2 -t \
-e DB_SERVER_HOST="mysql-server" \
-e MYSQL_DATABASE="zabbix" \
-e MYSQL_USER="zabbix" \
-e MYSQL_PASSWORD="zabbix_pwd" \
-e MYSQL_ROOT_PASSWORD="root_pwd" \
--network=zabbix-net \
-p 81:8080 \
--restart unless-stopped \
-d zabbix/zabbix-web-nginx-mysql:alpine-7.2.4

Fig. 17. Two started Zabbix frontend containers in docker

docker run --name zabbix-web-nginx-mysql3 -t \
-e DB_SERVER_HOST="mysql-server" \
-e MYSQL_DATABASE="zabbix" \
-e MYSQL_USER="zabbix" \
-e MYSQL_PASSWORD="zabbix_pwd" \
-e MYSQL_ROOT_PASSWORD="root_pwd" \
--network=zabbix-net \
-p 82:8080 \
--restart unless-stopped \
-d zabbix/zabbix-web-nginx-mysql:alpine-7.2.4

Fig. 18. Three started Zabbix frontend containers in docker

Fig. 19. Multiple frontends accessed through different ports

Browser monitoring

Browser monitoring setup has never been easier! Just add two parameters to zabbix-server container config:

ZBX_WEBDRIVERURL=selenium:4444
ZBX_STARTBROWSERPOLLERS=2

And start the web driver in the docker (with a standalone chrome browser):

docker run --name selenium -t\
--network=zabbix-net \
--restart unless-stopped \
-p 4444:4444 \
--shm-size="1g" \
-d selenium/standalone-chrome:latest

Next step: create a new host, add the template, specify which page to monitor with Macro values, and it’s DONE!!!!

Fig. 20. Creating host for monitoring website

Fig. 21. Screenshot of the monitored website

SNMP traps

For the snmptraps to work, the same directory must be shared among the zabbix-server and zabbix-snmptrap container. On the Zabbix-server side, you need to explicitly set snmp environment variable ZBX_ENABLE_SNMP_TRAPS to true and mount directory /var/lib/zabbix/snmptraps.

You also need to add the same volume to the snmptrap container.

And run the snmptraps container (make sure there is no permission issue for the directory)

docker run --name zabbix-snmptraps -t \
-v /var/lib/zabbix/snmptraps:/var/lib/zabbix/snmptraps:rw \
--network=zabbix-net \
-p 162:1162/udp \
--restart unless-stopped \
-d zabbix/zabbix-snmptraps:alpine-7.2-latest

Fig. 22. Received SNMP trap message

Scheduled reports

You can also easily configure scheduled reports by adding 2 additional environment variables to the Zabbix-server. In my case, both of these containers are in the same custom user network, therefore I will use the container name zabbix-web-service in the ZBX_WEBSERVICEURL option.

ZBX_STARTREPORTWRITERS=5
ZBX_WEBSERVICEURL=http://zabbix-web-service:10053/report

Start the Zabbix-web service, specify also these 2 parameters (you can skip those if defaults are used). You can also allow any incoming connections by setting ZBX_ALLOWEDIP=0.0.0.0/0. We discourage this, however.

ZBX_ALLOWEDIP=zabbix-server-mysql
ZBX_LISTENPORT=10053

Before testing scheduled reports, make sure you have enabled and configured the email media type.

Fig. 23. Configured and enabled media type

It is also encouraged to test it and check that you have received the test email.

Fig. 24. Successful media type test response

Fig. 25. Received test response on the selected media type.

Next, configure the user media where the scheduled report will be sent.

Fig. 26.Media type defined for the user

Last, but not least, set the frontend URL in the section Administration/General/Other section. In my case, I set the container name of the frontend and specify the port.

for Apache: http://<server_ip_or_name>/zabbix
for Nginx: http://<server_ip_or_name>

Fig. 27. Configured frontend address for the Frontend URL option

Next, create a scheduled report based on the dashboard of your choice.

Fig. 28.Configuring scheduled report

Check that you have received the test report in your mail.

Fig. 29.Successful scheduled report test.

Fig. 30. Received scheduled report test in the email

Now you know how to set up scheduled reports!

Docker container monitoring

You can also monitor Docker containers with a containerized Zabbix instance*

* Disclaimer: If docker service is not running, Zabbix monitoring will also not function and you will not receive notifications and alerts.

You can also monitor your docker instance with the Zabbix agent 2, however, you will be required to install Zabbix-agent 2 on the host either as a package or build it from the source.

You will also need to give user zabbix access to the docker.sock file. Just add user zabbix to group docker:

# usermod -aG docker zabbix

Otherwise, you will get an error message in items:

Cannot fetch data: Get "http://1.28/info": dial unix /var/run/docker.sock: connect: permission denied.

Go back to the frontend and create a Host for monitoring the docker containers:

  • Link template: Docker by Zabbix agent 2
  • Add host to host group
  • Specify host address or dns name, set the correct connect to option, and specify the agent port (if a default port is used, then set 10050).

Fig. 31. Configuring the host for monitoring the docker container

Now, if some issue happens to other containers, Zabbix will monitor them. But to be notified of an issue, don’t forget to enable and configure the media, user media, media templates, and trigger actions, so that you receive alerts.

Fig. 32.Latest data for the docker host

Thank you for reading – I hope you’ve found this article helpful and informative!


The post Deploying Zabbix Components with Docker and Docker Compose appeared first on Zabbix Blog.

Arguing Against CALEA

Post Syndicated from Bruce Schneier original https://www.schneier.com/blog/archives/2025/04/arguing-against-calea.html

At a Congressional hearing earlier this week, Matt Blaze made the point that CALEA, the 1994 law that forces telecoms to make phone calls wiretappable, is outdated in today’s threat environment and should be rethought:

In other words, while the legally-mandated CALEA capability requirements have changed little over the last three decades, the infrastructure that must implement and protect it has changed radically. This has greatly expanded the “attack surface” that must be defended to prevent unauthorized wiretaps, especially at scale. The job of the illegal eavesdropper has gotten significantly easier, with many more options and opportunities for them to exploit. Compromising our telecommunications infrastructure is now little different from performing any other kind of computer intrusion or data breach, a well-known and endemic cybersecurity problem. To put it bluntly, something like Salt Typhoon was inevitable, and will likely happen again unless significant changes are made.

This is the access that the Chinese threat actor Salt Typhoon used to spy on Americans:

The Wall Street Journal first reported Friday that a Chinese government hacking group dubbed Salt Typhoon broke into three of the largest U.S. internet providers, including AT&T, Lumen (formerly CenturyLink), and Verizon, to access systems they use for facilitating customer data to law enforcement and governments. The hacks reportedly may have resulted in the “vast collection of internet traffic”; from the telecom and internet giants. CNN and The Washington Post also confirmed the intrusions and that the U.S. government’s investigation is in its early stages.

Диана Димова от „Мисия Криле“: Пролетта започва с една птичка

Post Syndicated from Ина Иванова original https://www.toest.bg/diana-dimova-ot-misia-krile-proletta-zapochva-s-edna-ptichka/

Диана Димова от „Мисия Криле“: Пролетта започва с една птичка

Екипът на Фондация „Мисия Криле“ е на първа линия, когато става въпрос за майки с деца, опитващи се да се спасят от домашно насилие, за хора, изпаднали в крайна бедност, или за големи бежански вълни, като тези от Сирия, Афганистан и Украйна. Екипът е почти неизменен от основаването на фондацията през 2018 г. 

Председателка на организацията, чието седалище е в Стара Загора, е Диана Димова – отдадена социална работничка, майка и жена с кауза, която говори ясно, тихо и задълбочено по трудните теми.

За нея всичко започва преди 27 години, когато в родната ѝ Стара Загора се появяват бездомни деца, живеещи в района на гарата. Диана и други млади хора започват да ги хранят. Оттогава започва и дейността ѝ в помощ на хора от уязвими групи. 

Днес част от „Мисия Криле“ е основаният преди 20 години център Комплекс за социални услуги, на който Диана Димова е директорка. Той е оказал подкрепа на над 6000 жени и деца в риск.

В началото на годината представители на екипа на Фондация „Мисия Криле“ се опитаха да спасят бедстващи тийнейджъри, търсещи убежище, но поради бездействието на институциите децата починаха. 

Диана Димова и колегите ѝ създават и Консултативен център в град Харманли – в подкрепа на хора, търсещи и получили убежище в страната. Защото на практика дори онези, които получат хуманитарен или бежански статут, остават в повечето случаи отхвърлени или невидими за обществото. 

В предварителния ни разговор Диана Димова сподели с мен, че често намира утеха в книгата „Джонатан Ливингстън Чайката“. Героят на Ричард Бах е изхвърлен от ятото си за това, че се рее, вместо да изпълнява обичайните за чайка задължения. Наказан е да остане в изгнание на един остров. Там освен небесните ширини, сред които продължава да лети, Чайката намира съмишленици. И разбира, че грешката не е у него.

Най-впечатляващ обаче е завършекът на романа – Джонатан Ливингстън осъзнава, че трябва да се върне, че мисията му всъщност е да бъде там, сред враждебното ято, където е бил най-неразбран. Диана продължава да размишлява върху това: 

Да се опитваш да кажеш своите послания и да променяш твоята общност. Това е най-голямото предизвикателство на живота ми. Мисля, че ако живеем само за себе си, нищо не сме постигнали. Всеки трябва през своята къщурка да прави опити да стане светът по-добър, а може, всеки един от нас може.


Каква мечтаехте да станете, когато бяхте дете?

Като голяма част от момичетата на моята възраст си мечтаех да работя с деца, да помагам на деца. И понеже нямаше кой знае колко разнообразни професии тогава, единственият основен модел, който виждахме, беше детската учителка. Това присъстваше не само в мечтите, а и в игрите от моето детство. Ако сравним игрите, които играят децата днес, и игрите, които предпочитахме ние като деца, ще открием големи разлики. Защото малките играят моделите, които са възприели, личи кои са моделите за подражание и какви са ценностите на възрастните около тях.

За съжаление, много от образите, които ние имахме като деца, тези ореоли, които поставяхме на някои професии или на определени личности, се развенчаха с времето и от перспективата на съвремието. Ако се върна назад, виждам колко много неща, в които аз съм вярвала или които съм боготворяла, се оказаха фалшиви идоли и маски.

Това е голямата тема: какво играят децата ни и в какво вярват, какви са ценностите за тях. И тя се отнася и до нас – обяснява какви игри играят възрастните хора днес, кои са техните модели на подражание и как това се превръща в стил на живот.

От години работите с деца в бежански центрове. На какво играят те?

Като социален работник, като човек, който работи на първа линия с деца и възрастни, които преживяват или са преживели различни страдания, ми прави впечатление, че са забравили да мечтаят. 

Може да играе дете, което има мечти – без да имаш перспектива и фантазии за едно илюзорно или по-красиво, по-щастливо бъдеще, няма как. 

Децата в бежанските центрове трудно могат да символизират в игра своите представи за по-добър живот. Те често използват демонстрацията на сила, на власт над другия, над връстника, който може да се окаже заплаха, и се чувстват длъжни да му демонстрират своите граници, норми и правила. Ние организираме спортни събития, отваряме чрез спорта пространство за деца бежанци, за да могат да изразяват емоциите си. Те мислят, че ние играем с тях, но всъщност се опитваме да им помогнем да се лекуват. 

В нашия екип на „Мисия Криле“ имаме двама колеги треньори от Сирия, които работят много активно с деца бежанци чрез спорт, фитнес и футбол.

Прави ми впечатление на състезания колко силно удрят топката тийнейджърите, колко много имат да изразят от себе си и същевременно колко малко пространство имат за това. 

В арт ателиетата децата използват по-ярки цветове, понякога натискат силно, до степен да скъсат листа, което говори за това, което преживяват. 

В света, в който живеем, като че ли няма място да изразяваме емоции. И още нещо – има голяма пропаст между нас, възрастните, и съвременните деца. Грешка е да правим автоматични препратки към нашето детство, защото то е коренно различно от тяхното. Независимо дали сме психолози, социални работници, независимо дали работим с български, ромски деца, деца бежанци, е огромно предизвикателство да сме любопитни към тях и да се опитаме да разберем техния свят, а не да ги назидаваме какви трябва да бъдат през перспективата на живота, който ние сме имали. Най-полезни са ми били моментите, когато съм ги изслушвала, за да намеря пътя заедно с тях, когато те ми позволят да ги придружа за известен период, докато намерим посоката, тъй като те се лутат.

Какво научихте за себе си от битките, които водите за другите?

Много – и за себе си, и за близкия ми кръг, и за враговете си. Колко издръжливост има в мен. Понякога в ситуация, в която мисля, че ще се разпадна на парчета, разбирам, че всъщност съм на средата на пътя. Трудните моменти ни показват, че не сме толкова безпомощни, беззащитни и слаби, а че имаме повече сила, отколкото дори предполагаме. 

Може би една птичка не може да направи пролет, но пролетта може да започва с една птичка и капката може да разбие скалата с постоянство. Вярвам, че човек може да преобърне света. Вярвам, че войната може да спре с решението на един човек. Колкото и клиширано да звучи, смятам, че злото не може да трае вечно, колкото и всемогъщо да изглежда.

Кое Ви окрилява и кое Ви обезсърчава?

Аз все по активно търся неща, които да ме вдъхновят, които да ме очароват, които да ми върнат усещането за смисъл, мотивация. В последните години силно вдъхновение получавам, когато правим различни общностни събития, където има хора от различни култури – да готвят, танцуват или спортуват заедно. Изпитвам силно вълнение, защото много вярвам в идеята за многообразието. Смятам, че то е богатство и ако сме по-отворени едни към други, можем да почерпим от чуждия опит, от човека с различна вяра, ако щете, или на различна възраст. Всичко, което се иска от нас, е просто да сме любопитни и отворени към различния. 

Бих добавила още едно нещо, което много ми помага. Аз силно вярвам в християнските добродетели. И търся да се съюзявам със съмишленици, вместо да губя енергия да воювам с великани.

Огорчава ме едно огромно неразбиране, което все повече се засилва като усещане в мен – че онова, което правя, не просто е неразбираемо, не просто е неприемливо. А е недопустимо. Посланията, които чувам от различни кръгове по различен начин, мненията, които достигат до мен, когато говоря за моите каузи, са, че това, което правя, може да е заплаха за обществото или за националната сигурност, че съм национален предател. Това са неща, които мен лично ме изненадаха, защото не подозирах, че има хора, които могат да възприемат по-слабите като заплаха, независимо дали става въпрос за жена – жертва на насилие, дали за изоставено от родителите си дете, за бежанци, или за роми. 

От какво се страхуваме като общество и счупва ли се митът за българското гостоприемство, когато говорим за бежанци?

Тук е еднакво отношението към чужд човек, който е влязъл на територията на страната да търси убежище, или към човек от изолиран ромски квартал, който не го е напускал от 12 години и се страхува да слезе до центъра на големия град.

Има голяма съпротива от различни групи, мога само да подозирам какъв е техният мотив и откъде се захранват с такива идеи. Някои имат икономически интереси. Втори живеят в конспиративни теории, включително в ригиден, закостенял свят, в който другият е заплаха и приемането му може да означава загуба на собствената идентичност. Така че от тази гледна точка разбирам тяхното поведение, но не го оправдавам – защото в света, в който живеем, когато се даде пространство на този тип мислене и говорене, то може да взриви буквално цялата планета. 

Отдавна ме вълнува тази тема. Не съм намерила пътя как да се справя с това разочарование. И като мине малко време и си почина, си казвам: всъщност това е, за което живея. Нямам друг път и друг живот. Това е моята мисия. Да помагам на слабите и невидимите да бъдат тук и сега и мнозинството да се съобрази с тях, да ги приеме като равни. Да защитавам правата на слабите и да се боря за тяхното благополучие. Най-общо казано, това е човечността. Нищо повече. 

Да се върнем на темата за страха?

Истински смелите хора са се научили да яздят страха си, да го контролират, за да го насочат в една или друга посока. Страхът е като диво животно и научиш ли се да го яздиш, той може да ти свърши добра работа, да те предпазва от неблагополучия. За мен хората, които успяват да не се парализират от страх, съумяват да кажат какво мислят, а това става все по-трудно във времето, в което живеем. Особено в интернет. Виждаме как са тормозени хора заради липсата на истинска свобода на словото. В последните месеци разбрах, че държавни агенции към Министерския съвет се използват активно като бухалки срещу активисти и хора, които огласяват престъпления. Не бива да има област от обществения живот, в която гражданите да се страхуват да зададат въпрос. 

Аз задавам въпроси в една много трудна област и разказвам истории, които са достигнали до мен през хората, на които помагам, именно мигранти и бежанци, търсещи убежище и закрила – за това какво се случва по границите и в болниците.

И аз, и моите колеги се опитваме да усилваме на гласа на онези, които нямат такъв или чийто глас е много тих, макар за нас лично да става все по-трудно и рисковано да го правим. 

Вярвам в равнопоставеността, в справедливостта и ще се боря за това, докато имам сили. 

По-силният внушава много убедително, че е всемогъщ и държи всички лостове да се саморазправи с теб, но много често не е така. И когато си мислим, че сме сами, не е така. Вярвайте ми, злото просто не може да трае вечно. Не е възможно.

Какво винаги носи в чантата си Диана Димова?

Първо, аз непрекъснато сменям различни торби, раници и обикновено все съм забравила нещо в някоя друга чанта. Но все пак с мен винаги е лаптопът, защото много често пътувам и имам важни неща, които е ключово да се случат. Което означава, че непрекъснато съм в работен режим. Често нося хапчета за главоболие. В портмонето ми винаги е снимката на моя син и тя ми е много скъпа. Той е далеч от мен, замина да работи в Брюксел след една менторска програма преди година и половина. Не разбирах хората, които пътуват и се разделят, но и на мен ми се случи. Така че най-близкият до сърцето ми човек е символично с мен с тази снимка.

Дигитално евро, следене и ценности

Post Syndicated from Bozho original https://blog.bozho.net/blog/4473

Тъй като конспиративните теории за еврото от няколко дни са „на стероиди“, ето една контра-конспиративна теория. За тези, които не приемат аргументите, че дигиталното евро няма да се ползва за проследяване, тъй като в самия регламент има изрични текстове за анонимност на офлайн плащанията и липса на централна проследимост на трансакциите.

Ами ако „лошият ЕС“ реши да следи кеша? Всяка банкнота има индивидуален номер. Т.е. всяка банкнота е проследима. Банкоматът ще знае на кого са отпуснати дадени банкноти. В магазина могат много лесно тези номера да се сканират и така да се следи потокът им. На касите може да се въведе задължително показване на лична карта, така че дори рестото да е ясно при кого отива.

Или дори лицево разпознаване, вързано с базата данни със снимки на МВР. И може НАП да затваря магазини, които не изпълняват тези исиквания. (А, чакай, лошият ЕС на практика забрани лицевото разпознаване на обществени места, но сигурно това е заблуждаваща маневра)

Затова – никакъв кеш. Ще ни следят с него какво купуваме. Не веднага, но един ден… Така че само в злато. Хм, те пък и кюлчетата си имат серийни номера. Значи бартери.

Между другото, следят ви и в момента какво купувате. Дори като плащате с наложен платеж. И дори когато не сте го купили онлайн, а само сте си хо харесали. (Благодарение на проследяващите бисквитки, за които бъдещият председател на КЗЛД нищо не знаеше)

Само че не ви следи лошият ЕС, а Гугъл и Фейсбук, които лошият ЕС глобява заради неправомерно обработване на лични данни.

Следят ви и къде ходите. През GPS-a и през клетките на телефоните. Благодарение на ЕС можете да забраните да се записват данните от GPS-a централно. А благодарение на съда на ЕС, държавите трябва да ограничат телекомите в събиране на данни за местоположение доста под 6 месеца, именно за да не може да се анализира поведение.

Не е въпрос на технологии. Не е въпрос да измислим конспиративна теория как някой централно ще ни следи – има стотици начини за това и без дигитално евро. Въпрос на ценности е. А ценностите на европейските народи не допускат тоталитаризъм. Защото са го допускали в миналото и са видели какво следва. И това стои в колективната ни памет (защото и ние сме европейци).

Материалът Дигитално евро, следене и ценности е публикуван за пръв път на БЛОГодаря.

Enhance Agentforce data security with Private Connect for Salesforce Data Cloud and Amazon Redshift – Part 3

Post Syndicated from Yogesh Dhimate original https://aws.amazon.com/blogs/big-data/enhance-agentforce-data-security-with-private-connect-for-salesforce-data-cloud-and-amazon-redshift-part-3/

Data protection is a high priority, particularly as organizations face increasing cybersecurity threats. Maintaining the security of customer data is top priority for AWS and Salesforce. With AWS PrivateLink, Salesforce Private Connect eliminates common security risks associated with public endpoints. Salesforce Private Connect now works with Salesforce Data Cloud to keep your customer data secure when using with key services like Agentforce.

In Part 2 of this series, we discussed the architecture and implementation details of cross-Region data sharing between Salesforce Data Cloud and AWS accounts. In this post, we discuss how to create AWS endpoint services to improve data security with Private Connect for Salesforce Data Cloud.

Solution overview

In this example, we configure PrivateLink for an Amazon Redshift instance to enable direct, private connectivity from Salesforce Data Cloud. AWS recommends that organizations use an Amazon Redshift managed VPC endpoint (powered by PrivateLink) to privately access a Redshift cluster or serverless workgroup. For details about best practices, refer to Enable private access to Amazon Redshift from your client applications in another VPC.

However, some organizations might prefer to use PrivateLink managed by themselves—for example, a Redshift managed VPC endpoint is not yet available in Salesforce Data Cloud, and you need to manage your PrivateLink connection. This post focuses on the solution to configure self-managed PrivateLink between Salesforce Data Cloud and Amazon Redshift in your AWS account to establish private connectivity.

The following architecture diagram shows the steps for setting up private connectivity between Salesforce Data Cloud and Amazon Redshift in your AWS account.

To set up private connectivity between Salesforce Data Cloud and Amazon Redshift, we use the following resources:

Prerequisites

To complete the steps in this post, you must already have Amazon Redshift running in a private subnet and have the permissions to manage it.

Create a security group for the Network Load Balancer

The security group acts as a virtual firewall. The only traffic that reaches the instance is the traffic allowed by the security group rules. To enhance the security posture, you only want to allow traffic to Redshift instances. Complete the following steps to create a security group for your Network Load Balancer (NLB):

  1. On the Amazon VPC console, choose Security groups in the navigation pane.
  2. Choose Create security group.
  3. Enter a name and description for the security group.
  4. For VPC, use the same virtual private cloud (VPC) as your Redshift cluster.
  5. For Inbound rules, add a rule to allow traffic to ingress the listening port 5439 on the load balancer.

  1. For Outbound rules, add a rule to allow traffic to your Redshift instance.

  1. Choose Create security group.

Create a target group

Complete the following steps to create a target group:

  1. On the Amazon EC2 console, under Load balancing in the navigation pane, choose Target groups.
  2. Choose Create target group.
  3. For Choose a target type, select IP addresses.

  1. For Protocol: Port, choose TCP and port 5436 (if your Redshift cluster runs on a different port, change the port accordingly).
  2. For IP address type, select IPv4.
  3. For VPC, choose the same VPC as your Redshift cluster.
  4. Choose Next.

  1. For Enter an IPv4 address from a VPC subnet, enter your Amazon Redshift IP address.

To locate this address, navigate to your cluster details on the Amazon Redshift console, choose the Properties tab, and under Network and security settings, expand VPC endpoint connection details and copy the private address of the network interface. If you’re using Amazon Redshift Serverless, navigate to the workgroup home page. The Amazon Redshift IPv4 addresses can be located in the Network and security section under Data access when you choose VPC endpoint ID.

  1. After you add the IP address, choose Include as pending below, then choose Create target group.

Create a load balancer

Complete the following steps to create a load balancer:

  1. On the Amazon EC2 console, choose Load balancers in the navigation pane.
  2. Choose Create load balancer.
  3. Choose Network.
  4. For Load balancer name, enter a name.
  5. For Scheme, select Internal.
  6. For Load balancer address type, select IPv4.
  7. For VPC, use the VPC that your target group is in.

  1. For Availably Zones, select the Availability Zone where the Redshift cluster is running.
  2. For Security groups, choose the security group you created in the previous step.
  3. For Listener details, add a listener that points to the target group created in the last step:
    1. For Protocol, choose TCP.
    2. For Port, use 5439.
    3. For Default action, choose Redshift-TargetGroup.
  4. Choose Create load balancer.

Make sure that the registered targets in the target group are healthy before proceeding. Also make sure that the target group has a target for all Availability Zones in your AWS Region or the NLB has the Cross-zone load balancing attribute enabled.

In the load balancer’s security setting, make sure that Enforce inbound rules on PrivateLink traffic is off.

Create an endpoint service

Complete the following steps to create an endpoint service:

  1. On the Amazon VPC console, choose Endpoint services in the navigation pane.
  2. Choose Create endpoint service.
  3. For Load balancer type, choose Network.
  4. For Available load balancers, select the load balancer you created in the last step
  5. From Supported Regions, select an additional region if Data Cloud isn’t hosted in the same AWS region as the Redshift instance.  For additional settings leave Acceptance required.

If this is selected, later, when the Salesforce Data Cloud endpoint is created to connect to the endpoint service, you will need to come back to this page to accept the connection. If not selected, the connection will be built directly.

  1. For Supported IP address type, select IPv4.
  2. Choose Create.

Next, you need to allow Salesforce principals.

  1. After you create the endpoint service, choose Allow principals.
  2. In another browser, navigate to Salesforce Data Cloud Setup.
  3. Under External Integrations, access the new Private Connect menu item.
  4. Create a new private network route to Amazon Redshift.

  1. Copy the principal ID.

  1. Return to the endpoint service creation page.
  2. For Principals to add, enter the principal ID.
  3. Copy the endpoint service name.
  4. Choose Allow principals.

  1. Return to the Salesforce Data Cloud private network configuration page.
  2. For Route Name, enter the endpoint service name.
  3. Choose Save.

The route status should show as Allocating.

If you opted to accept connections in the previous step, you will now need to accept the connection from Salesforce Data Cloud.

  1. On the Amazon VPC console, navigate to the endpoint service.
  2. On the Endpoint connections tab, locate your pending connection request.

  1. Accept the endpoint connection request from Salesforce Data Cloud.

Navigate to the Salesforce Data Cloud setup and wait 30 seconds, then refresh the private connect route so the status shows as Ready.

You can now use this route when creating a connection with Amazon Redshift. For additional details, refer to Part 1 of this series.

Amazon Redshift federation PrivateLink failover

Now that we have discussed how to configure PrivateLink to use with Private Connect for Salesforce Data Cloud, let’s discuss Amazon Redshift federation PrivateLink failover scenarios.

You can choose to deploy your Redshift clusters in three different deployment modes:

  • Amazon Redshift provisioned in a Single-AZ RA3 cluster
  • Amazon Redshift provisioned in a Multi-AZ RA3 cluster
  • Amazon Redshift Serverless

PrivateLink relies on a customer managed NLB connected to service endpoints using IP address target groups. The target group has the IP addresses of your Redshift instance. If there is a change in IP address targets, the NLB target group must be updated to the new IP addresses associated with the service. Failover behavior for Amazon Redshift will differ based on the deployment mode you employ.

This section describes PrivateLink failover scenarios for these three deployment modes.

Amazon Redshift provisioned in a Single-AZ RA3 cluster

RA3 nodes support provisioned cluster VPC endpoints, which decouple the backend infrastructure from the cluster endpoint used for access. When you create or restore an RA3 cluster, Amazon Redshift uses a port within the ranges of 5431–5455 or 8191–8215. When the cluster is set to a port in one of these ranges, Amazon Redshift automatically creates a VPC endpoint in your AWS account for the cluster and attaches network interfaces with a private IP for each Availability Zone in the cluster. For the PrivateLink configuration, you use the IP associated with the VPC endpoint as the target for the frontend NLB. You can identify the IP address of the VPC endpoint on the Amazon Redshift console or by doing a describe-clusters query on the Redshift cluster.

Amazon Redshift will not remove a network interface associated with a VPC endpoint unless you add an additional subnet to an existing Availability Zone or remove a subnet using Amazon Redshift APIs. We recommend that you don’t add multiple subnets to an Availability Zone to avoid disruption. There might be failover scenarios where additional network interfaces are added to a VPC endpoint.

In RA3 clusters, the nodes are automatically recovered and replaced as needed by Amazon Redshift. The cluster’s VPC endpoint will not change even if the leader node is replaced.

Cluster relocation is an optional feature that allows Amazon Redshift to move a cluster to another Availability Zone without any loss of data or changes to your applications. When cluster relocation is turned on, Amazon Redshift might choose to relocate clusters in some situations. In particular, this happens where issues in the current Availability Zone prevent optimal cluster operation or to improve service availability. You can also invoke the relocation function in cases where resource constraints in a given Availability Zone are disrupting cluster operations. When a Redshift cluster is relocated to a new Availability Zone, the new cluster has the same VPC endpoint but a new network interface is added in the new Availability Zone. The new private address should be added to the NLB’s target group to optimize availability and performance.

In the case that a cluster has failed and can’t be recovered automatically, you have to initiate a restore of the cluster from a previous snapshot. This action generates a new cluster with a new DNS name, connection string, and VPC endpoint and IP address for the cluster. You have to update the NLB with the new IP for the VPC endpoint of the new cluster.

Amazon Redshift provisioned in a Multi-AZ RA3 cluster

Amazon Redshift supports Multi-AZ deployments for provisioned RA3 clusters. By using Multi-AZ deployments, your Redshift data warehouse can continue operating in failure scenarios when an unexpected event happens in an Availability Zone. A Multi-AZ deployment deploys compute resources in two Availability Zones, and these compute resources can be accessed through a single endpoint. In the case of a failure of the primary nodes, Multi-AZ clusters will make secondary nodes primary and deploy a new secondary stack in another Availability Zone. The following diagram illustrates this architecture.

Multi-AZ clusters deploy VPC endpoints that point to network interfaces in two Availability Zones, which should be configured as a part of the NLB target group. To configure the VPC endpoints in the NLB target group, you can identify the IP addresses of the VPC endpoint using the Amazon Redshift console or by doing a describe-clusters query on the Redshift cluster. In a failover scenario, VPC endpoint IPs will not change and the NLB doesn’t require an update.

Amazon Redshift will not remove a network interface associated with a VPC endpoint unless you add an additional subnet in to an existing Availability Zone or remove a subnet using Amazon Redshift APIs. We recommend that you don’t add multiple subnets to an Availability Zone to avoid disruption.

Amazon Redshift Serverless

Redshift Serverless provides managed infrastructure. You can perform the get-workgroup query to get the workgroup’s VpcEndpoint IPs. IPs should be configured in the target group of the PrivateLink NLB. Because this is a managed service, the failover is managed by AWS. During the event of an underlying Availability Zone failure, the workgroup might get a new set of IPs. You can frequently query the workgroup configuration or DNS record for the Redshift cluster to check if IP addresses have changed and update the NLB accordingly.

Automating IP address management

In scenarios where Amazon Redshift operations might change the IP address of the endpoint needed for Amazon Redshift connectivity, you can automate the update of NLB network targets by monitoring the results for cluster DNS resolution, using describe-cluster or get-workgroup queries, and using an AWS Lambda function to update the NLB target group configuration.

You can periodically (on a schedule) query the DNS of the Redshift cluster for IP address resolution. Use a Lambda function to compare and update the IP target groups for the NLB. For an example of this solution, see Hostname-as-Target for Network Load Balancers.

For legacy DS2 clusters where the IP address of the leader node must be explicitly monitored, you can configure Amazon CloudWatch metrics to monitor the HealthStatus of the leader node. You can configure the metric to trigger an alarm, which alerts an Amazon Simple Notification Service (Amazon SNS) topic and invokes a Lambda function to reconcile the NLB target group.

For backup and restore patterns, you can create a rule in Amazon EventBridge triggered on the RestoreFromClusterSnapshot API action, which invokes a Lambda function to update the NLB with the new IP addresses of the cluster.

For a cluster relocation pattern, you can trigger an event based on the Amazon Redshift ModifyCluster availability-zone-relocation API action.

Conclusion

In this post, we discussed how to use AWS endpoint services to improve data security with Private Connect for Salesforce Data Cloud. If you are currently using the Salesforce Data Cloud zero-copy integration with Amazon Redshift, we recommend you follow the steps provided in this post to make the network connection between Salesforce and AWS secure. Reach out to your Salesforce and AWS support teams if you need additional support to implement this solution.


About the authors

Yogesh Dhimate is a Sr. Partner Solutions Architect at AWS, leading technology partnership with Salesforce. Prior to joining AWS, Yogesh worked with leading companies including Salesforce driving their industry solution initiatives. With over 20 years of experience in product management and solutions architecture Yogesh brings unique perspective in cloud computing and artificial intelligence.

Avijit Goswami is a Principal Solutions Architect at AWS specialized in data and analytics. He supports AWS strategic customers in building high-performing, secure, and scalable data lake solutions on AWS using AWS managed services and open source solutions. Outside of his work, Avijit likes to travel, hike, watch sports, and listen to music.

Ife Stewart is a Principal Solutions Architect in the Strategic ISV segment at AWS. She has been engaged with Salesforce Data Cloud over the last 2 years to help build integrated customer experiences across Salesforce and AWS. Ife has over 10 years of experience in technology. She is an advocate for diversity and inclusion in the technology field.

Mike Patterson is a Senior Customer Solutions Manager in the Strategic ISV segment at AWS. He has partnered with Salesforce Data Cloud to align business objectives with innovative AWS solutions to achieve impactful customer experiences. In his spare time, he enjoys spending time with his family, sports, and outdoor activities.

Drew Loika is a Director of Product Management at Salesforce and has spent over 15 years delivering customer value via data platforms and services. When not diving deep with customers on what would help them be more successful, he enjoys the acts of making, growing, and exploring the great outdoors.

The collective thoughts of the interwebz