Post Syndicated from Techmoan original https://www.youtube.com/watch?v=XX_wOOvByPs
Comic for 2025.03.25 – Don’t Come Any Closer
Post Syndicated from Explosm.net original https://explosm.net/comics/dont-come-any-closer
New Cyanide and Happiness Comic
Build multi-Region resilient Apache Kafka applications with identical topic names using Amazon MSK and Amazon MSK Replicator
Post Syndicated from Subham Rakshit original https://aws.amazon.com/blogs/big-data/build-multi-region-resilient-apache-kafka-applications-with-identical-topic-names-using-amazon-msk-and-amazon-msk-replicator/
Resilience has always been a top priority for customers running mission-critical Apache Kafka applications. Amazon Managed Streaming for Apache Kafka (Amazon MSK) is deployed across multiple Availability Zones and provides resilience within an AWS Region. However, mission-critical Kafka deployments require cross-Region resilience to minimize downtime during service impairment in a Region. With Amazon MSK Replicator, you can build multi-Region resilient streaming applications to provide business continuity, share data with partners, aggregate data from multiple clusters for analytics, and serve global clients with reduced latency. This post explains how to use MSK Replicator for cross-cluster data replication and details the failover and failback processes while keeping the same topic name across Regions.
MSK Replicator overview
Amazon MSK offers two cluster types: Provisioned and Serverless. Provisioned cluster supports two broker types: Standard and Express. With the introduction of Amazon MSK Express brokers, you can now deploy MSK clusters that significantly reduce recovery time by up to 90% while delivering consistent performance. Express brokers provide up to 3 times the throughput per broker and scale up to 20 times faster compared to Standard brokers running Kafka. MSK Replicator works with both broker types in Provisioned clusters and along with Serverless clusters.
MSK Replicator supports an identical topic name configuration, enabling seamless topic name retention during both active-active or active-passive replication. This avoids the risk of infinite replication loops commonly associated with third-party or open source replication tools. When deploying an active-passive cluster architecture for regional resilience, where one cluster handles live traffic and the other acts as a standby, an identical topic configuration simplifies the failover process. Applications can transition to the standby cluster without reconfiguration because topic names remain consistent across the source and target clusters.
To set up an active-passive deployment, you have to enable multi-VPC connectivity for the MSK cluster in the primary Region and deploy an MSK Replicator in the secondary Region. The replicator will consume data from the primary Region’s MSK cluster and asynchronously replicate it to the secondary Region. You connect the clients initially to the primary cluster but fail over the clients to the secondary cluster in the case of primary Region impairment. When the primary Region recovers, you deploy a new MSK Replicator to replicate data back from the secondary cluster to the primary. You need to stop the client applications in the secondary Region and restart them in the primary Region.
Because replication with MSK Replicator is asynchronous, there is a possibility of duplicate data in the secondary cluster. During a failover, consumers might reprocess some messages from Kafka topics. To address this, deduplication should occur on the consumer side, such as by using an idempotent downstream system like a database.
In the next sections, we demonstrate how to deploy MSK Replicator in an active-passive architecture with identical topic names. We provide a step-by-step guide for failing over to the secondary Region during a primary Region impairment and failing back when the primary Region recovers. For an active-active setup, refer to Create an active-active setup using MSK Replicator.
Solution overview
In this setup, we deploy a primary MSK Provisioned cluster with Express brokers in the us-east-1 Region. To provide cross-Region resilience for Amazon MSK, we establish a secondary MSK cluster with Express brokers in the us-east-2 Region and replicate topics from the primary MSK cluster to the secondary cluster using MSK Replicator. This configuration provides high resilience within each Region by using Express brokers, and cross-Region resilience is achieved through an active-passive architecture, with replication managed by MSK Replicator.
The following diagram illustrates the solution architecture.

The primary Region MSK cluster handles client requests. In the event of a failure to communicate to MSK cluster due to primary region impairment, you need to fail over the clients to the secondary MSK cluster. The producer writes to the customer topic in the primary MSK cluster, and the consumer with the group ID msk-consumer reads from the same topic. As part of the active-passive setup, we configure MSK Replicator to use identical topic names, making sure that the customer topic remains consistent across both clusters without requiring changes from the clients. The entire setup is deployed within a single AWS account.
In the next sections, we describe how to set up a multi-Region resilient MSK cluster using MSK Replicator and also show the failover and failback strategy.
Provision an MSK cluster using AWS CloudFormation
We provide AWS CloudFormation templates to provision certain resources:
- Deploy this CloudFormation template in
us-east-1(primary) - Deploy this CloudFormation template in
us-east-2(secondary)
This will create the virtual private cloud (VPC), subnets, and the MSK Provisioned cluster with Express brokers within the VPC configured with AWS Identity and Access Management (IAM) authentication in each Region. It will also create a Kafka client Amazon Elastic Compute Cloud (Amazon EC2) instance, where we can use the Kafka command line to create and view a Kafka topic and produce and consume messages to and from the topic.
Configure multi-VPC connectivity in the primary MSK cluster
After the clusters are deployed, you need to enable the multi-VPC connectivity in the primary MSK cluster deployed in us-east-1. This will allow MSK Replicator to connect to the primary MSK cluster using multi-VPC connectivity (powered by AWS PrivateLink). Multi-VPC connectivity is only required for cross-Region replication. For same-Region replication, MSK Replicator uses an IAM policy to connect to the primary MSK cluster.
MSK Replicator uses IAM authentication only to connect to both primary and secondary MSK clusters. Therefore, although other Kafka clients can still continue to use SASL/SCRAM or mTLS authentication, for MSK Replicator to work, IAM authentication has to be enabled.
To enable multi-VPC connectivity, complete the following steps:
- On the Amazon MSK console, navigate to the MSK cluster.
- On the Properties tab, under Network settings, choose Turn on multi-VPC connectivity on the Edit dropdown menu.

- For Authentication type, select IAM role-based authentication.
- Choose Turn on selection.
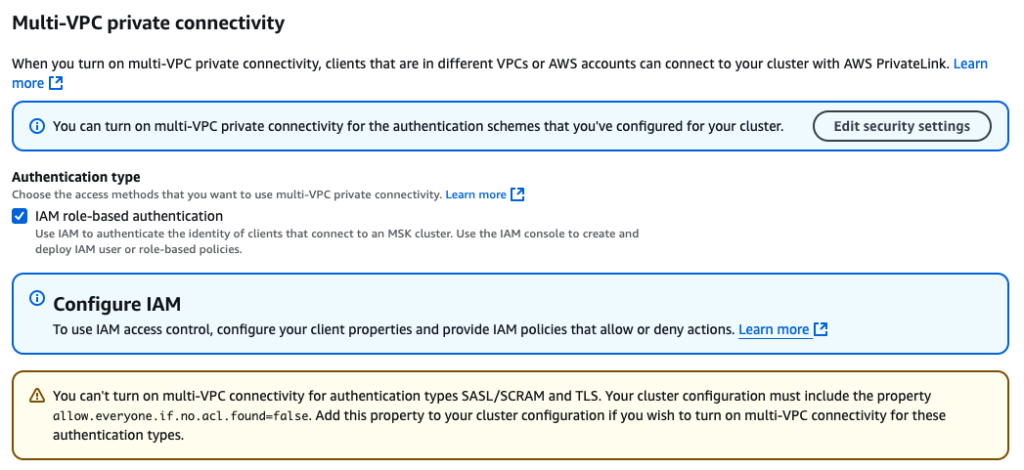
Enabling multi-VPC connectivity is a one-time setup and it can take approximately 30–45 minutes depending on the number of brokers. After this is enabled, you need to provide the MSK cluster resource policy to allow MSK Replicator to talk to the primary cluster.
- Under Security settings¸ choose Edit cluster policy.
- Select Include Kafka service principal.

Now that the cluster is enabled to receive requests from MSK Replicator using PrivateLink, we need to set up the replicator.
Create a MSK Replicator
Complete the following steps to create an MSK Replicator:
- In the secondary Region (
us-east-2), open the Amazon MSK console. - Choose Replicators in the navigation pane.
- Choose Create replicator.
- Enter a name and optional description.

- In the Source cluster section, provide the following information:
- For Cluster region, choose us-east-1.
- For MSK cluster, enter the Amazon Resource Name (ARN) for the primary MSK cluster.
For cross-Region setup, the primary cluster will appear disabled if the multi-VPC connectivity is not enabled and the cluster resource policy is not configured in the primary MSK cluster. After you choose the primary cluster, it automatically selects the subnets associated with primary cluster. Security groups are not required because the primary cluster’s access is governed by the cluster resource policy.

Next, you select the target cluster. The target cluster Region is defaulted to the Region where the MSK Replicator is created. In this case, it’s us-east-2.
- In the Target cluster section, provide the following information:
- For MSK cluster, enter the ARN of the secondary MSK cluster. This will automatically select the cluster subnets and the security group associated with the secondary cluster.
- For Security groups, choose any additional security groups.
Make sure that the security groups have outbound rules to allow traffic to your secondary cluster’s security groups. Also make sure that your secondary cluster’s security groups have inbound rules that accept traffic from the MSK Replicator security groups provided here.

Now let’s provide the MSK Replicator settings.
- In the Replicator settings section, enter the following information:
- For Topics to replicate, we keep the topics to replicate as a default value that replicates all topics from the primary to secondary cluster.
- For Replication starting position, we choose Earliest, so that we can get all the events from the start of the source topics.
- For Copy settings, select Keep the same topic names to configure the topic name in the secondary cluster as identical to the primary cluster.
This makes sure that the MSK clients don’t need to add a prefix to the topic names.

- For this example, we keep the Consumer group replication setting as default and set Target compression type as None.
Also, MSK Replicator will automatically create the required IAM policies.
- Choose Create to create the replicator.
The process takes around 15–20 minutes to deploy the replicator. After the MSK Replicator is running, this will be reflected in the status.
Configure the MSK client for the primary cluster
Complete the following steps to configure the MSK client:
- On the Amazon EC2 console, navigate to the EC2 instance of the primary Region (
us-east-1) and connect to the EC2 instancedr-test-primary-KafkaClientInstance1using Session Manager, a capability of AWS Systems Manager.
After you have logged in, you need to configure the primary MSK cluster bootstrap address to create a topic and publish data to the cluster. You can get the bootstrap address for IAM authentication on the Amazon MSK console under View Client Information on the cluster details page.
- Configure the bootstrap address with the following code:
- Configure the client configuration for IAM authentication to talk to the MSK cluster:
Create a topic and produce and consume messages to the topic
Complete the following steps to create a topic and then produce and consume messages to it:
- Create a
customertopic:
- Create a console producer to write to the topic:
- Produce the following sample text to the topic:
- Press Ctrl+C to exit the console prompt.
- Create a consumer with
group.idmsk-consumerto read all the messages from the beginning of the customer topic:
This will consume both the sample messages from the topic.
- Press Ctrl+C to exit the console prompt.
Configure the MSK client for the secondary MSK cluster
Go to the EC2 cluster of the secondary Region us-east-2 and follow the previously mentioned steps to configure an MSK client. The only difference from the previous steps is that you should use the bootstrap address of the secondary MSK cluster as the environment variable. Configure the variable $BS_SECONDARY to configure the secondary Region MSK cluster bootstrap address.
Verify replication
After the client is configured to talk to the secondary MSK cluster using IAM authentication, list the topics in the cluster. Because the MSK Replicator is now running, the customer topic is replicated. To verify it, let’s see the list of topics in the cluster:
The topic name is customer without any prefix.
By default, MSK Replicator replicates the details of all the consumer groups. Because you used the default configuration, you can verify using the following command if the consumer group ID msk-consumer is also replicated to the secondary cluster:
Now that we have verified the topic is replicated, let’s understand the key metrics to monitor.
Monitor replication
Monitoring MSK Replicator is very important to make sure that replication of data is happening fast. This reduces the risk of data loss in case an unplanned failure occurs. Some important MSK Replicator metrics to monitor are ReplicationLatency, MessageLag, and ReplicatorThroughput. For a detailed list, see Monitor replication.
To understand how many bytes are processed by MSK Replicator, you should monitor the metric ReplicatorBytesInPerSec. This metric indicates the average number of bytes processed by the replicator per second. Data processed by MSK Replicator consists of all data MSK Replicator receives. This includes the data replicated to the target cluster and filtered by MSK Replicator. This metric is applicable if you use Keep same topic name in the MSK Replicator copy settings. During a failback scenario, MSK Replicator starts to read from the earliest offset and replicates records from the secondary back to the primary. Depending on the retention settings, some data might exist in the primary cluster. To prevent duplicates, MSK Replicator processes the data but automatically filters out duplicate data.
Fail over clients to the secondary MSK cluster
In the case of an unexpected event in the primary Region in which clients can’t connect to the primary MSK cluster or the clients are receiving unexpected produce and consume errors, this could be a sign that the primary MSK cluster is impacted. You may notice a sudden spike in replication latency. If the latency continues to rise, it could indicate a regional impairment in Amazon MSK. To verify this, you can check the AWS Health Dashboard, though there is a chance that status updates may be delayed. Once you identify signs of a regional impairment in Amazon MSK, you should prepare to fail over the clients to the secondary region.
For critical workloads we recommend not taking a dependency on control plane actions for failover. To mitigate this risk, you could implement a pilot light deployment, where essential components of the stack are kept running in a secondary region and scaled up when the primary region is impaired. Alternatively, for faster and smoother failover with minimal downtime, a hot standby approach is recommended. This involves pre-deploying the entire stack in a secondary region so that, in a disaster recovery scenario, the pre-deployed clients can be quickly activated in the secondary region.
Failover process
To perform the failover, you first need to stop the clients pointed to the primary MSK cluster. However, for the purpose of the demo, we are using console producer and consumers, so our clients are already stopped.
In a real failover scenario, using primary Region clients to communicate with the secondary Region MSK cluster is not recommended, as it breaches fault isolation boundaries and leads to increased latency. To simulate the failover using the preceding setup, let’s start a producer and consumer in the secondary Region (us-east-2). For this, run a console producer in the EC2 instance (dr-test-secondary-KafkaClientInstance1) of the secondary Region.
The following diagram illustrates this setup.

Complete the following steps to perform a failover:
- Create a console producer using the following code:
- Produce the following sample text to the topic:
Now, let’s create a console consumer. It’s important to make sure the consumer group ID is exactly the same as the consumer attached to the primary MSK cluster. For this, we use the group.id msk-consumer to read the messages from the customer topic. This simulates that we are bringing up the same consumer attached to the primary cluster.
- Create a console consumer with the following code:
Although the consumer is configured to read all the data from the earliest offset, it only consumes the last two messages produced by the console producer. This is because MSK Replicator has replicated the consumer group details along with the offsets read by the consumer with the consumer group ID msk-consumer. The console consumer with the same group.id mimic the behaviour that the consumer is failed over to the secondary Amazon MSK cluster.
Fail back clients to the primary MSK cluster
Failing back clients to the primary MSK cluster is the common pattern in an active-passive scenario, when the service in the primary region has recovered. Before we fail back clients to the primary MSK cluster, it’s important to sync the primary MSK cluster with the secondary MSK cluster. For this, we need to deploy another MSK Replicator in the primary Region configured to read from the earliest offset from the secondary MSK cluster and write to the primary cluster with the same topic name. The MSK Replicator will copy the data from the secondary MSK cluster to the primary MSK cluster. Although the MSK Replicator is configured to start from the earliest offset, it will not duplicate the data already present in the primary MSK cluster. It will automatically filter out the existing messages and will only write back the new data produced in the secondary MSK cluster when the primary MSK cluster was down. The replication step from secondary to primary wouldn’t be required if you don’t have a business requirement of keeping the data same across both clusters.
After the MSK Replicator is up and running, monitor the MessageLag metric of MSK Replicator. This metric indicates how many messages are yet to be replicated from the secondary MSK cluster to the primary MSK cluster. The MessageLag metric should come down close to 0. Now you should stop the producers writing to the secondary MSK cluster and restart connecting to the primary MSK cluster. You should also allow the consumers to read data from the secondary MSK cluster until the MaxOffsetLag metric for the consumers is not 0. This makes sure that the consumers have already processed all the messages from the secondary MSK cluster. The MessageLag metric should be 0 by this time because no producer is producing records in the secondary cluster. MSK Replicator replicated all messages from the secondary cluster to the primary cluster. At this point, you should start the consumer with the same group.id in the primary Region. You can delete the MSK Replicator created to copy messages from the secondary to the primary cluster. Make sure that the previously existing MSK Replicator is in RUNNING status and successfully replicating messages from the primary to secondary. This can be confirmed by looking at the ReplicatorThroughput metric, which should be greater than 0.
Failback process
To simulate a failback, you first need to enable multi-VPC connectivity in the secondary MSK cluster (us-east-2) and add a cluster policy for the Kafka service principal like we did before.
Deploy the MSK Replicator in the primary Region (us-east-1) with the source MSK cluster pointed to us-east-2 and the target cluster pointed to us-east-1. Configure Replication starting position as Earliest and Copy settings as Keep the same topic names.
The following diagram illustrates this setup.

After the MSK Replicator is in RUNNING status, let’s verify there is no duplicate while replicating the data from the secondary to the primary MSK cluster.
Run a console consumer without the group.id in the EC2 instance (dr-test-primary-KafkaClientInstance1) of the primary Region (us-east-1):
This should show the four messages without any duplicates. Although in the consumer we specify to read from the earliest offset, MSK Replicator makes sure the duplicate data isn’t replicated back to the primary cluster from the secondary cluster.
You can now point the clients to start producing to and consuming from the primary MSK cluster.
Clean up
At this point, you can tear down the MSK Replicator deployed in the primary Region.
Conclusion
This post explored how to enhance Kafka resilience by setting up a secondary MSK cluster in another Region and synchronizing it with the primary cluster using MSK Replicator. We demonstrated how to implement an active-passive disaster recovery strategy while maintaining consistent topic names across both clusters. We provided a step-by-step guide for configuring replication with identical topic names and detailed the processes for failover and failback. Additionally, we highlighted key metrics to monitor and outlined actions to provide efficient and continuous data replication.
For more information, refer to What is Amazon MSK Replicator? For a hands-on experience, try out the Amazon MSK Replicator Workshop. We encourage you to try out this feature and share your feedback with us.
About the Author

Subham Rakshit is a Senior Streaming Solutions Architect for Analytics at AWS based in the UK. He works with customers to design and build streaming architectures so they can get value from analyzing their streaming data. His two little daughters keep him occupied most of the time outside work, and he loves solving jigsaw puzzles with them. Connect with him on LinkedIn.
Disaster Recovery 101: Improving RTO and RPO Goals with the Cloud
Post Syndicated from Kari Rivas original https://www.backblaze.com/blog/disaster-recovery-101-improving-rto-and-rpo-goals-with-the-cloud/

Creating clear goals is inevitably part of any business strategy. You’ve likely heard of the acronym SMART—specific, measurable, actionable, realistic, and time-bound—when it comes to goal setting. As a business leader in information technology or a related business unit, you’re responsible for developing sound goals for business technology, data protection, and disaster recovery.
Two key metrics that feed into those strategies are your recovery time objective (RTO) and recovery point objective (RPO). Like all the other goals your business sets, the RTO and RPO should also be SMART goals.
So, how can you set meaningful RTO and RPO objectives for your business? And how can the cloud help you achieve or improve on those objectives? Today I’ll talk about how to smarten up these objectives to lead to better business continuity (BC) and a more effective disaster recovery (DR) plan.
The Essential Guide to Disaster Recovery Planning
Read more about how to build a disaster recovery plan for your organization.

Why do RTO and RPO matter?
RTO and RPO are two fundamental inputs to a comprehensive disaster recovery plan. They also very much guide how you’ll structure your backup strategy and engineer your backup architecture.
RTO is a business metric that states the maximum length of time a business can tolerate for recovery. It’s important to note the difference between recovery and restoration of data here. Restoring data is just one part of a recovery.
Recovery means systems are back up and running—fully functional—with users (employees, customers, etc.) able to utilize them in the same manner as before the data incident occurred.
RPO measures the maximum amount of data a company can afford to lose (or is willing to lose), measured in units of time. For instance, an RPO of 12 hours means that the company can accept the risk (financial risk, risk to the brand, etc.) of having lost 12 hours worth of data. So, if you run backups every 11 hours, you will be able to meet your RPO.
How to set RTO and RPO
Creating these objectives is a business decision—not an IT decision. If you’re an IT leader, your job is to work with your internal stakeholders to fully understand the business and the criticality of various applications and services in order to help define the RTO and RPO.
Put another way: The decision about what standard to meet is a shared responsibility. And those standards (recovery time, file durability, etc.) are the targets that IT and infrastructure providers teams must meet.
RTO and RPO may be different from one system to another. Some applications are more important than others.
Keep in mind that it’s likely that department heads will all say their services are the most important to immediately recover. But if everything is deemed critical, then nothing is.
Discuss how data loss and time to recovery impact the business in quantifiable details—revenue lost, number of customers affected, etc.—in order to truly prioritize systems and set appropriate RTOs and RPOs.
Making your RTOs and RPOs SMART
Remember that your objectives should be SMART:
- Specific: Think through how granular your RTOs and RPOs should be. In addition to different RTOs and RPOs per application, you may also need different RTOs and RPOs per scenario. For example, the RTO for a ransomware attack is much different than that for hardware failure.
- Measurable: One good way of measuring the efficacy of your RTOs and RPOs is by conducting DR testing. Run fire drills and conduct tabletop exercises. Practice restoring data. These inputs will help you understand if your objectives are meaningful and obtainable.
- Actionable: Document your RTO and RPO in your DR plans and ensure they align with any business continuity risk management plans or goals around maximum allowable risk tolerance. You may also want to document the assumptions and inputs that formed the RTO and RPO. For instance, how much revenue is lost when a given system is down? Explain how that factor drives your RTO.
- Realistic: Don’t let your stakeholders set unachievable objectives. If there is an ask for a very low RTO and/or RPO, help your stakeholder understand exactly what it will take—and how much it will cost—to implement that objective.
- Time-bound: The RTO can be defined in seconds up to weeks. The shorter the RTO, the more expensive the investment will be to meet it.
Remember that you’re always balancing RTO and RPO against an unachievable “perfect” state. For instance, you would likely need multiple failover hot sites with replicated data to meet an RTO of seconds of downtime.
RTO is a forward-looking measurement; RPO is a backward-looking measurement that essentially represents the frequency of your backups.
A short RPO means more recent backup data is needed, and, yes, that also means greater investment. RPOs measured in seconds may require high-speed backup technology like continuous replication.
How to discuss RTO and RPO with business leaders
Discussing technical concepts with internal stakeholders can be challenging. To guide the objective-setting discussion with stakeholders, use the following questions as a guide:
- Where and how do you store data?
- How often does your data change?
- What would a minute of downtime cost your department, in terms of revenue, risk, loss of productivity, impact to customers, etc.?
- What are the compliance or industry requirements for maintaining sensitive data?
- Do you have a way of manually transacting business if service is down?
Your IT department may already be well aware of many of these goals, but it’s good to do a fresh and full inventory of data and data management procedures. For example, even with the rise of shared drives, many employees still save important data locally. Or, there may be business-critical data being saved in services like Microsoft 365 or Kubernetes—and those services are often not adequately backed up.
How do RTO and RPO affect backup strategy?
Your RPO is often more directly related to backup strategy, although RTO certainly informs backup strategy. If you need a very low RPO (i.e., the business can tolerate very little data loss), you must plan to run backups more frequently. This ensures you always have very recent data to recover.
RTO, however, relates more to systems and infrastructure—again, because the objective is about recovery and not just restoring data. RTO will drive investment decisions around backup and DR architecture.
Your backup strategy or tech stack should not dictate either your RTO or your RPO.
First, you should define your RTO and RPO, and then you must determine if changes in backup policy are needed or if you need to update any backup systems in order to reach desired RTOs and RPOs.
Your RTO will drive decisions around backup and DR infrastructure; your RPO will drive decisions around frequency of backup and type of backup.
How does the cloud help companies meet RTO and RPO goals?
Using a public cloud for backup and archive can help you achieve your desired RTO and/or RPO. An obvious example is using cloud to replace LTO tape backup. Tape backup has some of the worst (maybe the worst) RTOs and RPOs. It takes an extraordinarily long time to recover from tape, and backups are likely not as frequent as they should be because tape is often not properly maintained. Migrating your tape backups to a public cloud like Backblaze B2 Cloud Storage is still cost-effective and it will drastically improve RTO and RPO.
If you’re using a hyperscaler like AWS, you may have had to cut back on frequency of backup or needed retention periods due to exorbitant fees. Shifting your backups to Backblaze B2 can help you achieve your goals: Backblaze B2 is one-fifth the cost of AWS S3, you can afford to run and save more frequent backups, thus lowering your overall RPO.
Replication is another technology that can help reduce RTOs. Many enterprise businesses will already have a failover site, but keeping an extra copy of your data in the cloud ensures you can still meet your desired RTO in the case of a DR site or production facility takeout. This is exactly what brought SaaS platform Centerbase to Backblaze.
More commonly, if it’s inordinately expensive to own your own DR site, you can store your backups in Backblaze B2 and utilize Cloud Replication for added redundancy.
RTO and RPO and your business
Ultimately, you should frame your RTO and RPO in terms of business impact. Then, reverse engineer your backup and DR infrastructure to support those objectives. Next, identify the storage systems for your data based on its business criticality and desired RTO and RPO.
Depending on your business goals, you’ll likely use cloud storage services, on-premises storage, or some combination of the two. Regardless of the type of business you run, demonstrating that you have an airtight DR plan with SMART RTO and RPO goals will instill confidence in your business partners, help with cyber insurance eligibility, and shore up your organization’s ability to withstand data disasters.
The post Disaster Recovery 101: Improving RTO and RPO Goals with the Cloud appeared first on Backblaze Blog | Cloud Storage & Cloud Backup
Bhattcharya: Closing the chapter on OpenH264
Post Syndicated from jzb original https://lwn.net/Articles/1015408/
Boudhayan Bhattcharya has posted a lengthy article
about the announcement
that the Freedesktop project is dropping OpenH264 from the Freedesktop SDK for Flatpak
applications and runtimes.
Some Flatpak applications that depend on the Freedesktop runtime
version 23.08 will lose H.264 playback support starting with the
release scheduled for April, unless application developers replace it
with the ffmpeg-full extension. The 24.08 runtime is
unaffected, and future releases will include a new
codecs-extra extension to replace OpenH264 that includes FFmpeg with support for a number of
patented codecs.
Considering all things, I think and hope we made the correct decision
and hopefully the new org.freedesktop.Platform.codecs-extra works
out. libx264, libx265 and others are built from source and there are
no binaries or extra-data involved. So we should theoretically be able
to patch and fix any issues that come up in the future.Apart from all this, I’m slightly worried at the prospects of legal
issues cropping up with this setup and also that the new extension
contains “too much”, but we will have to see where things flow.
Multiple vulnerabilities in Ingress NGINX Controller for Kubernetes
Post Syndicated from Stephen Fewer original https://blog.rapid7.com/2025/03/25/etr-multiple-vulnerabilities-in-ingress-nginx-controller-for-kubernetes/

On March 24, 2025, Kubernetes disclosed 5 new vulnerabilities affecting the Ingress NGINX Controller for Kubernetes. Successful exploitation could allow attackers access to all secrets stored across all namespaces in the Kubernetes cluster, which could result in cluster takeover.
- CVE-2025-1974 (9.8 Critical): RCE escalation. An unauthenticated attacker with access to the pod network can achieve arbitrary code execution in the context of the ingress-nginx controller. This can lead to disclosure of Secrets accessible to the controller. (In the default installation, the controller can access all Secrets cluster-wide.)
- CVE-2025-24514 (8.8 High): Configuration injection via unsanitized auth-url annotation. In ingress-nginx, the `auth-url` Ingress annotation can be used to inject configuration into nginx. This can lead to arbitrary code execution in the context of the ingress-nginx controller, and disclosure of Secrets accessible to the controller.
- CVE-2025-1097 (8.8 High): Configuration injection via unsanitized auth-tls-match-cn annotation. The `auth-tls-match-cn` Ingress annotation can be used to inject configuration into nginx. This can lead to arbitrary code execution in the context of the ingress-nginx controller, and disclosure of Secrets accessible to the controller.
- CVE-2025-1098 (8.8 High): Configuration injection via unsanitized mirror annotations. The `mirror-target` and `mirror-host` Ingress annotations can be used to inject arbitrary configuration into nginx. This can lead to arbitrary code execution in the context of the ingress-nginx controller, and disclosure of Secrets accessible to the controller.
- CVE-2025-24513 (4.8 Medium): Auth secret file path traversal vulnerability. Attacker-provided data is included in a filename by the ingress-nginx Admission Controller feature, resulting in directory traversal within the container. This could result in denial of service, or when combined with other vulnerabilities, limited disclosure of Secret objects from the cluster.
Of the 5 vulnerabilities disclosed, any one of the injection vulnerabilities (CVE-2025-24514, CVE-2025-1097, CVE-2025-1098) may be chained with CVE-2025-1974 to achieve unauthenticated RCE on the Kubernetes pod that is running a vulnerable Ingress NGINX Controller. Achieving RCE could allow an attacker to take over a Kubernetes cluster. As of March 25, 2025, none of the above CVEs is known to be exploited in the wild.
Ingress is a Kubernetes feature to route HTTP(S) traffic into a Kubernetes cluster. An Ingress Controller is an application responsible for performing the routing. While there are many Ingress Controllers available, the vulnerabilities disclosed on March 24 are specific to the Ingress NGINX Controller, which is an Ingress Controller based upon NGINX.
The original finders of all five vulnerabilities, Wiz, noted that 43% of cloud environments are vulnerable to the issues disclosed, and that they have identified 6,500 clusters with publicly exposed Ingress NGINX Controllers.
As of March 25, 2025 (14:00 pm GMT), there is now one known publicly available RCE exploit for CVE-2025-1974 (here). This exploit is unverified, but based on our understanding of the vulnerability, it appears viable.
Mitigation guidance
All 5 vulnerabilities are reported to affect the following versions of Ingress NGINX Controller:
- Versions <= 1.11.4
- Version 1.12.0
Notably, the Wiz advisory says that CVE-2025-24514 does not affect version 1.12.0, but the vendor indicates that the issue does affect 1.12.0.
Customers who use the Ingress NGINX Controller for Kubernetes are advised to update to the following versions immediately:
- Version 1.11.5
- Version 1.12.1
Rapid7 customers
With the latest Kubernetes Cluster Scanner (expected to be available Wednesday, March 26), InsightCloudSec customers will have the ability to discover Kubernetes workloads that have this vulnerability in their cluster. The discovery will be shown via the insights pack with a new insight called Publicly exposed vulnerable Ingress NGINX Admission. The insight will also include the remediation steps needed in order to resolve this vulnerability.
Amazon Spring Sale (Ends 3/31) with Price Tracking Graphs!
Post Syndicated from The Hook Up original https://www.youtube.com/watch?v=Kjt7zWpajy0
Notable vulnerabilities in Next.js (CVE-2025-29927) and CrushFTP
Post Syndicated from Calum Hutton original https://blog.rapid7.com/2025/03/25/etr-notable-vulnerabilities-in-next-js-cve-2025-29927/

Rapid7 is warning customers of notable vulnerabilities in Next.js, a React framework for building web applications, and CrushFTP, a file transfer technology that has previously been targeted by adversaries.
- CVE-2025-29927 is a critical improper authorization vulnerability in Next.js middleware that could (theoretically) allow an attacker to bypass authorization checks in a Next.js application, if the authorization check occurs in middleware.
- No CVE has been assigned (as of March 25, 2025) to an unauthenticated HTTP(S) port access vulnerability in CrushFTP file transfer software
Neither of the above vulnerabilities is known to have been exploited in the wild as of Tuesday, March 25, 2025. CrushFTP has previously been exploited in the wild for adversary access to (and exfiltration of) sensitive data.
CrushFTP unauthenticated HTTP(S) port access vulnerability (no CVE)
On Friday, March 21, 2025, file transfer software maker CrushFTP disclosed a new vulnerability to customers via email:

Note: While the email image above indicates only CrushFTP v11 is affected by the still-CVE-less (as of March 25) unauthenticated port access vulnerability, the extremely sparse vendor advisory indicates that both CrushFTP v10 and v11 are affected. According to the vendor, the issue is not exploitable if customers have the DMZ function of CrushFTP in place.
Mitigation guidance: File transfer technologies are high-value targets for ransomware and other adversaries looking to quickly gain access to and exfiltrate sensitive data. Per the email sent to CrushFTP customers on Friday, March 21, the vulnerability is fixed in CrushFTP v11.3.1 (and later). Customers should update immediately, without waiting for a regular patch cycle to occur.
Next.js CVE-2025-29927
CVE-2025-29927 stems from logic associated with how middleware is handled by the application — specifically, an attacker can provide a header in any request to bypass application middleware. Application middleware can perform any number of tasks, and it can stack so that multiple layers of middleware can be configured, with each able to modify the request/response passed to it. Common use cases of middleware include authentication/authorization, CSP validation, URL rewriting/redirection etc.
As the vulnerability affects an application framework, and the application middleware configuration can vary greatly, so too does the potential impact of exploiting the vulnerability. Based on Rapid7’s analysis, there is no ‘one-size-fits-all’ determination of risk/impact for CVE-2025-29927 (which is a common scenario for framework and library vulns). The most severe potential impact likely comes in the form of authentication bypass, but would still be highly application-dependent — the impact of bypassing authentication for a hobbyist “To do list” application is very different from theoretically bypassing authentication in an enterprise application utilising Next.js.
Organizations should consider whether their applications are relying solely on the middleware for authentication. It may be that the application uses middleware, but is just acting as a front end to back-end APIs that are dealing with server-side authentication logic. Bypassing the front-end Next.js middleware would not affect the back end’s ability to authenticate users.
As an example of how a more measured view can change the outlook, a Red Hat advisory for CVE-2025-29927 originally listed two products as affected: Red Hat Trusted Artifact Signer and Streams for Apache Kafka 2. Now these have been removed and classified as “Not affected,” presumably following further review. The advisory was updated with the following: “Red Hat Trusted Artifact Signer and Streams for Apache Kafka 2 are not affected by this vulnerability as they do not use Next.js for any authorization functionality.”
Mitigation guidance: Per the Next.js advisory, CVE-2025-29927 affects the following versions of Next.js:
- >= 13.0.0, < 13.5.9 (fixed in 13.5.9)
- >= 14.0.0, < 14.2.25 (fixed in 14.2.25)
- >= 15.0.0, < 15.2.3 (fixed in 15.2.3)
- >= 11.1.4, < 12.3.5 (fixed in 12.3.5)
Rapid7 customers
InsightVM and Nexpose customers who run CrushFTP on Linux can assess their exposure to the no-CVE unauthenticated HTTP(S) port access issue with a vulnerability check available in the Friday, March 21 content release.
Our InsightVM coverage team is assessing the feasibility of adding a vulnerability check for Next.js CVE-2025-29927. We will update this blog with further information no later than 6 AM ET on Wednesday, March 26, 2025.
Emporia Vue 3 ESPHome Install: Power Monitoring with Home Assistant
Post Syndicated from digiblur DIY original https://www.youtube.com/watch?v=Z52y1Gm4VAg
Build and deploy Remote Model Context Protocol (MCP) servers to Cloudflare
Post Syndicated from Brendan Irvine-Broque original https://blog.cloudflare.com/remote-model-context-protocol-servers-mcp/
It feels like almost everyone building AI applications and agents is talking about the Model Context Protocol (MCP), as well as building MCP servers that you install and run locally on your own computer.
You can now build and deploy remote MCP servers to Cloudflare. We’ve added four things to Cloudflare that handle the hard parts of building remote MCP servers for you:
-
workers-oauth-provider — an OAuth Provider that makes authorization easy
-
McpAgent — a class built into the Cloudflare Agents SDK that handles remote transport
-
mcp-remote — an adapter that lets MCP clients that otherwise only support local connections work with remote MCP servers
-
AI playground as a remote MCP client — a chat interface that allows you to connect to remote MCP servers, with the authentication check included
The button below, or the developer docs, will get you up and running in production with this example MCP server in less than two minutes:

Unlike the local MCP servers you may have previously used, remote MCP servers are accessible on the Internet. People simply sign in and grant permissions to MCP clients using familiar authorization flows. We think this is going to be a massive deal — connecting coding agents to MCP servers has blown developers’ minds over the past few months, and remote MCP servers have the same potential to open up similar new ways of working with LLMs and agents to a much wider audience, including more everyday consumer use cases.
MCP is quickly becoming the common protocol that enables LLMs to go beyond inference and RAG, and take actions that require access beyond the AI application itself (like sending an email, deploying a code change, publishing blog posts, you name it). It enables AI agents (MCP clients) to access tools and resources from external services (MCP servers).
To date, MCP has been limited to running locally on your own machine — if you want to access a tool on the web using MCP, it’s up to you to set up the server locally. You haven’t been able to use MCP from web-based interfaces or mobile apps, and there hasn’t been a way to let people authenticate and grant the MCP client permission. Effectively, MCP servers haven’t yet been brought online.
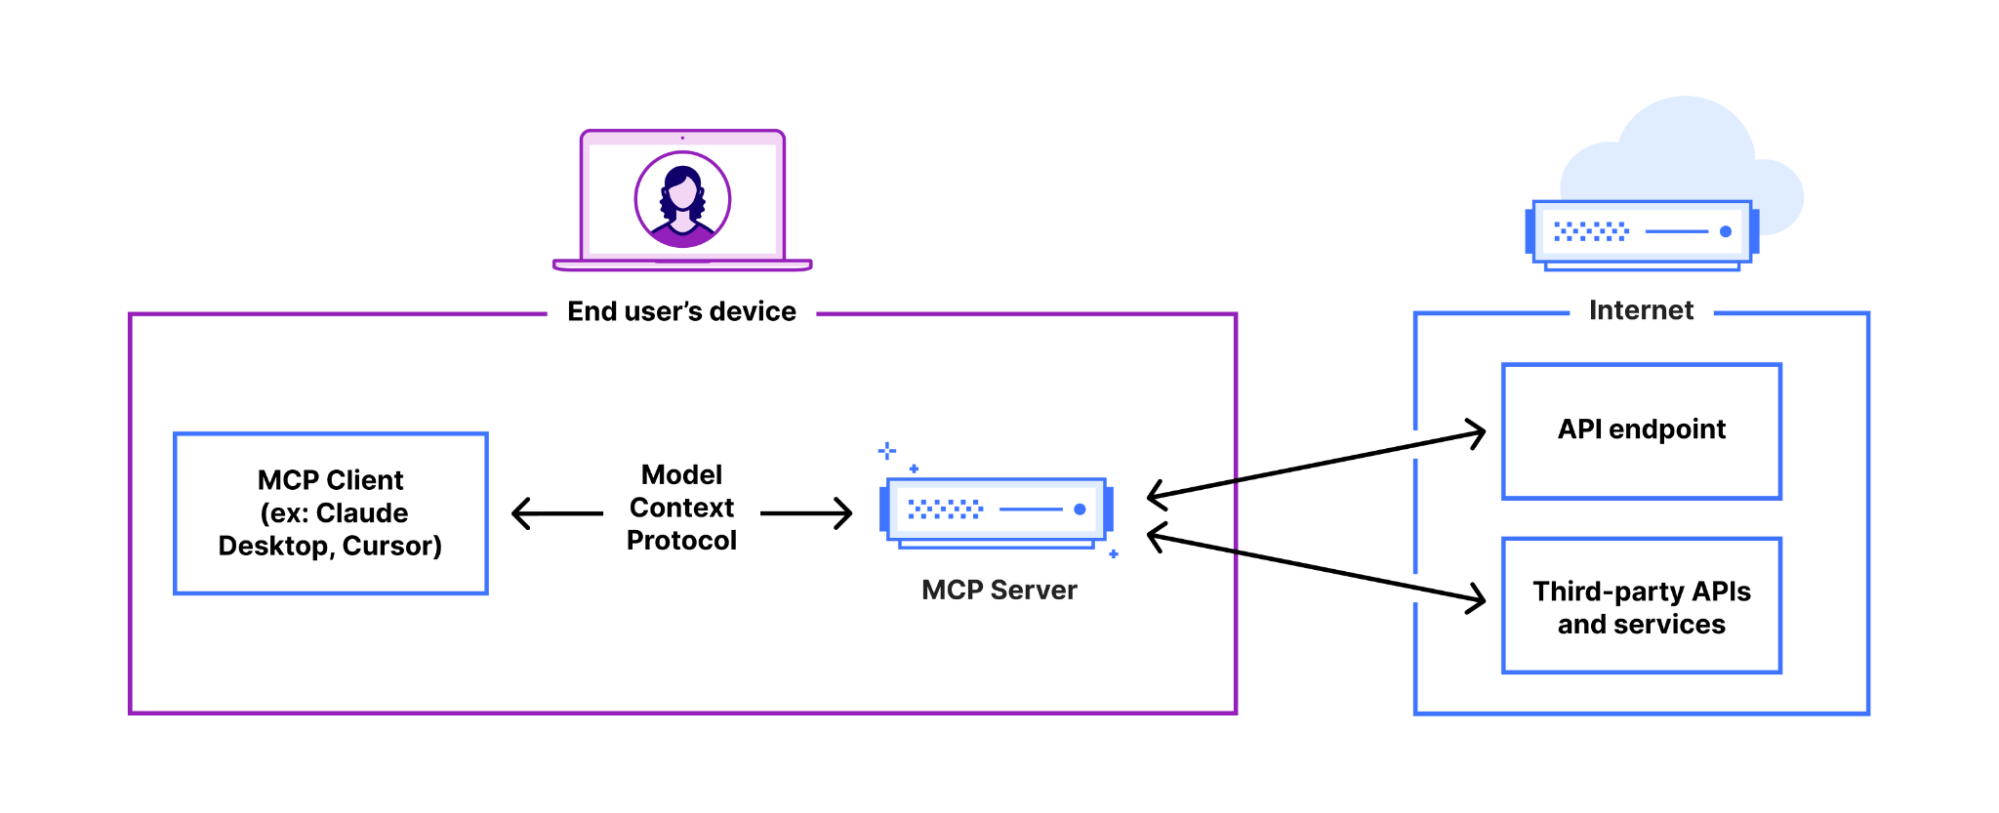
Support for remote MCP connections changes this. It creates the opportunity to reach a wider audience of Internet users who aren’t going to install and run MCP servers locally for use with desktop apps. Remote MCP support is like the transition from desktop software to web-based software. People expect to continue tasks across devices and to login and have things just work. Local MCP is great for developers, but remote MCP connections are the missing piece to reach everyone on the Internet.
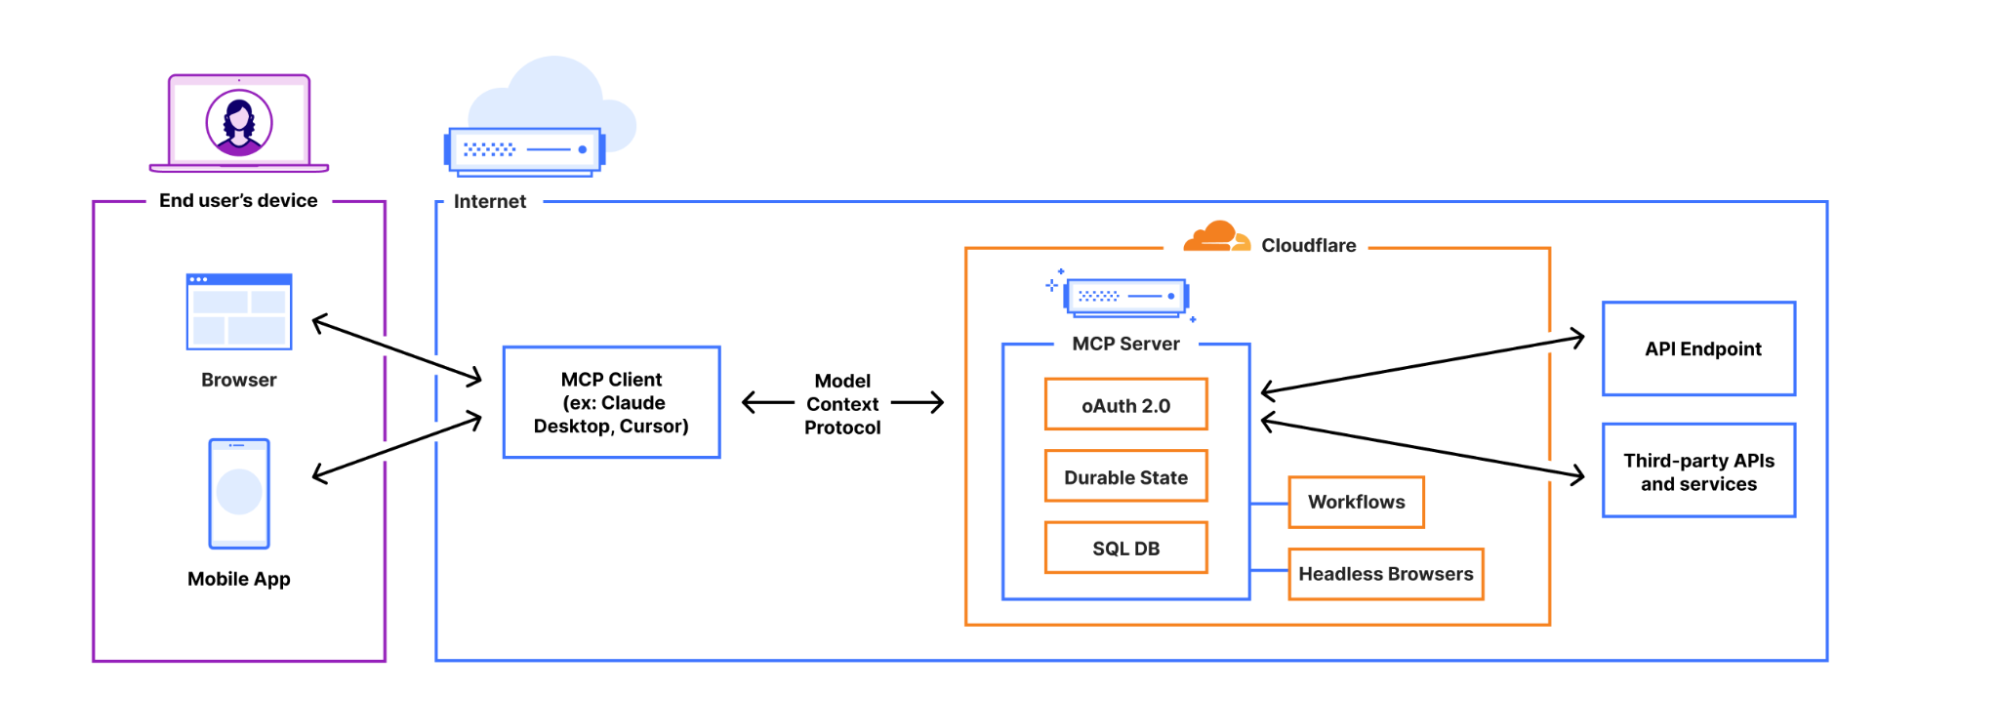
Beyond just changing the transport layer — from stdio to streamable HTTP — when you build a remote MCP server that uses information from the end user’s account, you need authentication and authorization. You need a way to allow users to login and prove who they are (authentication) and a way for users to control what the AI agent will be able to access when using a service (authorization).
MCP does this with OAuth, which has been the standard protocol that allows users to grant applications to access their information or services, without sharing passwords. Here, the MCP Server itself acts as the OAuth Provider. However, OAuth with MCP is hard to implement yourself, so when you build MCP servers on Cloudflare we provide it for you.
When you deploy an MCP Server to Cloudflare, your Worker acts as an OAuth Provider, using workers-oauth-provider, a new TypeScript library that wraps your Worker’s code, adding authorization to API endpoints, including (but not limited to) MCP server API endpoints.
Your MCP server will receive the already-authenticated user details as a parameter. You don’t need to perform any checks of your own, or directly manage tokens. You can still fully control how you authenticate users: from what UI they see when they log in, to which provider they use to log in. You can choose to bring your own third-party authentication and authorization providers like Google or GitHub, or integrate with your own.
The complete MCP OAuth flow looks like this:
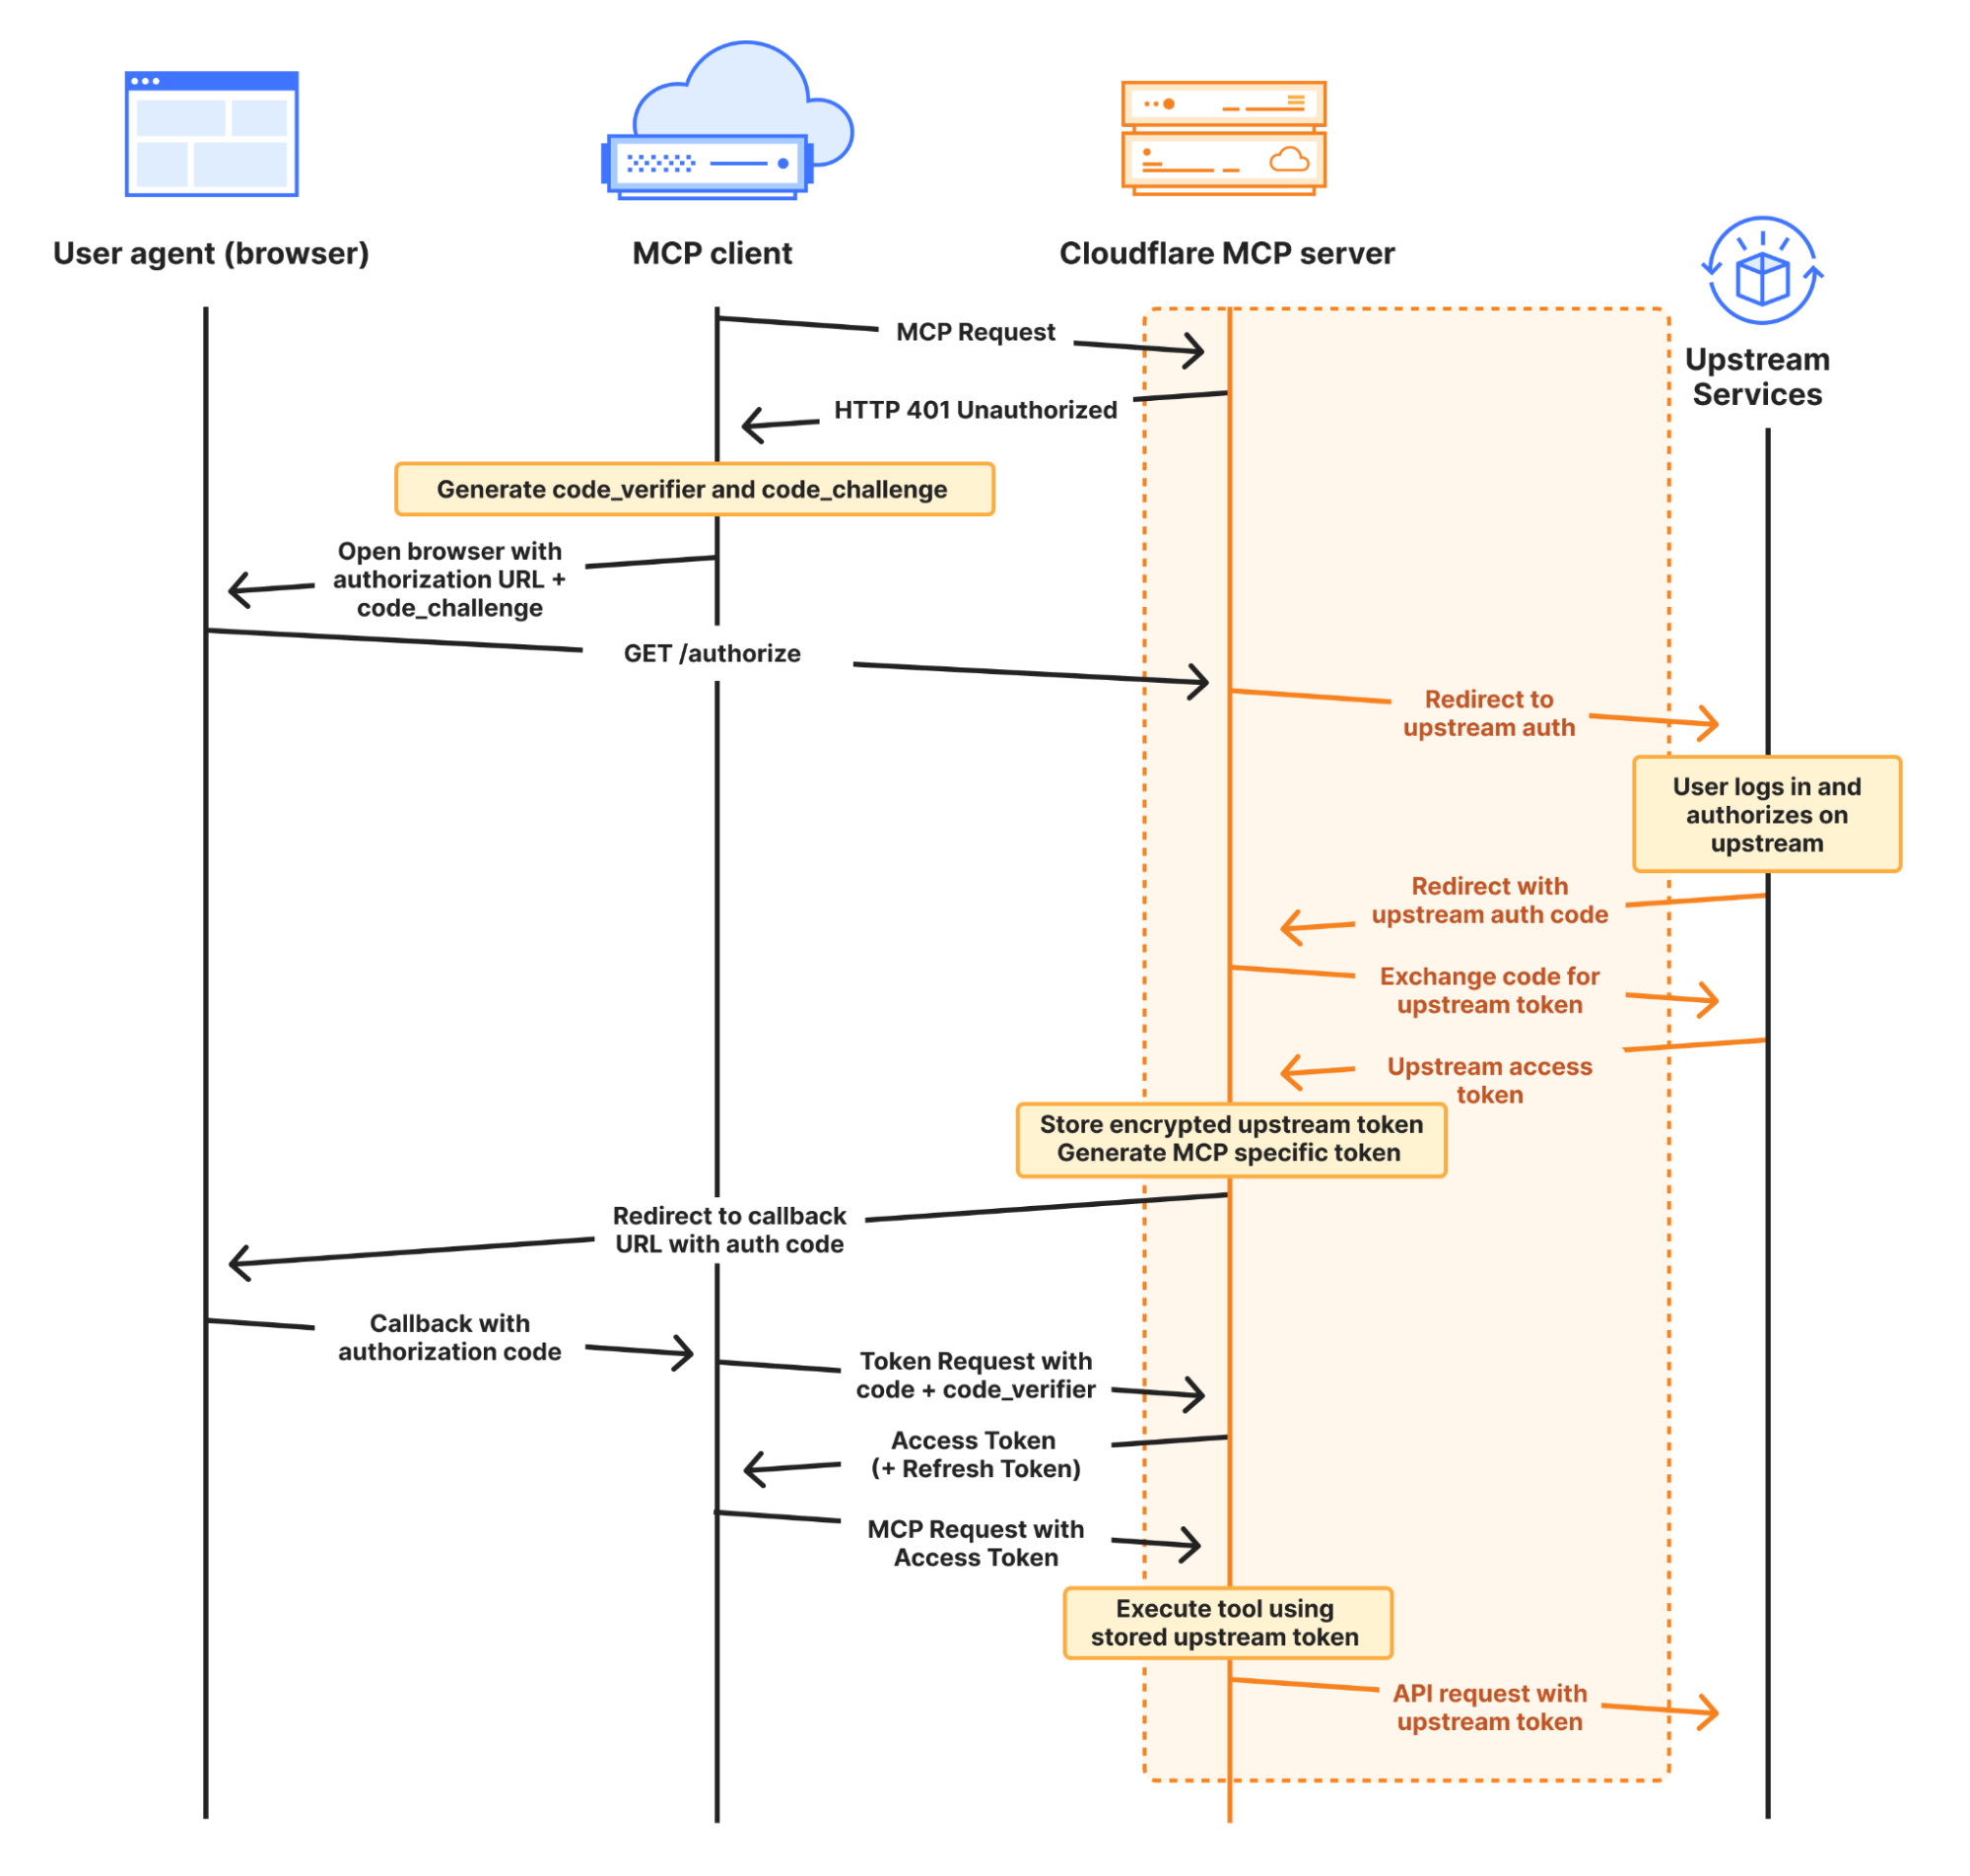
Here, your MCP server acts as both an OAuth client to your upstream service, and as an OAuth server (also referred to as an OAuth “provider”) to MCP clients. You can use any upstream authentication flow you want, but workers-oauth-provider guarantees that your MCP server is spec-compliant and able to work with the full range of client apps & websites. This includes support for Dynamic Client Registration (RFC 7591) and Authorization Server Metadata (RFC 8414).
When you build an MCP server with Cloudflare Workers, you provide an instance of the OAuth Provider paths to your authorization, token, and client registration endpoints, along with handlers for your MCP Server, and for auth:
import OAuthProvider from "@cloudflare/workers-oauth-provider";
import MyMCPServer from "./my-mcp-server";
import MyAuthHandler from "./auth-handler";

export default new OAuthProvider({
  apiRoute: "/sse", // MCP clients connect to your server at this route
  apiHandler: MyMCPServer.mount('/sse'), // Your MCP Server implmentation
  defaultHandler: MyAuthHandler, // Your authentication implementation
  authorizeEndpoint: "/authorize",
  tokenEndpoint: "/token",
  clientRegistrationEndpoint: "/register",
});
This abstraction lets you easily plug in your own authentication. Take a look at this example that uses GitHub as the identity provider for an MCP server, in less than 100 lines of code, by implementing /callback and /authorize routes.
You may have noticed in the authorization diagram above, and in the authorization section of the MCP spec, that the MCP server issues its own token to the MCP client.
Instead of passing the token it receives from the upstream provider directly to the MCP client, your Worker stores an encrypted access token in Workers KV. It then issues its own token to the client. As shown in the GitHub example above, this is handled on your behalf by the workers-oauth-provider — your code never directly handles writing this token, preventing mistakes. You can see this in the following code snippet from the GitHub example above:
  // When you call completeAuthorization, the accessToken you pass to it
  // is encrypted and stored, and never exposed to the MCP client
  // A new, separate token is generated and provided to the client at the /token endpoint
  const { redirectTo } = await c.env.OAUTH_PROVIDER.completeAuthorization({
    request: oauthReqInfo,
    userId: login,
    metadata: { label: name },
    scope: oauthReqInfo.scope,
    props: {
      accessToken,  // Stored encrypted, never sent to MCP client
    },
  })

  return Response.redirect(redirectTo)
On the surface, this indirection might sound more complicated. Why does it work this way?
By issuing its own token, MCP Servers can restrict access and enforce more granular controls than the upstream provider. If a token you issue to an MCP client is compromised, the attacker only gets the limited permissions you’ve explicitly granted through your MCP tools, not the full access of the original token.
Let’s say your MCP server requests that the user authorize permission to read emails from their Gmail account, using the gmail.readonly scope. The tool that the MCP server exposes is more narrow, and allows reading travel booking notifications from a limited set of senders, to handle a question like “What’s the check-out time for my hotel room tomorrow?” You can enforce this constraint in your MCP server, and if the token you issue to the MCP client is compromised, because the token is to your MCP server — and not the raw token to the upstream provider (Google) — an attacker cannot use it to read arbitrary emails. They can only call the tools your MCP server provides. OWASP calls out “Excessive Agency” as one of the top risk factors for building AI applications, and by issuing its own token to the client and enforcing constraints, your MCP server can limit tools access to only what the client needs.
Or building off the earlier GitHub example, you can enforce that only a specific user is allowed to access a particular tool. In the example below, only users that are part of an allowlist can see or call the generateImage tool, that uses Workers AI to generate an image based on a prompt:
import { McpAgent } from "agents/mcp";
import { McpServer } from "@modelcontextprotocol/sdk/server/mcp.js";
import { z } from "zod";

const USER_ALLOWLIST = ["geelen"];

export class MyMCP extends McpAgent<Props, Env> {
  server = new McpServer({
    name: "Github OAuth Proxy Demo",
    version: "1.0.0",
  });

  async init() {
    // Dynamically add tools based on the user's identity
    if (USER_ALLOWLIST.has(this.props.login)) {
      this.server.tool(
        'generateImage',
        'Generate an image using the flux-1-schnell model.',
        {
          prompt: z.string().describe('A text description of the image you want to generate.')
        },
        async ({ prompt }) => {
          const response = await this.env.AI.run('@cf/black-forest-labs/flux-1-schnell', {
            prompt,
            steps: 8
          })
          return {
            content: [{ type: 'image', data: response.image!, mimeType: 'image/jpeg' }],
          }
        }
      )
    }
  }
}
Introducing McpAgent: remote transport support that works today, and will work with the revision to the MCP spec
The next step to opening up MCP beyond your local machine is to open up a remote transport layer for communication. MCP servers you run on your local machine just communicate over stdio, but for an MCP server to be callable over the Internet, it must implement remote transport.
The McpAgent class we introduced today as part of our Agents SDK handles this for you, using Durable Objects behind the scenes to hold a persistent connection open, so that the MCP client can send server-sent events (SSE) to your MCP server. You don’t have to write code to deal with transport or serialization yourself. A minimal MCP server in 15 lines of code can look like this:
import { McpAgent } from "agents/mcp";
import { McpServer } from "@modelcontextprotocol/sdk/server/mcp.js";
import { z } from "zod";

export class MyMCP extends McpAgent {
  server = new McpServer({
    name: "Demo",
    version: "1.0.0",
  });
  async init() {
    this.server.tool("add", { a: z.number(), b: z.number() }, async ({ a, b }) => ({
      content: [{ type: "text", text: String(a + b) }],
    }));
  }
}
After much discussion, remote transport in the MCP spec is changing, with Streamable HTTP replacing HTTP+SSE This allows for stateless, pure HTTP connections to MCP servers, with an option to upgrade to SSE, and removes the need for the MCP client to send messages to a separate endpoint than the one it first connects to. The McpAgent class will change with it and just work with streamable HTTP, so that you don’t have to start over to support the revision to how transport works.
This applies to future iterations of transport as well. Today, the vast majority of MCP servers only expose tools, which are simple remote procedure call (RPC) methods that can be provided by a stateless transport. But more complex human-in-the-loop and agent-to-agent interactions will need prompts and sampling. We expect these types of chatty, two-way interactions will need to be real-time, which will be challenging to do well without a bidirectional transport layer. When that time comes, Cloudflare, the Agents SDK, and Durable Objects all natively support WebSockets, which enable full-duplex, bidirectional real-time communication.
When you build MCP servers on Cloudflare, each MCP client session is backed by a Durable Object, via the Agents SDK. This means each session can manage and persist its own state, backed by its own SQL database.
This opens the door to building stateful MCP servers. Rather than just acting as a stateless layer between a client app and an external API, MCP servers on Cloudflare can themselves be stateful applications — games, a shopping cart plus checkout flow, a persistent knowledge graph, or anything else you can dream up. When you build on Cloudflare, MCP servers can be much more than a layer in front of your REST API.
To understand the basics of how this works, let’s look at a minimal example that increments a counter:
import { McpAgent } from "agents/mcp";
import { McpServer } from "@modelcontextprotocol/sdk/server/mcp.js";
import { z } from "zod";

type State = { counter: number }

export class MyMCP extends McpAgent<Env, State, {}> {
  server = new McpServer({
    name: "Demo",
    version: "1.0.0",
  });

  initialState: State = {
    counter: 1,
  }

  async init() {
    this.server.resource(`counter`, `mcp://resource/counter`, (uri) => {
      return {
        contents: [{ uri: uri.href, text: String(this.state.counter) }],
      }
    })

    this.server.tool('add', 'Add to the counter, stored in the MCP', { a: z.number() }, async ({ a }) => {
      this.setState({ ...this.state, counter: this.state.counter + a })

      return {
        content: [{ type: 'text', text: String(`Added ${a}, total is now ${this.state.counter}`) }],
      }
    })
  }

  onStateUpdate(state: State) {
    console.log({ stateUpdate: state })
  }

}
For a given session, the MCP server above will remember the state of the counter across tool calls.
From within an MCP server, you can use Cloudflare’s whole developer platform, and have your MCP server spin up its own web browser, trigger a Workflow, call AI models, and more. We’re excited to see the MCP ecosystem evolve into more advanced use cases.
Cloudflare is supporting remote MCP early — before the most prominent MCP client applications support remote, authenticated MCP, and before other platforms support remote MCP. We’re doing this to give you a head start building for where MCP is headed.
But if you build a remote MCP server today, this presents a challenge — how can people start using your MCP server if there aren’t MCP clients that support remote MCP?
We have two new tools that allow you to test your remote MCP server and simulate how users will interact with it in the future:
We updated the Workers AI Playground to be a fully remote MCP client that allows you to connect to any remote MCP server with built-in authentication support. This online chat interface lets you immediately test your remote MCP servers without having to install anything on your device. Instead, just enter the remote MCP server’s URL (e.g. https://remote-server.example.com/sse) and click Connect.
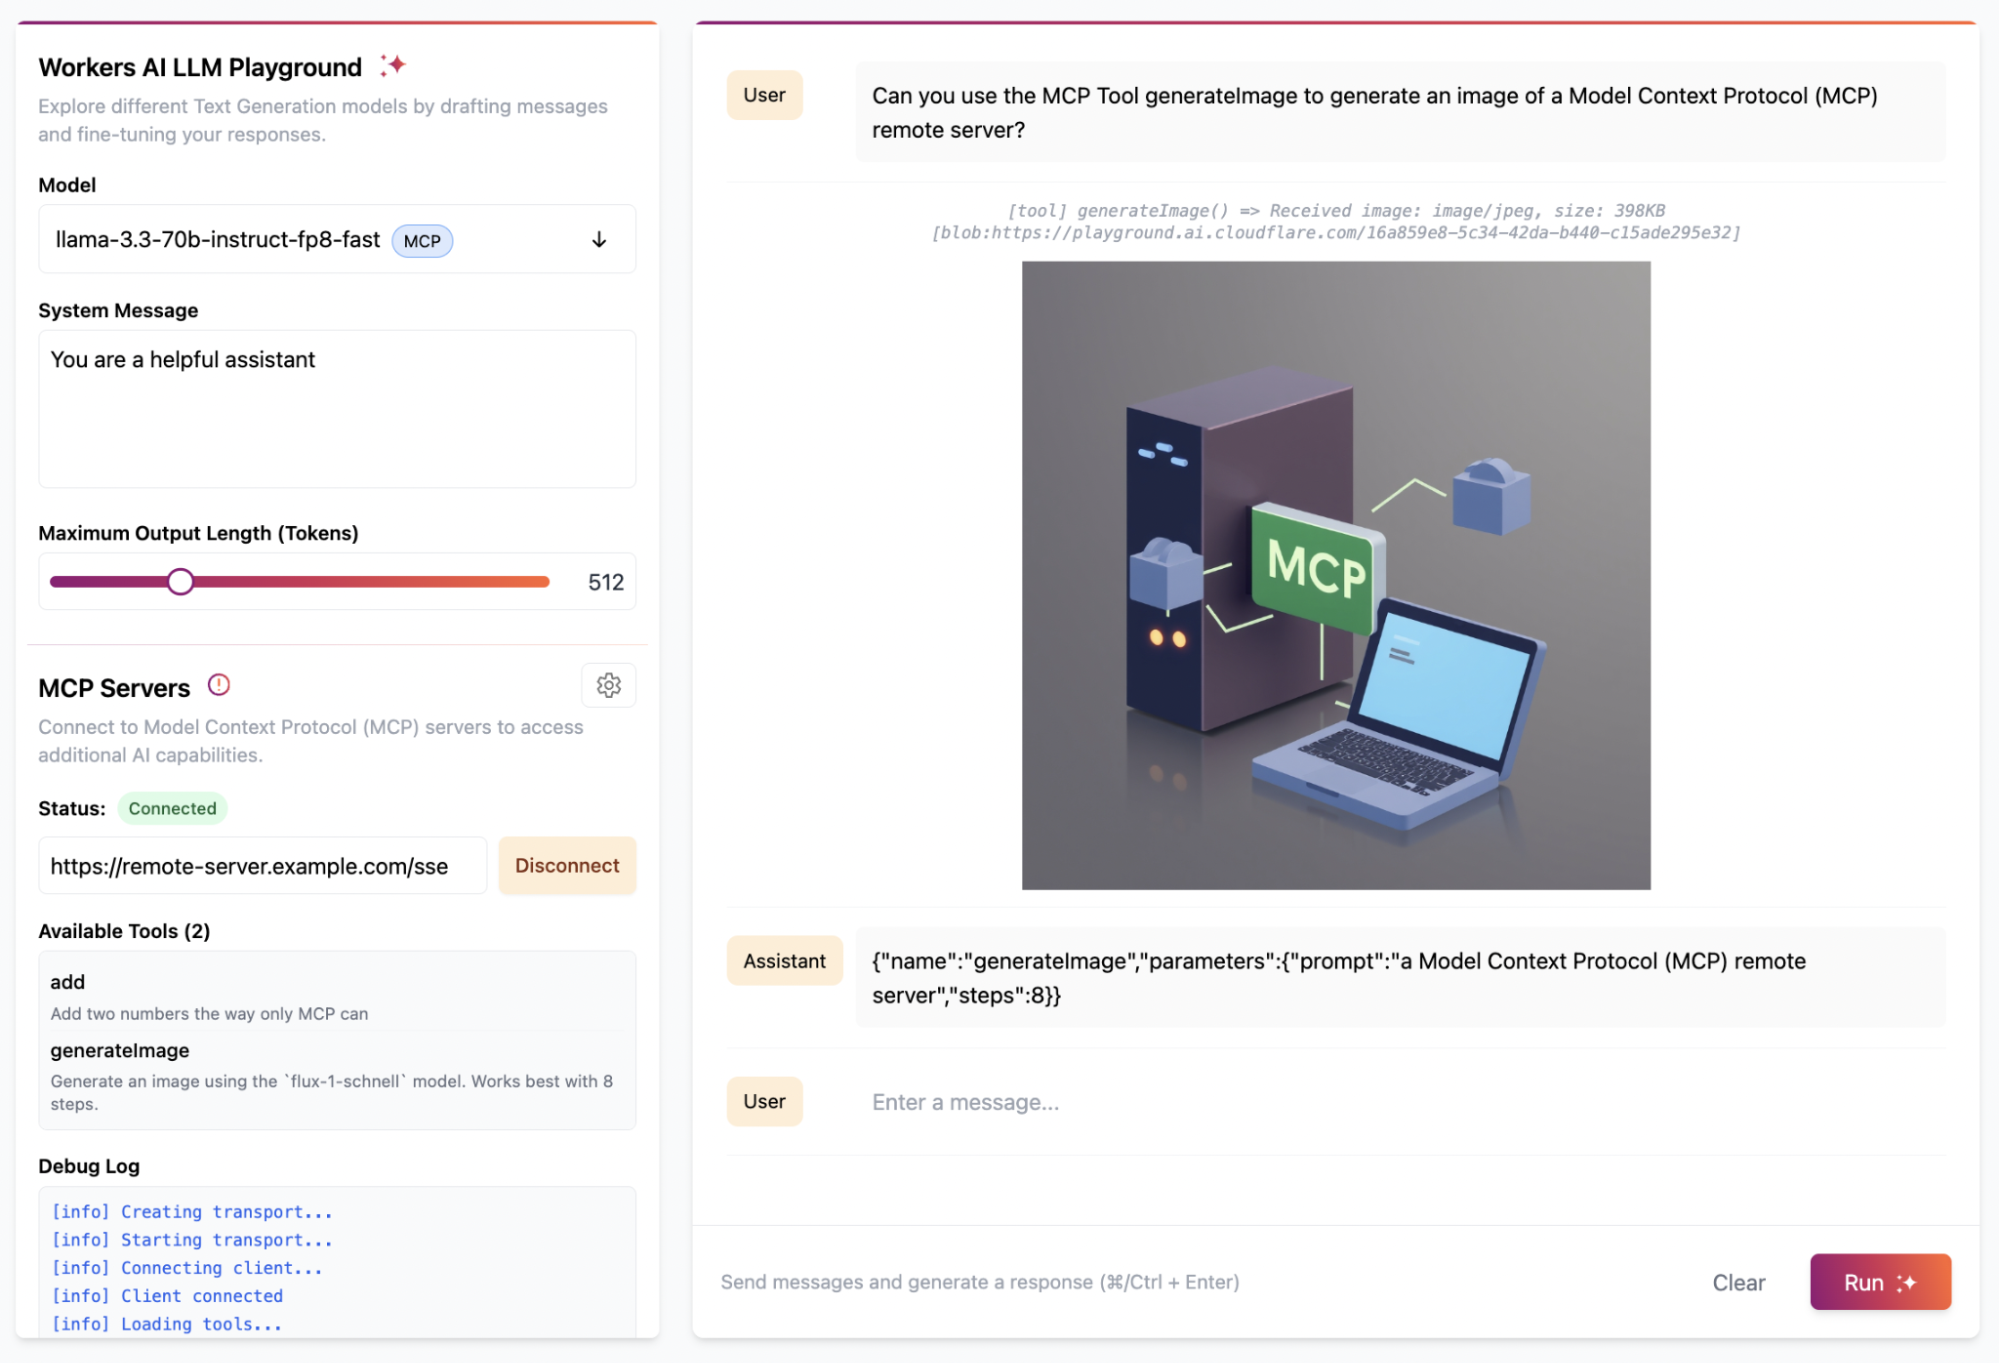
Once you click Connect, you’ll go through the authentication flow (if you set one up) and after, you will be able to interact with the MCP server tools directly from the chat interface.
If you prefer to use a client like Claude Desktop or Cursor that already supports MCP but doesn’t yet handle remote connections with authentication, you can use mcp-remote. mcp-remote is an adapter that lets MCP clients that otherwise only support local connections to work with remote MCP servers. This gives you and your users the ability to preview what interactions with your remote MCP server will be like from the tools you’re already using today, without having to wait for the client to support remote MCP natively.
We’ve published a guide on how to use mcp-remote with popular MCP clients including Claude Desktop, Cursor, and Windsurf. In Claude Desktop, you add the following to your configuration file:
{
  "mcpServers": {
    "remote-example": {
      "command": "npx",
      "args": [
        "mcp-remote",
        "https://remote-server.example.com/sse"
      ]
    }
  }
}Remote Model Context Protocol (MCP) is coming! When client apps support remote MCP servers, the audience of people who can use them opens up from just us, developers, to the rest of the population — who may never even know what MCP is or stands for.
Building a remote MCP server is the way to bring your service into the AI assistants and tools that millions of people use. We’re excited to see many of the biggest companies on the Internet are busy building MCP servers right now, and we are curious about the businesses that pop-up in an agent-first, MCP-native way.
On Cloudflare, you can start building today. We’re ready for you, and ready to help build with you. Email us at [email protected], and we’ll help get you going. There’s lots more to come with MCP, and we’re excited to see what you build.
Open-sourcing OpenPubkey SSH (OPKSSH): integrating single sign-on with SSH
Post Syndicated from Ethan Heilman original https://blog.cloudflare.com/open-sourcing-openpubkey-ssh-opkssh-integrating-single-sign-on-with-ssh/
OPKSSH makes it easy to SSH with single sign-on technologies like OpenID Connect, thereby removing the need to manually manage and configure SSH keys. It does this without adding a trusted party other than your identity provider (IdP).
We are excited to announce OPKSSH (OpenPubkey SSH) has been open-sourced under the umbrella of the OpenPubkey project. While the underlying protocol OpenPubkey became an open source Linux foundation project in 2023, OPKSSH was closed source and owned by BastionZero (now Cloudflare). Cloudflare has gifted this code to the OpenPubkey project, making it open source.
In this post, we describe what OPKSSH is, how it simplifies SSH management, and what OPKSSH being open source means for you.
A cornerstone of modern access control is single sign-on (SSO), where a user authenticates to an identity provider (IdP), and in response the IdP issues the user a token. The user can present this token to prove their identity, such as “Google says I am Alice”. SSO is the rare security technology that both increases convenience — users only need to sign in once to get access to many different systems — and increases security.
OpenID Connect (OIDC) is the main protocol used for SSO. As shown below, in OIDC the IdP, called an OpenID Provider (OP), issues the user an ID Token which contains identity claims about the user, such as “email is [email protected]”. These claims are digitally signed by the OP, so anyone who receives the ID Token can check that it really was issued by the OP.
Unfortunately, while ID Tokens do include identity claims like name, organization, and email address, they do not include the user’s public key. This prevents them from being used to directly secure protocols like SSH or End-to-End Encrypted messaging.
Note that throughout this post we use the term OpenID Provider (OP) rather than IdP, as OP specifies the exact type of IdP we are using, i.e., an OpenID IdP. We use Google as an example OP, but OpenID Connect works with Google, Azure, Okta, etc.
Shows a user Alice signing in to Google using OpenID Connect and receiving an ID Token
OpenPubkey, shown below, adds public keys to ID Tokens. This enables ID Tokens to be used like certificates, e.g. “Google says [email protected] is using public key 0x123.” We call an ID token that contains a public key a PK Token. The beauty of OpenPubkey is that, unlike other approaches, OpenPubkey does not require any changes to existing SSO protocols and supports any OpenID Connect compliant OP.
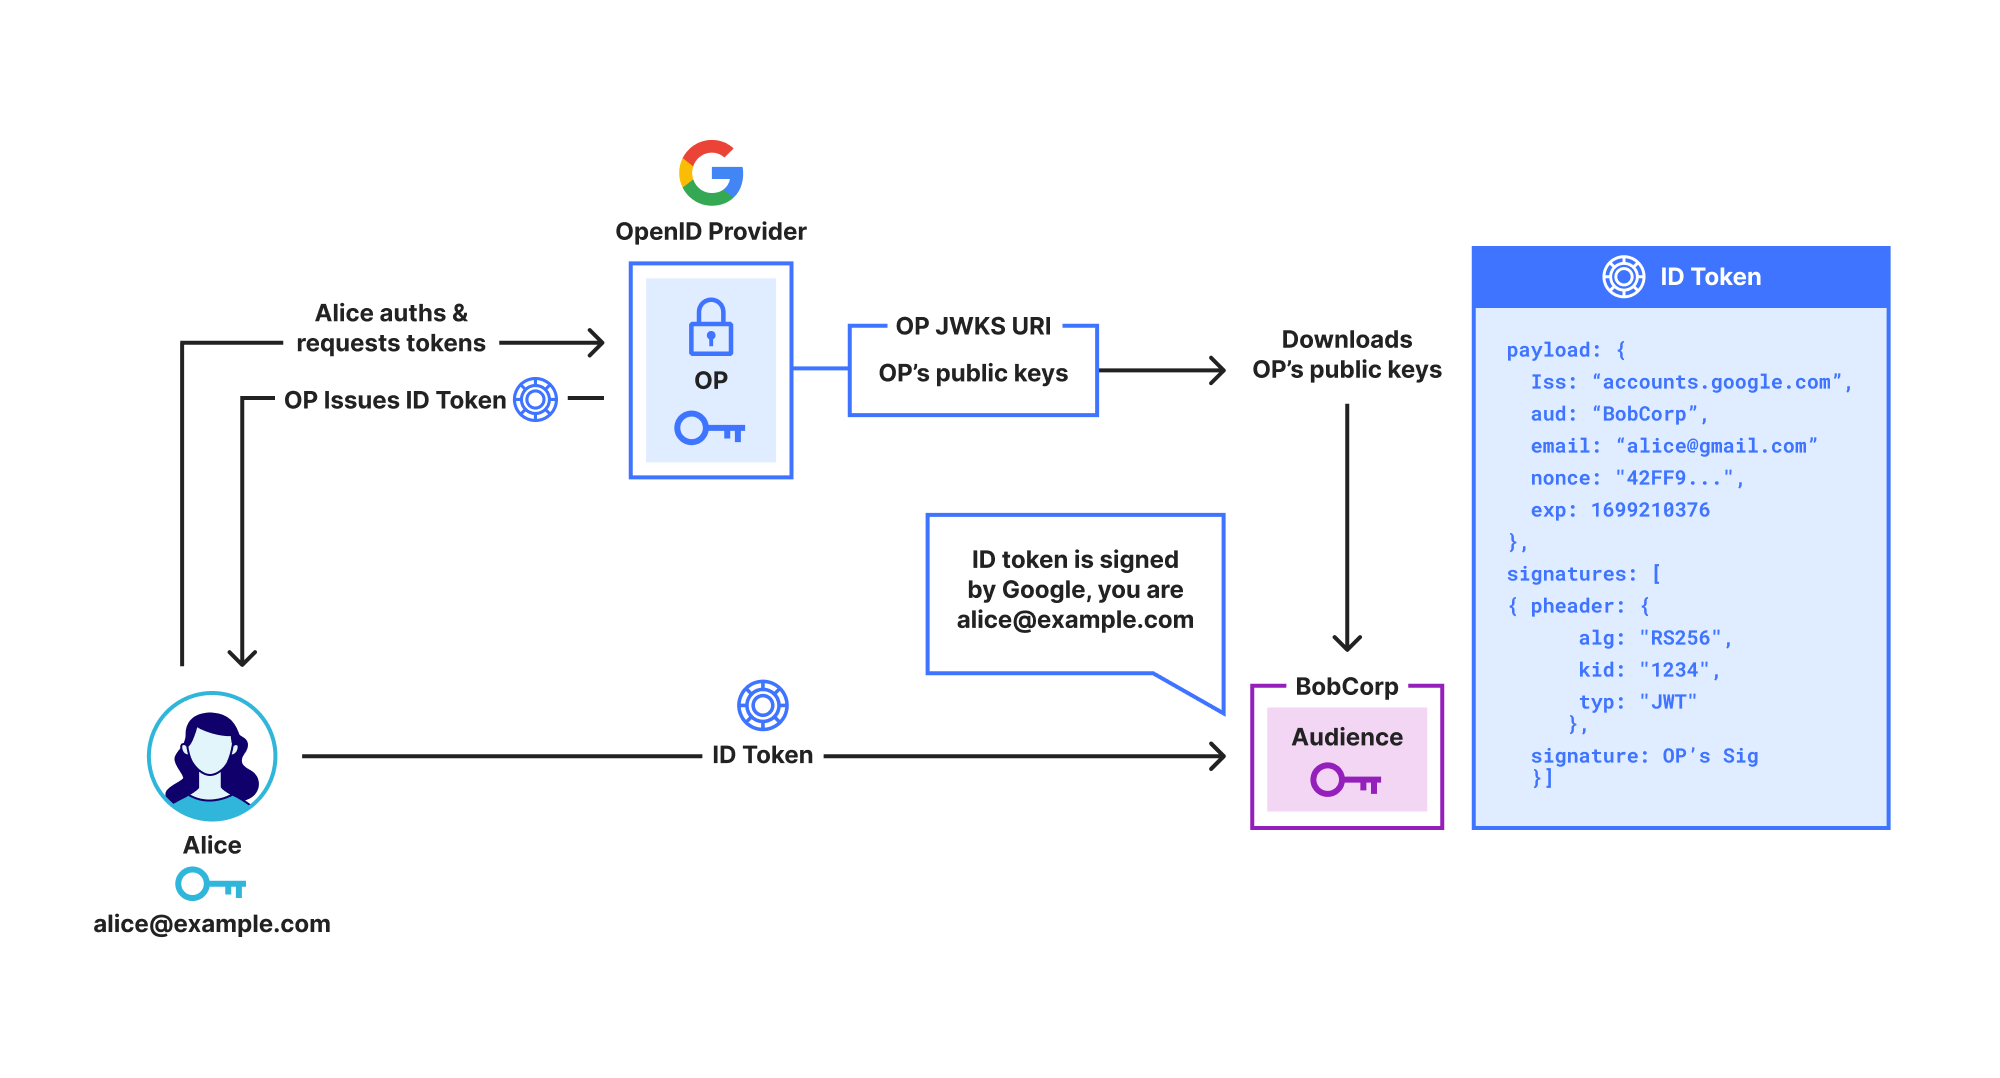
Shows a user Alice signing in to Google using OpenID Connect/OpenPubkey and then producing a PK Token
While OpenPubkey enables ID Tokens to be used as certificates, OPKSSH extends this functionality so that these ID Tokens can be used as SSH keys in the SSH protocol. This adds SSO authentication to SSH without requiring changes to the SSH protocol.
OPKSSH frees users and administrators from the need to manage long-lived SSH keys, making SSH more secure and more convenient.
“In many organizations – even very security-conscious organizations – there are many times more obsolete authorized keys than they have employees. Worse, authorized keys generally grant command-line shell access, which in itself is often considered privileged. We have found that in many organizations about 10% of the authorized keys grant root or administrator access. SSH keys never expire.”
– Challenges in Managing SSH Keys – and a Call for Solutions by Tatu Ylonen (Inventor of SSH)
In SSH, users generate a long-lived SSH public key and SSH private key. To enable a user to access a server, the user or the administrator of that server configures that server to trust that user’s public key. Users must protect the file containing their SSH private key. If the user loses this file, they are locked out. If they copy their SSH private key to multiple computers or back up the key, they increase the risk that the key will be compromised. When a private key is compromised or a user no longer needs access, the user or administrator must remove that public key from any servers it currently trusts. All of these problems create headaches for users and administrators.
OPKSSH overcomes these issues:
Improved security: OPKSSH replaces long-lived SSH keys with ephemeral SSH keys that are created on-demand by OPKSSH and expire when they are no longer needed. This reduces the risk a private key is compromised, and limits the time period where an attacker can use a compromised private key. By default, these OPKSSH public keys expire every 24 hours, but the expiration policy can be set in a configuration file.
Improved usability: Creating an SSH key is as easy as signing in to an OP. This means that a user can SSH from any computer with opkssh installed, even if they haven’t copied their SSH private key to that computer.
To generate their SSH key, the user simply runs opkssh login, and they can use ssh as they typically do.
Improved visibility: OPKSSH moves SSH from authorization by public key to authorization by identity. If Alice wants to give Bob access to a server, she doesn’t need to ask for his public key, she can just add Bob’s email address [email protected] to the OPKSSH authorized users file, and he can sign in. This makes tracking who has access much easier, since administrators can see the email addresses of the authorized users.
OPKSSH does not require any code changes to the SSH server or client. The only change needed to SSH on the SSH server is to add two lines to the SSH config file. For convenience, we provide an installation script that does this automatically, as seen in the video below.
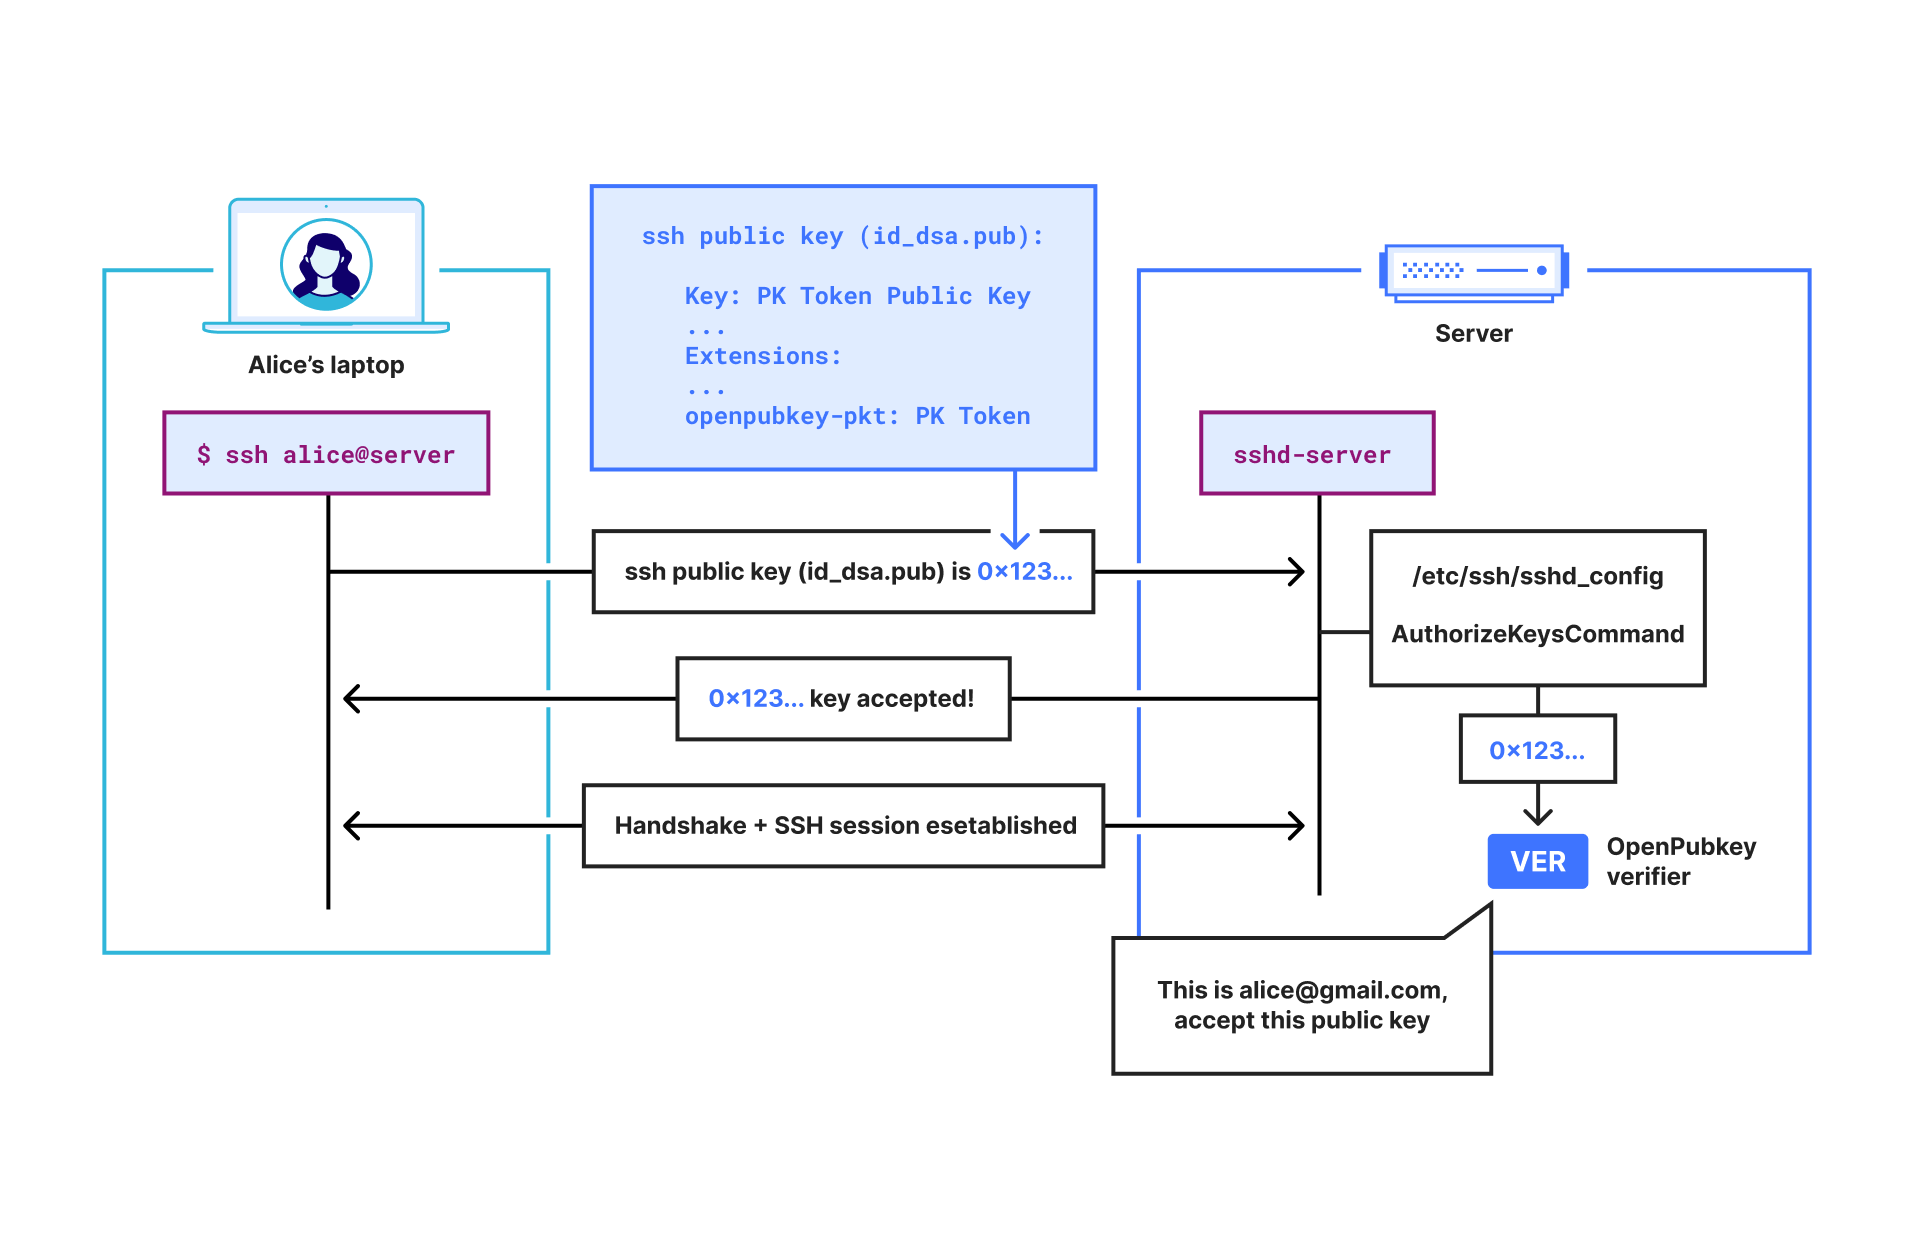
Shows a user Alice SSHing into a server with her PK Token inside her SSH public key. The server then verifies her SSH public key using the OpenPubkey verifier.
Let’s look at an example of Alice ([email protected]) using OPKSSH to SSH into a server:
-
Alice runs
opkssh login. This command automatically generates an ephemeral public key and private key for Alice. Then it runs the OpenPubkey protocol by opening a browser window and having Alice log in through their SSO provider, e.g., Google. -
If Alice SSOs successfully, OPKSSH will now have a PK Token that commits to Alice’s ephemeral public key and Alice’s identity. Essentially, this PK Token says “
[email protected]authenticated her identity and her public key is 0x123…”. -
OPKSSH then saves to Alice’s
.sshdirectory:-
an SSH public key file that contains Alice’s PK Token
-
and an SSH private key set to Alice’s ephemeral private key.
-
-
When Alice attempts to SSH into a server, the SSH client will find the SSH public key file containing the PK Token in Alice’s
.sshdirectory, and it will send it to the SSH server to authenticate. -
The SSH server forwards the received SSH public key to the OpenPubkey verifier installed on the SSH server. This is because the SSH server has been configured to use the OpenPubkey verifier via the AuthorizedKeysCommand.
-
The OpenPubkey verifier receives the SSH public key file and extracts the PK Token from it. It then verifies that the PK Token is unexpired, valid, signed by the OP and that the public key in the PK Token matches the public key field in the SSH public key file. Finally, it extracts the email address from the PK Token and checks if
[email protected]is allowed to SSH into this server.
Consider the problems we face in getting OpenPubkey to work with SSH without requiring any changes to the SSH protocol or software:
How do we get the PK Token from the user’s machine to the SSH server inside the SSH protocol?
We use the fact that SSH public keys can be SSH certificates, and that SSH certificates have an extension field that allows arbitrary data to be included in the certificate. Thus, we package the PK Token into an SSH certificate extension so that the PK Token will be transmitted inside the SSH public key as a normal part of the SSH protocol. This enables us to send the PK Token to the SSH server as additional data in the SSH certificate, and allows OPKSSH to work without any changes to the SSH client.
How do we check that the PK Token is valid once it arrives at the SSH server?
SSH servers support a configuration parameter called the AuthorizedKeysCommand that allows us to use a custom program to determine if an SSH public key is authorized or not. Thus, we change the SSH server’s config file to use the OpenPubkey verifier instead of the SSH verifier by making the following two line change to sshd_config:
AuthorizedKeysCommand /usr/local/bin/opkssh verify %u %k %t
AuthorizedKeysCommandUser root
The OpenPubkey verifier will check that the PK Token is unexpired, valid and signed by the OP. It checks the user’s email address in the PK Token to determine if the user is authorized to access the server.
How do we ensure that the public key in the PK Token is actually the public key that secures the SSH session?
The OpenPubkey verifier also checks that the public key in the public key field in the SSH public key matches the user’s public key inside the PK Token. This works because the public key field in the SSH public key is the actual public key that secures the SSH session.
We have open sourced OPKSSH under the Apache 2.0 license, and released it as openpubkey/opkssh on GitHub. While the OpenPubkey project has had code for using SSH with OpenPubkey since the early days of the project, this code was intended as a prototype and was missing many important features. With OPKSSH, SSH support in OpenPubkey is no longer a prototype and is now a complete feature. Cloudflare is not endorsing OPKSSH, but simply donating code to OPKSSH.
OPKSSH provides the following improvements to OpenPubkey:
-
Production ready SSH in OpenPubkey
-
Automated installation
-
Better configuration tools
See the OPKSSH readme for documentation on how to install and connect using OPKSSH.
There are a number of ways to get involved in OpenPubkey or OPKSSH. The project is organized through the OPKSSH GitHub. We are building an open and friendly community and welcome pull requests from anyone. If you are interested in contributing, see our contribution guide.
We run a community meeting every month which is open to everyone, and you can also find us over on the OpenSSF Slack in the #openpubkey channel.
[$] Development statistics for 6.14
Post Syndicated from corbet original https://lwn.net/Articles/1013892/
By the time that Linus Torvalds released
the 6.14 kernel, 11,003 non-merge changesets had been pulled into the
mainline, making this one of the smallest releases we have seen in some
time. Indeed, one must go back to the 4.0
release, which happened almost exactly ten years ago, to find a release
with fewer changesets than 6.14. Even so, “small” is relative, and 6.14
contains a lot of significant changes.
Monitoring Pure Storage FlashArray with Zabbix
Post Syndicated from Aleksandr Iantsen original https://blog.zabbix.com/monitoring-pure-storage-flasharray-with-zabbix/29752/
Monitoring data storage systems is the key to keeping modern IT systems running smoothly. With the rapid growth of data and the need for instant access, using high-performance solutions like Pure Storage FlashArray is not just an advantage – it’s a necessity. However, even the most advanced systems require careful oversight regarding their performance and health. Good monitoring helps find problems early and makes it possible to use resources more efficiently. In this article, we will explore how to set up monitoring for the Pure Storage FlashArray storage system with Zabbix using our new templates.
Pure Storage FlashArray offers two API versions: REST API 1.X and REST API 2.X. To ensure compatibility and comprehensive coverage for the maximum number of devices, two templates have been developed for these API versions. This allows users to effectively monitor their Pure Storage FlashArray storage systems regardless of which API version they are utilizing, making sure that they can take full advantage of the monitoring capabilities and performance metrics provided by each version. By accommodating both API versions, organizations can achieve a more flexible and comprehensive monitoring setup tailored to meet their specific infrastructure needs.
Table of Contents
Preparing Pure Storage FlashArray for monitoring with Zabbix
In all of these examples, the Purity for FlashArray (Purity//FA) graphical user interface (GUI) will be used, so keep in mind that some of the UI elements or navigation menus can potentially change in the future.
User creation
First of all, you need to set up a user in GUI that Zabbix will use to access the REST API and gather data. To do so, navigate to 'Settings' -> 'Users and Policies' -> 'Users' from the left-side menu. On this page, pay attention to the ‘Users’ block. In the upper right corner of this block, you will see three dots. Click on them to open a context menu. In this menu, select the 'Create User...' option. Here, create a new user by filling in the fields.


API Key creation
Unlike Pure Storage FlashArray v2 by HTTP, Pure Storage FlashArray v1 by HTTP supports authentication using a username and password instead of a token. This feature is left for backward compatibility with older versions of devices and firmware. However, it is strongly recommended to use token authentication if there are no technical limitations.
If you do plan to use username and password authentication in the Pure Storage FlashArray v1 by HTTP template, you can skip this step and move on to the next one.
Once you have created the user, the next step is to generate an API token. To do this, find the newly created user in the 'Users' block on the 'Settings' -> 'Users and Policies' page. On the right side of the user’s entry, locate the three dots and click on them to open the menu. From this menu, select 'Create API Token...'. Follow the prompts to generate the API token, which Zabbix will use to authenticate requests. The 'Expires In' field can be left empty.


After clicking the Create button, the GUI will show you details about the API key. Save this information somewhere safe for now, as we will need to use this data later in Zabbix. After saving, you can close this pop-up.

Preparing Zabbix
Create a host
Open your Zabbix web interface, then navigate to the ‘Configuration' -> 'Hosts‘ page and create a new host. In this step, you need to specify a host name of your choice, so choose one of the Pure Storage FlashArray v1 by HTTP or Pure Storage FlashArray v2 by HTTP templates and assign the host to a group. The choice of template depends on the version of the Pure Storage FlashArray RESTful API that is supported by your devices.

Before clicking the Add button, you need to configure macros. Open the Macros tab and choose both Inherited and host macros. You’ll find a lot of macros there, but only a few of them need to be changed to start using the template. Let’s take a look at these macros.
Macro list in the Pure Storage FlashArray v1 by HTTP template:
| Macro | Default value | Description |
|---|---|---|
{$PURE.FLASHARRAY.API.URL} |
– | Web interface URL. |
{$PURE.FLASHARRAY.API.TOKEN} |
– | API token. |
{$PURE.FLASHARRAY.API.USERNAME} |
– | Web interface username. |
{$PURE.FLASHARRAY.API.PASSWORD} |
– | Web interface password. |
{$PURE.FLASHARRAY.API.VERSION} |
1.19 | API version. |
For the Pure Storage FlashArray v1 by HTTP template, it is mandatory to specify the {$PURE.FLASHARRAY.API.URL} macro, as well as either the {$PURE.FLASHARRAY.API.TOKEN} or {$PURE.FLASHARRAY.API.USERNAME} and {$PURE.FLASHARRAY.API.PASSWORD}. It is highly recommended to use a token for authentication.
Macro list in the Pure Storage FlashArray v2 by HTTP template:
| Macro | Default value | Description |
|---|---|---|
{$PURE.FLASHARRAY.API.URL} |
– | Web interface URL. |
{$PURE.FLASHARRAY.API.TOKEN} |
– | API token. |
{$PURE.FLASHARRAY.API.VERSION} |
2.36 | API version. |
For the Pure Storage FlashArray v2 by HTTP template, it is mandatory to specify just the {$PURE.FLASHARRAY.API.URL} and {$PURE.FLASHARRAY.API.TOKEN} macros to start using the template.
You can change the value for the {$PURE.FLASHARRAY.API.VERSION} macro if your device does not support this version of the API.
After specifying at least the mandatory macro values, your Macros tab should look something like this:
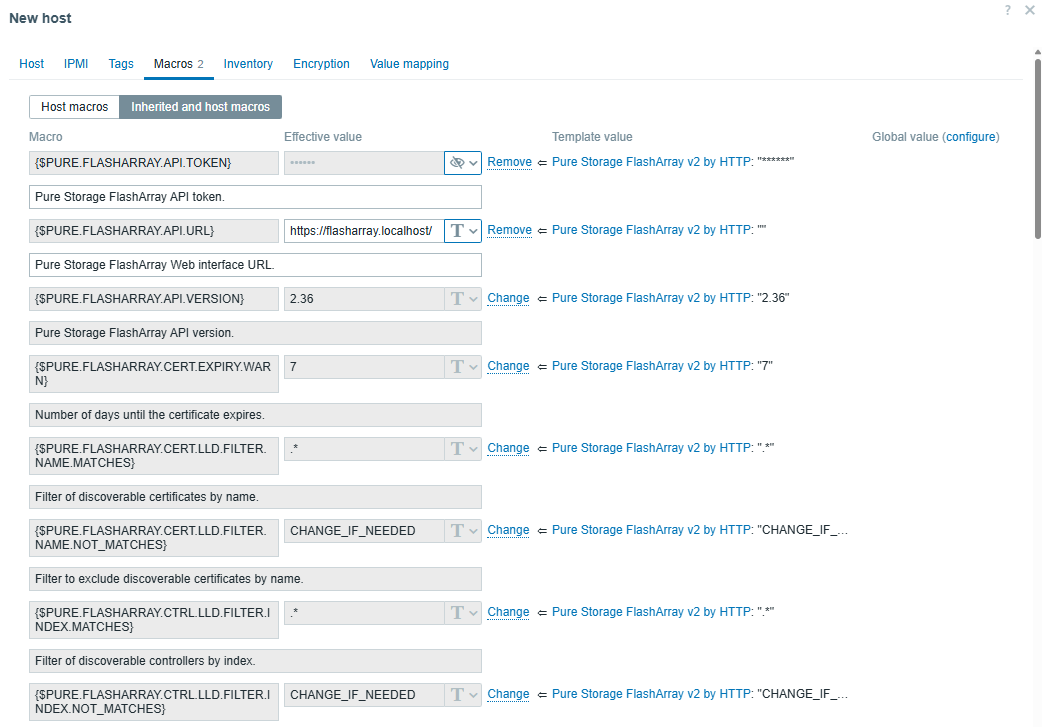
After clicking the Add button, this host will be added to Zabbix.
Data collection
After following the above steps, you should notice the newly created triggers and items after a short time if the macro values are correct.
In case there are any problems with the template’s data collection, you will find errors in the last history data of items with a name ending with item errors. Also, the corresponding triggers should be fired if there are any problems with the collection of any data.
After that, you should see newly discovered items in the Items view (for example).
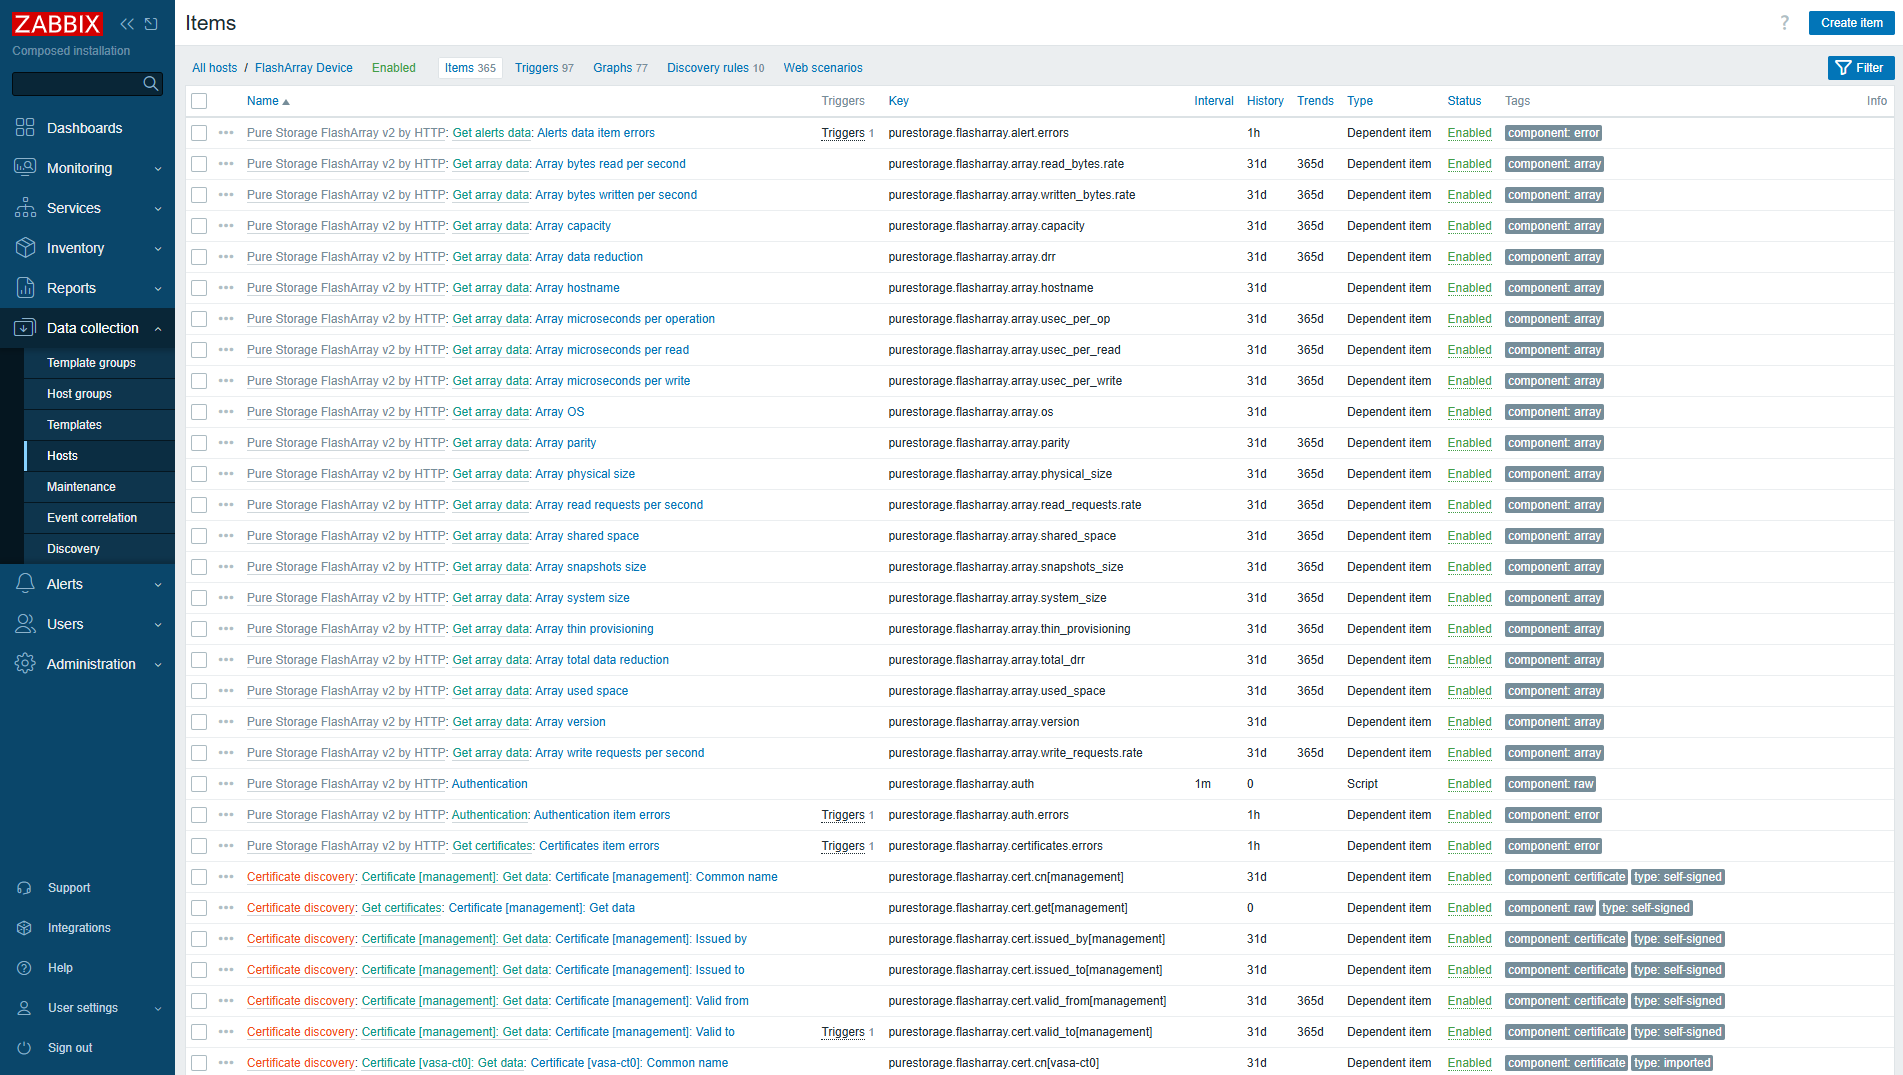
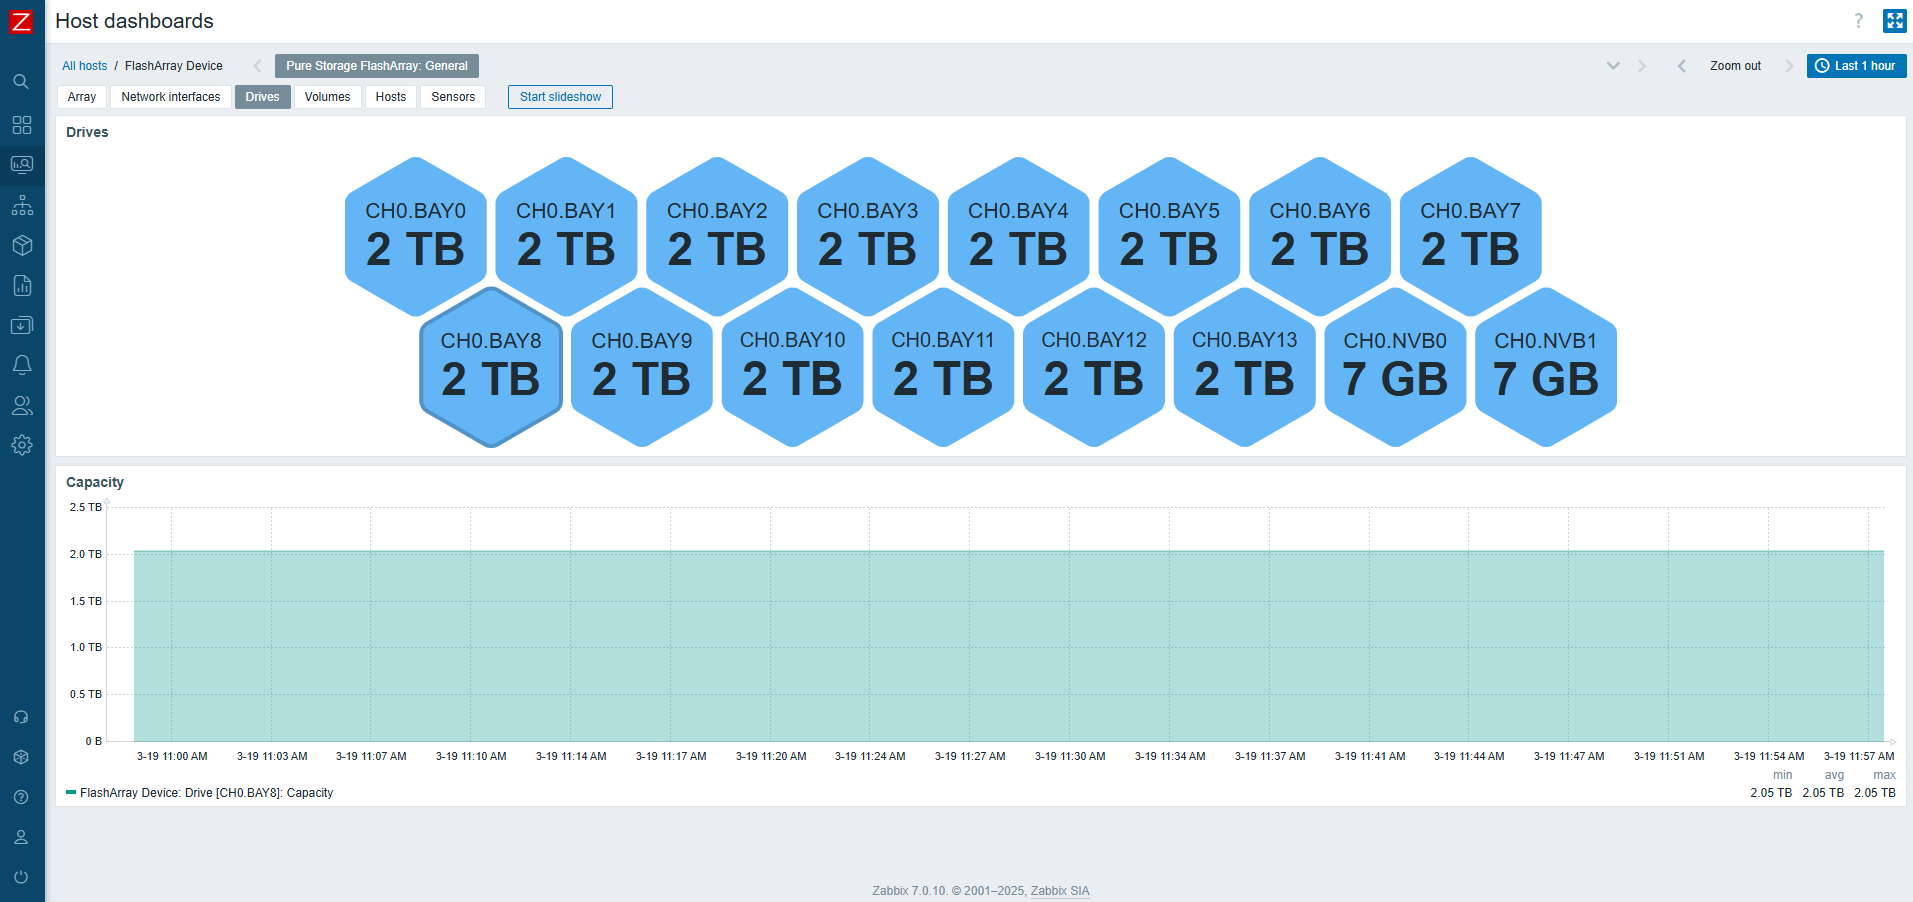
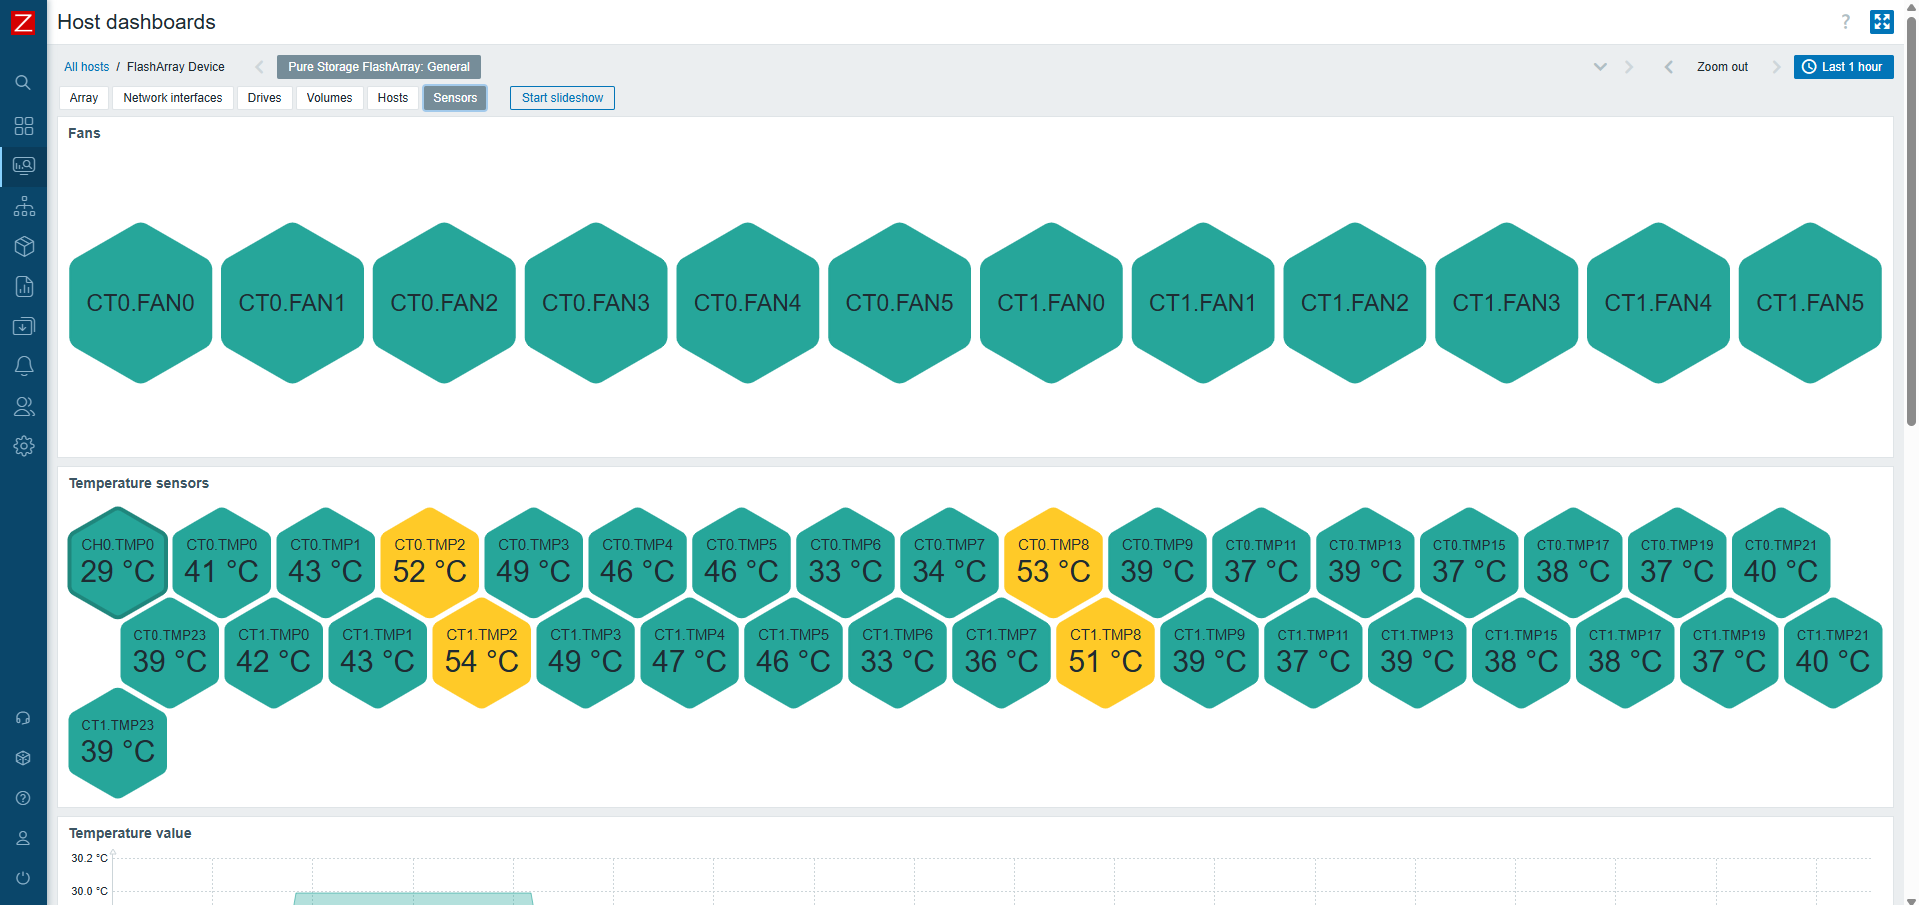
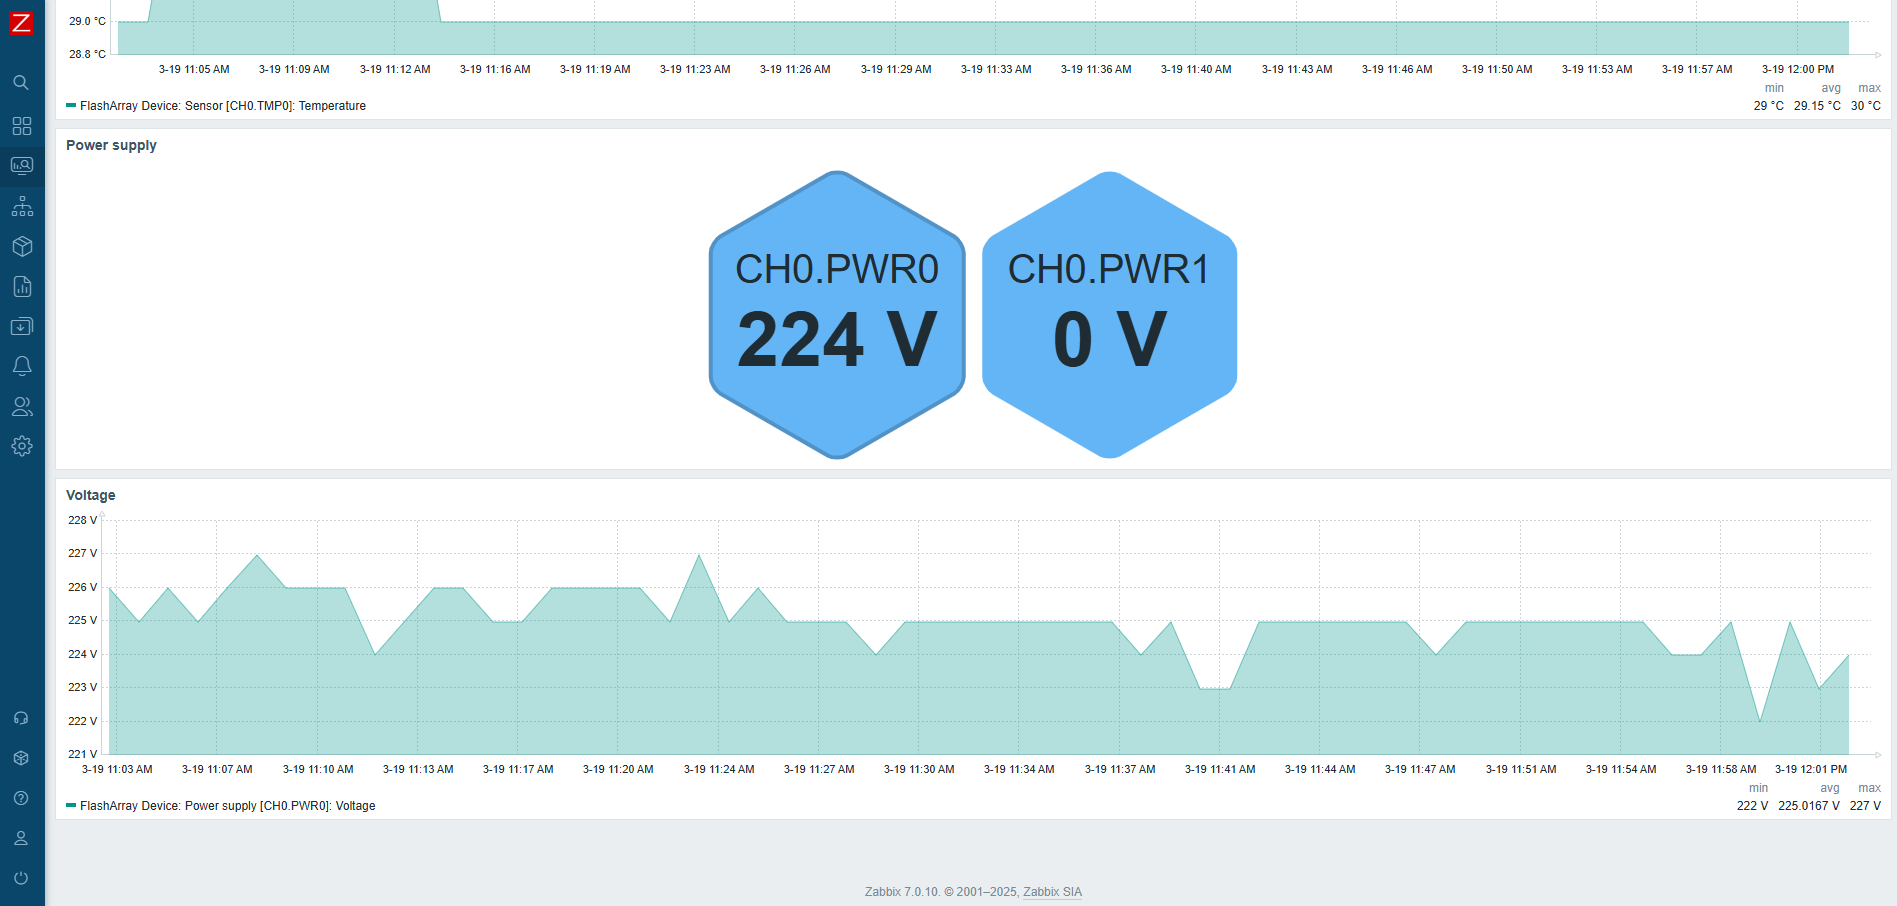
On top of that, each host will have its own dashboard created automatically that will provide you with a good overview of resource utilization.
Use macros for low-level discovery filtering
In official Zabbix templates, you might find macros that end with MATCHES and NOT_MATCHES. These are used for low-level discovery rules (LLDs), to help you filter resources that should or should not be discovered. These values use regular expressions. Therefore, you can use wildcard symbols for pattern matching.
Usage of these macros can be found in the Filters tab, under discovery rules.
The typical default value for MATCHES is .* and for NOT_MATCHES – CHANGE_IF_NEEDED. This means that any kind of value will be discovered if it is not equal to CHANGE_IF_NEEDED. For example, in Network interface discovery, filters are used to check the interface name:
- Macro
{$PURE.FLASHARRAY.NETIF.LLD.FILTER.NAME.MATCHES}has a value of.*; - Macro
{$PURE.FLASHARRAY.NETIF.LLD.FILTER.NAME.NOT_MATCHES}has a value ofCHANGE_IF_NEEDED.
You can set the value of macro {$PURE.FLASHARRAY.NETIF.LLD.FILTER.NAME.NOT_MATCHES}filevip, which will cause an interface named filevip to not be discovered.
Now that you have an idea how these filters work, you can adjust them based on your requirements.
HTTP proxy usage
If needed, you can specify an HTTP proxy for the template to use by changing the value of the{$PURE.FLASHARRAY.HTTP_PROXY} user macro. Every request will use this proxy.
Afterword
To wrap things up, setting up monitoring for Pure Storage FlashArray devices in Zabbix is an important step that guarantees the smooth operation of your infrastructure. I hope that our new templates will help you manage and monitor your devices more effectively.
This short article has been created to provide you with the necessary knowledge and tools to set up a monitoring system that meets your specific needs. By enabling efficient monitoring, you will be better equipped to respond to changes in system performance and maintain optimal operation. I believe this material will be valuable in helping you achieve these goals!
The post Monitoring Pure Storage FlashArray with Zabbix appeared first on Zabbix Blog.
Security updates for Tuesday
Post Syndicated from corbet original https://lwn.net/Articles/1015377/
Security updates have been issued by Debian (ruby-rack), Fedora (chromium, golang-github-openprinting-ipp-usb, OpenIPMI, and python-jinja2), Mageia (kernel, kernel-linus, and wpa_supplicant, hostapd), Red Hat (fence-agents, kernel, kernel-rt, libxml2, libxslt, and pcs), SUSE (cadvisor, docker, freetype2, nodejs-electron, php8, rsync, u-boot, warewulf4, webkit2gtk3, and zvbi), and Ubuntu (elfutils, python3.5, python3.8, ruby-rack, smartdns, and zvbi).
Report on Paragon Spyware
Post Syndicated from Bruce Schneier original https://www.schneier.com/blog/archives/2025/03/report-on-paragon-spyware.html
Citizen Lab has a new report on Paragon’s spyware:
Key Findings:
- Introducing Paragon Solutions. Paragon Solutions was founded in Israel in 2019 and sells spyware called Graphite. The company differentiates itself by claiming it has safeguards to prevent the kinds of spyware abuses that NSO Group and other vendors are notorious for.
- Infrastructure Analysis of Paragon Spyware. Based on a tip from a collaborator, we mapped out server infrastructure that we attribute to Paragon’s Graphite spyware tool. We identified a subset of suspected Paragon deployments, including in Australia, Canada, Cyprus, Denmark, Israel, and Singapore.
- Identifying a Possible Canadian Paragon Customer. Our investigation surfaced potential links between Paragon Solutions and the Canadian Ontario Provincial Police, and found evidence of a growing ecosystem of spyware capability among Ontario-based police services.
- Helping WhatsApp Catch a Zero-Click. We shared our analysis of Paragon’s infrastructure with Meta, who told us that the details were pivotal to their ongoing investigation into Paragon. WhatsApp discovered and mitigated an active Paragon zero-click exploit, and later notified over 90 individuals who it believed were targeted, including civil society members in Italy.
- Android Forensic Analysis: Italian Cluster. We forensically analyzed multiple Android phones belonging to Paragon targets in Italy (an acknowledged Paragon user) who were notified by WhatsApp. We found clear indications that spyware had been loaded into WhatsApp, as well as other apps on their devices.
- A Related Case of iPhone Spyware in Italy. We analyzed the iPhone of an individual who worked closely with confirmed Android Paragon targets. This person received an Apple threat notification in November 2024, but no WhatsApp notification. Our analysis showed an attempt to infect the device with novel spyware in June 2024. We shared details with Apple, who confirmed they had patched the attack in iOS 18.
- Other Surveillance Tech Deployed Against The Same Italian Cluster. We also note 2024 warnings sent by Meta to several individuals in the same organizational cluster, including a Paragon victim, suggesting the need for further scrutiny into other surveillance technology deployed against these individuals.
Home Assistant 2025.4 Release Party
Post Syndicated from Home Assistant original https://www.youtube.com/watch?v=-w9IBKg5RAw
Politicians Think Voters Are Dumb. Are They Right?
Post Syndicated from The Atlantic original https://www.youtube.com/watch?v=bE1_JDe8ajc
Cloudflare incident on March 21, 2025
Post Syndicated from Phillip Jones original https://blog.cloudflare.com/cloudflare-incident-march-21-2025/
Multiple Cloudflare services, including R2 object storage, experienced an elevated rate of errors for 1 hour and 7 minutes on March 21, 2025 (starting at 21:38 UTC and ending 22:45 UTC). During the incident window, 100% of write operations failed and approximately 35% of read operations to R2 failed globally. Although this incident started with R2, it impacted other Cloudflare services including Cache Reserve, Images, Log Delivery, Stream, and Vectorize.
While rotating credentials used by the R2 Gateway service (R2’s API frontend) to authenticate with our storage infrastructure, the R2 engineering team inadvertently deployed the new credentials (ID and key pair) to a development instance of the service instead of production. When the old credentials were deleted from our storage infrastructure (as part of the key rotation process), the production R2 Gateway service did not have access to the new credentials. This ultimately resulted in R2’s Gateway service being able to authenticate with our storage backend. There was no data loss or corruption that occurred as part of this incident: any in-flight uploads or mutations that returned successful HTTP status codes were persisted.
Once the root cause was identified and we realized we hadn’t deployed the new credentials to the production R2 Gateway service, we deployed the updated credentials and service availability was restored.
This incident happened because of human error and lasted longer than it should have because we didn’t have proper visibility into which credentials were being used by the Gateway Worker to authenticate with our storage infrastructure.
We’re deeply sorry for this incident and the disruption it may have caused to you or your users. We hold ourselves to a high standard and this is not acceptable. This blog post exactly explains the impact, what happened and when, and the steps we are taking to make sure this failure (and others like it) doesn’t happen again.
The primary incident window occurred between 21:38 UTC and 22:45 UTC.
The following table details the specific impact to R2 and Cloudflare services that depend on, or interact with, R2:
| Product/Service | Impact |
|---|---|
| R2 | All customers using Cloudflare R2 would have experienced an elevated error rate during the primary incident window. Specifically:
* Object write operations had a 100% error rate. * Object reads had an approximate error rate of 35% globally. Individual customer error rate varied during this window depending on access patterns. Customers accessing public assets through custom domains would have seen a reduced error rate as cached object reads were not impacted. * Operations involving metadata only (e.g., head and list operations) were not impacted. There was no data loss or risk to data integrity within R2’s storage subsystem. This incident was limited to a temporary authentication issue between R2’s API frontend and our storage infrastructure. |
| Billing | Billing uses R2 to store customer invoices. During the primary incident window, customers may have experienced errors when attempting to download/access past Cloudflare invoices. |
| Cache Reserve | Cache Reserve customers observed an increase in requests to their origin during the incident window as an increased percentage of reads to R2 failed. This resulted in an increase in requests to origins to fetch assets unavailable in Cache Reserve during this period.
User-facing requests for assets to sites with Cache Reserve did not observe failures as cache misses failed over to the origin. |
| Email Security | Email Security depends on R2 for customer-facing metrics. During the primary incident window, customer-facing metrics would not have updated. |
| Images | All (100% of) uploads failed during the primary incident window. Successful delivery of stored images dropped to approximately 25%. |
| Key Transparency Auditor | All (100% of) operations failed during the primary incident window due to dependence on R2 writes and/or reads. Once the incident was resolved, service returned to normal operation immediately. |
| Log Delivery | Log delivery (for Logpush and Logpull) was delayed during the primary incident window, resulting in significant delays (up to 70 minutes) in log processing. All logs were delivered after incident resolution. |
| Stream | All (100% of) uploads failed during the primary incident window. Successful Stream video segment delivery dropped to 94%. Viewers may have seen video stalls every minute or so, although actual impact would have varied.
Stream Live was down during the primary incident window as it depends on object writes. |
| Vectorize | Queries and operations against Vectorize indexes were impacted during the incident window. During the incident window, Vectorize customers would have seen an increased error rate for read queries to indexes and all (100% of) insert and upsert operation failed as Vectorize depends on R2 for persistent storage. |
All timestamps referenced are in Coordinated Universal Time (UTC).
| Time | Event |
|---|---|
| Mar 21, 2025 – 19:49 UTC | The R2 engineering team started the credential rotation process. A new set of credentials (ID and key pair) for storage infrastructure was created. Old credentials were maintained to avoid downtime during credential change over. |
| Mar 21, 2025 – 20:19 UTC | Set updated production secret (wrangler secret put) and executed wrangler deploy command to deploy R2 Gateway service with updated credentials.
Note: We later discovered the –env parameter was inadvertently omitted for both Wrangler commands. This resulted in credentials being deployed to the Worker assigned to the default environment instead of the Worker assigned to the production environment. |
| Mar 21, 2025 – 20:20 UTC | The R2 Gateway service Worker assigned to the default environment is now using the updated storage infrastructure credentials.
Note: This was the wrong Worker, the production environment should have been explicitly set. But, at this point, we incorrectly believed the credentials were updated on the correct production Worker. |
| Mar 21, 2025 – 20:37 UTC | Old credentials were removed from our storage infrastructure to complete the credential rotation process. |
| Mar 21, 2025 – 21:38 UTC | – IMPACT BEGINS –
R2 availability metrics begin to show signs of service degradation. The impact to R2 availability metrics was gradual and not immediately obvious because there was a delay in the propagation of the previous credential deletion to storage infrastructure. |
| Mar 21, 2025 – 21:45 UTC | R2 global availability alerts are triggered (indicating 2% of error budget burn rate).
The R2 engineering team began looking at operational dashboards and logs to understand impact. |
| Mar 21, 2025 – 21:50 UTC | Internal incident declared. |
| Mar 21, 2025 – 21:51 UTC | R2 engineering team observes gradual but consistent decline in R2 availability metrics for both read and write operations. Operations involving metadata only (e.g., head and list operations) were not impacted.
Given gradual decline in availability metrics, R2 engineering team suspected a potential regression in propagation of new credentials in storage infrastructure. |
| Mar 21, 2025 – 22:05 UTC | Public incident status page published. |
| Mar 21, 2025 – 22:15 UTC | R2 engineering team created a new set of credentials (ID and key pair) for storage infrastructure in an attempt to force re-propagation.
Continued monitoring operational dashboards and logs. |
| Mar 21, 2025 – 22:20 UTC | R2 engineering team saw no improvement in availability metrics. Continued investigating other potential root causes. |
| Mar 21, 2025 – 22:30 UTC | R2 engineering team deployed a new set of credentials (ID and key pair) to R2 Gateway service Worker. This was to validate whether there was an issue with the credentials we had pushed to gateway service.
Environment parameter was still omitted in the deploy and secret put commands, so this deployment was still to the wrong non-production Worker. |
| Mar 21, 2025 – 22:36 UTC | – ROOT CAUSE IDENTIFIED –
The R2 engineering team discovered that credentials had been deployed to a non-production Worker by reviewing production Worker release history. |
| Mar 21, 2025 – 22:45 UTC | – IMPACT ENDS –
Deployed credentials to correct production Worker. R2 availability recovered. |
| Mar 21, 2025 – 22:54 UTC | The incident is considered resolved. |
R2’s architecture is primarily composed of three parts: R2 production gateway Worker (serves requests from S3 API, REST API, Workers API), metadata service, and storage infrastructure (stores encrypted object data).
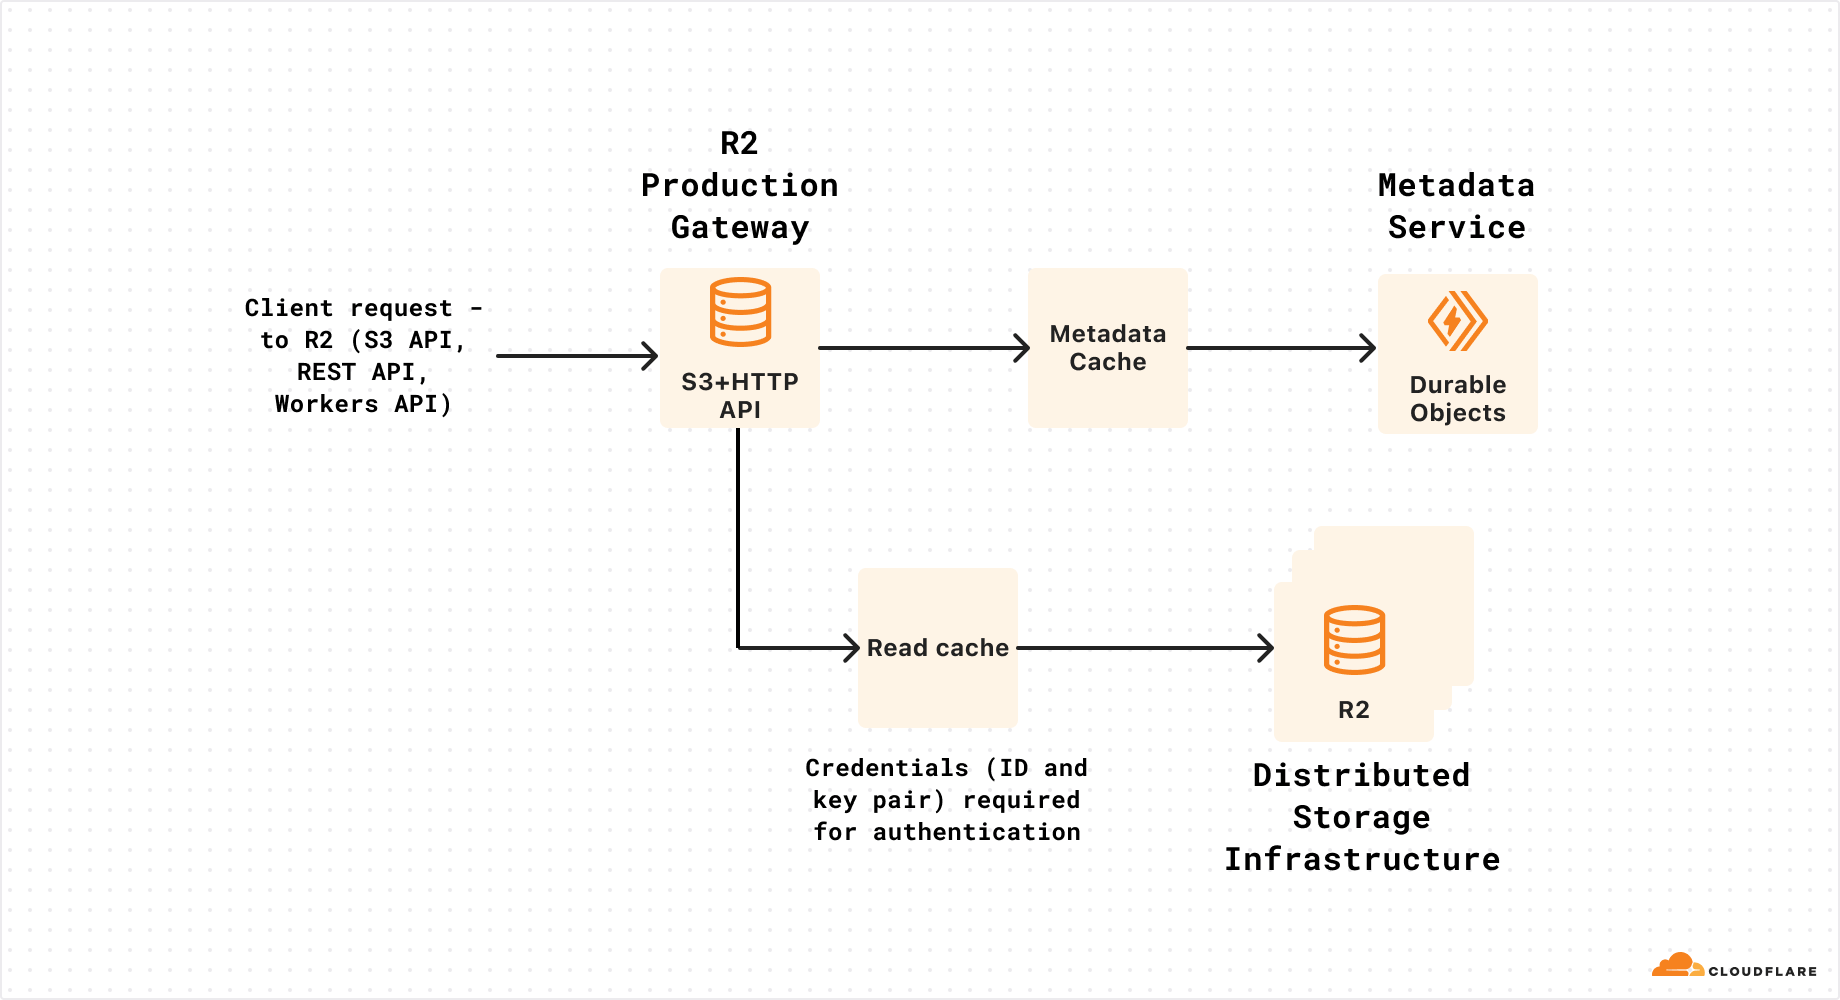
The R2 Gateway Worker uses credentials (ID and key pair) to securely authenticate with our distributed storage infrastructure. We rotate these credentials regularly as a best practice security precaution.
Our key rotation process involves the following high-level steps:
-
Create a new set of credentials (ID and key pair) for our storage infrastructure. At this point, the old credentials are maintained to avoid downtime during credential change over.
-
Set the new credential secret for the R2 production gateway Worker using the
wrangler secret putcommand. -
Set the new updated credential ID as an environment variable in the R2 production gateway Worker using the
wrangler deploycommand. At this point, new storage credentials start being used by the gateway Worker. -
Remove previous credentials from our storage infrastructure to complete the credential rotation process.
-
Monitor operational dashboards and logs to validate change over.
The R2 engineering team uses Workers environments to separate production and development environments for the R2 Gateway Worker. Each environment defines a separate isolated Cloudflare Worker with separate environment variables and secrets.
Critically, both wrangler secret put and wrangler deploy commands default to the default environment if the –env command line parameter is not included. In this case, due to human error, we inadvertently omitted the –env parameter and deployed the new storage credentials to the wrong Worker (default environment instead of production). To correctly deploy storage credentials to the production R2 Gateway Worker, we need to specify --env production.
The action we took on step 4 above to remove the old credentials from our storage infrastructure caused authentication errors, as the R2 Gateway production Worker still had the old credentials. This is ultimately what resulted in degraded availability.
The decline in R2 availability metrics was gradual and not immediately obvious because there was a delay in the propagation of the previous credential deletion to storage infrastructure. This accounted for a delay in our initial discovery of the problem. Instead of relying on availability metrics after updating the old set of credentials, we should have explicitly validated which token was being used by the R2 Gateway service to authenticate with R2’s storage infrastructure.
Overall, the impact on read availability was significantly mitigated by our intermediate cache that sits in front of storage and continued to serve requests.
Once we identified the root cause, we were able to resolve the incident quickly by deploying the new credentials to the production R2 Gateway Worker. This resulted in an immediate recovery of R2 availability.
This incident happened because of human error and lasted longer than it should have because we didn’t have proper visibility into which credentials were being used by the R2 Gateway Worker to authenticate with our storage infrastructure.
We have taken immediate steps to prevent this failure (and others like it) from happening again:
-
Added logging tags that include the suffix of the credential ID the R2 Gateway Worker uses to authenticate with our storage infrastructure. With this change, we can explicitly confirm which credential is being used.
-
Related to the above step, our internal processes now require explicit confirmation that the suffix of the new token ID matches logs from our storage infrastructure before deleting the previous token.
-
Require that key rotation takes place through our hotfix release tooling instead of relying on manual wrangler command entry which introduces human error. Our hotfix release deploy tooling explicitly enforces the environment configuration and contains other safety checks.
-
While it’s been an implicit standard that this process involves at least two humans to validate the changes ahead as we progress, we’ve updated our relevant SOPs (standard operating procedures) to include this explicitly.
-
In Progress: Extend our existing closed loop health check system that monitors our endpoints to test new keys, automate reporting of their status through our alerting platform, and ensure global propagation prior to releasing the gateway Worker.
-
In Progress: To expedite triage on any future issues with our distributed storage endpoints, we are updating our observability platform to include views of upstream success rates that bypass caching to give clearer indication of issues serving requests for any reason.
The list above is not exhaustive: as we work through the above items, we will likely uncover other improvements to our systems, controls, and processes that we’ll be applying to improve R2’s resiliency, on top of our business-as-usual efforts. We are confident that this set of changes will prevent this failure, and related credential rotation failure modes, from occurring again. Again, we sincerely apologize for this incident and deeply regret any disruption it has caused you or your users.
The Trump Administration Accidentally Texted Our Editor Their War Plans
Post Syndicated from The Atlantic original https://www.youtube.com/watch?v=HFunw-2jKKc
Death of Elizabeth I
Post Syndicated from The History Guy: History Deserves to Be Remembered original https://www.youtube.com/watch?v=xxIqzIK4XrE