От тогава доста хора споделиха в социалните мрежи и коментарите тук какъв е бил опита им. След като минаха летните отпуски, реших да попитам НЗОК все пак колко хора все пак са се възползвали спрямо общия брой изкарани карти. Ето какво научих.
През януари 2022 е подадено едно заявление през ССЕВ – моето. След три месеца увещаване получих картата си през април. Тогава писах за пръв път за случая в twitter. Според предоставените данни, следващите подадени заявления са чак август – общо 12. Три от тях са отново от мен за останалите от семейството ми. След това има между по 2 до 11 между ноември и април 2023. През май тази година пуснах още 4 заявления, за да обновя картите. Още 13 души са подали тогава.
В края на юни пуснах статията си как работи процеса и 58 души са го използвал. През юли вече беше копиран текста от няколко медии и 195 са подали заявление, а през август и септември – още общо 209. Откакто показах, че може и следва да е опция, над 400 души са попълнили заявлението и са получили картите с куриер.
За сравнение, от началото на 2022-ра до края на септември 2023 са били издадени 283625 карти на гише. Приемайки, че в този период някои са били преиздадени, това означава, че поне 164 хиляди души са се редели два пъти почти изцяло в клонове на партньорските им банки, за да си вземат картите от НЗОК.
Подновените карти са 60% от всички издадени. За такива се считат всички карти на хора, които някога са си изваждали ЕЗОК. Забелязва се сериозно покачване на новоиздадените карти през това лято, отчасти заради кампания в медиите колко са полезни всъщност. Интересно е, че немалко количество карти се издават в рамките на цялата година, не само през летните месеци, когато е основният поток от пътувания зад граница. Кривата съвпада доста добре с тази на излизащите от страната с цел почивка. Закономерно се вижда пик през юни и юли, т.е. преди летните отпуски.
Интересно наблюдение е, че немалка част от картите издадени пред 2022-ра не се преиздават скоро след изтичането на едногодишния им срок през 2023-та. Пикът това лято е основно от нови карти. Има обаче поне една група от около 100 хиляди души, които редовно си обновяват картите. Може да свалите всички числа от отговора на НЗОК тук.
Тук отново изниква въпроса защо е нужно всичко това. Обяснението на НЗОК от край време е, за да се пресичат злоупотребите. Попитах колко притежатели на карти са губили здравните си права докато са имали активна карта. Казаха ми, че не знаят. Причината е, че не го следят активно, а при искане за покриване на лечение. Отделно се оказа, че НЗОК нямат справка в реално време кой си плаща здравните вноски и кой не – налага се индивидуално да проверяват всеки за конкретен период през интерфейс на НАП. Това, както сами се сещате, е абсурдно на много нива.
Това, което ми отговориха обаче е, че от 140669 заявления подадени по какъвто и да е начин през 2022-ра, 2371 или 1.69% са били отказани заради прекъснати здравни права. Това число и съответно процент намалява значително откакто има ЕЗОК – от 5662 в 2013, през 4374 през 2018 до наполовина сега спрямо преди 10 години. Така смисълът от краткия срок на тези карти се обезсмисля, предвид, че разходът за издаването всяка година, разпространението и времето, което хората губят е повече, отколкото потенциалните щети за касата.
Докато някой в НЗОК започне да мисли за този и други далеч по-тежки пороци в системата, това, което огромна част от хората губещи време по каси и банки могат да направят е да използват дистанционния вариант. Това, с което Министерството за електронното управление от една страна и здравеопазването от друга могат да спомогнат, е да се направи прост формуляр, което да попълва всичко автоматично. Особено предвид, че 90% от информацията изисквана в наредбата е достъпна служебно правейки наредбата противозаконна.
Към този момент под 0.78% от ЕЗОК издадени след статията ми са били поискани през ССЕВ. Не съм фен на оптимизирането на процеси, които не следва да съществуват на първо място, но това тук е полезно упражнение в комуникация и честно казано – обучение на собствените ни институции. По този начин съм подавал както адресна регистрация, така и искания за акт за раждане, заявления по ЗДОИ и други документи.
From customer interactions on e-commerce platforms to social media trends and from sensor data in internet of things (IoT) devices to financial market updates, streaming data encompasses a vast array of information. This ability to handle real-time flow often distinguishes successful organizations from their competitors. Harnessing the potential of streaming data processing offers organizations an opportunity to stay at the forefront of their industries, make data-informed decisions with unprecedented agility, and gain invaluable insights into customer behavior and operational efficiency.
AWS provides a foundation for building robust and reliable data pipelines that efficiently transport streaming data, eliminating the intricacies of infrastructure management. This shift empowers engineers to focus their talents and energies on creating business value, rather than consuming their time for managing infrastructure.
In a world of exploding data, traditional on-premises analytics struggle to scale and become cost-prohibitive. Modern data architecture on AWS offers a solution. It lets organizations easily access, analyze, and break down data silos, all while ensuring data security. This empowers real-time insights and versatile applications, from live dashboards to data lakes and warehouses, transforming the way we harness data.
This whitepaper guides you through implementing this architecture, focusing on streaming technologies. It simplifies data collection, management, and analysis, offering three movement patterns to glean insights from near real-time data using AWS’s tailored analytics services. The future of data analytics has arrived.
In this workshop, you’ll see how to process data in real-time, using streaming and micro-batching technologies in the context of anomaly detection. You will also learn how to integrate Apache Kafka on Amazon Managed Streaming for Apache Kafka (Amazon MSK) with an Apache Flink consumer to process and aggregate the events for reporting purposes.
Streaming architectures built on Apache Kafka follow the publish/subscribe paradigm: producers publish events to topics via a write operation and the consumers read the events.
This video describes how to offer a real-time financial data feed as a service on AWS. By using Amazon MSK, you can work with Kafka to allow consumers to subscribe to message topics containing the data of interest. The sessions drills down into the best design practices for working with Kafka and the techniques for establishing hybrid connectivity for working at a global scale.
The Samsung SmartThings story is a compelling case study in how businesses can modernize and optimize their streaming data analytics, relieve the burden of infrastructure management, and embrace a future of real-time insights. After Samsung migrated to Amazon Managed Service for Apache Flink, the development team’s focus shifted from the tedium of infrastructure upkeep to the realm of delivering tangible business value. This change enabled them to harness the full potential of a fully managed stream-processing platform.
Software upgrades bring new features and better performance, and keep you current with the software provider. However, upgrades for software services can be difficult to complete successfully, especially when you can’t tolerate downtime and when the new version’s APIs introduce breaking changes and deprecation that you must remediate. This post shows you how to upgrade from Elasticsearch engine to OpenSearch engine on Amazon OpenSearch Service without needing an intermediate upgrade to Elasticsearch 7.10.
OpenSearch Service supports OpenSearch as an engine, with versions in the 1.x through 2.x series. The service also supports legacy versions of Elasticsearch, versions 1.x through 7.10. Although OpenSearch brings many improvements over earlier engines, it can feel daunting to consider not only upgrading versions, but also changing engines in the process. The good news is that OpenSearch 1.0 is wire compatible with Elasticsearch 7.10, making engine changes straightforward. If you’re running a version of Elasticsearch in the 6.x or early 7.x series on OpenSearch Service, you might think you need to upgrade to Elasticsearch 7.10, and then upgrade to OpenSearch 1.3. However, you can easily upgrade your existing Elasticsearch engine running 6.8, 7.1, 7.2, 7.4, 7.9, and 7.10 in OpenSearch Service to the OpenSearch 1.3 engine.
OpenSearch Service runs a variety of checks before running an actual upgrade:
Validation before starting an upgrade
Preparing the setup configuration for the desired version
Provisioning new nodes with the same hardware configuration
Moving shards from old nodes to newly provisioned nodes
Removing older nodes and old node references from OpenSearch endpoints
During an upgrade, AWS takes care of the undifferentiated heavy lifting of provisioning, deploying, and moving the data to new domain. You are responsible to make sure there are no breaking changes that affect the data migration and movement to the newer version of the OpenSearch domain. In this post, we discuss the things you must modify and verify before and after running an upgrade from 6.8, 7.1, 7.2, 7.4, 7.9, and 7.10 version of Elasticsearch to 1.3 OpenSearch Service.
Pre-upgrade breaking changes
The following are pre-upgrade breaking changes:
Dependency check for language clients and libraries – If you’re using the open-source high-level language clients from Elastic, for example the Java, go, or Python client libraries, AWS recommends moving to the open-source, OpenSearch versions of these clients. (If you don’t use a high-level language client, you can skip this step.) The following are a few steps to perform a dependency check:
Determine the client library – Choose an appropriate client library compatible with your programing language. Refer to OpenSearch language clients for a list of all supported client libraries.
Add dependencies and resolve conflicts – Update your project’s dependency management system with the necessary dependencies specified by the client library. If your project already has dependencies that conflict with the OpenSearch client library dependencies, you may encounter dependency conflicts. In such cases, you need to resolve the conflicts manually.
Test and verify the client – Test the OpenSearch client functionality by establishing a connection, performing some basic operations (like indexing and searching), and verifying the results.
Removal of mapping types – Multiple types within an index were deprecated in Elasticsearch version 6.x, and completely removed in version 7.0 or later. OpenSearch indexes can only contain one mapping type. From OpenSearch version 2.x onward, the mapping _type must be _doc. You must check and fix the mapping before upgrading to OpenSearch 1.3.
Complete the following steps to identify and fix mapping issues:
Navigate to dev tools and use the following GET <index> mapping API to fetch the mapping information for all the indexes:
GET /index-name/_mapping
The mapping response will contain a JSON structure that represents the mapping for your index.
Look for the top-level keys in the response JSON; each key represents a custom type within the index.
The _doc type is used for the default type in Elasticsearch 7.x and OpenSearch Service 1.x, but you may see additional types that you defined in earlier versions of Elasticsearch. The following is an example response for an index with two custom types, type1 and type2.
Note that indexes created in 5.x will continue to function in 6.x as they did in 5.x, but indexes created in 6.x only allow a single type per index.
To fix the multiple mapping types in your existing domain, you need to reindex the data, where you can create one index for each mapping. This is a crucial step in the migration process because OpenSearch doesn’t support multiple types within a single index. In the next steps, we convert an index that has multiple mapping types into two separate indexes, each using the _doc type.
You can unify the mapping by using your existing index name as a root and adding the type as a suffix. For example, the following code creates two indexes with myindex as the root name and type1 and type2 as the suffix:
# Create an index for "type1"
PUT /myindex_type1

# Create an index for "type2"
PUT /myindex_type2
Use the _reindex API to reindex the data from the original index into the two new indexes. Alternately, you can reload the data from its source, if you’re keeping it in another system.
If your application was previously querying the original index with multiple types, you’ll need to update your queries to specify the new indexes with _doc as the type. For example, if your client was querying using myindex, which has been reindexed to myindex_type1 and myindex_type2, then change your clients to point to myindex*, which will query across both indexes.
After you have verified that the data is successfully reindexed and your application is working as expected with the new indexes, you should delete the original index before starting the upgrade, because it won’t be supported in the new version. Be cautious when deleting data and make sure you have backups if necessary.
As part of this upgrade, Kibana will be replaced with OpenSearch Dashboards. When you’re done with the upgrade in the next step, you should advocate your users to use the new endpoint, which will be _dashboards. If you use a custom endpoint, be sure to update it to point to /_dashboards.
We recommend that you update your AWS Identity and Access Management (IAM) policies to use the renamed API operations. However, OpenSearch Service will continue to respect existing policies by internally replicating the old API permissions. Service control policies (SCPs) introduce an additional layer of complexity compared to standard IAM. To prevent your SCP policies from breaking, you need to add both the old and the new API operations to each of your SCP policies.
Start the upgrade
The upgrade process is irreversible and can’t be paused or cancelled. You should make sure that everything will go smoothly by running a proof of concept (POC) check. By building a POC, you ensure data preservation, avoid compatibility issues, prevent unwanted bugs, and mitigate risks. You can run a POC with a small domain on the new version, and with a small subset of your data. Deploy and run any front-end code that communicates with OpenSearch Service via API against your test domain. Use your ingest pipeline to send data to your test domain as well, ensuring nothing breaks. Import or rebuild dashboards, alerts, anomaly detectors, and so on. This simple precaution can make your upgrade experience smoother and trouble-free while minimizing potential disruptions.
When OpenSearch Service starts the upgrade, it can take from 15 minutes to several hours to complete. OpenSearch Dashboards might be unavailable during some or all of the duration of the upgrade.
This snapshot serves as a backup that you can restore on a new domain if you want to return to using the prior version.
On the OpenSearch Service console, choose the domain that you want to upgrade.
On the Actions menu, choose Upgrade.
Select the target version as OpenSearch 1.3. If you’re upgrading to an OpenSearch version, then you’ll be able to enable compatibility mode. If you enable this setting, OpenSearch reports its version as 7.10 to allow Elastic’s open-source clients and plugins like Logstash to continue working with your OpenSearch Service domain.
Choose Check Upgrade Eligibility, which helps you identify if there are any breaking changes you still need to fix before running an upgrade.
Choose Upgrade.
Check the status on the domain dashboard to monitor the status of the upgrade.
The following graphic gives a quick demonstration of running and monitoring the upgrade via the preceding steps.
Post-upgrade changes and validations
Now that you have successfully upgraded your domain to OpenSearch Service 1.3, be sure to make the following changes:
Custom endpoint – A custom endpoint for your OpenSearch Service domain makes it straightforward for you to refer to your OpenSearch and OpenSearch Dashboards URLs. You can include your company’s branding or just use a shorter, easier-to-remember endpoint than the standard one. In OpenSearch Service, Kibana has been renamed to dashboards. After you upgrade a domain from the Elasticsearch engine to the OpenSearch engine, the /_plugin/kibana endpoint changes to /_dashboards. If you use the Kibana endpoint to set up a custom domain, you need to update it to include the new /_dashboards endpoint.
SAML authentication for OpenSearch Dashboards – After you upgrade your domain to OpenSearch Service, you need to change all Kibana URLs configured in your identity provider (IdP) from /_plugin/kibana to /_dashboards. The most common URLs are assertion consumer service (ACS) URLs and recipient URLs.
Conclusion
This post discussed what to consider when planning to upgrade your existing Elasticsearch engine in your OpenSearch Service domain to the OpenSearch engine. OpenSearch Service continues to support older engine versions, including open-source versions of Elasticsearch from 1.x through 7.10. By migrating forward to OpenSearch Service, you will be able to take advantage of bug fixes, performance improvements, new service features, and expanded instance types for your data nodes, like AWS Graviton 2 instances.
Prashant Agrawal is a Sr. Search Specialist Solutions Architect with Amazon OpenSearch Service. He works closely with customers to help them migrate their workloads to the cloud and helps existing customers fine-tune their clusters to achieve better performance and save on cost. Before joining AWS, he helped various customers use OpenSearch and Elasticsearch for their search and log analytics use cases. When not working, you can find him traveling and exploring new places. In short, he likes doing Eat → Travel → Repeat.
Harsh Bansal is a Solutions Architect at AWS with Analytics as his area of specialty.He has been building solutions to help organizations make data-driven decisions.
Amazon Redshift is a fast, petabyte-scale, cloud data warehouse that tens of thousands of customers rely on to power their analytics workloads. Data analysts and database developers want to use this data to train machine learning (ML) models, which can then be used to generate insights on new data for use cases such as forecasting revenue, predicting customer churn, and detecting anomalies. Amazon Redshift ML makes it easy for SQL users to create, train, and deploy ML models using SQL commands familiar to many roles such as executives, business analysts, and data analysts. We covered in a previous post how you can use data in Amazon Redshift to train models in Amazon SageMaker, a fully managed ML service, and then make predictions within your Redshift data warehouse.
Redshift ML currently supports ML algorithms such as XGBoost, multilayer perceptron (MLP), KMEANS, and Linear Learner. Additionally, you can import existing SageMaker models into Amazon Redshift for in-database inference or remotely invoke a SageMaker endpoint.
Amazon SageMaker Feature Store is a fully managed, purpose-built repository to store, share, and manage features for ML models. However, one challenge in training a production-ready ML model using SageMaker Feature Store is access to a diverse set of features that aren’t always owned and maintained by the team that is building the model. For example, an ML model to identify fraudulent financial transactions needs access to both identifying (device type, browser) and transaction (amount, credit or debit, and so on) related features. As a data scientist building an ML model, you may have access to the identifying information but not the transaction information, and having access to a feature store solves this.
In this post, we discuss the combined feature store pattern, which allows teams to maintain their own local feature stores using a local Redshift table while still being able to access shared features from the centralized feature store. In a local feature store, you can store sensitive data that can’t be shared across the organization for regulatory and compliance reasons.
We also show you how to use familiar SQL statements to create and train ML models by combining shared features from the centralized store with local features and use these models to make in-database predictions on new data for use cases such as fraud risk scoring.
Overview of solution
For this post, we create an ML model to predict if a transaction is fraudulent or not, given the transaction record. To build this, we need to engineer features that describe an individual credit card’s spending pattern, such as the number of transactions or the average transaction amount, and also information about the merchant, the cardholder, the device used to make the payment, and any other data that may be relevant to detecting fraud.
Train and validate a fraud risk scoring ML model using local feature data and external offline feature store data.
Use the offline feature store and local store for inference.
Dataset
To demonstrate this use case, we use a synthetic dataset with two tables: identity and transactions. They can both be joined by the TransactionID column. The transaction table contains information about a particular transaction, such as amount, credit or debit card, and so on, and the identity table contains information about the user, such as device type and browser. The transaction must exist in the transaction table, but might not always be available in the identity table.
The following is an example of the transactions dataset.
The following is an example of the identity dataset.
Let’s assume that across the organization, data science teams centrally manage the identity data and process it to extract features in a centralized offline feature store. The data warehouse team ingests and analyzes transaction data in a Redshift table, owned by them.
We work through this use case to understand how the data warehouse team can securely retrieve the latest features from the identity feature group and join it with transaction data in Amazon Redshift to create a feature set for training and inferencing a fraud detection model.
Create the offline feature group and ingest data
To start, we set up SageMaker Feature Store, create a feature group for the identity dataset, inspect and process the dataset, and ingest some sample data. We then prepare the transaction features from the transaction data and store it in Amazon S3 for further loading into the Redshift table.
Alternatively, you can author features using Amazon SageMaker Data Wrangler, create feature groups in SageMaker Feature Store, and ingest features in batches using an Amazon SageMaker Processing job with a notebook exported from SageMaker Data Wrangler. This mode allows for batch ingestion into the offline store.
Let’s explore some of the key steps in this section.
On the SageMaker console, under Notebook in the navigation pane, choose Notebook instances.
Locate your notebook instance and choose Open Jupyter.
Choose Upload and upload the notebook you just downloaded.
Open the notebook sagemaker_featurestore_fraud_redshiftml_python_sdk.ipynb.
Follow the instructions and run all the cells up to the Cleanup Resources section.
The following are key steps from the notebook:
We create a Pandas DataFrame with the initial CSV data. We apply feature transformations for this dataset.
identity_data = pd.read_csv(io.BytesIO(identity_data_object["Body"].read()))
transaction_data = pd.read_csv(io.BytesIO(transaction_data_object["Body"].read()))

identity_data = identity_data.round(5)
transaction_data = transaction_data.round(5)

identity_data = identity_data.fillna(0)
transaction_data = transaction_data.fillna(0)

# Feature transformations for this dataset are applied
# One hot encode card4, card6
encoded_card_bank = pd.get_dummies(transaction_data["card4"], prefix="card_bank")
encoded_card_type = pd.get_dummies(transaction_data["card6"], prefix="card_type")

transformed_transaction_data = pd.concat(
    [transaction_data, encoded_card_type, encoded_card_bank], axis=1
)
We store the processed and transformed transaction dataset in an S3 bucket. This transaction data will be loaded later in the Redshift table for building the local feature store.
Next, we need a record identifier name and an event time feature name. In our fraud detection example, the column of interest is TransactionID.EventTime can be appended to your data when no timestamp is available. In the following code, you can see how these variables are set, and then EventTime is appended to both features’ data.
# record identifier and event time feature names
record_identifier_feature_name = "TransactionID"
event_time_feature_name = "EventTime"

# append EventTime feature
identity_data[event_time_feature_name] = pd.Series(
    [current_time_sec] * len(identity_data), dtype="float64"
)
We then create and ingest the data into the feature group using the SageMaker SDK FeatureGroup.ingest API. This is a small dataset and therefore can be loaded into a Pandas DataFrame. When we work with large amounts of data and millions of rows, there are other scalable mechanisms to ingest data into SageMaker Feature Store, such as batch ingestion with Apache Spark.
identity_feature_group.create(
    s3_uri=<S3_Path_Feature_Store>,
    record_identifier_name=record_identifier_feature_name,
    event_time_feature_name=event_time_feature_name,
    role_arn=<role_arn>,
    enable_online_store=False,
)

identity_feature_group_name = "identity-feature-group"

# load feature definitions to the feature group. SageMaker FeatureStore Python SDK will auto-detect the data schema based on input data.
identity_feature_group.load_feature_definitions(data_frame=identity_data)
identity_feature_group.ingest(data_frame=identity_data, max_workers=3, wait=True)
We can verify that data has been ingested into the feature group by running Athena queries in the notebook or running queries on the Athena console.
At this point, the identity feature group is created in an offline feature store with historical data persisted in Amazon S3. SageMaker Feature Store automatically creates an AWS Glue Data Catalog for the offline store, which enables us to run SQL queries against the offline data using Athena or Redshift Spectrum.
Create a Redshift table and load local feature data
To build a Redshift ML model, we build a training dataset joining the identity data and transaction data using SQL queries. The identity data is in a centralized feature store where the historical set of records are persisted in Amazon S3. The transaction data is a local feature for training data that needs to made available in the Redshift table.
Let’s explore how to create the schema and load the processed transaction data from Amazon S3 into a Redshift table.
Create the customer_transaction table and load daily transaction data into the table, which you’ll use to train the ML model:
Load the sample data by using the following command. Replace your Region and S3 path as appropriate. You will find the S3 path in the S3 Bucket Setup For The OfflineStore section in the notebook or by checking the dataset_uri_prefix in the notebook.
COPY customer_transaction
FROM '<s3path>/transformed_transaction_data.csv'
IAM_ROLE default delimiter ','
region 'your-region';
Now that we have created a local feature store for the transaction data, we focus on integrating a centralized feature store with Amazon Redshift to access the identity data.
Create an external schema for Redshift Spectrum to access the offline store data
We have created a centralized feature store for identity features, and we can access this offline feature store using services such as Redshift Spectrum. When the identity data is available through the Redshift Spectrum table, we can create a training dataset with feature values from the identity feature group and customer_transaction, joining on the TransactionId column.
This section provides an overview of how to enable Redshift Spectrum to query data directly from files on Amazon S3 through an external database in an AWS Glue Data Catalog.
First, check that the identity-feature-group table is present in the Data Catalog under the sagemamker_featurestore database.
Using Redshift Query Editor V2, create an external schema using the following command:
CREATE EXTERNAL SCHEMA sagemaker_featurestore
FROM DATA CATALOG
DATABASE 'sagemaker_featurestore'
IAM_ROLE default
create external database if not exists;
All the tables, including identity-feature-group external tables, are visible under the sagemaker_featurestore external schema. In Redshift Query Editor v2, you can check the contents of the external schema.
Run the following query to sample a few records—note that your table name may be different:
Select * from sagemaker_featurestore.identity_feature_group_1680208535 limit 10;
Create a view to join the latest data from identity-feature-group and customer_transaction on the TransactionId column. Be sure to change the external table name to match your external table name:
create or replace view public.credit_fraud_detection_v
AS select  "isfraud",
        "transactiondt",
        "transactionamt",
        "card1","card2","card3","card5",
         case when "card_type_credit" = 'False' then 0 else 1 end as card_type_credit,
         case when "card_type_debit" = 'False' then 0 else 1 end as card_type_debit,
         case when "card_bank_american_express" = 'False' then 0 else 1 end as card_bank_american_express,
         case when "card_bank_discover" = 'False' then 0 else 1 end as card_bank_discover,
         case when "card_bank_mastercard" = 'False' then 0 else 1 end as card_bank_mastercard,
         case when "card_bank_visa" = 'False' then 0 else 1 end as card_bank_visa,
        "id_01","id_02","id_03","id_04","id_05"
from public.customer_transaction ct left join sagemaker_featurestore.identity_feature_group_1680208535 id
on id.transactionid = ct.transactionid with no schema binding;
Train and validate the fraud risk scoring ML model
Redshift ML gives you the flexibility to specify your own algorithms and model types and also to provide your own advanced parameters, which can include preprocessors, problem type, and hyperparameters. In this post, we create a customer model by specifying AUTO OFF and the model type of XGBOOST. By turning AUTO OFF and using XGBoost, we are providing the necessary inputs for SageMaker to train the model. A benefit of this can be faster training times. XGBoost is as open-source version of the gradient boosted trees algorithm. For more details on XGBoost, refer to Build XGBoost models with Amazon Redshift ML.
We train the model using 80% of the dataset by filtering on transactiondt < 12517618. The other 20% will be used for inference. A centralized feature store is useful in providing the latest supplementing data for training requests. Note that you will need to provide an S3 bucket name in the create model statement. It will take approximately 10 minutes to create the model.
CREATE MODEL frauddetection_xgboost
FROM (select  "isfraud",
        "transactiondt",
        "transactionamt",
        "card1","card2","card3","card5",
        "card_type_credit",
        "card_type_debit",
        "card_bank_american_express",
        "card_bank_discover",
        "card_bank_mastercard",
        "card_bank_visa",
        "id_01","id_02","id_03","id_04","id_05"
from credit_fraud_detection_v where transactiondt < 12517618
)
TARGET isfraud
FUNCTION ml_fn_frauddetection_xgboost
IAM_ROLE default
AUTO OFF
MODEL_TYPE XGBOOST
OBJECTIVE 'binary:logistic'
PREPROCESSORS 'none'
HYPERPARAMETERS DEFAULT EXCEPT(NUM_ROUND '100')
SETTINGS (S3_BUCKET <s3_bucket>);
When you run the create model command, it will complete quickly in Amazon Redshift while the model training is happening in the background using SageMaker. You can check the status of the model by running a show model command:
show model frauddetection_xgboost;
The output of the show model command shows that the model state is TRAINING. It also shows other information such as the model type and the training job name that SageMaker assigned. After a few minutes, we run the show model command again:
show model frauddetection_xgboost;
Now the output shows the model state is READY. We can also see the train:error score here, which at 0 tells us we have a good model. Now that the model is trained, we can use it for running inference queries.
Use the offline feature store and local store for inference
We can use the SQL function to apply the ML model to data in queries, reports, and dashboards. Let’s use the function ml_fn_frauddetection_xgboost created by our model against our test dataset by filtering where transactiondt >=12517618, to predict whether a transaction is fraudulent or not. SageMaker Feature Store can be useful in supplementing data for inference requests.
Run the following query to predict whether transactions are fraudulent or not:
select  "isfraud" as "Actual",
        ml_fn_frauddetection_xgboost(
        "transactiondt",
        "transactionamt",
        "card1","card2","card3","card5",
        "card_type_credit",
        "card_type_debit",
        "card_bank_american_express",
        "card_bank_discover",
        "card_bank_mastercard",
        "card_bank_visa",
        "id_01","id_02","id_03","id_04","id_05") as "Predicted"
from credit_fraud_detection_v where transactiondt >= 12517618;
For binary and multi-class classification problems, we compute the accuracy as the model metric. Accuracy can be calculated based on the following:
accuracy = (sum (actual == predicted)/total) *100
Let’s apply the preceding code to our use case to find the accuracy of the model. We use the test data (transactiondt >= 12517618) to test the accuracy, and use the newly created function ml_fn_frauddetection_xgboost to predict and take the columns other than the target and label as the input:
-- check accuracy
WITH infer_data AS (
SELECT "isfraud" AS label,
ml_fn_frauddetection_xgboost(
        "transactiondt",
        "transactionamt",
        "card1","card2","card3","card5",
        "card_type_credit",
        "card_type_debit",
        "card_bank_american_express",
        "card_bank_discover",
        "card_bank_mastercard",
        "card_bank_visa",
        "id_01","id_02","id_03","id_04","id_05") AS predicted,
CASE
   WHEN label IS NULL
       THEN 0
   ELSE label
   END AS actual,
CASE
   WHEN actual = predicted
       THEN 1::INT
   ELSE 0::INT
   END AS correct
FROM credit_fraud_detection_v where transactiondt >= 12517618),
aggr_data AS (
SELECT SUM(correct) AS num_correct,
COUNT(*) AS total
FROM infer_data)

SELECT (num_correct::FLOAT / total::FLOAT) AS accuracy FROM aggr_data;
Clean up
As a final step, clean up the resources:
Delete the Redshift cluster.
Run the Cleanup Resources section of your notebook.
Conclusion
Redshift ML enables you to bring machine learning to your data, powering fast and informed decision-making. SageMaker Feature Store provides a purpose-built feature management solution to help organizations scale ML development across business units and data science teams.
In this post, we showed how you can train an XGBoost model using Redshift ML with data spread across SageMaker Feature Store and a Redshift table. Additionally, we showed how you can make inferences on a trained model to detect fraud using Amazon Redshift SQL commands.
About the authors
Anirban Sinha is a Senior Technical Account Manager at AWS. He is passionate about building scalable data warehouses and big data solutions working closely with customers. He works with large ISVs customers, in helping them build and operate secure, resilient, scalable, and high-performance SaaS applications in the cloud.
Phil Bates is a Senior Analytics Specialist Solutions Architect at AWS. He has more than 25 years of experience implementing large-scale data warehouse solutions. He is passionate about helping customers through their cloud journey and using the power of ML within their data warehouse.
Gaurav Singh is a Senior Solutions Architect at AWS, specializing in AI/ML and Generative AI. Based in Pune, India, he focuses on helping customers build, deploy, and migrate ML production workloads to SageMaker at scale. In his spare time, Gaurav loves to explore nature, read, and run.
“Кметът в сянка” в гр. Царево Ангел Цигуларов е за пореден път “измъкнат”, вместо да бъде подведен под отговорност, с помощта на местната власт и на Прокуратурата на Република България…
The C programming language is replete with features that seemed like a good
idea at the time (and perhaps even were good ideas then) that have not aged
well. Most would likely agree that string handling, and the use of
NUL-terminated strings, is one of those. Kernel developers have, for
years, tried to improve the handling of strings in an attempt to slow the
flow of bugs and vulnerabilities that result from mistakes in that area.
Now there is an early discussion on the idea of moving away from
NUL-terminated strings in much of the kernel.
Security updates have been issued by Debian (firefox-esr and xorg-server), Fedora (firefox, mbedtls, nodejs18, nodejs20, and xen), Gentoo (libinput, unifi, and USBView), Mageia (python-nltk), Oracle (linux-firmware), Red Hat (nginx:1.22), SUSE (chromium, firefox, java-11-openjdk, jetty-minimal, nghttp2, nodejs18, webkit2gtk3, and zlib), and Ubuntu (linux, linux-lowlatency, linux-oracle-5.15, vim, and xorg-server, xwayland).
On Wednesday 18th, 2023, Cloudflare’s Security Incident Response Team (SIRT) discovered an attack on our systems that originated from an authentication token stolen from one of Okta’s support systems. No Cloudflare customer information or systems were impacted by the incident, thanks to the real-time detection and rapid action of our Security Incident Response Team (SIRT) in tandem with our Zero Trust security posture and use of hardware keys. With that said, we’d rather not repeat the experience — and so we have built a new security tool that can help organizations render this type of attack obsolete for good.
The bad actor in the Okta breach compromised user sessions by capturing session tokens from administrators at Cloudflare and other impacted organizations. They did this by infiltrating Okta’s customer support system and stealing one of the most common mechanisms for troubleshooting — an HTTP Response Archive (HAR) file.
HAR files contain a record of a user’s browser session, a kind of step-by-step audit, that a user can share with someone like a help desk agent to diagnose an issue. However, the file can also contain sensitive information that can be used to launch an attack.
As a follow-up to the Okta breach, we are making a HAR file sanitizer available to everyone, not just Cloudflare customers, at no cost. We are publishing this tool under an open source license and are making it available to any support, engineering or security team. At Cloudflare, we are committed to making the Internet a better place and using HAR files without the threat of stolen sessions should be part of the future of the Internet.
HAR Files – a look back in time
Imagine being able to rewind time and revisit every single step a user took during a web session, scrutinizing each request and the responses the browser received.
HAR (HTTP Archive) files are a JSON formatted archive file of a web browser’s interaction with a web application. HAR files provide a detailed snapshot of every request, including headers, cookies, and other types of data sent to a web server by the browser. This makes them an invaluable resource to troubleshoot web application issues especially for complex, layered web applications.
The snapshot that a HAR file captures can contain the following information:
Complete Request and Response Headers: Every piece of data sent and received, including method types (GET, POST, etc.), status codes, URLs, cookies, and more.
Payload Content: Details of what was actually exchanged between the client and server, which can be essential for diagnosing issues related to data submission or retrieval.
Timing Information: Precise timing breakdowns of each phase – from DNS lookup, connection time, SSL handshake, to content download – giving insight into performance bottlenecks.
This information can be difficult to gather from an application’s logs due to the diverse nature of devices, browsers and networks used to access an application. A user would need to take dozens of manual steps. A HAR file gives them a one-click option to share diagnostic information with another party. The file is also standard, providing the developers, support teams, and administrators on the other side of the exchange with a consistent input to their own tooling. This minimizes the frustrating back-and-forth where teams try to recreate a user-reported problem, ensuring that everyone is, quite literally, on the same page.
HAR files as an attack vector
HAR files, while powerful, come with a cautionary note. Within the set of information they contain, session cookies make them a target for malicious actors.
The Role of Session Cookies
Before diving into the risks, it’s crucial to understand the role of session cookies. A session cookie is sent from a server and stored on a user’s browser to maintain stateful information across web sessions for that user. In simpler terms, it’s how the browser keeps you logged into an application for a period of time even if you close the page. Generally, these cookies live in local memory on a user’s browser and are not often shared. However, a HAR file is one of the most common ways that a session cookie could be inadvertently shared.
Dangers of a stolen session cookie
If a HAR file with a valid session cookie is shared, then there are a number of potential security threats that user, and company, may be exposed to:
Unauthorized Access: The biggest risk is unauthorized access. If a HAR file with a session cookie lands in the wrong hands, it grants entry to the user’s account for that application. For platforms that store personal data or financial details, the consequences of such a breach can be catastrophic. Especially if the session cookie of a user with administrative or elevated permissions is stolen.
Session Hijacking: Armed with a session cookie, attackers can impersonate legitimate users, a tactic known as session hijacking. This can lead to a range of malicious activities, from spreading misinformation to siphoning off funds.
Persistent Exposure: Unlike other forms of data, a session cookie’s exposure risk doesn’t necessarily end when a user session does. Depending on the cookie’s lifespan, malicious actors could gain prolonged access, repeatedly compromising a user’s digital interactions.
Gateway to Further Attacks: With access to a user’s session, especially an administrator’s, attackers can probe for other vulnerabilities, exploit platform weaknesses, or jump to other applications.
Mitigating the impact of a stolen HAR file
Thankfully, there are ways to render a HAR file inert even if stolen by an attacker. One of the most effective methods is to “sanitize” a HAR file of any session related information before sharing it for debugging purposes.
The HAR sanitizer we are introducing today allows a user to upload any HAR file, and the tool will strip out any session related cookies or JSON Web Tokens (JWT). The tool is built entirely on Cloudflare Workers, and all sanitization is done client-side which means Cloudflare never sees the full contents of the session token.
Just enough sanitization
By default, the sanitizer will remove all session-related cookies and tokens — but there are some cases where these are essential for troubleshooting. For these scenarios, we are implementing a way to conditionally strip “just enough” data from the HAR file to render them safe, while still giving support teams the information they need.
The first product we’ve optimized the HAR sanitizer for is Cloudflare Access. Access relies on a user’s JWT — a compact token often used for secure authentication — to verify that a user should have access to the requested resource. This means a JWT plays a crucial role in troubleshooting issues with Cloudflare Access. We have tuned the HAR sanitizer to strip the cryptographic signature out of the Access JWT, rendering it inert, while still providing useful information for internal admins and Cloudflare support to debug issues.
Because HAR files can include a diverse array of data types, selectively sanitizing them is not a case of ‘one size fits all’. We will continue to expand support for other popular authentication tools to ensure we strip out “just enough” information.
What’s next
Over the coming months, we will launch additional security controls in Cloudflare Zero Trust to further mitigate attacks stemming from session tokens stolen from HAR files. This will include:
Enhanced Data Loss Prevention (DLP) file type scanning to include HAR file and session token detections, to ensure users in your organization can not share unsanitized files.
Expanded API CASB scanning to detect HAR files with session tokens in collaboration tools like Zendesk, Jira, Drive and O365.
Automated HAR sanitization of data in popular collaboration tools.
As always, we continue to expand our Cloudflare One Zero Trust suite to protect organizations of all sizes against an ever-evolving array of threats. Ready to get started? Sign up here to begin using Cloudflare One at no cost for teams of up to 50 users.
It’s been two years since we announced Email Routing, our solution to create custom email addresses for your domains and route incoming emails to your preferred mailbox. Since then, the team has worked hard to evolve the product and add more powerful features to meet our users’ expectations. Examples include Route to Workers, which allows you to process your Emails programmatically using Workers scripts, Public APIs, Audit Logs, or DMARC Management.
We also made significant progress in supporting more email security extensions and protocols, protecting our customers from unwanted traffic, and keeping our IP space reputation for email egress impeccable to maximize our deliverability rates to whatever inbox upstream provider you chose.
Since leaving beta, Email Routing has grown into one of our most popular products; it’s used by more than one million different customer zones globally, and we forward around 20 million messages daily to every major email platform out there. Our product is mature, robust enough for general usage, and suitable for any production environment. And it keeps evolving: today, we announce three new features that will help make Email Routing more secure, flexible, and powerful than ever.
New security protocols
The SMTP email protocol has been around since the early 80s. Naturally, it wasn’t designed with the best security practices and requirements in mind, at least not the ones that the Internet expects today. For that reason, several protocol revisions and extensions have been standardized and adopted by the community over the years. Cloudflare is known for being an early adopter of promising emerging technologies; Email Routing already supports things like SPF, DKIM signatures, DMARC policy enforcement, TLS transport, STARTTLS, and IPv6 egress, to name a few. Today, we are introducing support for two new standards to help increase email security and improve deliverability to third-party upstream email providers.
ARC
Authenticated Received Chain (ARC) is an email authentication system designed to allow an intermediate email server (such as Email Routing) to preserve email authentication results. In other words, with ARC, we can securely preserve the results of validating sender authentication mechanisms like SPF and DKIM, which we support when the email is received, and transport that information to the upstream provider when we forward the message. ARC establishes a chain of trust with all the hops the message has passed through. So, if it was tampered with or changed in one of the hops, it is possible to see where by following that chain.
We began rolling out ARC support to Email Routing a few weeks ago. Here’s how it works:
Email Routing will use @example.com’s DMARC policy to check the SPF and DKIM alignments (SPF, DKIM, and DMARC help authenticate email senders by verifying that the emails came from the domain that they claim to be from.) It then stores this authentication result by adding a Arc-Authentication-Results header in the message:
ARC-Authentication-Results: i=1; mx.cloudflare.net; dkim=pass header.d=cloudflare.com header.s=example09082023 header.b=IRdayjbb; dmarc=pass header.from=example.com policy.dmarc=reject; spf=none (mx.cloudflare.net: no SPF records found for [email protected]) smtp.helo=smtp.example.com; spf=pass (mx.cloudflare.net: domain of [email protected] designates 2a00:1440:4824:20::32e as permitted sender) [email protected]; arc=none smtp.remote-ip=2a00:1440:4824:20::32e
Then we take a snapshot of all the headers and the body of the original message, and we generate an Arc-Message-Signature header with a DKIM-like cryptographic signature (in fact ARC uses the same DKIM keys):
Finally, before forwarding the message to [email protected], Email Routing generates the Arc-Seal header, another DKIM-like signature, composed out of the Arc-Authentication-Results and Arc-Message-Signature, and cryptographically “seals” the message:
When Gmail receives the message from Email Routing, it not only normally authenticates the last hop domain.example domain (Email Routing uses SRS), but it also checks the ARC seal header, which provides the authentication results of the original sender.
ARC increases the traceability of the message path through email intermediaries, allowing for more informed delivery decisions by those who receive emails as well as higher deliverability rates for those who transport them, like Email Routing. It has been adopted by all the major email providers like Gmail and Microsoft. You can read more about the ARC protocol in the RFC8617.
MTA-STS
As we said earlier, SMTP is an old protocol. Initially Email communications were done in the clear, in plain-text and unencrypted. At some point in time in the late 90s, the email providers community standardized STARTTLS, also known as Opportunistic TLS. The STARTTLS extension allowed a client in a SMTP session to upgrade to TLS encrypted communications.
While at the time this seemed like a step forward in the right direction, we later found out that because STARTTLS can start with an unencrypted plain-text connection, and that can be hijacked, the protocol is susceptible to man-in-the-middle attacks.
A few years ago MTA Strict Transport Security (MTA-STS) was introduced by email service providers including Microsoft, Google and Yahoo as a solution to protect against downgrade and man-in-the-middle attacks in SMTP sessions, as well as solving the lack of security-first communication standards in email.
Suppose that example.com uses Email Routing. Here’s how you can enable MTA-STS for it.
First, log in to the Cloudflare dashboard and select your account and zone. Then go to DNS > Records and create a new CNAME record with the name “_mta-sts” that points to Cloudflare’s record “_mta-sts.mx.cloudflare.net”. Make sure to disable the proxy mode.
Confirm that the record was created:
$ dig txt _mta-sts.example.com
_mta-sts.example.com.	300	IN	CNAME	_mta-sts.mx.cloudflare.net.
_mta-sts.mx.cloudflare.net. 300	IN	TXT	"v=STSv1; id=20230615T153000;"
This tells the other end client that is trying to connect to us that we support MTA-STS.
Next you need an HTTPS endpoint at mta-sts.example.com to serve your policy file. This file defines the mail servers in the domain that use MTA-STS. The reason why HTTPS is used here instead of DNS is because not everyone uses DNSSEC yet, so we want to avoid another MITM attack vector.
To do this you need to deploy a very simple Worker that allows Email clients to pull Cloudflare’s Email Routing policy file using the “well-known” URI convention. Go to your Account > Workers & Pages and press Create Application. Pick the “MTA-STS” template from the list.
This Worker simply proxies https://mta-sts.mx.cloudflare.net/.well-known/mta-sts.txt to your own domain. After deploying it, go to the Worker configuration, then Triggers > Custom Domains and Add Custom Domain.
You can then confirm that your policy file is working:
This says that we enforce MTA-STS. Capable email clients will only deliver email to this domain over a secure connection to the specified MX servers. If no secure connection can be established the email will not be delivered.
Email Routing also supports MTA-STS upstream, which greatly improves security when forwarding your Emails to service providers like Gmail or Microsoft, and others.
While enabling MTA-STS involves a few steps today, we plan to simplify things for you and automatically configure MTA-STS for your domains from the Email Routing dashboard as a future improvement.
Sending emails and replies from Workers
Last year we announced Email Workers, allowing anyone using Email Routing to associate a Worker script to an Email address rule, and programmatically process their incoming emails in any way they want. Workers is our serverless compute platform, it provides hundreds of features and APIs, like databases and storage. Email Workers opened doors to a flood of use-cases and applications that weren’t possible before like implementing allow/block lists, advanced rules, notifications to messaging applications, honeypot aggregators and more.
Still, you could only act on the incoming email event. You could read and process the email message, you could even manipulate and create some headers, but you couldn’t rewrite the body of the message or create new emails from scratch.
Today we’re announcing two new powerful Email Workers APIs that will further enhance what you can do with Email Routing and Workers.
Send emails from Workers
Now you can send an email from any Worker, from scratch, whenever you want, not just when you receive incoming messages, to any email address verified on Email Routing under your account. Here are a few practical examples where sending email from Workers to your verified addresses can be helpful:
Daily digests with the news from your favorite publications.
Alert messages whenever the weather conditions are adverse.
Automatic notifications when systems complete tasks.
Receive a message composed of the inputs of a form online on a contact page.
Let’s see a simple example of a Worker sending an email. First you need to create “send_email” bindings in your wrangler.toml configuration:
send_email = [
    {type = "send_email", name = "EMAIL_OUT"}
 ]
And then creating a new message and sending it in a Workers is as simple as:
import { EmailMessage } from "cloudflare:email";
import { createMimeMessage } from "mimetext";

export default {
 async fetch(request, env) {
   const msg = createMimeMessage();
   msg.setSender({ name: "Workers AI story", addr: "[email protected]" });
   msg.setRecipient("[email protected]");
   msg.setSubject("An email generated in a worker");
   msg.addMessage({
       contentType: 'text/plain',
       data: `Congratulations, you just sent an email from a worker.`
   });

   var message = new EmailMessage(
     "[email protected]",
     "[email protected]",
     msg.asRaw()
   );
   try {
     await env.EMAIL_OUT.send(message);
   } catch (e) {
     return new Response(e.message);
   }

   return new Response("email sent!");
 },
};
This example makes use of mimetext, an open-source raw email message generator.
Again, for security reasons, you can only send emails to the addresses for which you confirmed ownership in Email Routing under your Cloudflare account. If you’re looking for sending email campaigns or newsletters to destination addresses that you do not control or larger subscription groups, you should consider other options like our MailChannels integration.
Since sending Emails from Workers is not tied to the EmailEvent, you can send them from any type of Worker, including Cron Triggers and Durable Objects, whenever you want, you control all the logic.
Reply to emails
One of our most-requested features has been to provide a way to programmatically respond to incoming emails. It has been possible to do this with Email Workers in a very limited capacity by returning a permanent SMTP error message — but this may or may not be visible to the end user depending on the client implementation.
As of today, you can now truly reply to incoming emails with another new message and implement smart auto-responders programmatically, adding any content and context in the main body of the message. Think of a customer support email automatically generating a ticket and returning the link to the sender, an out-of-office reply with instructions when you’re on vacation, or a detailed explanation of why you rejected an email. Here’s a code example:
To mitigate security risks and abuse, replying to incoming emails has a few requirements:
The incoming email has to have valid DMARC.
The email can only be replied to once.
The In-Reply-To header of the reply message must match the Message-ID of the incoming message.
The recipient of the reply must match the incoming sender.
The outgoing sender domain must match the same domain that received the email.
If these and other internal conditions are not met, then reply() will fail with an exception, otherwise you can freely compose your reply message and send it back to the original sender.
For more information the documentation to these APIs is available in our Developer Docs.
Subdomains support
This is a big one.
Email Routing is a zone-level feature. A zone has a top-level domain (the same as the zone name) and it can have subdomains (managed under the DNS feature.) As an example, I can have the example.com zone, and then the mail.example.com and corp.example.com subdomains under it. However, we can only use Email Routing with the top-level domain of the zone, example.com in this example. While this is fine for the vast majority of use cases, some customers — particularly bigger organizations with complex email requirements — have asked for more flexibility.
This changes today. Now you can use Email Routing with any subdomain of any zone in your account. To make this possible we redesigned the dashboard UI experience to make it easier to get you started and manage all your Email Routing domains and subdomains, rules and destination addresses in one single place. Let’s see how it works.
To add Email Routing features to a new subdomain, log in to the Cloudflare dashboard and select your account and zone. Then go to Email > Email Routing > Settings and click “Add subdomain”.
Once the subdomain is added and the DNS records are configured, you can see it in the Settings list under the Subdomains section:
Now you can go to Email > Email Routing > Routing rules and create new custom addresses that will show you the option of using either the top domain of the zone or any other configured subdomain.
After the new custom address for the subdomain is created you can see it in the list with all the other addresses, and manage it from there.
It’s this easy.
Final words
We hope you enjoy the new features that we are announcing today. Still, we want to be clear: there are no changes in pricing, and Email Routing is still free for Cloudflare customers.
Ever since Email Routing was launched, we’ve been listening to customers’ feedback and trying to adjust our roadmap to both our requirements and their own ideas and requests. Email shouldn’t be difficult; our goal is to listen, learn and keep improving the service with better, more powerful features.
You can find detailed information about the new features and more in our Email Routing Developer Docs.
Welcome to the third DDoS threat report of 2023. DDoS attacks, or distributed denial-of-service attacks, are a type of cyber attack that aims to disrupt websites (and other types of Internet properties) to make them unavailable for legitimate users by overwhelming them with more traffic than they can handle — similar to a driver stuck in a traffic jam on the way to the grocery store.
We see a lot of DDoS attacks of all types and sizes, and our network is one of the largest in the world spanning more than 300 cities in over 100 countries. Through this network we serve over 64 million HTTP requests per second at peak and about 2.3 billion DNS queries every day. On average, we mitigate 140 billion cyber threats each day. This colossal amount of data gives us a unique vantage point to understand the threat landscape and provide the community access to insightful and actionable DDoS trends.
In recent weeks, we’ve also observed a surge in DDoS attacks and other cyber attacks against Israeli newspaper and media websites, as well as financial institutions and government websites. Palestinian websites have also seen a significant increase in DDoS attacks. View the full coverage here.
HTTP DDoS attacks against Israeli websites using Cloudflare
The global DDoS threat landscape
In the third quarter of 2023, Cloudflare faced one of the most sophisticated and persistent DDoS attack campaigns in recorded history.
Cloudflare mitigated thousands of hyper-volumetric HTTP DDoS attacks, 89 of which exceeded 100 million requests per second (rps) and with the largest peaking at 201 million rps — a figure three times higher than the previous largest attack on record (71M rps).
The campaign contributed to an overall increase of 65% in HTTP DDoS attack traffic in Q3 compared to the previous quarter. Similarly, L3/4 DDoS attacks also increased by 14%.
Gaming and Gambling companies were bombarded with the largest volume of HTTP DDoS attack traffic, overtaking the Cryptocurrency industry from last quarter.
Reminder: an interactive version of this report is also available as a Cloudflare Radar Report. On Radar, you can also dive deeper and explore traffic trends, attacks, outages and many more insights for your specific industry, network and country.
HTTP/2, which accounts for 62% of HTTP traffic, is a version of the protocol that’s meant to improve application performance. The downside is that HTTP/2 can also help improve a botnet’s performance.
Distribution of HTTP versions by Radar
Campaign of hyper-volumetric DDoS attacks exploiting HTTP/2 Rapid Resets
Starting in late August 2023, Cloudflare and various other vendors were subject to a sophisticated and persistent DDoS attack campaign that exploited the HTTP/2 Rapid Reset vulnerability (CVE-2023-44487).
Illustration of an HTTP/2 Rapid Reset DDoS attack
The DDoS campaign included thousands of hyper-volumetric DDoS attacks over HTTP/2 that peaked in the range of millions of requests per second. The average attack rate was 30M rps. Approximately 89 of the attacks peaked above 100M rps and the largest one we saw hit 201M rps.
HTTP/2 Rapid Reset campaign of hyper-volumetric DDoS attacks
Cloudflare’s systems automatically detected and mitigated the vast majority of attacks. We deployed emergency countermeasures and improved our mitigation systems’ efficacy and efficiency to ensure the availability of our network and of our customers’.
Check out our engineering blog that dives deep into the land of HTTP/2, what we learned and what actions we took to make the Internet safer.
Hyper-volumetric DDoS attacks enabled by VM-based botnets
As we’ve seen in this campaign and previous ones, botnets that leverage cloud computing platforms and exploit HTTP/2 are able to generate up to x5,000 more force per botnet node. This allowed them to launch hyper-volumetric DDoS attacks with a small botnet ranging 5-20 thousand nodes alone. To put that into perspective, in the past, IoT based botnets consisted of fleets of millions of nodes and barely managed to reach a few million requests per second.
Comparison of an Internet of Things (IoT) based botnet and a Virtual Machine (VM) based botnet
When analyzing the two-month-long DDoS campaign, we can see that Cloudflare infrastructure was the main target of the attacks. More specifically, 19% of all attacks targeted Cloudflare websites and infrastructure. Another 18% targeted Gaming companies, and 10% targeted well known VoIP providers.
Top industries targeted by the HTTP/2 Rapid Reset DDoS attacks
HTTP DDoS attack traffic increased by 65%
The attack campaign contributed to an overall increase in the amount of attack traffic. Last quarter, the volume of HTTP DDoS attacks increased by 15% QoQ. This quarter, it grew even more. Attacks volume increased by 65% QoQ to a total staggering figure of 8.9 trillion HTTP DDoS requests that Cloudflare systems automatically detected and mitigated.
Aggregated volume of HTTP DDoS attack requests by quarter
Alongside the 65% increase in HTTP DDoS attacks, we also saw a minor increase of 14% in L3/4 DDoS attacks — similar to the figures we saw in the first quarter of this year.
L3/4 DDoS attack by quarter
Top sources of HTTP DDoS attacks
When comparing the global and country-specific HTTP DDoS attack request volume, we see that the US remains the largest source of HTTP DDoS attacks. One out of every 25 HTTP DDoS requests originated from the US. China remains in second place. Brazil replaced Germany as the third-largest source of HTTP DDoS attacks, as Germany fell to fourth place.
HTTP DDoS attacks: Top sources compared to all attack traffic
Some countries naturally receive more traffic due to various factors such as the population and Internet usage, and therefore also receive/generate more attacks. So while it’s interesting to understand the total amount of attack traffic originating from or targeting a given country, it is also helpful to remove that bias by normalizing the attack traffic by all traffic to a given country.
When doing so, we see a different pattern. The US doesn’t even make it into the top ten. Instead, Mozambique is in first place (again). One out of every five HTTP requests that originated from Mozambique was part of an HTTP DDoS attack traffic.
Egypt remains in second place — approximately 13% of requests originating from Egypt were part of an HTTP DDoS attack. Libya and China follow as the third and fourth-largest source of HTTP DDoS attacks.
HTTP DDoS attacks: Top sources compared to their own traffic
Top sources of L3/4 DDoS attacks
When we look at the origins of L3/4 DDoS attacks, we ignore the source IP address because it can be spoofed. Instead, we rely on the location of Cloudflare’s data center where the traffic was ingested. Thanks to our large network and global coverage, we’re able to achieve geographical accuracy to understand where attacks come from.
In Q3, approximately 36% of all L3/4 DDoS attack traffic that we saw in Q3 originated from the US. Far behind, Germany came in second place with 8% and the UK followed in third place with almost 5%.
L3/4 DDoS attacks: Top sources compared to all attack traffic
When normalizing the data, we see that Vietnam dropped to the second-largest source of L3/4 DDoS attacks after being first for two consecutive quarters. New Caledonia, a French territory comprising dozens of islands in the South Pacific, grabbed the first place. Two out of every four bytes ingested in Cloudflare’s data centers in New Caledonia were attacks.
L3/4 DDoS attacks: Top sources compared to their own traffic
Top attacked industries by HTTP DDoS attacks
In terms of absolute volume of HTTP DDoS attack traffic, the Gaming and Gambling industry jumps to first place overtaking the Cryptocurrency industry. Over 5% of all HTTP DDoS attack traffic that Cloudflare saw targeted the Gaming and Gambling industry.
HTTP DDoS attacks: Top attacked industries compared to all attack traffic
The Gaming and Gambling industry has long been one of the most attacked industries compared to others. But when we look at the HTTP DDoS attack traffic relative to each specific industry, we see a different picture. The Gaming and Gambling industry has so much user traffic that, despite being the most attacked industry by volume, it doesn’t even make it into the top ten when we put it into the per-industry context.
Instead, what we see is that the Mining and Metals industry was targeted by the most attacks compared to its total traffic — 17.46% of all traffic to Mining and Metals companies were DDoS attack traffic.
Following closely in second place, 17.41% of all traffic to Non-profits were HTTP DDoS attacks. Many of these attacks are directed at more than 2,400 Non-profit and independent media organizations in 111 countries that Cloudflare protects for free as part of Project Galileo, which celebrated its ninth anniversary this year. Over the past quarter alone, Cloudflare mitigated an average of 180.5 million cyber threats against Galileo-protected websites every day.
HTTP DDoS attacks: Top attacked industries compared to their own traffic
Pharmaceuticals, Biotechnology and Health companies came in third, and US Federal Government websites in fourth place. Almost one out of every 10 HTTP requests to US Federal Government Internet properties were part of an attack. In fifth place, Cryptocurrency and then Farming and Fishery not far behind.
Top attacked industries by region
Now let’s dive deeper to understand which industries were targeted the most in each region.
HTTP DDoS attacks: Top industries targeted by HTTP DDoS attacks by region
Regional deepdives
Africa
After two consecutive quarters as the most attacked industry, the Telecommunications industry dropped from first place to fourth. Media Production companies were the most attacked industry in Africa. The Banking, Financial Services and Insurance (BFSI) industry follows as the second most attacked. Gaming and Gambling companies in third.
Asia
The Cryptocurrency industry remains the most attacked in APAC for the second consecutive quarter. Gaming and Gambling came in second place. Information Technology and Services companies in third.
Europe
For the fourth consecutive quarter, the Gaming and Gambling industry remains the most attacked industry in Europe. Retail companies came in second, and Computer Software companies in third.
Latin America
Farming was the most targeted industry in Latin America in Q3. It accounted for a whopping 53% of all attacks towards Latin America. Far behind, Gaming and Gambling companies were the second most targeted. Civic and Social Organizations were in third.
Middle East
Retail companies were the most targeted in the Middle East in Q3. Computer Software companies came in second and the Gaming and Gambling industry in third.
North America
After two consecutive quarters, the Marketing and Advertising industry dropped from the first place to the second. Computer Software took the lead. In third place, Telecommunications companies.
Oceania
The Telecommunications industry was, by far, the most targeted in Oceania in Q3 — over 45% of all attacks to Oceania. Cryptocurrency and Computer Software companies came in second and third places respectively.
Top attacked industries by L3/4 DDoS attacks
When descending the layers of the OSI model, the Internet networks and services that were most targeted belonged to the Information Technology and Services industry. Almost 35% of all L3/4 DDoS attack traffic (in bytes) targeted the Information Technology and Internet industry.
Far behind, Telecommunication companies came in second with a mere share of 3%. Gaming and Gambling came in third, Banking, Financial Services and Insurance companies (BFSI) in fourth.
L3/4 DDoS attacks: Top attacked industries compared to all attack traffic
When comparing the attacks on industries to all traffic for that specific industry, we see that the Music industry jumps to the first place, followed by Computer and Network Security companies, Information Technology and Internet companies and Aviation and Aerospace.
L3/4 DDoS attacks: Top attacked industries compared to their own traffic
Top attacked countries by HTTP DDoS attacks
When examining the total volume of attack traffic, the US remains the main target of HTTP DDoS attacks. Almost 5% of all HTTP DDoS attack traffic targeted the US. Singapore came in second and China in third.
HTTP DDoS attacks: Top attacked countries compared to all traffic
If we normalize the data per country and region and divide the attack traffic by the total traffic, we get a different picture. The top three most attacked countries are Island nations.
Anguilla, a small set of islands east of Puerto Rico, jumps to the first place as the most attacked country. Over 75% of all traffic to Anguilla websites were HTTP DDoS attacks. In second place, American Samoa, a group of islands east of Fiji. In third, the British Virgin Islands.
In fourth place, Algeria, and then Kenya, Russia, Vietnam, Singapore, Belize, and Japan.
HTTP DDoS attacks: Top attacked countries compared to their own traffic
Top attacked countries by L3/4 DDoS attacks
For the second consecutive quarter, Chinese Internet networks and services remain the most targeted by L3/4 DDoS attacks. These China-bound attacks account for 29% of all attacks we saw in Q3.
Far, far behind, the US came in second place (3.5%) and Taiwan in third place (3%).
L3/4 DDoS attacks: Top attacked countries compared to all traffic
When normalizing the amount of attack traffic compared to all traffic to a country, China remains in first place and the US disappears from the top ten. Cloudflare saw that 73% of traffic to China Internet networks were attacks. However, the normalized ranking changes from second place on, with the Netherlands receiving the second-highest proportion of attack traffic (representing 35% of the country’s overall traffic), closely followed by Thailand, Taiwan and Brazil.
L3/4 DDoS attacks: Top attacked countries compared to their own traffic
Top attack vectors
The Domain Name System, or DNS, serves as the phone book of the Internet. DNS helps translate the human-friendly website address (e.g., www.cloudflare.com) to a machine-friendly IP address (e.g., 104.16.124.96). By disrupting DNS servers, attackers impact the machines’ ability to connect to a website, and by doing so making websites unavailable to users.
For the second consecutive quarter, DNS-based DDoS attacks were the most common. Almost 47% of all attacks were DNS-based. This represents a 44% increase compared to the previous quarter. SYN floods remain in second place, followed by RST floods, UDP floods, and Mirai attacks.
Top attack vectors
Emerging threats – reduced, reused and recycled
Aside from the most common attack vectors, we also saw significant increases in lesser known attack vectors. These tend to be very volatile as threat actors try to “reduce, reuse and recycle” older attack vectors. These tend to be UDP-based protocols that can be exploited to launch amplification and reflection DDoS attacks.
One well-known tactic that we continue to see is the use of amplification/reflection attacks. In this attack method, the attacker bounces traffic off of servers, and aims the responses towards their victim. Attackers are able to aim the bounced traffic to their victim by various methods such as IP spoofing.
Another form of reflection can be achieved differently in an attack named ‘DNS Laundering attack’. In a DNS Laundering attack, the attacker will query subdomains of a domain that is managed by the victim’s DNS server. The prefix that defines the subdomain is randomized and is never used more than once or twice in such an attack. Due to the randomization element, recursive DNS servers will never have a cached response and will need to forward the query to the victim’s authoritative DNS server. The authoritative DNS server is then bombarded by so many queries until it cannot serve legitimate queries or even crashes all together.
Illustration of a reflection and amplification attack
Overall in Q3, Multicast DNS (mDNS) based DDoS attacks was the attack method that increased the most. In second place were attacks that exploit the Constrained Application Protocol (CoAP), and in third, the Encapsulating Security Payload (ESP). Let’s get to know those attack vectors a little better.
Main emerging threats
mDNS DDoS attacks increased by 456%
Multicast DNS (mDNS) is a UDP-based protocol that is used in local networks for service/device discovery. Vulnerable mDNS servers respond to unicast queries originating outside the local network, which are ‘spoofed’ (altered) with the victim’s source address. This results in amplification attacks. In Q3, we noticed a large increase of mDNS attacks; a 456% increase compared to the previous quarter.
CoAP DDoS attacks increased by 387%
The Constrained Application Protocol (CoAP) is designed for use in simple electronics and enables communication between devices in a low-power and lightweight manner. However, it can be abused for DDoS attacks via IP spoofing or amplification, as malicious actors exploit its multicast support or leverage poorly configured CoAP devices to generate large amounts of unwanted network traffic. This can lead to service disruption or overloading of the targeted systems, making them unavailable to legitimate users.
ESP DDoS attacks increased by 303%
The Encapsulating Security Payload (ESP) protocol is part of IPsec and provides confidentiality, authentication, and integrity to network communications. However, it could potentially be abused in DDoS attacks if malicious actors exploit misconfigured or vulnerable systems to reflect or amplify traffic towards a target, leading to service disruption. Like with other protocols, securing and properly configuring the systems using ESP is crucial to mitigate the risks of DDoS attacks.
Ransom DDoS attacks
Occasionally, DDoS attacks are carried out to extort ransom payments. We’ve been surveying Cloudflare customers over three years now, and have been tracking the occurrence of Ransom DDoS attack events.
Comparison of Ransomware and Ransom DDoS attacks
Unlike Ransomware attacks, where victims typically fall prey to downloading a malicious file or clicking on a compromised email link which locks, deletes, or leaks their files until a ransom is paid, Ransom DDoS attacks can be much simpler for threat actors to execute. Ransom DDoS attacks bypass the need for deceptive tactics such as luring victims into opening dubious emails or clicking on fraudulent links, and they don’t necessitate a breach into the network or access to corporate resources.
Over the past quarter, reports of Ransom DDoS attacks continue to decrease. Approximately 8% of respondents reported being threatened or subject to Random DDoS attacks, which continues a decline we’ve been tracking throughout the year. This is a continued decline that we’ve been tracking throughout the year. Hopefully it is because threat actors have realized that organizations will not pay them (which is our recommendation).
Ransom DDoS attacks by quarter
However, keep in mind that this is also very seasonal, and we can expect an increase in ransom DDoS attacks during the months of November and December. If we look at Q4 numbers from the past three years, we can see that Ransom DDoS attacks have been significantly increasing YoY in November. In previous Q4s, it reached a point where one out of every four respondents reported being subject to Ransom DDoS attacks.
Improving your defenses in the era of hyper-volumetric DDoS attacks
In the past quarter, we saw an unprecedented surge in DDoS attack traffic. This surge was largely driven by the hyper-volumetric HTTP/2 DDoS attack campaign.
Cloudflare customers using our HTTP reverse proxy, i.e. our CDN/WAF services, are already protected from these and other HTTP DDoS attacks. Cloudflare customers that are using non-HTTP services and organizations that are not using Cloudflare at all are strongly encouraged to use an automated, always-on HTTP DDoS Protection service for their HTTP applications.
It’s important to remember that security is a process, not a single product or flip of a switch. Atop of our automated DDoS protection systems, we offer comprehensive bundled features such as firewall, bot detection, API protection, and caching to bolster your defenses. Our multi-layered approach optimizes your security posture and minimizes potential impact. We’ve also put together a list of recommendations to help you optimize your defenses against DDoS attacks, and you can follow our step-by-step wizards to secure your applications and prevent DDoS attacks.
Interesting article about the Snowden documents, including comments from former Guardian editor Ewen MacAskill
MacAskill, who shared the Pulitzer Prize for Public Service with Glenn Greenwald and Laura Poitras for their journalistic work on the Snowden files, retired from The Guardian in 2018. He told Computer Weekly that:
As far as he knows, a copy of the documents is still locked in the New York Times office. Although the files are in the New York Times office, The Guardian retains responsibility for them.
As to why the New York Times has not published them in a decade, MacAskill maintains “this is a complicated issue.” “There is, at the very least, a case to be made for keeping them for future generations of historians,” he said.
Why was only 1% of the Snowden archive published by the journalists who had full access to it? Ewen MacAskill replied: “The main reason for only a small percentage—though, given the mass of documents, 1% is still a lot—was diminishing interest.”
[…]
The Guardian’s journalist did not recall seeing the three revelations published by Computer Weekly, summarized below:
The NSA listed Cavium, an American semiconductor company marketing Central Processing Units (CPUs)—the main processor in a computer which runs the operating system and applications—as a successful example of a “SIGINT-enabled” CPU supplier. Cavium, now owned by Marvell, said it does not implement back doors for any government.
The NSA compromised lawful Russian interception infrastructure, SORM. The NSA archive contains slides showing two Russian officers wearing jackets with a slogan written in Cyrillic: “You talk, we listen.” The NSA and/or GCHQ has also compromised key lawful interception systems.
Among example targets of its mass-surveillance programme, PRISM, the NSA listed the Tibetan government in exile.
Those three pieces of info come from Jake Appelbaum’s Ph.D. thesis.
Женя Лазарова е невроучен и психолог. Завършила е магистратура и е защитила докторат в Оксфорд. Дисертацията ѝ разглежда процесите, чрез които мозъкът формира ново знание. Изводите, до които достига, и опитът ѝ с различни образователни системи превръщат в нейна кауза осъвременяването на образованието по начин, съобразен с естествените процеси на учене.
Работата ѝ като консултант в отдела по обществени политики и стратегии на „Делойт“ – Лондон я прави и защитник на убеждението, че всяка промяна в големи публични системи като образованието трябва да се опре на достиженията на науката, но и да вземе под внимание интересите на всички участници в системата, както и различните експертности, необходими за създаването на ефективни иновации и добри практики.
Може ли системи като образованието да имат развитие, основано на данни?
Аз съм учен и бизнес консултант. Това са две професии, които са 100% базирани на данни – емпирични данни, информация за добри практики, данни къде се намираш, какъв ти е локалният контекст, каква е обратната връзка от потребителите, тоест данни, които непрекъснато трябва да се събират.
Като невроучен бих започнала с данните, със знанието как изобщо протича процесът на научаване. Мозъкът се учи най-добре чрез преживяване, особено в детска възраст. Колкото повече сетива са ангажирани при натрупването на опит, токова по-устойчиво знание може да се създаде. Затова абстрактните дефиниции или сухата фактология без предистория, контекст и свързаност са много трудни за запомняне – защото мозъкът не може да ги свърже с никакъв реален опит, оценява ги като ненужни и много лесно ги изхвърля.
Вие говорите в много свои участия за зазубрянето (или запаметяването на набор от факти) като основа, на която е построено традиционното образование още в Средновековието и която в ХХI век губи своята ефективност. Това обаче продължава да е фундамент на образованието. Не е ли сериозна революция да го отхвърлим?
В моя TED Talk показвам снимки на различни пространства отпреди сто години – как изглежда библиотека преди сто години, как изглежда производствена среда и една класна стая. Между класната стая отпреди сто години и днес няма почти никаква разлика. Докато всички останали аспекти на живота са се променили много – детският труд, достъпът до знание, науката. Образованието е единственото, което се затруднява да преодолее това наследство.
Образованието днес все още носи белезите на своя произход, които вече отдавна не са ефективни, нито дори полезни. Част от тях са от времето на религиозните и килийните училища – например нуждата от запаметяване на случайна поредица от факти, които понякога дори не разбираш. Който е можел да зазубри Библията на латински или на старогръцки, е бил оценяван като най-умен и нямало да работи тежък ръчен труд.
По-късно се наслагва и стандартизацията като подход. По време на индустриалната революция е трябвало да се обучават работници с идентични знания и умения. И последният аспект, който исторически е повлиял върху образованието, е дисциплината или сляпото подчинение. Те са били необходими на военното обучение, чиято идея не е да формира хора, които мислят индивидуално.
Тези подходи видимо не съответстват на нуждите на децата в съвременния свят. Стандартизацията унищожава способността за творчество и творческото мислене, както и възможността за развиване на уникалните таланти на всяко дете. Зазубрянето не развива когнитивните функции, дори паметта не развива. А подчинението елиминира възможността човек да развие лична отговорност за действията си.
Казвате, че ученето наизуст не развива паметта?
Да, категорично. Семантичната памет се базира на взаимовръзки между знанията и тяхната релевантност, които не се формират адекватно при назубрена информация и тя твърде лесно се забравя. Но по-важното е, че този тип учене не развива интелекта. Аз съм работила няколко години в МЕНСА – организация за хора с високо IQ. Много време изучавах различни тестове за интелигентност и с абсолютна сигурност мога да кажа, че няма тест за интелигентност, който да измерва способността за зазубряне. Има тестове за краткотрайна памет, които обичайно са включени в пакет за измерване на различни видове интелигентност – пространствена, математическа, вербална и др., които в по-голямата си част се игнорират от този тип учене.
Какво е необходимо тогава, за да се развива интелектът, личността?
Необходимо е образование, което подкрепя цялостното развитие на едно дете. Всичките му потребности – на психиката, на развитието на мозъка, на емоционалното и на физическото му развитие. Всички тези аспекти са еднакво важни, за да може да се развие детето като пълноценна личност, да има пълноценна професионална и лична реализация, тоест да бъде щастлив човек в личния си живот.
И е ключово ученето да е съобразено с особеностите на възрастта.
Различно ли е ученето в различните възрасти?
Много. Различните способности на мозъка се развиват с различна скорост. Сетивата, когнитивните способности, емоционалното и социалното съзряване се развиват в различни етапи, във всяка възраст мозъкът има нужда да развива различни умения и следователно учи по различен начин. Това са много интуитивни концепции и когато ги обяснявам, родителите и учениците ги припознават с лекота.
В ранна възраст децата градят своя база данни от знания чрез сетивни преживявания. Тоест детето иска да вижда, да чува, да пипа. Затова децата са толкова любопитни, имат нужда от стимулация, задават много въпроси, искат да разберат как се свързват всички тези неща, които виждат – как се казва това, дай да го пипна, издава ли звук, как се ползва и т.н. Така се създават връзки, които в един момент помагат на детето да започне да класифицира, да мисли за важните различия, на базата на които определяме и кои са маловажните различия.
Например едно куче не става не-куче в зависимост от това дали лае по-силно, или по-тихо; но ако мяука – това определено го прави не-куче. Много елементарно звучи този принцип, но тук говорим за изграждане на умения, които са много важни по-нататък в живота и които всъщност се измерват с тестовете за интелигентност. В момента обаче образованието не ги развива.
До 12–13-годишна възраст е много активно имплицитното учене – способността да се извличат общи принципи от конкретни примери. Тоест ако първото куче, което виждаш в живота си, е черно, вероятно ще предположиш, че всички кучета са черни, докато не започнеш да виждаш други цветове и да адаптираш знанието си. Това е и причината децата да учат по-лесно езици, защото, когато детето чуе едно изречение, може да извлече граматическото правило от него неусетно и по подразбиране. В по-късна възраст това учене става доста по-трудно, защото тогава се затварят много критични периоди в развитието на мозъка, включително способността да учим чужди езици като майчиния.
Способността за абстракция идва още по-късно, когато имаш вече голяма и взаимосвързана база данни.
Може ли да дадете съществуващи примери за съобразяване с възрастта, за да онагледим по-добре за какво говорите?
Например когато учат за Бай Ганьо в седми клас, децата не осмислят напълно иронизирането на този персонаж. Те виждат един герой, който е българин и не се държи добре в чужбина – всички му се подиграват. В тази възраст децата все още учат имплицитно и резултатът е, че приписват характеристиките на Бай Ганьо на всички българи, включително ги приемат в своята собствена идентичност. Един такъв герой не би трябвало да се изучава преди гимназиалния етап, а да се въведе като надграждане, след като детето е достигнало необходимата емоционална и социална зрялост, за да може да го разтълкува и осмисли като критика на определени типажи в обществото.
Какво означава надграждане? В момента се учи една глава от „Бай Ганьо“ в седми клас, а цялото произведение – в гимназията.
В никакъв случай нямам предвид да се извади една глава от дадено произведение. Конкретно при примера с Бай Ганьо имам предвид децата да са достатъчно социално и емоционално съзрели, за да разбират идеологическите концепции, иронията и да могат да осмислят героя добре, без това да навреди на психическото им развитие и на себеуважението. А за да се осмисли пълноценно този персонаж, разбира се, че е необходимо да се прочете цялото произведение.
Говоря за надграждане на умения по начин, който буквално трябва да е физиологично адекватен.
Знанието не е линейно, нито има универсален път към него. Универсално и линейно е физиологичното и психическото развитие. На тях трябва да бъде базирано надграждането в образователната система. А пътят към знанието трябва да е гъвкав и да оставя възможности за персонализиране според интересите и способностите на детето. Това е изпитан подход, който работи много добре. Има образователни системи, които са силно персонализирани и съобразени с индивидуалния интерес на децата и предоставят много възможности за избор на детето и родителите му. Линейният подход към знанието не отговаря на естествения начин, по който човекът формира знания.
Каква е връзката между остарелите принципи на масовото образование и академичните резултати на децата?
Ученето има нужда от постоянна и качествена обратна връзка. Академичните резултати не са достатъчна обратна връзка – ние дори не сме напълно наясно какво точно измерваме с тях.
Вземете например външното оценяване. То би трябвало да измерва качеството на работа на училищата, но на практика измерва качеството на частните уроци или финансовата възможност на родителите да си ги позволят, както и други външни за системата фактори. Така училищата непрекъснато събират някакви данни, но на практика има много малко адекватни измерители. Ние не измерваме до каква степен образованието помага на децата да се развият така, че да станат успешни хора.
В съвременния свят успехът се определя от социално-емоционалната зрялост – както професионалният успех, така и личното благополучие. Има много примери за хора, които на 16 години напускат училище с дислексия, дефицит на вниманието или други особености на невроразвитието. Те не се чувстват успешни в академична среда, но извън системата успяват именно със социално-емоционалните си умения. Всякакви фактологични знания могат да се усвоят по-късно в живота, но социално-емоционалните умения много трудно могат да се наваксат. А относно тези умения не просто не събираме никакви данни, ние изобщо не ги смятаме за принадлежащи към образованието.
Другата обратна връзка – от ученика към учителя и МОН – също липсва.
Как трябва да учат децата, за да изградят съвременни умения?
За мен има изкуствена разделителна линия между педагогическата наука, от една страна, и невронауките, психологията, от друга. Когнитивната психология, невронауките от десетилетия изследват и развиват познанието ни за това как човек учи – базови науки, на които би следвало да е основана педагогиката. Това е една от големите бариери, които трябва да прескочим, за да приложим научните достижения от последните 20 години. България в това отношение не бива да е на опашката, защото в много системи този преход вече е в ход. Част от моята концепция е, че редица сериозни и дълбоки социални проблеми са вкоренени в образованието ни и може да бъдат разрешени само ако ги адресираме правилно. Но за целта трябва да придобием повече интелектуално самочувствие, че ние тук можем да разработваме добри решения – няма нужда все да чакаме някой да ни ги даде наготово от чужбина.
Чувала съм обаче от учители репликата, че тяхната работа е да обучават, а не да възпитават.
И аз съм я чувала, да. Но социално-емоционалните умения имат много по-дълбоко съдържание от възпитанието. Възпитанието се е превърнало в нещо като социален лубрикант, имитация на личностна зрялост. Научили сме се да имитираме тази социална зрялост, без наистина да я развиваме вътрешно. Учим децата да казват „благодаря“, но не ги учим как да изпитват истинска благодарност, учим ги да казват „извинете“, но не ги учим да уважават пространството и границите на другите. Развиването на тези умения не може да остане само извън образованието.
Ако погледнем какво е положението в момента, у нас едни експерти казват, че изграждането или възпитаването на социално-емоционални умения не е работа на училището, а на семейството, други – че то вече се прави в училище, а трети – че е заложено в закона, но не се прави. За да разберем кой е прав, трябва да погледнем данните. В случая това са данните за психичното здраве на децата ни. А те показват, че българските деца и младежи са на водещи места по негативните показатели за ментално здраве, като агресия и тормоз в училище, кибертормоз, консумация на алкохол и цигари, консумация на марихуана и наркотични вещества, ранна сексуализация, тревожност и т.н.
И така, какво ни казват данните за мнението на експертите, които смятат, че социално-емоционалното учене не е работа на училището или обратното – че то вече се прави? Казват ни, че каквото и да се прави в момента, няма резултат. Казват ни, че децата имат някаква огромна потребност, която не е адресирана. Краткият отговор на въпроса чия е отговорността – на училището или на семейството, е: и на двете. Трябва да се случва в партньорство. Според мен това е най-голямото предизвикателство и най-големият приоритет на образованието в момента.
Това не натоварва ли учителите с твърде много очаквания?
По-скоро променя очакванията към учителите. Вярвам, че в съвременното образование ролята на учителя е да бъде ментор, да насочва децата и да бъде човешкият пример за подражание. Родителят и учителят са най-авторитетните възрастни в живота на едно дете, от тях се възприемат много от тези принципи, които ние се опитваме да изградим у децата като умения за живот. Човешката роля на учителя ще бъде все по-незаменима в бъдещето, защото тя няма как да бъде изпълнена от изкуствен интелект. Голямата част от знанията вече може да се добият от различни източници и учителят няма да е толкова необходим като приносител на фактологични знания. Но ще е ключов за предаване на тези човешки умения, които ни правят хора и които ние трябва да съхраним в децата.
Например един учител трябва да има умения за емоционална регулация, за да научи децата на емоционална регулация. Ако той крещи в час, но може да даде на децата дефиниция какво е емоционална регулация, защото работата му е само да обучава, това ще създаде недоверие и няма да доведе до резултата, който бихме искали да имаме, а именно – децата да придобият умението за емоционална регулация и да могат да го прилагат в правилните ситуации, а не само да назубрят дефиницията за него. Разбира се, учителите също трябва да бъдат адекватно подкрепени в развиването на уменията, които целим да предадем на следващото поколение.
Казахте, че има системи, в които преходът от зазубряне към социално-емоционални умения вече е започнал. Можем ли да черпим опит как да адаптираме системата към новото? Или по-конкретно, как променяме възрастните, които трябва да променят системата?
Това е въпрос за един милион долара. Извън шегата, съществуват много системи, както и неформални образователни форми, в които се наблюдават различни добри практики. Не бих казала, че има една напълно обновена образователна система, съобразена с всичко, което знае науката. Но например в скандинавските държави, в Уелс, в Япония са много напред в прилагането на социално-емоционалното учене.
Можем ли да извлечем посланието, че не трябва да се страхуваме да променяме образователната система?
Да, по принцип не трябва да се страхуваме от промяната и развитието, но същевременно на нас ни е еволюционно заложено да се страхуваме. Всяка промяна предизвиква естествена реакция на резистентност, защото необходимостта да се адаптираме към новостите изисква повече ресурси.
Пътят е непрекъснато да търсим начини да преодоляваме тази естествена резистентност и това е задължително във всяка обществена политика, включваща промяна в голям мащаб.
Живеем във време, в което да научиш това, което поискаш, в момент, в който го искаш, е по-лесно от когато и да било преди в човешката история. Въпреки това, или може би имено заради това, формалното образование преживява криза на идентичността. В рубриката „Разговори за образованието" Надежда Цекулова и нейните събеседници търсят философията, смисъла и формите на онова, което наричаме „образование“, в третата декада на 21 в.
Цвете да ни учи на вода и суша. Себе си посяхме, себе си поливахме с най-милите си мили намерения.
Какво посяхме в дланите си, облак да поникне. В облака да ходим с безразсъдните си пикници, надолу да залитаме с озон в гърдите.
Въздуха посяхме, вдишан в бързината между две умирания. Ти тогава беше спряла в сънищата си, убодена на подлото вретено; помниш ли, че идвах теб ли да избавя, ти ли мен.
Какво посяхме в дланите си, плод да ни огрее. Плод да ни огрее горе в синевата над притихналите болници; и колко светли да се носим цяла есен. Слънцето посяхме, сушата на цветето.
Какво посяхме в обичливите си длани, челюст да поникне. Челюст от стомана да прониже гърлото ни. Себе си посяхме, себе си поливахме с най-милите си мили намерения.
Никола Петров (р. 1987) e автор на книгите „Въжеиграч“ (ИК „Жанет 45“, 2012), „Бяс/бяло“ (Фондация „Литературен вестник“, 2017) и „Не са чудовища“ („Издателство за поезия ДА“ (2021), награда „Перото“ и номинация за наградата „Иван Николов“). От 2015 г. насам участва в редица издания на представлението „Актьори срещу поети“ в Театрална работилница „Сфумато“. Негова поезия е превеждана на английски, испански, италиански, руски и беларуски. Работи като медиен анализатор.
Според Екатерина Йосифова „четящият стихотворение сутрин… добре понася другите часове“ от деня. Убедени, че поезията държи умовете ни будни, а сърцата – отворени, в края на всеки месец ви предлагаме по едно стихотворение. Защото и в най-смутни времена доброто стихотворение е добра новина.
As the scale and complexity of microservices and distributed applications continues to expand, customers are seeking guidance for building cost-efficient infrastructure supporting operational analytics use cases. Operational analytics is a popular use case with Amazon OpenSearch Service. A few of the defining characteristics of these use cases are ingesting a high volume of time series data and a relatively low volume of querying, alerting, and running analytics on ingested data for real-time insights. Although OpenSearch Service is capable of ingesting petabytes of data across storage tiers, you still have to provision capacity to migrate between hot and warm tiers. This adds to the cost of provisioned OpenSearch Service domains.
The time series data often contains logs or telemetry data from various sources with different values and needs. That is, logs from some sources need to be available in a hot storage tier longer, whereas logs from other sources can tolerate a delay in querying and other requirements. Until now, customers were building external ingestion systems with the Amazon Kinesis family of services, Amazon Simple Queue Service (Amazon SQS), AWS Lambda, custom code, and other similar solutions. Although these solutions enable ingestion of operational data with various requirements, they add to the cost of ingestion.
In general, operational analytics workloads use anomaly detection to aid domain operations. This assumes that the data is already present in OpenSearch Service and the cost of ingestion is already borne.
With the addition of a few recent features of Amazon OpenSearch Ingestion, a fully managed serverless pipeline for OpenSearch Service, you can effectively address each of these cost points and build a cost-effective solution. In this post, we outline a solution that does the following:
Uses conditional routing of Amazon OpenSearch Ingestion to separate logs with specific attributes and store those, for example, in Amazon OpenSearch Service and archive all events in Amazon S3 to query with Amazon Athena
Uses in-stream anomaly detection with OpenSearch Ingestion, thereby removing the cost associated with compute needed for anomaly detection after ingestion
In this post, we use a VPC flow logs use case to demonstrate the solution. The solution and pattern presented in this post is equally applicable to larger operational analytics and observability use cases.
Solution overview
We use VPC flow logs to capture IP traffic and trigger processing notifications to the OpenSearch Ingestion pipeline. The pipeline filters the data, routes the data, and detects anomalies. The raw data will be stored in Amazon S3 for archival purposes, then the pipeline will detect anomalies in the data in near-real time using the Random Cut Forest (RCF) algorithm and send those data records to OpenSearch Service. The raw data stored in Amazon S3 can be inexpensively retained for an extended period of time using tiered storage and queried using the Athena query engine, and also visualized using Amazon QuickSight or other data visualization services. Although this walkthrough uses VPC flow log data, the same pattern applies for use with AWS CloudTrail, Amazon CloudWatch, any log files as well as any OpenTelemetry events, and custom producers.
The following is a diagram of the solution that we configure in this post.
In the following sections, we provide a walkthrough for configuring this solution.
The patterns and procedures presented in this post have been validated with the current version of OpenSearch Ingestion and the Data Prepper open-source project version 2.4.
Prerequisites
Complete the following prerequisite steps:
We will be using a VPC for demonstration purposes for generating data. Set up the VPC flow logs to publish logs to an S3 bucket in text format. To optimize S3 storage costs, create a lifecycle configuration on the S3 bucket to transition the VPC flow logs to different tiers or expire processed logs. Make a note of the S3 bucket name you configured to use in later steps.
Set up an OpenSearch Service domain. Make a note of the domain URL. The domain can be either public or VPC based, which is the preferred configuration.
Create an S3 bucket for storing archived events, and make a note of S3 bucket name. Configure a resource-based policy allowing OpenSearch Ingestion to archive logs and Athena to read the logs.
Configure Athena or validate that Athena is configured on your account. For instructions, refer to Getting started.
Configure an SQS notification
VPC flow logs will write data in Amazon S3. After each file is written, Amazon S3 will send an SQS notification to notify the OpenSearch Ingestion pipeline that the file is ready for processing.
If the data is already stored in Amazon S3, you can use the S3 scan capability for a one-time or scheduled loading of data through the OpenSearch Ingestion pipeline.
Use AWS CloudShell to issue the following commands to create the SQS queues VpcFlowLogsNotifications and VpcFlowLogsNotifications-DLQ that we use for this walkthrough.
Create a dead-letter queue with the following code
To configure the S3 bucket to send events to the SQS queue, use the following code (provide the name of your S3 bucket used for storing VPC flow logs):
__AWS_S3_BUCKET_ARCHIVE__ – S3 bucket for archiving processed events
__AMAZON_OPENSEARCH_DOMAIN_URL__ – URL of OpenSearch Service domain
__REGION__ – Region (for example, us-east-1)
In the Network settings section, specify your network access. For this walkthrough, we are using VPC access. We provided the VPC and private subnet locations that have connectivity with the OpenSearch Service domain and security groups.
Leave the other settings with default values, and choose Next.
Review the configuration changes and choose Create pipeline.
It will take a few minutes for OpenSearch Service to provision the environment. While the environment is being provisioned, we’ll walk you through the pipeline configuration. Entry-pipeline listens for SQS notifications about newly arrived files and triggers the reading of VPC flow log compressed files:
…
entry-pipeline:
  source:
     s3:
…
The pipeline branches into two sub-pipelines. The first stores original messages for archival purposes in Amazon S3 in read-optimized Parquet format; the other applies analytics routes events to the OpenSearch Service domain for fast querying and alerting:
The pipeline archive-pipeline aggregates messages in 50 MB chunks or every 60 seconds and writes a Parquet file to Amazon S3 with the schema inferred from the message. Also, a prefix is added to help with partitioning and query optimization when reading a collection of files using Athena.
Now that we have reviewed the basics, we focus on the pipeline that detects anomalies and sends only high-value messages that deviate from the norm to OpenSearch Service. It also stores Internet Control Message Protocols (ICMP) messages in OpenSearch Service.
We applied a grok processor to parse the message using a predefined regex for parsing VPC flow logs, and also tagged all unparsable messages with the grok_match_failure tag, which we use to remove headers and other records that can’t be parsed:
In the analytics pipeline, we dropped all records that can’t be parsed using the hasTags method based on the tag that we assigned at the time of parsing. We also removed all records that don’t contains useful data for anomaly detection.
…
  - drop_events:
        drop_when: "hasTags(\"grok_match_failure\") or \"/log-status\" == \"NODATA\""
…
Then we applied probabilistic sampling using the tail_sampler processor for all accepted messages grouped by source and destination addresses and sent those to the sink with all messages that were not accepted. This helps reduce the volume of messages within the selected cardinality keys, with a focus on all messages that weren’t accepted, and keeps a sample representation of messages that were accepted.
Then we used the anomaly detector processor to identify anomalies within the cardinality key pairs or source and destination addresses in our example. The anomaly detector processor creates and trains RCF models for a hashed value of keys, then uses those models to determine whether newly arriving messages have an anomaly based on the trained data. In our demonstration, we use bytes data to detect anomalies:
We set verbose:true to instruct the detector to emit the message every time an anomaly is detected. Also, for this walkthrough, we used a non-default sample_size for training the model.
When anomalies are detected, the anomaly detector returns a complete record and adds
"deviation_from_expected":value,"grade":value attributes that signify the deviation value and severity of the anomaly. These values can be used to determine routing of such messages to OpenSearch Service, and use per-document monitoring capabilities in OpenSearch Service to alert on specific conditions.
Currently, OpenSearch Ingestion creates up to 5,000 distinct models based on cardinality key values per compute unit. This limit is observed using the anomaly_detector.RCFInstances.value CloudWatch metric. It’s important to select a cardinality key-value pair to avoid exceeding this constraint. As development of the Data Prepper open-source project and OpenSearch Ingestion continues, more configuration options will be added to offer greater flexibility around model training and memory management.
The OpenSearch Ingestion pipeline exposes the anomaly_detector.cardinalityOverflow.count metric through CloudWatch. This metric indicates a number of key value pairs that weren’t run by the anomaly detection processor during a period of time as the maximum number of RCFInstances per compute unit was reached. To avoid this constraint, a number of compute units can be scaled out to provide additional capacity for hosting additional instances of RCFInstances.
In the last sink, the pipeline writes records with detected anomalies along with deviation_from_expected and grade attributes to the OpenSearch Service domain:
Because only anomaly records are being routed and written to the OpenSearch Service domain, we are able to significantly reduce the size of our domain and optimize the cost of our sample observability infrastructure.
Another sink was used for storing all ICMP records in a separate index in the OpenSearch Service domain:
In this section, we review the configuration of Athena for querying archived events data stored in Amazon S3. Complete the following steps:
Navigate to the Athena query editor and create a new database called vpc-flow-logs-archive-database using the following command:
CREATE DATABASE `vpc-flow-logs-archive`
2. On the Database menu, choose vpc-flow-logs-archive.
In the query editor, enter the following command to create a table (provide the S3 bucket used for archiving processed events). For simplicity, for this walkthrough, we create a table without partitions.
Run the following query to validate that you can query the archived VPC flow log data:
SELECT * FROM "vpc-flow-logs-archive"."vpc-flow-logs-data" LIMIT 10;
Because archived data is stored in its original format, it helps avoid issues related to format conversion. Athena will query and display records in the original format. However, it’s ideal to interact only with a subset of columns or parts of the messages. You can use the regexp_split function in Athena to split the message in the columns and retrieve certain columns. Run the following query to see the source and destination address groupings from the VPC flow log data:
SELECT srcaddr, dstaddr FROM (
   SELECT regexp_split(message, ' ')[4] AS srcaddr,
          regexp_split(message, ' ')[5] AS dstaddr,
          regexp_split(message, ' ')[14] AS status  FROM "vpc-flow-logs-archive"."vpc-flow-logs-data"
) WHERE status = 'OK'
GROUP BY srcaddr, dstaddr
ORDER BY srcaddr, dstaddr LIMIT 10;
This demonstrated that you can query all events using Athena, where archived data in its original raw format is used for the analysis. Athena is priced per data scanned. Because the data is stored in a read-optimized format and partitioned, it enables further cost-optimization around on-demand querying of archived streaming and observability data.
Clean up
To avoid incurring future charges, delete the following resources created as part of this post:
OpenSearch Service domain
OpenSearch Ingestion pipeline
SQS queues
VPC flow logs configuration
All data stored in Amazon S3
Conclusion
In this post, we demonstrated how to use OpenSearch Ingestion pipelines to build a cost-optimized infrastructure for log analytics and observability events. We used routing, filtering, aggregation, and anomaly detection in an OpenSearch Ingestion pipeline, enabling you to downsize your OpenSearch Service domain and create a cost-optimized observability infrastructure. For our example, we used a data sample with 1.5 million events with a pipeline distilling to 1,300 events with predicted anomalies based on source and destination IP pairs. This metric demonstrates that the pipeline identified that less than 0.1% of events were of high importance, and routed those to OpenSearch Service for visualization and alerting needs. This translates to lower resource utilization in OpenSearch Service domains and can lead to provisioning of smaller OpenSearch Service environments.
We encourage you to use OpenSearch Ingestion pipelines to create your purpose-built and cost-optimized observability infrastructure that uses OpenSearch Service for storing and alerting on high-value events. If you have comments or feedback, please leave them in the comments section.
About the Authors
Mikhail Vaynshteyn is a Solutions Architect with Amazon Web Services. Mikhail works with healthcare and life sciences customers to build solutions that help improve patients’ outcomes. Mikhail specializes in data analytics services.
Muthu Pitchaimani is a Search Specialist with Amazon OpenSearch Service. He builds large-scale search applications and solutions. Muthu is interested in the topics of networking and security, and is based out of Austin, Texas.
Today, we’re announcing a new capability for Amazon Simple Notification Service (Amazon SNS) message data protection. In this post, we show you how you can use this new capability to create custom data identifiers to detect and protect domain-specific sensitive data, such as your company’s employee IDs. Previously, you could only use managed data identifiers to detect and protect common sensitive data, such as names, addresses, and credit card numbers.
Overview
Amazon SNS is a serverless messaging service that provides topics for push-based, many-to-many messaging for decoupling distributed systems, microservices, and event-driven serverless applications. As applications become more complex, it can become challenging for topic owners to manage the data flowing through their topics. These applications might inadvertently start sending sensitive data to topics, increasing regulatory risk. To mitigate the risk, you can use message data protection to protect sensitive application data using built-in, no-code, scalable capabilities.
To discover and protect data flowing through SNS topics with message data protection, you can associate data protection policies to your topics. Within these policies, you can write statements that define which types of sensitive data you want to discover and protect. Within each policy statement, you can then define whether you want to act on data flowing inbound to an SNS topic or outbound to an SNS subscription, the AWS accounts or specific AWS Identity and Access Management (IAM) principals the statement applies to, and the actions you want to take on the sensitive data found.
Now, message data protection provides three actions to help you protect your data. First, the audit operation reports on the amount of sensitive data found. Second, the deny operation helps prevent the publishing or delivery of payloads that contain sensitive data. Third, the de-identify operation can mask or redact the sensitive data detected. These no-code operations can help you adhere to a variety of compliance regulations, such as Health Insurance Portability and Accountability Act (HIPAA), Federal Risk and Authorization Management Program (FedRAMP), General Data Protection Regulation (GDPR), and Payment Card Industry Data Security Standard (PCI DSS).
This message data protection feature coexists with the message data encryption feature in SNS, both contributing to an enhanced security posture of your messaging workloads.
Managed and custom data identifiers
After you add a data protection policy to your SNS topic, message data protection uses pattern matching and machine learning models to scan your messages for sensitive data, then enforces the data protection policy in real time. The types of sensitive data are referred to as data identifiers. These data identifiers can be either managed by Amazon Web Services (AWS) or custom to your domain.
Custom data identifiers (CDI), on the other hand, enable you to define custom regular expressions in the data protection policy itself, then refer to them from policy statements. Using custom data identifiers, you can scan for business-specific sensitive data, which managed data identifiers can’t. For example, you can use a custom data identifier to look for company-specific employee IDs in SNS message payloads. Internally, SNS has guardrails to make sure custom data identifiers are safe and that they add only low single-digit millisecond latency to message processing.
In a data protection policy statement, you refer to a custom data identifier using only the name that you have given it, as follows:
Note that custom data identifiers can be used in conjunction with managed data identifiers, as part of the same data protection policy statement. In the preceding example, both MyCompanyEmployeeId and CreditCardNumber are in scope.
For more information, see Data Identifiers, in the SNS Developer Guide.
Inbound and outbound data directions
In addition to the DataIdentifier property, each policy statement also sets the DataDirection property (whose value can be either Inbound or Outbound) as well as the Principal property (whose value can be any combination of AWS accounts, IAM users, and IAM roles).
When you use message data protection for data de-identification and set DataDirection to Inbound, instances of DataIdentifier published by the Principal are masked or redacted before the payload is ingested into the SNS topic. This means that every endpoint subscribed to the topic receives the same modified payload.
When you set DataDirection to Outbound, on the other hand, the payload is ingested into the SNS topic as-is. Then, instances of DataIdentifier are either masked, redacted, or kept as-is for each subscribing Principal in isolation. This means that each endpoint subscribed to the SNS topic might receive a different payload from the topic, with different sensitive data de-identified, according to the data access permissions of its Principal.
The following snippet expands the example data protection policy to include the DataDirection and Principal properties.
To complete the policy statement, you need to set the Operation property, which informs the SNS topic of the action that it should take when it finds instances of DataIdentifer in the outbound payload.
The following snippet expands the data protection policy to include the Operation property, in this case using the Deidentify object, which in turn supports masking and redaction.
In this example, the MaskConfig object instructs the SNS topic to mask instances of CreditCardNumber in Outbound messages to subscriptions created by ReportingApplicationRole, using the MaskWithCharacter value, which in this case is the hash symbol (#). Alternatively, you could have used the RedactConfig object instead, which would have instructed the SNS topic to simply cut the sensitive data off the payload.
The following snippet shows how the outbound payload is masked, in real time, by the SNS topic.
// original message published to the topic:
My credit card number is 4539894458086459

// masked message delivered to subscriptions created by ReportingApplicationRole:
My credit card number is ################
Consider a company where managers use an internal expense report management application where expense reports from employees can be reviewed and approved. Initially, this application depended only on an internal payment application, which in turn connected to an external payment gateway. However, this workload eventually became more complex, because the company started also paying expense reports filed by external contractors. At that point, the company built a mobile application that external contractors could use to view their approved expense reports. An important business requirement for this mobile application was that specific financial and PII data needed to be de-identified in the externally displayed expense reports. Specifically, both the credit card number used for the payment and the internal employee ID that approved the payment had to be masked.
Figure 1: Expense report processing application
To distribute the approved expense reports to both the payment application and the reporting application that backed the mobile application, the company used an SNS topic with a data protection policy. The policy has only one statement, which masks credit card numbers and employee IDs found in the payload. This statement applies only to the IAM role that the company used for subscribing the AWS Lambda function of the reporting application to the SNS topic. This access permission configuration enabled the Lambda function from the payment application to continue receiving the raw data from the SNS topic.
The data protection policy from the previous section addresses this use case. Thus, when a message representing an expense report is published to the SNS topic, the Lambda function in the payment application receives the message as-is, whereas the Lambda function in the reporting application receives the message with the financial and PII data masked.
To automate the provisioning of the resources and the data protection policy of the example expense management use case, we’re going to use CloudFormation templates. You have two options for deploying the resources:
Alternatively, use the following four CloudFormation templates, in order. Allow time for each stack to complete before deploying the next stack.
Deploy using the individual CloudFormation templates in sequence
Prerequisites template: This first template provisions two IAM roles with a managed policy that enables them to create SNS subscriptions and configure the subscriber Lambda functions. You will use these provisioned IAM roles in steps 3 and 4 that follow.
Topic owner template: The second template provisions the SNS topic along with its access policy and data protection policy.
Payment subscriber template: The third template provisions the Lambda function and the corresponding SNS subscription that comprise of the Payment application stack. When prompted, select the PaymentApplicationRole in the Permissions panel before running the template. Moreover, the CloudFormation console will require you to acknowledge that a CloudFormation transform might require access capabilities.
Reporting subscriber template: The final template provisions the Lambda function and the SNS subscription that comprise of the Reporting application stack. When prompted, select the ReportingApplicationRole in the Permissions panel, before running the template. Moreover, the CloudFormation console will require, once again, that you acknowledge that a CloudFormation transform might require access capabilities.
Figure 2: Select IAM role
Now that the application stacks have been deployed, you’re ready to start testing.
Testing the data de-identification operation
Use the following steps to test the example expense management use case.
In the Amazon SNS console, select the ApprovalTopic, then choose to publish a message to it.
In the SNS message body field, enter the following message payload, representing an external contractor expense report, then choose to publish this message:
In the CloudWatch console, select the log group for the PaymentLambdaFunction, then choose to view its latest log stream. Now look for the log stream entry that shows the message payload received by the Lambda function. You will see that no data has been masked in this payload, as the payment application requires raw financial data to process the credit card transaction.
Still in the CloudWatch console, select the log group for the ReportingLambdaFunction, then choose to view its latest log stream. Now look for the log stream entry that shows the message payload received by this Lambda function. You will see that the values for properties credit_card_number and employee_id have been masked, protecting the financial data from leaking into the external reporting application.
As shown, different subscribers received different versions of the message payload, according to their sensitive data access permissions.
Cleaning up the resources
After testing, avoid incurring usage charges by deleting the resources that you created. Open the CloudFormation console and delete the four CloudFormation stacks that you created during the walkthrough.
Conclusion
This post showed how you can use Amazon SNS message data protection to discover and protect sensitive data published to or delivered from your SNS topics. The example use case shows how to create a data protection policy that masks messages delivered to specific subscribers if the payloads contain financial or personally identifiable information.
If you have feedback about this post, submit comments in the Comments section below. If you have questions about this post, start a new thread on AWS re:Post or contact AWS Support.
Want more AWS Security how-to content, news, and feature announcements? Follow us on Twitter.
Unstructured data is information that doesn’t conform to a predefined schema or isn’t organized according to a preset data model. Unstructured information may have a little or a lot of structure but in ways that are unexpected or inconsistent. Text, images, audio, and videos are common examples of unstructured data. Most companies produce and consume unstructured data such as documents, emails, web pages, engagement center phone calls, and social media. By some estimates, unstructured data can make up to 80–90% of all new enterprise data and is growing many times faster than structured data. After decades of digitizing everything in your enterprise, you may have an enormous amount of data, but with dormant value. However, with the help of AI and machine learning (ML), new software tools are now available to unearth the value of unstructured data.
In this post, we discuss how AWS can help you successfully address the challenges of extracting insights from unstructured data. We discuss various design patterns and architectures for extracting and cataloging valuable insights from unstructured data using AWS. Additionally, we show how to use AWS AI/ML services for analyzing unstructured data.
Why it’s challenging to process and manage unstructured data
Unstructured data makes up a large proportion of the data in the enterprise that can’t be stored in a traditional relational database management systems (RDBMS). Understanding the data, categorizing it, storing it, and extracting insights from it can be challenging. In addition, identifying incremental changes requires specialized patterns and detecting sensitive data and meeting compliance requirements calls for sophisticated functions. It can be difficult to integrate unstructured data with structured data from existing information systems. Some view structured and unstructured data as apples and oranges, instead of being complementary. But most important of all, the assumed dormant value in the unstructured data is a question mark, which can only be answered after these sophisticated techniques have been applied. Therefore, there is a need to being able to analyze and extract value from the data economically and flexibly.
Solution overview
Data and metadata discovery is one of the primary requirements in data analytics, where data consumers explore what data is available and in what format, and then consume or query it for analysis. If you can apply a schema on top of the dataset, then it’s straightforward to query because you can load the data into a database or impose a virtual table schema for querying. But in the case of unstructured data, metadata discovery is challenging because the raw data isn’t easily readable.
You can integrate different technologies or tools to build a solution. In this post, we explain how to integrate different AWS services to provide an end-to-end solution that includes data extraction, management, and governance.
The solution integrates data in three tiers. The first is the raw input data that gets ingested by source systems, the second is the output data that gets extracted from input data using AI, and the third is the metadata layer that maintains a relationship between them for data discovery.
The following is a high-level architecture of the solution we can build to process the unstructured data, assuming the input data is being ingested to the raw input object store.
The steps of the workflow are as follows:
Integrated AI services extract data from the unstructured data.
These services write the output to a data lake.
A metadata layer helps build the relationship between the raw data and AI extracted output. When the data and metadata are available for end-users, we can break the user access pattern into additional steps.
In the metadata catalog discovery step, we can use query engines to access the metadata for discovery and apply filters as per our analytics needs. Then we move to the next stage of accessing the actual data extracted from the raw unstructured data.
The end-user accesses the output of the AI services and uses the query engines to query the structured data available in the data lake. We can optionally integrate additional tools that help control access and provide governance.
There might be scenarios where, after accessing the AI extracted output, the end-user wants to access the original raw object (such as media files) for further analysis. Additionally, we need to make sure we have access control policies so the end-user has access only to the respective raw data they want to access.
Now that we understand the high-level architecture, let’s discuss what AWS services we can integrate in each step of the architecture to provide an end-to-end solution.
The following diagram is the enhanced version of our solution architecture, where we have integrated AWS services.
Let’s understand how these AWS services are integrated in detail. We have divided the steps into two broad user flows: data processing and metadata enrichment (Steps 1–3) and end-users accessing the data and metadata with fine-grained access control (Steps 4–6).
Various AI services (which we discuss in the next section) extract data from the unstructured datasets.
The output is written to an Amazon Simple Storage Service (Amazon S3) bucket (labeled Extracted JSON in the preceding diagram). Optionally, we can restructure the input raw objects for better partitioning, which can help while implementing fine-grained access control on the raw input data (labeled as the Partitioned bucket in the diagram).
After the initial data extraction phase, we can apply additional transformations to enrich the datasets using AWS Glue. We also build an additional metadata layer, which maintains a relationship between the raw S3 object path, the AI extracted output path, the optional enriched version S3 path, and any other metadata that will help the end-user discover the data.
The AI extracted output is expected to be available as a delimited file or in JSON format. We can create an AWS Glue Data Catalog table for querying using Athena or Redshift Spectrum. Like the previous step, we can use Lake Formation policies for fine-grained access control.
Lastly, the end-user accesses the raw unstructured data available in Amazon S3 for further analysis. We have proposed integrating Amazon S3 Access Points for access control at this layer. We explain this in detail later in this post.
Now let’s expand the following parts of the architecture to understand the implementation better:
Using AWS AI services to process unstructured data
Using S3 Access Points to integrate access control on raw S3 unstructured data
Process unstructured data with AWS AI services
As we discussed earlier, unstructured data can come in a variety of formats, such as text, audio, video, and images, and each type of data requires a different approach for extracting metadata. AWS AI services are designed to extract metadata from different types of unstructured data. The following are the most commonly used services for unstructured data processing:
Amazon Comprehend – This natural language processing (NLP) service uses ML to extract metadata from text data. It can analyze text in multiple languages, detect entities, extract key phrases, determine sentiment, and more. With Amazon Comprehend, you can easily gain insights from large volumes of text data such as extracting product entity, customer name, and sentiment from social media posts.
Amazon Transcribe – This speech-to-text service uses ML to convert speech to text and extract metadata from audio data. It can recognize multiple speakers, transcribe conversations, identify keywords, and more. With Amazon Transcribe, you can convert unstructured data such as customer support recordings into text and further derive insights from it.
Amazon Rekognition – This image and video analysis service uses ML to extract metadata from visual data. It can recognize objects, people, faces, and text, detect inappropriate content, and more. With Amazon Rekognition, you can easily analyze images and videos to gain insights such as identifying entity type (human or other) and identifying if the person is a known celebrity in an image.
Amazon Textract – You can use this ML service to extract metadata from scanned documents and images. It can extract text, tables, and forms from images, PDFs, and scanned documents. With Amazon Textract, you can digitize documents and extract data such as customer name, product name, product price, and date from an invoice.
Amazon SageMaker – This service enables you to build and deploy custom ML models for a wide range of use cases, including extracting metadata from unstructured data. With SageMaker, you can build custom models that are tailored to your specific needs, which can be particularly useful for extracting metadata from unstructured data that requires a high degree of accuracy or domain-specific knowledge.
Amazon Bedrock – This fully managed service offers a choice of high-performing foundation models (FMs) from leading AI companies like AI21 Labs, Anthropic, Cohere, Meta, Stability AI, and Amazon with a single API. It also offers a broad set of capabilities to build generative AI applications, simplifying development while maintaining privacy and security.
With these specialized AI services, you can efficiently extract metadata from unstructured data and use it for further analysis and insights. It’s important to note that each service has its own strengths and limitations, and choosing the right service for your specific use case is critical for achieving accurate and reliable results.
AWS AI services are available via various APIs, which enables you to integrate AI capabilities into your applications and workflows. AWS Step Functions is a serverless workflow service that allows you to coordinate and orchestrate multiple AWS services, including AI services, into a single workflow. This can be particularly useful when you need to process large amounts of unstructured data and perform multiple AI-related tasks, such as text analysis, image recognition, and NLP.
With Step Functions and AWS Lambda functions, you can create sophisticated workflows that include AI services and other AWS services. For instance, you can use Amazon S3 to store input data, invoke a Lambda function to trigger an Amazon Transcribe job to transcribe an audio file, and use the output to trigger an Amazon Comprehend analysis job to generate sentiment metadata for the transcribed text. This enables you to create complex, multi-step workflows that are straightforward to manage, scalable, and cost-effective.
The following is an example architecture that shows how Step Functions can help invoke AWS AI services using Lambda functions.
The workflow steps are as follows:
Unstructured data, such as text files, audio files, and video files, are ingested into the S3 raw bucket.
A Lambda function is triggered to read the data from the S3 bucket and call Step Functions to orchestrate the workflow required to extract the metadata.
The Step Functions workflow checks the type of file, calls the corresponding AWS AI service APIs, checks the job status, and performs any postprocessing required on the output.
AWS AI services can be accessed via APIs and invoked as batch jobs. To extract metadata from different types of unstructured data, you can use multiple AI services in sequence, with each service processing the corresponding file type.
After the Step Functions workflow completes the metadata extraction process and performs any required postprocessing, the resulting output is stored in an S3 bucket for cataloging.
Next, let’s understand how can we implement security or access control on both the extracted output as well as the raw input objects.
Implement access control on raw and processed data in Amazon S3
We just consider access controls for three types of data when managing unstructured data: the AI-extracted semi-structured output, the metadata, and the raw unstructured original files. When it comes to AI extracted output, it’s in JSON format and can be restricted via Lake Formation and Amazon DataZone. We recommend keeping the metadata (information that captures which unstructured datasets are already processed by the pipeline and available for analysis) open to your organization, which will enable metadata discovery across the organization.
To control access of raw unstructured data, you can integrate S3 Access Points and explore additional support in the future as AWS services evolve. S3 Access Points simplify data access for any AWS service or customer application that stores data in Amazon S3. Access points are named network endpoints that are attached to buckets that you can use to perform S3 object operations. Each access point has distinct permissions and network controls that Amazon S3 applies for any request that is made through that access point. Each access point enforces a customized access point policy that works in conjunction with the bucket policy that is attached to the underlying bucket. With S3 Access Points, you can create unique access control policies for each access point to easily control access to specific datasets within an S3 bucket. This works well in multi-tenant or shared bucket scenarios where users or teams are assigned to unique prefixes within one S3 bucket.
An access point can support a single user or application, or groups of users or applications within and across accounts, allowing separate management of each access point. Every access point is associated with a single bucket and contains a network origin control and a Block Public Access control. For example, you can create an access point with a network origin control that only permits storage access from your virtual private cloud (VPC), a logically isolated section of the AWS Cloud. You can also create an access point with the access point policy configured to only allow access to objects with a defined prefix or to objects with specific tags. You can also configure custom Block Public Access settings for each access point.
The following architecture provides an overview of how an end-user can get access to specific S3 objects by assuming a specific AWS Identity and Access Management (IAM) role. If you have a large number of S3 objects to control access, consider grouping the S3 objects, assigning them tags, and then defining access control by tags.
This post explained how you can use AWS AI services to extract readable data from unstructured datasets, build a metadata layer on top of them to allow data discovery, and build an access control mechanism on top of the raw S3 objects and extracted data using Lake Formation, Amazon DataZone, and S3 Access Points.
In addition to AWS AI services, you can also integrate large language models with vector databases to enable semantic or similarity search on top of unstructured datasets. To learn more about how to enable semantic search on unstructured data by integrating Amazon OpenSearch Service as a vector database, refer to Try semantic search with the Amazon OpenSearch Service vector engine.
As of writing this post, S3 Access Points is one of the best solutions to implement access control on raw S3 objects using tagging, but as AWS service features evolve in the future, you can explore alternative options as well.
About the Authors
Sakti Mishra is a Principal Solutions Architect at AWS, where he helps customers modernize their data architecture and define their end-to-end data strategy, including data security, accessibility, governance, and more. He is also the author of the book Simplify Big Data Analytics with Amazon EMR. Outside of work, Sakti enjoys learning new technologies, watching movies, and visiting places with family.
Bhavana Chirumamilla is a Senior Resident Architect at AWS with a strong passion for data and machine learning operations. She brings a wealth of experience and enthusiasm to help enterprises build effective data and ML strategies. In her spare time, Bhavana enjoys spending time with her family and engaging in various activities such as traveling, hiking, gardening, and watching documentaries.
Sheela Sonone is a Senior Resident Architect at AWS. She helps AWS customers make informed choices and trade-offs about accelerating their data, analytics, and AI/ML workloads and implementations. In her spare time, she enjoys spending time with her family—usually on tennis courts.
Daniel Bruno is a Principal Resident Architect at AWS. He had been building analytics and machine learning solutions for over 20 years and splits his time helping customers build data science programs and designing impactful ML products.
The collective thoughts of the interwebz
Manage Consent
To provide the best experiences, we use technologies like cookies to store and/or access device information. Consenting to these technologies will allow us to process data such as browsing behavior or unique IDs on this site. Not consenting or withdrawing consent, may adversely affect certain features and functions.
Functional
Always active
The technical storage or access is strictly necessary for the legitimate purpose of enabling the use of a specific service explicitly requested by the subscriber or user, or for the sole purpose of carrying out the transmission of a communication over an electronic communications network.
Preferences
The technical storage or access is necessary for the legitimate purpose of storing preferences that are not requested by the subscriber or user.
Statistics
The technical storage or access that is used exclusively for statistical purposes.The technical storage or access that is used exclusively for anonymous statistical purposes. Without a subpoena, voluntary compliance on the part of your Internet Service Provider, or additional records from a third party, information stored or retrieved for this purpose alone cannot usually be used to identify you.
Marketing
The technical storage or access is required to create user profiles to send advertising, or to track the user on a website or across several websites for similar marketing purposes.
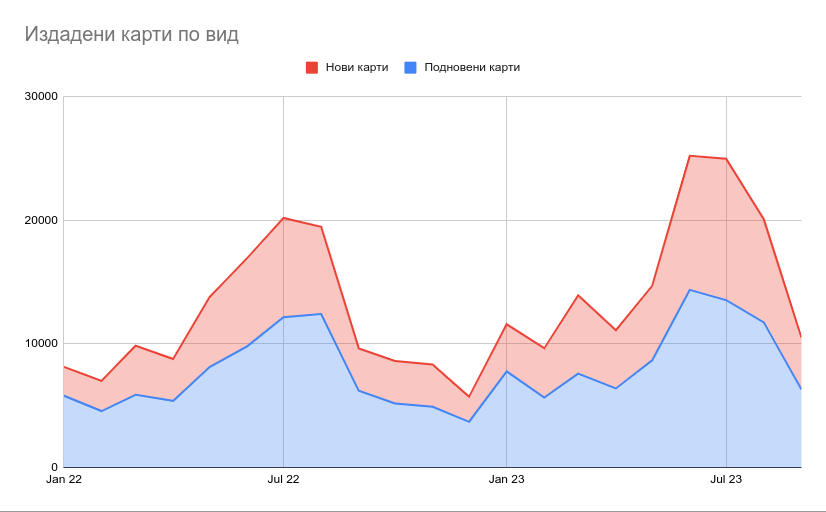
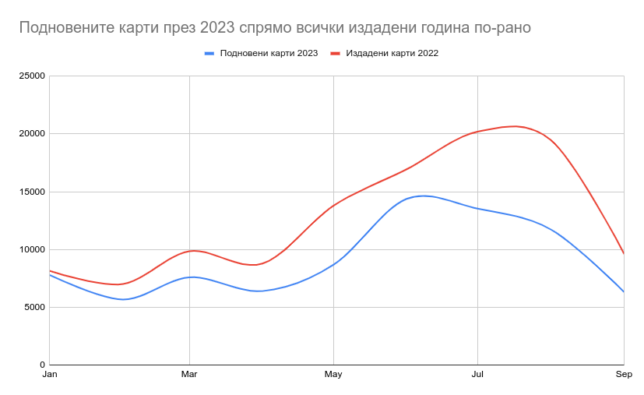


 Prashant Agrawal is a Sr. Search Specialist Solutions Architect with Amazon OpenSearch Service. He works closely with customers to help them migrate their workloads to the cloud and helps existing customers fine-tune their clusters to achieve better performance and save on cost. Before joining AWS, he helped various customers use OpenSearch and Elasticsearch for their search and log analytics use cases. When not working, you can find him traveling and exploring new places. In short, he likes doing Eat → Travel → Repeat.


 Anirban Sinha is a Senior Technical Account Manager at AWS. He is passionate about building scalable data warehouses and big data solutions working closely with customers. He works with large ISVs customers, in helping them build and operate secure, resilient, scalable, and high-performance SaaS applications in the cloud.
 Phil Bates is a Senior Analytics Specialist Solutions Architect at AWS. He has more than 25 years of experience implementing large-scale data warehouse solutions. He is passionate about helping customers through their cloud journey and using the power of ML within their data warehouse.
 Gaurav Singh is a Senior Solutions Architect at AWS, specializing in AI/ML and Generative AI. Based in Pune, India, he focuses on helping customers build, deploy, and migrate ML production workloads to SageMaker at scale. In his spare time, Gaurav loves to explore nature, read, and run.


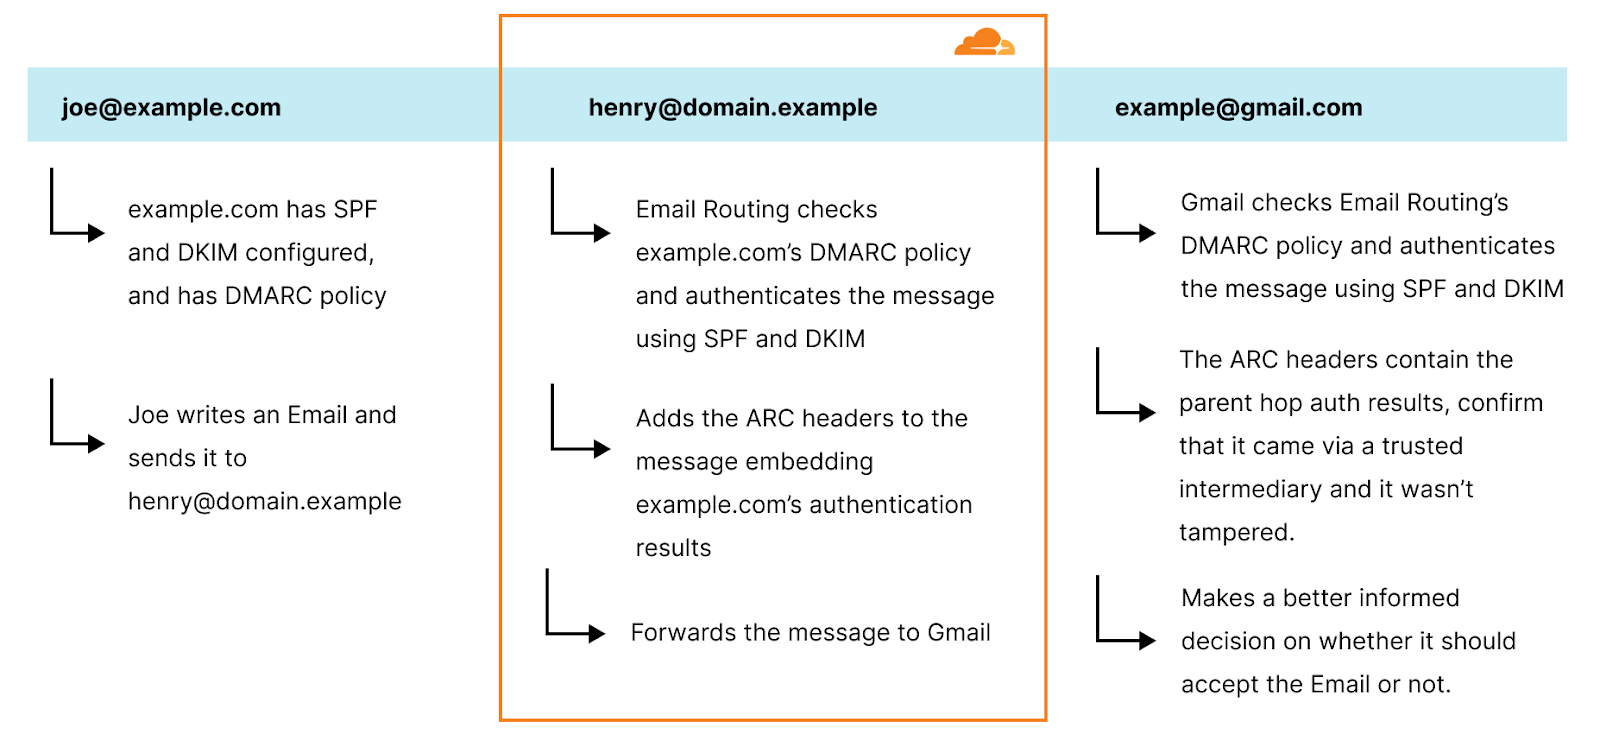
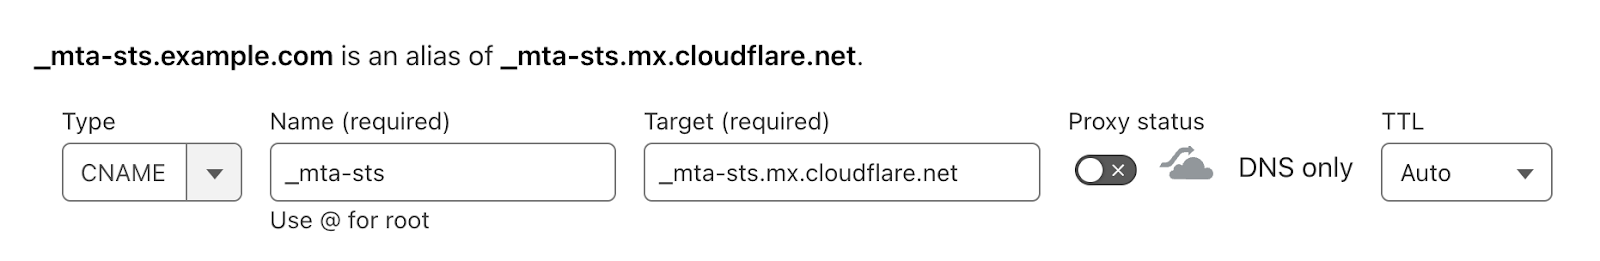
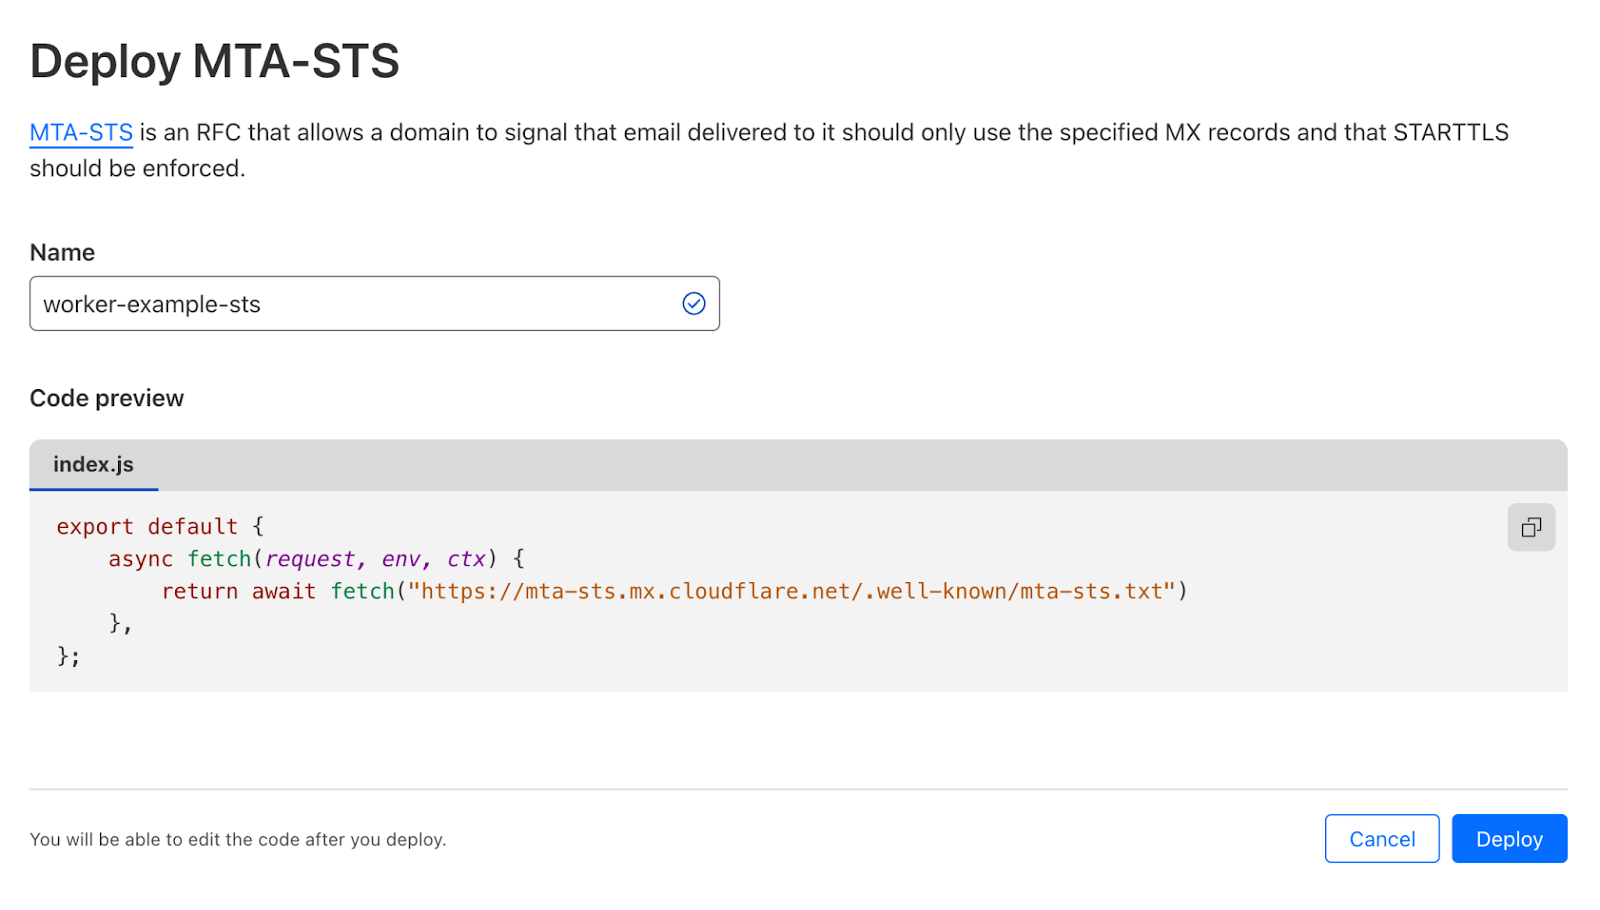
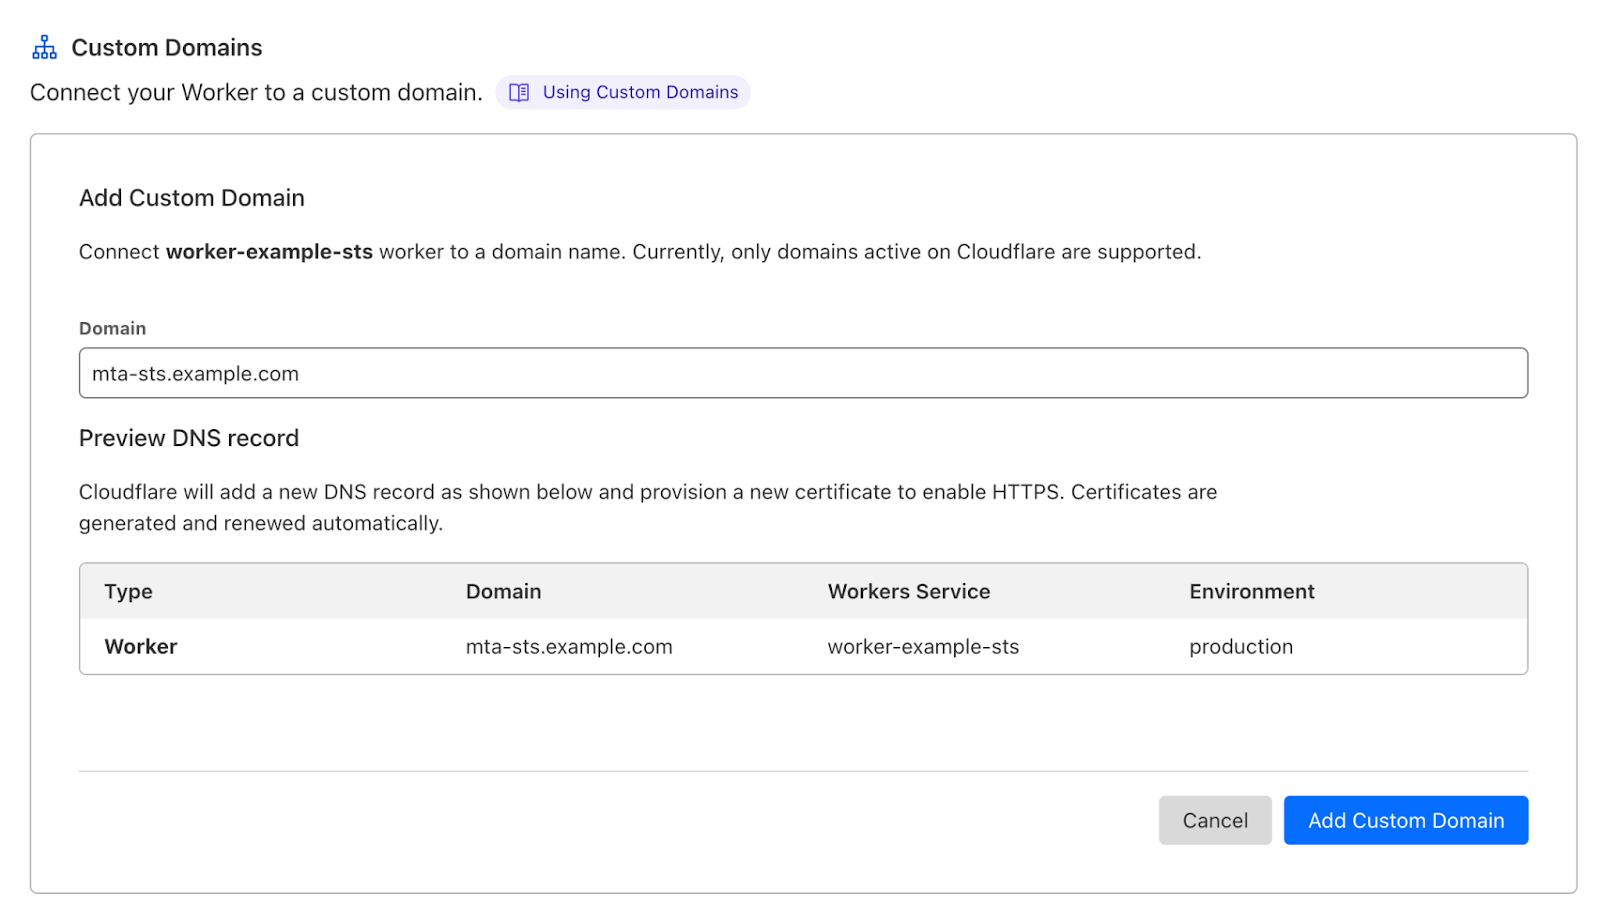
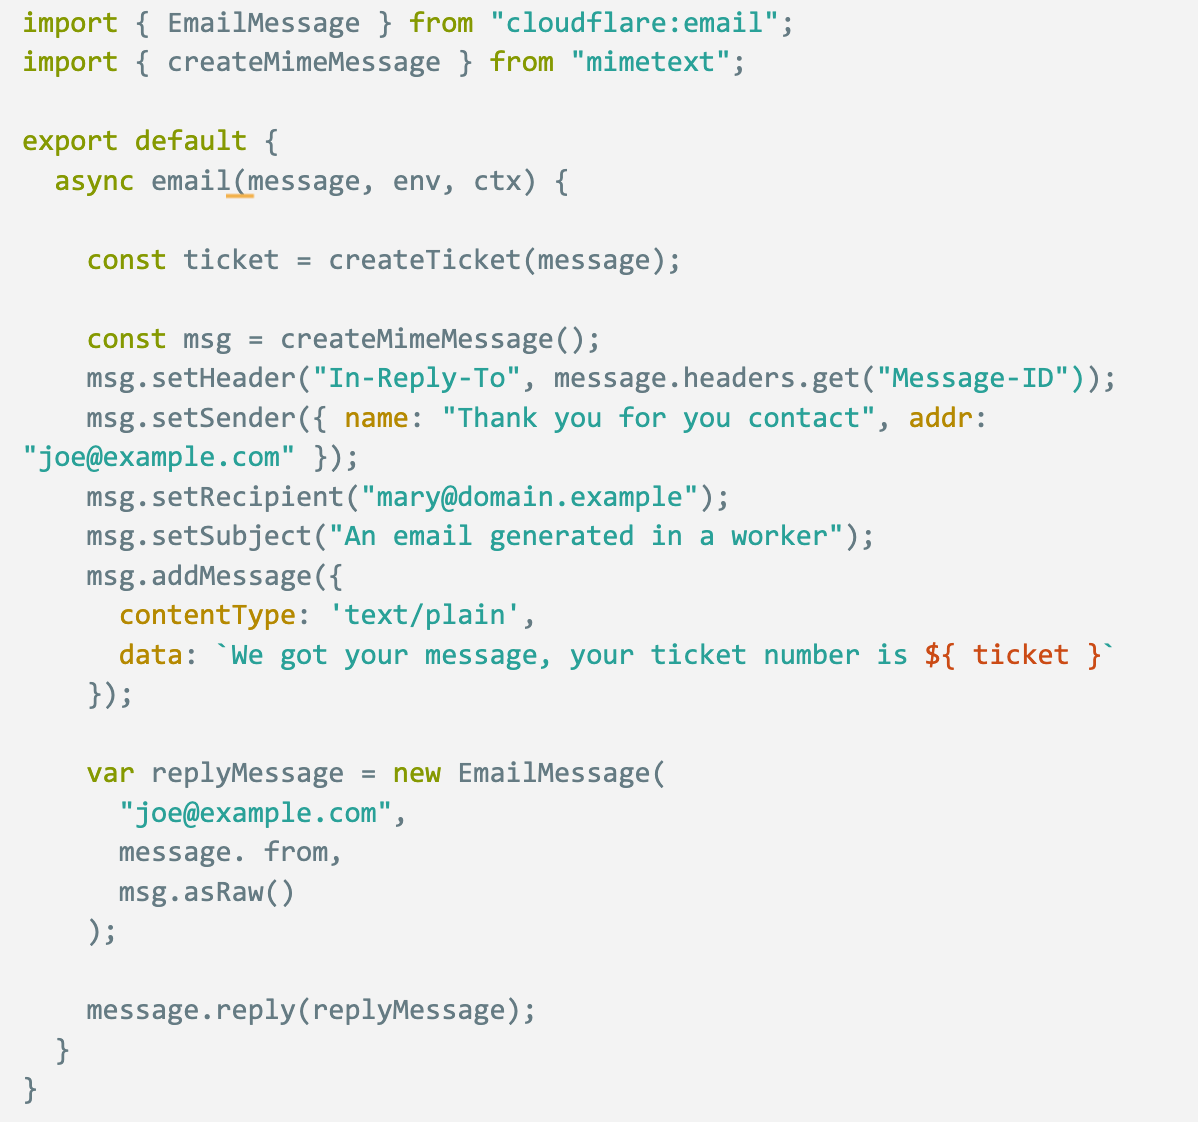
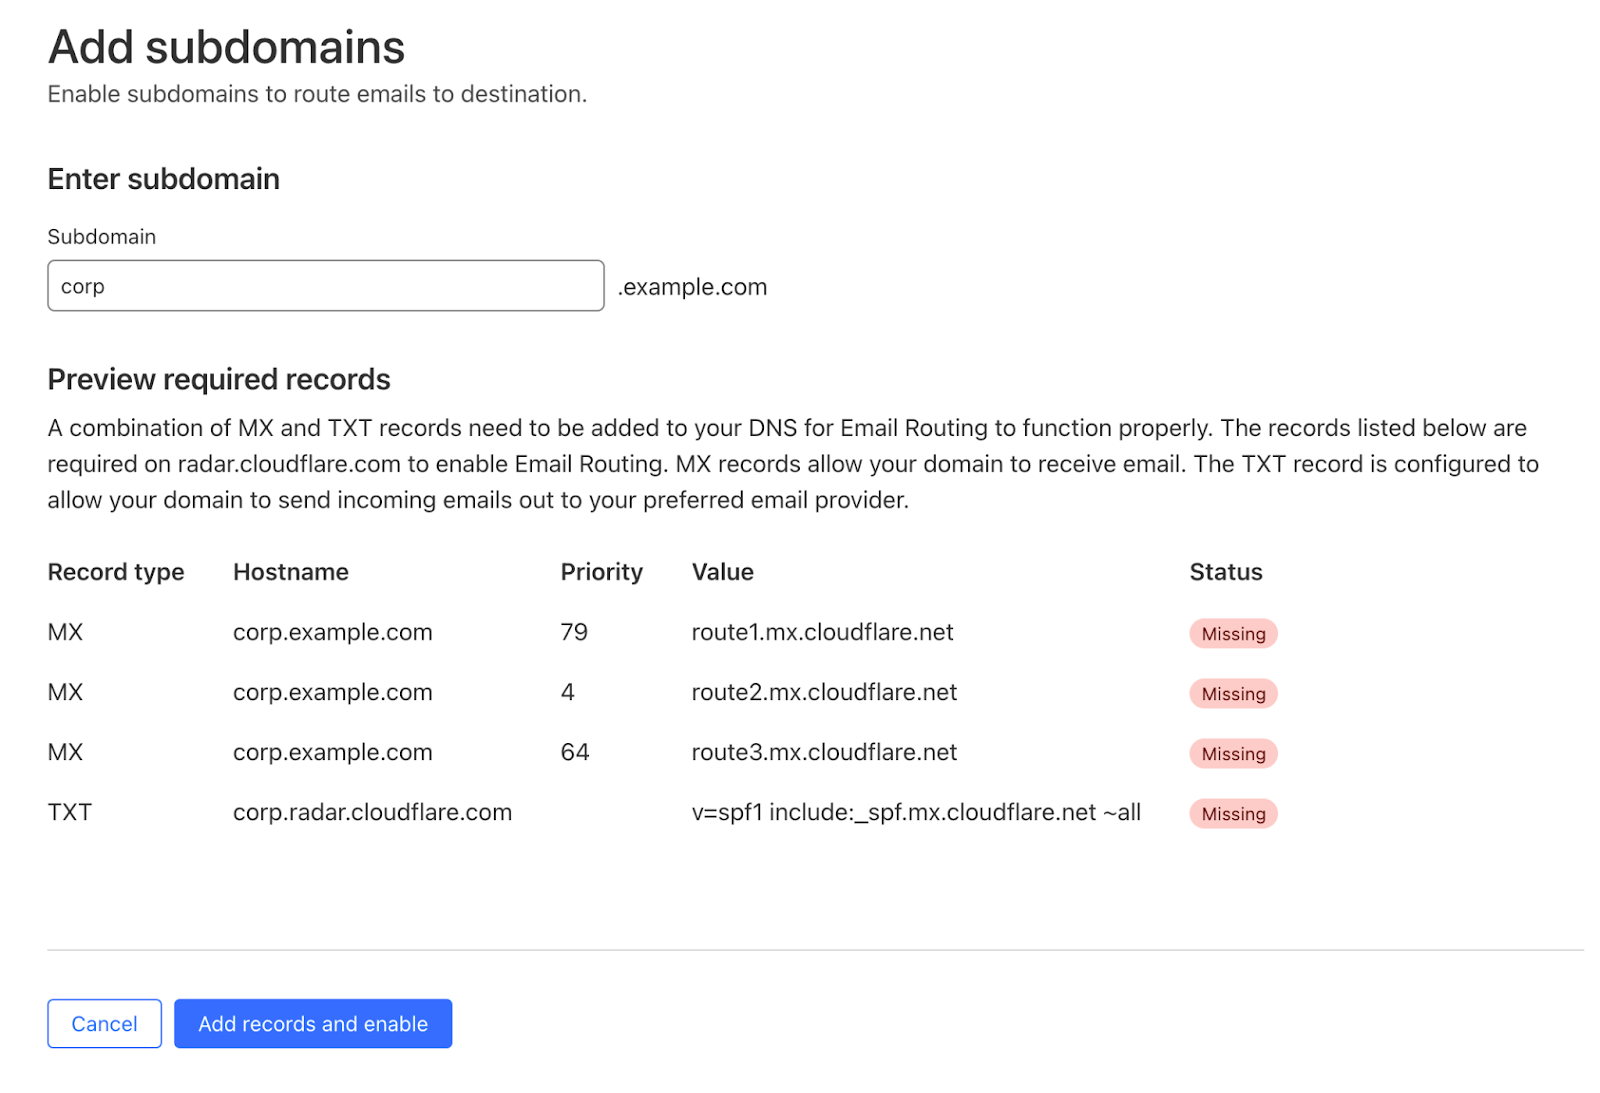
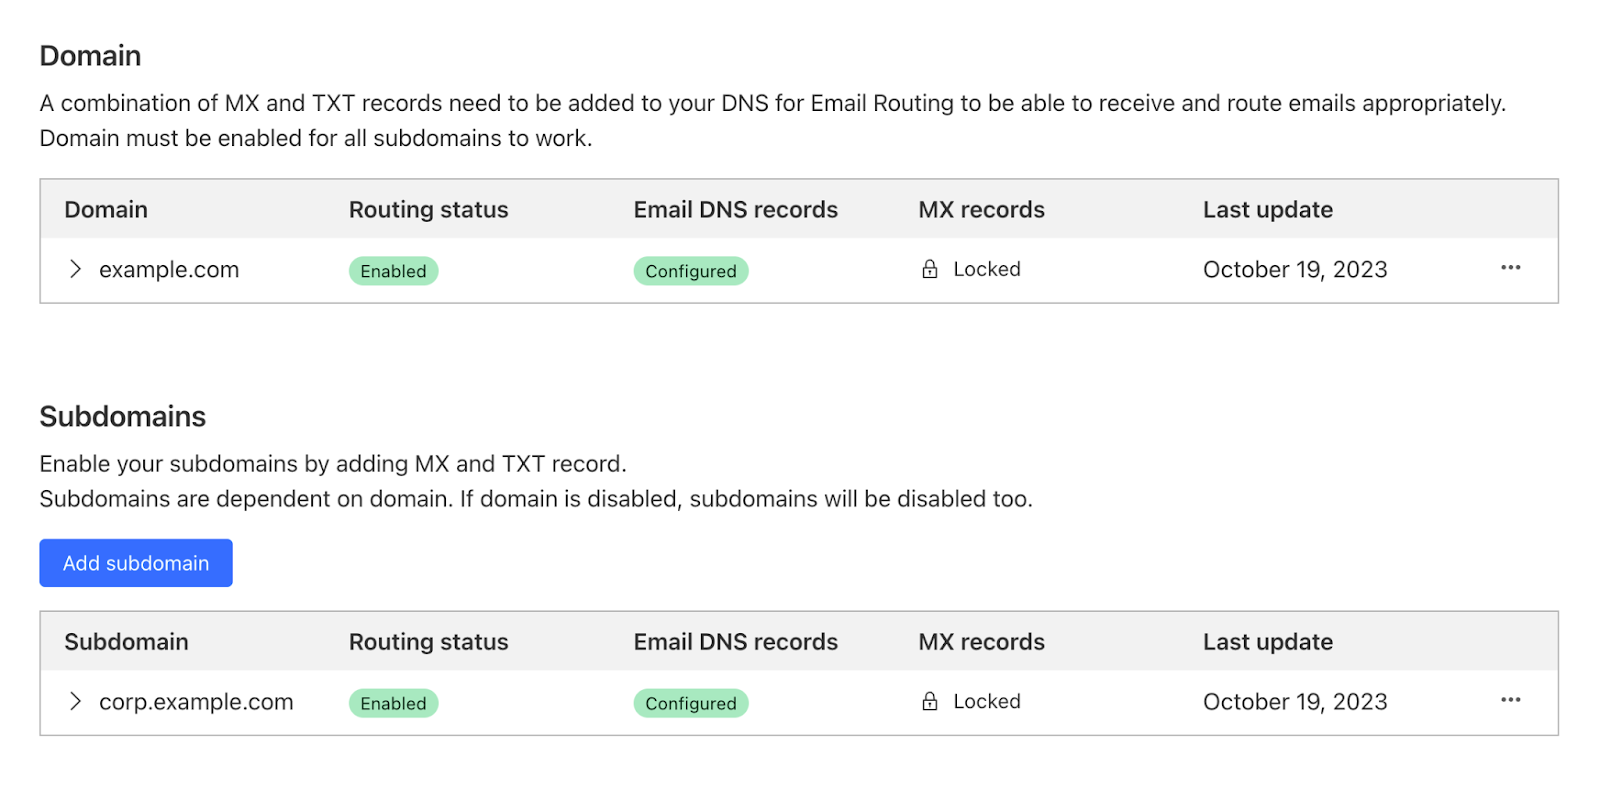
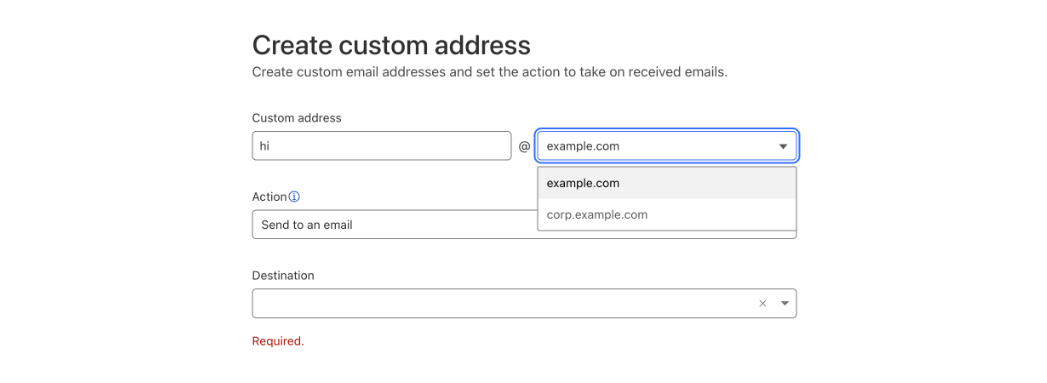
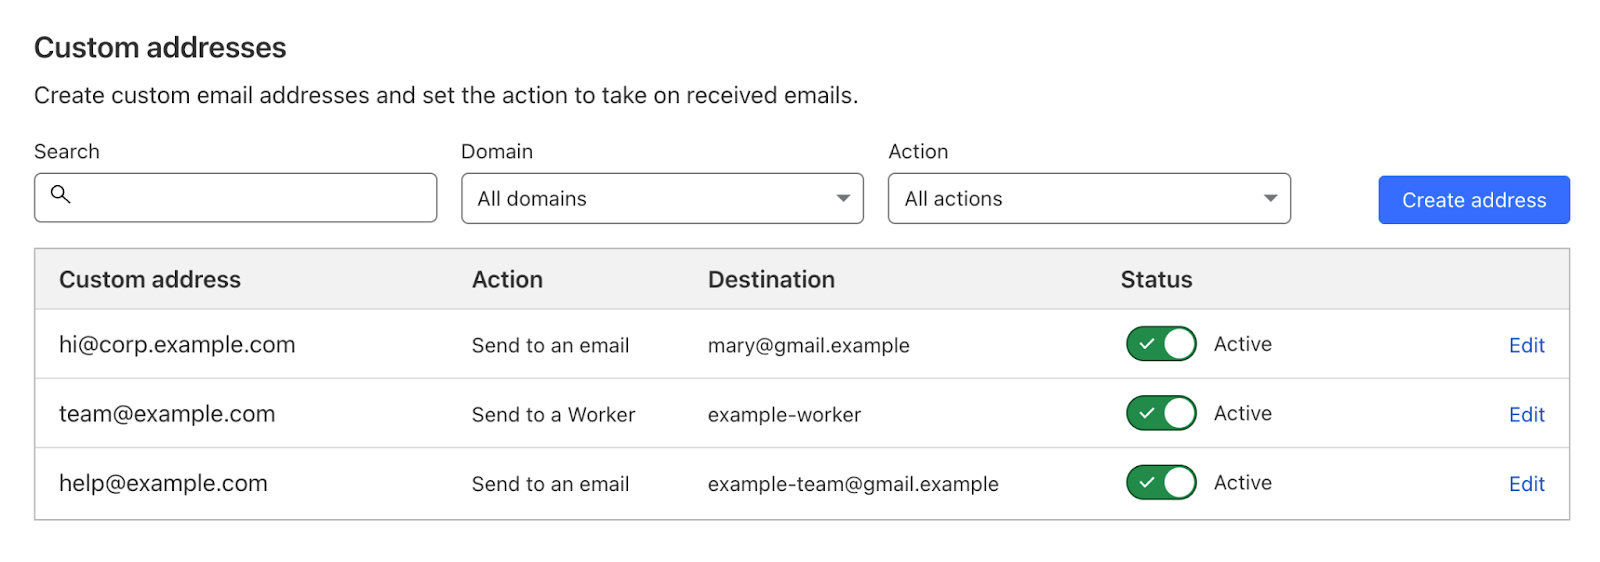


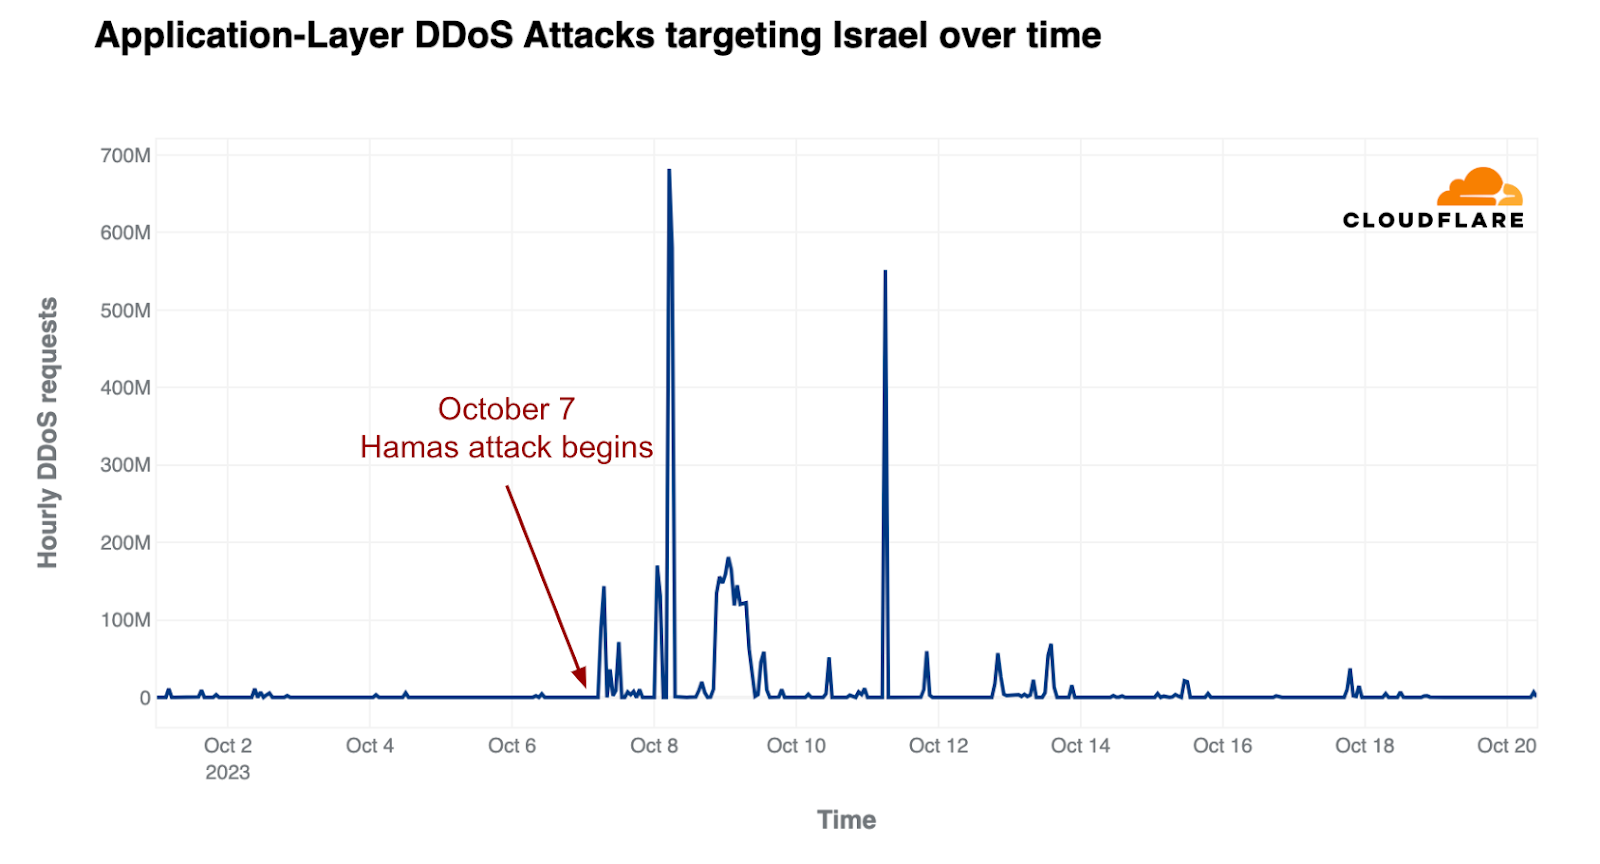
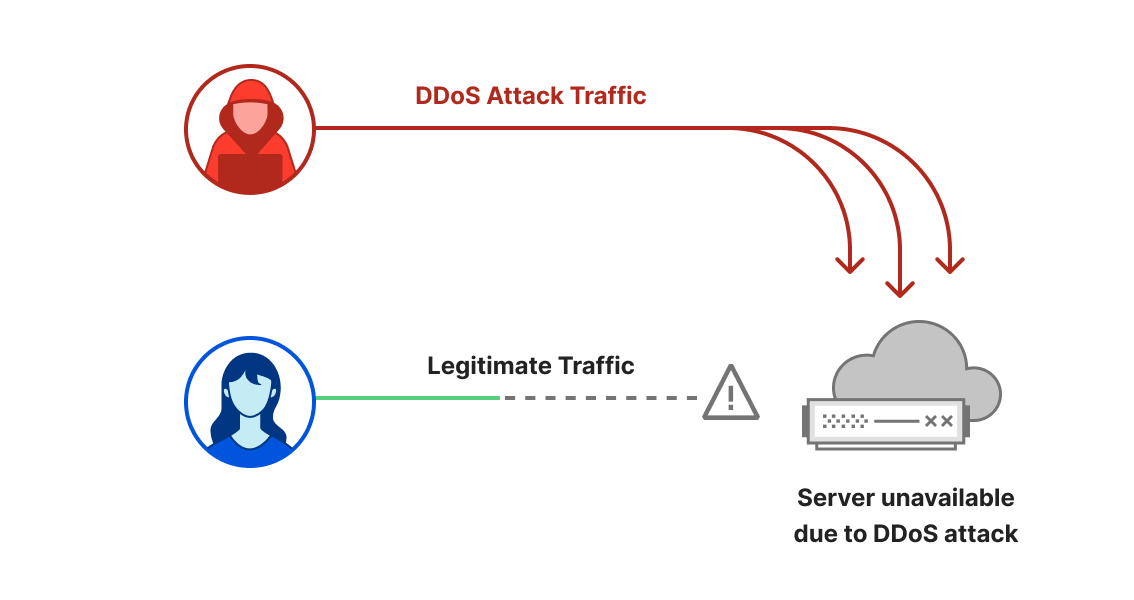
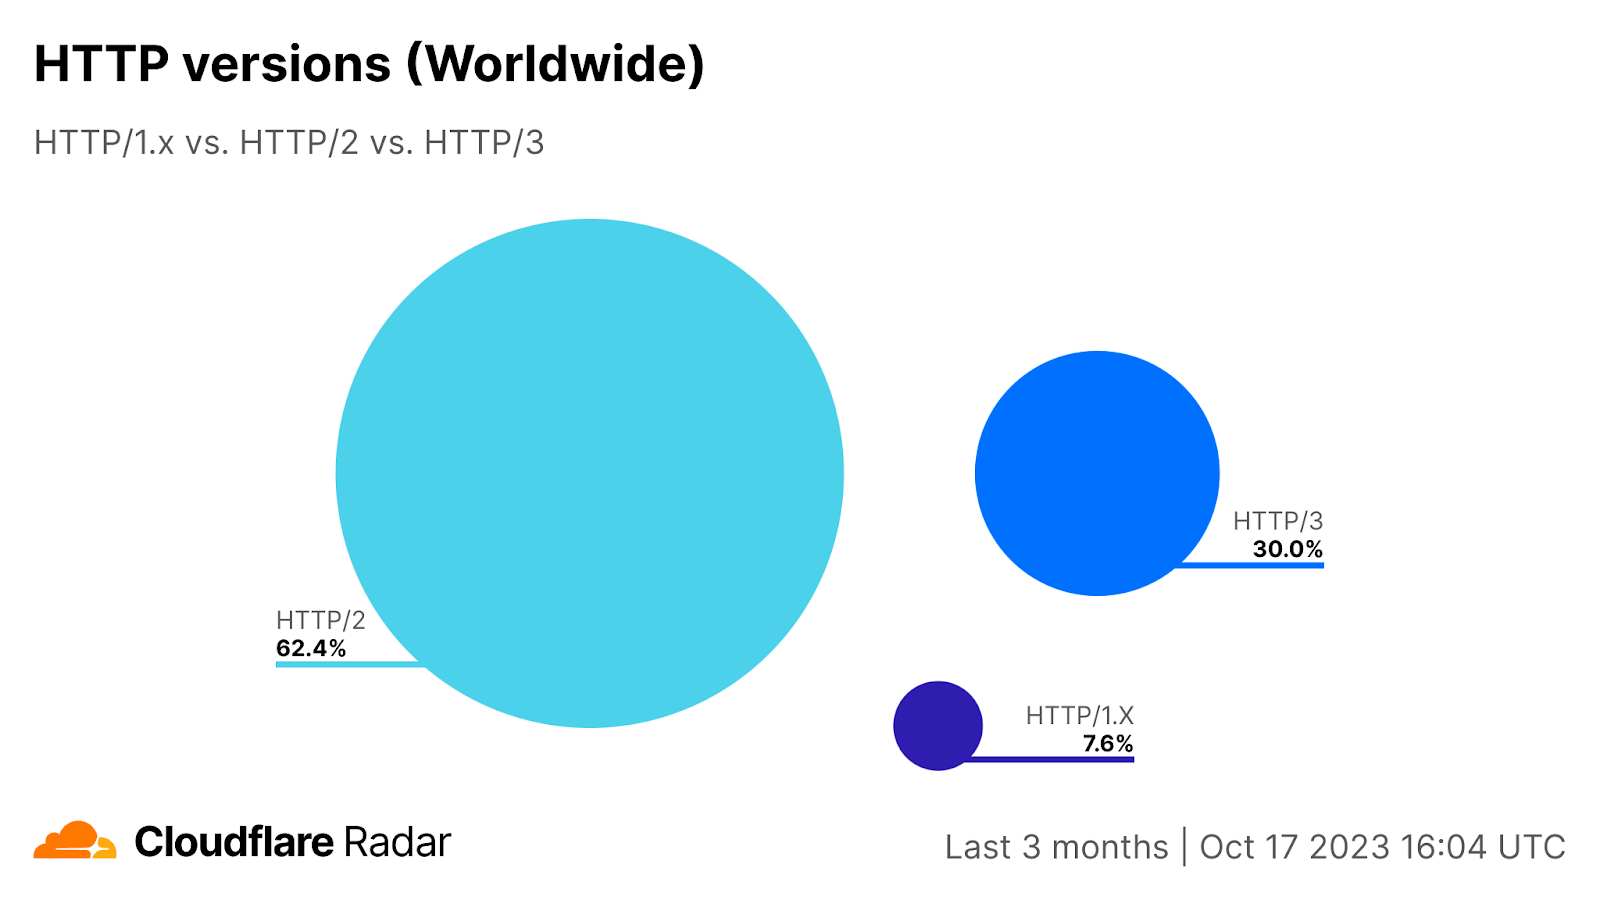
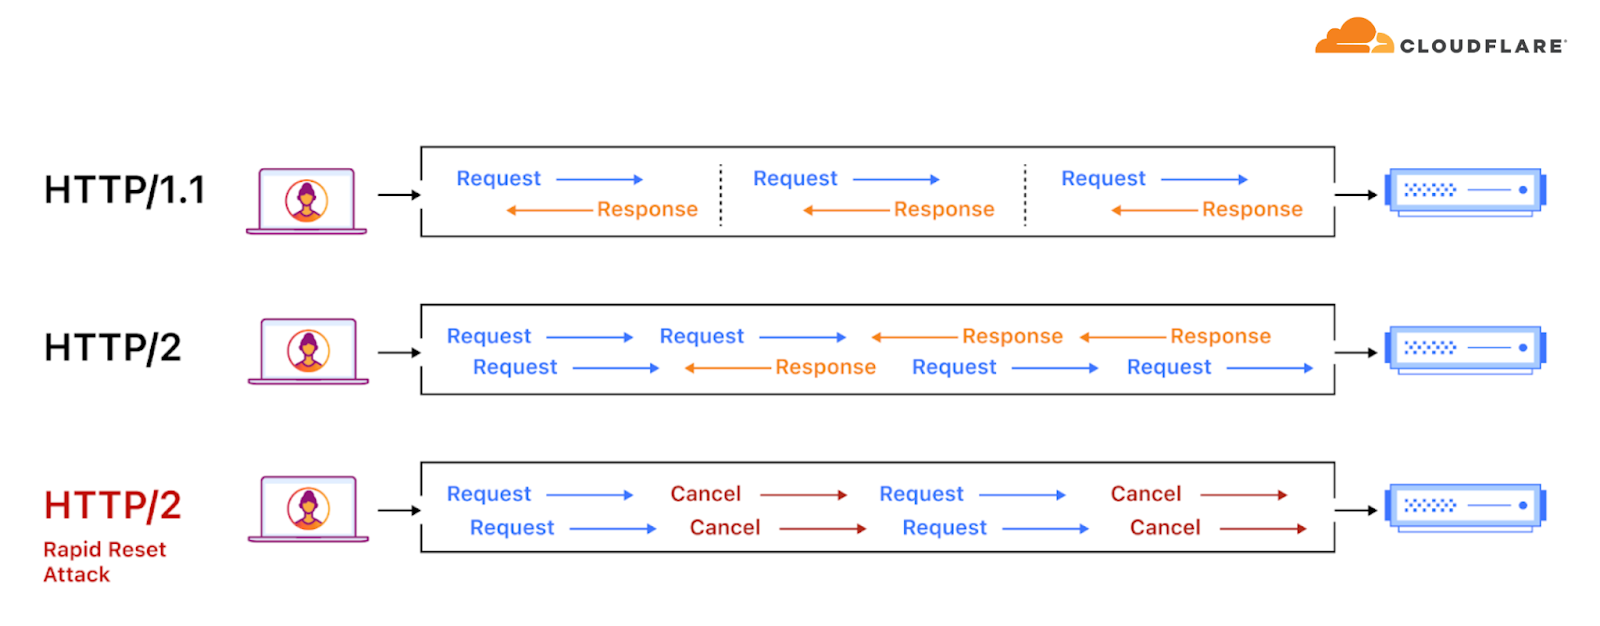
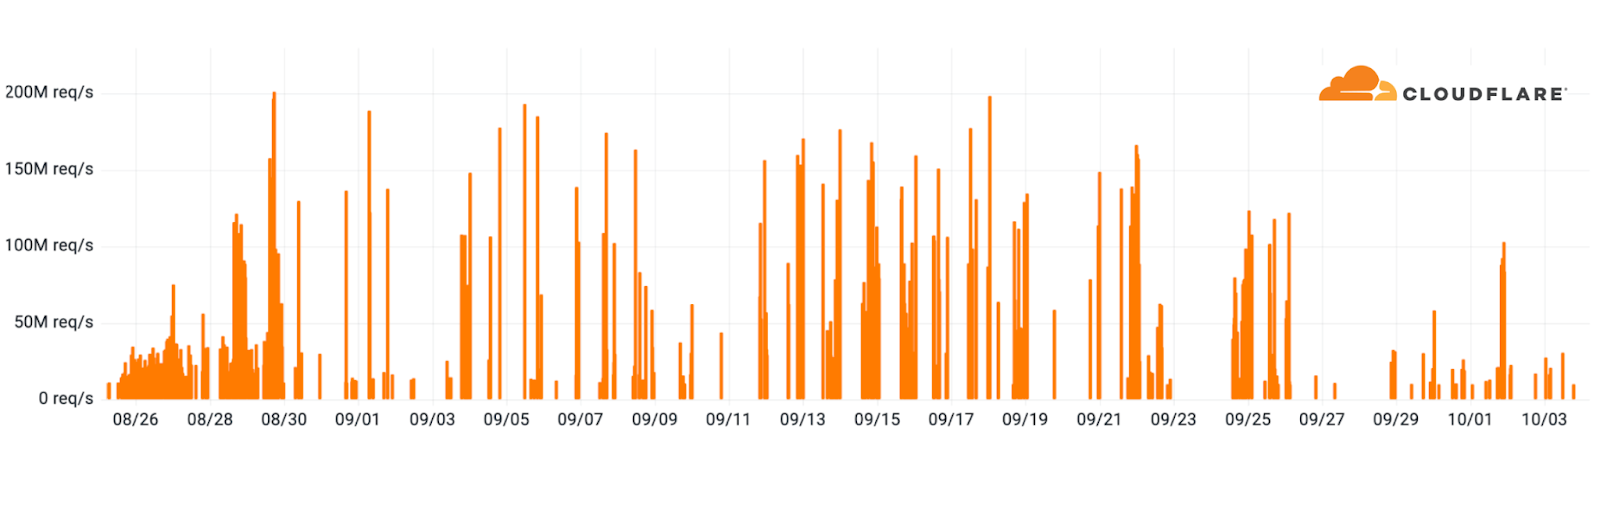
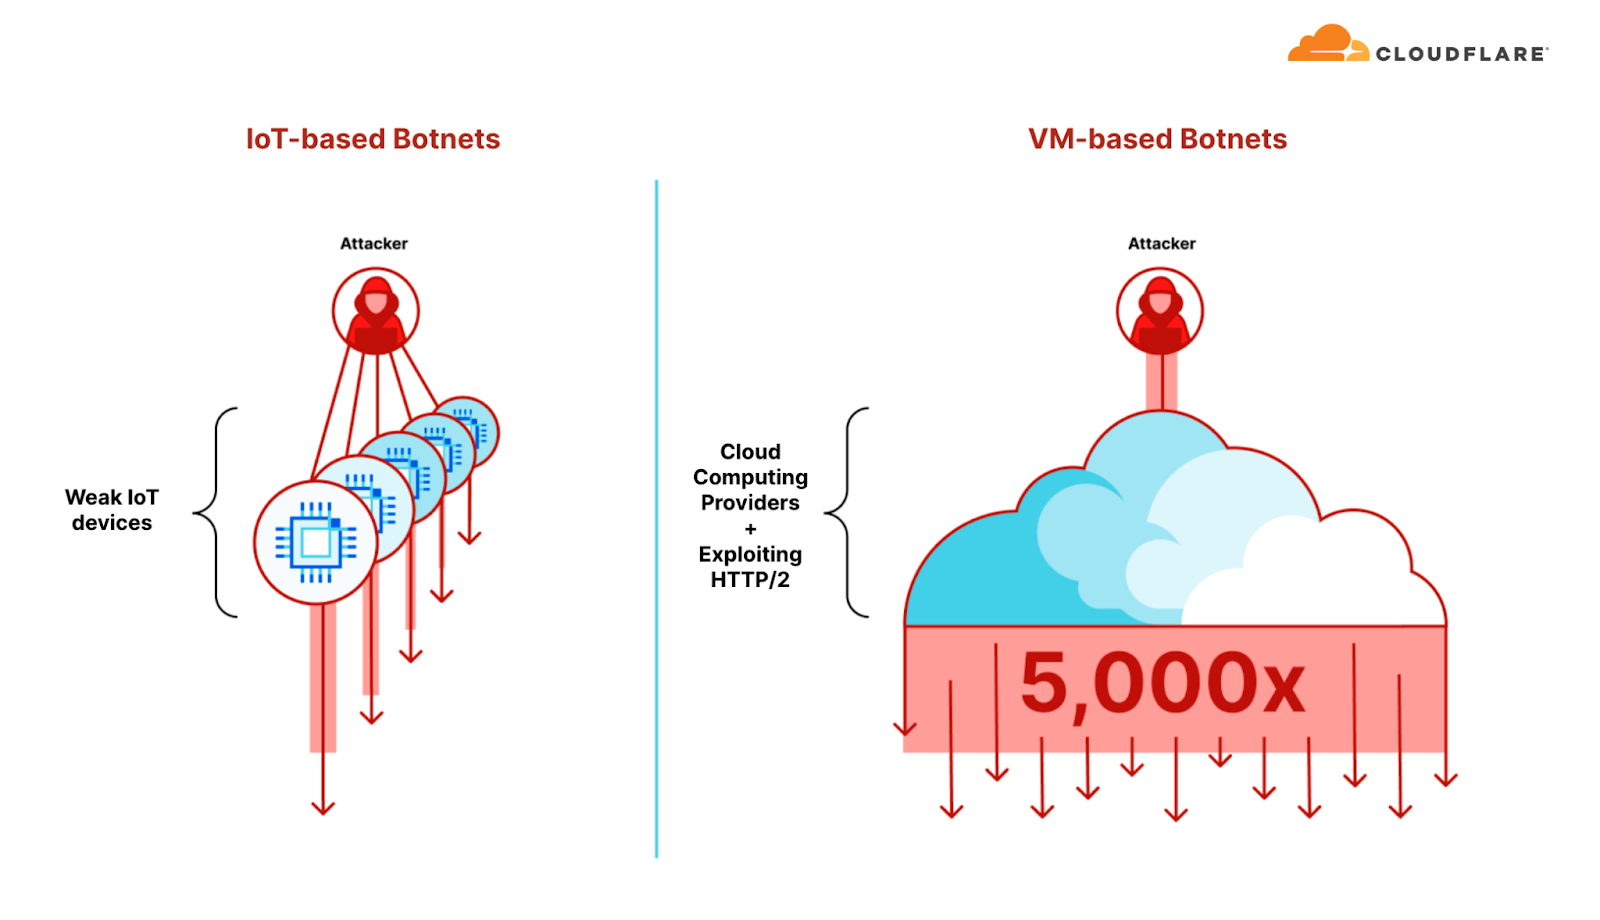
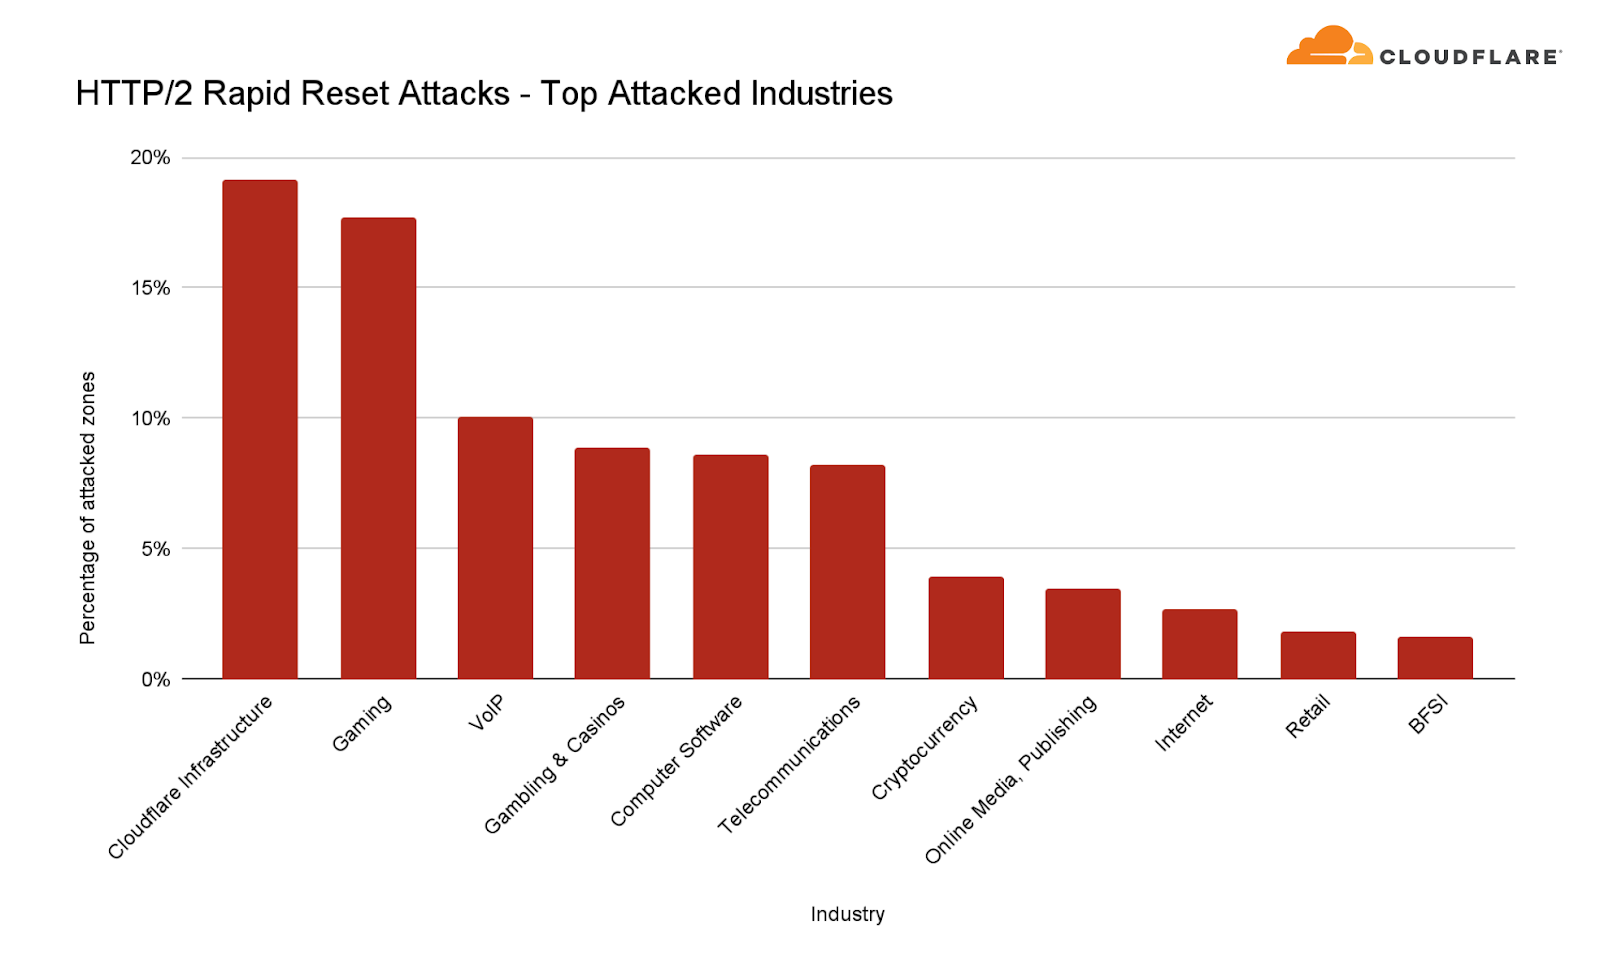
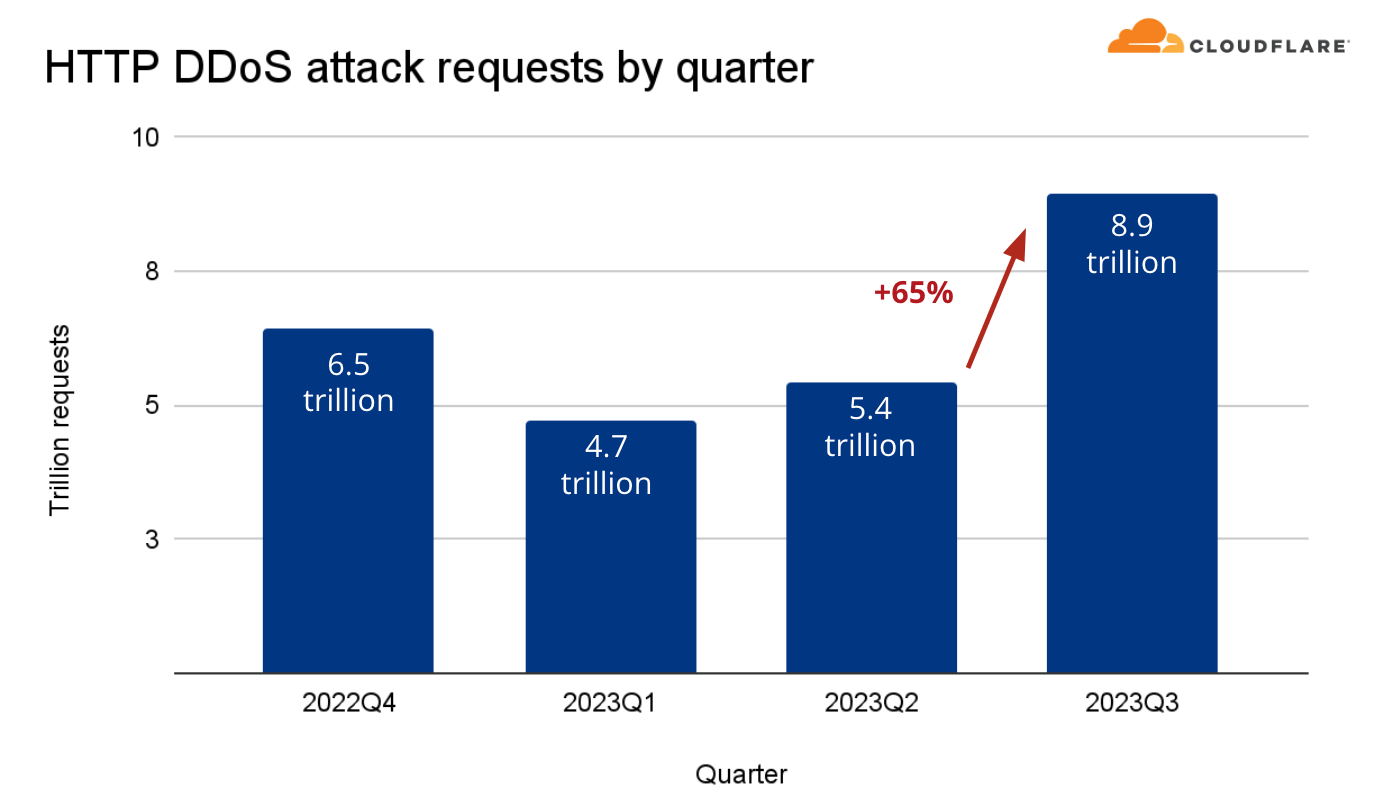
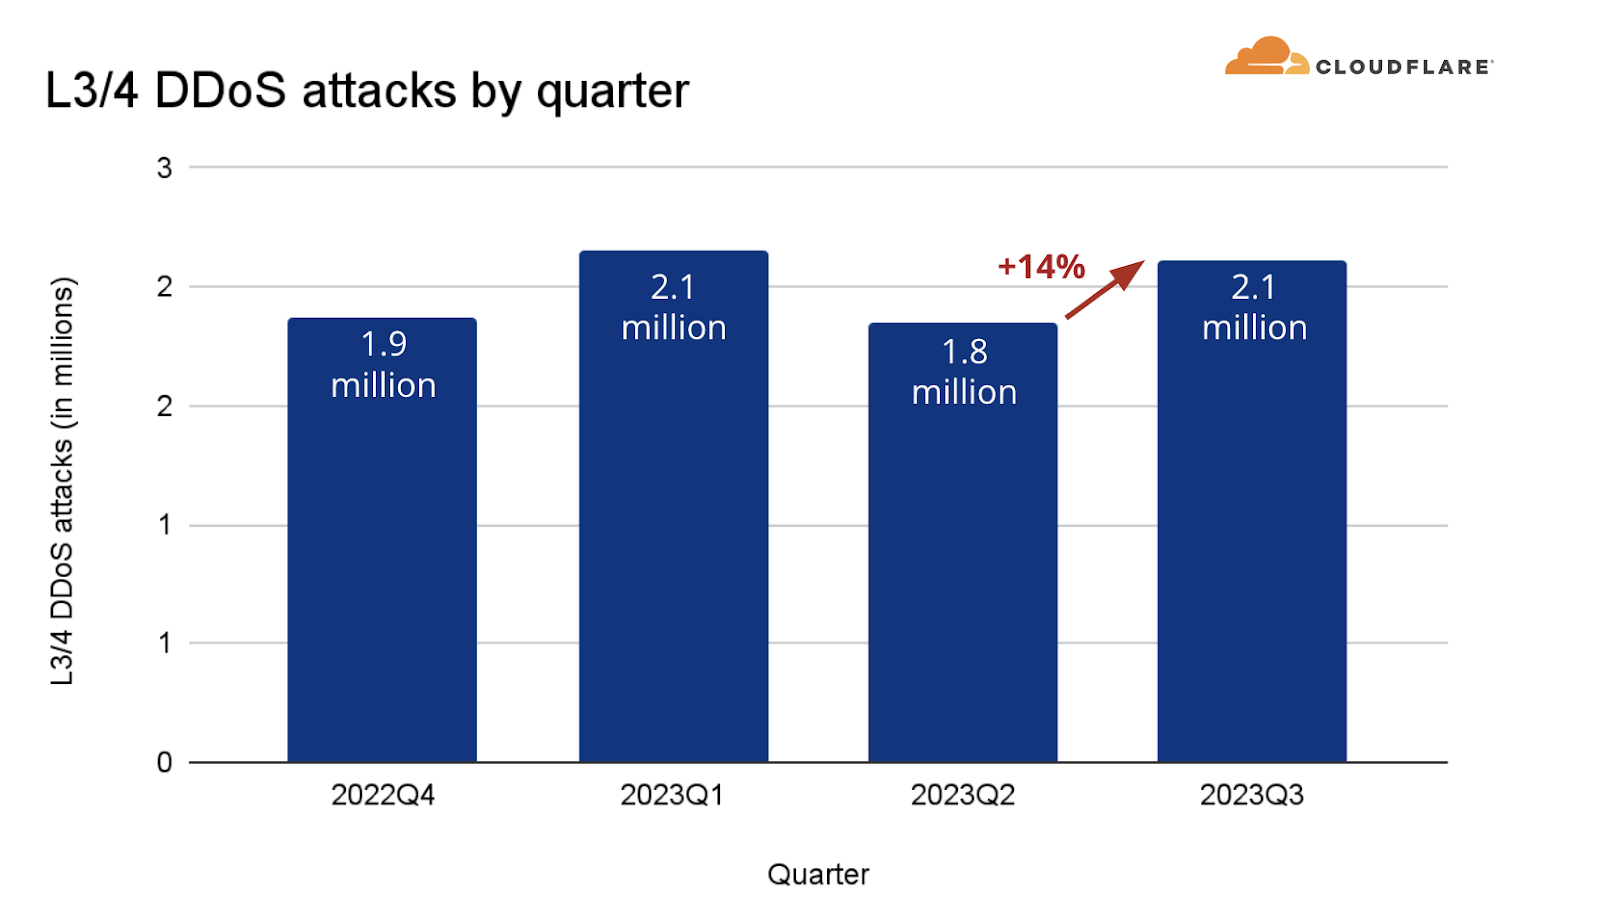
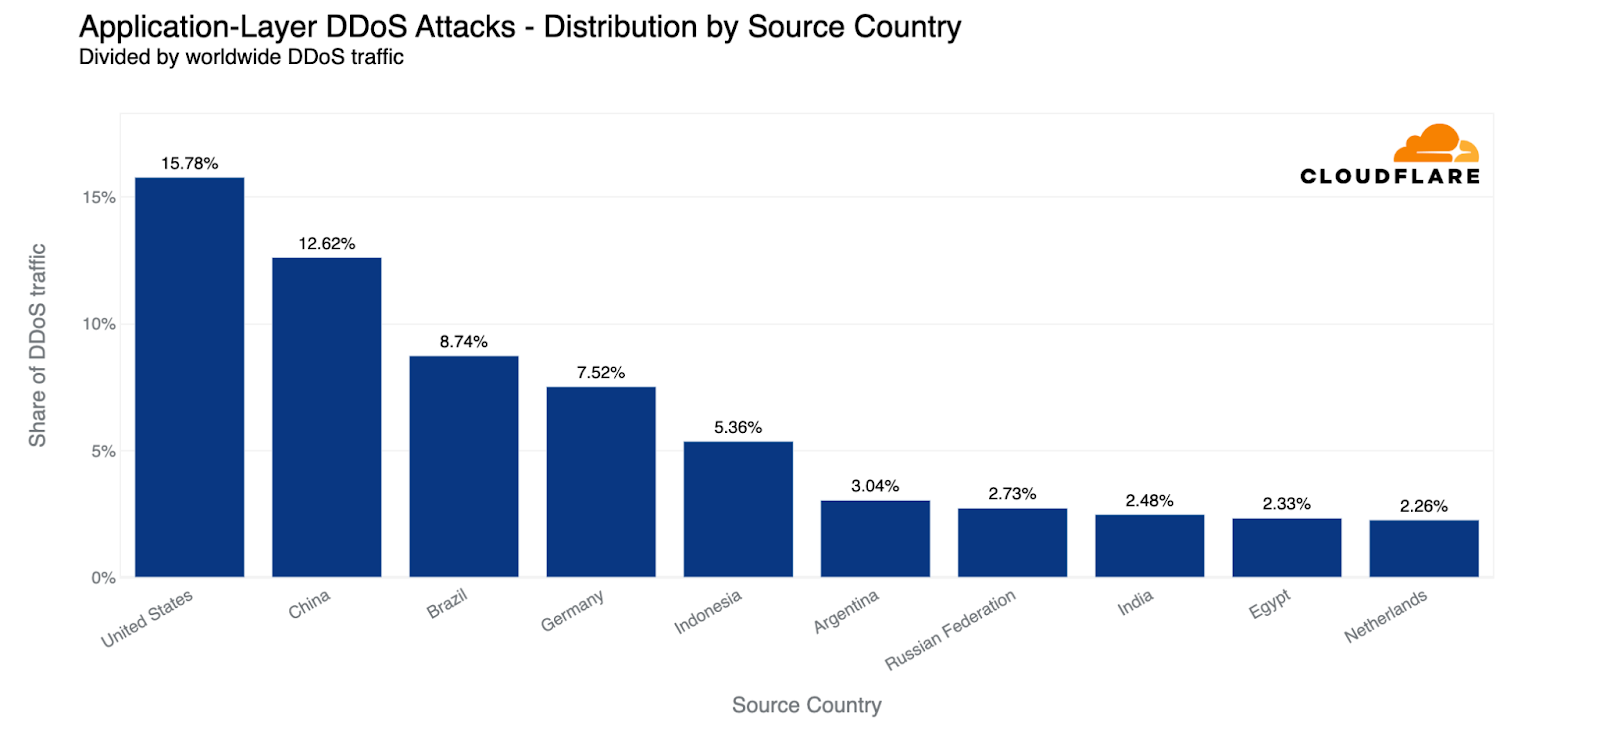
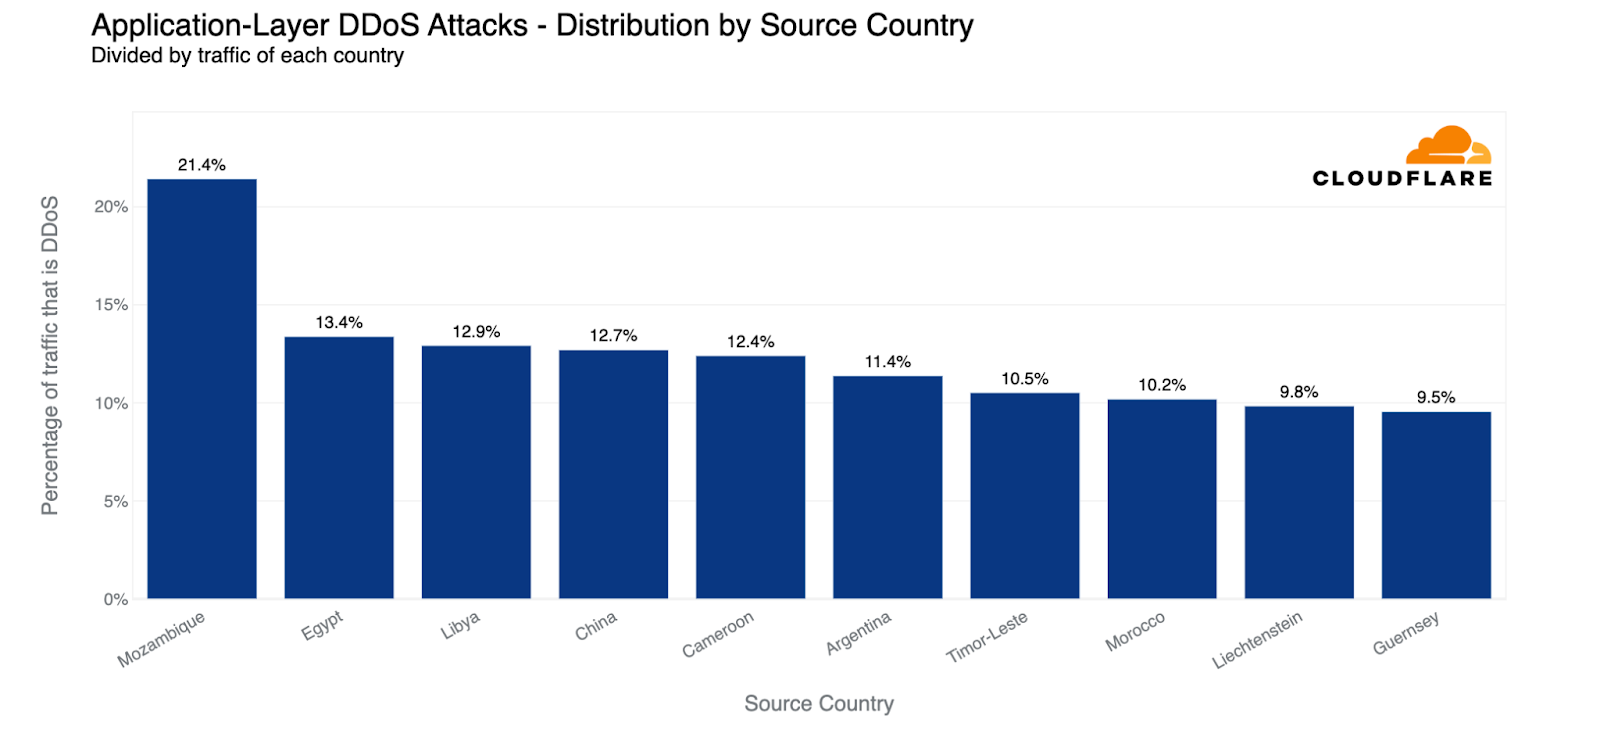
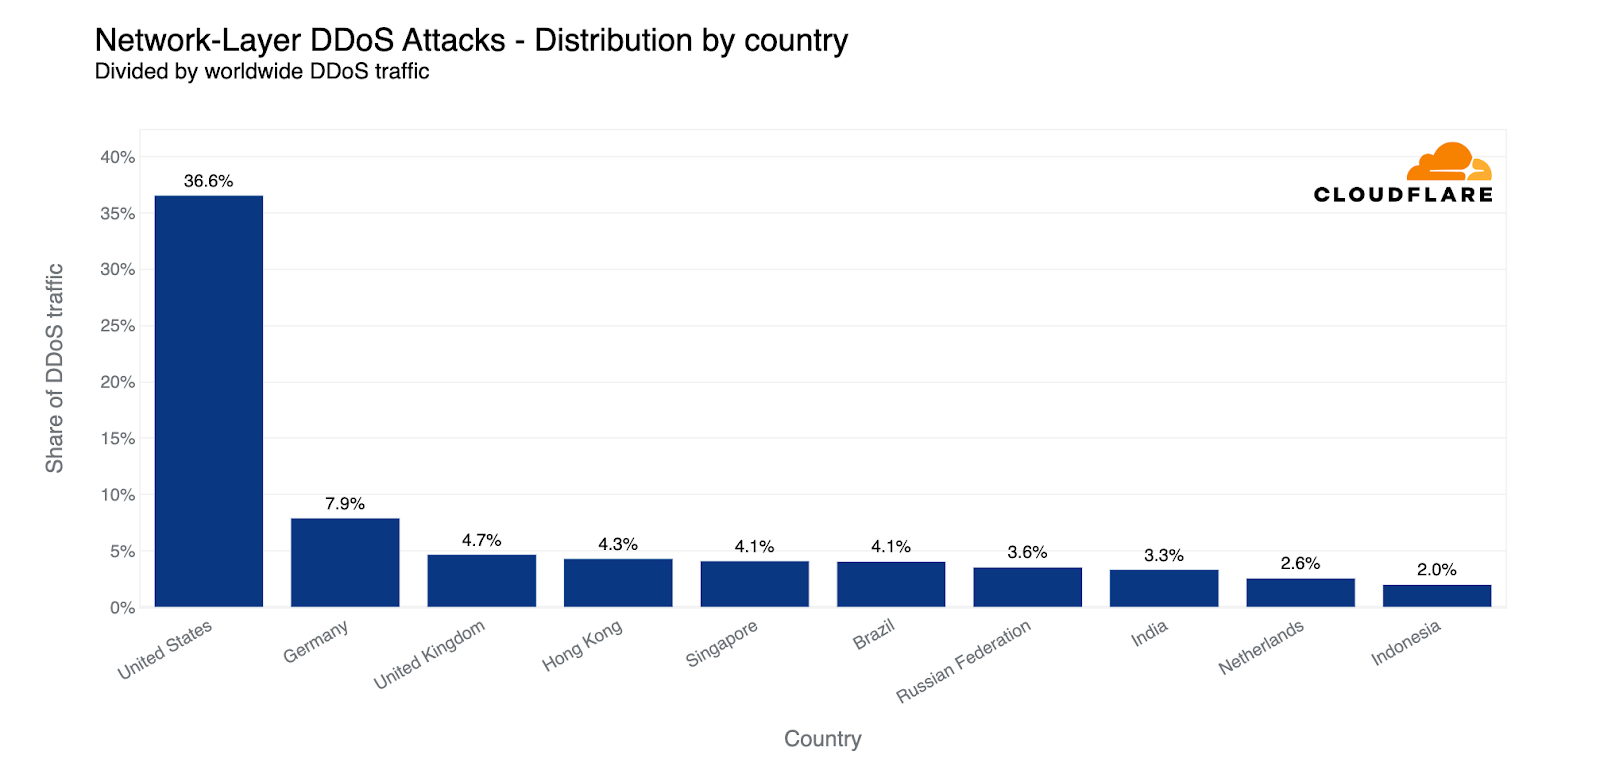
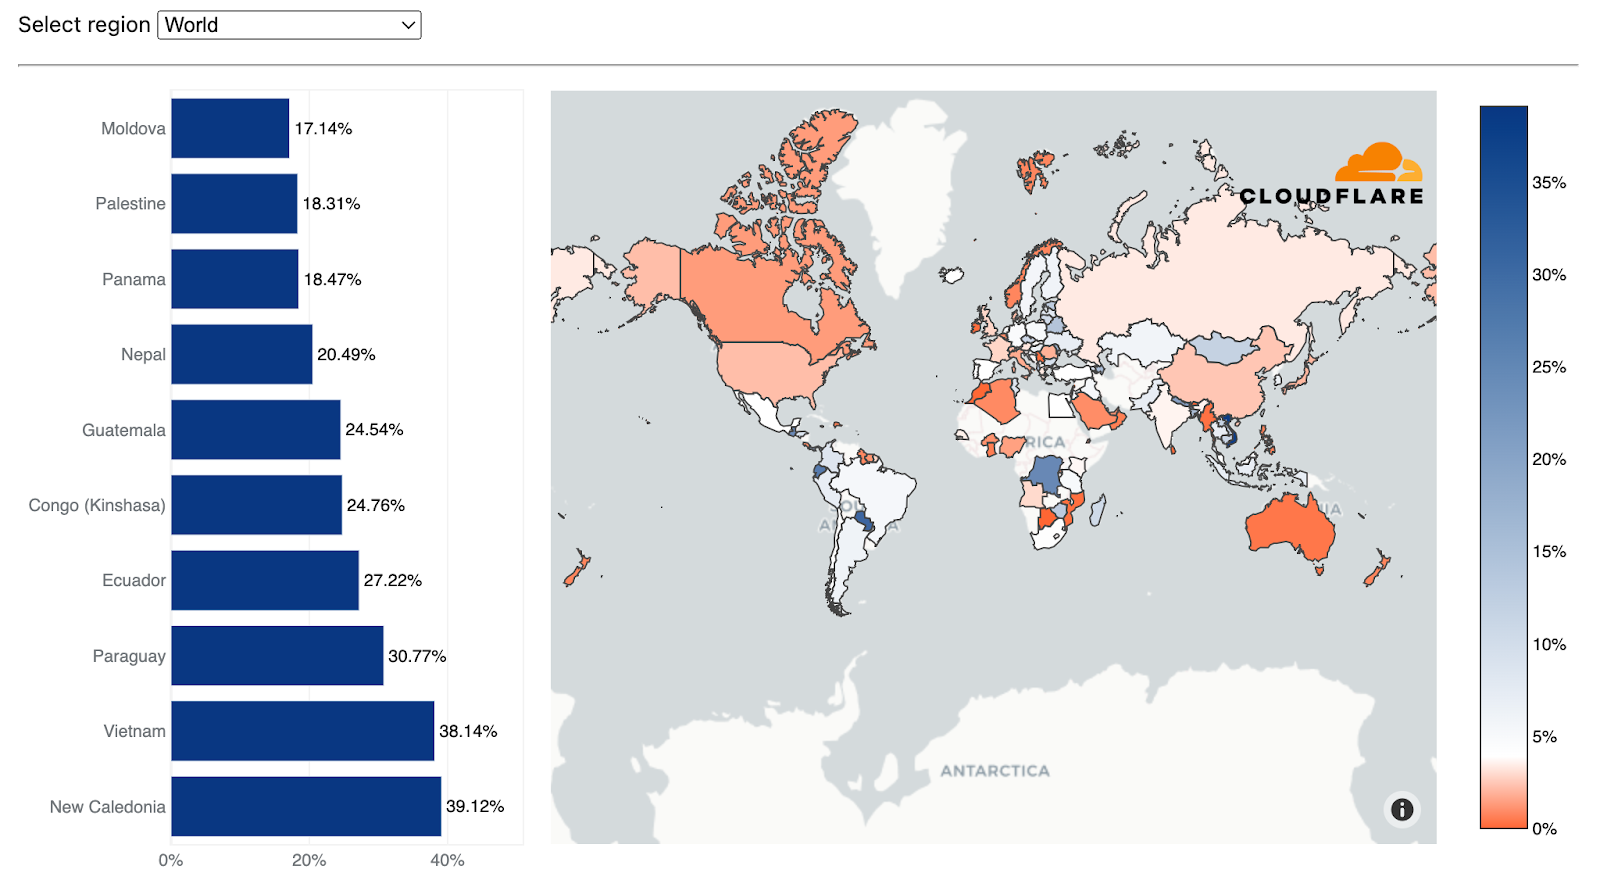
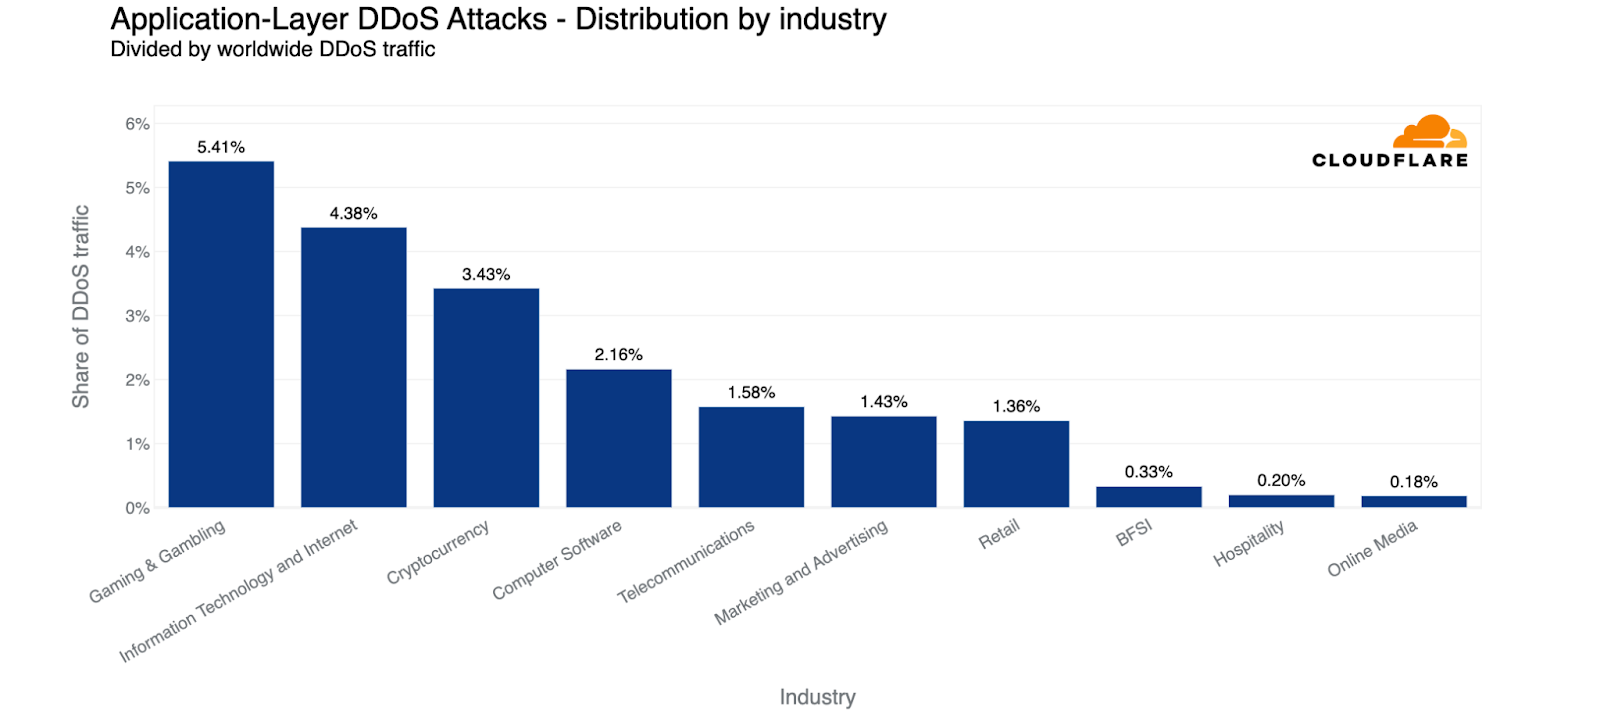
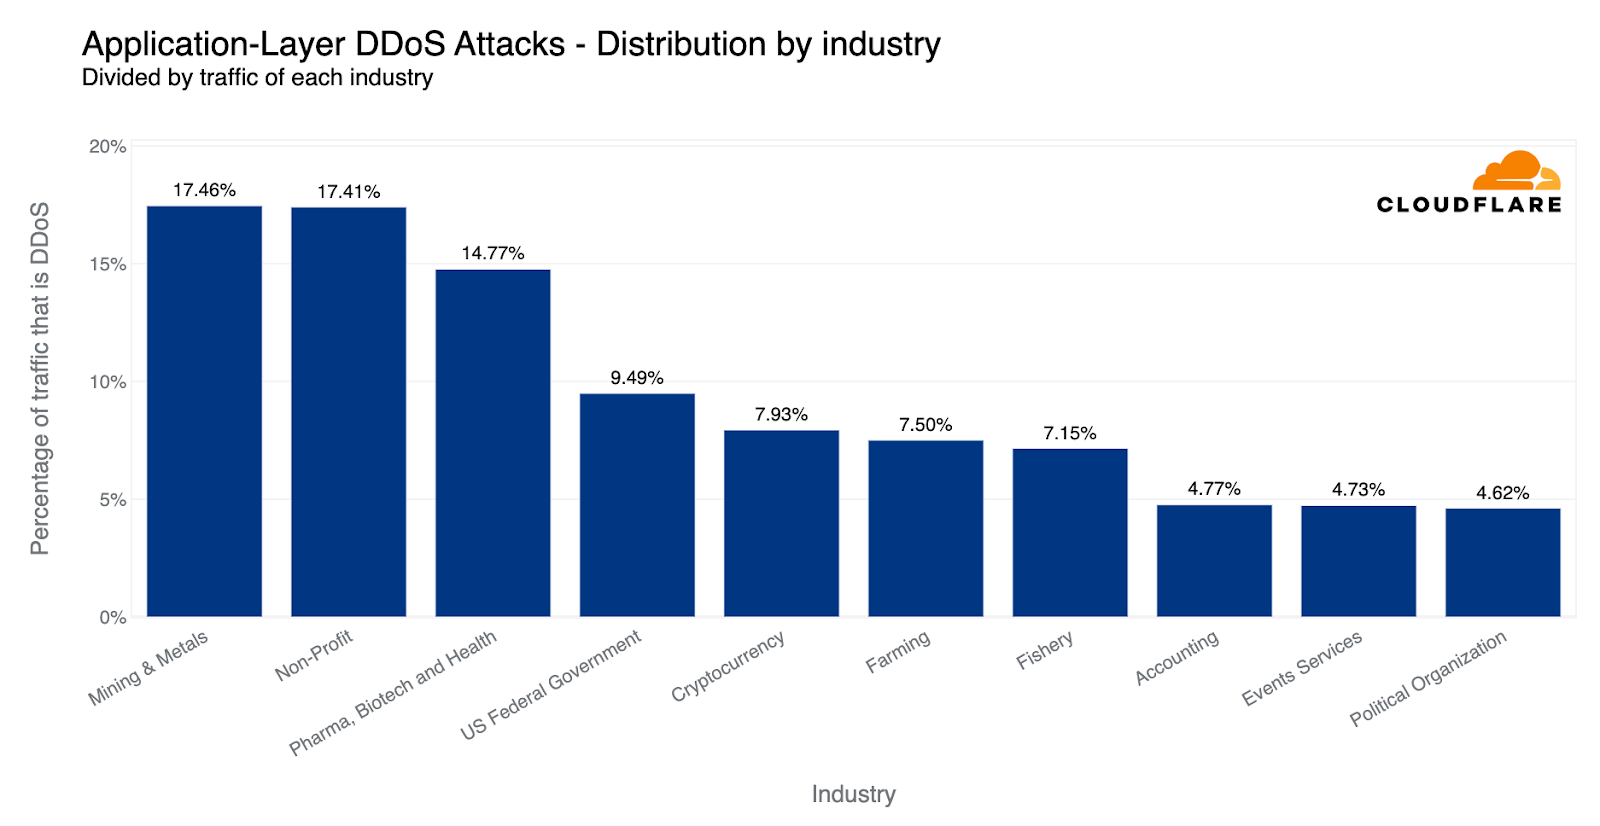
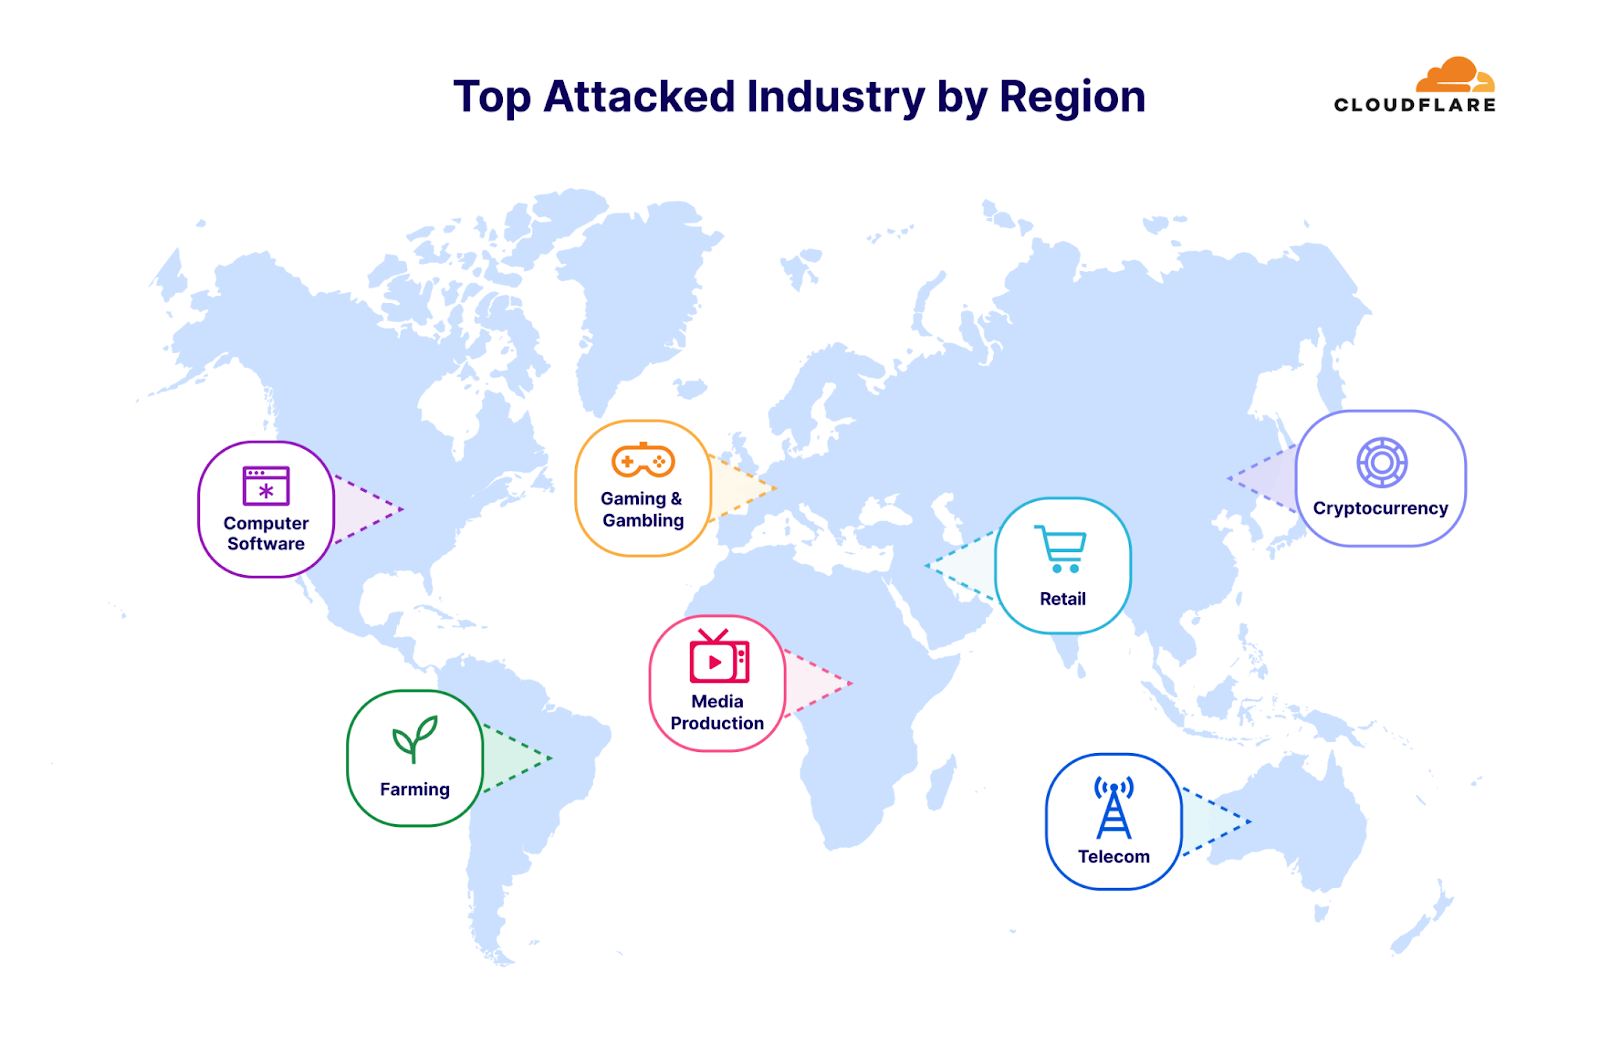
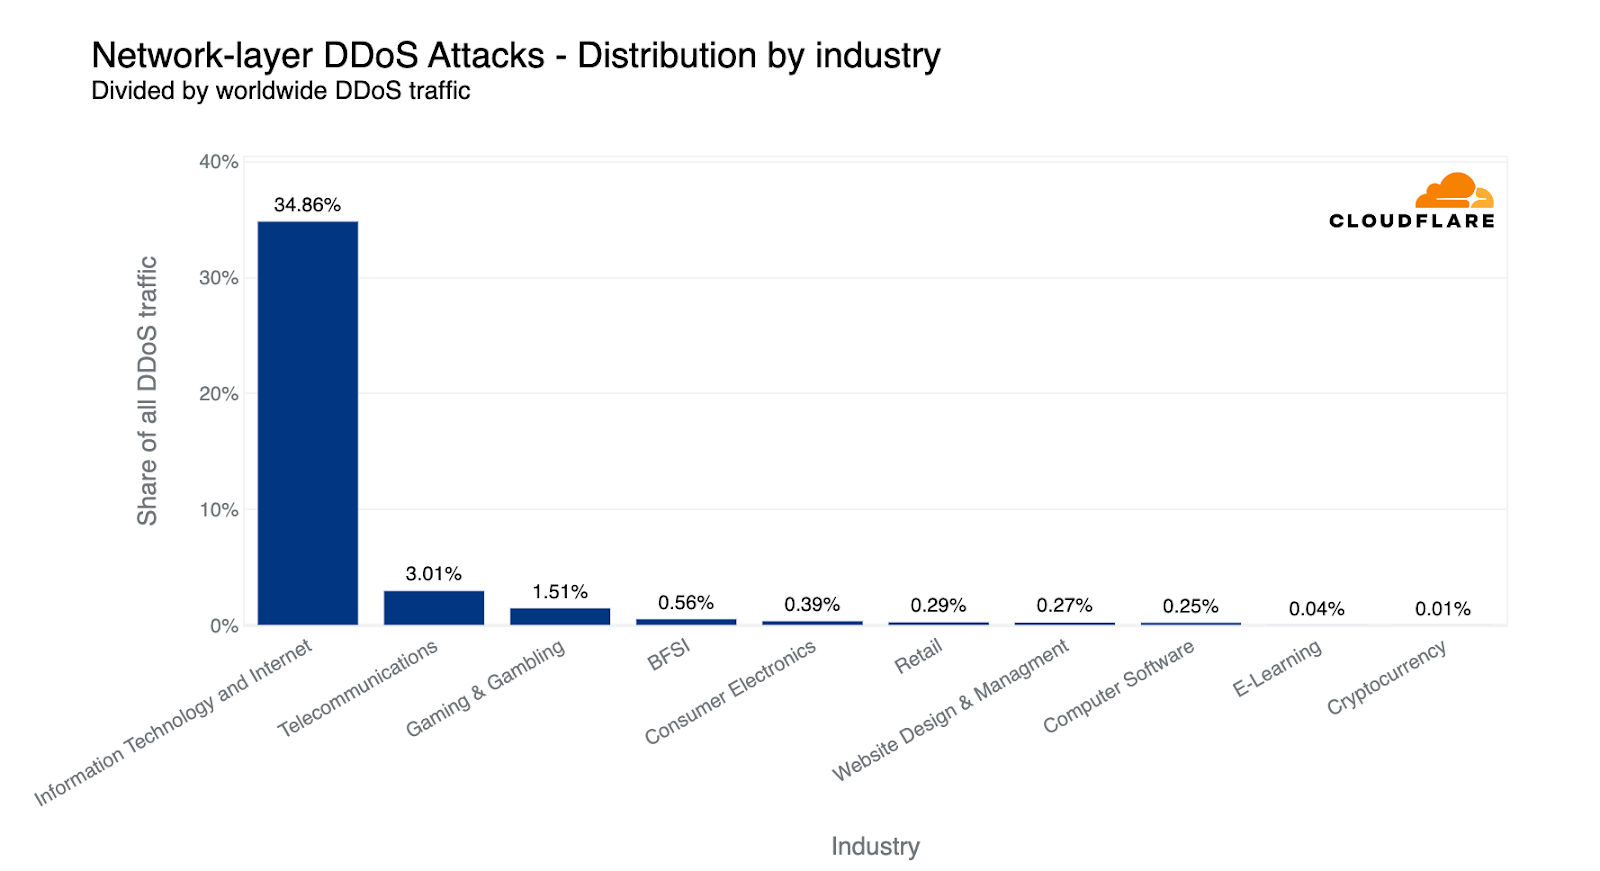
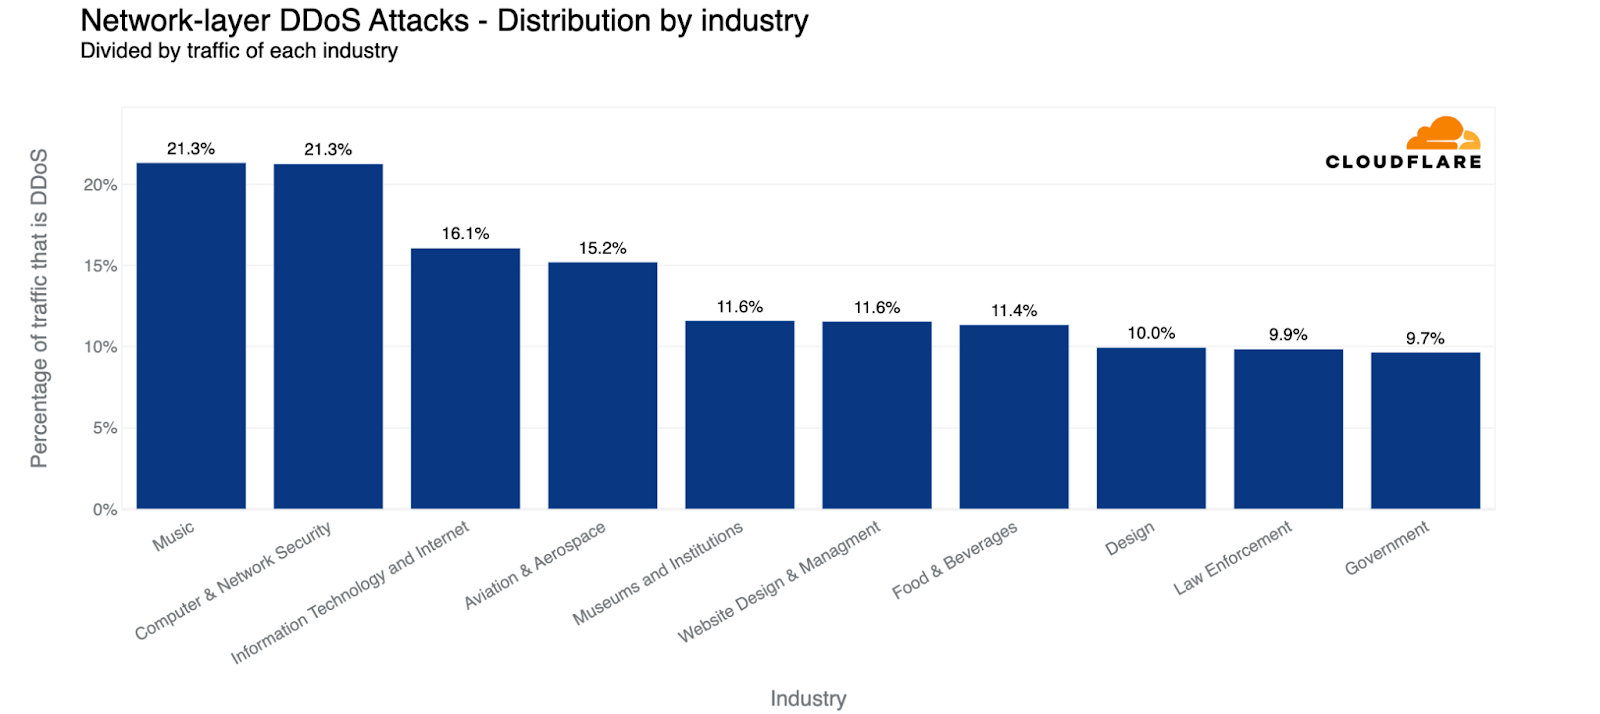
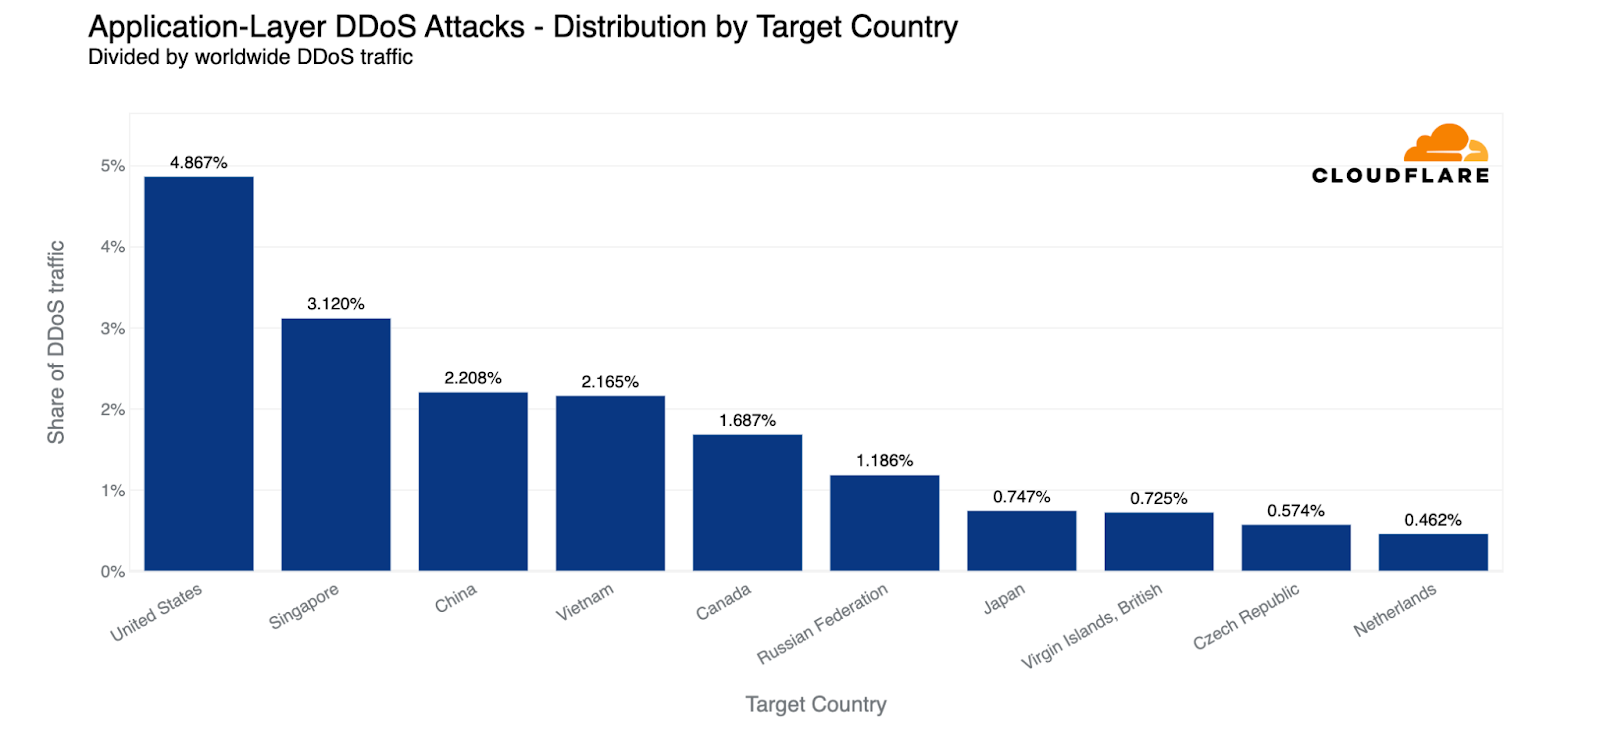
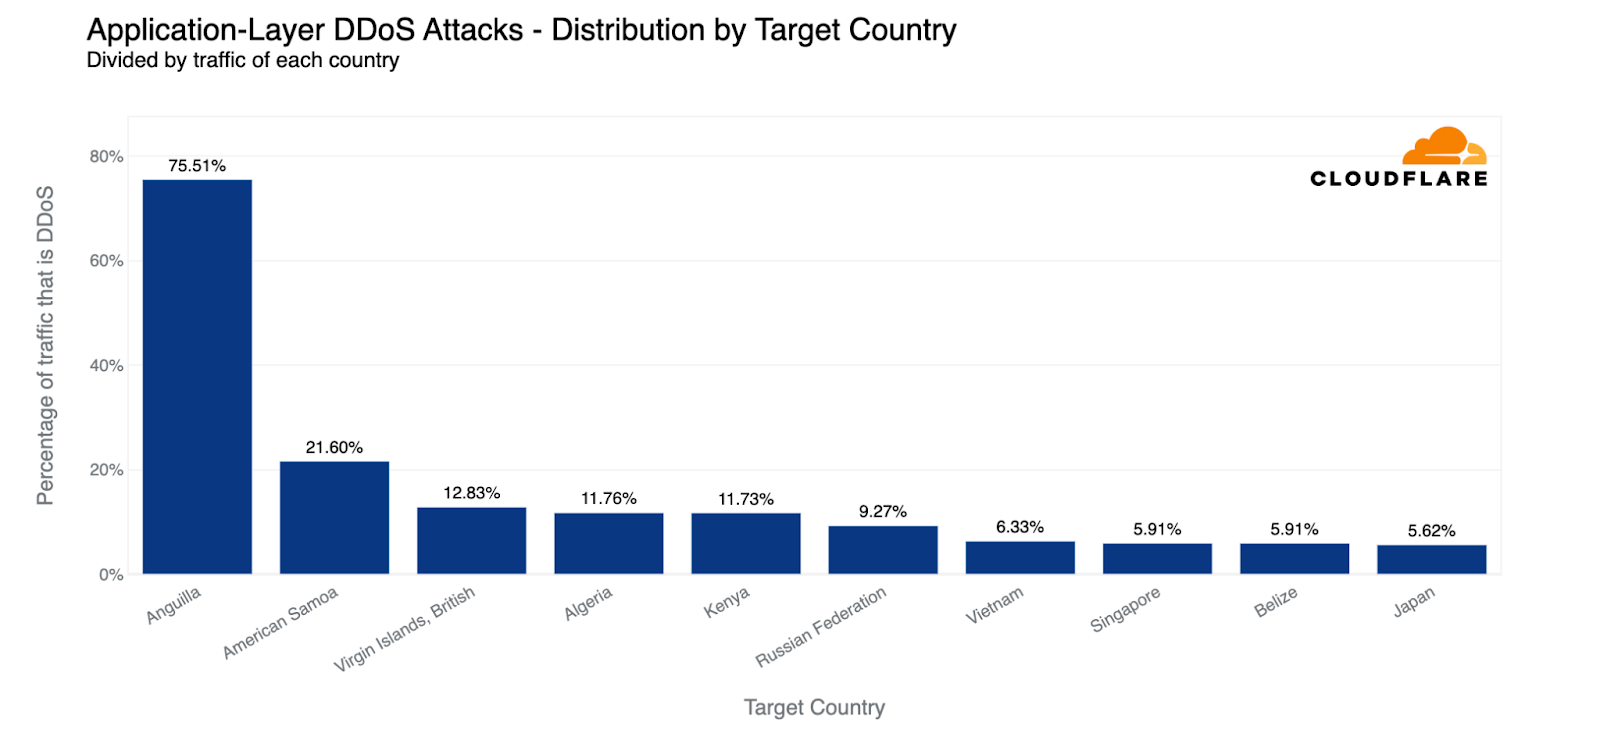
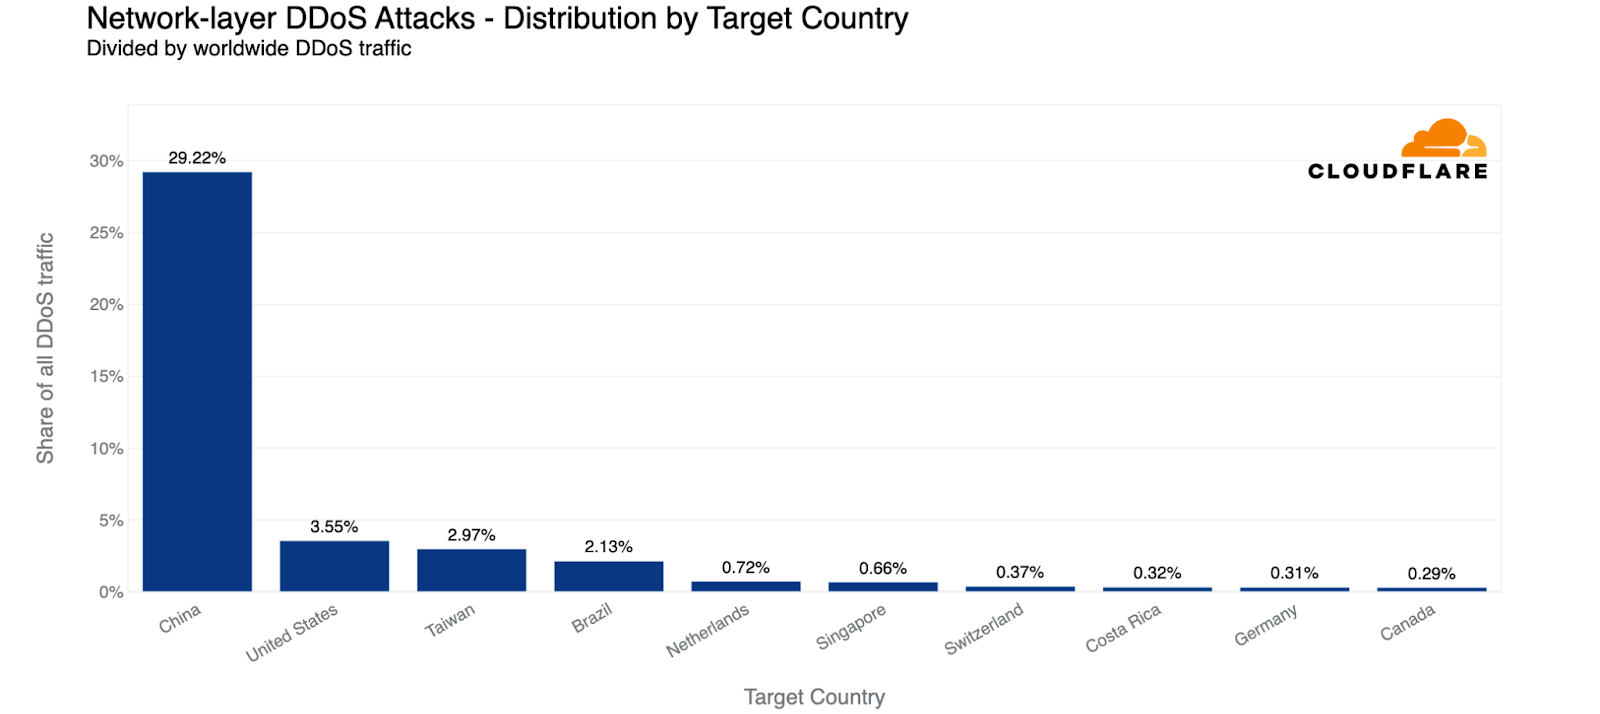
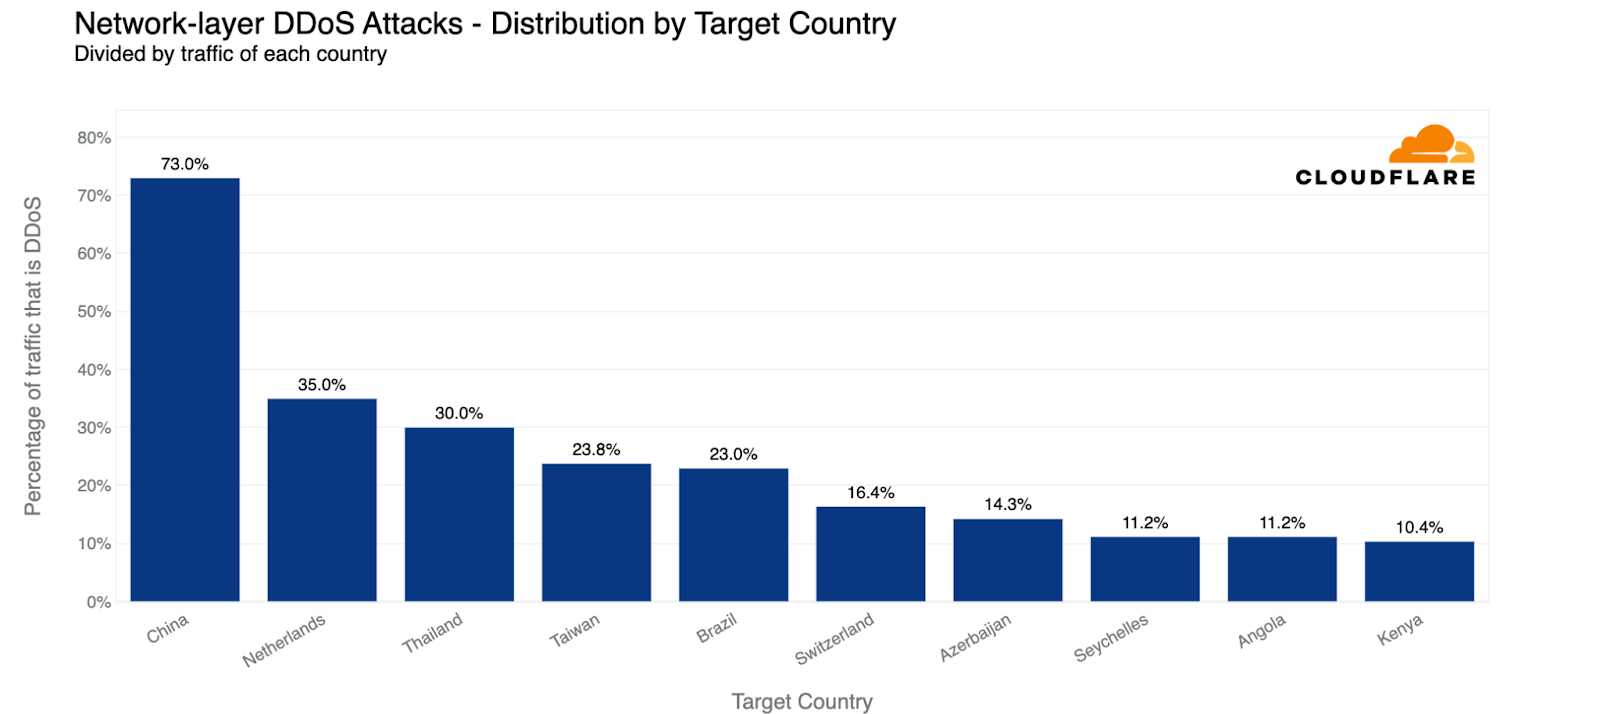
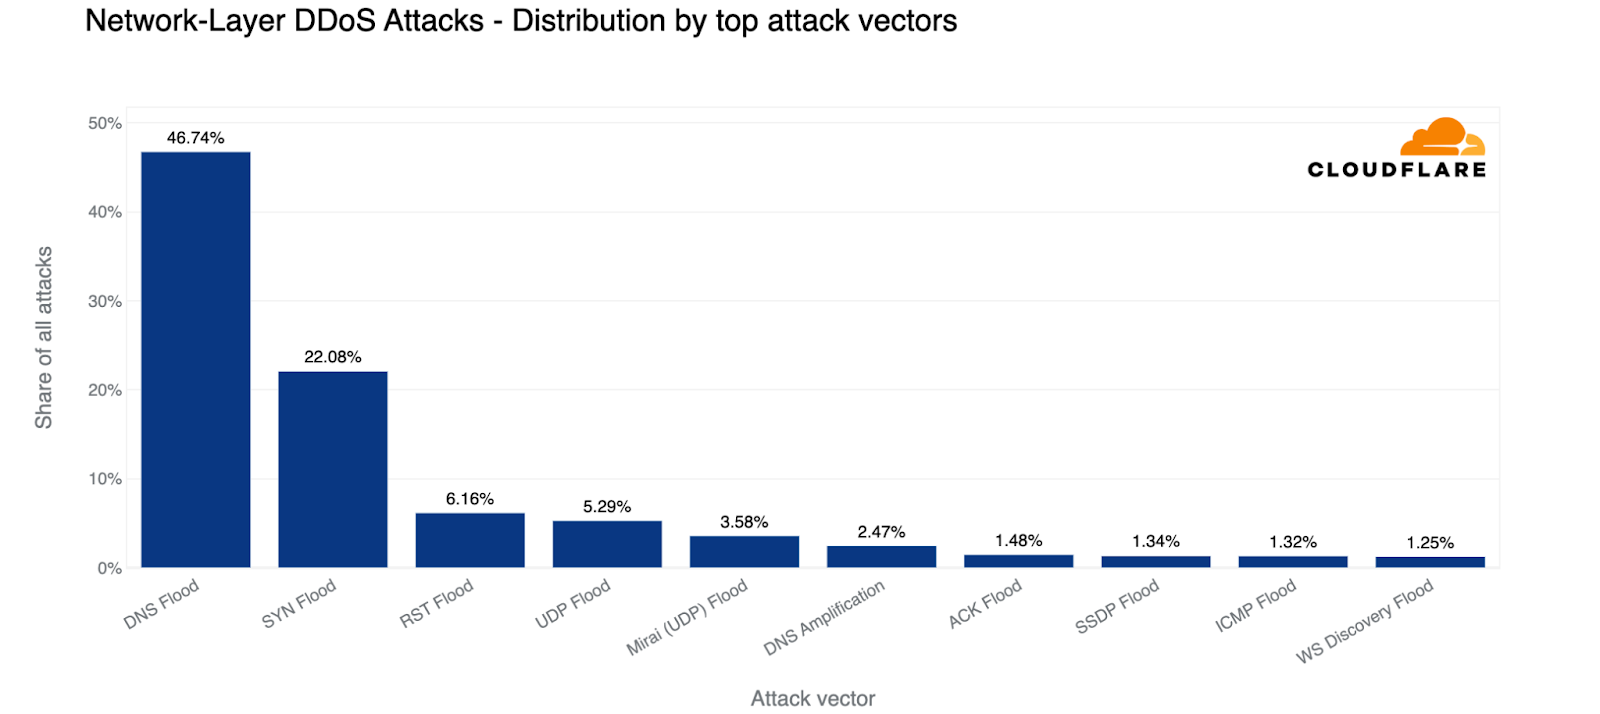
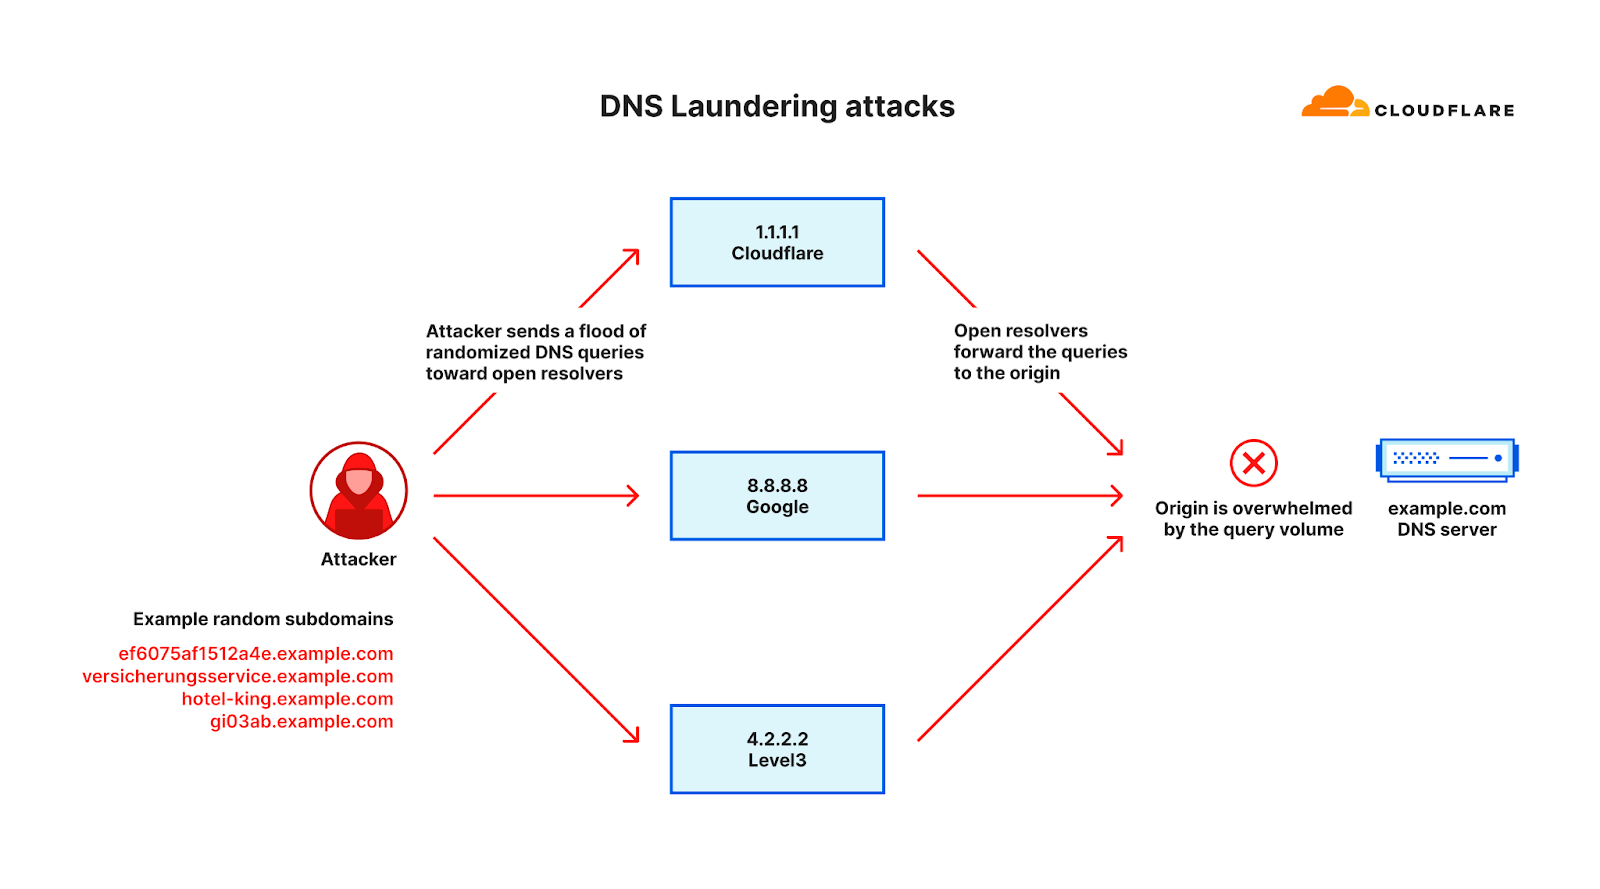
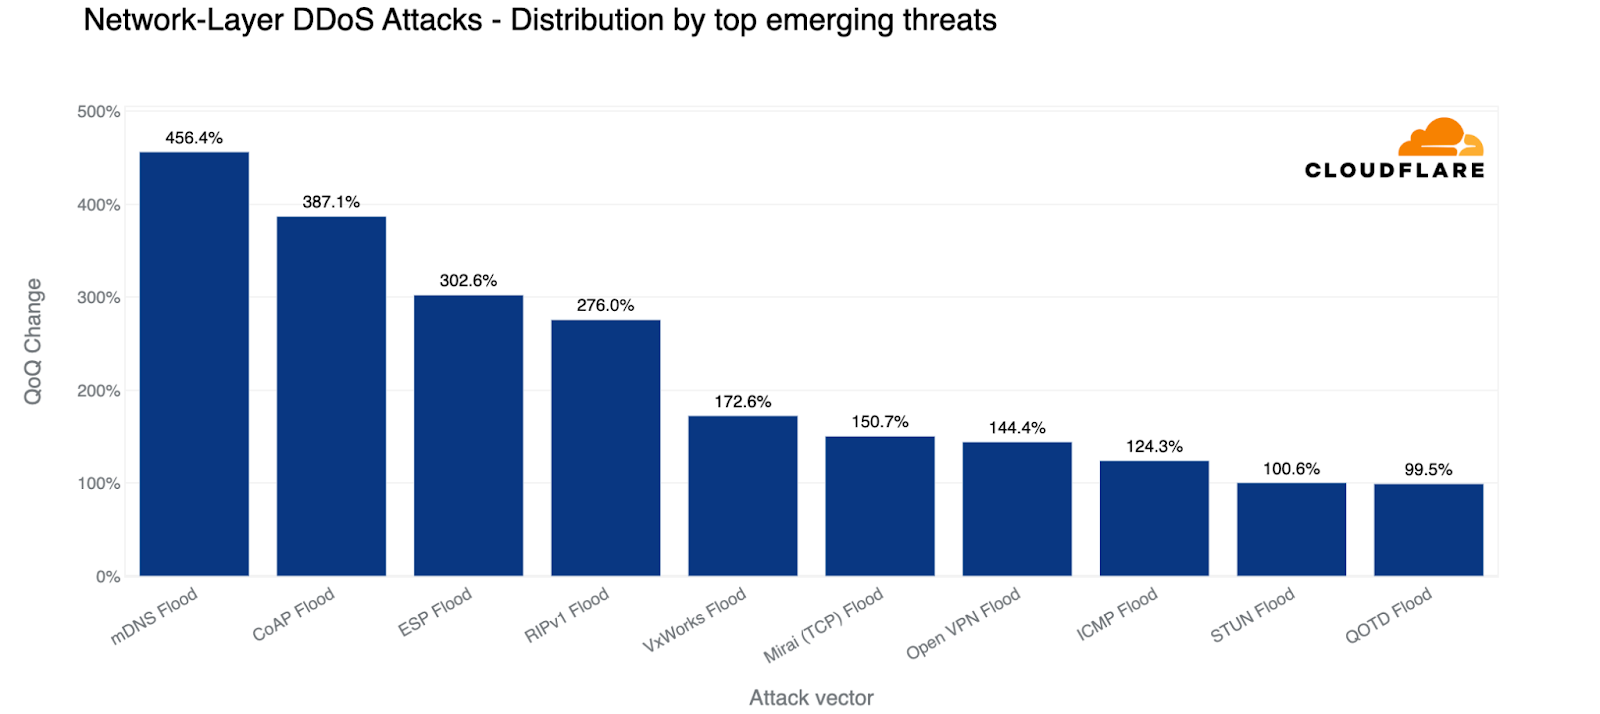
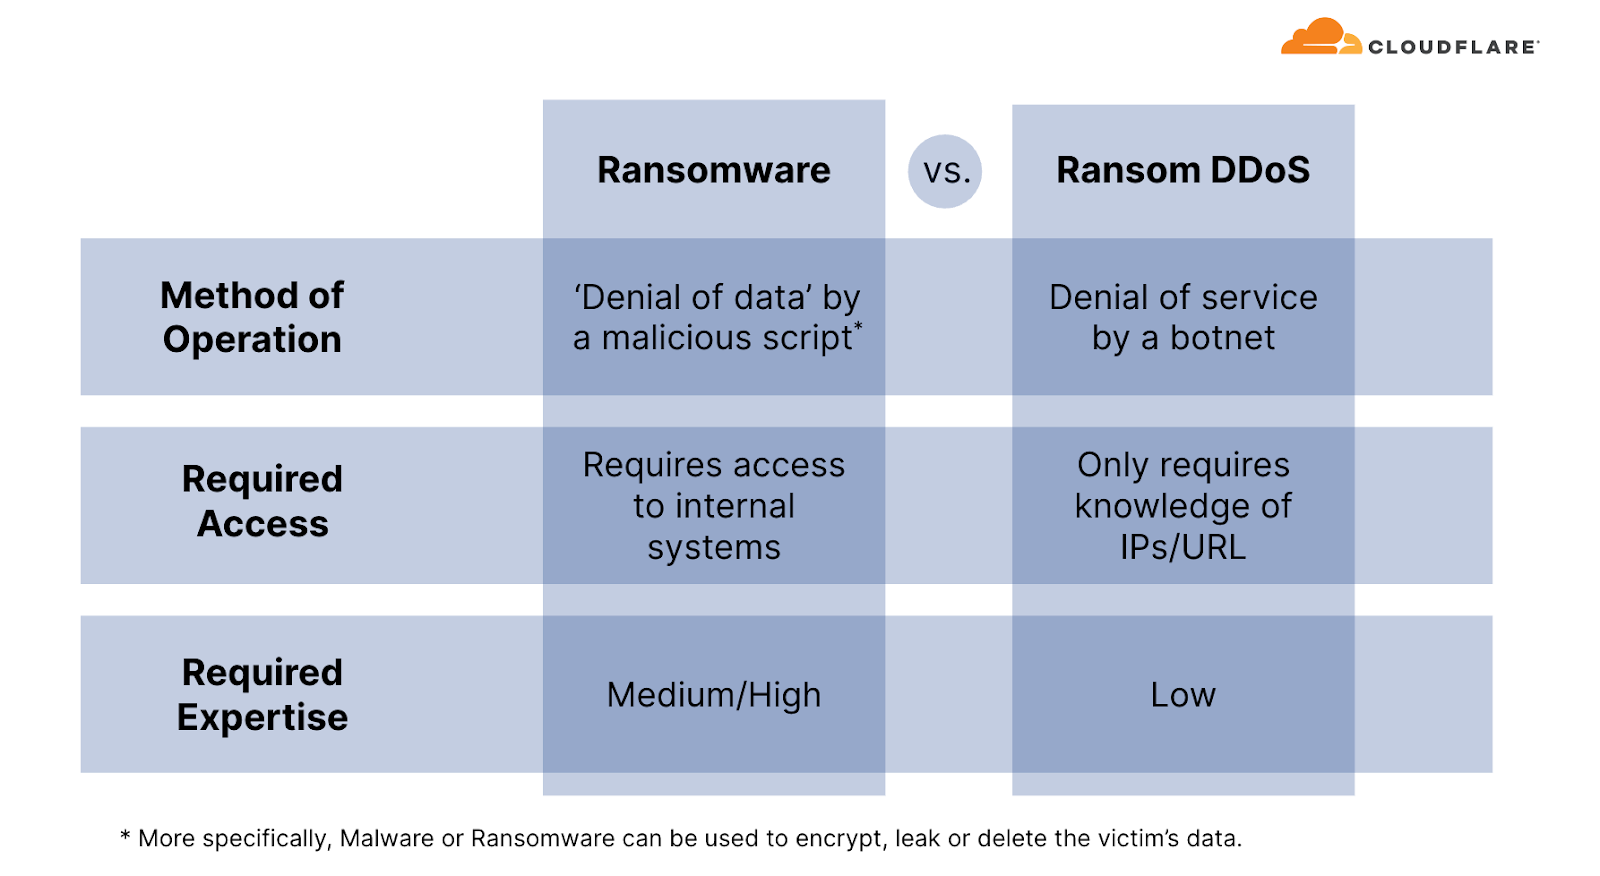

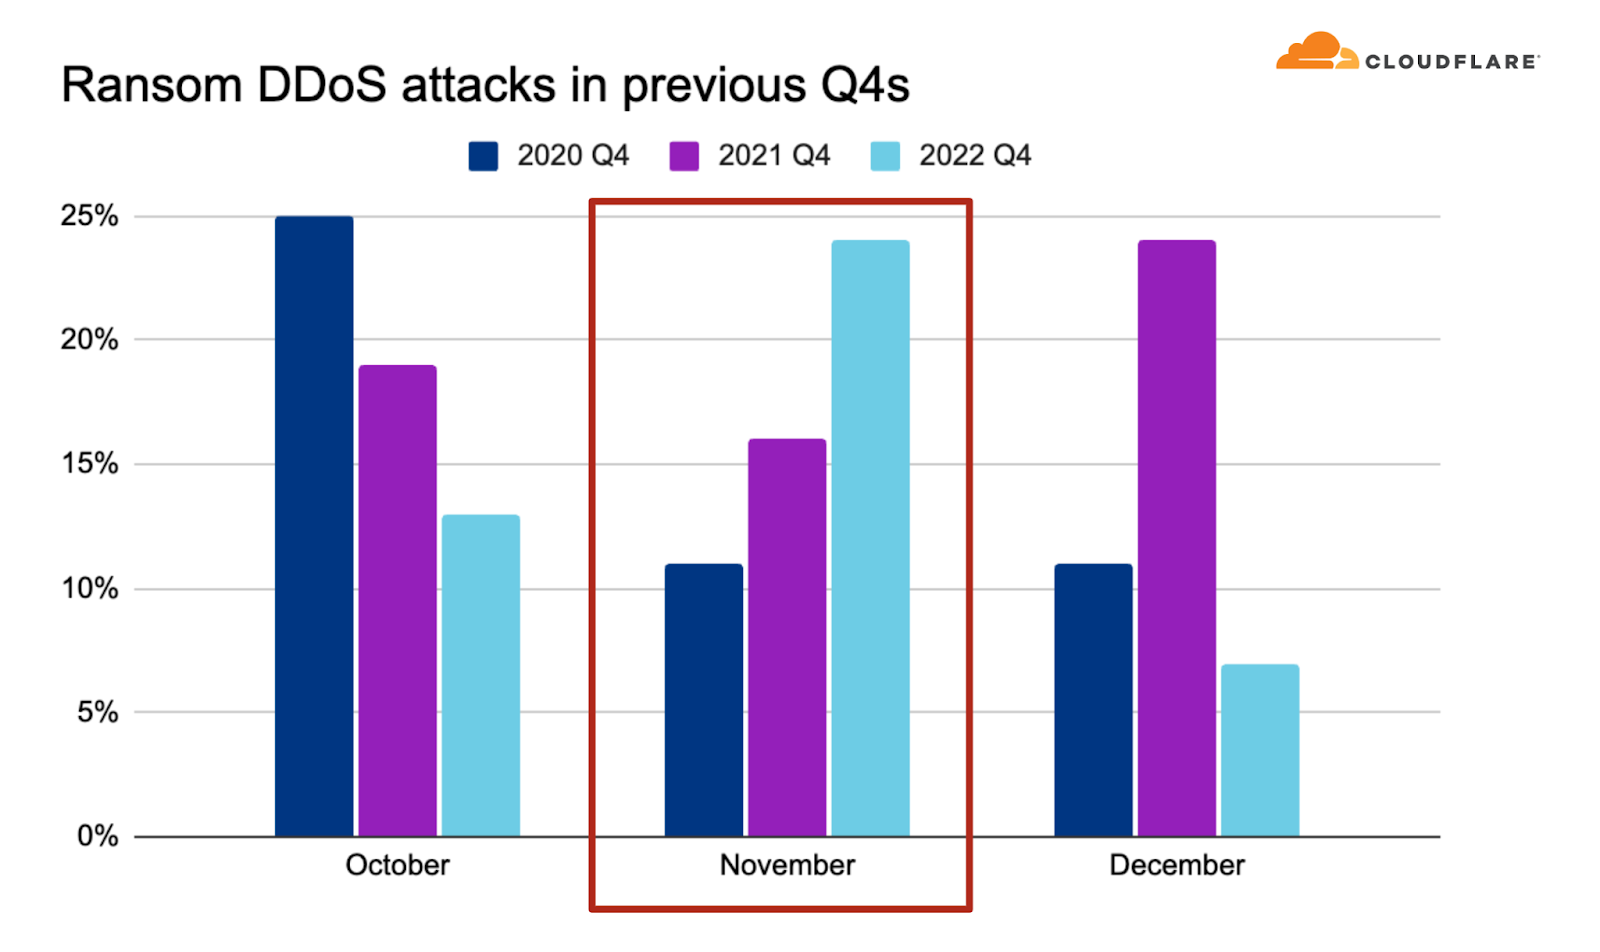


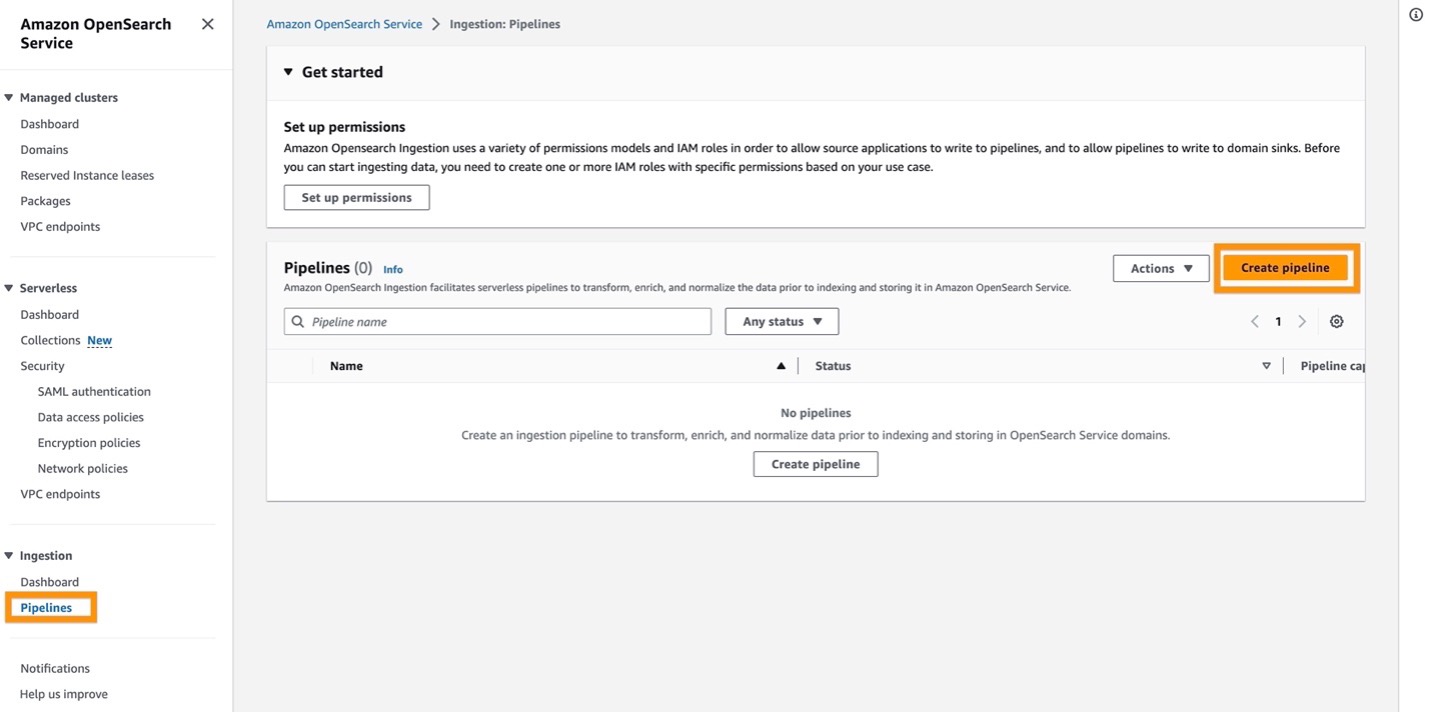

 Mikhail Vaynshteyn is a Solutions Architect with Amazon Web Services. Mikhail works with healthcare and life sciences customers to build solutions that help improve patients’ outcomes. Mikhail specializes in data analytics services.
 Muthu Pitchaimani is a Search Specialist with Amazon OpenSearch Service. He builds large-scale search applications and solutions. Muthu is interested in the topics of networking and security, and is based out of Austin, Texas.

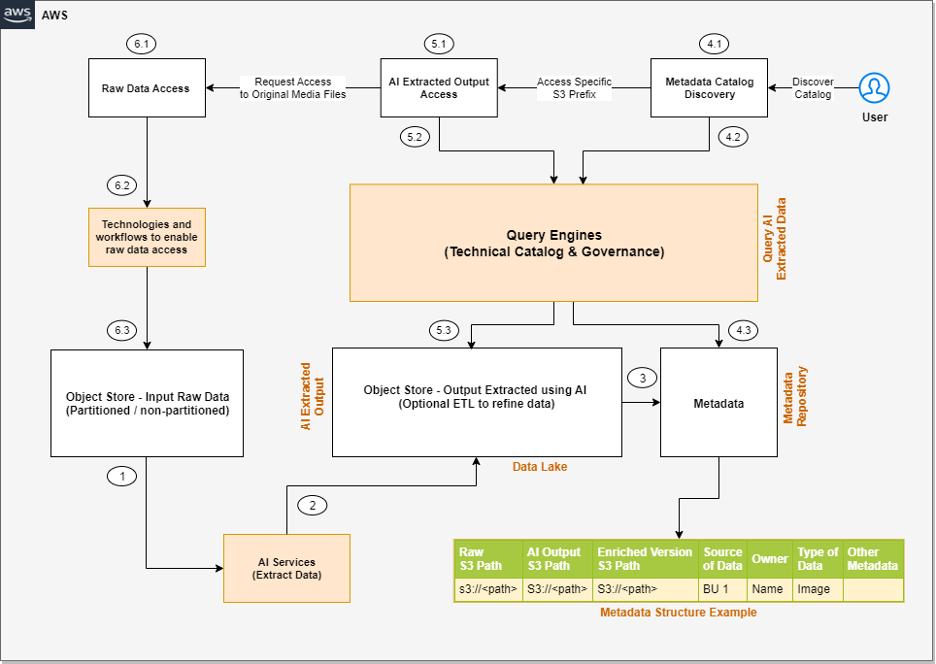

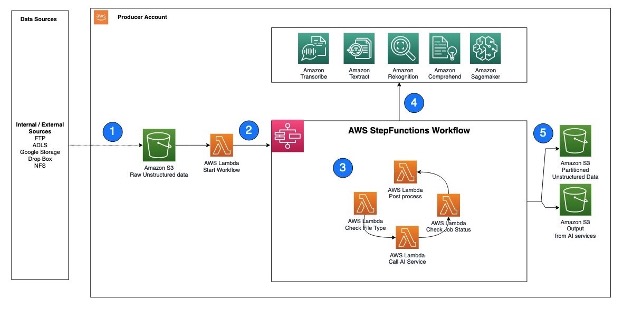
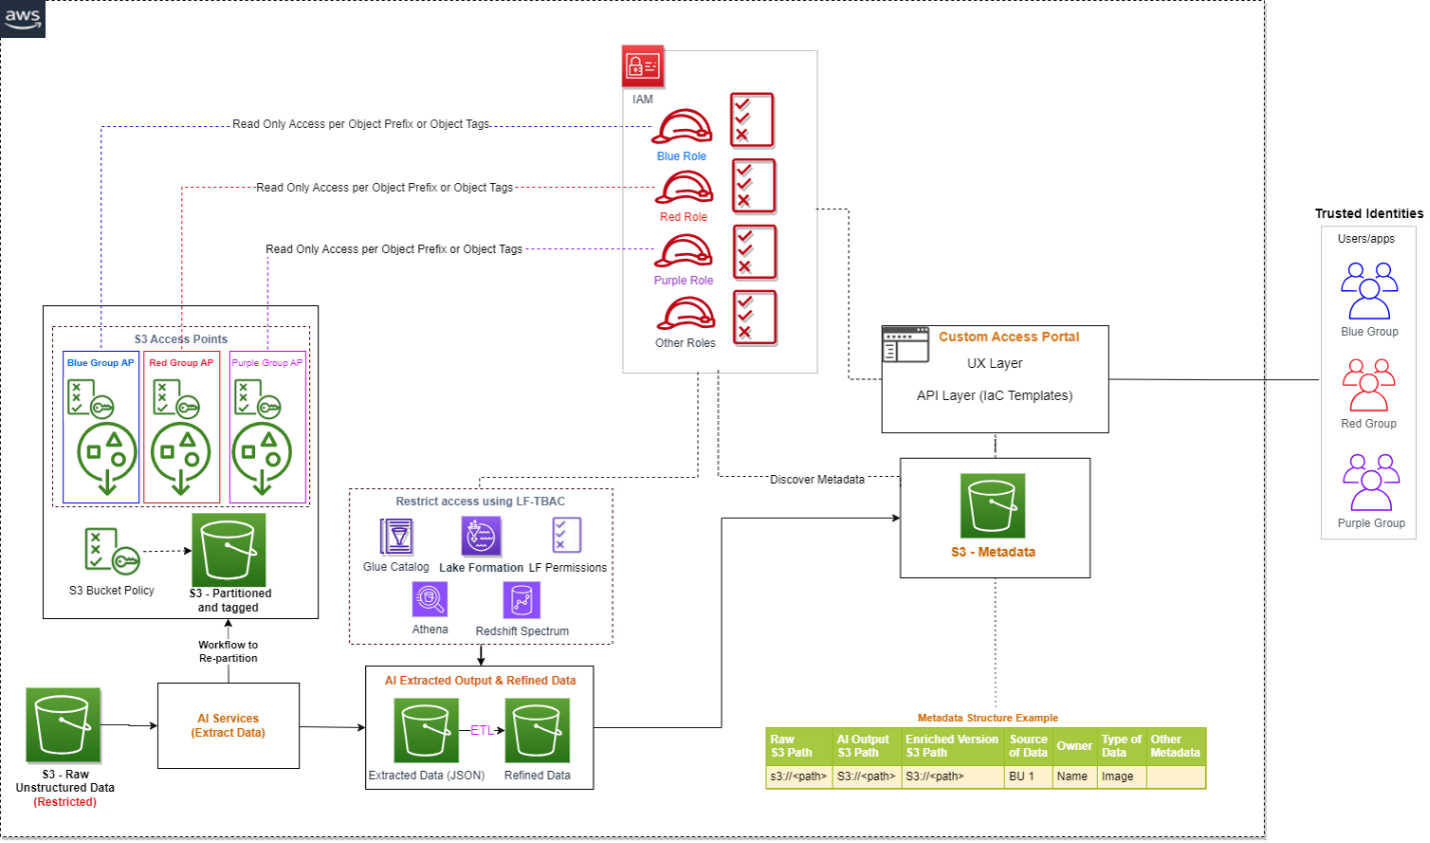
 Sakti Mishra is a Principal Solutions Architect at AWS, where he helps customers modernize their data architecture and define their end-to-end data strategy, including data security, accessibility, governance, and more. He is also the author of the book
  Bhavana Chirumamilla is a Senior Resident Architect at AWS with a strong passion for data and machine learning operations. She brings a wealth of experience and enthusiasm to help enterprises build effective data and ML strategies. In her spare time, Bhavana enjoys spending time with her family and engaging in various activities such as traveling, hiking, gardening, and watching documentaries.
 Sheela Sonone is a Senior Resident Architect at AWS. She helps AWS customers make informed choices and trade-offs about accelerating their data, analytics, and AI/ML workloads and implementations. In her spare time, she enjoys spending time with her family—usually on tennis courts.
 Daniel Bruno is a Principal Resident Architect at AWS. He had been building analytics and machine learning solutions for over 20 years and splits his time helping customers build data science programs and designing impactful ML products.