Post Syndicated from Manasi Bhutada original https://aws.amazon.com/blogs/big-data/introducing-amazon-mwaa-support-for-apache-airflow-version-2-7-2-and-deferrable-operators/
Amazon Managed Workflow for Apache Airflow (Amazon MWAA) is a managed service that allows you to use a familiar Apache Airflow environment with improved scalability, availability, and security to enhance and scale your business workflows without the operational burden of managing the underlying infrastructure.
Today, we are announcing the availability of Apache Airflow version 2.7.2 environments and support for deferrable operators on Amazon MWAA. In this post, we provide an overview of deferrable operators and triggers, including a walkthrough of an example showcasing how to use them. We also delve into some of the new features and capabilities of Apache Airflow, and how you can set up or upgrade your Amazon MWAA environment to version 2.7.2.
Deferrable operators and triggers
Standard operators and sensors continuously occupy an Airflow worker slot, regardless of whether they are active or idle. For example, even while waiting for an external system to complete a job, a worker slot is consumed. The Gantt chart below, representing a Directed Acyclic Graph (DAG), showcases this scenario through multiple Amazon Redshift operations.
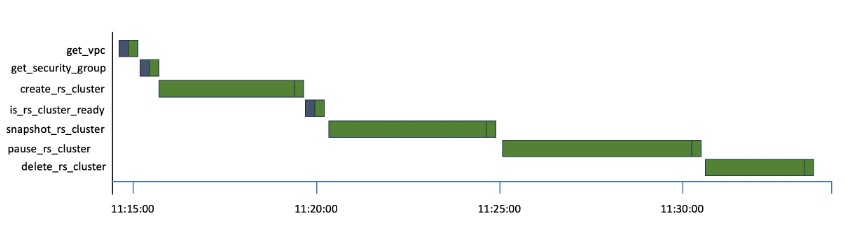
You can see the time each task spends idling while waiting for the Redshift cluster to be created, snapshotted, and paused. With the introduction of deferrable operators in Apache Airflow 2.2, the polling process can be offloaded to ensure efficient utilization of the worker slot. A deferrable operator can suspend itself and resume once the external job is complete, instead of continuously occupying a worker slot. This minimizes queued tasks and leads to a more efficient utilization of resources within your Amazon MWAA environment. The following figure shows a simplified diagram describing the process flow.
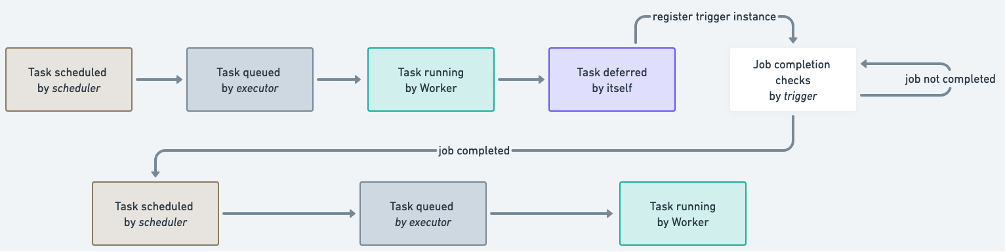
After a task has deferred its run, it frees up the worker slot and assigns the check of completion to a small piece of asynchronous code called a trigger. The trigger runs in a parent process called a triggerer, a service that runs an asyncio event loop. The triggerer has the capability to run triggers in parallel at scale, and to signal tasks to resume when a condition is met.
The Amazon provider package for Apache Airflow has added triggers for popular AWS services like AWS Glue and Amazon EMR. In Amazon MWAA environments running Apache Airflow v2.7.2, the management and operation of the triggerer service is taken care of for you. If you prefer not to use the triggerer service, you can change the configuration mwaa.triggerer_enabled. Additionally, you can define how many triggers each triggerer can run in parallel using the configuration parameter triggerer.default_capacity. This parameter defaults to values based on your Amazon MWAA environment class. Refer to the Configuration reference in the User Guide for detailed configuration values.
When to use deferrable operators
Deferrable operators are particularly useful for tasks that submit jobs to systems external to an Amazon MWAA environment, such as Amazon EMR, AWS Glue, and Amazon SageMaker, or other sensors waiting for a specific event to occur. These tasks can take minutes to hours to complete and are primarily idle operators, making them good candidates to be replaced by their deferrable versions. Some additional use cases include:
- File system-based operations.
- Database operations with long running queries.
Using deferrable operators in Amazon MWAA
To use deferrable operators in Amazon MWAA, ensure you’re running Apache Airflow version 2.7 or greater in your Amazon MWAA environment, and the operators or sensors in your DAGs support deferring. Operators in the Amazon provider package expose a deferrable parameter which you can set to True to run the operator in asynchronous mode. For example, you can use S3KeySensor in asynchronous mode as follows:
You can also utilize various pre-built deferrable operators available in other provider packages, such as Snowflake and Databricks.
Follow the complete sample code in the GitHub repository to understand how deferrable operators work together. You will be building and orchestrating the data pipeline illustrated in the following figure.

The pipeline consists of three stages:
- A S3KeySensor that waits for a dataset to be uploaded in Amazon Simple Storage Service (Amazon S3)
- An AWS Glue crawler to classify objects in the dataset and save schemas into the AWS Glue Data Catalog
- An AWS Glue job that uses the metadata in the Data Catalog to denormalize the source dataset, create Data Catalog tables based on filtered data, and write the resulting data back to Amazon S3 in separate Apache Parquet files.
Setup and Teardown tasks
It’s common to build workflows that require ephemeral resources, for example an S3 bucket to temporarily store data, databases and corresponding datasets to run quality checks, or a compute cluster to train a model in a machine learning (ML) orchestration pipeline. You need to have these resources properly configured before running work tasks, and after their run, ensure they are torn down. Doing this manually is complex. It may lead to poor readability and maintainability of your DAGs, and leave resources running constantly, thereby increasing costs. With Amazon MWAA support for Apache Airflow version 2.7.2, you can use two new types of tasks to support this scenario: setup and teardown tasks.
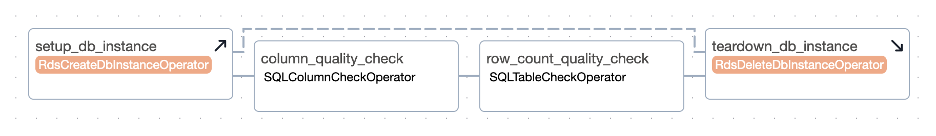
Setup and teardown tasks ensure that the resources needed for a work task are set up before the task starts its run and then are taken down after it has finished, even if the work task fails. Any task can be configured as a setup or teardown task. Once configured, they have special visibility in the Airflow UI and also special behavior. The following graph describes a simple data quality check pipeline using setup and teardown tasks.
One option to mark setup_db_instance and teardown_db_instance as setup and teardown tasks is to use the as_teardown() method in the teardown task in the dependencies chain declaration. Note that the method receives the setup task as a parameter:
Another option is to use @setup and @teardown decorators:
After you configure the tasks, the graph view shows your setup tasks with an upward arrow and your teardown tasks with a downward arrow. They’re connected by a dotted line depicting the setup/teardown workflow. Any task between the setup and teardown tasks (such as column_quality_check and row_count_quality_check) are in the scope of the workflow. This arrangement involves the following behavior:
- If you clear
column_quality_checkorrow_count_quality_check, bothsetup_db_instanceandteardown_db_instancewill be cleared - If
setup_db_instanceruns successfully, andcolumn_quality_checkandrow_count_quality_checkhave completed, regardless of whether they were successful or not,teardown_db_instancewill run - If
setup_db_instancefails or is skipped, thenteardown_db_instancewill fail or skip - If
teardown_db_instancefails, by default Airflow ignores its status to evaluate whether the pipeline run was successful
Note that when creating setup and teardown workflows, there can be more than one set of setup and teardown tasks, and they can be parallel and nested. Neither setup nor teardown tasks are limited in number, nor are the worker tasks you can include in the scope of the workflow.
Follow the complete sample code in the GitHub repository to understand how setup and teardown tasks work.
When to use setup and teardown tasks
Setup and teardown tasks are useful to improve the reliability and cost-effectiveness of DAGs, ensuring that required resources are created and deleted in the right time. They can also help simplify complex DAGs by breaking them down into smaller, more manageable tasks, improving maintainability. Some use cases include:
- Data processing based on ephemeral compute, like Amazon Elastic Compute Cloud (Amazon EC2) instances fleets or EMR clusters
- ML model training or tuning pipelines
- Extract, transform, and load (ETL) jobs using external ephemeral data stores to share data among Airflow tasks
With Amazon MWAA support for Apache Airflow version 2.7.2, you can start using setup and teardown tasks to improve your pipelines as of today. To learn more about Setup and Teardown tasks, refer to the Apache Airflow documentation.
Secrets cache
To reflect changes to your DAGs and tasks, the Apache Airflow scheduler parses your DAG files continuously, every 30 seconds by default. If you have variables or connections as top-level code (code outside the operator’s execute methods), a request is generated every time the DAG file is parsed, impacting parsing speed and leading to sub-optimal performance in the DAG file processing. If you are running at scale, it has the potential to affect Airflow performance and scalability as the amount of network communication and load on the metastore database increase. If you’re using an alternative secrets backend, such as AWS Secrets Manager, every DAG parse is a new request to that service, increasing costs.
With Amazon MWAA support for Apache Airflow version 2.7.2, you can use secrets cache for variables and connections. Airflow will cache variables and connections locally so that they can be accessed faster during DAG parsing, without having to fetch them from the secrets backend, environments variables, or metadata database. The following diagram describes the process.
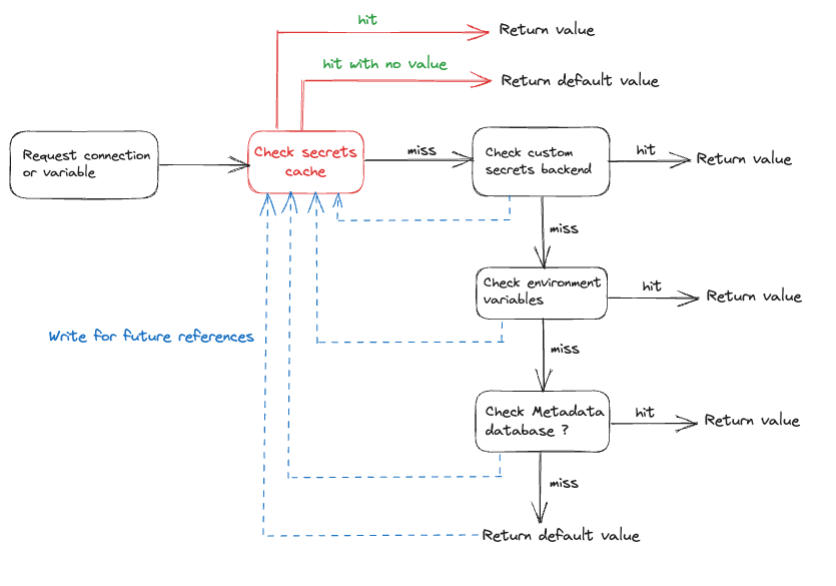
Enabling caching will help lower the DAG parsing time, especially if variables and connections are used in top-level code (which is not a best practice). With the introduction of a secrets cache, the frequency of API calls to the backend is reduced, which in turn lowers the overall cost associated with backend access. However, similar to other caching implementations, a secrets cache may serve outdated values until the time to live (TTL) expires.
When to use the secrets cache feature
You should consider using the secrets cache feature to improve performance and reliability, and to reduce the operating costs of your Airflow tasks. This is particularly useful if your DAG frequently retrieves variables or connections in the top-level Python code.
How to use the secrets cache feature on Amazon MWAA
To enable the secrets cache, you can set the secrets.use_cache environment configuration parameter to True. Once enabled, Airflow will automatically cache secrets when they are accessed. The cache will only be used during DAG files parsing, and not during DAG runtime.
You can also control the TTL of stored values for which the cache is considered valid using the environment configuration parameter secrets.cache_ttl_seconds, which is defaulted to 15 minutes.
Running or failed filters and Cluster Activity page
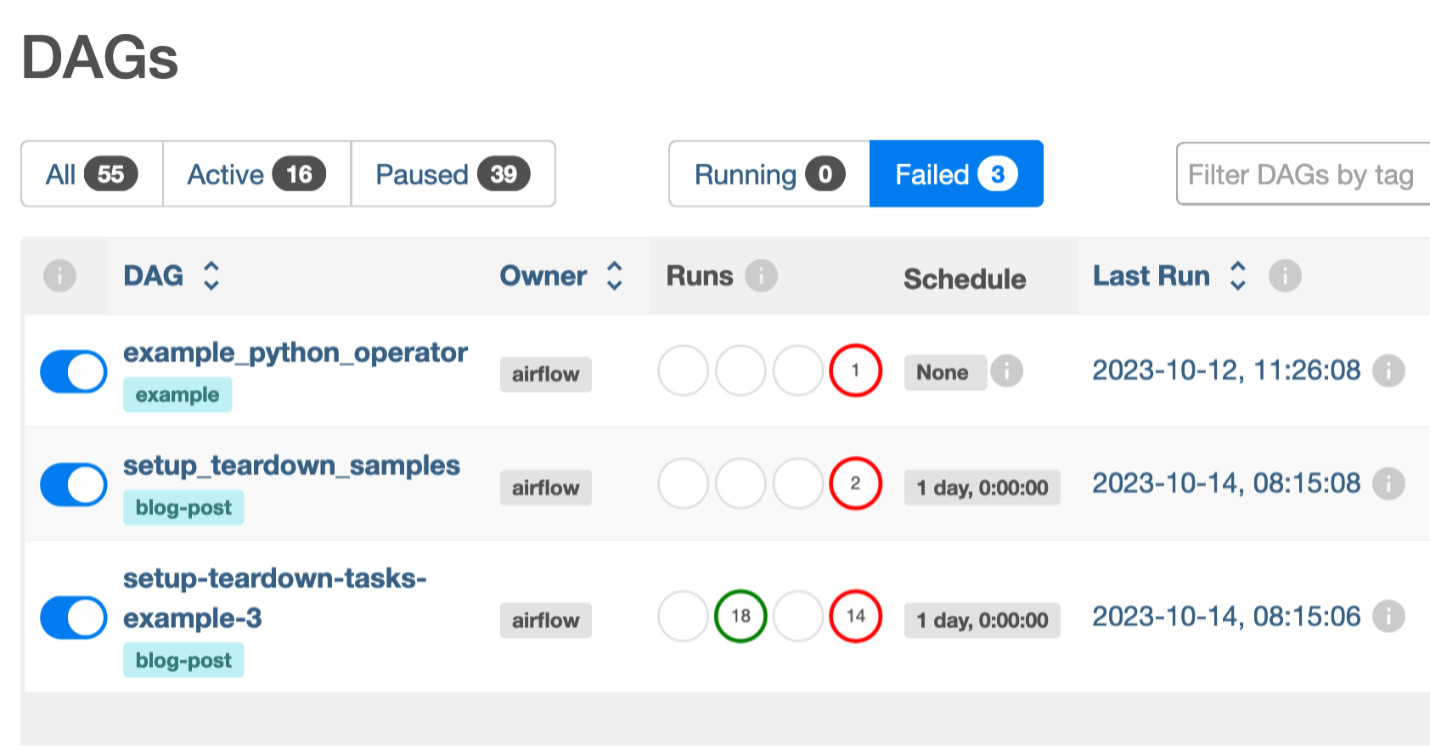
Identifying DAGs in failed state can be challenging for large Airflow instances. You typically find yourself scrolling through pages searching for failures to address. With Apache Airflow version 2.7.2 environments in Amazon MWAA, you can now filter DAGs currently running and DAGs with failed DAG runs. As you can see in the following screenshot, two status tabs, Running and Failed, were added to the UI.
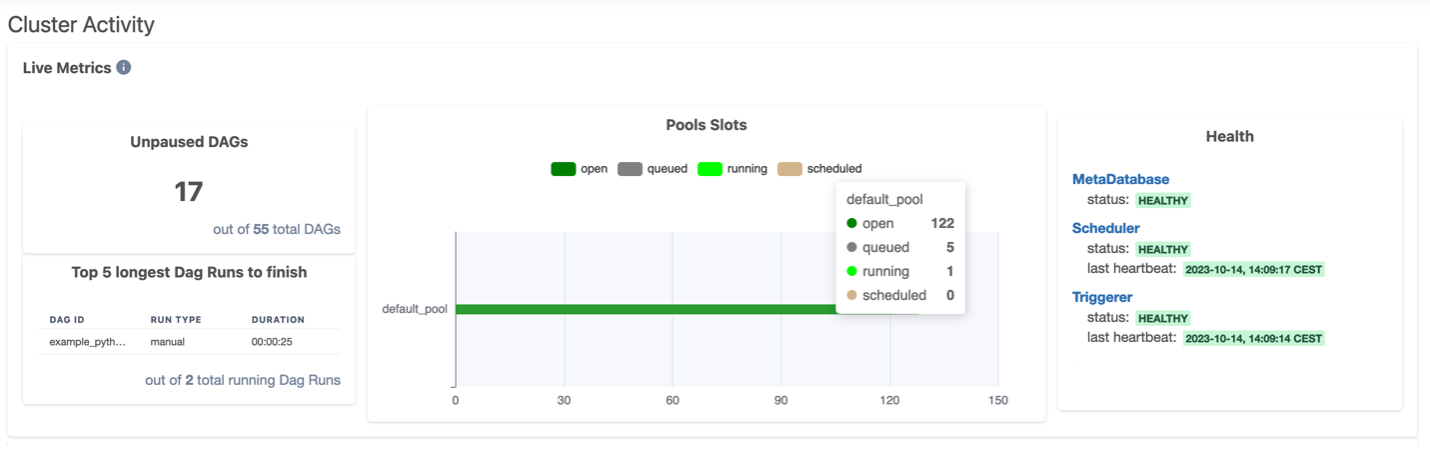
Another advantage of Amazon MWAA environments using Apache Airflow version 2.7.2 is the new Cluster Activity page for environment-level monitoring.
The Cluster Activity page gathers useful data to monitor your cluster’s live and historical metrics. In the top section of the page, you get live metrics on the number of DAGs ready to be scheduled, the top 5 longest running DAGs, slots used in different pools, and components health (meta database, scheduler, and triggerer). The following screenshot shows an example of this page.
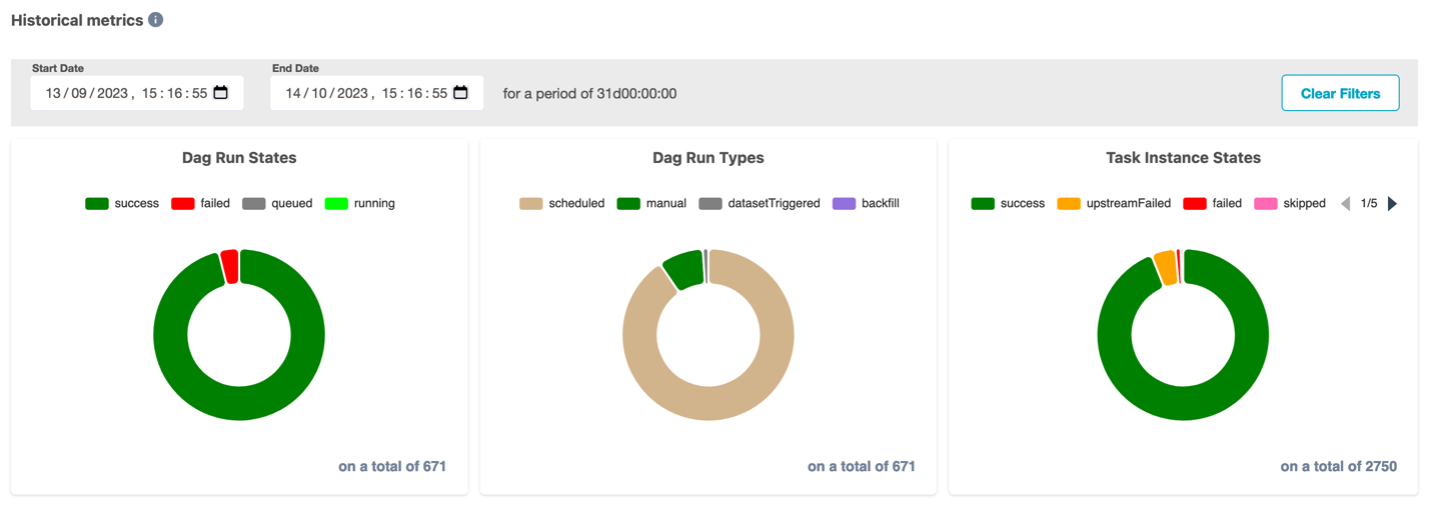
The bottom section of the Cluster Activity page includes historical metrics of DAG runs and task instances states.
Set up a new Apache Airflow v2.7.2 environment in Amazon MWAA
Setting up a new Apache Airflow version 2.7.2 environment in Amazon MWAA not only provides new features, but also leverages Python 3.11 and the Amazon Linux 2023 (AL2023) base image, offering enhanced security, modern tooling, and support for the latest Python libraries and features. You can initiate the set up in your account and preferred Region using the AWS Management Console, API, or AWS Command Line Interface (AWS CLI). If you’re adopting infrastructure as code (IaC), you can automate the setup using AWS CloudFormation, the AWS Cloud Development Kit (AWS CDK), or Terraform scripts.
Upon successful creation of an Apache Airflow version 2.7.2 environment in Amazon MWAA, certain packages are automatically installed on the scheduler and worker nodes. For a complete list of installed packages and their versions, refer to this MWAA documentation. You can install additional packages using a requirements file. Beginning with Apache Airflow version 2.7.2, your requirements file must include a --constraints statement. If you do not provide a constraint, Amazon MWAA will specify one for you to ensure the packages listed in your requirements are compatible with the version of Apache Airflow you are using.
Upgrade from older versions of Apache Airflow to Apache Airflow v2.7.2
Take advantage of these latest capabilities by upgrading your older Apache Airflow v2.x-based environments to version 2.7.2 using in-place version upgrades. To learn more about in-place version upgrades, refer to Upgrading the Apache Airflow version or Introducing in-place version upgrades with Amazon MWAA.
Conclusion
In this post, we discussed deferrable operators along with some significant changes introduced in Apache Airflow version 2.7.2, such as the Cluster Activity page in the UI, the cache for variables and connections, and how you can get started using them in Amazon MWAA.
For additional details and code examples on Amazon MWAA, visit the Amazon MWAA User Guide and the Amazon MWAA examples GitHub repo.
Apache, Apache Airflow, and Airflow are either registered trademarks or trademarks of the Apache Software Foundation in the United States and/or other countries.
About the Authors
 Manasi Bhutada is an ISV Solutions Architect based in the Netherlands. She helps customers design and implement well architected solutions in AWS that address their business problems. She is passionate about data analytics and networking. Beyond work she enjoys experimenting with food, playing pickleball, and diving into fun board games.
 Hernan Garcia is a Senior Solutions Architect at AWS based in the Netherlands. He works in the Financial Services Industry supporting enterprises in their cloud adoption. He is passionate about serverless technologies, security, and compliance. He enjoys spending time with family and friends, and trying out new dishes from different cuisines.


 ) in the toolbar at the top of the console.


 Ashley Zhou is a Software Development Engineer at AWS. She is interested in data analytics and distributed systems.
 Srividya Parthasarathy is a Senior Big Data Architect on the AWS Lake Formation team. She enjoys building analytics and data mesh solutions on AWS and sharing them with the community.