Post Syndicated from Eric Swamy original https://aws.amazon.com/blogs/security/migrating-your-secrets-to-aws-secrets-manager-part-i-discovery-and-design/
“An ounce of prevention is worth a pound of cure.” – Benjamin Franklin
A secret can be defined as sensitive information that is not intended to be known or disclosed to unauthorized individuals, entities, or processes. Secrets like API keys, passwords, and SSH keys provide access to confidential systems and resources, but it can be a challenge for organizations to maintain secure and consistent management of these secrets. Commonly observed anti-patterns in organizational secrets management systems include sharing plaintext secrets in emails or messaging apps, allowing application developers to view secrets in plaintext, hard-coding secrets into applications and storing them in version control systems, failing to rotate secrets regularly, and not logging and monitoring access to secrets.
We have created a two-part Amazon Web Services (AWS) blog post that provides prescriptive guidance on how you can use AWS Secrets Manager to help you achieve a cloud-based and modern secrets management system. In this first blog post, we discuss approaches to discover and classify secrets. In Part 2 of this series, we elaborate on the implementation phase and discuss migration techniques that will help you migrate your secrets to AWS Secrets Manager.
Managing secrets: Best practices and personas
A secret’s lifecycle comprises four phases: create, store, use, and destroy. An effective secrets management solution protects the secret in each of these phases from unauthorized access. Besides being secure, robust, scalable, and highly available, the secrets management system should integrate closely with other tools, solutions, and services that are being used within the organization. Legacy secret stores may lack integration with privileged access management (PAM), logging and monitoring, DevOps, configuration management, and encryption and auditing, which leads to teams not having uniform practices for consuming secrets and creates discrepancies from organizational policies.
Secrets Manager is a secrets management service that helps you protect access to your applications, services, and IT resources. This is a non-exhaustive list of features that AWS Secrets Manager offers:
- Access control through AWS Identity and Access Management (IAM) — Secrets Manager offers built-in integration with the AWS Identity and Access Management (IAM) service. You can attach access control policies to IAM principals or to secrets themselves (by using resource-based policies).
- Logging and monitoring — Secrets Manager integrates with AWS logging and monitoring services such as AWS CloudTrail and Amazon CloudWatch. This means that you can use your existing AWS logging and monitoring stack to log access to secrets and audit their usage.
- Integration with other AWS services — Secrets Manager can store and manage the lifecycle of secrets created by other AWS services like Amazon Relational Database Service (Amazon RDS), Amazon Redshift, and Amazon QuickSight. AWS is constantly working on integrating more services with Secrets Manager.
- Secrets encryption at rest — Secrets Manager integrates with AWS Key Management Service (AWS KMS). Secrets are encrypted at rest by using an AWS-managed key or customer-managed key.
- Framework to support the rotation of secrets securely — Rotation helps limit the scope of a compromise and should be an integral part of a modern approach to secrets management. You can use Secrets Manager to schedule automatic database credentials rotation for Amazon RDS, Amazon Redshift, and Amazon DocumentDB. You can use customized AWS Lambda functions to extend the Secrets Manager rotation feature to other secret types, such as API keys and OAuth tokens for on-premises and cloud resources.
Security, cloud, and application teams within an organization need to work together cohesively to build an effective secrets management solution. Each of these teams has unique perspectives and responsibilities when it comes to building an effective secrets management solution, as shown in the following table.
| Persona | Responsibilities | What they want | What they don’t want |
| Security teams/security architect | Define control objectives and requirements from the secrets management system | Least privileged short-lived access, logging and monitoring, and rotation of secrets | Secrets sprawl |
| Cloud team/environment team | Implement controls, create guardrails, detect events of interest | Scalable, robust, and highly available secrets management infrastructure | Application teams reaching out to them to provision or manage app secrets |
| Developer/migration engineer | Migrate applications and their secrets to the cloud | Independent control and management of their app secrets | Dependency on external teams |
To sum up the requirements from all the personas mentioned here: The approach to provision and consume secrets should be secure, governed, easily scalable, and self-service.
We’ll now discuss how to discover and classify secrets and design the migration in a way that helps you to meet these varied requirements.
Discovery — Assess and categorize existing secrets
The initial discovery phase involves running sessions aimed at discovering, assessing, and categorizing secrets. Migrating applications and associated infrastructure to the cloud requires a strategic and methodical approach to progressively discover and analyze IT assets. This analysis can be used to create high-confidence migration wave plans. You should treat secrets as IT assets and include them in the migration assessment planning.
For application-related secrets, arguably the most appropriate time to migrate a secret is when the application that uses the secret is being migrated itself. This lets you track and report the use of secrets as soon as the application begins to operate in the cloud. If secrets are left on-premises during an application migration, this often creates a risk to the availability of the application. The migrated application ends up having a dependency on the connectivity and availability of the on-premises secrets management system.
The activities performed in this phase are often handled by multiple teams. Depending on the purpose of the secret, this can be a mix of application developers, migration teams, and environment teams.
Following are some common secret types you might come across while migrating applications.
| Type | Description |
| Application secrets | Secrets specific to an application |
| Client credentials | Cloud to on-premises credentials or OAuth tokens (such as Okta, Google APIs, and so on) |
| Database credentials | Credentials for cloud-hosted databases, for example, Amazon Redshift, Amazon RDS or Amazon Aurora, Amazon DocumentDB |
| Third-party credentials | Vendor application credentials or API keys |
| Certificate private keys | Custom applications or infrastructure that might require programmatic access to the private key |
| Cryptographic keys | Cryptographic keys used for data encryption or digital signatures |
| SSH keys | Centralized management of SSH keys can potentially make it easier to rotate, update, and track keys |
| AWS access keys | On-premises to cloud credentials (IAM) |
Creating an inventory for secrets becomes simpler when organizations have an IT asset management (ITAM) or Identity and Access Management (IAM) tool to manage their IT assets (such as secrets) effectively. For organizations that don’t have an on-premises secrets management system, creating an inventory of secrets is a combination of manual and automated efforts. Application subject matter experts (SMEs) should be engaged to find the location of secrets that the application uses. In addition, you can use commercial tools to scan endpoints and source code and detect secrets that might be hardcoded in the application. Amazon CodeGuru is a service that can detect secrets in code. It also provides an option to migrate these secrets to Secrets Manager.
AWS has previously described seven common migration strategies for moving applications to the cloud. These strategies are refactor, replatform, repurchase, rehost, relocate, retain, and retire. For the purposes of migrating secrets, we recommend condensing these seven strategies into three: retire, retain, and relocate. You should evaluate every secret that is being considered for migration against a decision tree to determine which of these three strategies to use. The decision tree evaluates each secret against key business drivers like cost reduction, risk appetite, and the need to innovate. This allows teams to assess if a secret can be replaced by native AWS services, needs to be retained on-premises, migrated to Secrets Manager, or retired. Figure 1 shows this decision process.

Figure 1: Decision tree for assessing a secret for migration
Capture the associated details for secrets that are marked as RELOCATE. This information is essential and must remain confidential. Some secret metadata is transitive and can be derived from related assets, including details such as itsm-tier, sensitivity-rating, cost-center, deployment pipeline, and repository name. With Secrets Manager, you will use resource tags to bind this metadata with the secret.
You should gather at least the following information for the secrets that you plan to relocate and migrate to AWS Secrets Manager.
| Metadata about secrets | Rationale for gathering data |
| Secrets team name or owner | Gathering the name or email address of the individual or team responsible for managing secrets can aid in verifying that they are maintained and updated correctly. |
| Secrets application name or ID | To keep track of which applications use which secrets, it is helpful to collect application details that are associated with these secrets. |
| Secrets environment name or ID | Gathering information about the environment to which secrets belong, such as “prod,” “dev,” or “test,” can assist in the efficient management and organization of your secrets. |
| Secrets data classification | Understanding your organization’s data classification policy can help you identify secrets that contain sensitive or confidential information. It is recommended to handle these secrets with extra care. This information, which may be labeled “confidential,” “proprietary,” or “personally identifiable information (PII),” can indicate the level of sensitivity associated with a particular secret according to your organization’s data classification policy or standard. |
| Secrets function or usage | If you want to quickly find the secrets you need for a specific task or project, consider documenting their usage. For example, you can document secrets related to “backup,” “database,” “authentication,” or “third-party integration.” This approach can allow you to identify and retrieve the necessary secrets within your infrastructure without spending a lot of time searching for them. |
This is also a good time to decide on the rotation strategy for each secret. When you rotate a secret, you update the credentials in both Secrets Manager and the service to which that secret provides access (in other words, the resource). Secrets Manager supports automatic rotation of secrets based on a schedule.
Design the migration solution
In this phase, security and environment teams work together to onboard the Secrets Manager service to their organization’s cloud environment. This involves defining access controls, guardrails, and logging capabilities so that the service can be consumed in a regulated and governed manner.
As a starting point, use the following design principles mentioned in the Security Pillar of the AWS Well Architected Framework to design a migration solution:
- Implement a strong identity foundation
- Enable traceability
- Apply security at all layers
- Automate security best practices
- Protect data at rest and in transit
- Keep people away from data
- Prepare for security events
The design considerations covered in the rest of this section will help you prepare your AWS environment to host production-grade secrets. This phase can be run in parallel with the discovery phase.
Design your access control system to establish a strong identity foundation
In this phase, you define and implement the strategy to restrict access to secrets stored in Secrets Manager. You can use the AWS Identity and Access Management (IAM) service to specify that identities (human and non-human IAM principals) are only able to access and manage secrets that they own. Organizations that organize their workloads and environments by using separate AWS accounts should consider using a combination of role-based access control (RBAC) and attribute-based access control (ABAC) to restrict access to secrets depending on the granularity of access that’s required.
You can use a scalable automation to deploy and update key IAM roles and policies, including the following:
- Pipeline deployment policies and roles — This refers to IAM roles for CICD pipelines. These pipelines should be the primary mechanism for creating, updating, and deleting secrets in the organization.
- IAM Identity Center permission sets — These allow human identities access to the Secrets Manager API. We recommend that you provision secrets by using infrastructure as code (IaC). However, there are instances where users need to interact directly with the service. This can be for initial testing, troubleshooting purposes, or updating a secret value when automatic rotation fails or is not enabled.
- IAM permissions boundary — Boundary policies allow application teams to create IAM roles in a self-serviced, governed, and regulated manner.
Most organizations have Infrastructure, DevOps, or Security teams that deploy baseline configurations into AWS accounts. These solutions help these teams govern the AWS account and often have their own secrets. IAM policies should be created such that the IAM principals created by the application teams are unable to access secrets that are owned by the environment team, and vice versa. To enforce this logical boundary, you can use tagging and naming conventions on your secrets by using IAM.
A sample scheme for tagging your secrets can look like the following.
| Tag key | Tag value | Notes | Policy elements | Secret tags |
| appname |
|
A user-friendly name for the application | PrincipalTag/ appname =<value> (applies to role) RequestTag/ appname =<value> (applies to caller) SecretManager:ResourceTag/ appname=<value> (applies to the secret) |
appname:<value> |
| appid |
|
Uniquely identifies the application among other cloud-hosted apps | PrincipalTag/appid=<value> RequestTag/appid=<value> SecretManager:ResourceTag/appid=<value> |
appid:<value> |
| appfunc |
|
Used to describe the function of a particular target that the secret material is associated with (for example, web server, message broker, database) | PrincipalTag/appfunc=<value> RequestTag/appfunc=<value> SecretManager:ResourceTag/appfunc=<value> |
Appfunc:<value> |
| appenv |
|
An identifier for the secret usage environment | PrincipalTag/appenv=<value> RequestTag/appenv=<value> SecretManager:ResourceTag/appenv=<value> |
appenv:<value> |
| dataclassification |
|
Use your organization’s data classification standards to classify the secrets | PrincipalTag/dataclassification=<value> RequestTag/dataclassification=<value> SecretManager:ResourceTag/dataclassification=<value> |
Dataclassification:<value> |
If you maintain a registry that documents details of your cloud-hosted applications, most of these tags can be derived from the registry.
It’s common to apply different security and operational policies for the non-production and production environments of a given workload. Although production environments are generally deployed in a dedicated account, it’s common to have less critical non-production apps and environments coexisting in the same AWS account. For operation and governance at scale in these multi-tenanted accounts, you can use attribute-based access control (ABAC) to manage secure access to secrets. ABAC enables you to grant permissions based on tags. The main benefits of using tag-based access control are its scalability and operational efficiency.
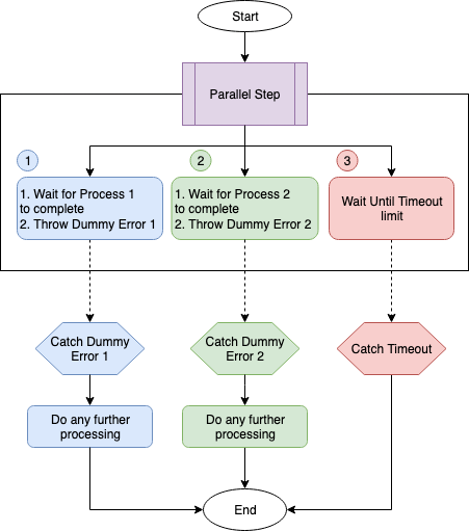
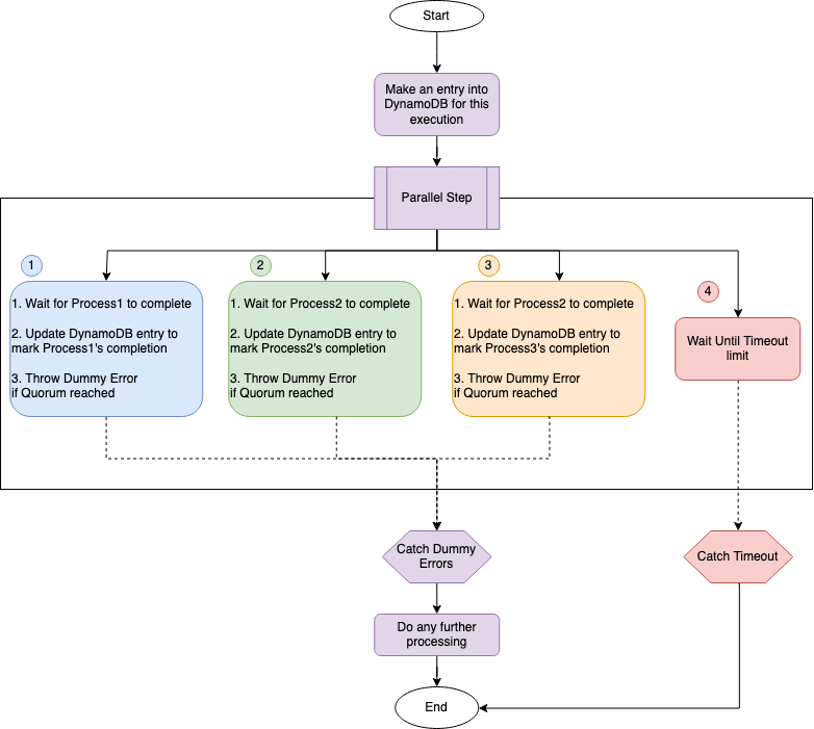
Figure 2 shows an example of ABAC in action, where an IAM policy allows access to a secret only if the appfunc, appenv, and appid tags on the secret match the tags on the IAM principal that is trying to access the secrets.

Figure 2: ABAC access control
ABAC works as follows:
- Tags on a resource define who can access the resource. It is therefore important that resources are tagged upon creation.
- For a create secret operation, IAM verifies whether the Principal tags on the IAM identity that is making the API call match the request tags in the request.
- For an update, delete, or read operation, IAM verifies that the Principal tags on the IAM identity that is making the API call match the resource tags on the secret.
- Regardless of the number of workloads or environments that coexist in the same account, you only need to create one ABAC-based IAM policy. This policy is the same for different kinds of accounts and can be deployed by using a capability like AWS CloudFormation StackSets. This is the reason that ABAC scales well for scenarios where multiple applications and environments are deployed in the same AWS account.
- IAM roles can use a common IAM policy, such as the one described in the previous bullet point. You need to verify that the roles have the correct tags set on them, according to your tagging convention. This will automatically grant the roles access to the secrets that have the same resource tags.
- Note that with this approach, tagging secrets and IAM roles becomes the most critical component for controlling access. For this reason, all tags on IAM roles and secrets on Secrets Manager must follow a standard naming convention at all times.
The following is an ABAC-based IAM policy that allows creation, updates, and deletion of secrets based on the tagging scheme described in the preceding table.
{
    "Version": "2012-10-17",
    "Statement": [
        {
            "Condition": {
                "StringEquals": {
                    "secretsmanager:ResourceTag/appfunc": "${aws:PrincipalTag/appfunc}",
                    "secretsmanager:ResourceTag/appenv": "${aws:PrincipalTag/appenv}",
                    "secretsmanager:ResourceTag/name": "${aws:PrincipalTag/name}",
                    "secretsmanager:ResourceTag/appid": "${aws:PrincipalTag/appid}"
                }
            },
            "Action": [
                "secretsmanager:GetSecretValue",
                "secretsmanager:PutSecretValue",
                "secretsmanager:UpdateSecret",
                "secretsmanager:DeleteSecret"
            ],
            "Resource": "arn:aws:secretsmanager:ap-southeast-2:*:secret:${aws:PrincipalTag/name}/${aws:PrincipalTag/appid}/${aws:PrincipalTag/appfunc}/${aws:PrincipalTag/appenv}*",
            "Effect": "Allow",
            "Sid": "AccessBasedOnResourceTags"
        },
        {
            "Condition": {
                "StringEquals": {
                    "aws:RequestTag/appfunc": "${aws:PrincipalTag/appfunc}",
                    "aws:RequestTag/appid": "${aws:PrincipalTag/appid}",
                    "aws:RequestTag/name": "${aws:PrincipalTag/name}",
                    "aws:RequestTag/appenv": "${aws:PrincipalTag/appenv}"
                }
            },
            "Action": [
                "secretsmanager:TagResource",
                "secretsmanager:CreateSecret"
            ],
            "Resource": "arn:aws:secretsmanager:ap-southeast-2:*:secret:${aws:PrincipalTag/name}/${aws:PrincipalTag/appid}/${aws:PrincipalTag/appfunc}/${aws:PrincipalTag/appenv}*",
            "Effect": "Allow",
            "Sid": "AccessBasedOnRequestTags"
        }
    ]
}
In addition to controlling access, this policy also enforces a naming convention. IAM principals will only be able to create a secret that matches the following naming scheme.
You can choose to implement ABAC so that the resource name matches the principal tags or the resource tags match the principal tags, or both. These are just different types of ABAC. The sample policy provided here implements both types. It’s important to note that because ABAC-based IAM policies are shared across multiple workloads, potential misconfigurations in the policies will have a wider scope of impact.
For more information about building your ABAC strategy, refer to the blog post Working backward: From IAM policies and principal tags to standardized names and tags for your AWS resources.
You can also add checks in your pipeline to provide early feedback for developers. These checks may potentially assist in verifying whether appropriate tags have been set up in IaC resources prior to their creation. Your pipeline-based controls provide an additional layer of defense and complement or extend restrictions enforced by IAM policies.
Resource-based policies
Resource-based policies are a flexible and powerful mechanism to control access to secrets. They are directly associated with a secret and allow specific principals mentioned in the policy to have access to the secret. You can use these policies to grant identities (internal or external to the account) access to a secret.
If your organization uses resource policies, security teams should come up with control objectives for these policies. Controls should be set so that only resource-based policies meeting your organizations requirements are created. Control objectives for resource policies may be set as follows:
- Allow statements in the policy to have allow access to the secret from the same application.
- Allow statements in the policy to have allow access from organization-owned cross-account identities only if they belong to the same environment. Controls that meet these objectives can be preventative (checks in pipeline) or responsive (config rules and Amazon EventBridge invoked Lambda functions).
Environment teams can also choose to provision resource-based policies for application teams. The provision process can be manual, but is preferably automated. An example would be that these teams can allow application teams to tag secrets with specific values, like a cross-account IAM role Amazon Resource Number (ARN) that needs access. An automation invoked by EventBridge rules then asserts that the cross-account principal in the tag belongs to the organization and is in the same environment, and then provisions a resource-based policy for the application team. Using such mechanisms creates a self-service way for teams to create safe resource policies that meet common use cases.
Resource-based policies for Secrets Manager can be a helpful tool for controlling access to secrets, but it is important to consider specific situations where alternative access control mechanisms might be more appropriate. For example, if your access control requirements for secrets involve complex conditions or dependencies that cannot be easily expressed using the resource-based policy syntax, it may be challenging to manage and maintain the policies effectively. In such cases, you may want to consider using a different access control mechanism that better aligns with your requirements. For help determining which type of policy to use, see Identity-based policies and resource-based policies.
Design detective controls to achieve traceability, monitoring, and alerting
Prepare your environment to record and flag events of interest when Secrets Manager is used to store and update secrets. We recommend that you start by identifying risks and then formulate objectives and devise control measures for each identified risk, as follows:
- Control objectives — What does the control evaluate, and how is it configured? Controls can be configured by using CloudTrail events invoked by Lambda functions, AWS config rules, or CloudWatch alarms. Controls can evaluate a misconfigured property in a secrets resource or report on an event of interest.
- Target audience — Identify teams that should be notified if the event occurs. This can be a combination of the environment, security, and application teams.
- Notification type — SNS, email, Slack channel notifications, or an ITIL ticket.
- Criticality — Low, medium, or high, based on the criticality of the event.
The following is a sample matrix that can serve as a starting point for documenting detective controls for Secrets Manager. The column titled AWS services in the table offers some suggestions for implementation to help you meet your control objetves.
| Risk | Control objective | Criticality | AWS services |
| A secret is created without tags that match naming and tagging schemes |
|
HIGH (if using ABAC) | CloudTrail invoked Lambda function or custom AWS config rule |
| IAM related tags on a secret are updated, removed |
|
HIGH (if using ABAC) | CloudTrail invoked Lambda function or custom config rule |
| A resource policy is created when resource policies have not been onboarded to the environment |
|
HIGH | Pipeline or CloudTrail invoked ¬Lambda function or custom config rule |
| A secret is marked for deletion from an unusual source — root user or admin break glass role |
|
HIGH | CloudTrail invoked Lambda function |
| A non-compliant resource policy was created — for example, to provide secret access to a foreign account |
|
HIGH | CloudTrail invoked Lambda function or custom config rule |
| An AWS KMS key for secrets encryption is marked for deletion |
|
HIGH | CloudTrail invoked Lambda function |
| A secret rotation failed |
|
MEDIUM | Managed config rule |
| A secret is inactive and is not being accessed for x number of days |
|
LOW | Managed config rule |
| Secrets are created that do not use KMS key |
|
LOW | Managed config rule |
| Automatic rotation is not enabled |
|
LOW | Managed config rule |
| Successful create, update, and read events for secrets |
|
LOW | CloudTrail logs |
We suggest that you deploy these controls in your AWS accounts by using a scalable mechanism, such as CloudFormation StackSets.
For more details, see the following topics:
- Audit Secrets Manager secrets for compliance by using AWS Config
- Log AWS Secrets Manager events with AWS CloudTrail
- Monitor Secrets Manager with Amazon CloudWatch
Design for additional protection at the network layer
You can use the guiding principles for Zero Trust networking to add additional mechanisms to control access to secrets. The best security doesn’t come from making a binary choice between identity-centric and network-centric controls, but by using both effectively in combination with each other.
VPC endpoints allow you to provide a private connection between your VPC and Secrets Manager API endpoints. They also provide the ability to attach a policy that allows you to enforce identity-centric rules at a logical network boundary. You can use global context keys like aws:PrincipalOrgID in VPC endpoint policies to allow requests to Secrets Manager service only from identities that belong to the same AWS organization. You can also use aws:sourceVpce and aws:sourceVpc IAM conditions to allow access to the secret only if the request originates from a specific VPC endpoint or VPC, respectively.
For more details on VPC endpoints, see Using an AWS Secrets Manager VPC endpoint.
Design for least privileged access to encryption keys
To reduce unauthorized access, secrets should be encrypted at rest. Secrets Manager integrates with AWS KMS and uses envelope encryption. Every secret in Secrets Manager is encrypted with a unique data key. Each data key is protected by a KMS key. Whenever the secret value inside a secret changes, Secrets Manager generates a new data key to protect it. The data key is encrypted under a KMS key and stored in the metadata of the secret. To decrypt the secret, Secrets Manager first decrypts the encrypted data key by using the KMS key in AWS KMS.
The following is a sample AWS KMS policy that permits cryptographic operations to a KMS key only from the Secrets Manager service within an AWS account, and allows the AWS KMS decrypt action from a specific IAM principal throughout the organization.
{
    "Version": "2012-10-17",
    "Id": "secrets_manager_encrypt_org",
    "Statement": [
        {
            "Sid": "Root Access",
            "Effect": "Allow",
            "Principal": {
                "AWS": "arn:aws:iam::444455556666:root"
            },
            "Action": "kms:*",
            "Resource": "*"
        },
        {
            "Sid": "Allow access for Key Administrators",
            "Effect": "Allow",
            "Principal": {
                "AWS": [
             "arn:aws:iam::444455556666:role/platformRoles/KMS-key-admin-role",                    "arn:aws:iam::444455556666:role/platformRoles/KMS-key-automation-role"
                ]
            },
            "Action": [
                "kms:CancelKeyDeletion",
                "kms:Create*",
                "kms:Delete*",
                "kms:Describe*",
                "kms:Disable*",
                "kms:Enable*",
                "kms:Get*",
                "kms:List*",
                "kms:Put*",
                "kms:Revoke*",
                "kms:ScheduleKeyDeletion",
                "kms:TagResource",
                "kms:UntagResource",
                "kms:Update*"
            ],
            "Resource": "*"
        },
        {
            "Sid": "Allow Secrets Manager use of the KMS key for a specific account",
            "Effect": "Allow",
            "Principal": {
                "AWS": "*"
            },
            "Action": [
                "kms:Encrypt",
                "kms:Decrypt",
                "kms:ReEncrypt*",
                "kms:GenerateDataKey*",
                "kms:CreateGrant",
                "kms:ListGrants",
                "kms:DescribeKey"
            ],
            "Resource": "*",
            "Condition": {
                "StringEquals": {
                    "kms:CallerAccount": "444455556666",
                    "kms:ViaService": "secretsmanager.us-east-1.amazonaws.com"
                }
            }
        },
        {
            "Sid": "Allow use of Secrets Manager secrets from a specific IAM role (service account) throughout your org",
            "Effect": "Allow",
            "Principal": {
                "AWS": "*"
            },
            "Action": "kms:Decrypt",
            "Resource": "*",
            "Condition": {
                "StringEquals": {
                    "aws:PrincipalOrgID": "o-exampleorgid"
                },
                "StringLike": {
                    "aws:PrincipalArn": "arn:aws:iam::*:role/platformRoles/secretsAccessRole"
                }
            }
        }
    ]
}
Additionally, you can use the secretsmanager:KmsKeyId IAM condition key to allow secrets creation only when AWS KMS encryption is enabled for the secret. You can also add checks in your pipeline that allow the creation of a secret only when a KMS key is associated with the secret.
Design or update applications for efficient retrieval of secrets
In applications, you can retrieve your secrets by calling the GetSecretValue function in the available AWS SDKs. However, we recommend that you cache your secret values by using client-side caching. Caching secrets can improve speed, help to prevent throttling by limiting calls to the service, and potentially reduce your costs.
Secrets Manager integrates with the following AWS services to provide efficient retrieval of secrets:
- For Amazon RDS, you can integrate with Secrets Manager to simplify managing master user passwords for Amazon RDS database instances. Amazon RDS can manage the master user password and stores it securely in Secrets Manager, which may eliminate the need for custom AWS Lambda functions to manage password rotations. The integration can help you secure your database by encrypting the secrets, using your own managed key or an AWS KMS key provided by Secrets Manager. As a result, the master user password is not visible in plaintext during the database creation workflow. This feature is available for the Amazon RDS and Aurora engines, and more information can be found in the Amazon RDS and Aurora User Guides.
- For Amazon Elastic Kubernetes Service (Amazon EKS), you can use the AWS Secrets and Configuration Provider (ASCP) for the Kubernetes Secrets Store CSI Driver. This open-source project enables you to mount Secrets Manager secrets as Kubernetes secrets. The driver translates Kubernetes secret objects into Secrets Manager API calls, allowing you to access and manage secrets from within Kubernetes. After you configure the Kubernetes Secrets Store CSI Driver, you can create Kubernetes secrets backed by Secrets Manager secrets. These secrets are securely stored in Secrets Manager and can be accessed by your applications that are running in Amazon EKS.
- For Amazon Elastic Container Service (Amazon ECS), sensitive data can be securely stored in Secrets Manager secrets and then accessed by your containers through environment variables or as part of the log configuration. This allows for a simple and potentially safe injection of sensitive data into your containers, making it a possible solution for your needs.
- For AWS Lambda, you can use the AWS Parameters and Secrets Lambda Extension to retrieve and cache Secrets Manager secrets in Lambda functions without the need for an AWS SDK. It is noteworthy that retrieving a cached secret is faster compared to the standard method of retrieving secrets from Secrets Manager. Moreover, using a cache can be cost-efficient, because there is a charge for calling Secrets Manager APIs. For more details, see the Secrets Manager User Guide.
For additional information on how to use Secrets Manager secrets with AWS services, refer to the following resources:
Develop an incident response plan for security events
It is recommended that you prepare for unforeseeable incidents such as unauthorized access to your secrets. Developing an incident response plan can help minimize the impact of the security event, facilitate a prompt and effective response, and may help to protect your organization’s assets and reputation. The traceability and monitoring controls we discussed in the previous section can be used both during and after the incident.
The Computer Security Incident Handling Guide SP 800-61 Rev. 2, which was created by the National Institute of Standards and Technology (NIST), can help you create an incident response plan for specific incident types. It provides a thorough and organized approach to incident response, covering everything from initial preparation and planning to detection and analysis, containment, eradication, recovery, and follow-up. The framework emphasizes the importance of continual improvement and learning from past incidents to enhance the overall security posture of the organization.
Refer to the following documentation for further details and sample playbooks:
Conclusion
In this post, we discussed how organizations can take a phased approach to migrate their secrets to AWS Secrets Manager. Your teams can use the thought exercises mentioned in this post to decide if they would like to rehost, replatform, or retire secrets. We discussed what guardrails should be enabled for application teams to consume secrets in a safe and regulated manner. We also touched upon ways organizations can discover and classify their secrets.
In Part 2 of this series, we go into the details of the migration implementation phase and walk you through a sample solution that you can use to integrate on-premises applications with Secrets Manager.
If you have feedback about this post, submit comments in the Comments section below. If you have questions about this post, start a new thread on the AWS Secrets Manager re:Post or contact AWS Support.
Want more AWS Security news? Follow us on Twitter.


