Cloudflare Incident on January 24th, 2023

Post Syndicated from Kenny Johnson original https://blog.cloudflare.com/cloudflare-incident-on-january-24th-2023/

Cloudflare Incident on January 24th, 2023

Cloudflare Incident on January 24th, 2023

Several Cloudflare services became unavailable for 121 minutes on January 24th, 2023 due to an error releasing code that manages service tokens. The incident degraded a wide range of Cloudflare products including aspects of our Workers platform, our Zero Trust solution, and control plane functions in our content delivery network (CDN).

Cloudflare provides a service token functionality to allow automated services to authenticate to other services. Customers can use service tokens to secure the interaction between an application running in a data center and a resource in a public cloud provider, for example. As part of the release, we intended to introduce a feature that showed administrators the time that a token was last used, giving users the ability to safely clean up unused tokens. The change inadvertently overwrote other metadata about the service tokens and rendered the tokens of impacted accounts invalid for the duration of the incident.

The reason a single release caused so much damage is because Cloudflare runs on Cloudflare. Service tokens impact the ability for accounts to authenticate, and two of the impacted accounts power multiple Cloudflare services. When these accounts’ service tokens were overwritten, the services that run on these accounts began to experience failed requests and other unexpected errors.

We know this impacted several customers and we know the impact was painful. We’re documenting what went wrong so that you can understand why this happened and the steps we are taking to prevent this from occurring again.

What is a service token?

When users log into an application or identity provider, they typically input a username and a password. The password allows that user to demonstrate that they are in control of the username and that the service should allow them to proceed. Layers of additional authentication can be added, like hard keys or device posture, but the workflow consists of a human proving they are who they say they are to a service.

However, humans are not the only users that need to authenticate to a service. Applications frequently need to talk to other applications. For example, imagine you build an application that shows a user information about their upcoming travel plans.

The airline holds details about the flight and its duration in their own system. They do not want to make the details of every individual trip public on the Internet and they do not want to invite your application into their private network. Likewise, the hotel wants to make sure that they only send details of a room booking to a valid, approved third party service.

Your application needs a trusted way to authenticate with those external systems. Service tokens solve this problem by functioning as a kind of username and password for your service. Like usernames and passwords, service tokens come in two parts: a Client ID and a Client Secret. Both the ID and Secret must be sent with a request for authentication. Tokens are also assigned a duration, after which they become invalid and must be rotated. You can grant your application a service token and, if the upstream systems you need validate it, your service can grab airline and hotel information and present it to the end user in a joint report.

When administrators create Cloudflare service tokens, we generate the Client ID and the Client Secret pair. Customers can then configure their requesting services to send both values as HTTP headers when they need to reach a protected resource. The requesting service can run in any environment, including inside of Cloudflare’s network in the form of a Worker or in a separate location like a public cloud provider. Customers need to deploy the corresponding protected resource behind Cloudflare’s reverse proxy. Our network checks every request bound for a configured service for the HTTP headers. If present, Cloudflare validates their authenticity and either blocks the request or allows it to proceed. We also log the authentication event.

Incident Timeline

All Timestamps are UTC

At 2023-01-24 16:55 UTC the Access engineering team initiated the release that inadvertently began to overwrite service token metadata, causing the incident.

At 2023-01-24 17:05 UTC a member of the Access engineering team noticed an unrelated issue and rolled back the release which stopped any further overwrites of service token metadata.

Service token values are not updated across Cloudflare’s network until the service token itself is updated (more details below). This caused a staggered impact of the service token’s that had their metadata overwritten.

2023-01-24 17:50 UTC: The first invalid service token for Cloudflare WARP was synced to the edge. Impact began for WARP and Zero Trust users.

Cloudflare Incident on January 24th, 2023
WARP device posture uploads dropped to zero which raised an internal alert

At 2023-01-24 18:12 an incident was declared due to the large drop in successful WARP device posture uploads.

2023-01-24 18:19 UTC: The first invalid service token for the Cloudflare API was synced to the edge. Impact began for Cache Purge, Cache Reserve, Images and R2. Alerts were triggered for these products which identified a larger scope of the incident.

Cloudflare Incident on January 24th, 2023

At 2023-01-24 18:21 the overwritten services tokens were discovered during the initial investigation.

At 2023-01-24 18:28 the incident was elevated to include all impacted products.

At 2023-01-24 18:51 An initial solution was identified and implemented to revert the service token to its original value for the Cloudflare WARP account, impacting WARP and Zero Trust. Impact ended for WARP and Zero Trust.

At 2023-01-24 18:56 The same solution was implemented on the Cloudflare API account, impacting Cache Purge, Cache Reserve, Images and R2. Impact ended for Cache Purge, Cache Reserve, Images and R2.

At 2023-01-24 19:00 An update was made to the Cloudflare API account which incorrectly overwrote the Cloudflare API account. Impact restarted for Cache Purge, Cache Reserve, Images and R2. All internal Cloudflare account changes were then locked until incident resolution.

At 2023-01-24 19:07 the Cloudflare API was updated to include the correct service token value. Impact ended for Cache Purge, Cache Reserve, Images and R2.

At 2023-01-24 19:51 all affected accounts had their service tokens restored from a database backup. Incident Ends.

What was released and how did it break?

The Access team was rolling out a new change to service tokens that added a “Last seen at” field. This was a popular feature request to help identify which service tokens were actively in use.

What went wrong?

The “last seen at” value was derived by scanning all new login events in an account’s login event Kafka queue. If a login event using a service token was detected, an update to the corresponding service token’s last seen value was initiated.

In order to update the service token’s “last seen at” value a read write transaction is made to collect the information about the corresponding service token. Service token read requests redact the “client secret” value by default for security reasons. The “last seen at” update to the service token then used that information from the read did not include the “client secret” and updated the service token with an empty “client secret” on the write.

An example of the correct and incorrect service token values shown below:

Example Access Service Token values

{
  "1a4ddc9e-a1234-4acc-a623-7e775e579c87": {
    "client_id": "6b12308372690a99277e970a3039343c.access",
    "client_secret": "<hashed-value>", <-- what you would expect
    "expires_at": 1698331351
  },
  "23ade6c6-a123-4747-818a-cd7c20c83d15": {
    "client_id": "1ab44976dbbbdadc6d3e16453c096b00.access",
    "client_secret": "", <--- this is the problem
    "expires_at": 1670621577
  }
}

The service token “client secret” database did have a “not null” check however in this situation an empty text string did not trigger as a null value.

As a result of the bug, any Cloudflare account that used a service token to authenticate during the 10 minutes “last seen at” release was out would have its “client secret” value set to an empty string. The service token then needed to be modified in order for the empty “client secret” to be used for authentication. There were a total of 4 accounts in this state, all of which are internal to Cloudflare.

How did we fix the issue?

As a temporary solution, we were able to manually restore the correct service token values for the accounts with overwritten service tokens. This stopped the immediate impact across the affected Cloudflare services.

The database team was then able to implement a solution to restore the service tokens of all impacted accounts from an older database copy. This concluded any impact from this incident.

Why did this impact other Cloudflare services?

Service tokens impact the ability for accounts to authenticate. Two of the impacted accounts power multiple Cloudflare services. When these accounts’ services tokens were overwritten, the services that run on these accounts began to experience failed requests and other unexpected errors.

Cloudflare WARP Enrollment

Cloudflare provides a mobile and desktop forward proxy, Cloudflare WARP (our “1.1.1.1” app), that any user can install on a device to improve the privacy of their Internet traffic. Any individual can install this service without the need for a Cloudflare account and we do not retain logs that map activity to a user.

When a user connects using WARP, Cloudflare validates the enrollment of a device by relying on a service that receives and validates the keys on the device. In turn, that service communicates with another system that tells our network to provide the newly enrolled device with access to our network

During the incident, the enrollment service could no longer communicate with systems in our network that would validate the device. As a result, users could no longer register new devices and/or install the app on a new device, and may have experienced issues upgrading to a new version of the app (which also triggers re-registration).

Cloudflare Zero Trust Device Posture and Re-Auth Policies

Cloudflare provides a comprehensive Zero Trust solution that customers can deploy with or without an agent living on the device. Some use cases are only available when using the Cloudflare agent on the device. The agent is an enterprise version of the same Cloudflare WARP solution and experienced similar degradation anytime the agent needed to send or receive device state. This impacted three use cases in Cloudflare Zero Trust.

First, similar to the consumer product, new devices could not be enrolled and existing devices could not be revoked. Administrators were also unable to modify settings of enrolled devices.. In all cases errors would have been presented to the user.

Second, many customers who replace their existing private network with Cloudflare’s Zero Trust solution may add rules that continually validate a user’s identity through the use of session duration policies. The goal of these rules is to enforce users to reauthenticate in order to prevent stale sessions from having ongoing access to internal systems. The agent on the device prompts the user to reauthenticate based on signals from Cloudflare’s control plane. During the incident, the signals were not sent and users could not successfully reauthenticate.

Finally, customers who rely on device posture rules also experienced impact. Device posture rules allow customers who use Access or Gateway policies to rely on the WARP agent to continually enforce that a device meets corporate compliance rules.

The agent communicates these signals to a Cloudflare service responsible for maintaining the state of the device. Cloudflare’s Zero Trust access control product uses a service token to receive this signal and evaluate it along with other rules to determine if a user can access a given resource. During this incident those rules defaulted to a block action, meaning that traffic modified by these policies would appear broken to the user. In some cases this meant that all internet bound traffic from a device was completely blocked leaving users unable to access anything.

Cloudflare Gateway caches the device posture state for users every 5 minutes to apply Gateway policies. The device posture state is cached so Gateway can apply policies without having to verify device state on every request. Depending on which Gateway policy type was matched, the user would experience two different outcomes. If they matched a network policy the user would experience a dropped connection and for an HTTP policy they would see a 5XX error page. We peaked at over 50,000 5XX errors/minute over baseline and had over 10.5 million posture read errors until the incident was resolved.

Gateway 5XX errors per minute

Cloudflare Incident on January 24th, 2023

Total count of Gateway Device posture errors

Cloudflare Incident on January 24th, 2023

Cloudflare R2 Storage and Cache Reserve

Cloudflare R2 Storage allows developers to store large amounts of unstructured data without the costly egress bandwidth fees associated with typical cloud storage services.

During the incident, the R2 service was unable to make outbound API requests to other parts of the Cloudflare infrastructure. As a result, R2 users saw elevated request failure rates when making requests to R2.  

Many Cloudflare products also depend on R2 for data storage and were also affected. For example, Cache Reserve users were impacted during this window and saw increased origin load for any items not in the primary cache. The majority of read and write operations to the Cache Reserve service were impacted during this incident causing entries into and out of Cache Reserve to fail. However, when Cache Reserve sees an R2 error, it falls back to the customer origin, so user traffic was still serviced during this period.

Cloudflare Cache Purge

Cloudflare’s content delivery network (CDN) caches the content of Internet properties on our network in our data centers around the world to reduce the distance that a user’s request needs to travel for a response. In some cases, customers want to purge what we cache and replace it with different data.

The Cloudflare control plane, the place where an administrator interacts with our network, uses a service token to authenticate and reach the cache purge service. During the incident, many purge requests failed while the service token was invalid. We saw an average impact of 20 purge requests/second failing and a maximum of 70 requests/second.

What are we doing to prevent this from happening again?

We take incidents like this seriously and recognize the impact it had. We have identified several steps we can take to address the risk of a similar problem occurring in the future. We are implementing the following remediation plan as a result of this incident:

Test: The Access engineering team will add unit tests that would automatically catch any similar issues with service token overwrites before any new features are launched.

Alert: The Access team will implement an automatic alert for any dramatic increase in failed service token authentication requests to catch issues before they are fully launched.

Process: The Access team has identified process improvements to allow for faster rollbacks for specific database tables.

Implementation: All relevant database fields will be updated to include checks for empty strings on top of existing “not null checks”

We are sorry for the disruption this caused for our customers across a number of Cloudflare services. We are actively making these improvements to ensure improved stability moving forward and that this problem will not happen again.

[$] Python packaging, visions, and unification

Post Syndicated from original https://lwn.net/Articles/920832/

The Python community is currently struggling with a longtime difficulty in
its ecosystem: how to develop, package, distribute, and maintain libraries
and applications. The current situation is sub-optimal in several
dimensions due, at least in part, to the existence of multiple,
non-interoperable mechanisms and tools to handle some of those needs. Last
week, we had an overview of Python
packaging
as a prelude to starting to dig into the discussions. In
this installment, we start to look at the kinds of problems that exist—and
the barriers to solving them.

WINE 8.0 released

Post Syndicated from original https://lwn.net/Articles/921078/

Version 8.0 of the WINE
Windows compatibility layer has been released. The headline feature
appears to be the conversion to PE (“portable executable”) modules:

After 4 years of work, the PE conversion is finally complete: all
modules can be built in PE format. This is an important milestone
on the road to supporting various features such as copy protection,
32-bit applications on 64-bit hosts, Windows debuggers, x86
applications on ARM, etc.

Other changes include WoW64 support (allowing 32-bit modules to call into
64-bit libraries), Print Processor support, improved Direct3D support, and
more.

Build a multi-Region and highly resilient modern data architecture using AWS Glue and AWS Lake Formation

Post Syndicated from Vivek Shrivastava original https://aws.amazon.com/blogs/big-data/build-a-multi-region-and-highly-resilient-modern-data-architecture-using-aws-glue-and-aws-lake-formation/

AWS Lake Formation helps with enterprise data governance and is important for a data mesh architecture. It works with the AWS Glue Data Catalog to enforce data access and governance. Both services provide reliable data storage, but some customers want replicated storage, catalog, and permissions for compliance purposes.

This post explains how to create a design that automatically backs up Amazon Simple Storage Service (Amazon S3), the AWS Glue Data Catalog, and Lake Formation permissions in different Regions and provides backup and restore options for disaster recovery. These mechanisms can be customized for your organization’s processes. The utility for cloning and experimentation is available in the open-sourced GitHub repository.

This solution only replicates metadata in the Data Catalog, not the actual underlying data. To have a redundant data lake using Lake Formation and AWS Glue in an additional Region, we recommend replicating the Amazon S3-based storage using S3 replication, S3 sync, aws-s3-copy-sync-using-batch or S3 Batch replication process. This ensures that the data lake will still be functional in another Region if Lake Formation has an availability issue. The Data Catalog setup (tables, databases, resource links) and Lake Formation setup (permissions, settings) must also be replicated in the backup Region.

Solution overview

This post shows how to create a backup of the Lake Formation permissions and AWS Glue Data Catalog from one Region to another in the same account. The solution doesn’t create or modify AWS Identity and Access Management (IAM) roles, which are available in all Regions. There are three steps to creating a multi-Region data lake:

  1. Migrate Lake Formation data permissions.
  2. Migrate AWS Glue databases and tables.
  3. Migrate Amazon S3 data.

In the following sections, we look at each migration step in more detail.

Lake Formation permissions

In Lake Formation, there are two types of permissions: metadata access and data access.

Metadata access permissions allow users to create, read, update, and delete metadata databases and tables in the Data Catalog.

Data access permissions allow users to read and write data to specific locations in Amazon S3. Data access permissions are managed using data location permissions, which allow users to create and alter metadata databases and tables that point to specific Amazon S3 locations.

When data is migrated from one Region to another, only the metadata access permissions are replicated. This means that if data is moved from a bucket in the source Region to another bucket in the target Region, the data access permissions need to be reapplied in the target Region.

AWS Glue Data Catalog

The AWS Glue Data Catalog is a central repository of metadata about data stored in your data lake. It contains references to data that is used as sources and targets in AWS Glue ETL (extract, transform, and load) jobs, and stores information about the location, schema, and runtime metrics of your data. The Data Catalog organizes this information in the form of metadata tables and databases. A table in the Data Catalog is a metadata definition that represents the data in a data lake, and databases are used to organize these metadata tables.

Lake Formation permissions can only be applied to objects that already exist in the Data Catalog in the target Region. Therefore, in order to apply these permissions, the underlying Data Catalog databases and tables must already exist in the target Region. To meet this requirement, this utility migrates both the AWS Glue databases and tables from the source Region to the target Region.

Amazon S3 data

The data that underlies an AWS Glue table can be stored in an S3 bucket in any Region, so replication of the data itself isn’t necessary. However, if the data has already been replicated to the target Region, this utility has the option to update the table’s location to point to the replicated data in the target Region. If the location of the data is changed, the utility updates the S3 bucket name and keeps the rest of the prefix hierarchy unchanged.

This utility doesn’t include the migration of data from the source Region to the target Region. Data migration must be performed separately using methods such as S3 replication, S3 sync, aws-s3-copy-sync-using-batch or S3 Batch replication.

This utility has two modes for replicating Lake Formation and Data Catalog metadata: on-demand and real-time. The on-demand mode is a batch replication that takes a snapshot of the metadata at a specific point in time and uses it to synchronize the metadata. The real-time mode replicates changes made to the Lake Formation permissions or Data Catalog in near-real time.

The on-demand mode of this utility is recommended for creating existing Lake Formation permissions and Data Catalogs because it replicates a snapshot of the metadata. After the Lake Formation and Data Catalogs are synchronized, you can use real-time mode to replicate any ongoing changes. This creates a mirror image of the source Region in the target Region and keeps it up to date as changes are made in the source Region. These two modes can be used independently of each other, and the operations are idempotent.

The code for the on-demand and real-time modes is available in the GitHub repository. Let’s look at each mode in more detail.

On-demand mode

On-demand mode is used to copy the Lake Formation permissions and Data Catalog at a specific point in time. The code is deployed using the AWS Cloud Development Kit (AWS CDK). The following diagram shows the solution architecture for this mode.

The AWS CDK deploys an AWS Glue job to perform the replication. The job retrieves configuration information from a file stored in an S3 bucket. This file includes details such as the source and target Regions, an optional list of databases to replicate, and options for moving data to a different S3 bucket. More information about these options and deployment instructions is available in the GitHub repository.

The AWS Glue job retrieves the Lake Formation permissions and Data Catalog object metadata from the source Region and stores it in a JSON file in an S3 bucket. The same job then uses this file to create the Lake Formation permissions and Data Catalog databases and tables in the target Region.

This tool can be run on demand by running the AWS Glue job. It copies the Lake Formation permissions and Data Catalog object metadata from the source Region to the target Region. If you run the tool again after making changes to the target Region, the changes are replaced with the latest Lake Formation permissions and Data Catalog from the source Region.

This utility can detect any changes made to the Data Catalog metadata, databases, tables, and columns while replicating the Data Catalog from the source to the target Region. If a change is detected in the source Region, the latest version of the AWS Glue object is applied to the target Region. The utility reports the number of objects modified during its run.

The Lake Formation permissions are copied from the source to the target Region, so any new permissions are replicated in the target Region. If a permission is removed from the source Region, it is not removed from the target Region.

Real-time mode

Real-time mode replicates the Lake Formation permissions and Data Catalog at a regular interval. The default interval is 1 minute, but it can be modified during deployment. The code is deployed using the AWS CDK. The following diagram shows the solution architecture for this mode.

The AWS CDK deploys two AWS Lambda jobs and creates an Amazon DynamoDB table to store AWS CloudTrail events and an Amazon EventBridge rule to run the replication at a regular interval. The Lambda jobs retrieve the configuration information from a file stored in an S3 bucket. This file includes details such as the source and target Regions, options for moving data to a different S3 bucket, and the lookback period for CloudTrail in hours. More information about these options and deployment instructions is available in the GitHub repository.

The EventBridge rule triggers a Lambda job at a fixed interval. This job retrieves the configuration information and queries CloudTrail events related to the Data Catalog and Lake Formation that occurred in the past hour (the duration is configurable). All relevant events are then stored in a DynamoDB table.

After the event information is inserted into the DynamoDB table, another Lambda job is triggered. This job retrieves the configuration information and queries the DynamoDB table. It then applies all the changes to the target Region. If the tool is run again after making changes to the target Region, the changes are replaced with the latest Lake Formation permissions and Data Catalog from the source Region. Unlike on-demand mode, this utility also removes any Lake Formation permissions that were removed from the source Region from the target Region.

Limitations

This utility is designed to replicate permissions within a single account only. The on-demand mode replicates a snapshot and doesn’t remove existing permissions, so it doesn’t perform delete operations. The API currently doesn’t support replicating changes to row and column permissions.

Conclusion

In this post, we showed how you can use this utility to migrate the AWS Glue Data Catalog and Lake Formation permissions from one Region to another. It can also keep the source and target Regions synchronized if any changes are made to the Data Catalog or the Lake Formation permissions. Implementing it across Regions (multi-Region) is a good option if you are looking for the most separation and complete independence of your globally diverse data workloads. Also consider the trade-offs. Implementing and operating this strategy, particularly using multi-Region, can be more complicated and more expensive, than other DR strategies.

To get started, checkout the github repo. For more resources, refer to the following:


About the authors

Vivek Shrivastava is a Principal Data Architect, Data Lake in AWS Professional Services. He is a Bigdata enthusiast and holds 13 AWS Certifications. He is passionate about helping customers build scalable and high-performance data analytics solutions in the cloud. In his spare time, he loves reading and finds areas for home automation

Raza Hafeez is a Senior Data Architect within the Shared Delivery Practice of AWS Professional Services. He has over 12 years of professional experience building and optimizing enterprise data warehouses and is passionate about enabling customers to realize the power of their data. He specializes in migrating enterprise data warehouses to AWS Modern Data Architecture.

Nivas Shankar  is a Principal Product Manager for AWS Lake Formation. He works with customers around the globe to translate business and technical requirements into products that enable customers to improve how they manage, secure and access data lake. Also leads several data and analytics initiatives within AWS including support for Data Mesh.

Build a serverless analytics application with Amazon Redshift and Amazon API Gateway

Post Syndicated from David Zhang original https://aws.amazon.com/blogs/big-data/build-a-serverless-analytics-application-with-amazon-redshift-and-amazon-api-gateway/

Serverless applications are a modernized way to perform analytics among business departments and engineering teams. Business teams can gain meaningful insights by simplifying their reporting through web applications and distributing it to a broader audience.

Use cases can include the following:

  • Dashboarding – A webpage consisting of tables and charts where each component can offer insights to a specific business department.
  • Reporting and analysis – An application where you can trigger large analytical queries with dynamic inputs and then view or download the results.
  • Management systems – An application that provides a holistic view of the internal company resources and systems.
  • ETL workflows – A webpage where internal company individuals can trigger specific extract, transform, and load (ETL) workloads in a user-friendly environment with dynamic inputs.
  • Data abstraction – Decouple and refactor underlying data structure and infrastructure.
  • Ease of use – An application where you want to give a large set of user-controlled access to analytics without having to onboard each user to a technical platform. Query updates can be completed in an organized manner and maintenance has minimal overhead.

In this post, you will learn how to build a serverless analytics application using Amazon Redshift Data API and Amazon API Gateway WebSocket and REST APIs.

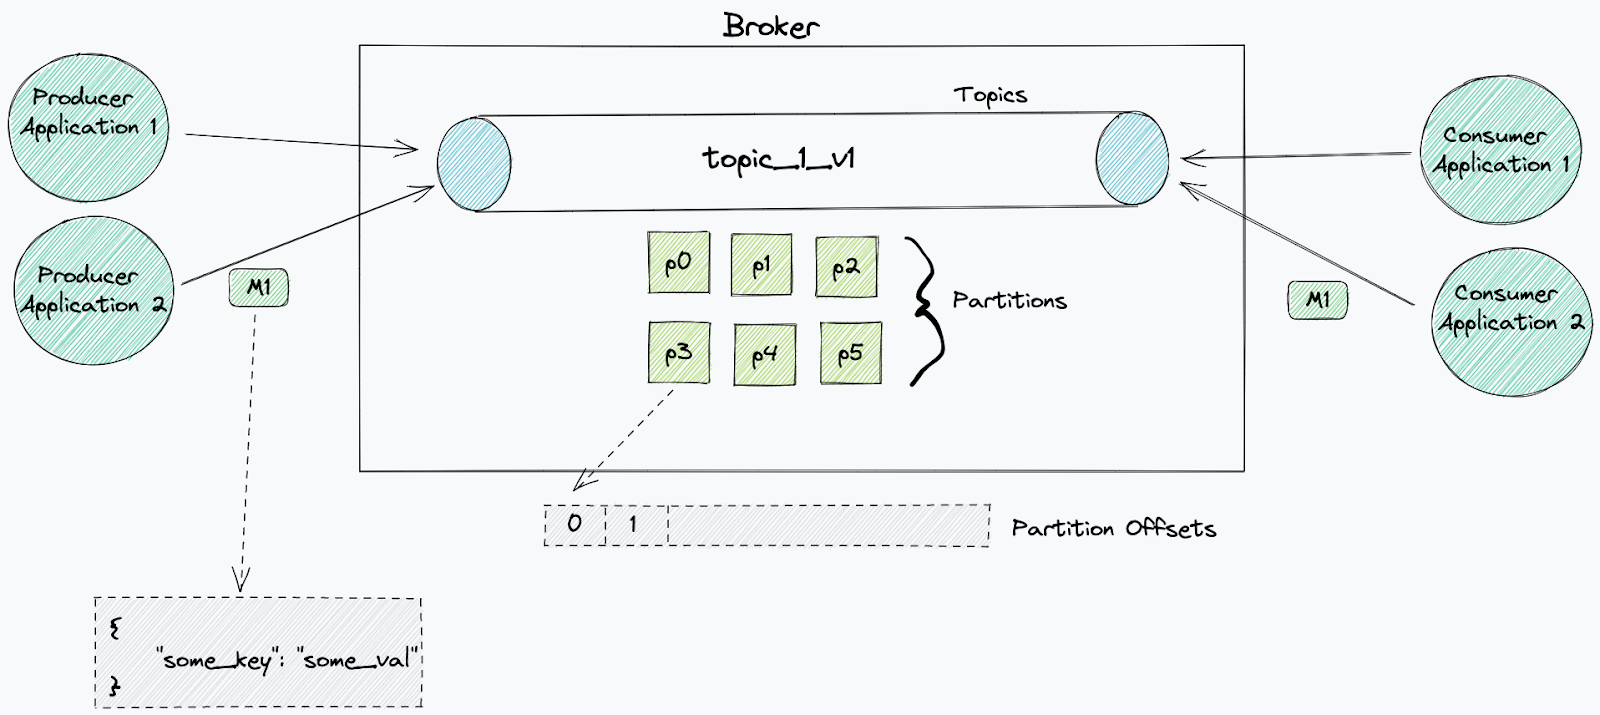
Amazon Redshift is fully managed by AWS, so you no longer need to worry about data warehouse management tasks such as hardware provisioning, software patching, setup, configuration, monitoring nodes and drives to recover from failures, or backups. The Data API simplifies access to Amazon Redshift because you don’t need to configure drivers and manage database connections. Instead, you can run SQL commands to an Amazon Redshift cluster by simply calling a secured API endpoint provided by the Data API. The Data API takes care of managing database connections and buffering data. The Data API is asynchronous, so you can retrieve your results later.

API Gateway is a fully managed service that makes it easy for developers to publish, maintain, monitor, and secure APIs at any scale. With API Gateway, you can create RESTful APIs and WebSocket APIs that enable real-time two-way communication applications. API Gateway supports containerized and serverless workloads, as well as web applications. API Gateway acts as a reverse proxy to many of the compute resources that AWS offers.

Event-driven model

Event-driven applications are increasingly popular among customers. Analytical reporting web applications can be implemented through an event-driven model. The applications run in response to events such as user actions and unpredictable query events. Decoupling the producer and consumer processes allows greater flexibility in application design and building decoupled processes. This design can be achieved with the Data API and API Gateway WebSocket and REST APIs.

Both REST API calls and WebSocket establish communication between the client and the backend. Due to the popularity of REST, you may wonder why WebSockets are present and how they contribute to an event-driven design.

What are WebSockets and why do we need them?

Unidirectional communication is customary when building analytical web solutions. In traditional environments, the client initiates a REST API call to run a query on the backend and either synchronously or asynchronously waits for the query to complete. The “wait” aspect is engineered to apply the concept of polling. Polling in this context is when the client doesn’t know when a backend process will complete. Therefore, the client will consistently make a request to the backend and check.

What is the problem with polling? Main challenges include the following:

  • Increased traffic in your network bandwidth – A large number of users performing empty checks will impact your backend resources and doesn’t scale well.
  • Cost usage – Empty requests don’t deliver any value to the business. You pay for the unnecessary cost of resources.
  • Delayed response – Polling is scheduled in time intervals. If the query is complete in-between these intervals, the user can only see the results after the next check. This delay impacts the user experience and, in some cases, may result in UI deadlocks.

For more information on polling, check out From Poll to Push: Transform APIs using Amazon API Gateway REST APIs and WebSockets.

WebSockets is another approach compared to REST when establishing communication between the front end and backend. WebSockets enable you to create a full duplex communication channel between the client and the server. In this bidirectional scenario, the client can make a request to the server and is notified when the process is complete. The connection remains open, with minimal network overhead, until the response is received.

You may wonder why REST is present, since you can transfer response data with WebSockets. A WebSocket is a light weight protocol designed for real-time messaging between systems. The protocol is not designed for handling large analytical query data and in API Gateway, each frame’s payload can only hold up to 32 KB. Therefore, the REST API performs large data retrieval.

By using the Data API and API Gateway, you can build decoupled event-driven web applications for your data analytical needs. You can create WebSocket APIs with API Gateway and establish a connection between the client and your backend services. You can then initiate requests to perform analytical queries with the Data API. Due to the Data API’s asynchronous nature, the query completion generates an event to notify the client through the WebSocket channel. The client can decide to either retrieve the query results through a REST API call or perform other follow-up actions. The event-driven architecture enables bidirectional interoperable messages and data while keeping your system components agnostic.

Solution overview

In this post, we show how to create a serverless event-driven web application by querying with the Data API in the backend, establishing a bidirectional communication channel between the user and the backend with the WebSocket feature in API Gateway, and retrieving the results using its REST API feature. Instead of designing an application with long-running API calls, you can use the Data API. The Data API allows you to run SQL queries asynchronously, removing the need to hold long, persistent database connections.

The web application is protected using Amazon Cognito, which is used to authenticate the users before they can utilize the web app and also authorize the REST API calls when made from the application.

Other relevant AWS services in this solution include AWS Lambda and Amazon EventBridge. Lambda is a serverless, event-driven compute resource that enables you to run code without provisioning or managing servers. EventBridge is a serverless event bus allowing you to build event-driven applications.

The solution creates a lightweight WebSocket connection between the browser and the backend. When a user submits a request using WebSockets to the backend, a query is submitted to the Data API. When the query is complete, the Data API sends an event notification to EventBridge. EventBridge signals the system that the data is available and notifies the client. Afterwards, a REST API call is performed to retrieve the query results for the client to view.

We have published this solution on the AWS Samples GitHub repository and will be referencing it during the rest of this post.

The following architecture diagram highlights the end-to-end solution, which you can provision automatically with AWS CloudFormation templates run as part of the shell script with some parameter variables.

The application performs the following steps (note the corresponding numbered steps in the process flow):

  1. A web application is provisioned on AWS Amplify; the user needs to sign up first by providing their email and a password to access the site.
  2. The user verifies their credentials using a pin sent to their email. This step is mandatory for the user to then log in to the application and continue access to the other features of the application.
  3. After the user is signed up and verified, they can sign in to the application and requests data through their web or mobile clients with input parameters. This initiates a WebSocket connection in API Gateway. (Flow 1, 2)
  4. The connection request is handled by a Lambda function, OnConnect, which initiates an asynchronous database query in Amazon Redshift using the Data API. The SQL query is taken from a SQL script in Amazon Simple Storage Service (Amazon S3) with dynamic input from the client. (Flow 3, 4, 6, 7)
  5. In addition, the OnConnect Lambda function stores the connection, statement identifier, and topic name in an Amazon DynamoDB database. The topic name is an extra parameter that can be used if users want to implement multiple reports on the same webpage. This allows the front end to map responses to the correct report. (Flow 3, 4, 5)
  6. The Data API runs the query, mentioned in step 2. When the operation is complete, an event notification is sent to EventBridge. (Flow 8)
  7. EventBridge activates an event rule to redirect that event to another Lambda function, SendMessage. (Flow 9)
  8. The SendMessage function notifies the client that the SQL query is complete via API Gateway. (Flow 10, 11, 12)
  9. After the notification is received, the client performs a REST API call (GET) to fetch the results. (Flow 13, 14, 15, 16)
  10. The GetResult function is triggered, which retrieves the SQL query result and returns it to the client.
  11. The user is now able to view the results on the webpage.
  12. When clients disconnect from their browser, API Gateway automatically deletes the connection information from the DynamoDB table using the onDisconnect function. (Flow 17, 18,19)

Prerequisites

Prior to deploying your event-driven web application, ensure you have the following:

  • An Amazon Redshift cluster in your AWS environment – This is your backend data warehousing solution to run your analytical queries. For instructions to create your Amazon Redshift cluster, refer to Getting started with Amazon Redshift.
  • An S3 bucket that you have access to – The S3 bucket will be your object storage solution where you can store your SQL scripts. To create your S3 bucket, refer to Create your first S3 bucket.

Deploy CloudFormation templates

The code associated to the design is available in the following GitHub repository. You can clone the repository inside an AWS Cloud9 environment in our AWS account. The AWS Cloud9 environment comes with AWS Command Line Interface (AWS CLI) installed, which is used to run the CloudFormation templates to set up the AWS infrastructure. Make sure that the jQuery library is installed; we use it to parse the JSON output during the run of the script.

The complete architecture is set up using three CloudFormation templates:

  • cognito-setup.yaml – Creates the Amazon Cognito user pool to web app client, which is used for authentication and protecting the REST API
  • backend-setup.yaml – Creates all the required Lambda functions and the WebSocket and Rest APIs, and configures them on API Gateway
  • webapp-setup.yaml – Creates the web application hosting using Amplify to connect and communicate with the WebSocket and Rest APIs.

These CloudFormation templates are run using the script.sh shell script, which takes care of all the dependencies as required.

A generic template is provided for you to customize your own DDL SQL scripts as well as your own query SQL scripts. We have created sample scripts for you to follow along.

  1. Download the sample DDL script and upload it to an existing S3 bucket.
  2. Change the IAM role value to your Amazon Redshift cluster’s IAM role with permissions to AmazonS3ReadOnlyAccess.

For this post, we copy the New York Taxi Data 2015 dataset from a public S3 bucket.

  1. Download the sample query script and upload it to an existing S3 bucket.
  2. Upload the modified sample DDL script and the sample query script into a preexisting S3 bucket that you own, and note down the S3 URI path.

If you want to run your own customized version, modify the DDL and query script to fit your scenario.

  1. Edit the script.sh file before you run it and set the values for the following parameters:
    • RedshiftClusterEndpoint (aws_redshift_cluster_ep) – Your Amazon Redshift cluster endpoint available on the AWS Management Console
    • DBUsername (aws_dbuser_name) – Your Amazon Redshift database user name
    • DDBTableName (aws_ddbtable_name) – The name of your DynamoDB table name that will be created
    • WebsocketEndpointSSMParameterName (aws_wsep_param_name) – The parameter name that stores the WebSocket endpoint in AWS Systems Manager Parameter Store.
    • RestApiEndpointSSMParameterName (aws_rapiep_param_name) – The parameter name that stores the REST API endpoint in Parameter Store.
    • DDLScriptS3Path (aws_ddl_script_path) – The S3 URI to the DDL script that you uploaded.
    • QueryScriptS3Path (aws_query_script_path) – The S3 URI to the query script that you uploaded.
    • AWSRegion (aws_region) – The Region where the AWS infrastructure is being set up.
    • CognitoPoolName (aws_user_pool_name) – The name you want to give to your Amazon Cognito user pool
    • ClientAppName (aws_client_app_name) – The name of the client app to be configured for the web app to handle the user authentication for the users

The default acceptable values are already provided as part of the downloaded code.

  1. Run the script using the following command:
./script.sh

During deployment, AWS CloudFormation creates and triggers the Lambda function SetupRedshiftLambdaFunction, which sets up an Amazon Redshift database table and populates data into the table. The following diagram illustrates this process.

Use the demo app

When the shell script is complete, you can start interacting with the demo web app:

  1. On the Amplify console, under All apps in the navigation pane, choose DemoApp.
  2. Choose Run build.

The DemoApp web application goes through a phase of Provision, Build, Deploy.

  1. When it’s complete, use the URL provided to access the web application.

The following screenshot shows the web application page. It has minimal functionality: you can sign in, sign up, or verify a user.

  1. Choose Sign Up.

  1. For Email ID, enter an email.
  2. For Password, enter a password that is at least eight characters long, has at least one uppercase and lowercase letter, at least one number, and at least one special character.
  3. Choose Let’s Enroll.

The Verify your Login to Demo App page opens.

  1. Enter your email and the verification code sent to the email you specified.
  2. Choose Verify.


You’re redirected to a login page.

  1. Sign in using your credentials.

You’re redirected to the demoPage.html website.

  1. Choose Open Connection.

You now have an active WebSocket connection between your browser and your backend AWS environment.

  1. For Trip Month, specify a month (for this example, December) and choose Submit.

You have now defined the month and year you want to query your data upon. After a few seconds, you can to see the output delivered from the WebSocket.

You may continue using the active WebSocket connection for additional queries—just choose a different month and choose Submit again.

  1. When you’re done, choose Close Connection to close the WebSocket connection.

For exploratory purposes, while your WebSocket connection is active, you can navigate to your DynamoDB table on the DynamoDB console to view the items that are currently stored. After the WebSocket connection is closed, the items stored in DynamoDB are deleted.

Clean up

To clean up your resources, complete the following steps:

  1. On the Amazon S3 console, navigate to the S3 bucket containing the sample DDL script and query script and delete them from the bucket.
  2. On the Amazon Redshift console, navigate to your Amazon Redshift cluster and delete the data you copied over from the sample DDL script.
    1. Run truncate nyc_yellow_taxi;
    2. Run drop table nyc_yellow_taxi;
  3. On the AWS CloudFormation console, navigate to the CloudFormation stacks and choose Delete. Delete the stacks in the following order:
    1. WebappSetup
    2. BackendSetup
    3. CognitoSetup

All resources created in this solution will be deleted.

Monitoring

You can monitor your event-driven web application events, user activity, and API usage with Amazon CloudWatch and AWS CloudTrail. Most areas of this solution already have logging enabled. To view your API Gateway logs, you can turn on CloudWatch Logs. Lambda comes with default logging and monitoring and can be accessed with CloudWatch.

Security

You can secure access to the application using Amazon Cognito, which is a developer-centric and cost-effective customer authentication, authorization, and user management solution. It provides both identity store and federation options that can scale easily. Amazon Cognito supports logins with social identity providers and SAML or OIDC-based identity providers, and supports various compliance standards. It operates on open identity standards (OAuth2.0, SAML 2.0, and OpenID Connect). You can also integrate it with API Gateway to authenticate and authorize the REST API calls either using the Amazon Cognito client app or a Lambda function.

Considerations

The nature of this application includes a front-end client initializing SQL queries to Amazon Redshift. An important component to consider are potential malicious activities that the client can perform, such as SQL injections. With the current implementation, that is not possible. In this solution, the SQL queries preexist in your AWS environment and are DQL statements (they don’t alter the data or structure). However, as you develop this application to fit your business, you should evaluate these areas of risk.

AWS offers a variety of security services to help you secure your workloads and applications in the cloud, including AWS Shield, AWS Network Firewall, AWS Web Application Firewall, and more. For more information and a full list, refer to Security, Identity, and Compliance on AWS.

Cost optimization

The AWS services that the CloudFormation templates provision in this solution are all serverless. In terms of cost optimization, you only pay for what you use. This model also allows you to scale without manual intervention. Review the following pages to determine the associated pricing for each service:

Conclusion

In this post, we showed you how to create an event-driven application using the Amazon Redshift Data API and API Gateway WebSocket and REST APIs. The solution helps you build data analytical web applications in an event-driven architecture, decouple your application, optimize long-running database queries processes, and avoid unnecessary polling requests between the client and the backend.

You also used severless technologies, API Gateway, Lambda, DynamoDB, and EventBridge. You didn’t have to manage or provision any servers throughout this process.

This event-driven, serverless architecture offers greater extensibility and simplicity, making it easier to maintain and release new features. Adding new components or third-party products is also simplified.

With the instructions in this post and the generic CloudFormation templates we provided, you can customize your own event-driven application tailored to your business. For feedback or contributions, we welcome you to contact us through the AWS Samples GitHub Repository by creating an issue.


About the Authors

David Zhang is an AWS Data Architect in Global Financial Services. He specializes in designing and implementing serverless analytics infrastructure, data management, ETL, and big data systems. He helps customers modernize their data platforms on AWS. David is also an active speaker and contributor to AWS conferences, technical content, and open-source initiatives. During his free time, he enjoys playing volleyball, tennis, and weightlifting. Feel free to connect with him on LinkedIn.

Manash Deb is a Software Development Manager in the AWS Directory Service team. With over 18 years of software dev experience, his passion is designing and delivering highly scalable, secure, zero-maintenance applications in the AWS identity and data analytics space. He loves mentoring and coaching others and to act as a catalyst and force multiplier, leading highly motivated engineering teams, and building large-scale distributed systems.

Pavan Kumar Vadupu Lakshman Manikya is an AWS Solutions Architect who helps customers design robust, scalable solutions across multiple industries. With a background in enterprise architecture and software development, Pavan has contributed in creating solutions to handle API security, API management, microservices, and geospatial information system use cases for his customers. He is passionate about learning new technologies and solving, automating, and simplifying customer problems using these solutions.

Build a Cloud Storage App in 30 Minutes

Post Syndicated from Pat Patterson original https://www.backblaze.com/blog/build-a-cloud-storage-app-in-30-minutes/

The working title for this developer tutorial was originally the “Polyglot Quickstart.” It made complete sense to me—it’s a “multilingual” guide that shows developers how to get started with Backblaze B2 using different programming languages—Java, Python, and the command line interface (CLI). But the folks on our publishing and technical documentation teams wisely advised against such an arcane moniker.

Editor’s Note

Full disclosure, I had to look up the word polyglot. Thanks, Merriam-Webster, for the assist.

Polyglot, adjective.
1a: speaking or writing several languages: multilingual
1b: composed of numerous linguistic groups; a polyglot population
2: containing matter in several languages; a polyglot sign
3: composed of elements from different languages
4: widely diverse (as in ethnic or cultural origins); a polyglot cuisine

Fortunately for you, readers, and you, Google algorithms, we landed on the much easier to understand Backblaze B2 Developer Quick-Start Guide, and we’re launching it today. Read on to learn all about it.

Start Building Applications on Backblaze B2 in 30 Minutes or Less

Yes, you heard that correctly. Whether or not you already have experience working with cloud object storage, this tutorial will get you started building applications that use Backblaze B2 Cloud Storage in 30 minutes or less. You’ll learn how scripts and applications can interact with Backblaze B2 via the AWS SDKs and CLI and the Backblaze S3-compatible API.

The tutorial covers how to:

  • Sign up for a Backblaze B2 account.
  • Create a public bucket, upload and view files, and create an application key using the Backblaze B2 web console.
  • Interact with the Backblaze B2 Storage Cloud using Java, Python, and the CLI: listing the contents of buckets, creating new buckets, and uploading files to buckets.

This first release of the tutorial covers Java, Python, and the CLI. We’ll add more programming languages in the future. Right now we’re looking at JavaScript, C#, and Go. Let us know in the comments if there’s another language we should cover!

➔ Check Out the Guide

What Else Can You Do?

If you already have experience with Amazon S3, the Quick-Start Guide shows how to use the tools and techniques you already know with Backblaze B2. You’ll be able to quickly build new applications and modify existing ones to interact with the Backblaze Storage Cloud. If you’re new to cloud object storage, on the other hand, this is the ideal way to get started.

Watch this space for future tutorials on topics such as:

  • Downloading files from a private bucket programmatically.
  • Uploading large files by splitting them into chunks.
  • Creating pre-signed URLs so that users can access private files securely.
  • Deleting versions, files and buckets.

Want More?

Have questions about any of the above? Curious about how to use Backblaze B2 with your specific application? Already a wiz at this and ready to do more? Here’s how you can get in touch and get involved:

  • Sign up for Backblaze’s virtual user group.
  • Find us at Developer Week.
  • Let us know in the comments which programming languages we should add to the Quick-Start Guide.

The post Build a Cloud Storage App in 30 Minutes appeared first on Backblaze Blog | Cloud Storage & Cloud Backup.

A security audit of Git

Post Syndicated from original https://lwn.net/Articles/921067/

The Open Source Technology Improvement Fund has announced the
completion of a security audit of the Git source.

For this portion of the research a total of 35 issues were
discovered, including 2 critical severity findings and a high
severity finding. Additionally, because of this research, a number
of potentially catastrophic security bugs were discovered and
resolved internally by the git security team.

See the
full report
for all the details.

Rapid7 Now Available Through Carahsoft’s NASPO ValuePoint

Post Syndicated from Rapid7 original https://blog.rapid7.com/2023/01/24/rapid7-now-available-through-carahsofts-naspo-valuepoint/

Rapid7 Now Available Through Carahsoft’s NASPO ValuePoint

We are happy to announce that Rapid7’s solutions have been added to the NASPO ValuePoint Cloud Solutions contract held by Carahsoft Technology Corp. The addition of this contract enables Carahsoft and its reseller partners to provide Rapid7’s Insight platform to participating States, Local Governments, and Educational (SLED) institutions.

“Rapid7’s Insight platform goes beyond threat detection by enabling organizations to quickly respond to attacks with intelligent automation,” said Alex Whitworth, Sales Director who leads the Rapid7 Team at Carahsoft.

“We are thrilled to work with Rapid7 and our reseller partners to deliver these advanced cloud risk management and threat detection solutions to NASPO members to further protect IT environments across the SLED space.”

NASPO ValuePoint is a cooperative purchasing program facilitating public procurement solicitations and agreements using a lead-state model. The program provides the highest standard of excellence in public cooperative contracting. By leveraging the leadership and expertise of all states and the purchasing power of their public entities, NASPO ValuePoint delivers the highest valued, reliable and competitively sourced contracts, offering public entities outstanding prices.

“In partnership with Carahsoft and their reseller partners, we look forward to providing broader availability of the Insight platform to help security teams better protect their organizations from an increasingly complex and volatile threat landscape,” said Damon Cabanillas, Vice President of Public Sector Sales at Rapid7.

The Rapid7 Insight platform is available through Carahsoft’s NASPO ValuePoint Master Agreement #AR2472. For more information, visit https://www.carahsoft.com/rapid7/contracts.

Rapid7 Added to Carahsoft GSA Schedule Contract

Post Syndicated from Rapid7 original https://blog.rapid7.com/2023/01/24/rapid7-added-to-carahsoft-gsa-schedule-contract/

Rapid7 Added to Carahsoft GSA Schedule Contract

We are happy to announce that Rapid7 has been added to Carahsoft’s GSA Schedule contract, making our suite of comprehensive security solutions widely available to Federal, State, and Local agencies through Carahsoft and its reseller partners.

“With the ever-evolving threat landscape, it is important that the public sector has the resources to defend against sophisticated cyber attacks and vulnerabilities,” said Alex Whitworth, Sales Director who leads the Rapid7 Team at Carahsoft.

“The addition of Rapid7’s cloud risk management and threat detection solutions to our GSA Schedule gives Government customers and our reseller partners expansive access to the tools necessary to protect their critical infrastructure.”

With the GSA contract award, Rapid7 is able to significantly expand its availability to Federal, State, Local, and Government markets. In addition to GSA, Rapid7 was recently added to the Department of Homeland Security (DHS) Continuous Diagnostics Mitigation’s Approved Products List.

“As the attack surface continues to increase in size and complexity, it’s imperative that all organizations have access to the tools and services they need to monitor risk across their environments,” said Damon Cabanillas, Vice President of Public Sector Sales at Rapid7.

“This contract award is a massive step forward for Rapid7 as we work to further serve the public sector.”

Rapid7 is available through Carahsoft’s GSA Schedule No. 47QSWA18D008F. For more information on Rapid7’s products and services, contact the Rapid7 team at Carahsoft at [email protected].

Security updates for Tuesday

Post Syndicated from original https://lwn.net/Articles/921024/

Security updates have been issued by Debian (kernel and spip), Fedora (kernel), Mageia (chromium-browser-stable, docker, firefox, jpegoptim, nautilus, net-snmp, phoronix-test-suite, php, php-smarty, samba, sdl2, sudo, tor, viewvc, vim, virtualbox, and x11-server), Red Hat (bash, curl, dbus, expat, firefox, go-toolset, golang, java-1.8.0-openjdk, java-17-openjdk, kernel, kernel-rt, kpatch-patch, libreoffice, libtasn1, libtiff, libxml2, libXpm, nodejs, nodejs-nodemon, pcs, postgresql-jdbc, sqlite, sssd, sudo, systemd, and usbguard), Scientific Linux (firefox, java-11-openjdk, and sudo), SUSE (freeradius-server, python-mechanize, and upx), and Ubuntu (exuberant-ctags, haproxy, ruby2.5, ruby3.0, and wheel).

Best practices for working with the Apache Velocity Template Language in Amazon API Gateway

Post Syndicated from Benjamin Smith original https://aws.amazon.com/blogs/compute/best-practices-for-working-with-the-apache-velocity-template-language-in-amazon-api-gateway/

This post is written by Ben Freiberg, Senior Solutions Architect, and Marcus Ziller, Senior Solutions Architect.

One of the most common serverless patterns are APIs built with Amazon API Gateway and AWS Lambda. This approach is supported by many different frameworks across many languages. However, direct integration with AWS can enable customers to increase the cost-efficiency and resiliency of their serverless architecture. This blog post discusses best practices for using Apache Velocity Templates for direct service integration in API Gateway.

Deciding between integration via Velocity templates and Lambda functions

Many use cases of Velocity templates in API Gateway can also be solved with Lambda. With Lambda, the complexity of integrating with different backends is moved from the Velocity templating language (VTL) to the programming language. This allows customers to use existing frameworks and methodologies from the ecosystem of their preferred programming language.

However, many customers choose serverless on AWS to build lean architectures and using additional services such as Lambda functions can add complexity to your application. There are different considerations that customers can use to assess the trade-offs between the two approaches.

Developer experience

Apache Velocity has a number of operators that can be used when an expression is evaluated, most prominently in #if and #set directives. These operators allow you to implement complex transformations and business logic in your Velocity templates.

However, this adds complexity to multiple aspects of the development workflow:

  • Testing: Testing Velocity templates is possible but the tools and methodologies are less mature than for traditional programming languages used in Lambda functions.
  • Libraries: API Gateway offers utility functions for VTL that simplify common use cases such as data transformation. Other functionality commonly offered by programming language libraries (for example, Python Standard Library) might not be available in your template.
  • Logging: It is not possible to log information to Amazon CloudWatch from a Velocity template, so there is no option to retain this information.
  • Tracing: API Gateway supports request tracing via AWS X-Ray for native integrations with services such as Amazon DynamoDB.

You should use VTL for data mapping and transformations rather than complex business logic. There are exceptions but the drawbacks of using VTL for other use cases often outweigh the benefits.

API lifecycle

The API lifecycle is an important aspect to consider when deciding on Velocity or Lambda. In early stages, requirements are typically not well defined and can change rapidly while exploring the solution space. This often happens when integrating with databases such as Amazon DynamoDB and finding out the best way to organize data on the persistence layer.

For DynamoDB, this often means changes to attributes, data types, or primary keys. In such cases, it is a sensible decision to start with Lambda. Writing code in a programming language can give developers more leeway and flexibility when incorporating changes. This shortens the feedback loop for changes and can improve the developer experience.

When an API matures and is run in production, changes typically become less frequent and stability increases. At this point, it can make sense to evaluate if the Lambda function can be replaced by moving logic into Velocity templates. Especially for busy APIs, the one-time effort of moving Lambda logic to Velocity templates can pay off in the long run as it removes the cost of Lambda invocations.

Latency

In web applications, a major factor of user perceived performance is the time it takes for a page to load. In modern single page applications, this often means multiple requests to backend APIs. API Gateway offers features to minimize the latency for calls on the API layer. With Lambda for service integration, an additional component is added into the execution flow of the request, which inevitably introduces additional latency.

The degree of that additional latency depends on the specifics of the workload, and often is as low as a few milliseconds.

The following example measures no meaningful difference in latency other than cold starts of the execution environments for a basic CRUD API with a Node.js Lambda function that queries DynamoDB. I observe similar results for Go and Python.

Concurrency and scalability

Concurrency and scalability of an API changes when having an additional Lambda function in the execution path of the request. This is due to different Service Quotas and general scaling behaviors in different services.

For API Gateway, the current default quota is 10,000 requests per second (RPS) with an additional burst capacity provided by the token bucket algorithm, using a maximum bucket capacity of 5,000 requests. API Gateway quotas are independent of Region, while Lambda default concurrency limits depend on the Region.

After the initial burst, your functions’ concurrency can scale by an additional 500 instances each minute. This continues until there are enough instances to serve all requests, or until a concurrency limit is reached. For more details on this topic, refer to Understanding AWS Lambda scaling and throughput.

If your workload experiences sharp spikes of traffic, a direct integration with your persistence layer can lead to a better ability to handle such spikes without throttling user requests. Especially for Regions with an initial burst capacity of 1000 or 500, this can help avoid throttling and provide a more consistent user experience.

Best practices

Organize your project for tooling support

When VTL is used in Infrastructure as Code (IaC) artifacts such as AWS CloudFormation templates, it must be embedded into the IaC document as a string.

This approach has three main disadvantages:

  • Especially with multi-line Velocity templates, this leads to IaC definitions that are difficult to read or write.
  • Tools such as IDEs or Linters do not work with string representations of Velocity templates.
  • The templates cannot be easily used outside of the IaC definition, such as for local testing.

Each aspect impacts developer productivity and make the implementation more prone to errors.

You should decouple the definition of Velocity templates from the definition of IaC templates wherever possible. For the CDK, the implementation requires only a few lines of code.

// The following code is licensed under MIT-0 
import { readFileSync } from 'fs';
import * as path from 'path';

const getUserIntegrationWithVTL = new AwsIntegration({
      service: 'dynamodb',
      integrationHttpMethod: HttpMethods.POST,
      action: 'GetItem',
      options: {
        // Omitted for brevity
        requestTemplates: {
          'application/json': readFileSync(path.join('path', 'to', 'vtl', 'request.vm'), 'utf8').toString(),
        },
        integrationResponses: [
          {
            statusCode: '200',
            responseParameters: {
              'method.response.header.access-control-allow-origin': "'*'",
            },
            responseTemplates: {
              'application/json': readFileSync(path.join('path', 'to', 'vtl', 'request.vm'), 'utf8').toString(),
            },
          },
        ],
      },
    });

Another advantage of this approach is that it forces you to externalize variables in your templates. When defining Velocity templates inside of IaC documents, it is possible to refer to other resources in the same IaC document and set this value in the Velocity template through string concatenation. However, this hardcodes the value into the template as opposed to the recommended way of using Stage Variables.

Test Velocity templates locally

A frequent challenge that customers face with Velocity templates is how to shorten the feedback loop when implementing a template. A common workflow to test changes to templates is:

  1. Make changes to the template.
  2. Deploy the stack.
  3. Test the API endpoint.
  4. Evaluate the results or check logs for errors.
  5. Complete or return to step 1.

Depending on the duration of the stack deployment, this can often lead to feedback loops of several minutes. Although the test ecosystem for Velocity is far from being as extensive as it is for mainstream programming languages, there are still ways to improve the developer experience when writing VTL.

Local Velocity rendering engine with AWS SDK

When API Gateway receives a request that has an AWS integration target, the following things happen:

  1. Retrieve request context: API Gateway retrieves request parameters and stage variables.
  2. Make request: body:  API Gateway uses the template and variables from 1 to render a JSON document.
  3. Send request: API Gateway makes an API call to the respective AWS Service. It abstracts Authorization (via it’s IAM Role), Encoding and other aspects of the request away so that only the request body needs to be provided by API Gateway
  4. Retrieve response: API Gateway retrieves a JSON response from the API call.
  5. Make response body: If the call was successful the JSON response is used as input to render the response template. The result will then be sent back to the client that initiated the request to the API Gateway

To simplify our developing workflow, you can locally replicate the above flow with the AWS SDK and a Velocity rendering engine of your choice.

I recommend using Node.js for two reasons:

  • The velocityjs library is a lightweight but powerful Velocity render engine
  • The client methods (e.g. dynamoDbClient.query(jsonBody)) of the AWS SDK for JavaScript generally expect the same JSON body like the AWS REST API does. For most use cases, no transformation (e.g. camel case to Pascal case) is thus needed

The following snippet shows how to test Velocity templates for request and response of a DynamoDB Service Integration. It loads templates from files and renders them with context and parameters. Refer to the git repository for more details.

// The following code is licensed under MIT-0 
const fs = require('fs')
const Velocity = require('velocityjs');
const AWS = require('@aws-sdk/client-dynamodb');
const ddb = new AWS.DynamoDB()

const requestTemplate = fs.readFileSync('path/to/vtl/request.vm', 'utf8')
const responseTemplate = fs.readFileSync(''path/to/vtl/response.vm', 'utf8')

async function testDynamoDbIntegration() {
  const requestTemplateAsString = Velocity.render(requestTemplate, {
    // Mocks the variables provided by API Gateway
    context: {
      arguments: {
        tableName: 'MyTable'
      }
    },
    input: {
      params: function() {
        return 'someId123'
      },
    },
  });

  print(requestTemplateAsString)

  const sdkJsonRequestBody = JSON.parse(requestTemplateAsString)
  const item = await ddb.query(sdkJsonRequestBody)

  const response = Velocity.render(responseTemplate, {
    input: {
      path: function() {
        return {
          Items: item.Items
        }
      },
    },
  })

  const jsonResponse = JSON.parse(response)
}

This approach does not cover all use cases and ultimately must be validated by a deployment of the template. However, it helps to reduce the length of one feedback loop from minutes to a few seconds and allows for faster iterations in the development of Velocity templates.

Conclusion

This blog post discusses considerations and best practices for working with Velocity Templates in API Gateway. Developer experience, latency, API lifecycle, cost, and scalability are key factors when choosing between Lambda and VTL. For most use cases, we recommend Lambda as a starting point and VTL as an optimization step.

Setting up a local test environment for VTL helps shorten the feedback loop significantly and increase developer productivity. The AWS CDK is the recommended IaC framework for working with VTL projects, since it enables you to efficiently organize your infrastructure as code project for tooling support.

For more serverless learning resources, visit Serverless Land.

Intelligent, automatic restarts for unhealthy Kafka consumers

Post Syndicated from Chris Shepherd original https://blog.cloudflare.com/intelligent-automatic-restarts-for-unhealthy-kafka-consumers/

Intelligent, automatic restarts for unhealthy Kafka consumers

Intelligent, automatic restarts for unhealthy Kafka consumers

At Cloudflare, we take steps to ensure we are resilient against failure at all levels of our infrastructure. This includes Kafka, which we use for critical workflows such as sending time-sensitive emails and alerts.

We learned a lot about keeping our applications that leverage Kafka healthy, so they can always be operational. Application health checks are notoriously hard to implement: What determines an application as healthy? How can we keep services operational at all times?

These can be implemented in many ways. We’ll talk about an approach that allows us to considerably reduce incidents with unhealthy applications while requiring less manual intervention.

Kafka at Cloudflare

Cloudflare is a big adopter of Kafka. We use Kafka as a way to decouple services due to its asynchronous nature and reliability. It allows different teams to work effectively without creating dependencies on one another. You can also read more about how other teams at Cloudflare use Kafka in this post.

Kafka is used to send and receive messages. Messages represent some kind of event like a credit card payment or details of a new user created in your platform. These messages can be represented in multiple ways: JSON, Protobuf, Avro and so on.

Kafka organises messages in topics. A topic is an ordered log of events in which each message is marked with a progressive offset. When an event is written by an external system, that is appended to the end of that topic. These events are not deleted from the topic by default (retention can be applied).

Intelligent, automatic restarts for unhealthy Kafka consumers

Topics are stored as log files on disk, which are finite in size. Partitions are a systematic way of breaking the one topic log file into many logs, each of which can be hosted on separate servers–enabling to scale topics.

Topics are managed by brokers–nodes in a Kafka cluster. These are responsible for writing new events to partitions, serving reads and replicating partitions among themselves.

Messages can be consumed by individual consumers or co-ordinated groups of consumers, known as consumer groups.

Consumers use a unique id (consumer id) that allows them to be identified by the broker as an application which is consuming from a specific topic.

Each topic can be read by an infinite number of different consumers, as long as they use a different id. Each consumer can replay the same messages as many times as they want.

When a consumer starts consuming from a topic, it will process all messages, starting from a selected offset, from each partition. With a consumer group, the partitions are divided amongst each consumer in the group. This division is determined by the consumer group leader. This leader will receive information about the other consumers in the group and will decide which consumers will receive messages from which partitions (partition strategy).

Intelligent, automatic restarts for unhealthy Kafka consumers

The offset of a consumer’s commit can demonstrate whether the consumer is working as expected. Committing a processed offset is the way a consumer and its consumer group report to the broker that they have processed a particular message.

Intelligent, automatic restarts for unhealthy Kafka consumers

A standard measurement of whether a consumer is processing fast enough is lag. We use this to measure how far behind the newest message we are. This tracks time elapsed between messages being written to and read from a topic. When a service is lagging behind, it means that the consumption is at a slower rate than new messages being produced.

Due to Cloudflare’s scale, message rates typically end up being very large and a lot of requests are time-sensitive so monitoring this is vital.

At Cloudflare, our applications using Kafka are deployed as microservices on Kubernetes.

Health checks for Kubernetes apps

Kubernetes uses probes to understand if a service is healthy and is ready to receive traffic or to run. When a liveness probe fails and the bounds for retrying are exceeded, Kubernetes restarts the services.

Intelligent, automatic restarts for unhealthy Kafka consumers

When a readiness probe fails and the bounds for retrying are exceeded, it stops sending HTTP traffic to the targeted pods. In the case of Kafka applications this is not relevant as they don’t run an http server. For this reason, we’ll cover only liveness checks.

A classic Kafka liveness check done on a consumer checks the status of the connection with the broker. It’s often best practice to keep these checks simple and perform some basic operations – in this case, something like listing topics. If, for any reason, this check fails consistently, for instance the broker returns a TLS error, Kubernetes terminates the service and starts a new pod of the same service, therefore forcing a new connection. Simple Kafka liveness checks do a good job of understanding when the connection with the broker is unhealthy.

Intelligent, automatic restarts for unhealthy Kafka consumers

Problems with Kafka health checks

Due to Cloudflare’s scale, a lot of our Kafka topics are divided into multiple partitions (in some cases this can be hundreds!) and in many cases the replica count of our consuming service doesn’t necessarily match the number of partitions on the Kafka topic. This can mean that in a lot of scenarios this simple approach to health checking is not quite enough!

Microservices that consume from Kafka topics are healthy if they are consuming and committing offsets at regular intervals when messages are being published to a topic. When such services are not committing offsets as expected, it means that the consumer is in a bad state, and it will start accumulating lag. An approach we often take is to manually terminate and restart the service in Kubernetes, this will cause a reconnection and rebalance.

Intelligent, automatic restarts for unhealthy Kafka consumers

When a consumer joins or leaves a consumer group, a rebalance is triggered and the consumer group leader must re-assign which consumers will read from which partitions.

When a rebalance happens, each consumer is notified to stop consuming. Some consumers might get their assigned partitions taken away and re-assigned to another consumer. We noticed when this happened within our library implementation; if the consumer doesn’t acknowledge this command, it will wait indefinitely for new messages to be consumed from a partition that it’s no longer assigned to, ultimately leading to a deadlock. Usually a manual restart of the faulty client-side app is needed to resume processing.

Intelligent health checks

As we were seeing consumers reporting as “healthy” but sitting idle, it occurred to us that maybe we were focusing on the wrong thing in our health checks. Just because the service is connected to the Kafka broker and can read from the topic, it does not mean the consumer is actively processing messages.

Therefore, we realised we should be focused on message ingestion, using the offset values to ensure that forward progress was being made.

The PagerDuty approach

PagerDuty wrote an excellent blog on this topic which we used as inspiration when coming up with our approach.

Their approach used the current (latest) offset and the committed offset values. The current offset signifies the last message that was sent to the topic, while the committed offset is the last message that was processed by the consumer.

Intelligent, automatic restarts for unhealthy Kafka consumers

Checking the consumer is moving forwards, by ensuring that the latest offset was changing (receiving new messages) and the committed offsets were changing as well (processing the new messages).

Therefore, the solution we came up with:

  • If we cannot read the current offset, fail liveness probe.
  • If we cannot read the committed offset, fail liveness probe.
  • If the committed offset == the current offset, pass liveness probe.
  • If the value for the committed offset has not changed since the last run of the health check, fail liveness probe.
Intelligent, automatic restarts for unhealthy Kafka consumers

To measure if the committed offset is changing, we need to store the value of the previous run, we do this using an in-memory map where partition number is the key. This means each instance of our service only has a view of the partitions it is currently consuming from and will run the health check for each.

Problems

When we first rolled out our smart health checks we started to notice cascading failures some time after release. After initial investigations we realised this was happening when a rebalance happens. It would initially affect one replica then quickly result in the others reporting as unhealthy.

What we observed was due to us storing the previous value of the committed offset in-memory, when a rebalance happens the service may get re-assigned a different partition. When this happened it meant our service was incorrectly assuming that the committed offset for that partition had not changed (as this specific replica was no longer updating the latest value), therefore it would start to report the service as unhealthy. The failing liveness probe would then cause it to restart which would in-turn trigger another rebalancing in Kafka causing other replicas to face the same issue.

Solution

To fix this issue we needed to ensure that each replica only kept track of the offsets for the partitions it was consuming from at that moment. Luckily, the Shopify Sarama library, which we use internally, has functionality to observe when a rebalancing happens. This meant we could use it to rebuild the in-memory map of offsets so that it would only include the relevant partition values.

This is handled by receiving the signal from the session context channel:

for {
  select {
  case message, ok := <-claim.Messages(): // <-- Message received

     // Store latest received offset in-memory
     offsetMap[message.Partition] = message.Offset


     // Handle message
     handleMessage(ctx, message)


     // Commit message offset
     session.MarkMessage(message, "")


  case <-session.Context().Done(): // <-- Rebalance happened

     // Remove rebalanced partition from in-memory map
     delete(offsetMap, claim.Partition())
  }
}

Verifying this solution was straightforward, we just needed to trigger a rebalance. To test this worked in all possible scenarios we spun up a single replica of a service consuming from multiple partitions, then proceeded to scale up the number of replicas until it matched the partition count, then scaled back down to a single replica. By doing this we verified that the health checks could safely handle new partitions being assigned as well as partitions being taken away.

Takeaways

Probes in Kubernetes are very easy to set up and can be a powerful tool to ensure your application is running as expected. Well implemented probes can often be the difference between engineers being called out to fix trivial issues (sometimes outside of working hours) and a service which is self-healing.

However, without proper thought, “dumb” health checks can also lead to a false sense of security that a service is running as expected even when it’s not. One thing we have learnt from this was to think more about the specific behaviour of the service and decide what being unhealthy means in each instance, instead of just ensuring that dependent services are connected.

Monitoring Kubernetes with Zabbix

Post Syndicated from Michaela DeForest original https://blog.zabbix.com/monitoring-kubernetes-with-zabbix/25055/

There are many options available for monitoring Kubernetes and cloud-native applications. In this multi-part blog series, we’ll explore how to use Zabbix to monitor a Kubernetes cluster and understand the metrics generated within Zabbix. We’ll also learn how to exploit Prometheus endpoints exposed by applications to monitor application-specific metrics.

Want to see Kubernetes monitoring in action? Watch the step-by-step Zabbix Kubernetes monitoring configuration and deployment guide.

Why Choose Zabbix to Monitor Kubernetes?

Before choosing Zabbix as a Kubernetes monitoring tool, we asked ourselves, “why would we choose to use Zabbix rather than Prometheus, Grafana, and alertmanager?” After all, they have become the standard monitoring tools in the cloud ecosystem. We decided that our minimum criteria for Zabbix would be that it was just as effective as Prometheus for monitoring both Kubernetes and cloud-native applications.

Through our discovery process, we concluded that Zabbix meets (and exceeds) this minimum requirement. Zabbix provides similar metrics and triggers as Prometheus, alert manager, and Grafana for Kubernetes, as they both use the same backend tools to do this. However, Zabbix can do this in one product while still maintaining flexibility and allowing you to monitor pretty much anything you can write code to collect. Regarding application monitoring, Zabbix can transform Prometheus metrics fed to it by Prometheus exporters and endpoints. In addition, because Zabbix can make calls to any HTTP endpoint, it can monitor applications that do not have a dedicated Prometheus endpoint, unlike Prometheus.

The Zabbix Helm Chart

Zabbix monitors Kubernetes by collecting metrics exposed via the Kubernetes API and kube-state-metrics. The components necessary to monitor a cluster are installed within the cluster using this helm chart provided by Zabbix. The helm chart includes the Zabbix agent installed as a daemon set and is used to monitor local resources and applications on each node. A Zabbix proxy is also installed to collect monitoring data and transfer it to the external Zabbix server.

Only the Zabbix proxy needs access to the Zabbix server, while the agents can send data to the proxy installed in the same namespace as each agent. A cluster role allows Zabbix to access resources in the cluster via the Kubernetes API. While the cluster role could be modified to restrict privileges given to Zabbix, this will result in some items becoming unsupported. We recommend keeping this the same if you want to get the most out of Kubernetes monitoring with Zabbix.

The Zabbix helm chart installs the kube-state-metrics project as a dependency. You may already be familiar with this project under the Kubernetes organization, which generates Prometheus format metrics based on the current state of the Kubernetes resources. In addition, if you have experience using Prometheus to monitor a cluster, you may already have this installed. If that is the case, you can point to this deployment rather than installing another one.

In this tutorial, we will install kube-state-metrics via the Zabbix helm chart.

For more information on skipping this step, refer to the values file in the Zabbix Kubernetes helm chart.

Installing the Zabbix Helm Chart

Now that we’ve explained how the Zabbix helm chart works, let’s go ahead and install it. In this example, we will assume that you have a running Zabbix 6.0 (or higher) instance that is reachable from the cluster you wish to monitor. I am running a 6.0 instance in a different cluster than the one we want to monitor. The server is reachable via the DNS name mdeforest.zabbix.atsgroup.io with a non-standard port of 31103.

We will start by installing the latest Zabbix helm chart. I recommend visiting zabbix.com/integrations/kubernetes to get any sources that may be referred to in this tutorial. There you will find a link to the Zabbix helm chart and templates. For the most part, we will follow the steps outlined in the readme.


Using a terminal window, I am going to make sure the active cluster is set to the cluster that I want to monitor:

kubectl config use-context <cluster context name>

I’m then going to add the Zabbix chart repo to my local helm repository:

helm repo add zabbix-chart-6.0 https://cdn.zabbix.com/zabbix/integrations/kubernetes-helm/6.0/

If you’re running Zabbix 6.2 or newer, change the references to 6.0 in this command to 6.2.

Depending on your circumstances, you will need to set a few values for the installation. In most cases, you only need to set a few environment variables for the Zabbix agent and the proxy. The complete list of values and environment variables is available in the helm chart repo, alongside the agent and proxy images on Docker Hub.

In this case, I’m setting the passive server environment variable for the agent to allow any IP to connect. For the proxy, I am setting the server host accessible from the proxy alongside the non-standard port. I’ve also set here some variables related to cache size. These variables may depend on your cluster size, so you may need to play around with them to find the correct values.

Now that I have the values file ready, I’m ready to install the chart. So, we’ll use the following command. Of course, the chart path might vary depending on what version of the chart you’re using.

helm install -f </path/to/values/file> [-n <namespace>] zabbix zabbix-chart-6.0/zabbix-helm-chart

You can also optionally add a namespace. You must wait until everything is running, so I’ll check just that with the following:

watch kubectl get pods

Now that everything is installed, we’re ready to set up hosts in Zabbix that will be associated with the cluster. The last step before we have all the information we need is to obtain the token created via the service account installed with the helm chart. We’ll get this by running the next command, which is the name of the service account that was created:

kubectl get secret -o jsonpath={.data.token} zabbix service-account | base64 -d

This will get the secret created for the service account and grab just the token from that, which is passed to the base64 utility to decode it. Be sure to copy that value somewhere because you’ll need it for later.

You’ll also need the Kubernetes API endpoint. In most cases, you’ll use the proxy installed rather than the server directly or a proxy outside the cluster. If this is the case, you can use the service DNS for the API. We should be able to reach it by pointing to https://kubernetes.default.svc.cluster.local:443/api.

If this is not the case, you can use the output from the command:

kubectl cluster-info

Now, let’s head over to the Zabbix UI. All the templates we need are shipped in Zabbix 6. If for some reason, you can’t find them, they are available for download and import by visiting the integrations page that I pointed out earlier on the Zabbix site.

Adding the Proxy

We will add our proxy by heading to Administration -> Proxies:

  1. Click Create Proxy. Because this is an active proxy by default, we only need to specify the proxy name. If you didn’t make any changes to the helm chart, this should default to zabbix-proxy. If you’d like to name this differently, you can change the environment variable zbx_hostname for the proxy in the helm chart. We’re going to leave it as the default for now. You’re going to enter this name and then click “Add.” After a few minutes, you’ll start to see that it says that the proxy has been seen.
  2. Create a Host Group to put hosts related to Kubernetes. For this example, let’s create one, which we’ll call Kubernetes.
  3. Head to the host page under configuration and click Create Host. The first host will collect metrics related to monitoring Kubernetes nodes, and we’ll discover nodes and create new hosts using Zabbix low-level discovery.
  4. Give this host the name Kubernetes Nodes. We’ll also assign this host to the Kubernetes host group we created and attach the template Kubernetes nodes by HTTP.
  5. Change the line “Monitored by proxy” to the proxy created earlier, called zabbix-proxy.
  6. Click the Macros tab and select “Inherited and host macros.” You should be able to see all the macros that may be set to influence what is monitored in your cluster. In this case, we need to change the first two macros. The first, {KUBE.API.ENDPOINT.URL}, should be set to the Kubernetes API endpoint. In our case, we can set it to what I mentioned earlier: default.svc.cluster.local:443/api. Next, the token should be set to the previously retrieved value from the command line.
  7. lick Add. After a few minutes, you should start seeing data on the latest data page and new hosts on the host page representing each node.

Creating an Additional Host

Now let’s create another host that will represent the metrics available via the Kubernetes API and the kube-state-metrics endpoint.

  1. Click Create Host again, name this host Kubernetes Cluster State, and add it to the Kubernetes group again.
  2. Let’s also attach the Kubernetes Cluster State template by HTTP. Again, we’re going to choose the proxy that we created earlier.
  3. In the Macro section, change the kube.api.url to the same thing we used before, but this time leave off the /api at the end. Simply: default.svc.cluster.local:443. Be sure to set the token as we did before.
  4. Assuming nothing else was changed in the installation of the helm chart, we can now add that host.

After a few minutes, you should receive metrics related to the cluster state, including hosts representing the kubelet on each node.

What’s Next?

Now you’re all set to start monitoring your Kubernetes cluster in Zabbix! Give it a try, and let us know your thoughts in the comments.

In the next blog post, we’ll look at what you can do with your newly monitored cluster and how to get the most out of it.

If you’d like help with any of this, ATS has advanced monitoring, orchestration, and automation skills to make this process a snap. Set up a 15-minute with our team to go through any questions you have.

About the Author

Michaela DeForest is a Platform Engineer for The ATS Group.  She is a Zabbix Certified Specialist on Zabbix 6.0 with additional areas of expertise, including Terraform, Amazon Web Services (AWS), Ansible, and Kubernetes, to name a few.  As ATS’s resident authority in DevOps, Michaela is critical in delivering cutting-edge solutions that help businesses improve efficiency, reduce errors, and achieve a faster ROI.

About ATS Group: The ATS Group provides a fully inclusive set of technology services and tools designed to innovate and transform IT.  Their systems integration, business resiliency, cloud enablement, infrastructure intelligence, and managed services help businesses of all sizes “get IT done.” With over 20 years in business, ATS has become the trusted advisor to nearly 500 customers across multiple industries.  They have built their reputation around honesty, integrity, and technical expertise unrivaled by the competition.

Bulk Surveillance of Money Transfers

Post Syndicated from Bruce Schneier original https://www.schneier.com/blog/archives/2023/01/bulk-surveillance-of-money-transfers.html

Just another obscure warrantless surveillance program.

US law enforcement can access details of money transfers without a warrant through an obscure surveillance program the Arizona attorney general’s office created in 2014. A database stored at a nonprofit, the Transaction Record Analysis Center (TRAC), provides full names and amounts for larger transfers (above $500) sent between the US, Mexico and 22 other regions through services like Western Union, MoneyGram and Viamericas. The program covers data for numerous Caribbean and Latin American countries in addition to Canada, China, France, Malaysia, Spain, Thailand, Ukraine and the US Virgin Islands. Some domestic transfers also enter the data set.

[…]

You need to be a member of law enforcement with an active government email account to use the database, which is available through a publicly visible web portal. Leber told The Journal that there haven’t been any known breaches or instances of law enforcement misuse. However, Wyden noted that the surveillance program included more states and countries than previously mentioned in briefings. There have also been subpoenas for bulk money transfer data from Homeland Security Investigations (which withdrew its request after Wyden’s inquiry), the DEA and the FBI.

How is it that Arizona can be in charge of this?

Wall Street Journal podcast—with transcript—on the program. I think the original reporting was from last March, but I missed it back then.

The collective thoughts of the interwebz