So, if you read our last post, you undoubtedly know that we were looking to relocate the collection to an organisation that was going to display it and potentially restore it. We had many, many interested parties reach out to us from museums all over the world to private collectors interested in acquiring the machines. When we set out to rescue the 360’s Chris and I decided that our main goal was their preservation, and everything else was by the wayside. We evaluated each and every opportunity presented to us for a new home for the 360’s, and found an organisation who we considered to be exactly what we’d been looking for.
System Source Museum got in touch with us very shortly after we made the post to register their interest. We had an initial engagement call with them, and were very impressed by their attitude and approach. Ideally Chris & I wanted to maintain ownership of the systems, and System Source were very happy to take them on a long term loan basis. Chris flew over to see them in Maryland and was again extremely impressed with their collection, display, team, and approach to restoration & conservation. We drew up a contract together, signed the various agreements, and two of their team, Ryan Schiff (Vice President) & Ryan Burke (Assistant Museum Director), flew to the UK to package and ship the systems.
Soon enough, a delivery of bespoke sized pallets (made for the sizes of the machines) arrived at Creslow, and a huge delivery of packing material was delivered to my house (filling my lounge!):
The team arrived the next day and we set about planning how to package the machines, spares, consumables etc. safely and securely for their transatlantic voyage. The System Source chaps had procured and had delivered a steel strapping machine and a large amount of strapping which would be used to secure the machines to the pallets. This was coupled with moving blankets, cardboard corners, bubble wrap, packaging tape etc. etc. Soon enough we started loading machines onto the pallets:
When it came to the larger items, these presented a problem. The forklift truck available at Creslow doesn’t fit into the building because of the cage height, and the floor probably wouldn’t support its weight anyway. We therefore had to come up with a different solution. Cue the return of the ramp we built all of those years ago on a street in Nuremberg!
Yes, it still exists, and it had one final use moving IBM’s. It may have cost 150 euros in wood, but we’ve had our moneys worth!
Pretty quickly the 370 was loaded, strapped, and wrapped:
Now, the big question arrived. With a long, custom sized pallet, how do you move it? Two pallet trucks, one at each end, would’ve been possible but would’ve restricted where the machines could be placed. It was then we discovered that you can buy double length, wide fork pallet trucks. Dutifully the next day the System Source team went off to Pallet Truck World (yes, really) to acquire such an item:
This made moving everything about 100 times easier, and we could now shift the pallets around the room with ease.
So, next up was the first 360 CPU. This presented more of a challenge as the cables hanging under the system, which are wired directly into the backplane, meant we couldn’t use the ramp method. After scratching our heads for a few minutes we concocted a solution involving a car jack & a pile of wood:
Now this probably looks really sketchy, and thats because, like everything moving big iron related, it was. First, we jacked up the front of the machine to a height slightly above that of the pallet, and then wedged in some wood on the supporting rail. We then positioned the pallet under the front wheels of the CPU, and smacked out the wood. This enabled us to roll the machine forward onto the pallet as far as the angle of attack would allow, and we then jacked up the back of the machine and rolled it forward on the jack enabling us to locate it fully onto the pallet. This may sound slightly convoluted but it was actually a very quick operation, and by the third machine we were getting quite good at it!
Because the cables are hard wired into the CPU’s, we had to bundle them and cable tie them to the ends of the machines, later wrapping them in a significant amount of bubble wrap and blankets to protect them from crush risk:
We continued loading items throughout the next few days, using the same method each time:
For the exceptionally heavy item, the master tape drive, we decided to reinforce the pallet for extra security. This involved a trip to Wickes to buy some plywood (Wickes is no Bauhaus, trust me), which we then cut and secured to the pallet:
This enabled the loading of the nearly 1 tonne tape drive:
We then boxed and crated up the spares & consumables for easy shipping:
Some of the slightly more bizarre items we had acquired, like spare System 3 parts, were also palletised and used as support structures to ship other items such as loose pannels:
With all of the machines palletised and strapped down, we set about wrapping everything in bubble wrap, moving blankets, and pallet wrap:
We also cut and used pieces of 2×4 to box in the wheels so the machines wouldn’t move at all during transit:
Having started on the 10th of May, and finished packing everything on the 17th, it was time for the trucks. Because of the Francis Scott Key Bridge collapse at the Port of Baltimore, shipping had become a real challenge. It took the team several days to identify and engage with a shipping provider that could do the end to end move for a reasonable price. Eventually they did, and two trucks arrived to take the machines. I dutifully climbed into the forklift and loaded them one by one onto the trucks. Please don’t judge my forklift driving too harshly, at the time the brakes were… well, the less said the better.
With everything loaded up, the trucks departed and we waved goodbye to the machines as they’re off to their new home.
On October 18th System Source Museum will be holding a special gallery opening for the IBM 360’s, and I’m very happy to say that we’ll be in attendance to see them in their new home. We’re exceptionally pleased that we found somewhere that was not only willing to take the machines on a loan basis, but is going to display them to the public, restore them to working order, and use them as tools to educate future generations. It was a real pleasure working with the team from System Source on the project, and I’d like to extend to them my personal thanks for the highly professional and effective approach they’ve taken to the project.
I’ll write an update when we go to see the machines in their new home, and hopefully we’ll be able to keep updating the blog as they progress with their restoration.
Amazon Managed Streaming for Apache Kafka (Amazon MSK) is a fully managed service that makes it easy to build and run Kafka clusters on Amazon Web Services (AWS). When working with Amazon MSK, developers are interested in accessing the service locally. This allows developers to test their application with a Kafka cluster that has the same configuration as production and provides an identical infrastructure to the actual environment without needing to run Kafka locally.
This post presents a practical approach to accessing your Amazon MSK environment for development purposes through a bastion host using a Secure Shell (SSH) tunnel (a commonly used secure connection method). Whether you’re working with Amazon MSK Serverless, where public access is unavailable, or with provisioned MSK clusters that are intentionally kept private, this post guides you through the steps to establish a secure connection and seamlessly integrate your local development environment with your MSK resources.
Solution overview
The solution allows you to directly connect to the Amazon MSK Serverless service from your local development environment without using Direct Connect or a VPN. The service is accessed with the bootstrap server DNS endpoint boot-<<xxxxxx>>.c<<x>>.kafka-serverless.<<region-name>>.amazonaws.com on port 9098, then routed through an SSH tunnel to a bastion host, which connects to the MSK Serverless cluster. In the next step, let’s explore how to set up this connection.
The flow of the solution is as follows:
The Kafka client sends a request to connect to the bootstrap server
The DNS query for your MSK Serverless endpoint is routed to a locally configured DNS server
The locally configured DNS server routes the DNS query to localhost.
The SSH tunnel forwards all the traffic on port 9098 from the localhost to the MSK Serverless server through the Amazon Elastic Compute Cloud (Amazon EC2) bastion host.
The following image shows the architecture diagram.
Prerequisites
Before deploying the solution, you need to have the following resources deployed in your account:
For Windows users, install Linux on Windows with Windows Subsystem for Linux 2 (WSL 2) using Ubuntu 24.04. For guidance, refer to How to install Linux on Windows with WSL.
This guide assumes an MSK Serverless deployment in us-east-1, but it can be used in every AWS Region where MSK Serverless is available. Furthermore, we are using OS X as operating system. In the following steps replace msk-endpoint-url with your MSK Serverless endpoint URL with IAM authentication. The MSK endpoint URL has a format like boot-<<xxxxxx>>.c<<x>>.kafka-serverless.<<region-name>>.amazonaws.com.
Solution walkthrough
To access your Amazon MSK environment for development purposes, use the following walkthrough.
Configure local DNS server OSX
Install Dnsmasq as a local DNS server and configure the resolver to resolve the Amazon MSK. The solution uses Dnsmasq because it can compare DNS requests against a database of patterns and use these to determine the correct response. This functionality can match any request that ends in kafka-serverless.us-east-1.amazonaws.com and send 127.0.0.1 in response. Follow these steps to install Dnsmasq:
Update brew and install Dnsmasq using brew
brew up
brew install dnsmasq
Start the Dnsmasq service
sudo brew services start dnsmasq
Reroute all traffic for Serverless MSK (kafka-serverless.us-east-1.amazonaws.com) to 127.0.0.1
Now that you have a working DNS server, you can configure your operating system to use it. Configure the server to send only .kafka-serverless.us-east-1.amazonaws.com queries to Dnsmasq. Most operating systems that are similar to UNIX have a configuration file called /etc/resolv.conf that controls the way DNS queries are performed, including the default server to use for DNS queries. Use the following steps to configure the OS X resolver:
OS X also allows you to configure additional resolvers by creating configuration files in the /etc/resolver/ This directory probably won’t exist on your system, so your first step should be to create it:
sudo mkdir -p /etc/resolver
Create a new file with the same name as your new top-level domain (kafka-serverless.us-east-1.amazonaws.com) in the /etc/resolver/ directory and add 127.0.0.1 as a nameserver to it by entering the following command.
sudo tee /etc/resolver/kafka-serverless.us-east-1.amazonaws.com >/dev/null <<EOF
nameserver 127.0.0.1
EOF
Configure local DNS server Windows
In Windows Subsystem for Linux, first install Dnsmasq, then configure the resolver to resolve the Amazon MSK and finally add localhost as the first nameserver.
Update apt and install Dnsmasq using apt. Install the telnet utility for later tests:
The next step is to create the SSH tunnel, which will allow any connections made to localhost:9098 on your local machine to be forwarded over the SSH tunnel to the target Kafka broker. Use the following steps to create the SSH tunnel:
Replace bastion-host-dns-endpoint with the public DNS endpoint of the bastion host, which comes in the style of <<xyz>>.compute-1.amazonaws.com, and replace ec2-key-pair.pem with the key pair of the bastion host. Then create the SSH tunnel by entering the following command.
Leave the SSH tunnel running and open a new terminal window.
Test the connection to the Amazon MSK server by entering the following command.
telnet <<msk-endpoint-url>> 9098
The output should look like the following example.
Trying 127.0.0.1...
Connected to boot-<<xxxxxxxx>>.c<<x>>.kafka-serverless.us-east-1.amazonaws.com.
Escape character is '^]'.
Testing
Now configure the Kafka client to use IAM Authentication and then test the setup. You find the latest Kafka installation at the Apache Kafka Download site. Then unzip and copy the content of the Dafka folder into ~/kafka.
Download the IAM authentication and unpack it
cd ~/kafka/libs
wget https://github.com/aws/aws-msk-iam-auth/releases/download/v2.2.0/aws-msk-iam-auth-2.2.0-all.jar
cd ~
Configure Kafka properties to use IAM as the authentication mechanism
cat <<EOF > ~/kafka/config/client-config.properties

# Sets up TLS for encryption and SASL for authN.

security.protocol = SASL_SSL

# Identifies the SASL mechanism to use.

sasl.mechanism = AWS_MSK_IAM

# Binds SASL client implementation.

sasl.jaas.config = software.amazon.msk.auth.iam.IAMLoginModule required;


# Encapsulates constructing a SigV4 signature based on extracted credentials.

# The SASL client bound by "sasl.jaas.config" invokes this class.

sasl.client.callback.handler.class = software.amazon.msk.auth.iam.IAMClientCallbackHandler

EOF
Enter the following command in ~/kafka/bin to create an example topic. Make sure that the SSH tunnel created in the previous section is still open and running.
To remove the solution, complete the following steps for Mac users:
Delete the file /etc/resolver/kafka-serverless.us-east-1.amazonaws.com
Delete the entry address=/kafka-serverless.us-east-1.amazonaws.com/127.0.0.1 in the file $(brew --prefix)/etc/dnsmasq.conf
Stop the Dnsmasq service sudo brew services stop dnsmasq
Remove the Dnsmasq service sudo brew uninstall dnsmasq
To remove the solution, complete the following steps for WSL users:
Delete the file /etc/dnsmasq.conf
Delete the entry nameserver 127.0.0.1 in the file /etc/resolv.conf
Remove the Dnsmasq service sudo apt remove dnsmasq
Remove the telnet utility sudo apt remove telnet
Conclusion
In this post, I presented you with guidance on how developers can connect to Amazon MSK Serverless from local environments. The connection is done using an Amazon MSK endpoint through an SSH tunnel and a bastion host. This enables developers to experiment and test locally, without needing to setup a separate Kafka cluster.
About the Author
Simon Peyer is a Solutions Architect at Amazon Web Services (AWS) based in Switzerland. He is a practical doer and passionate about connecting technology and people using AWS Cloud services. A special focus for him is data streaming and automations. Besides work, Simon enjoys his family, the outdoors, and hiking in the mountains.
The Python community has been roiled, to a certain extent, by an action
taken by
the steering council (SC): the three-month suspension
of a unnamed—weirdly—Python core developer. Tim Peters is the developer
in question, as he has acknowledged,
though it could easily be deduced from the SC message. Peters has been
involved in the
project from its early days and, among many other things, is the author of PEP 20 (“The Zen of
Python”). The suspension was due to violations of the project’s code of
conduct that stem from the discussion around a somewhat controversial set
of proposed changes to the bylaws for the Python Software Foundation
(PSF) back in mid-June.
This blog post is co-written with Hardeep Randhawa and Abhay Kumar from HPE.
HPE Aruba Networking, formerly known as Aruba Networks, is a Santa Clara, California-based security and networking subsidiary of Hewlett Packard Enterprise company. HPE Aruba Networking is the industry leader in wired, wireless, and network security solutions. Hewlett-Packard acquired Aruba Networks in 2015, making it a wireless networking subsidiary with a wide range of next-generation network access solutions.
Aruba offers networking hardware like access points, switches, routers, software, security devices, and Internet of Things (IoT) products. Their large inventory requires extensive supply chain management to source parts, make products, and distribute them globally. This complex process involves suppliers, logistics, quality control, and delivery.
This post describes how HPE Aruba automated their Supply Chain management pipeline, and re-architected and deployed their data solution by adopting a modern data architecture on AWS.
Challenges with the on-premises solution
As the demand surged with time, it was imperative that Aruba build a sophisticated and powerful supply chain solution that could help them scale operations, enhance visibility, improve predictability, elevate customer experience, and drive sustainability. To achieve their vision of a modern, scalable, resilient, secure, and cost-efficient architecture, they chose AWS as their trusted partner due to the range of low-cost, scalable, and reliable cloud services they offer.
Through a commitment to cutting-edge technologies and a relentless pursuit of quality, HPE Aruba designed this next-generation solution as a cloud-based cross-functional supply chain workflow and analytics tool. The application supports custom workflows to allow demand and supply planning teams to collaborate, plan, source, and fulfill customer orders, then track fulfillment metrics via persona-based operational and management reports and dashboards. This also includes building an industry standard integrated data repository as a single source of truth, operational reporting through real time metrics, data quality monitoring, 24/7 helpdesk, and revenue forecasting through financial projections and supply availability projections. Overall, this new solution has empowered HPE teams with persona-based access to 10 full-scale business intelligence (BI) dashboards and over 350 report views across demand and supply planning, inventory and order management, SKU dashboards, deal management, case management, backlog views, and big deal trackers.
Overview of the solution
This post describes how HPE Aruba automated their supply chain management pipeline, starting from data migration from varied data sources into a centralized Amazon Simple Storage Service (Amazon S3) based storage to building their data warehouse on Amazon Redshift with the publication layer built on a third-party BI tool and user interface using ReactJS.
The following diagram illustrates the solution architecture.
In the following sections, we go through the key components in the diagram in more detail:
Aruba’s source repository includes data from three different operating regions in AMER, EMEA, and APJ, along with one worldwide (WW) data pipeline from varied sources like SAP S/4 HANA, Salesforce, Enterprise Data Warehouse (EDW), Enterprise Analytics Platform (EAP) SharePoint, and more. The data sources include 150+ files including 10-15 mandatory files per region ingested in various formats like xlxs, csv, and dat. Aruba’s data governance guidelines required that they use a single centralized tool that could securely and cost-effectively review all source files with multiple formats, sizes, and ingestion times for compliance before exporting them out of the HPE environment. To achieve this, Aruba first copied the respective files to a centralized on-premises staging layer.
2. Data migration
Aruba chose AWS Transfer Family for SFTP for secure and efficient file transfers from an on-premises staging layer to an Amazon S3 based landing zone. AWS Transfer Family seamlessly integrates with other AWS services, automates transfer, and makes sure data is protected with encryption and access controls. To prevent deduplication issues and maintain data integrity, Aruba customized these data transfer jobs to make sure previous transfers are complete before copying the next set of files.
3. Regional distribution
On average, Aruba transfers approximately 100 files, with total size ranging from 1.5–2 GB into the landing zone daily. The data volume increases each Monday with the weekly file loads and at the beginning of each month with the monthly file loads. These files follow the same naming pattern, with a daily system-generated timestamp appended to each file name. Each file arrives as a pair with a tail metadata file in CSV format containing the size and name of the file. This metadata file is later used to read source file names during processing into the staging layer.
The source data contains files from three different operating Regions and one worldwide pipeline that needs to be processed per local time zones. Therefore, separating the files and running a distinct pipeline for each was necessary to decouple and enhance failure tolerance. To achieve this, Aruba used Amazon S3 Event Notifications. With each file uploaded to Amazon S3, an Amazon S3 PUT event invokes an AWS Lambda function that distributes the source and the metadata files Region-wise and loads them into the respective Regional landing zone S3 bucket. To map the file with the respective Region, this Lambda function uses Region-to-file mapping stored in a configuration table in Amazon Aurora PostgreSQL-Compatible Edition.
4. Orchestration
The next requirement was to set up orchestration for the data pipeline to seamlessly implement the required logic on the source files to extract meaningful data. Aruba chose AWS Step Functions for orchestrating and automating their extract, transform, and load (ETL) processes to run on a fixed schedule. In addition, they use AWS Glue jobs for orchestrating validation jobs and moving data through the data warehouse.
They used Step Functions with Lambda and AWS Glue for automated orchestration to minimize the cloud solution deployment timeline by reusing the on-premises code base, where possible. The prior on-premises data pipeline was orchestrated using Python scripts. Therefore, integrating the existing scripts with Lambda within Step Functions and AWS Glue helped accelerate their deployment timeline on AWS.
5. File processing
With each pipeline running at 5:00 AM local time, the data is further validated, processed, and then moved to the processing zone folder in the same S3 bucket. Unsuccessful file validation results in the source files being moved to the reject zone S3 bucket directory. The following file validations are run by the Lambda functions invoked by the Step Functions workflow:
The Lambda function validates if the tail file is available with the corresponding source data file. When each complete file pair lands in the Regional landing zone, the Step Functions workflow considers the source file transfer as complete.
By reading the metadata file, the file validation function validates that the names and sizes of the files that land in the Regional landing zone S3 bucket match with the files on the HPE on-premises server.
6. Data quality checks
When the files land in the processing zone, the Step Functions workflow invokes another Lambda function that converts the raw files to CSV format followed by stringent data quality checks. The final validated CSV files are loaded into the temp raw zone S3 folder.
The data quality (DQ) checks are managed using DQ configurations stored in Aurora PostgreSQL tables. Some examples of DQ checks include duplicate data check, null value check, and date format check. The DQ processing is managed through AWS Glue jobs, which are invoked by Lambda functions from within the Step Functions workflow. A number of data processing logics are also integrated in the DQ flow, such as the following:
Flag-based deduplication – For specific files, when a flag managed in the Aurora configuration table is enabled, the process removes duplicates before processing the data
Pre-set values replacing nulls – Similarly, a preset value of 1 or 0 would imply a NULL in the source data based on the value set in the configuration table
7. Archiving processed files
When the CSV conversion is complete, the original raw files in the processing zone S3 folder are archived for 6 months in the archive zone S3 bucket folder. After 6 months, the files on AWS are deleted, with the original raw files retained in the HPE source system.
8. Copying to Amazon Redshift
When the data quality checks and data processing are complete, the data is loaded from the S3 temp raw zone into the curated zone on an Redshift provisioned cluster, using the COPY command feature.
9. Running stored procedures
From the curated zone, they use AWS Glue jobs, where the Redshift stored procedures are orchestrated to load the data from the curated zone into the Redshift publish zone. The Redshift publish zone is a different set of tables in the same Redshift provisioned cluster. The Redshift stored procedures process and load the data into fact and dimension tables in a star schema.
10. UI integration
Amazon OpenSearch Service is also integrated with the flow for publishing mass notifications to the end-users through the user interface (UI). The users can also send messages and post updates via the UI with the OpenSearch Service integration.
11. Code Deployment
Aruba uses AWS CodeCommit and AWS CodePipeline to deploy and manage a bi-monthly code release cycle, the frequency for which can be increased on-demand as per deployment needs. The release happens across four environments – Development, Testing, UAT and Production – deployed through DevOps discipline, thus enabling shorter turnaround time to ever-changing user requirements and upstream data source changes.
12. Security & Encryption
User access to the Aruba SC360 portal is managed via SSO with MFA authentication and data security managed via direct integration of the AWS solution with HPE IT’s unified access management API. All the data pipelines between HPE on-premises sources and S3 are encrypted for enhanced security.
13. Data Consumption
Aruba SC360 application provides a ‘Private Space’ feature to other BI/Analytics teams within HPE to run and manage their own data ingestion pipeline. This has been built using Amazon Redshift data sharing feature, which has enabled Aruba to securely share access to live data in their Amazon Redshift cluster, without manually moving or copying the data. Thus, the HPE internal teams could build their own data workloads on core Aruba SC360 data while maintaining data security and code isolation.
14. Final Steps
The data is finally fetched into the publication layer, which consists of a ReactJS-based user interface accessing the data in the Amazon publish zone using Spring Boot REST APIs. Along with data from the Redshift data warehouse, notifications updated in the OpenSearch Service tables are also fetched and loaded into the UI. Amazon Aurora PostgreSQL is used to maintain the configuration values for populating the UI. To build BI dashboards, Aruba opted to continue using their existing third-party BI tool due to its familiarity among internal teams.
Conclusion
In this post, we showed you how HPE Aruba Supply Chain successfully re-architected and deployed their data solution by adopting a modern data architecture on AWS.
The new solution has helped Aruba integrate data from multiple sources, along with optimizing their cost, performance, and scalability. This has also allowed the Aruba Supply Chain leadership to receive in-depth and timely insights for better decision-making, thereby elevating the customer experience.
To learn more about the AWS services used to build modern data solutions on AWS, refer to the AWS public documentation and stay up to date through the AWS Big Data Blog.
About the authors
Hardeep Randhawa is a Senior Manager – Big Data & Analytics, Solution Architecture at HPE, recognized for stewarding enterprise-scale programs and deployments. He has led a recent Big Data EAP (Enterprise Analytics Platform) build with one of the largest global SAP HANA/S4 implementations at HPE.
Abhay Kumar is a Lead Data Engineer in Aruba Supply Chain Analytics and manages the Cloud Infrastructure for the Application at HPE. With 11+ years of experience in the IT industry domains like banking, supply chain and Abhay has a strong background in Cloud Technologies, Data Analytics, Data Management, and Big Data systems. In his spare time, he likes reading, exploring new places and watching movies.
Ritesh Chaman is a Senior Technical Account Manager at Amazon Web Services. With 14 years of experience in the IT industry, Ritesh has a strong background in Data Analytics, Data Management, Big Data systems and Machine Learning. In his spare time, he loves cooking, watching sci-fi movies, and playing sports.
Sushmita Barthakur is a Senior Solutions Architect at Amazon Web Services, supporting Enterprise customers architect their workloads on AWS. With a strong background in Data Analytics and Data Management, she has extensive experience helping customers architect and build Business Intelligence and Analytics Solutions, both on-premises and the cloud. Sushmita is based out of Tampa, FL and enjoys traveling, reading and playing tennis.
Much has changed in the 2024 United States presidential election since the June 27 debate between Donald Trump and Joe Biden, then the presumptive nominees for the November election. Now, over two months later, on September 10, the debate was between Kamala Harris, the Democratic nominee, and Donald Trump, the Republican nominee. In this post, we will explore the event’s impact on Internet traffic in specific states where there was a bigger impact than during the Biden-Trump debate, as well as examine cyberattacks, email phishing trends, and general DNS data on candidates, news, and election-related activity.
Typically, we have observed that election days don’t come with significant changes to Internet traffic, and the same is true for debates. Yet, debates can also draw attention that impacts traffic, especially when there is heightened anticipation. The 2024 debates were not only aired on broadcast and cable television, but also streamed on platforms like YouTube, increasing their reach and impact.
Key takeaways:
The September 10 Harris-Trump debate caused bigger drops in Internet traffic in the US than the Biden-Trump debate on June 27.
There was also a noticeable increase in DNS traffic to both Kamala Harris-related and Donald Trump-related domains, with Trump-related DNS traffic peaking around the start of the debate and Harris-related DNS traffic peaking after the debate ended, around the time Taylor Swift announced she was endorsing Harris.
We also observed increases in DNS traffic to US news media outlets and election-related domains right after the debate ended.
Donald Trump remains the candidate with the most mentions in email subjects and the highest percentages of emails classified as spam (26.7%) and malicious (2.4%). Since mid-August, there has been a slight increase in the percentage of spam and malicious emails mentioning Kamala Harris.
Traffic drop in the US
During the September 10, 2024, debate between Harris and Trump, hosted by ABC News at 21:00 EST (01:00 UTC) in Philadelphia, Pennsylvania, Cloudflare noted a trend similar to the Biden-Trump debate, with a clear drop in nationwide Internet requests, falling as much as 9% below the same time a week prior at 21:15 EST (01:15 UTC). At the end of the debate, around 22:45 EST (02:45 UTC), the drop was less evident, at just 2%. Traffic increased slightly just after the debate.
Note: there were two four-minute breaks during the debate, at around 22:00 and 22:30, and our data here has 15-minute granularity.
There’s a clear difference between this second debate, with a drop of up to 9%, and the first one between Biden and Trump on June 27, when the traffic dropped just 2% below the same time a week prior. Interestingly, the biggest drop occurred at the same time in both debates, right after they started, at 21:15 EST (01:15 UTC).
Internet traffic dips across US states
Traffic shifts at the time of the debate, as compared to the previous week, can reveal more detail at a state-level perspective than at the country level. The map below summarizes traffic changes observed at a state level. A key observation is that traffic declines at a state level were much more pronounced during the Harris-Trump debate, than during the Biden-Trump debate in late June.
(Source: Cloudflare; created with Datawrapper)
The most significant traffic drops were observed in Vermont (-25%), Montana (-22%), and Idaho (-19%). More populous states such as California (-11%), Texas (-10%), and New York (-14%) also experienced notable declines in traffic.
Just for comparison, here’s the state map from that June 27 Biden-Trump debate:
(Source: Cloudflare; created with Datawrapper)
The initial minutes of the Harris-Trump debate triggered the largest traffic declines in most states, at least up until the first break, at around 21:30 ET (01:30 UTC).
In the next table, we provide a detailed breakdown of the same perspective shown on the US map ordered by the magnitude of the drop in traffic. We include the time of the biggest traffic drop compared to the previous week, at a 5-minute granularity, and also the percentage of the drop compared to the previous week. As noted above, the largest declines appeared to occur earlier in the debate.
State
Drop in traffic (%)
Local Time
UTC
Vermont
-25%
21:05 EDT
1:05
Montana
-22%
19:10 MDT
1:10
Idaho
-19%
19:10 MDT
1:10
Wyoming
-19%
19:15 MDT
1:15
North Dakota
-18%
20:15 CDT
1:15
Delaware
-15%
21:20 EDT
1:20
Illinois
-15%
20:20 CDT
1:20
Mississippi
-14%
20:05 CDT
1:05
New York
-14%
21:05 EDT
1:05
Rhode Island
-14%
21:45 EDT
1:45
West Virginia
-14%
21:15 EDT
1:15
Alabama
-13%
20:05 CDT
1:05
Georgia
-13%
21:20 EDT
1:20
South Carolina
-13%
21:15 EDT
1:15
Virginia
-13%
21:15 EDT
1:15
Colorado
-12%
19:45 MDT
1:45
Connecticut
-12%
21:05 EDT
1:05
Nevada
-12%
18:20 PDT
1:20
New Jersey
-12%
21:20 EDT
1:20
Alaska
-11%
17:15 AKDT
1:15
California
-11%
18:15 PDT
1:15
Florida
-11%
21:05 EDT
1:05
North Carolina
-11%
21:05 EDT
1:05
Wisconsin
-11%
20:20 CDT
1:20
Arkansas
-10%
20:05 CDT
1:05
District of Columbia
-10%
21:55 EDT
1:55
Missouri
-10%
20:25 CDT
1:25
Oregon
-10%
18:40 PDT
1:40
Pennsylvania
-10%
21:05 EDT
1:05
South Dakota
-10%
20:20 CDT
1:20
Texas
-10%
20:05 CDT
1:05
Maryland
-9%
21:20 EDT
1:20
Massachusetts
-9%
21:20 EDT
1:20
New Hampshire
-9%
21:05 EDT
1:05
Oklahoma
-9%
20:05 CDT
1:05
Arizona
-8%
18:15 MST
1:15
Indiana
-8%
21:05 EDT
1:05
Iowa
-8%
20:05 CDT
1:05
Kentucky
-8%
21:05 EDT
1:05
Maine
-8%
21:15 EDT
1:15
Nebraska
-8%
19:45 MDT
1:45
Kansas
-7%
20:25 CDT
1:25
Louisiana
-7%
20:20 CDT
1:20
Michigan
-7%
21:20 EDT
1:20
Minnesota
-7%
20:30 CDT
1:30
New Mexico
-7%
19:25 MDT
1:25
Washington
-7%
18:05 PDT
1:05
Hawaii
-6%
15:20 HST
1:20
Ohio
-6%
21:15 EDT
1:15
Tennessee
-6%
20:05 CDT
1:05
Utah
-6%
19:10 MDT
1:10
Swing state drops in traffic higher than first debate
The seven swing states that are said to be decisive in the election — Arizona, Georgia, Michigan, Nevada, North Carolina, Pennsylvania, and Wisconsin — each saw traffic drop between 8% and 13%, which is more than during the Biden-Trump debate (between 5% and 8% at that time). Here’s a more focused view of those swing states for easier visualization:
State
Drop in traffic
Local Time
UTC
Arizona
-8%
18:15 MST
1:15
Georgia
-13%
21:20 EDT
1:20
Michigan
-7%
21:20 EDT
1:20
Nevada
-12%
18:20 PDT
1:20
North Carolina
-11%
21:05 EDT
1:05
Pennsylvania
-10%
21:05 EDT
1:05
Wisconsin
-11%
20:20 CDT
1:20
DNS trends
Shifting our attention to domain trends, our 1.1.1.1 resolver data highlights a more targeted impact during and around the debate. Let’s start with Kamala Harris-related insights.
Harris and the Taylor Swift effect
Since July 21, the date of Biden’s withdrawal and endorsement of Harris, daily DNS traffic to Harris-related domains has significantly increased, with notable peaks on August 30 (the day after the Harris-Walz interview on CNN) and September 10 (the debate with Trump).
From an hourly perspective, the impact of the debate on Kamala Harris-related sites is evident, with increased DNS traffic throughout the day (September 10). The peak occurred at the debate’s start (21:00 ET / 01:00 UTC) with a 54% increase from the previous week, and again after it ended (23:00 ET / 03:00 UTC) with a 56% rise. This spike coincided with Taylor Swift’s endorsement of Kamala Harris.
Trump and the Elon Musk interview effect
Donald Trump, having a longer-standing campaign and websites compared to Kamala Harris, shows different trends. Aggregated daily DNS traffic to Trump-related domains has also increased in recent months. Significant peaks were observed on July 15 (two days after the assassination attempt), then during the Republican National Convention (August 19-22), with the highest spike occurring on August 12, following Elon Musk’s interview with Trump on X.
Hourly data shows the debate’s impact on Trump-related sites with a noticeable increase around the debate’s start (21:00 ET / 01:00 UTC), where DNS traffic was 46% higher than the previous week. This elevated traffic continued for a few hours, after the debate ended.
From news to election-related sites
Like previous US election-related events, the debate generated significant interest in US news organizations, leading to a rise in aggregated DNS traffic to general US news sites. This increase peaked during the debate at 22:00 ET (02:00 UTC), with DNS traffic 62% higher than the previous week. The elevated DNS traffic began before the debate and persisted afterward, with a 19% increase at 20:00 ET (00:00 UTC) and a 25% increase at 00:00 ET (04:00 UTC).
Microblogging social platforms like X or Threads outperformed their previous week’s traffic throughout the debate, peaking at 16% growth around 22:00 ET (02:00 UTC).
Additionally, there was a notable increase in DNS traffic to election-related websites, including official voting registration and election sites. During the morning of September 10 in the US, DNS traffic was 38% higher at 10:00 ET (14:00 UTC), with a significant spike at 23:00 ET (03:00 UTC) right after the debate, where DNS traffic surged by 76% compared to the previous week.
Harris-Trump: spam and malicious emails
From a cybersecurity perspective, trending events, topics, and individuals often attract more emails, including malicious, phishing, and spam messages. Our earlier analysis covered email trends involving “Joe Biden” and “Donald Trump” since January. We’ve since updated it to include Kamala Harris after the Democratic Convention.
From June 1, 2024, through August 21, Cloudflare’s Cloud Email Security service processed over 16 million emails that included the names “Donald Trump”, “Joe Biden”, or “Kamala Harris” in the subject, with 8.7 million referencing Trump, 4.8 million referencing Biden, and 3 million referencing Harris.
The chart below highlights a surge in emails mentioning Trump in mid-July, contrasting with a drop in the number of emails mentioning Biden in the subject and an increase in emails mentioning Harris.
Since July 21, following changes in the presumptive Democratic candidate, over 4.5 million emails mentioned “Donald Trump,” over 1.5 million mentioned “Joe Biden,” and around 2.8 million mentioned “Kamala Harris” in the subject. Of these, 26.7% of emails with Trump’s name were classified as spam, and 2.4% were classified as malicious. For Kamala Harris, 1.1% were classified as spam and 0.2% were classified as malicious, while Biden’s figures were 1.1% for spam and 0.1% for malicious.
Since mid-August, there has been a slight increase in the percentage of spam and malicious emails mentioning Kamala Harris. Trump remains the candidate with the most mentions in email subjects and the highest percentages of emails classified as spam and malicious.
September attacks on political and news sites
In our blog posts about several of the 2024 elections, we have noted that attacks on politically-related websites have remained a significant threat this year. In Europe, we’ve seen political parties and associated websites targeted around elections. We previously reported on DDoS attacks around the Republican National Convention and Democratic National Convention.
In our post about the Democratic National Convention, we showed that during late July and August, Cloudflare blocked DDoS attacks targeting three US politically related organizations, including a site associated with one of the major parties, with attacks occurring just before the Democratic Convention.
The largest DDoS attack recorded in recent days against politically-related websites targeted specifically a US political-party related website on September 4, peaking at 140,000 requests per second (rps) and lasting about 5 minutes.
But it’s not only US politically-related websites that could be the target of cyber attacks. News organizations are often attacked during relevant events, as we saw during the first year of the war in Ukraine, for example. Already in September, we’ve seen an example of a relevant US news organization that covers politics being the target of a DDoS attack on September 3, peaking at 343,000 requests per second (rps) and lasting about 5 minutes.
As highlighted in our Q2 DDoS report, most DDoS attacks are short-lived, as exemplified by the two mentioned attacks. Also, 81% of HTTP DDoS attacks peak at under 50,000 requests per second (rps), and only 7% reach between 100,000 and 250,000 rps. While a 140,000 rps attack might seem minor to Cloudflare, it can be devastating for websites not equipped to handle such high levels of traffic.
Conclusion
In this analysis of the Harris-Trump debate, we’ve observed that the September 10 debate caused bigger drops in traffic in the US than the Biden-Trump debate in late June. There was also a noticeable increase in DNS traffic to both Kamala Harris-related and Donald Trump-related domains, as well as to US news media outlets and election-related domains — in this case, right after the debate ended.
If you’re interested in more trends and insights about the Internet and elections, check out Cloudflare Radar, specifically our 2024 Elections Insights report. It will be updated throughout the year as elections (or election-related events) occur.
Security updates have been issued by AlmaLinux (389-ds:1.4, dovecot, emacs, and glib2), Fedora (bluez, iwd, libell, linux-firmware, seamonkey, vim, and wireshark), Mageia (apr, libtiff, Nginx, openssl, orc, unbound, webmin, and zziplib), Red Hat (389-ds:1.4), and SUSE (containerd, curl, go1.22, go1.23, gstreamer-plugins-bad, kernel, ntpd-rs, python-Django, and python311).
Today, we’re excited to expand our recent Unified Risk Posture announcement with more information on our latest integrations with CrowdStrike. We previously shared that our CrowdStrike Falcon Next-Gen SIEM integration allows for deeper analysis and further investigations by unifying first- and third-party data, native threat intelligence, AI, and workflow automation to allow your security teams to focus on work that matters.
This post explains how Falcon Next-Gen SIEM allows customers to identify and investigate risky user behavior and analyze data combined with other log sources to uncover hidden threats. By combining Cloudflare and CrowdStrike, organizations are better equipped to manage risk and decisively take action to stop cyberattacks.
By leveraging the combined capabilities of Cloudflare and CrowdStrike, organizations combine Cloudflare’s email security and zero trust logging capabilities with CrowdStrike’s dashboards and custom workflows to get better visibility into their environments and remediate potential threats. Happy Cog, a full-service digital agency, currently leverages the integration. Co-Founder and President Matthew Weinberg said: ‘The integration of Cloudflare’s robust Zero Trust capabilities with CrowdStrike Falcon Next-Gen SIEM enables organizations to gain a more comprehensive view of the threat landscape and take action to mitigate both internal and external risks posed by today’s security challenges.’
Cloudflare Email Security with Falcon Next-Gen SIEM
With Cloudflare Email Security’s configurable policies, organizations can now push indicators of compromise (IoC) alerts to Falcon Next-Gen SIEM, notifying analysts about suspicious activity, such as a user engaging with a phishing email. By proactively alerting analysts when suspicious activity is detected, Cloudflare and CrowdStrike can provide early detection of account compromises or insider threats.
Cloudflare Zero Trust Logs with Falcon Next-Gen SIEM
We are also integrating Cloudflare’s Zero Trust platform with Falcon Next-Gen SIEM. This allows our mutual customers to push Cloudflare Zero Trust logs from Cloudflare Access and Cloudflare Gateway to Falcon Next-Gen SIEM for better visualization, analysis, and remediation. This integration allows Cloudflare logs to be used to customize and enhance Falcon Next-Gen SIEM detections and trigger CrowdStrike workflows to automatically configure a response action. An example workflow: based on a new detection of a user’s access request being deemed fraudulent, or if a user is engaging with risky websites, the Falcon platform can trigger Cloudflare to move users to affected user groups and apply adaptive access control policies, such as access isolating or quarantining the user.
How To Get Started
To connect Cloudflare Zero Trust logs, start with the Falcon Next-Gen SIEM module. Navigate to the Data Connectors tab of your Falcon Next-Gen SIEM dashboard and select the Cloudflare Data Connector.
Give the connector a name and select “Save”, and you will receive two pieces of information: an API key and an API URL. Be sure to make note of the key, as it will only be shown once.
Next, in Cloudflare, create an HTTP logpush job via API, and format the “destination_conf” field as follows:
<DATASET> follows a dot delimited syntax, so http_requests becomes http.requests
Once the job is created and active, you will start to see events populating in the My Connectors section of your Falcon dashboard. Once Cloudflare data is populated in Falcon Next-Gen SIEM, you can now search events and create Falcon Fusion SOAR automation workflows and correlation rules, all based on Cloudflare log events.
In Summary
Together, CrowdStrike and Cloudflare’s shared telemetry will further decrease the mean time to containment and expedite any organization’s ability to decisively respond to risks within their environment. The two platforms work together as one, allowing organizations to block suspicious activity and deliver high-fidelity alerts to security analysts for further investigation.
To learn more about these integrations, feel free to reach out to us to get started with a consultation. We can discuss your existing environment and ensure that you are best equipped to achieve better visibility and remediation in the face of emerging threats.
New research evaluating the effectiveness of reward modeling during Reinforcement Learning from Human Feedback (RLHF): “SEAL: Systematic Error Analysis for Value ALignment.” The paper introduces quantitative metrics for evaluating the effectiveness of modeling and aligning human values:
Abstract: Reinforcement Learning from Human Feedback (RLHF) aims to align language models (LMs) with human values by training reward models (RMs) on binary preferences and using these RMs to fine-tune the base LMs. Despite its importance, the internal mechanisms of RLHF remain poorly understood. This paper introduces new metrics to evaluate the effectiveness of modeling and aligning human values, namely feature imprint, alignment resistance and alignment robustness. We categorize alignment datasets into target features (desired values) and spoiler features (undesired concepts). By regressing RM scores against these features, we quantify the extent to which RMs reward them a metric we term feature imprint. We define alignment resistance as the proportion of the preference dataset where RMs fail to match human preferences, and we assess alignment robustness by analyzing RM responses to perturbed inputs. Our experiments, utilizing open-source components like the Anthropic preference dataset and OpenAssistant RMs, reveal significant imprints of target features and a notable sensitivity to spoiler features. We observed a 26% incidence of alignment resistance in portions of the dataset where LM-labelers disagreed with human preferences. Furthermore, we find that misalignment often arises from ambiguous entries within the alignment dataset. These findings underscore the importance of scrutinizing both RMs and alignment datasets for a deeper understanding of value alignment.
Тази седмица се навършиха 80 години от преврата на 9 септември 1944 г., който вкарва България за 45 години в групата на тоталитарните социалистически държави. И макар тоталитарният режим да падна преди 35 години, белезите от него още са налице. Тези белези са не само видими, като панелните блокове и спорните паметници на Съветската армия – те са в манталитета, ценностите, институциите. Накратко – в културата.
Културата не се променя с магическа пръчка. Особено трудно се променя образованието. А то, от своя страна, е основен инструмент за възпроизводство на културата.
Хомофобският образователен хаос, който депутатите сътвориха
Новата учебна година ще започне с една голяма крачка към антидемократичното минало (а може би и бъдеще). Става въпрос за поправката в Закона за предучилищното и училищното образование, според която се забранява извършването на „пропаганда, популяризиране или подстрекаване по какъвто и да е начин, пряко или косвено, на идеи и възгледи, свързани с нетрадиционна сексуална ориентация и/или определяне на полова идентичност, различна от биологичната“.
Поправката, предложена не за първи път от „Възраждане“, беше приета от парламента на 7 август в спешен порядък и с решаващата подкрепа на ГЕРБ. Двете четения на законопроекта се състояха в един и същи ден, въпреки че обичайната практика е между тях да има поне няколко седмици.
Формулировката е толкова широка, че на практика всичко, свързано с ЛГБТИ (лесбийки, гей мъже, бисексуални, транс и интерсекс хора) в училище може да попадне под ударите на закона. Включително родители, които са в еднополови връзки, учители, които се опитват да се справят с хомофобски тормоз над ученици, или пък ученици, които носят обички в цветовете на дъгата. Или дори тениска с обложката на The Dark Side of the Moon, ако допуснем, че в училището им не знаят за този албум на Pink Floyd.
Изобщо, потенциалът за лов на вещици е огромен. И то без да се има предвид самото учебно съдържание, в което на практика няма теми, свързани с ЛГБТИ. Като изключим учебника по биология за IХ клас на издателство „Анубис“, в който се споменават реалните факти: че в юношеска възраст е възможно „осъзнаването на сексуално влечение към същия пол“, а в зряла – „изграждането на трайни връзки с партньор от другия или от същия пол“.
Преследването на работещи в училищната система впрочем започна още през лятната ваканция с инициативата на варненската организация на „Възраждане“ срещу педагогически специалисти от Варна, включили се в подписката срещу поправката.
Образователна система, която учи да не мислиш
Но и без въведената с поправка в закона цензура българското училищно образование е застинало в ХХ век. И особено в начина, по който късният социализъм идеализира 70-те години на ХIХ век, тоест времето на Априлското въстание и Освобождението на България от османското владичество.
Въпреки че много учители правят всичко по силите си да преподават по начин, адекватен на съвременния живот, самите образователни изисквания предпоставят развитието не на критично мислене, а на възпроизвеждане на понятия, факти и интерпретации. Това е и една от основните констатации след всяко издание на Програмата за международно оценяване на учениците (PISA). Липсата на функционална грамотност означава неспособност за разбиране и прилагане на наученото.
На изпитите за външно оценяване например учениците трябва да знаят какво значи „метонимия“, „синекдоха“ или „условно наклонение“, но от тях не се иска да могат да ги използват по адекватен начин. Докато в един съвременен учебник по западен език, издаден от съответната държава, от учениците няма да се очаква да знаят дефиницията на условното наклонение, а да го приложат – като например отправят учтива молба („Би ли ми подал чашата?“) или изразят нереалистично желание („Ако имах криле, бих прелетяла над града.“).
Представете си само някой ученик да изложи аргументация защо дадено произведение на Иван Вазов не му харесва. Ако има късмета учителят му да насърчава самостоятелното мислене, ще му се размине. Но със сигурност не е желателно да защитава подобни тези на изпит за външно оценяване.
Същото важи и за каноничните исторически интерпретации. Ако ученикът например се опита да докаже, че на голяма част от българите си им е било добре в Османската империя и не са искали да се освобождават, може да си има сериозни проблеми.
А Вазов си е имал критици, например доктор Кръстьо Кръстев и Пенчо Славейков от кръга „Мисъл“. Тезата, че съвсем не цялото българско население е искало да се освобождава от османската власт, се застъпва от изследователи като Захари Стоянов и Иван Хаджийски. Днес на Пенчо Славейков, Захари Стоянов и Иван Хаджийски има кръстени училища, но позициите на техните патрони не водят до плурализъм в интерпретациите на учебното съдържание в същите тези училища.
Олимпийско възмущение и гордо бетониране
Бетонирането на литературни, исторически и културни канони логично води до неспособност за критическа дистанция към културно-историческото наследство. Това е предпоставка толкова хора в България да се възмутят от откриването на Олимпиадата в Париж. Присъствието на куиър хора и сцената, погрешно асоциирана със стенописа на Леонардо да Винчи „Тайната вечеря“, предизвикаха най-голямо възмущение. Но за мнозина цялата концепция на откриването си беше скандална. Или най-малкото – неприемлива.
По време на няколкочасовия спектакъл зрителите видяха отрязаната глава на Мария Антоанета да пее, „Мона Лиза“ да се носи по Сена. Децата, плъховете и черепите в парижкото метро са намигване към „Клетниците“ на Виктор Юго и „клоаката на Париж“, която той описва в романа. Това са само малка част от препратките, демонстриращи свободно и иронично отношение към френското културно-историческо наследство.
Представете си сега откриване на хипотетична олимпиада в България, на което се представя как Христо Ботев играе брейк на кораба „Радецки“. Щафетата на олимпийския огън си предават Мунчо, дядо Йоцо и баба Илийца, а копие на „Мома с ябълки“ на Майстора плува по Перловската река. Орфей свири метъл, а тримата глупаци се черпят, сипвайки си гроздова ракия в съдовете от Панагюрското златно съкровище. Дори само мисълта за нещо подобно изглежда светотатствена.
Френската култура, разбира се, е твърде различна от българската и не можем да очакваме нашата да прилича на нея. По-скоро става въпрос за две противоположни нагласи. В единия край е способността да се надсмиваш на всичко, дори на себе си. Включително (и особено) когато се опитваш да се представиш в най-добрата си светлина пред целия свят. В другия край е болезнената потребност да бъдеш велик и да те възприемат сериозно – според собствената ти величава представа за себе си.
Между тези два полюса се разполага пространство на нарастваща (или намаляваща – зависи откъде гледате) способност за критическа дистанция. България обаче все повече се бетонира в героично-сериозния и некритичен полюс. Може да не сме първенци по функционална грамотност, да сме с най-ниските минимални заплати в Европейския съюз и да ходим на парламентарни избори седем пъти за три години, но сме велики и горди.
Междувременно българските ученици се опитват да оцелеят въпреки образователната система. Които от тях могат, ще продължат образованието, а може би и живота си в страни, в които „нетрадиционната“ сексуална ориентация и половата идентичност, „различна от биологичната“, не са обявени за опасност за децата. А в България всеки опит за модернизиране на образователната система ще угасва след поредната обществена истерия в стил „махат Вазов“, „махат Ботев“ и „опорочават българската история“.
At a workshop for the study, teachers collaborated to identify adaptations to Computing lessons
We used a set of ten areas of opportunity to scaffold and prompt teachers to look for ways that Computing resources could be adapted, including making changes to the content or the context of lessons, and using pedagogical techniques such as collaboration and open-ended tasks.
Today’s blog lays out our findings about how teachers can bring students’ identities into the classroom as an entry point for culturally responsive Computing teaching.
Collaborating with teachers
A group of twelve primary teachers, from schools spread across England, volunteered to participate in the study. The primary objective was for our research team to collaborate with these teachers to adapt two units of work about creating digital images and vector graphics so that they better aligned with the cultural contexts of their students. The research team facilitated an in-person, one-day workshop where the teachers could discuss their experiences and work in small groups to adapt materials that they then taught in their classrooms during the following term.
A shared focus on identity
As the workshop progressed, an interesting pattern emerged. Despite the diversity of schools and student populations represented by the teachers, each group independently decided to focus on the theme of identity in their adaptations. This was not a directive from the researchers, but rather a spontaneous alignment of priorities among the teachers.
An example of an adapted Computing activity to create a vector graphic emoji.
The focus on identity manifested in various ways. For some teachers, it involved adding diverse role models so that students could see themselves represented in computing, while for others, it meant incorporating discussions about students’ own experiences into the lessons. However, the most compelling commonality across all groups was the decision to have students create a digital picture that represented something important about themselves. This digital picture could take many forms — an emoji, a digital collage, an avatar to add to a game, or even creating fantastical animals. The goal of these activities was to provide students with a platform to express aspects of their identity that were significant to them whilst also practising the skills to manipulate vector graphics or digital images.
Funds of identity theory
After the teachers had returned to their classrooms and taught the adapted lessons to their students, we analysed the digital pictures created by the students using funds of identity theory. This theory explains how our personal experiences and backgrounds shape who we are and what makes us unique and individual, and argues that our identities are not static but are continuously shaped and reshaped through interactions with the world around us.
Funds of identity framework, drawing on work by Esteban-Guitart and Moll (2014) and Poole (2017).
In the context of our study, this theory argues that students bring their funds of identity into their Computing classrooms, including their cultural heritage, family traditions, languages, values, and personal interests. Through the image editing and vector graphics activities, students were able to create what the funds of identity theory refers to as identity artefacts. This allowed them to explore and highlight the various elements that hold importance in their lives, illuminating different facets of their identities.
Students’ funds of identity
The use of the funds of identity theory provided a robust framework for understanding the digital artefacts created by the students. We analysed the teachers’ descriptions of the artefacts, paying close attention to how students represented their identities in their creations.
1. Personal interests and values
One significant aspect of the analysis centered around the personal interests and values reflected in the artefacts. Some students chose to draw on their practical funds of identity and create images about hobbies that were important to them, such as drawing or playing football. Others focused on existential funds of identity and represented values that were central to their personalities, such as cool, chatty, or quiet.
2. Family and community connections
Many students also chose to include references to their family and community in their artefacts. Social funds of identity were displayed when students featured family members in their images. Some students also drew on their institutional funds, adding references to their school, or geographical funds, by showing places such as the local area or a particular country that held special significance for them. These references highlighted the importance of familial and communal ties in shaping the students’ identities.
3. Cultural representation
Another common theme was the way students represented their cultural backgrounds. Some students chose to highlight their cultural funds of identity, creating images that included their heritage, including their national flag or traditional clothing. Other students incorporated ideological aspects of their identity that were important to them because of their faith, including Catholicism and Islam. This aspect of the artefacts demonstrated how students viewed their cultural heritage as an integral part of their identity.
Implications for culturally responsive Computing teaching
The findings from this study have several important implications. Firstly, the spontaneous focus on identity by the teachers suggests that identity is a powerful entry point for culturally responsive Computing teaching. Secondly, the application of the funds of identity theory to the analysis of student work demonstrates the diverse cultural resources that students bring to the classroom and highlights ways to adapt Computing lessons in ways that resonate with students’ lived experiences.
An example of an identity artefact made by one of the students in the culturally adapted lesson on vector graphics.
However, we also found that teachers often had to carefully support students to illuminate their funds of identity. Sometimes students found it difficult to create images about their hobbies, particularly if they were from backgrounds with fewer social and economic opportunities. We also observed that when teachers modelled an identity artefact themselves, perhaps to show an example for students to aim for, students then sometimes copied the funds of identity revealed by the teacher rather than drawing on their own funds. These points need to be taken into consideration when using identity artefact activities.
Finally, these findings relate to lessons about image editing and vector graphics that were taught to students aged 8- to 10-years old in England, and it remains to be explored how students in other countries or of different ages might reveal their funds of identity in the Computing classroom.
Moving forward with cultural responsiveness
The study demonstrated that when Computing teachers are given the opportunity to collaborate and reflect on their practice, they can develop innovative ways to make their teaching more culturally responsive. The focus on identity, as seen in the creation of identity artefacts, provided students with a platform to express themselves and connect their learning to their own lives. By understanding and valuing the funds of identity that students bring to the classroom, teachers can create a more equitable and empowering educational experience for all learners.
We would like to thank all the researchers who worked on this project, including our collaborations with Lynda Chinaka from the University of Roehampton, and Alex Hadwen-Bennett from King’s College London. Finally, we are grateful to Cognizant for funding this academic research, and to the cohort of primary Computing teachers for their enthusiasm, energy, and creativity, and their commitment to this project.
The Prometheus Team is proud to announce the availability of Prometheus Version 3.0-beta!
You can download it here.
As is traditional with a beta release, we do not recommend users install Prometheus 3.0-beta on critical production systems, but we do want everyone to test it out and find bugs.
In general, the only breaking changes are the removal of deprecated feature flags. The Prometheus team worked hard to ensure backwards-compatibility and not to break existing installations, so all of the new features described below build on top of existing functionality. Most users should be able to try Prometheus 3.0 out of the box without any configuration changes.
With over 7500 commits in the 7 years since Prometheus 2.0 came out there are too many new individual features and fixes to list, but there are some big shiny and breaking changes we wanted to call out. We need everyone in the community to try them out and report any issues you might find.
The more feedback we get, the more stable the final 3.0 release can be.
New UI
One of the highlights in Prometheus 3.0 is its brand new UI that is enabled by default:
The UI has been completely rewritten with less clutter, a more modern look and feel, new features like a PromLens-style tree view, and will make future maintenance easier by using a more modern technical stack.
Learn more about the new UI in general in Julius’ detailed article on the PromLabs blog.
Users can temporarily enable the old UI by using the old-ui feature flag.
Since the new UI is not battle-tested yet, it is also very possible that there are still bugs. If you find any, please report them on GitHub.
Remote Write 2.0
Remote-Write 2.0 iterates on the previous protocol version by adding native support for a host of new elements including metadata, exemplars, created timestamp and native histograms. It also uses string interning to reduce payload size and CPU usage when compressing and decompressing. More details can be found here.
OpenTelemetry Support
Prometheus intends to be the default choice for storing OpenTelemetry metrics, and 3.0 includes some big new features that makes it even better as a storage backend for OpenTelemetry metrics data.
UTF-8
By default, Prometheus will allow all valid UTF-8 characters to be used in metric and label names, as well as label values as has been true in version 2.x.
Users will need to make sure their metrics producers are configured to pass UTF-8 names, and if either side does not support UTF-8, metric names will be escaped using the traditional underscore-replacement method. PromQL queries can be written with the new quoting syntax in order to retrieve UTF-8 metrics, or users can specify the __name__ label name manually.
Not all language bindings have been updated with support for UTF-8 but the primary Go libraries have been.
OTLP Ingestion
Prometheus can be configured as a native receiver for the OTLP Metrics protocol, receiving OTLP metrics on the /api/v1/otlp/v1/metrics endpoint.
Native Histograms
Native histograms are a Prometheus metric type that offer a higher efficiency and lower cost alternative to Classic Histograms. Rather than having to choose (and potentially have to update) bucket boundaries based on the data set, native histograms have pre-set bucket boundaries based on exponential growth.
Native Histograms are still experimental and not yet enabled by default, and can be turned on by passing --enable-feature=native-histograms. Some aspects of Native Histograms, like the text format and accessor functions / operators are still under active design.
Other Breaking Changes
The following feature flags have been removed, being enabled by default instead. References to these flags should be removed from configs, and will be ignored in Prometheus starting with version 3.0
promql-at-modifier
promql-negative-offset
remote-write-receiver
no-scrape-default-port
new-service-discovery-manager
Range selections are now left-open and right-closed, which will avoid rare occasions that more points than intended are included in operations.
Agent mode is now stable and has its own config flag instead of a feature flag
Microsoft is addressing 79 vulnerabilities this September 2024 Patch Tuesday. Microsoft has evidence of in-the-wild exploitation and/or public disclosure for four of the vulnerabilities published today; at time of writing, all four are listed on CISA KEV. Microsoft is also patching four critical remote code execution (RCE) vulnerabilities today. Unusually, Microsoft has not patched any browser vulnerabilities yet this month.
Servicing Stack: Windows 10 1507 rollback zero-day RCE
At first glance, the most concerning of today’s exploited-in-the-wild vulnerabilities is CVE-2024-43491, which describes a pre-auth RCE vulnerability caused by a regression in the Windows Servicing Stack that has rolled back fixes for a number of previous vulnerabilities affecting optional components.
The CVSSv3.1 base score is 9.8, which is typically not good news. However, things aren’t quite as bad as they seem: the key takeaway here is that only Windows 10, version 1507 (Windows 10 Enterprise 2015 LTSB and Windows 10 IoT Enterprise 2015 LTSB) is affected. Also, Microsoft notes that while at least some of the accidentally unpatched vulnerabilities were known to be exploited, they haven’t seen in-the-wild exploitation of CVE-2024-43491 itself, and the defect was discovered by Microsoft. All in all, while there are certainly more than a few organizations out there still running Windows 10 1507, most admins can breathe a sigh of relief on this one, and then go back to worrying about everything else.
The Servicing Stack regression described by CVE-2024-43491 was introduced in the March 2024 patches. Those nostalgic few still running Windows 10 1507 should note that patches are required for both Servicing Stack and the regular Windows OS patch released today, and must be applied in that order. Microsoft does not specify which vulnerabilities were accidentally unpatched back in March, although there is a significant list of affected optional components at the end of the FAQ, so potentially the set of vulnerabilities in play is quite long. Given time, an enthusiastic data miner could no doubt come up with a list of likely suspects.
Microsoft does also provide a high-level explanation of what went wrong: the build number of the March 2024 security patch for 1507 triggered a latent code defect in the Servicing Stack, and any optional component which was updated during this time was downgraded to the RTM version. This might sound eerily similar to the Windows OS downgrade attacks disclosed at Black Hat USA 2024 last month, but there’s not obviously any substantial connection between the two. It’s quite likely that someone at Microsoft HQ is carefully reviewing other Windows versions for similar version range-based flaws in the Servicing Stack.
The Mark-of-the-Web (MotW) security feature bypass CVE-2024-38217 is not only known to be exploited, but is also publicly disclosed via an extensive write-up which names the technique “LNK stomping” and highlights that exploitation will typically involve explorer.exe overwriting an existing LNK file. The write-up also links to exploit code on GitHub. Beyond that, the discoverer points to VirusTotal samples going back as far as 2018 to make the case that this has been abused for a very long time indeed.
As is generally the case with MotW bypass vulnerabilities, exploitation occurs when a user downloads and opens a specially-crafted malicious file, which could then bypass the SmartScreen Application Reputation security check and/or the legacy Windows Attachment Services security prompt.
Windows Installer: zero-day EoP
Next up in today’s foursome of exploited-in-the-wild vulnerabilities is CVE-2024-38014: an elevation of privilege vulnerability in Windows Installer. The middling CVSSv3.1 base score of 7.8 lines up with Microsoft’s severity assessment of Important rather than Critical. Exploitation grants code execution as SYSTEM, and although the attack vector is local, this might be at least slightly attractive to malware authors, since both attack complexity and privilege requirements are low, and no user interaction is required.
In this case, CWE-269: Improper Privilege Management presumably describes a means of causing the Windows Installer to be over-generous with the privileged access it requires to install software and configure the OS. All current versions of Windows receive a fix, as well as Server 2008, which Microsoft persists in patching from time to time out of the goodness of its heart, even if the end of official support was almost a year ago now.
Microsoft Publisher: zero-day macro policy bypass
It’s been a little while since we talked about Microsoft Publisher, so today’s publication of CVE-2024-38226 — a local security feature bypass for Office macro policy — gives us a chance to do that. The Preview Pane is not involved, and the description of exploit methodology in the FAQ is welcome, but somewhat unusual: an attacker must not only convince a user to download and open a malicious file, but the attacker must also be authenticated on the system itself, although the FAQ does not explain further.
Moving past those vulnerabilities which are known to be exploited or disclosed already, we see three critical RCE vulns: two in SharePoint, and one in the Windows NAT implementation.
SharePoint: two critical RCEs
Network-vector exploitation of SharePoint RCE CVE-2024-38018 requires that an attacker have Site Member permissions already, but since those aren’t exactly the crown jewels, attack complexity is low, and no user interaction is required, Microsoft very reasonably rates this as Critical on its own proprietary severity scale, and expects that exploitation is more likely.
The second SharePoint critical RCE patched this month is CVE-2024-43464, which describes a deserialization of untrusted data leading to code execution in the context of the SharePoint Server via specially-crafted API calls after uploading a malicious file; one mitigating factor is that the attacker must already have Site Owner permissions or better. This all sounds very similar to CVE-2024-30044, which Rapid7 wrote about back in May 2024.
Windows NAT: critical RCE
Rounding out this month’s critical RCE vulnerabilities is CVE-2024-38119, which describes a use after free flaw in the Windows NAT implementation. Attack vector is listed as adjacent, so an attacker would need an existing foothold on the same network as the target asset before winning a race condition, which bumps up the attack complexity to high. Even though this looks to be pre-auth RCE, Microsoft lists exploitation as less likely. For reasons unknown, Server 2012/2012 R2 does not receive a patch, although all newer supported versions of Windows do.
Exchange: nothing, still?
After a busy couple of months back in March and April 2024, it’s been all quiet on the Exchange front for quite some time, and this month extends that curiously lucky streak.
Microsoft lifecycle update
There are no significant changes to Microsoft product lifecycle during September 2024, although anyone responsible for Azure Database for MySQL – Single Server has until the sunset date of 2024-09-16 to migrate to a supported service to avoid involuntary forced-migration and server unavailability.
As Rapid7 noted last month, Visual Studio for Mac received its last ever patches on 2024-08-31. Also on 2024-08-31, a number of legacy Azure services reached retirement, including Azure Cache for Redis on Cloud Services (Classic).
October will see significant lifecycle changes for Windows 11: release end date for the 21H2 versions of Windows 11 Enterprise and Education, as well as release end date for 22H2 versions for other Windows 11 editions. Fans of legacy software will already know that Server 2012 and 2012 R2 move into year two of the cash-for-updates Extended Security Update program in October.
Pushy is Netflix’s WebSocket server that maintains persistent WebSocket connections with devices running the Netflix application. This allows data to be sent to the device from backend services on demand, without the need for continually polling requests from the device. Over the last few years, Pushy has seen tremendous growth, evolving from its role as a best-effort message delivery service to be an integral part of the Netflix ecosystem. This post describes how we’ve grown and scaled Pushy to meet its new and future needs, as it handles hundreds of millions of concurrent WebSocket connections, delivers hundreds of thousands of messages per second, and maintains a steady 99.999% message delivery reliability rate.
History & motivation
There were two main motivating use cases that drove Pushy’s initial development and usage. The first was voice control, where you can play a title or search using your virtual assistant with a voice command like “Show me Stranger Things on Netflix.” (See How to use voice controls with Netflix if you want to do this yourself!).
If we consider the Alexa use case, we can see how this partnership with Amazon enabled this to work. Once they receive the voice command, we allow them to make an authenticated call through apiproxy, our streaming edge proxy, to our internal voice service. This call includes metadata, such as the user’s information and details about the command, such as the specific show to play. The voice service then constructs a message for the device and places it on the message queue, which is then processed and sent to Pushy to deliver to the device. Finally, the device receives the message, and the action, such as “Show me Stranger Things on Netflix”, is performed. This initial functionality was built out for FireTVs and was expanded from there.
Sample system diagram for an Alexa voice command. Where aws ends and the internet begins is an exercise left to the reader.
The other main use case was RENO, the Rapid Event Notification System mentioned above. Before the integration with Pushy, the TV UI would continuously poll a backend service to see if there were any row updates to get the latest information. These requests would happen every few seconds, which ended up creating extraneous requests to the backend and were costly for devices, which are frequently resource constrained. The integration with WebSockets and Pushy alleviated both of these points, allowing the origin service to send row updates as they were ready, resulting in lower request rates and cost savings.
For more background on Pushy, you can see this InfoQ talk by Susheel Aroskar. Since that presentation, Pushy has grown in both size and scope, and this article will be discussing the investments we’ve made to evolve Pushy for the next generation of features.
Client Reach
This integration was initially rolled out for Fire TVs, PS4s, Samsung TVs, and LG TVs, leading to a reach of about 30 million candidate devices. With these clear benefits, we continued to build out this functionality for more devices, enabling the same efficiency wins. As of today, we’ve expanded our list of candidate devices even further to nearly a billion devices, including mobile devices running the Netflix app and the website experience. We’ve even extended support to older devices that lack modern capabilities, like support for TLS and HTTPS requests. For those, we’ve enabled secure communication from client to Pushy via an encryption/decryption layer on each, allowing for confidential messages to flow between the device and server.
Scaling to handle that growth (and more)
Growth
With that extended reach, Pushy has gotten busier. Over the last five years, Pushy has gone from tens of millions of concurrent connections to hundreds of millions of concurrent connections, and it regularly reaches 300,000 messages sent per second. To support this growth, we’ve revisited Pushy’s past assumptions and design decisions with an eye towards both Pushy’s future role and future stability. Pushy had been relatively hands-free operationally over the last few years, and as we updated Pushy to fit its evolving role, our goal was also to get it into a stable state for the next few years. This is particularly important as we build out new functionality that relies on Pushy; a strong, stable infrastructure foundation allows our partners to continue to build on top of Pushy with confidence.
Throughout this evolution, we’ve been able to maintain high availability and a consistent message delivery rate, with Pushy successfully maintaining 99.999% reliability for message delivery over the last few months. When our partners want to deliver a message to a device, it’s our job to make sure they can do so.
Here are a few of the ways we’ve evolved Pushy to handle its growing scale.
A few of the related services in Pushy’s immediate ecosystem and the changes we’ve made for them.
Message processor
One aspect that we invested in was the evolution of the asynchronous message processor. The previous version of the message processor was a Mantis stream-processing job that processed messages from the message queue. It was very efficient, but it had a set job size, requiring manual intervention if we wanted to horizontally scale it, and it required manual intervention when rolling out a new version.
It served Pushy’s needs well for many years. As the scale of the messages being processed increased and we were making more code changes in the message processor, we found ourselves looking for something more flexible. In particular, we were looking for some of the features we enjoy with our other services: automatic horizontal scaling, canaries, automated red/black rollouts, and more observability. With this in mind, we rewrote the message processor as a standalone Spring Boot service using Netflix paved-path components. Its job is the same, but it does so with easy rollouts, canary configuration that lets us roll changes safely, and autoscaling policies we’ve defined to let it handle varying volumes.
Rewriting always comes with a risk, and it’s never the first solution we reach for, particularly when working with a system that’s in place and working well. In this case, we found that the burden from maintaining and improving the custom stream processing job was increasing, and we made the judgment call to do the rewrite. Part of the reason we did so was the clear role that the message processor played — we weren’t rewriting a huge monolithic service, but instead a well-scoped component that had explicit goals, well-defined success criteria, and a clear path towards improvement. Since the rewrite was completed in mid-2023, the message processor component has been completely zero touch, happily automated and running reliably on its own.
Push Registry
For most of its life, Pushy has used Dynomite for keeping track of device connection metadata in its Push Registry. Dynomite is a Netflix open source wrapper around Redis that provides a few additional features like auto-sharding and cross-region replication, and it provided Pushy with low latency and easy record expiry, both of which are critical for Pushy’s workload.
As Pushy’s portfolio grew, we experienced some pain points with Dynomite. Dynomite had great performance, but it required manual scaling as the system grew. The folks on the Cloud Data Engineering (CDE) team, the ones building the paved path for internal data at Netflix, graciously helped us scale it up and make adjustments, but it ended up being an involved process as we kept growing.
These pain points coincided with the introduction of KeyValue, which was a new offering from the CDE team that is roughly “HashMap as a service” for Netflix developers. KeyValue is an abstraction over the storage engine itself, which allows us to choose the best storage engine that meets our SLO needs. In our case, we value low latency — the faster we can read from KeyValue, the faster these messages can get delivered. With CDE’s help, we migrated our Push Registry to use KV instead, and we have been extremely satisfied with the result. After tuning our store for Pushy’s needs, it has been on autopilot since, appropriately scaling and serving our requests with very low latency.
Scaling Pushy horizontally and vertically
Most of the other services our team runs, like apiproxy, the streaming edge proxy, are CPU bound, and we have autoscaling policies that scale them horizontally when we see an increase in CPU usage. This maps well to their workload — more HTTP requests means more CPU used, and we can scale up and down accordingly.
Pushy has slightly different performance characteristics, with each node maintaining many connections and delivering messages on demand. In Pushy’s case, CPU usage is consistently low, since most of the connections are parked and waiting for an occasional message. Instead of relying on CPU, we scale Pushy on the number of connections, with exponential scaling to scale faster after higher thresholds are reached. We load balance the initial HTTP requests to establish the connections and rely on a reconnect protocol where devices will reconnect every 30 minutes or so, with some staggering, that gives us a steady stream of reconnecting devices to balance connections across all available instances.
For a few years, our scaling policy had been that we would add new instances when the average number of connections reached 60,000 connections per instance. For a couple hundred million devices, this meant that we were regularly running thousands of Pushy instances. We can horizontally scale Pushy to our heart’s content, but we would be less content with our bill and would have to shard Pushy further to get around NLB connection limits. This evolution effort aligned well with an internal focus on cost efficiency, and we used this as an opportunity to revisit these earlier assumptions with an eye towards efficiency.
Both of these would be helped by increasing the number of connections that each Pushy node could handle, reducing the total number of Pushy instances and running more efficiently with the right balance between instance type, instance cost, and maximum concurrent connections. It would also allow us to have more breathing room with the NLB limits, reducing the toil of additional sharding as we continue to grow. That being said, increasing the number of connections per node is not without its own drawbacks. When a Pushy instance goes down, the devices that were connected to it will immediately try to reconnect. By increasing the number of connections per instance, it means that we would be increasing the number of devices that would be immediately trying to reconnect. We could have a million connections per instance, but a down node would lead to a thundering herd of a million devices reconnecting at the same time.
This delicate balance led to us doing a deep evaluation of many instance types and performance tuning options. Striking that balance, we ended up with instances that handle an average of 200,000 connections per node, with breathing room to go up to 400,000 connections if we had to. This makes for a nice balance between CPU usage, memory usage, and the thundering herd when a device connects. We’ve also enhanced our autoscaling policies to scale exponentially; the farther we are past our target average connection count, the more instances we’ll add. These improvements have enabled Pushy to be almost entirely hands off operationally, giving us plenty of flexibility as more devices come online in different patterns.
Reliability & building a stable foundation
Alongside these efforts to scale Pushy for the future, we also took a close look at our reliability after finding some connectivity edge cases during recent feature development. We found a few areas for improvement around the connection between Pushy and the device, with failures due to Pushy attempting to send messages on a connection that had failed without notifying Pushy. Ideally something like a silent failure wouldn’t happen, but we frequently see odd client behavior, particularly on older devices.
In collaboration with the client teams, we were able to make some improvements. On the client side, better connection handling and improvements around the reconnect flow meant that they were more likely to reconnect appropriately. In Pushy, we added additional heartbeats, idle connection cleanup, and better connection tracking, which meant that we were keeping around fewer and fewer stale connections.
While these improvements were mostly around those edge cases for the feature development, they had the side benefit of bumping our message delivery rates up even further. We already had a good message delivery rate, but this additional bump has enabled Pushy to regularly average 5 9s of message delivery reliability.
Push message delivery success rate over a recent 2-week period.
Recent developments
With this stable foundation and all of these connections, what can we now do with them? This question has been the driving force behind nearly all of the recent features built on top of Pushy, and it’s an exciting question to ask, particularly as an infrastructure team.
Shift towards direct push
The first change from Pushy’s traditional role is what we call direct push; instead of a backend service dropping the message on the asynchronous message queue, it can instead leverage the Push library to skip the asynchronous queue entirely. When called to deliver a message in the direct path, the Push library will look up the Pushy connected to the target device in the Push Registry, then send the message directly to that Pushy. Pushy will respond with a status code reflecting whether it was able to successfully deliver the message or it encountered an error, and the Push library will bubble that up to the calling code in the service.
The system diagram for the direct and indirect push paths.
Susheel, the original author of Pushy, added this functionality as an optional path, but for years, nearly all backend services relied on the indirect path with its “best-effort” being good enough for their use cases. In recent years, we’ve seen usage of this direct path really take off as the needs of backend services have grown. In particular, rather than being just best effort, these direct messages allow the calling service to have immediate feedback about the delivery, letting them retry if a device they’re targeting has gone offline.
These days, messages sent via direct push make up the majority of messages sent through Pushy. For example, for a recent 24 hour period, direct messages averaged around 160,000 messages per second and indirect averaged at around 50,000 messages per second..
Graph of direct vs indirect messages per second.
Device to device messaging
As we’ve thought through this evolving use case, our concept of a message sender has also evolved. What if we wanted to move past Pushy’s pattern of delivering server-side messages? What if we wanted to have a device send a message to a backend service, or maybe even to another device? Our messages had traditionally been unidirectional as we send messages from the server to the device, but we now leverage these bidirectional connections and direct device messaging to enable what we call device to device messaging. This device to device messaging supported early phone-to-TV communication in support of games like Triviaverse, and it’s the messaging foundation for our Companion Mode as TVs and phones communicate back and forth.
A screenshot of one of the authors playing Triviaquest with a mobile device as the controller.
This requires higher level knowledge of the system, where we need to know not just information about a single device, but more broader information, like what devices are connected for an account that the phone can pair with. This also enables things like subscribing to device events to know when another device comes online and when they’re available to pair or send a message to. This has been built out with an additional service that receives device connection information from Pushy. These events, sent over a Kafka topic, let the service keep track of the device list for a given account. Devices can subscribe to these events, allowing them to receive a message from the service when another device for the same account comes online.
Pushy and its relationship with the Device List Service for discovering other devices.
This device list enables the discoverability aspect of these device to device messages. Once the devices have this knowledge of the other devices connected for the same account, they’re able to choose a target device from this list that they can then send messages to.
Once a device has that list, it can send a message to Pushy over its WebSocket connection with that device as the target in what we call a device to device message (1 in the diagram below). Pushy looks up the target device’s metadata in the Push registry (2) and sends the message to the second Pushy that the target device is connected to (3), as if it was the backend service in the direct push pattern above. That Pushy delivers the message to the target device (4), and the original Pushy will receive a status code in response, which it can pass back to the source device (5).
A basic order of events for a device to device message.
The messaging protocol
We’ve defined a basic JSON-based message protocol for device to device messaging that lets these messages be passed from the source device to the target device. As a networking team, we naturally lean towards abstracting the communication layer with encapsulation wherever possible. This generalized message means that device teams are able to define their own protocols on top of these messages — Pushy would just be the transport layer, happily forwarding messages back and forth.
The client app protocol, built on top of the device to device protocol, built on top of Pushy.
This generalization paid off in terms of investment and operational support. We built the majority of this functionality in October 2022, and we’ve only needed small tweaks since then. We needed nearly no modifications as client teams built out the functionality on top of this layer, defining the higher level application-specific protocols that powered the features they were building. We really do enjoy working with our partner teams, but if we’re able to give them the freedom to build on top of our infrastructure layer without us getting involved, then we’re able to increase their velocity, make their lives easier, and play our infrastructure roles as message platform providers.
With early features in experimentation, Pushy sees an average of 1000 device to device messages per second, a number that will only continue to grow.
Graph of device to device messages per second.
The Netty-gritty details
In Pushy, we handle incoming WebSocket messages in our PushClientProtocolHandler (code pointer to class in Zuul that we extend), which extends Netty’s ChannelInboundHandlerAdapter and is added to the Netty pipeline for each client connection. We listen for incoming WebSocket messages from the connected device in its channelRead method and parse the incoming message. If it’s a device to device message, we pass the message, the ChannelHandlerContext, and the PushUserAuth information about the connection’s identity to our DeviceToDeviceManager.
A rough overview of the internal organization for these components.
The DeviceToDeviceManager is responsible for validating the message, doing some bookkeeping, and kicking off an async call that validates that the device is an authorized target, looks up the Pushy for the target device in the local cache (or makes a call to the data store if it’s not found), and forwards on the message. We run this asynchronously to avoid any event loop blocking due to these calls. The DeviceToDeviceManager is also responsible for observability, with metrics around cache hits, calls to the data store, message delivery rates, and latency percentile measurements. We’ve relied heavily on these metrics for alerts and optimizations — Pushy really is a metrics service that occasionally will deliver a message or two!
Security
As the edge of the Netflix cloud, security considerations are always top of mind. With every connection over HTTPS, we’ve limited these messages to just authenticated WebSocket connections, added rate limiting, and added authorization checks to ensure that a device is able to target another device — you may have the best intentions in mind, but I’d strongly prefer it if you weren’t able to send arbitrary data to my personal TV from yours (and vice versa, I’m sure!).
Latency and other considerations
One main consideration with the products built on top of this is latency, particularly when this feature is used for anything interactive within the Netflix app.
We’ve added caching to Pushy to reduce the number of lookups in the hotpath for things that are unlikely to change frequently, like a device’s allowed list of targets and the Pushy instance the target device is connected to. We have to do some lookups on the initial messages to know where to send them, but it enables us to send subsequent messages faster without any KeyValue lookups. For these requests where caching removed KeyValue from the hot path, we were able to greatly speed things up. From the incoming message arriving at Pushy to the response being sent back to the device, we reduced median latency to less than a millisecond, with the 99th percentile of latency at less than 4ms.
Our KeyValue latency is usually very low, but we have seen brief periods of elevated read latencies due to underlying issues in our KeyValue datastore. Overall latencies increased for other parts of Pushy, like client registration, but we saw very little increase in device to device latency with this caching in place.
Cultural aspects that enable this work
Pushy’s scale and system design considerations make the work technically interesting, but we also deliberately focus on non-technical aspects that have helped to drive Pushy’s growth. We focus on iterative development that solves the hardest problem first, with projects frequently starting with quick hacks or prototypes to prove out a feature. As we do this initial version, we do our best to keep an eye towards the future, allowing us to move quickly from supporting a single, focused use case to a broad, generalized solution. For example, for our cross-device messaging, we were able to solve hard problems in the early work for Triviaverse that we later leveraged for the generic device to device solution.
As one can immediately see in the system diagrams above, Pushy does not exist in a vacuum, with projects frequently involving at least half a dozen teams. Trust, experience, communication, and strong relationships all enable this to work. Our team wouldn’t exist without our platform users, and we certainly wouldn’t be here writing this post without all of the work our product and client teams do. This has also emphasized the importance of building and sharing — if we’re able to get a prototype together with a device team, we’re able to then show it off to seed ideas from other teams. It’s one thing to mention that you can send these messages, but it’s another to show off the TV responding to the first click of the phone controller button!
The future of Pushy
If there’s anything certain in this world, it’s that Pushy will continue to grow and evolve. We have many new features in the works, like WebSocket message proxying, WebSocket message tracing, a global broadcast mechanism, and subscription functionality in support of Games and Live. With all of this investment, Pushy is a stable, reinforced foundation, ready for this next generation of features.
We’ll be writing about those new features as well — stay tuned for future posts.
Special thanks to our stunning colleagues Jeremy Kelly and Justin Guerra who have both been invaluable to Pushy’s growth and the WebSocket ecosystem at large. We would also like to thank our larger teams and our numerous partners for their great work; it truly takes a village!
Version
3.4 of the Pandoc
document-conversion tool has been released. Notable changes in this
release include a new ANSI output format (for console output), a switch to WeasyPrint as the PDF engine for
HTML to PDF conversion, the ability to position captions
above or below tables and figures, and much more.
The collective thoughts of the interwebz
Manage Consent
To provide the best experiences, we use technologies like cookies to store and/or access device information. Consenting to these technologies will allow us to process data such as browsing behavior or unique IDs on this site. Not consenting or withdrawing consent, may adversely affect certain features and functions.
Functional
Always active
The technical storage or access is strictly necessary for the legitimate purpose of enabling the use of a specific service explicitly requested by the subscriber or user, or for the sole purpose of carrying out the transmission of a communication over an electronic communications network.
Preferences
The technical storage or access is necessary for the legitimate purpose of storing preferences that are not requested by the subscriber or user.
Statistics
The technical storage or access that is used exclusively for statistical purposes.The technical storage or access that is used exclusively for anonymous statistical purposes. Without a subpoena, voluntary compliance on the part of your Internet Service Provider, or additional records from a third party, information stored or retrieved for this purpose alone cannot usually be used to identify you.
Marketing
The technical storage or access is required to create user profiles to send advertising, or to track the user on a website or across several websites for similar marketing purposes.


 Simon Peyer is a Solutions Architect at Amazon Web Services (AWS) based in Switzerland. He is a practical doer and passionate about connecting technology and people using AWS Cloud services. A special focus for him is data streaming and automations. Besides work, Simon enjoys his family, the outdoors, and hiking in the mountains.
 Hardeep Randhawa is a Senior Manager – Big Data & Analytics, Solution Architecture at HPE, recognized for stewarding enterprise-scale programs and deployments. He has led a recent Big Data EAP (Enterprise Analytics Platform) build with one of the largest global SAP HANA/S4 implementations at HPE.
 Abhay Kumar is a Lead Data Engineer in Aruba Supply Chain Analytics and manages the Cloud Infrastructure for the Application at HPE. With 11+ years of experience in the IT industry domains like banking, supply chain and Abhay has a strong background in Cloud Technologies, Data Analytics, Data Management, and Big Data systems. In his spare time, he likes reading, exploring new places and watching movies.
 Ritesh Chaman is a Senior Technical Account Manager at Amazon Web Services. With 14 years of experience in the IT industry, Ritesh has a strong background in Data Analytics, Data Management, Big Data systems and Machine Learning. In his spare time, he loves cooking, watching sci-fi movies, and playing sports.
 Sushmita Barthakur is a Senior Solutions Architect at Amazon Web Services, supporting Enterprise customers architect their workloads on AWS. With a strong background in Data Analytics and Data Management, she has extensive experience helping customers architect and build Business Intelligence and Analytics Solutions, both on-premises and the cloud. Sushmita is based out of Tampa, FL and enjoys traveling, reading and playing tennis.
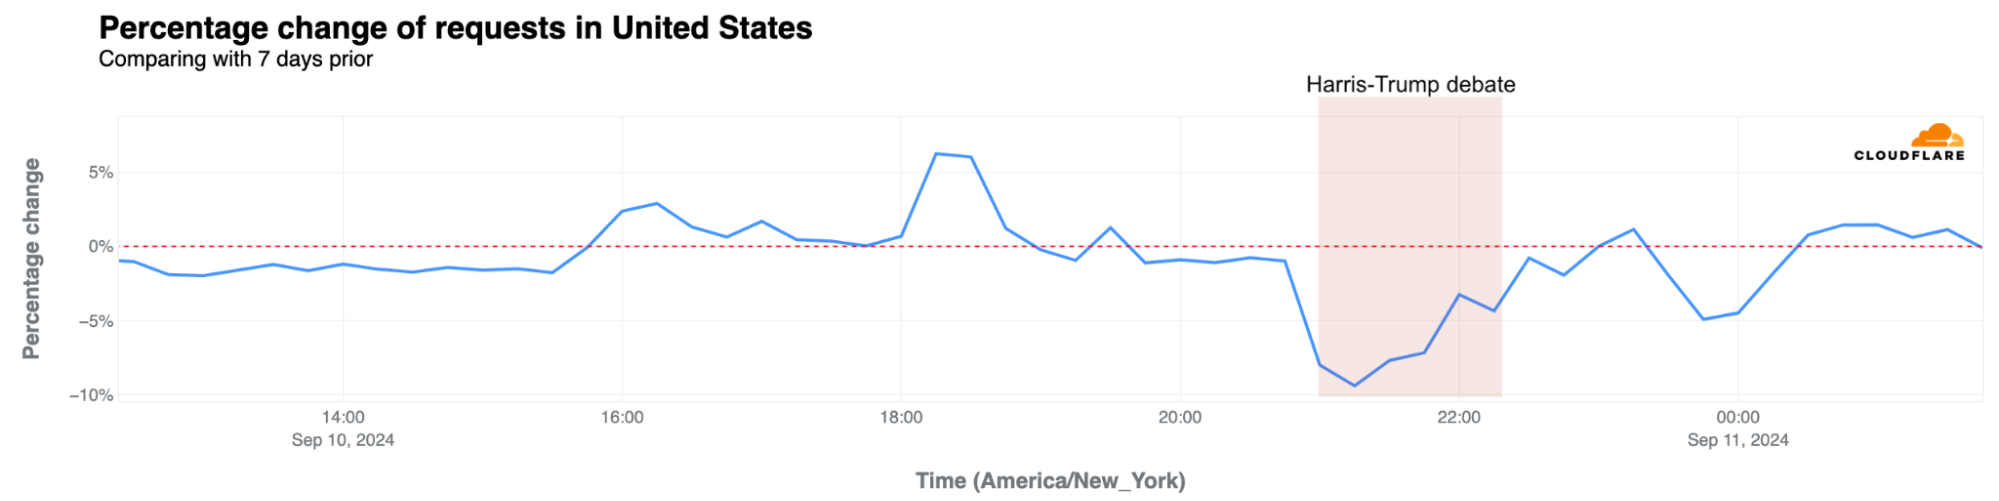


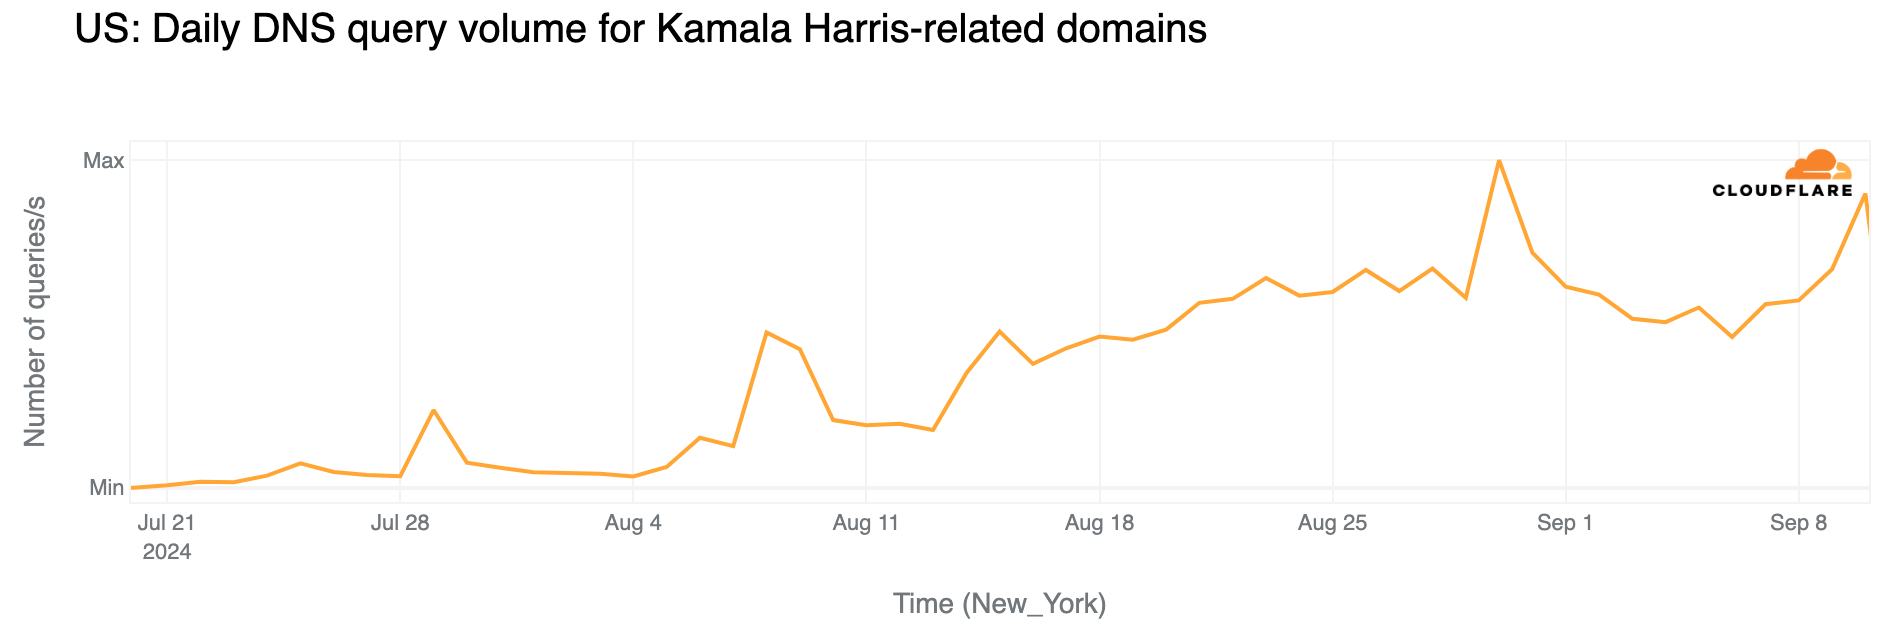
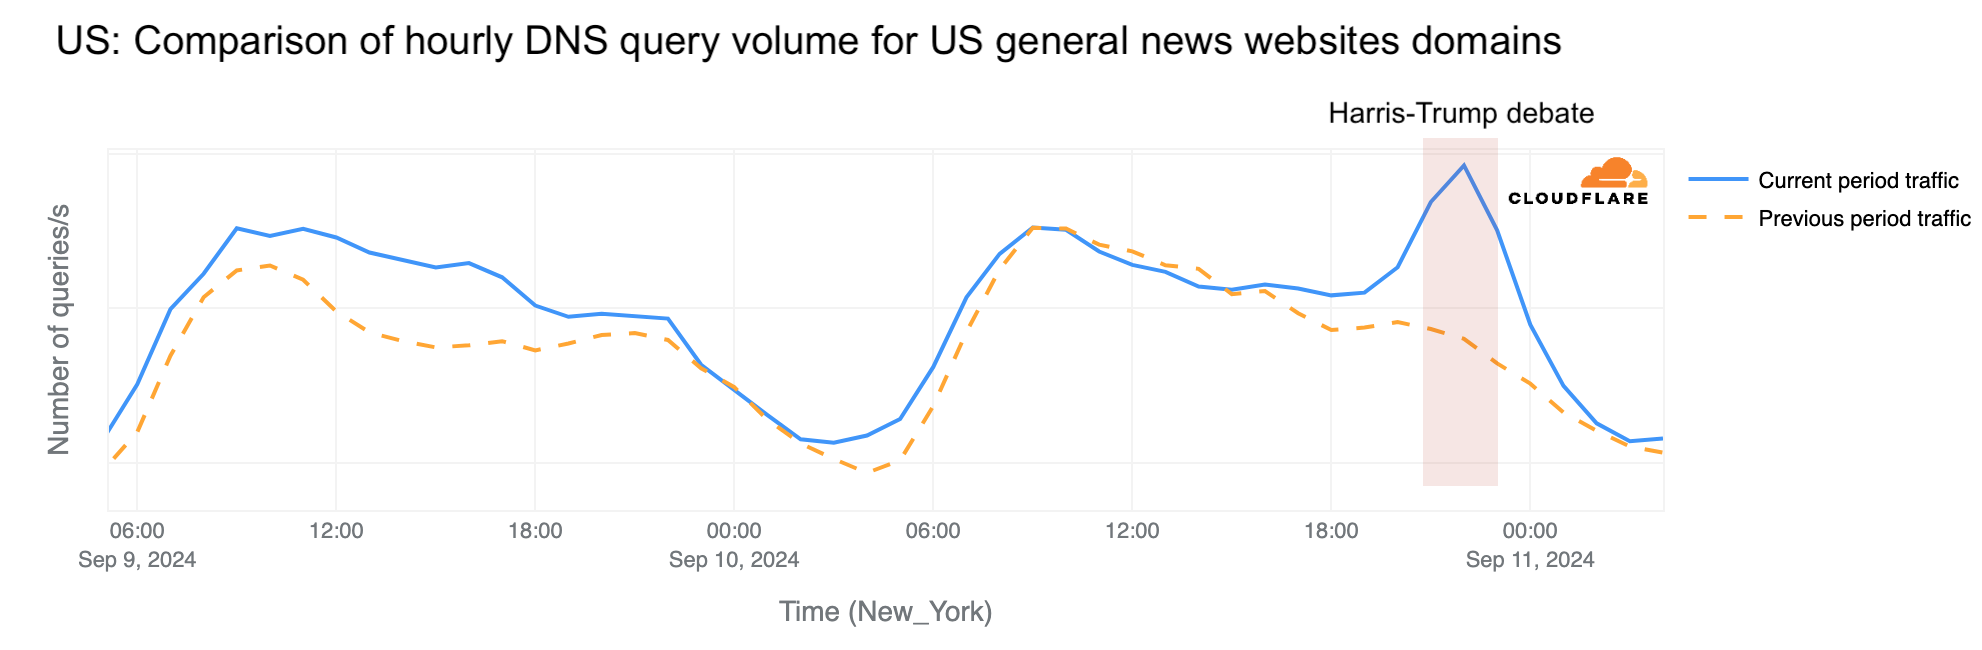
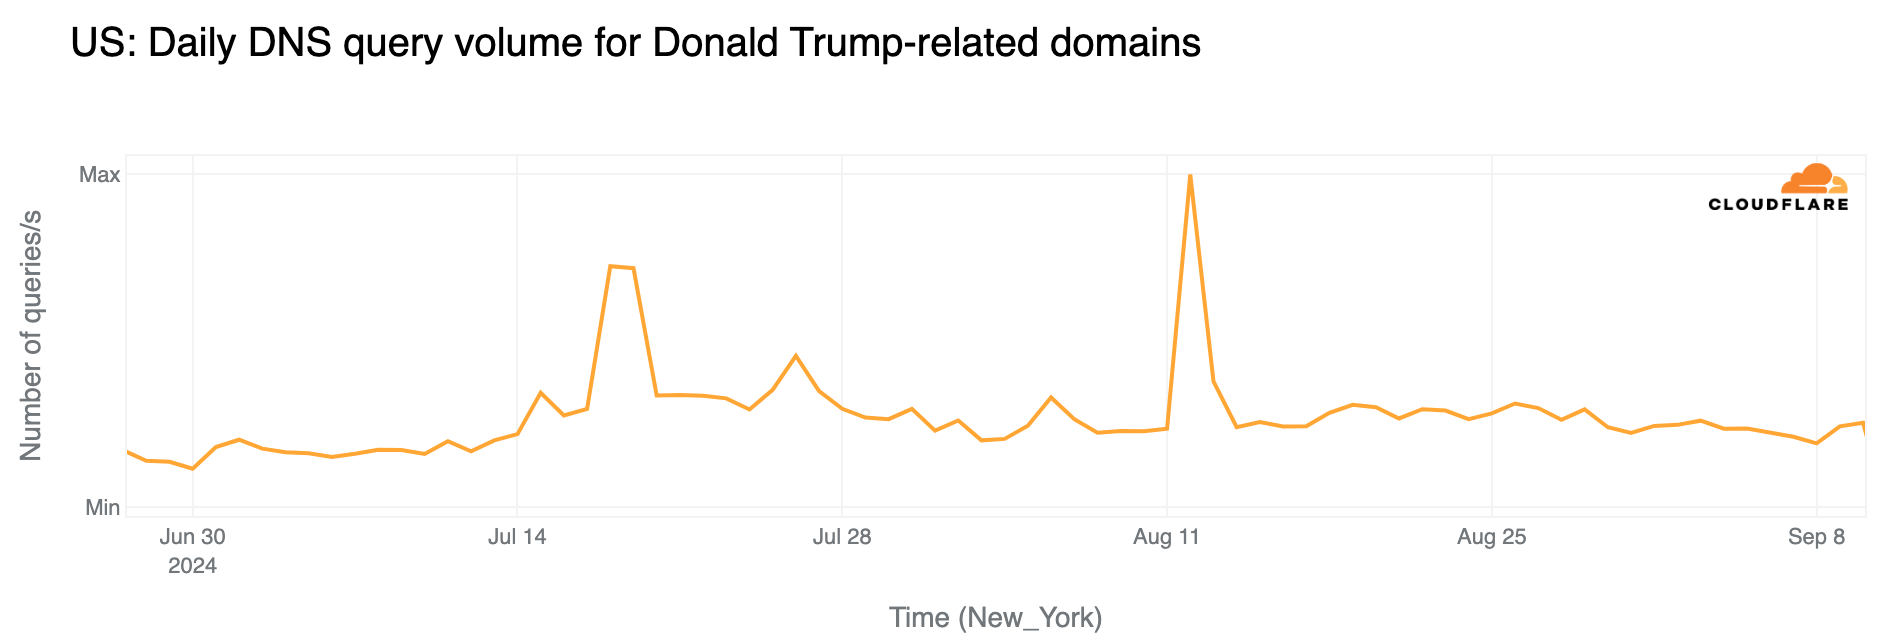
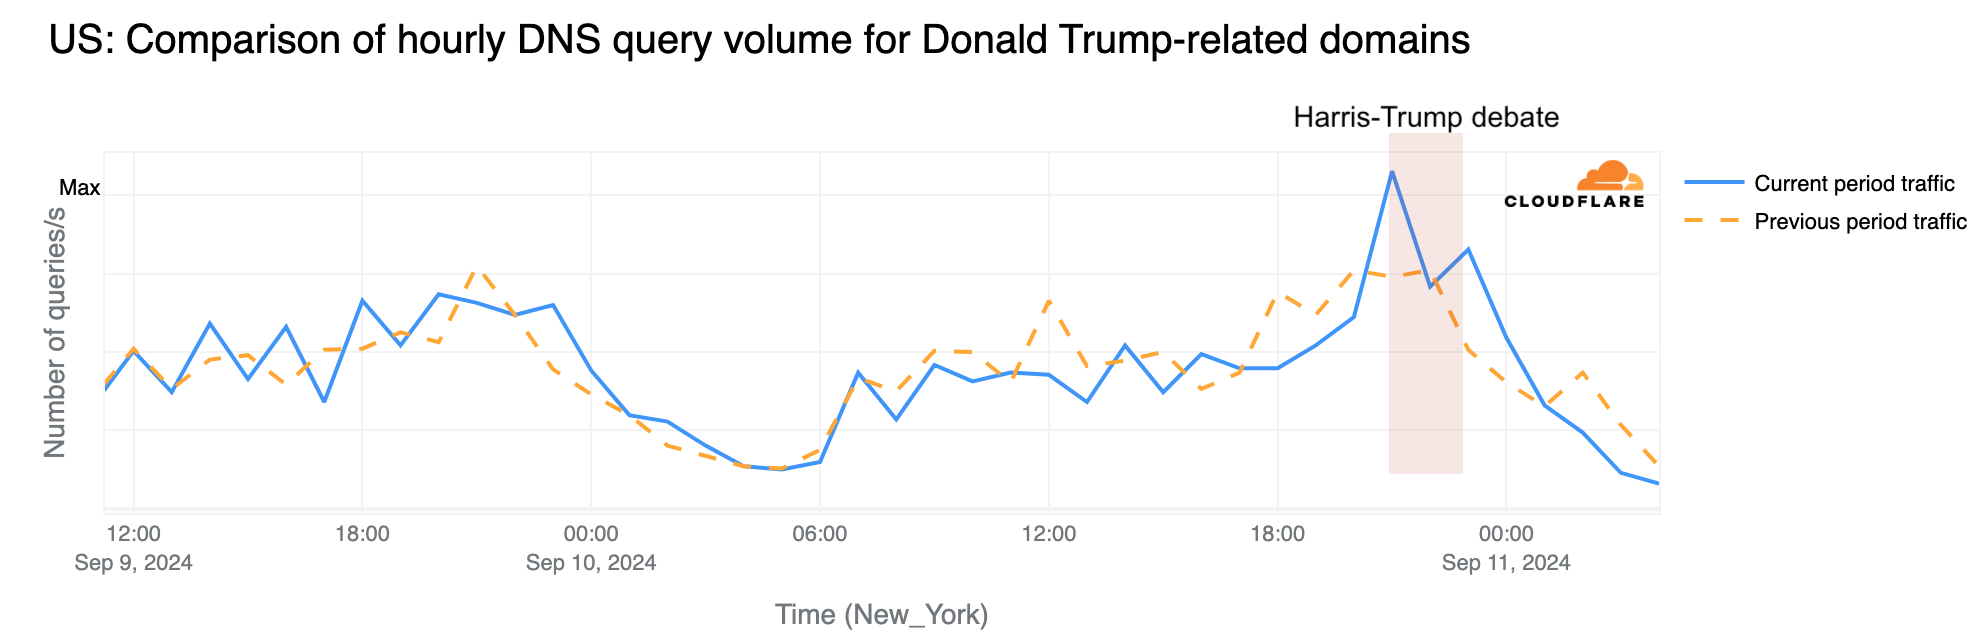

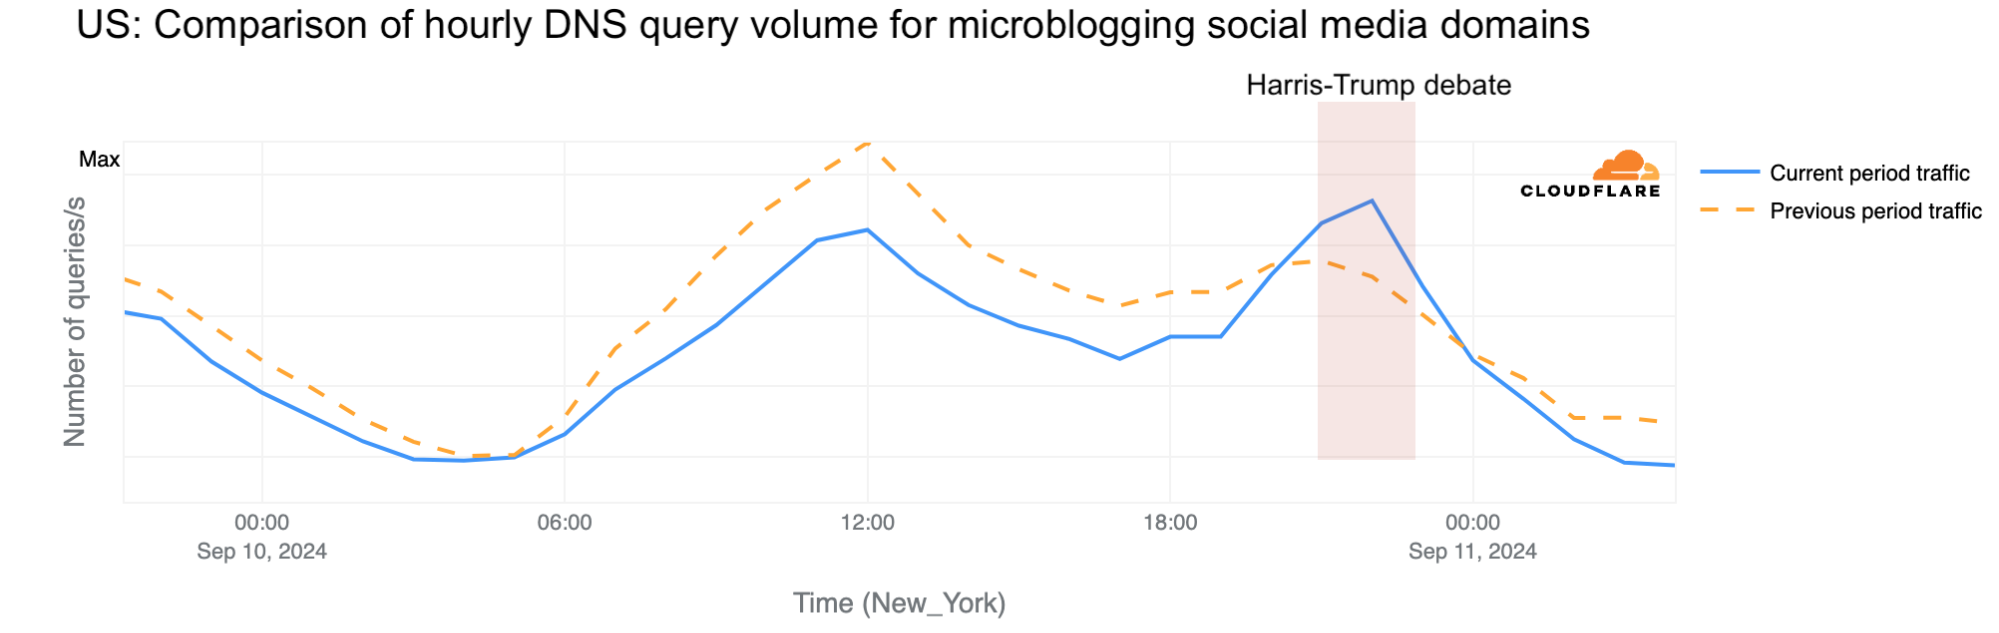
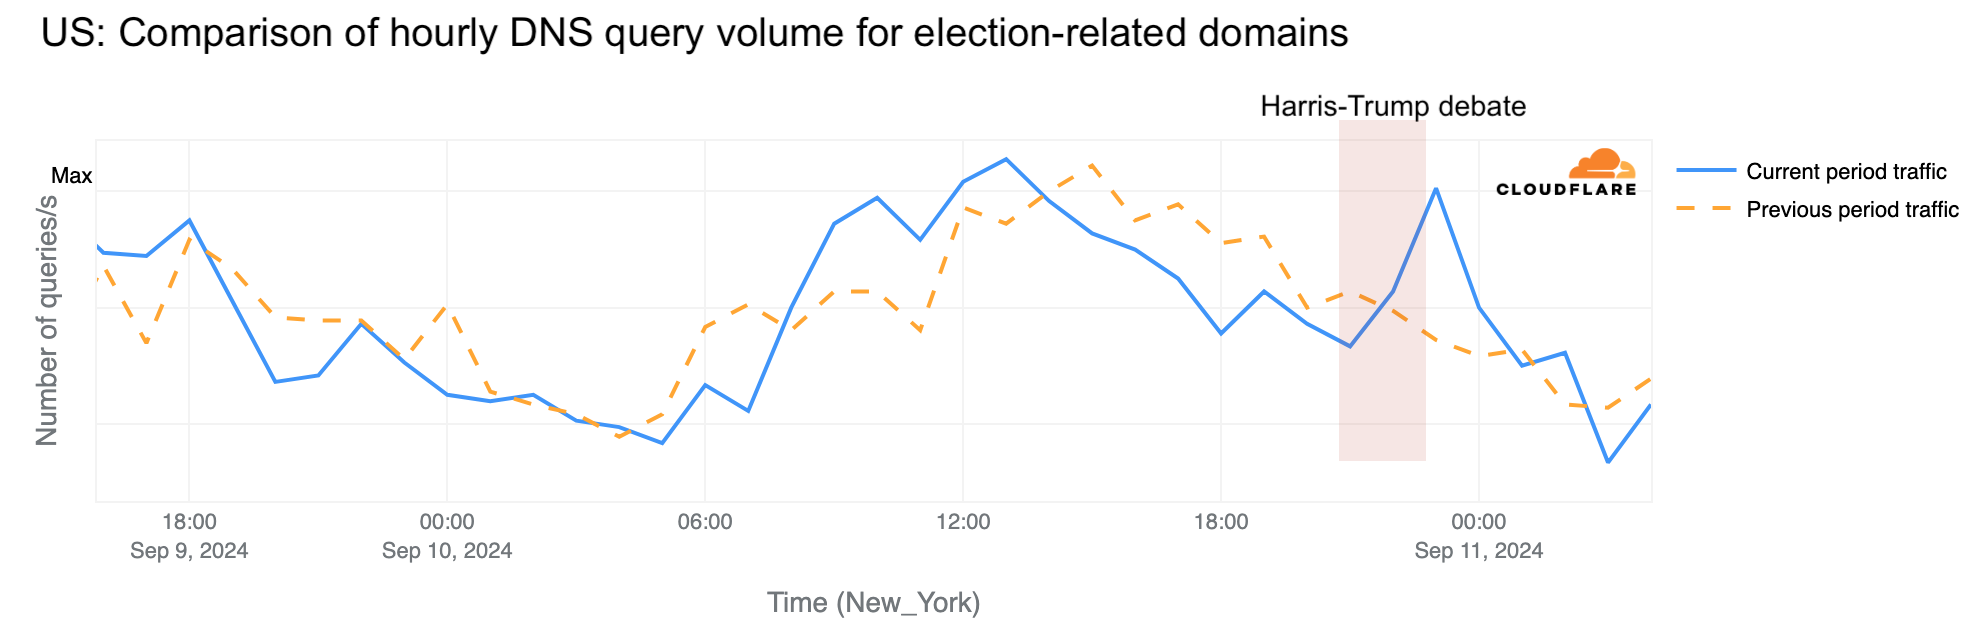
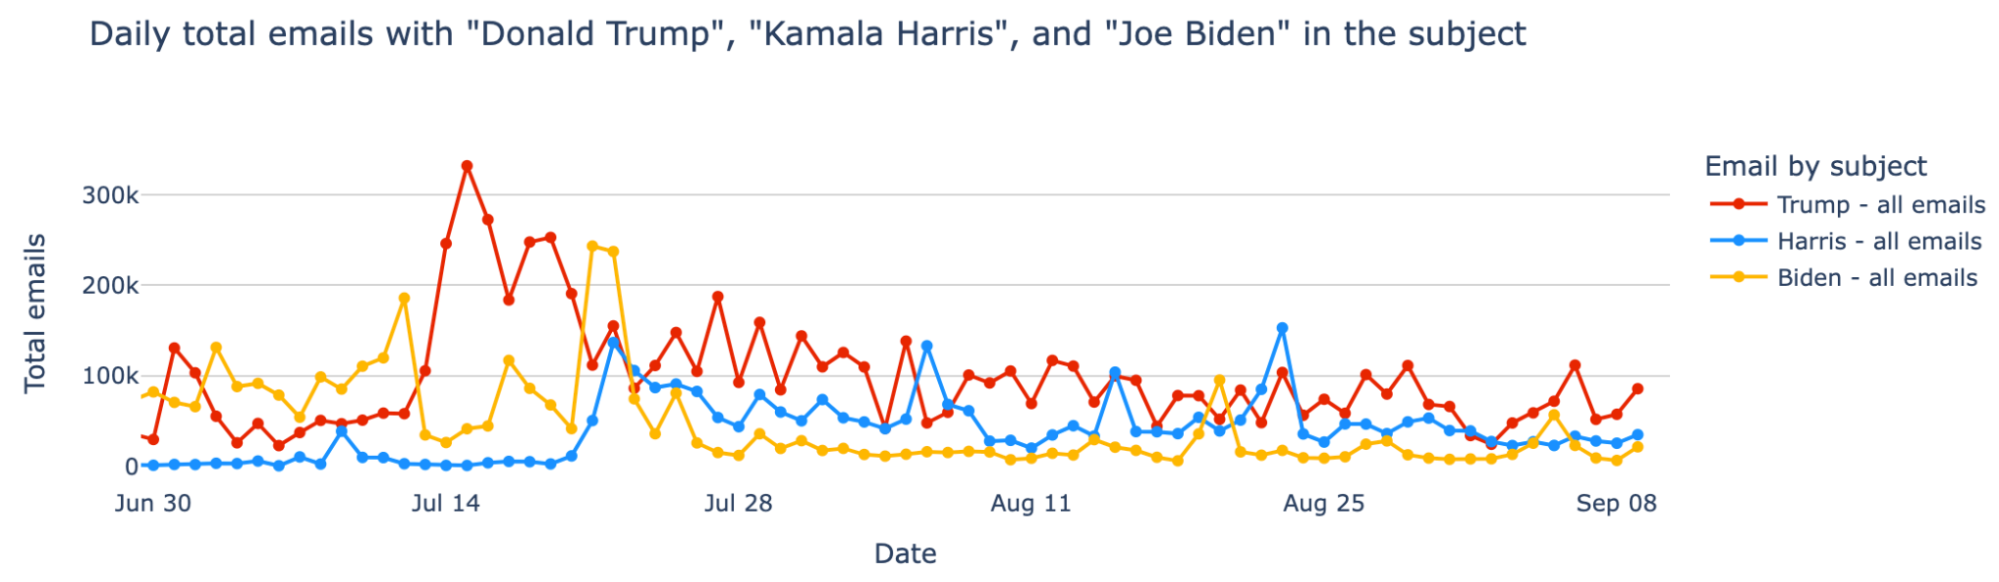
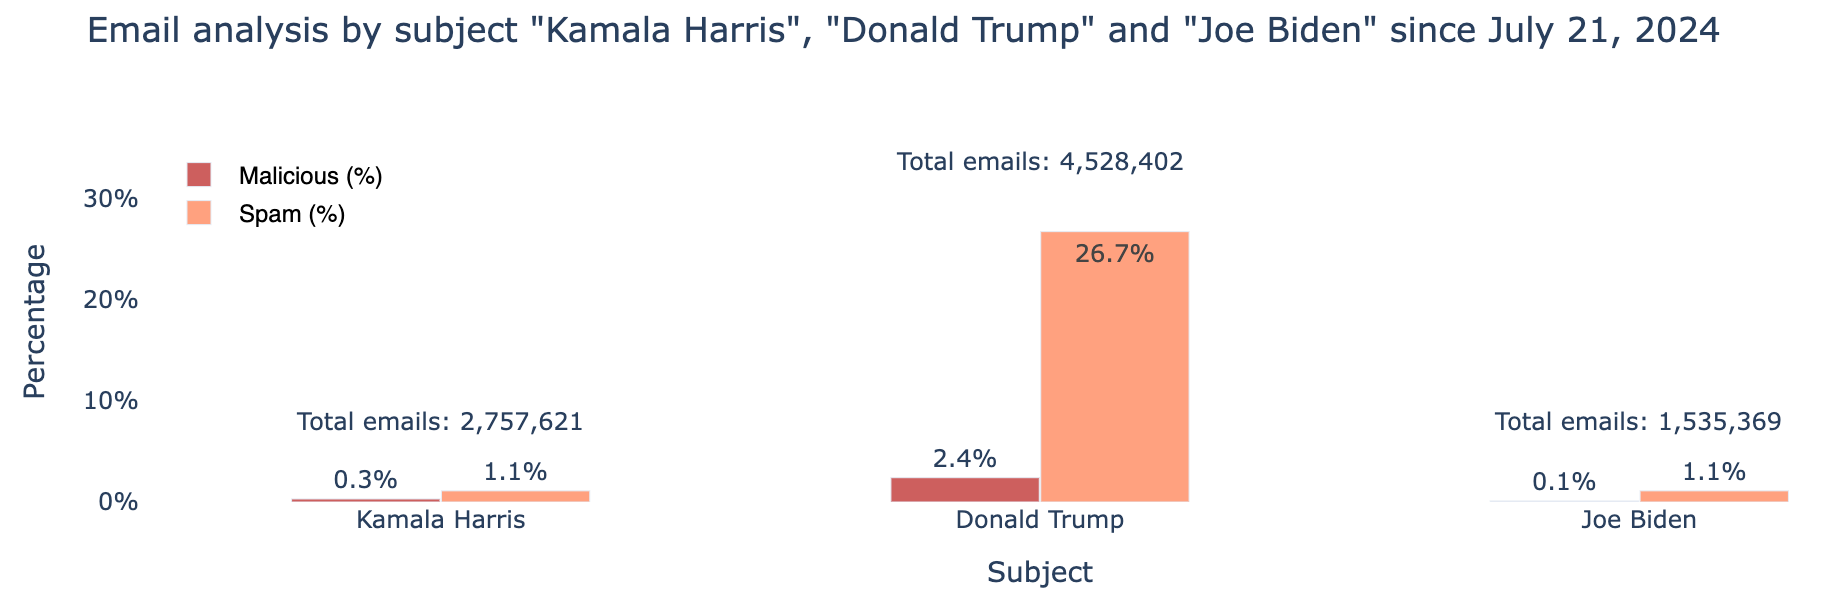
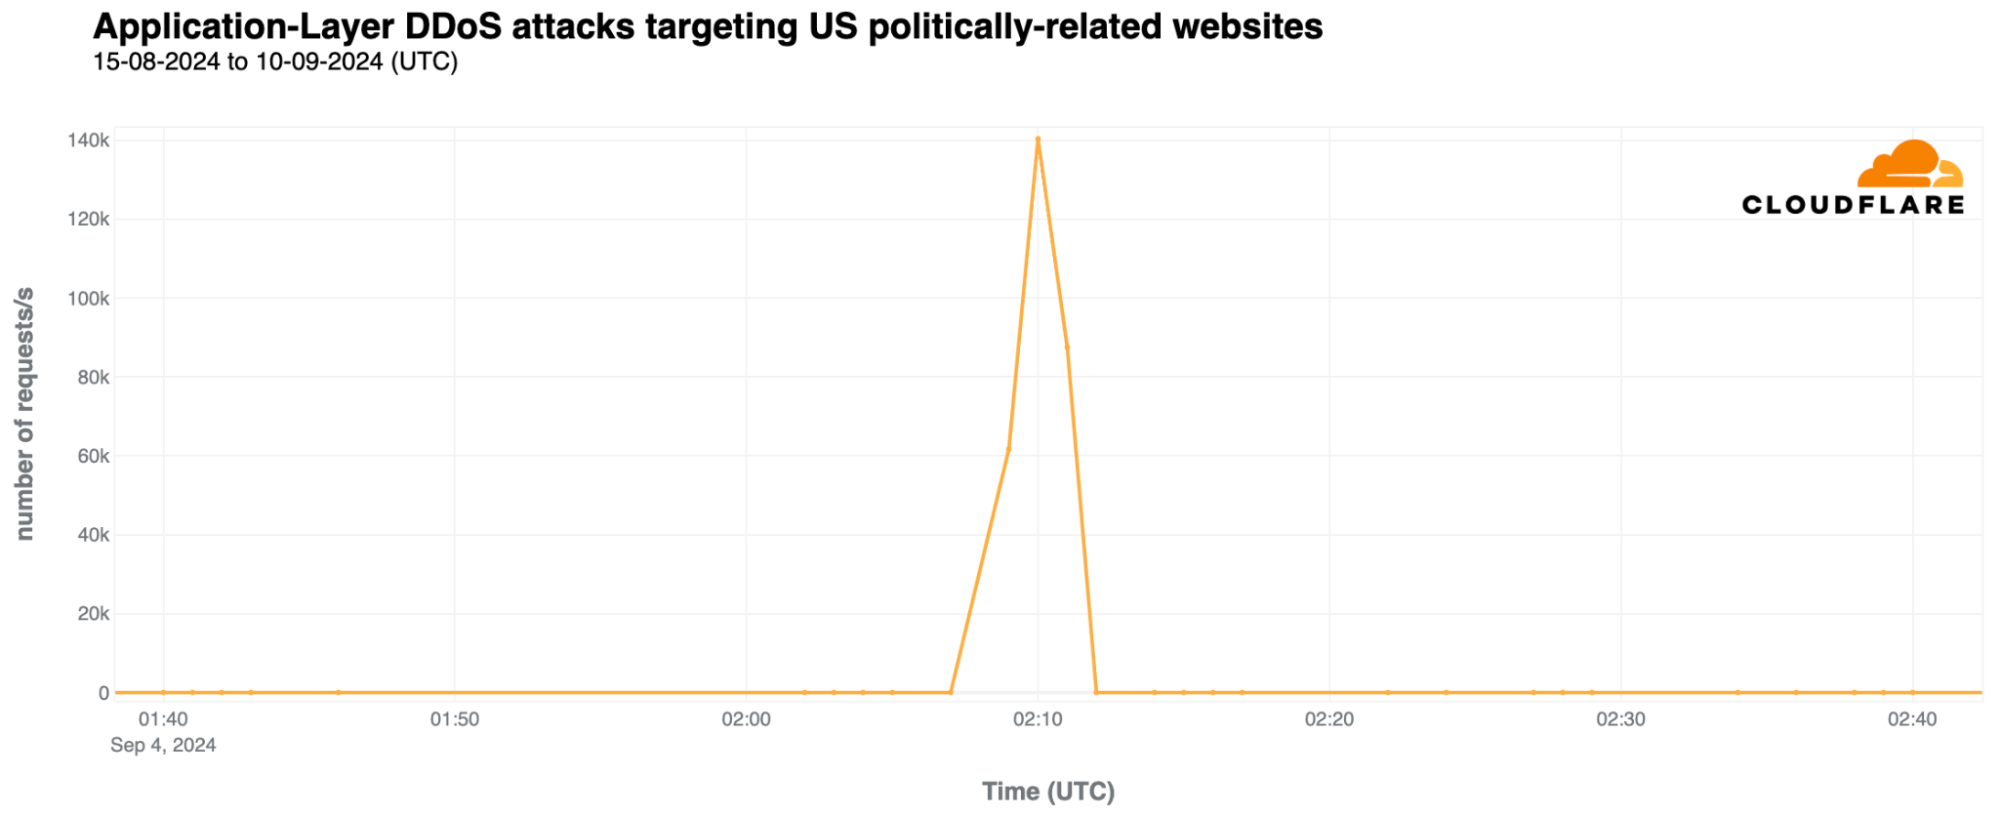
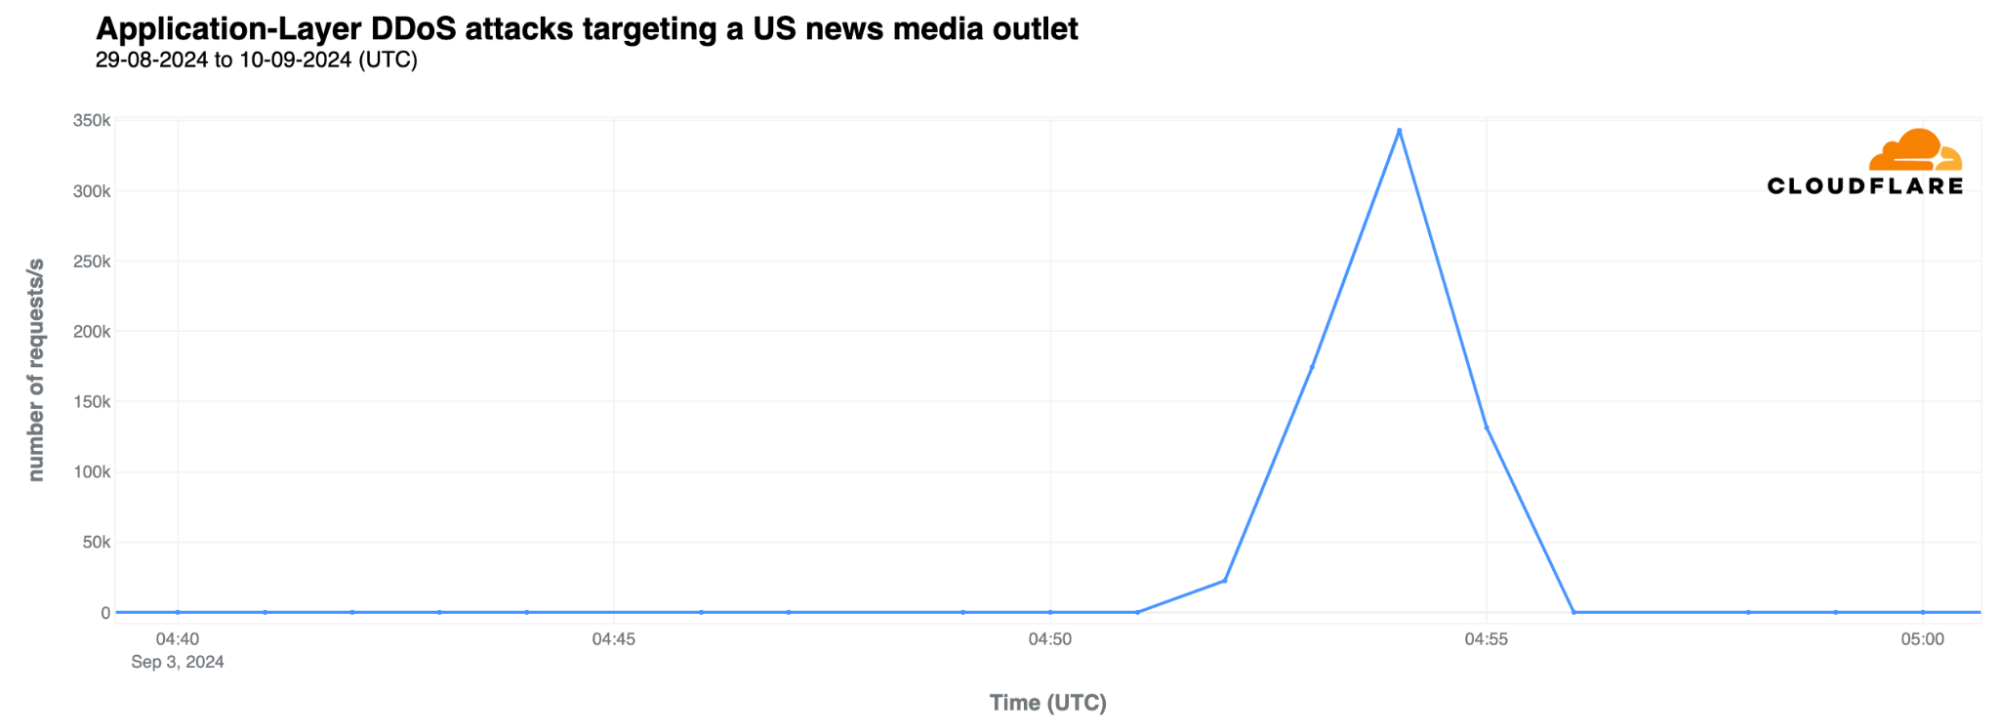
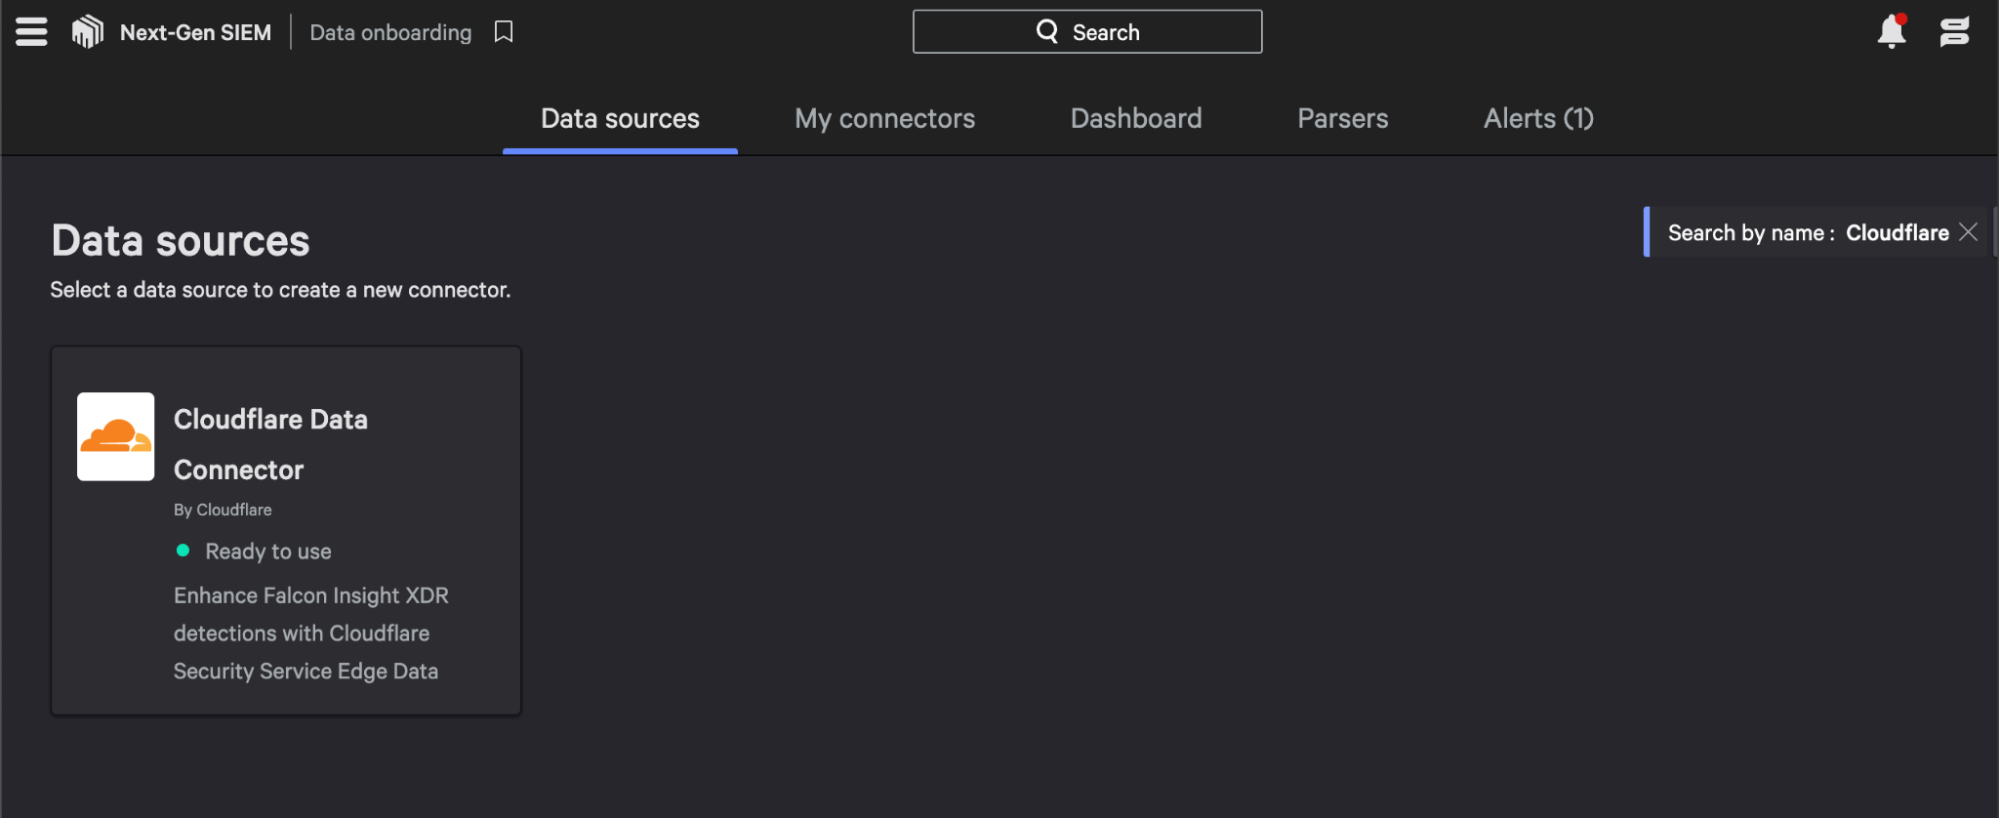
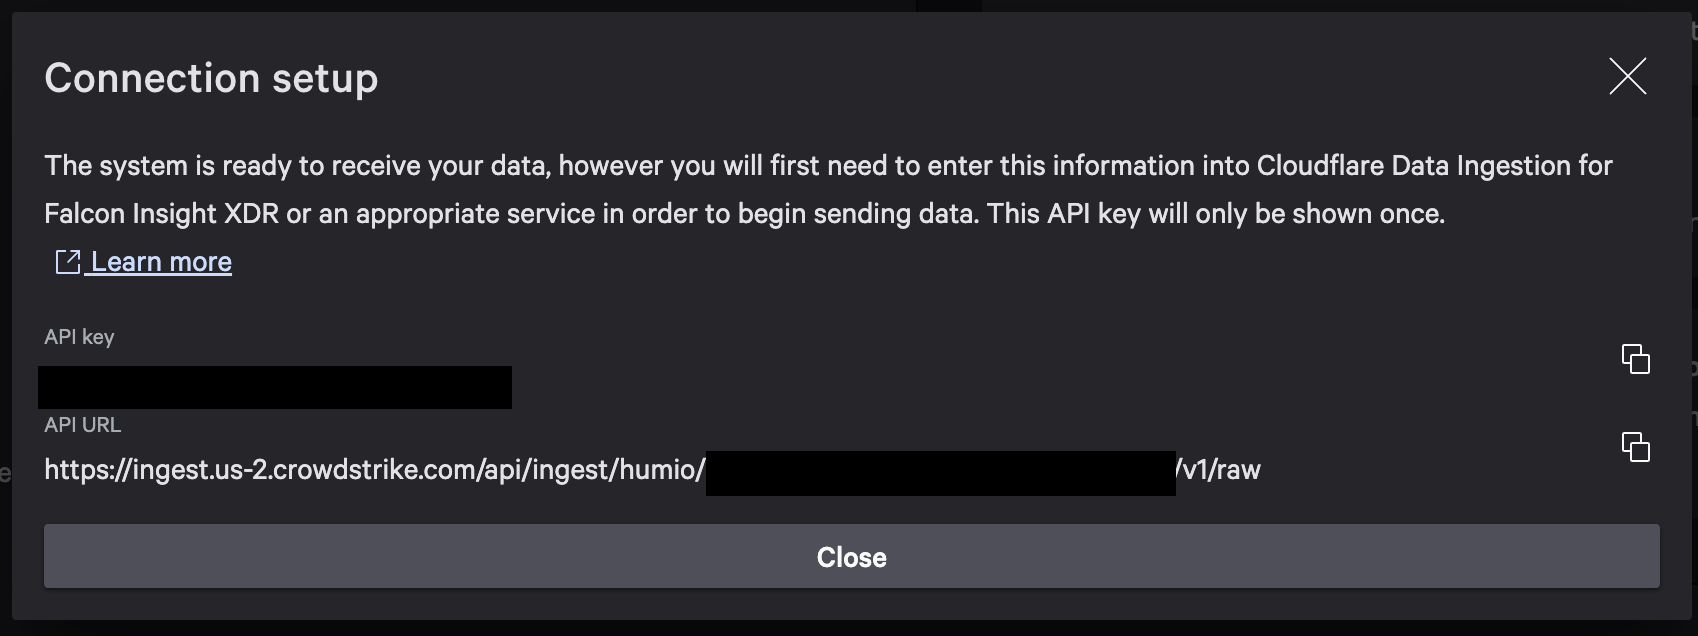
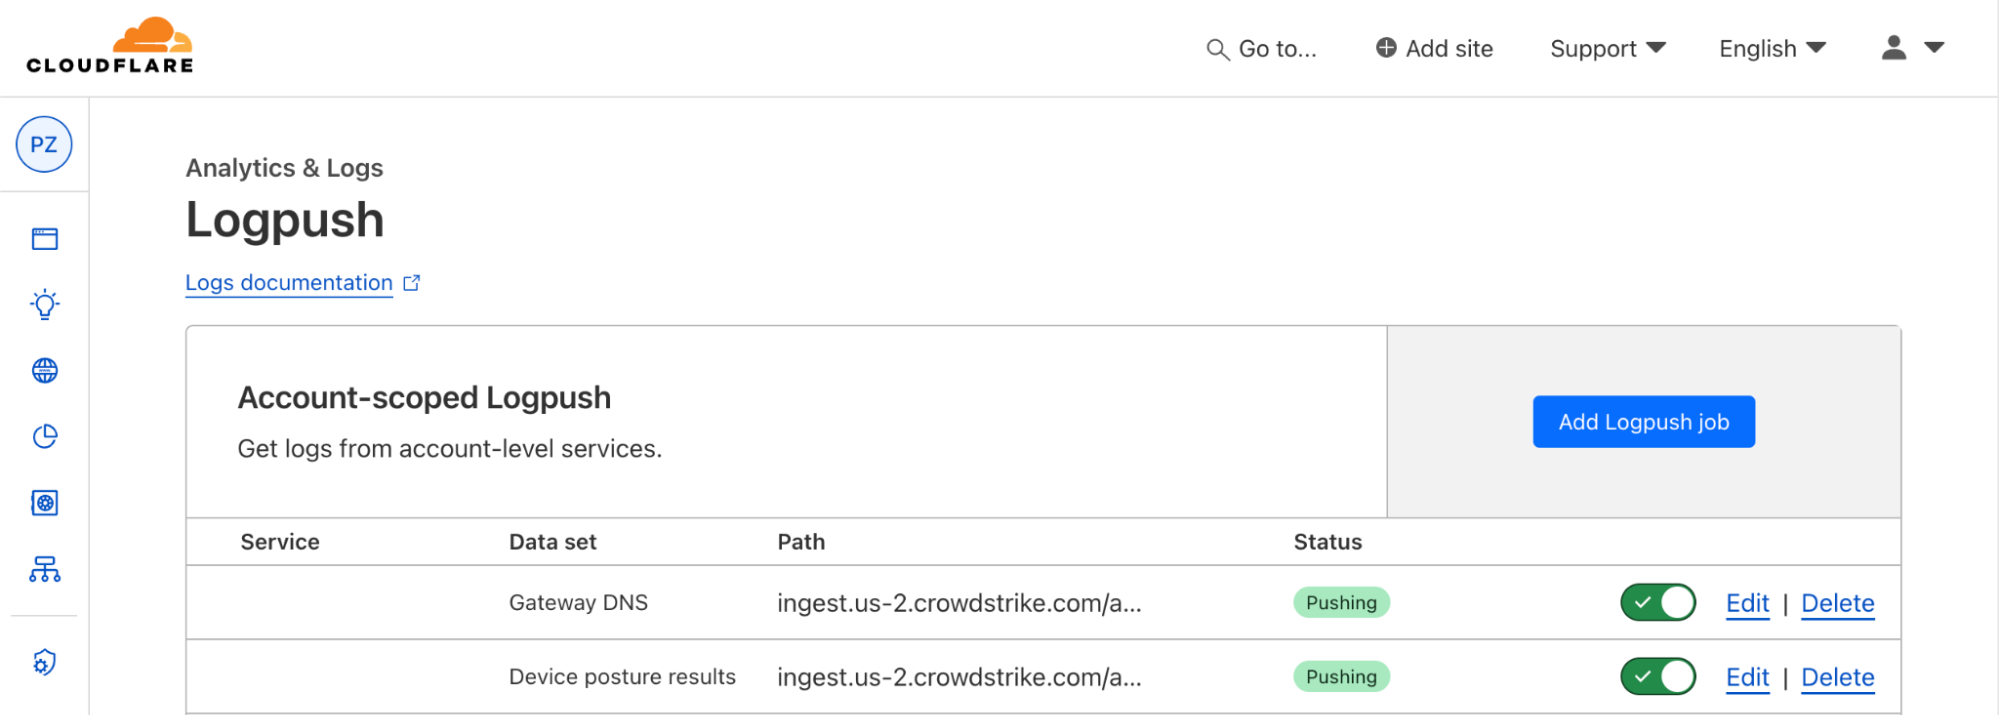
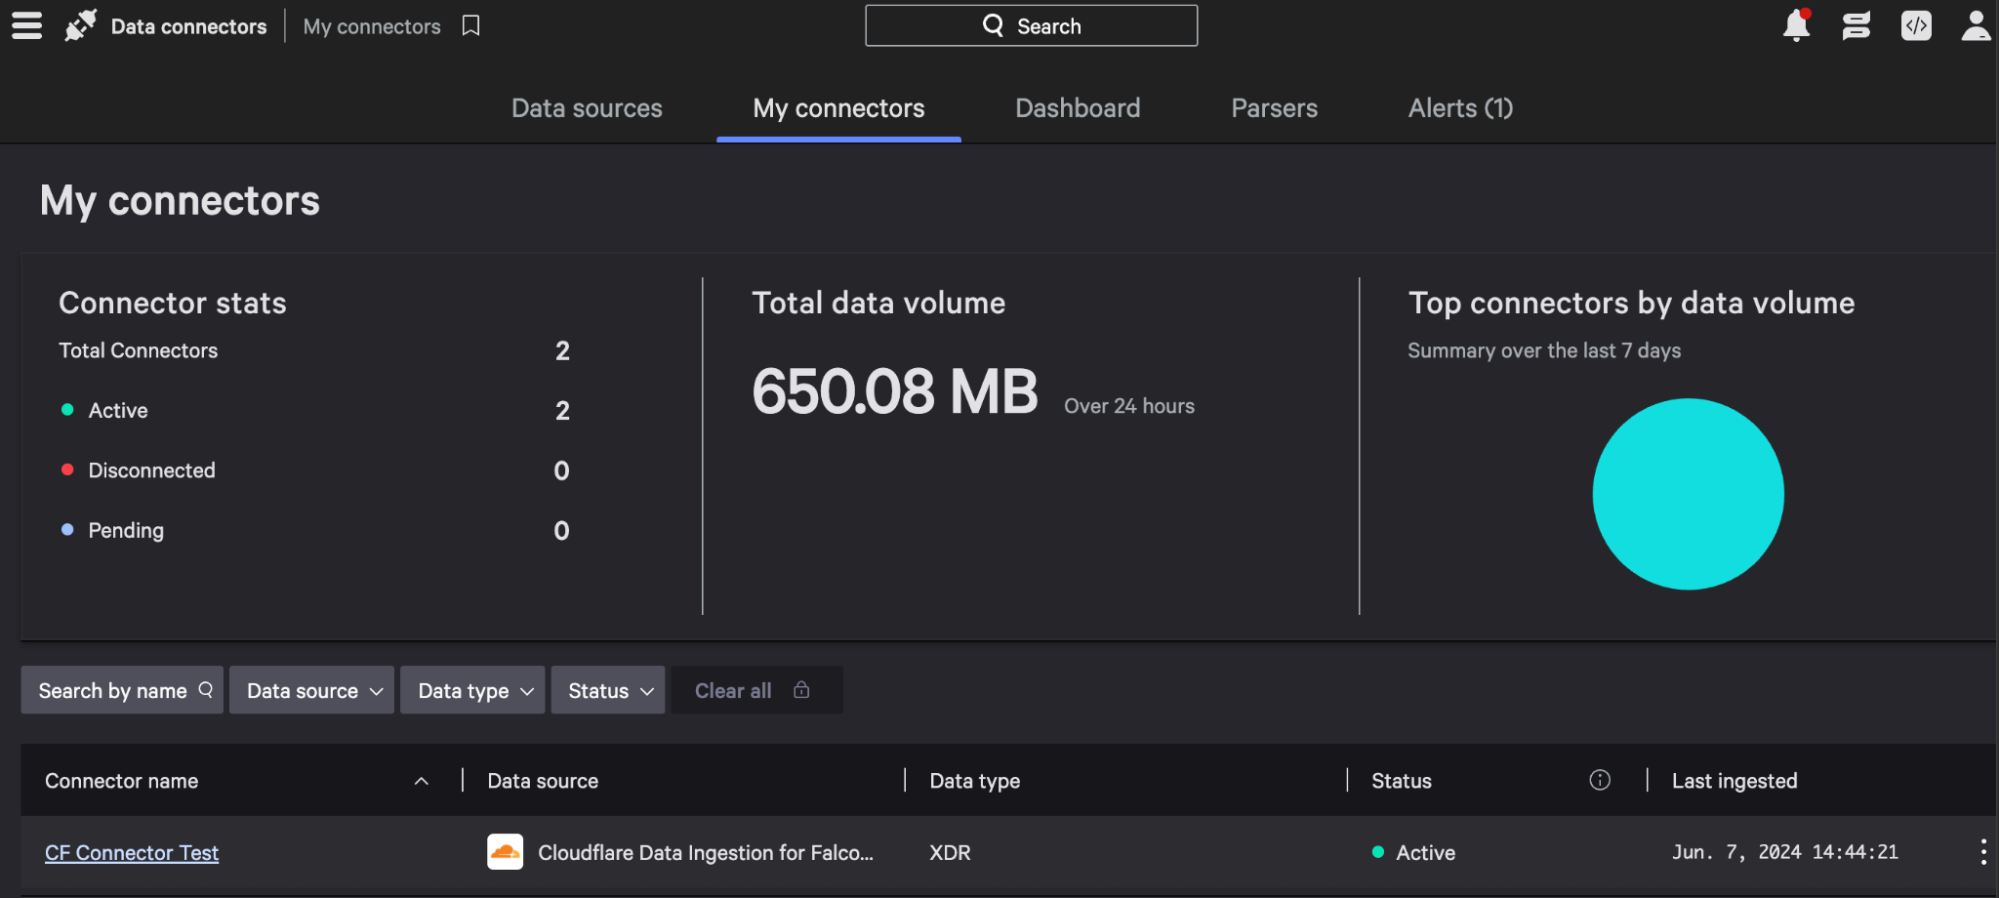

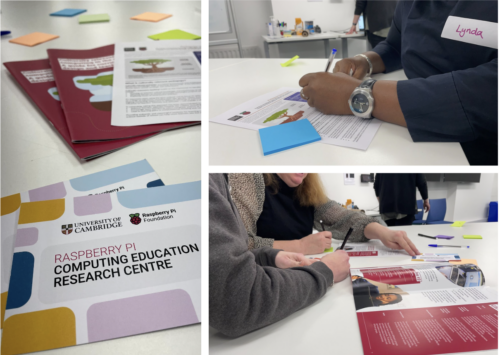


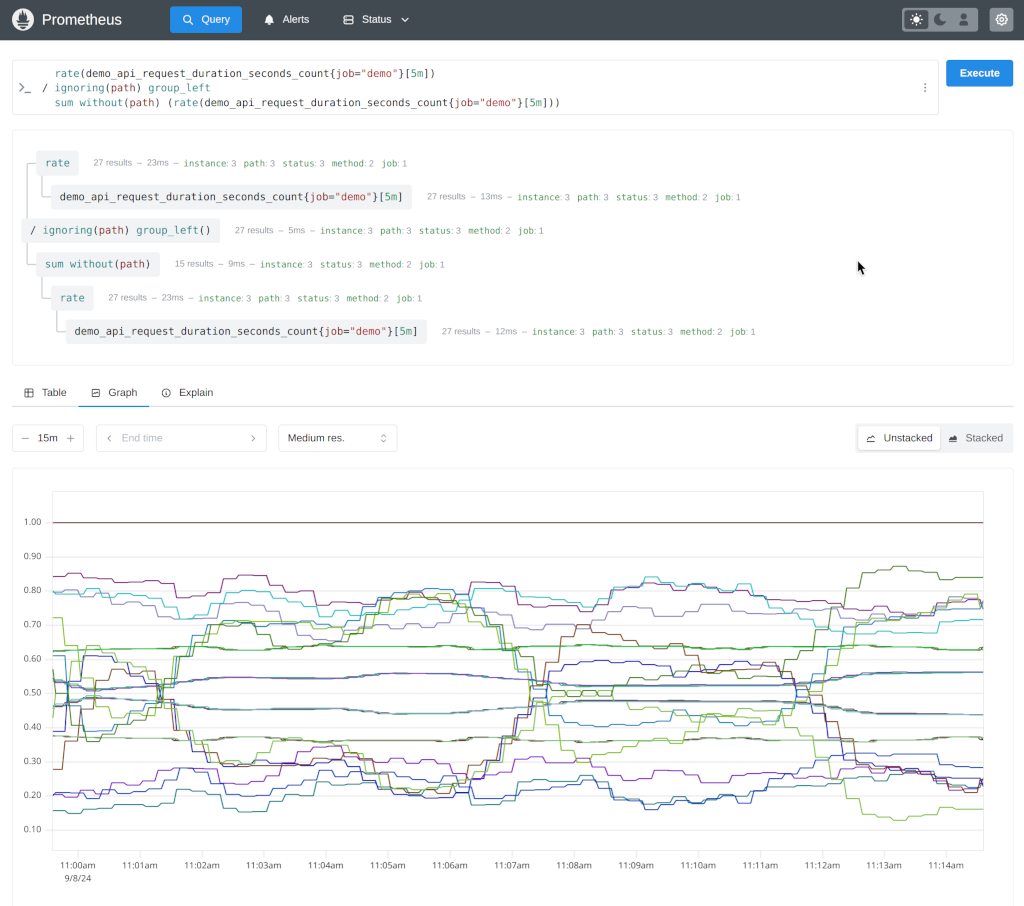

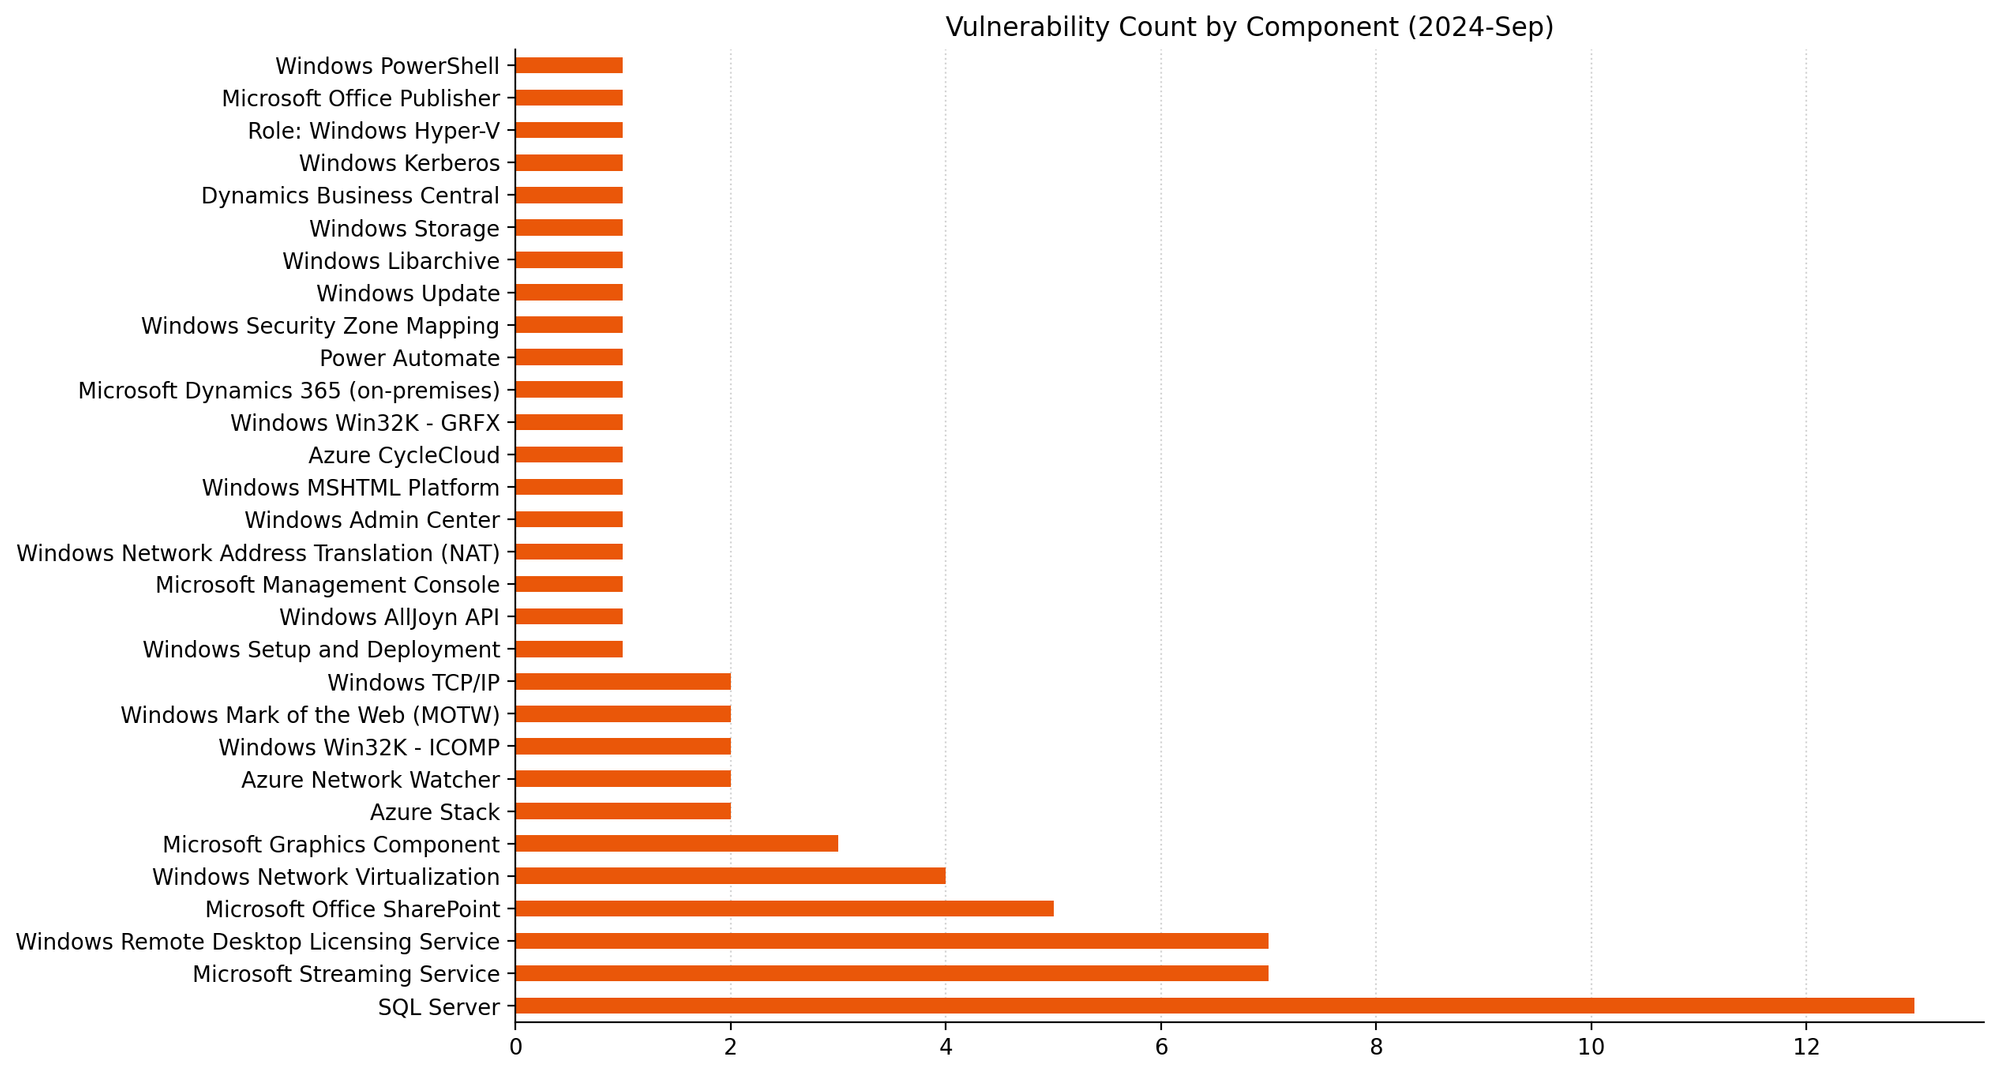
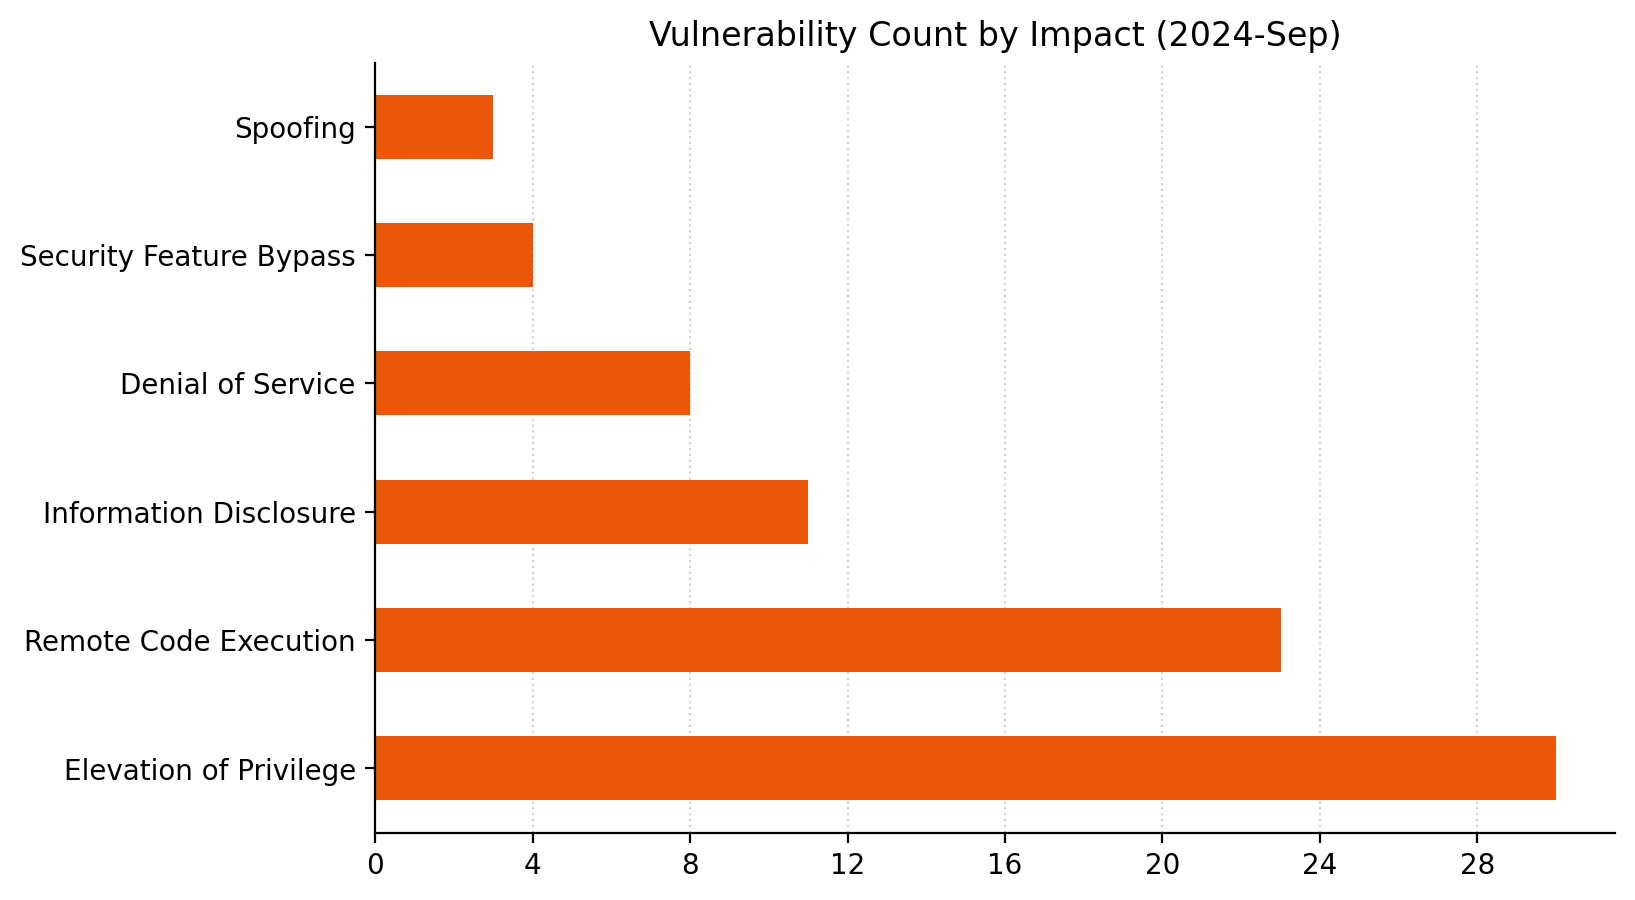
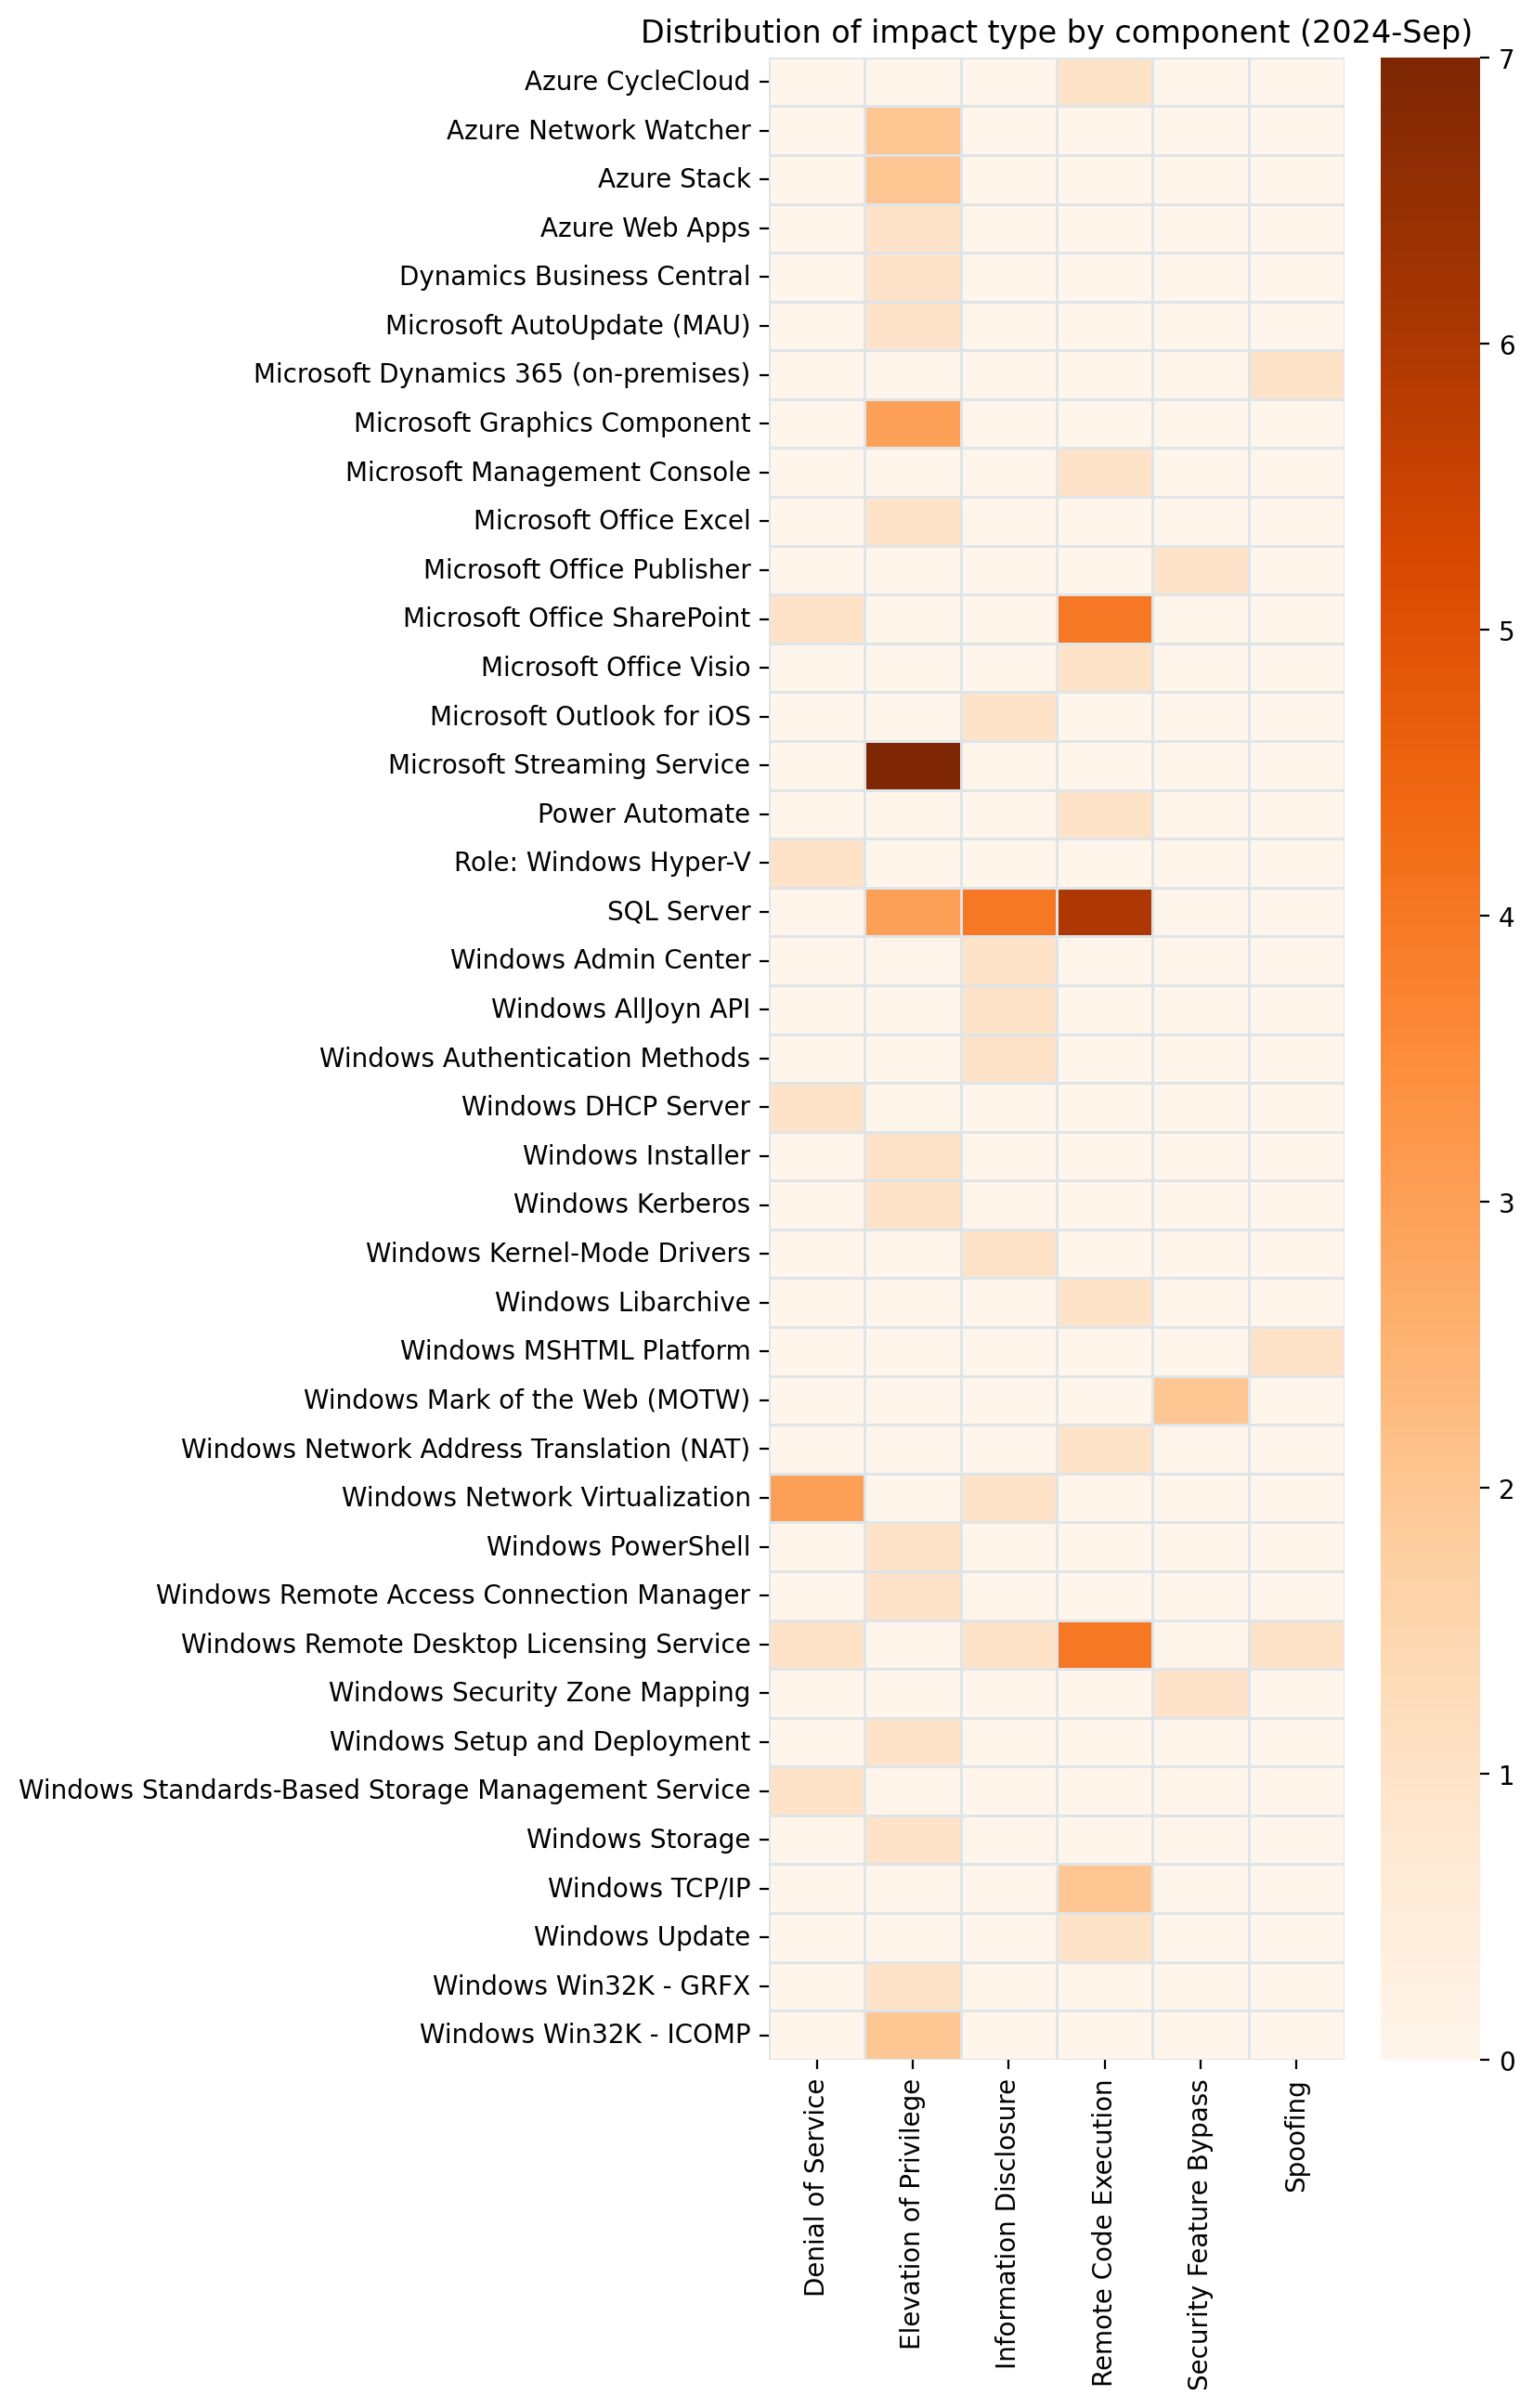
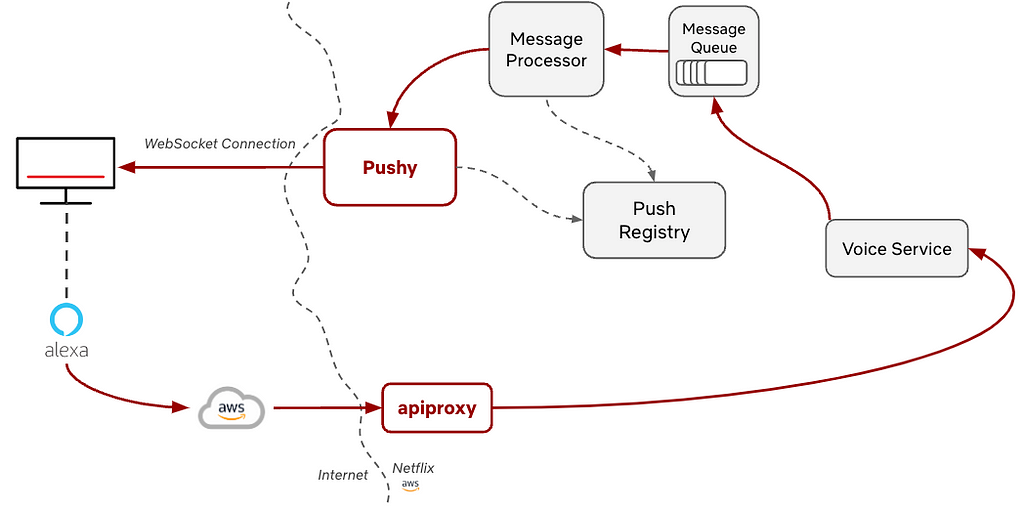
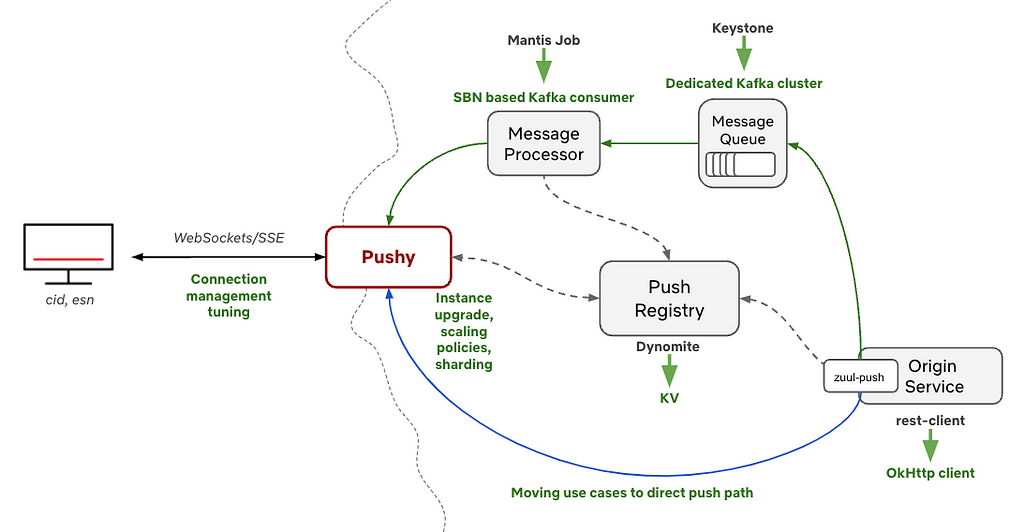
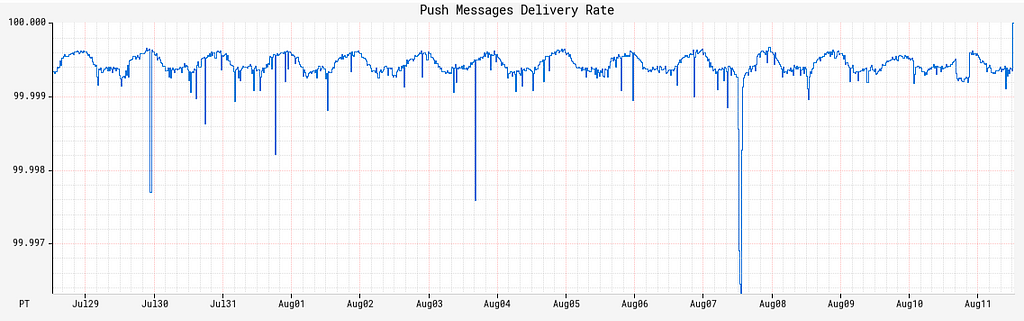
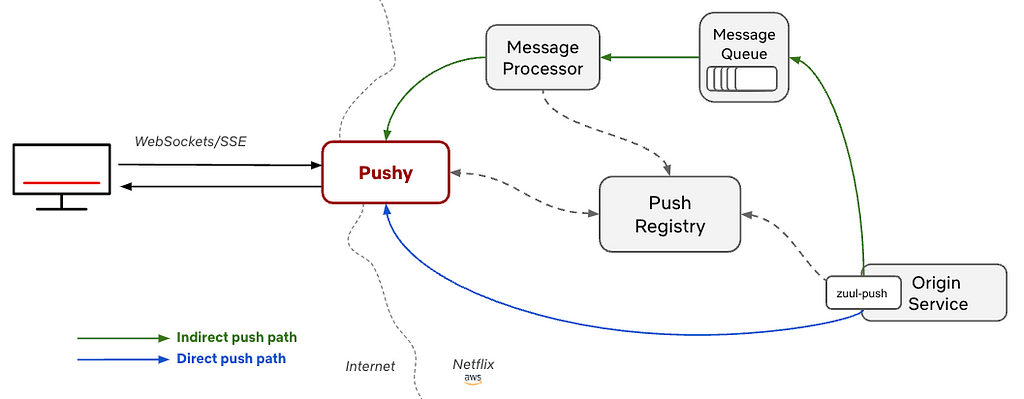
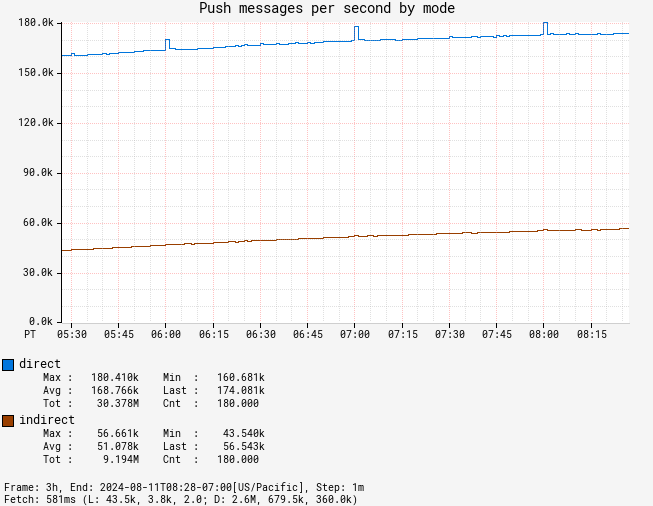

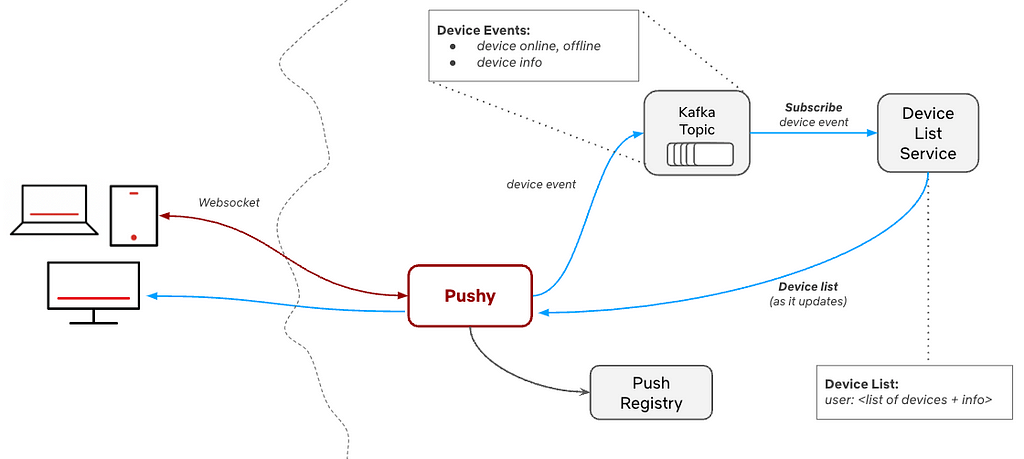
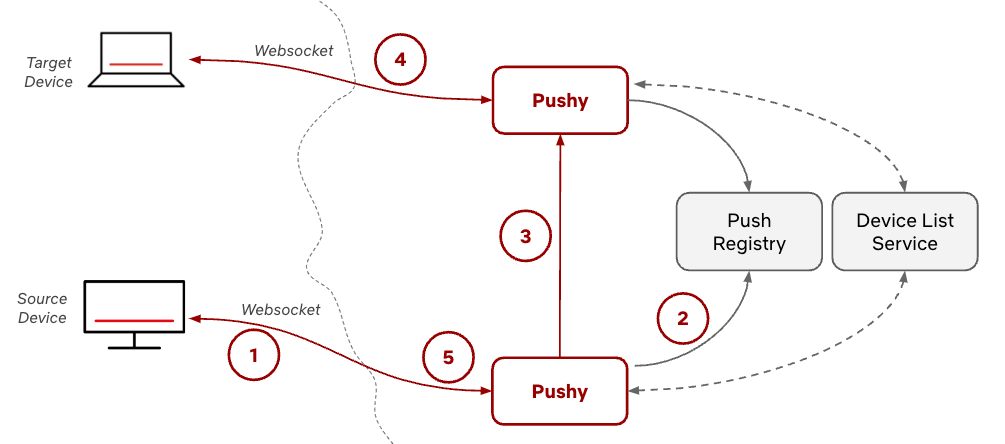
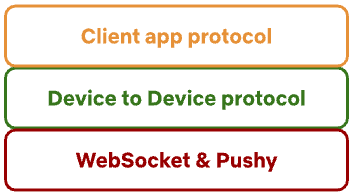
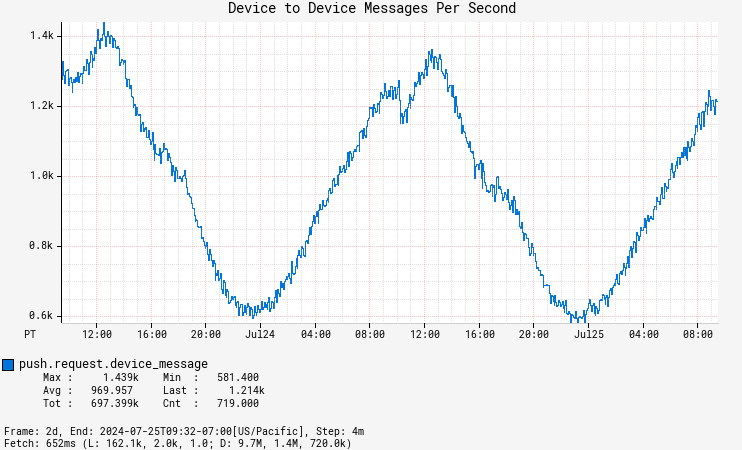
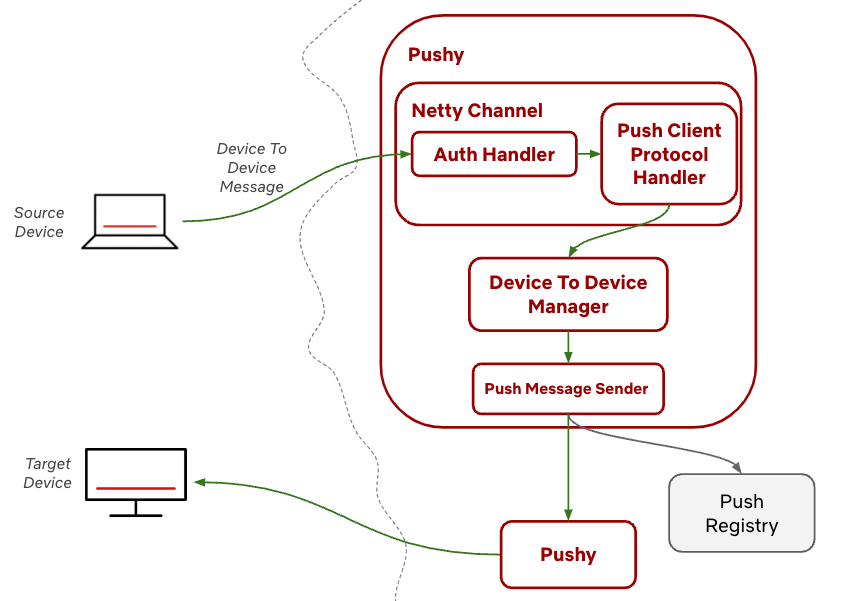