На второ четене: „Оланда“

Post Syndicated from Стефан Иванов original https://www.toest.bg/na-vtoro-chetene-olanda/

„Оланда“ от Рафал Вояшински

На второ четене: „Оланда“

Превод от полски Лъчезар Селяшки, изд. „Ерго“, 2021

Все по-трудно ми става да пиша за книги, които не само ми харесват, но и ме поразяват. Тази книга е кратка – новела и шест разказа на съвременен полски писател с множество награди. Чете се бързо и се заседява задълго в паметта. Eдновременно къса и залепва сърцето, сърцераздирателна е, но без сантименталност и евтини писателски манипулации. Тя е в равни части книга за оптимизма, но и за „Болка. Болко-о-о! Болчице…“ на Александър Геров.

Вояшински е особен писател. Съзнателно върви не само срещу течения и моди в литературата, а срещу цяла ценностна и цивилизационна рамка и начин на мислене – тази на рационализма. Той вярва в тайната и мистерията на живота. Полският автор не е концептуален, не е метафикционален, не неговият глас стои зад този на персонажите, правдоподобен е във фикцията си.

Книгата е за това какво е да срещнеш и чуеш Бог на улицата под формата на вик, както казва Джойс.

Да се разминеш с него даже. Вояшински пише за всекидневни епифании и срещи с непризнати светци от дъното на обществото. Има озарение и разрез в реалното при прочит, има пробойна в навика. Разтърсваща книга.

Като четях, пред очите ми изникваха възрастните хора от филмите на Кешловски, които просто преминават през кадъра и не казват нищо, но са там. Като пратеници на нещо, предрешени ангели или свидетелство, че има и друго в съществуването, освен всекидневното страдание.

В разказите и новелата на Вояшински има изпитване на границите на живота. Има отиване до ръба и отвъд него. Прозата му се състои от наблюдения, дневници, описания на видяното от живота на зачеркнатите, унижените и оскърбените. Има живот, който е оглозган до болка, стенание и мърморене. Но и този живот се живее; неговите свидетели и наблюдатели съществуват.

Вояшински с лекота създава съвременни истории от библейски мащаб,

и то по такъв начин, че да въздействат непосредствено. Не сочат с пръст, освен в раната, не са надменни и не те засрамват. Не са смекчени или захаросани. Изпълват със сурово съчувствие и запазват достойнството на героите. Реториката и стилът са високи и ниски, от улицата до небето.

„Оланда“ е лична, интимна и изповедна новела, обяснение в любов, обръщение към субект на любовта, евангелие или проповед към човечеството, което представлява всеки един човек сам по себе си. Изреченията са концентрирани като стихове – с истини, факти и открития. Не е нужно да се напомня, че полската поезия (не само със своите Нобелови лауреати) е една от най-добрите в света през този и през миналия век.

На второ четене: „Оланда“

Главният герой в „Оланда“ е сметнат за мъртъв при раждането си и баща му го слага в куфар, с който отива да пие и яде, и едва по-късно се оказва, че бебето е живо. Четейки това, се сетих за „Куфарът на баща ми“ на Орхан Памук, Нобеловата му лекция. В неговия куфар има ръкописи на бащата. В този на Вояшински има настояване,  

че тези, които с погнуса и пренебрежение подминаваме, са същите като нас. Че грозното и нелицеприятното са неизменна част от света. Както и щастието.

Парадоксалната формула, че „човек е нещастен, защото не знае, че е щастлив, само затова“, от „Бесове“ на Достоевски пронизва и писането на полския автор. Той не се стреми да шокира, като разказва и показва това, от което отвръщаме очи, напротив. А ако има шок, то той е в смисъла на shok, „приятел“ на албански – героите ти стават близки и подтикват към сепване и смирение.

Още в началото на книгата има колкото падение и безутешност, толкова и стоицизъм и любов. В монолозите и фрагментите към Оланда, работеща в магазин за хранителни стоки, има фрагменти и откъси, сравними както с Витгенщайн и Достоевски, така и с Шекспир. Какво е нужно, за да има живот – „голо тяло и друго тяло и да се хапне нещо“, „човекът е полудял от това, че съществува“, „с малък мозък е трудно да се лъже нечестно. Може само честно“. Героят в „Оланда“ е почиствал септични ями, бил е чистач, отглеждал е кокошки, поставял е ушни марки на бикове, белил е лук в цех за консерви, бил е охранител и огняр.

Героите на Вояшински не знаят готовите големи отговори на големите въпроси. Те не са образовани, култивирани и в крак с времето, тенденциите и технологиите. Лишени са от цинизъм, лицемерие и обиграност, бедни са и онеправдани. Не могат да бъдат победители. Те са по дефиниция от губещата страна.

Въпросът в тази книга е как светът да не е разочарование,

и отговорът е, че до истинска надежда се достига, когато не се надяваш. За героите въпросите за самоопределението и за смисъла на живота не са теоретични или академични, а са важни и могат да спасят или опропастят остатъка от дните им. Могат да ги приближат или отдалечат от болката, гробищата или лудостта. Могат да заситят нуждата им от надежда. Могат да отместят страховете им. И да открият истинското лице на оптимизма –

оптимизмът е любов към липсата на смисъл. Бог се появява от любовта към липсата на смисъл. Защото това е върхът на любовта към живота.

При представянето на „Оланда“ в София  авторът припомня, че човек не бива да се възгордява прекалено много и че най-важното – животът и смъртта – не е измислено от човешки разум. Вояшински не е съгласен с предпоставката, че няма енигми за човека, и писането му е опит за израз на тайната, по-стара от езика, религията и идеите. Убеден е, че въпреки насилието, агресията, експлоатацията и унищожението има и нещо друго и то може да се нарече и любов. Тази тайна, на която даваме много имена, ни пази от капаните на идеологията и от очевидни лъжи, но невинаги.

Вояшински държи на това, че тази красива тайна присъства във всички хора. А ако някак решим, както се е случвало и преди в историята, че някои хора просто нямат значение, то значи и другите хора, без оглед на това дали са богати, дали са на власт, или са талантливи, също нямат значение.

Авторът припомня и че Диоген е бил бездомен уличник, Сократ е приличал на скитник със скъсани дрехи, ходил е пиян по улиците на Атина и не е бил никак привлекателен, а по-скоро вонящ досадник. Те, допълва Вояшински, както и Сидхарта, Исус и Омир, не са написали нищо, а са разговаряли с няколко души, не и с тълпи. И са заставали на страната на гения на живота, не само на гения на човека. Този гений е по-древен от човешкия разум и за разлика от него, не е монологичен, скучен и най-вече авторитарен и поробващ.

Човешкият разум в своята крайност води до диктатура, а не до толкова необходимите и нужни свобода, грижа и любов.

Във връзка с отминалите и с винаги предстоящите празници, а и с част от все по-консервативно настроените сънародници и гласоподаватели бих цитирал и този пасаж:

Трябва да помним, моя златничка кокошчице, че Исус не е вдигнал къща, не е ходел в шест часа сутринта на работа, не е спестявал, не е заемал висока длъжност, не е имал обществено положение. Кой би желал такъв зет? Тогава какво правим ние? На кого подражаваме?


Активните дарители на „Тоест“ получават постоянна отстъпка в размер на 20% от коричната цена на всички заглавия от каталога на „Ерго", както и на няколко други български издателства в рамките на партньорската програма Читателски клуб „Тоест“. За повече информация прочетете на toest.bg/club.

Никой от нас не чете единствено най-новите книги. Тогава защо само за тях се пише? „На второ четене“ е рубрика, в която отваряме списъците с книги, публикувани преди поне година, четем ги и препоръчваме любимите си от тях. Рубриката е част от партньорската програма Читателски клуб „Тоест“. Изборът на заглавия обаче е единствено на авторите – Стефан Иванов и Севда Семер, които биха ви препоръчали тези книги и ако имаше как веднъж на две седмици да се разходите с тях в книжарницата.


Светът е голям и Атлас дебне отвсякъде

Post Syndicated from original https://www.toest.bg/svetut-e-golyam-i-atlas-debne-otvsyakude/

Светът е голям и Атлас дебне отвсякъде

Докато в България течаха предизборни дебати за и против евроатлантическото бъдеще на страната, аз предприех свое собствено евроатлантическо пътуване: прелетях от София до най-западната част на Европа, пресякох протока между Атлантическия океан и Средиземно море и се озовах в Африка. Освен със зашеметяващи гледки, а често и с необичайни вкусове, звуци и миризми, пътуването в Андалусия, през Гибралтар, а впоследствие и из Мароко ме впечатли и с изобилието от любопитни и неочаквани етимологии на иначе познати думи и топоними.

За илюстрация: наименованието Андалусия (الأندلس, или Al-Andalus на арабски) произлиза от племената на вандалите, чието име впоследствие става нарицателно за хора, които безсмислено унищожават културни ценности; Гибралтар е испанизирана версия на арабското جبل طارق (Jabal Ṭāriq), или „планина Тарик“, наречена на арабския пълководец от берберски произход Тарик ибн Зияд, който предвожда мюсюлманското завладяване на Пиренейския полуостров през VIII век; Мароко пък идва от наименованието на град Маракеш, за което се смята, че е заимствано от берберското словосъчетание ⴰⵎⵓⵔ ⵏ ⴰⴽⵓⵛ (amur n Yakuš), буквално „божия земя“¹.

Точно в покрайнините на Маракеш, докато пиех кафе на покрива на една къща, видях гледка, която ще остане в съзнанието ми дълго след края на пътуването: редица високи палми² на фона на заснежените върхове на планината Атлас.

Всъщност от тази част на Мароко се вижда Висок Атлас – една от трите вериги, заедно с Антиатлас в югозападната част на страната и Среден Атлас в западната, която съставлява мароканската част на планината. Цялата планинска система, чиято обща дължина е около 2500 км, започва от мароканския бряг на Атлантическия океан и се простира по посока изток покрай крайбрежието на Средиземно море, през териториите на Мароко, Алжир и Тунис.

Подобно на начина, по който гледката събира неочаквани и някак (смятани за) несъвместими елементи (тропици, пустиня и планини, Изток и Запад, съвременност и безвремие), наименованието на планината Атлас – а както с изненада научих, също и на Атлантическия океан³ – вплита в себе си многостранни, често противоречиви етимологии и разнообразни езикови, географски и исторически елементи.

Най-популярната теория за произхода на топонима е, че планината е наречена на древногръцкия титан Атлас, за когото съществуват множество легенди и истории.

Според една от тях Атлас участва заедно с други титани в Титаномахия, 10-годишната война срещу олимпийските богове, която титаните загубват. За наказание Зевс изпраща Атлас в най-западния край на познатия тогава свят (за който се смятали Северозападна Африка и Атлантическият океан⁴) и го осъжда да носи небесата върху плещите си за вечни времена.

В „Одисея“ Омир споменава Атлас като морско създание, което поддържа стълбовете между небето и земята, за да не се слеят. А за самите стълбове се смятало, че се намират в океана отвъд най-западния хоризонт⁵. Атлас се появява и в мита за Херакъл (по-известен с древноримското име Херкулес), където титанът успява временно да се отърве от бремето си, но в края на краищата бива надхитрен и отново принуден да се нагърби с небесната сфера.

В друг мит пък Атлас е представен като крал, който отказва на Персей гостоприемство, а Персей му отмъщава, като му показва отрязаната глава на Медуза. Виждайки това, Атлас се вкаменява: брадата и косата му се превръщат в гъсти гори, ръцете и раменете – във високи скали, а главата му – в планински връх, и той отново е заставен да поддържа небесния свод и съзвездията⁶.

По-късни легенди разказват за Атлас като за митологичен крал на Мавретания (да не се бърка с днешната държава Мавритания) – старото латинско наименование на региона, днес известен като Магреб, който включва Мароко, Западна Сахара, Алжир и Тунис (тоест района на Атласките планини)⁷. Въпросният крал, подобно на древногръцкия титан, имал дълбоки познания по философия, математика и астрономия и се смята за откривател на първата небесна сфера.

Идеята за тежкия товар, поне според някои лингвисти, е отразена и в етимологията на името Атлас (или Атлант). Според тях то идва от древногръцката дума τλῆναι (tlênai), която означава „понасям“, „издържам“, „търпя“, и на свой ред произлиза от протоиндоевропейското *telh₂- („издържам“, „поддържам“, „подкрепям“). В Etymological Dictionary of Greek (Етимологичен речник на гръцкия език) от 2010 г. обаче нидерландският лингвист Роберт С. П. Бекес опровергава тази теория с аргумента, че няма как древногръцкият титан да носи име с индоевропейски корен. Вместо това Бекес предполага, че произходът на думата всъщност е предгръцки, какъвто често е случаят с думи, завършващи на -ant.

Според други теории името на планината всъщност произлиза от езиците на нейните коренни обитатели, берберите.

Тук отварям скоба: наименованието на берберите идва от древногръцкото βάρβαρος (bárbaros), което първоначално означава „негръцки“ или „чужд“, а разбира се, впоследствие се превръща в източник и на думата „варвари“⁸. Някои лингвисти предполагат, че оригиналната дума има ономатопеичен произход, като имитация на неразбираемия за древните гърци говор на чужденците (нещо като „бъра-бъра“). Първоначално думата е била по-скоро неутрална, но с течение на вековете значението ѝ става пейоративно и в речниците на много европейски езици, включително и на български, тя започва да се използва като определение за „див, жесток, изостанал, нецивилизован човек“. Поради тази причина наименованието „бербери“ вече все повече и повече се смята за проблематично и на негово място започва да навлиза алтернативното ⵉⵎⴰⵣⵉⵖⵏ, ⵎⵣⵗⵏ (Imaziɣen), или „свободни хора“, а колективното име на различните им, но сходни езици е „тамазигт“⁹.

Точно на въпросните езици тамазигт думата за „планина“ е ⴰⴷⵔⴰⵔ (adrar) и според някои теории наименованието Атлас всъщност произлиза точно от нея.

Ето как, противно на общоприетите теории,

може да се окаже, че не древногръцкият титан е заел името си на планината, а обратното –

берберската дума за „планина“ е послужила като първоизточник на името Атлас, а съпътстващите легенди за поддържащия небесата титан са натъкмени към името и планината впоследствие.

Освен че обръща разбиранията ни за света с главата надолу, от тази етимологична теория също така следва, че словосъчетанието „планината Атлас“ е тавтологично, тоест ако се върнем на произхода на наименованието, то на практика гласи „планината Планина“.

Но дори и Атлас да не е дал името си на планината, със сигурност го е дал на няколко други немаловажни, макар и не толкова монументални географски, архитектурни, анатомични и психологически понятия.

На първо място, разбира се, е добре познатият ни географски атлас.

Появата на думата като съществително, което според Речника на българския език на БАН описва „събрани и подредени по определена система географски карти, издадени във вид на албум или книга“, датира от края на XVI век. Образът на древногръцкия титан първоначално се появява на заглавната страница на колекция от географски карти, издадена през 1572 г. от картографа и издател Антонио Лафрери в Рим. Самата дума „атлас“ обаче се използва за първи път от немско-фламандският картограф Герардус Меркатор в издадения през 1595 г. (една година след смъртта му) Atlas, sive cosmographicae meditationes de fabrica mundi. Както подсказва латинското заглавие, Меркатор използва неологизма не просто за да опише колекция от карти, а като синоним на трактат за създаването, историята и описанието на Вселената и света. С течение на времето значението на думата се променя и от средата на XVII век тя започва да се използва с дефиницията, с която ни е позната и до днес. В английския език думата навлиза през 1636 г. чрез превода на гореспоменатото издание, а в българския според Етимологичния речник тя идва чрез руски или немски10.

Друго езиково понятие, което дължи произхода си на Атлас, е от сферата на архитектурата.

Известен като „атлант“ (получено от множественото число ἄτλαντες (atlantes), терминът обозначава каменна скулптура във формата на мъжка фигура, която служи като колона и подпира на раменете си издадена част от фасадата, например балкон или еркер. За разлика от други подобни архитектурни елементи със сходна функция, които обикновено имат неутрални пози и физиономии, като например женските скулптурни фигури, наречени „кариатиди“, изражението на атлантите много често отразява мъчителното усилие, причинено от поддържането на тежкия товар.

Тежкият товар – само, че този на собствената ни глава – става причина думата „атлас“ да навлезе и в анатомията,

където обозначава първия, най-горен шиен прешлен при хората (и при някои животни). Наименованието му, разбира се, се дължи на функцията на прешлена да поддържа нелекото „кълбо“ на главата. Когато в прешлена настъпят изменения, това може да доведе до заболяването фибромиалгия, известно още като синдром на Атлас.

Синдромът на Атлас съществува и в психологията

като обозначение на определен личностен тип (известен на английски като Atlas personality), проявяващ се при индивиди, които като деца са били сериозно психически натоварвани от родителите си и е трябвало да се грижат за тях. Като възрастни тези хора не са способни да се забавляват и живеят в постоянна тревога и с усещането, че целият свят тежи върху техните плещи.

Въпреки всички тези тягостни асоциации от различни сфери и въпреки тежестта, която започвам да чувствам в атласния си прешлен от дългото седене пред компютъра, споменът за гледката към заснежените върхове на планина Атлас ми носи усещане за спокойствие, въздух и лекота – все едно от раменете ми е паднал товар. Но е възможно и това олекване да е породено от завършването на настоящия текст.

1 Любопитно е, че на арабски името на Мароко всъщност е المملكة المغربية (al-Mamlakah al-Maghribiyyah), което в превод означава „Кралството на западното място“. Думата за „западното място“ е много сходна с наименованието Магреб, което иначе се използва като групово название за северната част на Африка, включваща Мароко, Западна Сахара, Алжир, Тунис – тоест за района на Атласките планини. На някои езици, например персийски, Мароко продължава да се нарича Маракеш, а на турски държавата е известна като Фaс, което идва от древната столица Фес.

2 Използвам случая, за да спомена и интересната етимология на думата „палма“, която произлиза от латинския термин за „длан“ – palma, поради приликата на палмовия лист с отворената длан на човешката ръка. По стечение на обстоятелствата пиша този текст на Цветница, чието наименование на някои езици не е свързано с цветя и растения по принцип, а конкретно с палми заради палмовите клонки, с които тълпите посрещнали Христос в Йерусалим. Това е отразено и в наименованията на празника на някои езици: Palm Sunday на английски, Palmsonntag нa немски, Palmzondag на нидерландски и т.н.

3 Връзката между планината Атлас и Атлантическия океан е по-ясно видима в наименованието ѝ на някои езици, например италиански, където тя се казва Atlante. Името на океана за първи път се среща през V в.пр.Хр. в трудовете на Херодот, който пише, че „морето на запад от Херкулесовите стълбове се нарича Ἀτλαντίς“. В „Илиада“ и „Одисея“, океанът е наречен с името на най-големия титан, Ὠκεανός, олицетворяващ митологичната огромна река, за която се вярвало, че опасва цялата земя.

4 Неслучайно древноримското наименование на Средиземно море е било Mare Nostrum, или „Нашето море“.

5 Макар че двете височини от европейската и от африканската страна на входа на Гибралтарския пролив са известни като Херкулесовите стълбове (Columnae Herculis), понякога – например в „Одисея“, те се срещат и под наименованието Стълбовете на Атлас. По време на Ренесанса се появява идеята, че между стълбовете е стоял надписът Non plus ultra, или „Нищо по-нататък“. (С обратното си значение – Plus ultra, думите се възприемат като лично мото от императора на Свещената Римска империя Карл V през XVI век, няколко десетилетия след като Колумб „открива“ Америка.)

6 Разглеждайки изображения на титана Атлас, забелязвам една съществена разлика: на някои от тях Атлас наистина държи небесния свод заедно със звездите, което отразява вярването на древните гърци, че земята е плоска. В други скулптури и картини обаче Атлас е изобразен да държи на раменете си цялото земно кълбо.

7 В периода между XV и началото на XIX век европейското название на средиземноморското крайбрежие на Магреб в Северна Африка е било Варвария (Barbaria) или Варварският бряг (Barbary Coast на английски, Côte des Barbaresques на френски, costa berberisca на испански, Costa berbera на италиански и т.н.).

8 За пръв път думата „варвари“ е използвана от Омир, който нарича племето кари βαρβαρόφωνος (barbarophonos) – буквално „варвароезични“, тоест с чужда, неразбираема реч.

9 Въпреки че заради „варварските“ асоциации думата „бербери“ вече се смята за проблематична и често се заменя с „имазиген“, наименованията (поне на някои езици) на част от животинските видове, които населяват планината Атлас, продължават да включват определението, като например берберски макак, берберски леопард и берберски елен, както и за съжаление вече изчезналия берберски лъв.

10 В Етимологичния речник думата „атлас“ се предхожда от нейния омофон „атлаз“, с който обаче не споделя общ произход – атлазът е копринен плат, чието наименования идва в българския чрез турски и произлиза от арабския глагол طَلَسَ (ṭalasa), означаващ „лъскам“, „чистя“, „изтривам“.

В рубриката „От дума на дума“ Екатерина Петрова търси актуални, интересни или новопоявили се думи от нашето ежедневие и проследява често изненадващия им произход, развитието на значенията им във времето и взаимовръзките им с близки и далечни езици.

[$] Disabling SELinux’s runtime disable

Post Syndicated from original https://lwn.net/Articles/927463/

Distributors have been enabling the SELinux security module for nearly
20 years now, and many administrators have been disabling it on their
systems for almost as long. There are a few ways in which SELinux can be
disabled on any given system, including command-line options, a run-time
switch, or simply not loading a policy after boot. One of those ways,
however, is about to be disabled itself.

3 Key Challenges to Clarity in Threat Intelligence: 2023 Forrester Consulting Total Economic Impact™ Study

Post Syndicated from Stacy Moran original https://blog.rapid7.com/2023/04/20/3-key-challenges-to-clarity-in-threat-intelligence/

3 Key Challenges to Clarity in Threat Intelligence: 2023 Forrester Consulting Total Economic Impact™ Study

Inundated with data

It would have been really cool to combine those two words to make “inundata,” but it would have been disastrous for SEO purposes. It’s all meant to kick off a conversation about the state of security organizations with regard to threat intelligence. There are several key challenges to overcome on the road to clarity in threat intelligence operations and enabling actionable data.

This is the second entry in a blog series based on The Total Economic Impact™ of Rapid7 Threat Command For Digital Risk Protection and Threat Intelligence. Let’s dive into three challenges organizations are facing when it comes to threat intelligence.

Lack of visibility and actionable data

For the commissioned study, Forrester conducted interviews with four Rapid7 customers and collated their responses into the form of one representative organization and its experiences after implementing Rapid7’s threat intelligence solution, Threat Command. Interviewees noted that prior to utilizing Threat Command, lack of visibility and unactionable data across legacy systems were hampering efforts to innovate in threat detection. The study stated:

“Interviewees noted that there was an immense amount of data to examine with their previous solutions and systems. This resulted in limited visibility into the potential security threats to both interviewees’ organizations and their customers. The data the legacy solutions provided was confusing to navigate. There was no singular accounting of assets or solution to provide curated customizable information.”

A key part of that finding is that limited visibility can turn into potential liabilities for an organization’s customers – like the SonicWall attack a couple of years ago. These kinds of incidents can cause immediate pandemonium within the organizations of their downstream customers.

In this same scenario, lack of visibility can also be disastrous for the supply chain. Instead of affecting end-users of one product, now there’s a whole network of vendors and their end-users who could be adversely affected by lack of visibility into threat intelligence originating from just one organization. With greater data visibility through a single pane of glass and consolidating information into a centralized asset list, security teams can begin to mitigate visibility concerns.

Time-consuming processes for investigation and analysis

Rapid7 customers interviewed for the study also felt that their legacy threat intelligence solutions forced teams to “spend hours manually searching through different platforms, such as a web-based Git repository or the dark web, to investigate all potential threat alerts, many of which were irrelevant.”

Because of these inefficiencies, additional and unforeseen work was created on the backend, along with what we can assume were many overstretched analysts. How can organizations, then, gain back – and create new – efficiencies? First, alert context is a must. With Threat Command, security organizations can:

  • Receive actionable alerts categorized by severity, type (phishing, data leakage), and source (social media, black markets).
  • Implement alert automation rules based on your specific criteria so you can precisely customize and fine-tune alert management.
  • Accelerate alert triage and shorten investigation time by leveraging Threat Command Extend™ (browser extension) as well as 24x7x365 availability of Rapid7 expert analysts.  

By leveraging these features, the study’s composite organization was able to surface far more actionable alerts and see faster remediation processes. It saved $302,000 over three years by avoiding the cost of hiring an additional security analyst.

Pivoting away from a constant reactive approach to cyber incidents

When it comes to security, no one ever aims for an after-the-fact approach. But sometimes a SOC may realize that’s the position it’s been in for quite some time. Nothing good will come from that for the business or anyone on the security team. Indeed, interviewees in the study supported this perspective:

“Legacy systems and internal processes led to a reactive approach for their threat intelligence investigations and security responses. Security team members would get alerts from systems or other teams with limited context, which led to inefficient triage or larger issues. As a result, the teams sacrificed quality for speed.”

The study notes how interviewees’ organizations were then motivated to look for a solution with improved search capabilities across locations such as social media and the dark web. After implementing Threat Command, it was possible for those organizations to receive early warning of potential attacks and automated intelligence of vulnerabilities targeting their networks and customers.

By creating processes that are centered around early-warning methodologies and a more proactive approach to security, the composite organization was able to reduce the likelihood of a breach by up to 70% over the course of three years.

Security is about the solutions

Challenges in a SOC don’t have to mean stopping everything and preparing for a years-long audit of all processes and solutions. It is possible to overcome challenges relatively quickly with a solution like Threat Command that can show immediate value after an accelerated onboarding process. And it is possible to vastly improve security posture in the face of an increasing volume of global threats.  

For a deeper-dive into The Total Economic Impact™ of Rapid7 Threat Command For Digital Risk Protection and Threat Intelligence, download the study now. You can also read the previous blog entry in this series here.

Security updates for Thursday

Post Syndicated from original https://lwn.net/Articles/929671/

Security updates have been issued by Debian (golang-1.11), Fedora (chromium, golang-github-cenkalti-backoff, golang-github-cli-crypto, golang-github-cli-gh, golang-github-cli-oauth, golang-github-gabriel-vasile-mimetype, libpcap, lldpd, parcellite, tcpdump, thunderbird, and zchunk), Red Hat (java-11-openjdk, java-17-openjdk, and kernel), SUSE (chromium, dnsmasq, ImageMagick, nodejs16, openssl-1_0_0, openssl1, ovmf, and python-Flask), and Ubuntu (dnsmasq, libxml2, linux, linux-aws, linux-aws-5.4, linux-azure, linux-azure-5.4, linux-gcp,
linux-gcp-5.4, linux-gke, linux-gkeop, linux-hwe-5.4, linux-ibm,
linux-ibm-5.4, linux-kvm, linux-oracle, linux-oracle-5.4, linux-raspi,
linux-raspi-5.4, linux, linux-aws, linux-aws-hwe, linux-azure, linux-azure-4.15,
linux-dell300x, linux-gcp, linux-gcp-4.15, linux-hwe, linux-kvm,
linux-oracle, linux-raspi2, linux-oem-5.17, linux-oem-6.0, linux-oem-6.1, and linux-snapdragon).

Secure by default: recommendations from the CISA’s newest guide, and how Cloudflare follows these principles to keep you secure

Post Syndicated from Patrick R. Donahue original https://blog.cloudflare.com/secure-by-default-understanding-new-cisa-guide/

Secure by default: recommendations from the CISA’s newest guide, and how Cloudflare follows these principles to keep you secure

Secure by default: recommendations from the CISA’s newest guide, and how Cloudflare follows these principles to keep you secure

When you buy a new house, you shouldn’t have to worry that everyone in the city can unlock your front door with a universal key before you change the lock. You also shouldn’t have to walk around the house with a screwdriver and tighten the window locks and back door so that intruders can’t pry them open. And you really shouldn’t have to take your alarm system offline every few months to apply critical software updates that the alarm vendor could have fixed with better software practices before they installed it.

Similarly, you shouldn’t have to worry that when you buy a network discovery tool it can be accessed by any attacker until you change the password, or that your expensive hardware-based firewalls can be recruited to launch DDoS attacks or run arbitrary code without the need to authenticate.

This “default secure” posture is the focus of a recently published guide jointly authored by the Cybersecurity and Infrastructure Agency (CISA), NSA, FBI, and six other international agencies representing the United Kingdom, Australia, Canada, Germany, Netherlands, and New Zealand. In the guide, the authors implore technology vendors to follow Secure-by-Design and Secure-by-Default principles, shifting the burden of security as much as possible away from the end-user and back towards the manufacturer:

The authoring agencies strongly encourage every technology manufacturer to build their products in a way that prevents customers from having to constantly perform monitoring, routine updates, and damage control on their systems to mitigate cyber intrusions. Manufacturers are encouraged to take ownership of improving the security outcomes of their customers. Historically, technology manufacturers have relied on fixing vulnerabilities found after the customers have deployed the products, requiring the customers to apply those patches at their own expense. Only by incorporating Secure-by-Design practices will we break the vicious cycle of creating and applying fixes.

In this post we’ll review some of the authors’ recommendations, discuss how Cloudflare applies these principles to the products that we build, and provide some suggestions on what other organizations can do to support similar initiatives internally.

Secure-by-Default: building products that require minimal hardening

Cloudflare makes cybersecurity products that protect employees, applications, and networks from attack. Typically, the ideas for new products and features come from one of two places: i) customers who are expressing a risk they’re worried about; or ii) our own internal Security team asking for help better securing Cloudflare’s internal network from threats. (The products that we build for our Security team are also then made available to our customers, once they’re battle tested internally.)

Wherever the source, when a product manager thinks through a new product offering, they first socialize the idea around the company for feedback. Often this feedback includes encouragement to make the product more “magical”. What this means in practice is that customers should have to do less, but get more; our job is essentially to make security administrators’ lives easier so they can focus their time where it’s most needed. An early example of this approach can be found in our blog post announcing Universal SSL in 2014:

For all customers, we will now automatically provision a SSL certificate on CloudFlare’s network that will accept HTTPS connections for a customer’s domain and subdomains.

The idea sounds simple but in 2014 this approach to SSL/TLS was unique in the industry: every other platform required customers to take some action before their website was encrypted-in-transit using HTTPS to protect against snooping and impersonation. Security administrators either had to go acquire the certificate themselves and upload (and renew) it, or manually perform some steps to demonstrate ownership to a certificate authority (CA). Because Cloudflare both manages authoritative DNS for our customers and runs a global reverse proxy, we can take care of all these steps automagically. Additionally, as new SSL/TLS attacks are discovered, we automatically improve how our servers negotiate encryption with browsers and API clients to keep our customers secure. No customer configuration or oversight is required.

We agree with CISA’s statement that “[t]he complexity of security configuration should not be a customer problem.” And aim to build products that materially improve security with little to no customer action beyond putting their employees, applications, and networks behind Cloudflare:

Secure-by-Default products are those that are secure to use “out of the box” with little to no configuration changes necessary and security features available without additional cost. Together, these two principles move much of the burden of staying secure to manufacturers and reduce the chances that customers will fall victim to security incidents resulting from misconfigurations, insufficiently fast patching, or many other common issues.

Another example of our Secure-by-Default approach is how we protect against “0 day” attacks in our Web Application Firewall using machine learning (ML). Zero day attacks are security vulnerabilities discovered by attackers or researchers before the software vendor is aware of the issue (or has had a chance to release a patch). Often the attack is exploited “in the wild” before customers are able to plug the holes in their systems, or their upstream security vendors are able to virtually patch the issue. A recent, widely-exploited 0 day was Log4j; software manufacturers using this library in their code raced to update their software as quickly as possible. But many took days, weeks, or even months to do so.

Cloudflare is proud of the speed at which we responded to Log4j, and the fact we provide the highest severity WAF protections to all plans including Free—but it’s always a race against the clock. We created the ML-computed WAF Attack Score to provide our customers with a more Secure-by-Default system that didn’t rely on new rules being raced out, or making reactive configuration changes. The way most WAFs work is they match properties of an incoming HTTP request against a set of “signatures”, which are essentially patterns described using regular expressions. We do that too, but we also train ML models on the “true positive” matches, which allow us to infer the likelihood a new request is malicious even when it doesn’t match a signature. Customers can write one rule up front that blocks high-confidence malicious requests, and they’re protected against 0 days thereafter. Secure by default, even against attacks that have not yet been discovered.

One final example of this approach can be found in how we designed Cloudflare One, the zero trust suite we initially built to protect Cloudflare’s own employees and networks. When we opened Cloudflare One to businesses of all sizes, we wanted a secure-by-default way to connect and protect corporate networks that didn’t require poking a bunch of holes in network firewalls.

Instead of this traditional route that requires security administrators to make upfront changes and avoid firewall configuration drift over time, we designed Cloudflare Tunnel to establish mutually authenticated, encrypted connections directly to Cloudflare’s edge. Additionally, we wanted to completely shut off access to our customers’ networks by default, except for access to specific applications by strongly-authenticated users rather than IP and port holes that aren’t tied to a known identity.

Secure-by-Design: continual (re)investment in secure development practices

Secure defaults that require minimal customer invention are critically important, but not sufficient on their own to protect our customers. How the products are built by engineering and evaluated by our CSO organization for adherence to secure development practices is just as important in minimizing vulnerabilities that may result in customer compromise. And none of that matters without the support from executive leadership to make significant investments that may not immediately result in visible customer benefit.

Cloudflare’s engineering team builds products using the most secure development practices and tools available at the time of implementation, that sufficiently meet the requirements and architectural constraints. The options available evolve over time of course, so what was most appropriate (and secure) back in 2013 when we wrote the initial version of the Cloudflare WAF may no longer be the best option in 2023. Lua made sense for us for the reasons outlined in this talk, but when the WAF was starting to show its age in 2017 we had a choice: continue bolting on features quickly to try to close the gap with competitive products, or invest in a memory-safe language that improved security and performance at the cost of near-term momentum?

We knew that if we designed our underlying WAF platform correctly, customers—at scale—could more easily adopt other Application Security products such as Bot Management and our new API Gateway. Our existing core WAF functionality would also benefit from new evaluation engines, running 40% faster and becoming more resilient. But proposing an entire rewrite of a system that processed millions of requests per second in a relatively nascent language, Rust, was not a small undertaking or ask. Fortunately we had the full support of Cloudflare’s executive and technical leadership teams to make this investment, which is critical for security as CISA et al. write (emphasis added):

Secure-by-Design development requires the investment of significant resources by software manufacturers at each layer of the product design and development process that cannot be “bolted on” later. It requires strong leadership by the manufacturer’s top business executives to make security a business priority, not just a technical feature.

[and]

Manufacturers are encouraged to make hard tradeoffs and investments, including those that will be “invisible” to the customers, such as migrating to programming languages that eliminate widespread vulnerabilities. They should prioritize features, mechanisms, and implementation of tools that protect customers rather than product features that seem appealing but enlarge the attack surface.

The end result of our efforts was a new WAF rule evaluation engine entirely written in Rust—a performant, memory-safe language that is immune to buffer overflow attacks and has positioned us well for the future. After that rewrite, our Cache team also embarked on a similarly XL-sized project called Pingora, which replaced NGINX with a Rust-based reverse proxy engine called Pingora. These projects were costly, but improved the security posture of our customers:

The authoring agencies acknowledge that taking ownership of the security outcomes for customers and ensuring this level of customer security may increase development costs.

However, investing in “Secure-by-Design” practices while developing new technology products and maintaining existing ones can substantially improve the security posture of customers and reduce the likelihood of being compromised.

Secure-by-Default and Secure-by-Design: implementing these principles into your organization

Building secure products that are easy to adopt and require minimal ongoing customer oversight is paramount in today’s threat environment, but it takes an aligned organization to deliver. Below are some techniques that Cloudflare employs to solve our customers’ security problems, and shift the operational burden away from their network towards ours:

1. Perform as much logic as you can in code you control and can update without user intervention
Like many readers, I’m the technical support person for my parents. Their home networking equipment is quite modern and sends me alerts when there are critical security updates, but I’m always afraid if I apply updates without being onsite something might go wrong.

Professional security administrators face the same problem when dealing with enterprise networking equipment. When software gets shipped into heterogeneous customer environments, things can go wrong. Having a single software stack that runs on every server in our fleet has made it immeasurably easier to stay on top of software updates for our customers.

To the extent your organization can shift the operational burden away from your customer to your own infrastructure, the easier it will be for people to adopt your products and keep them secure. Relying on overburdened administrators to apply patches, especially if there’s risk of downtime, is a difficult proposition.

2. Educate executive leadership on the importance of continual reinvestment in modern security standards, and run experiments to build credibility
Today’s economic environment is challenging: customers are being forced to do more with less, while the software providers they depend upon are no longer hiring at the rate they once were. The appropriate prioritization of scarce engineering resources across new features, technical debt, and security hardening is not obvious and is likely met internally with differing opinions. Laying out clear business cases for adopting  secure-by-default and secure-by-design mindsets is thus even more critical for improving security outcomes without obvious customer-visible benefit.

Projects should also be appropriately scoped, and experiments should be run early and often. Do not wait until you are nearly through a project before letting others play with and review your proof-of-concepts and code. You may find support within the organization where you did not expect it, accelerating projects and increasing the likelihood that they succeed. You’ll also be able to demonstrate unexpected benefits that customers will embrace, helping build a base of support for the sustained effort.

3. Empower your security practitioners to provide feedback early and often in the development cycle
The skill set required to code new products and features does not perfectly overlap with the skill set required to spot security risks in them. Application security experts are helpful because they can quickly pattern match security “code smells” with other projects they’ve previously reviewed and helped harden.

You should embed your security experts within your product engineering teams so that they can provide guidance at the earliest (and lowest cost) phase of development. Having these experts review your functional specifications may save development cycles downstream.

4. Incentivize products that do more for customers “automagically”
People respond to incentives. If your business is built on selling professional services to enterprise customers, there is little incentive for your software developers to minimize the effort required during the installation, tuning, and hardening process.

If your products are designed to be consumed by hundreds of thousands of customers of all sizes, you have no choice but to do more for customers out-of-the-box. Otherwise, your support organization will be overwhelmed and your customers will be vulnerable.

5. Avoid default passwords at all costs
Every day, Cloudflare mitigates DDoS attacks launched by botnets comprised of insecure-by-default devices. Manufacturers ship IoT devices and home networking equipment with default or easy-to-guess passwords, and many proxy vendors require no authentication out of the box.

If these manufacturers followed the principles outlined in the CISA guide, these attacks would decrease in both intensity and frequency, as fewer and fewer devices can be recruited for attack amplification.

Oxy: Fish/Bumblebee/Splicer subsystems to improve reliability

Post Syndicated from Quang Luong original https://blog.cloudflare.com/oxy-fish-bumblebee-splicer-subsystems-to-improve-reliability/

Oxy: Fish/Bumblebee/Splicer subsystems to improve reliability

Oxy: Fish/Bumblebee/Splicer subsystems to improve reliability

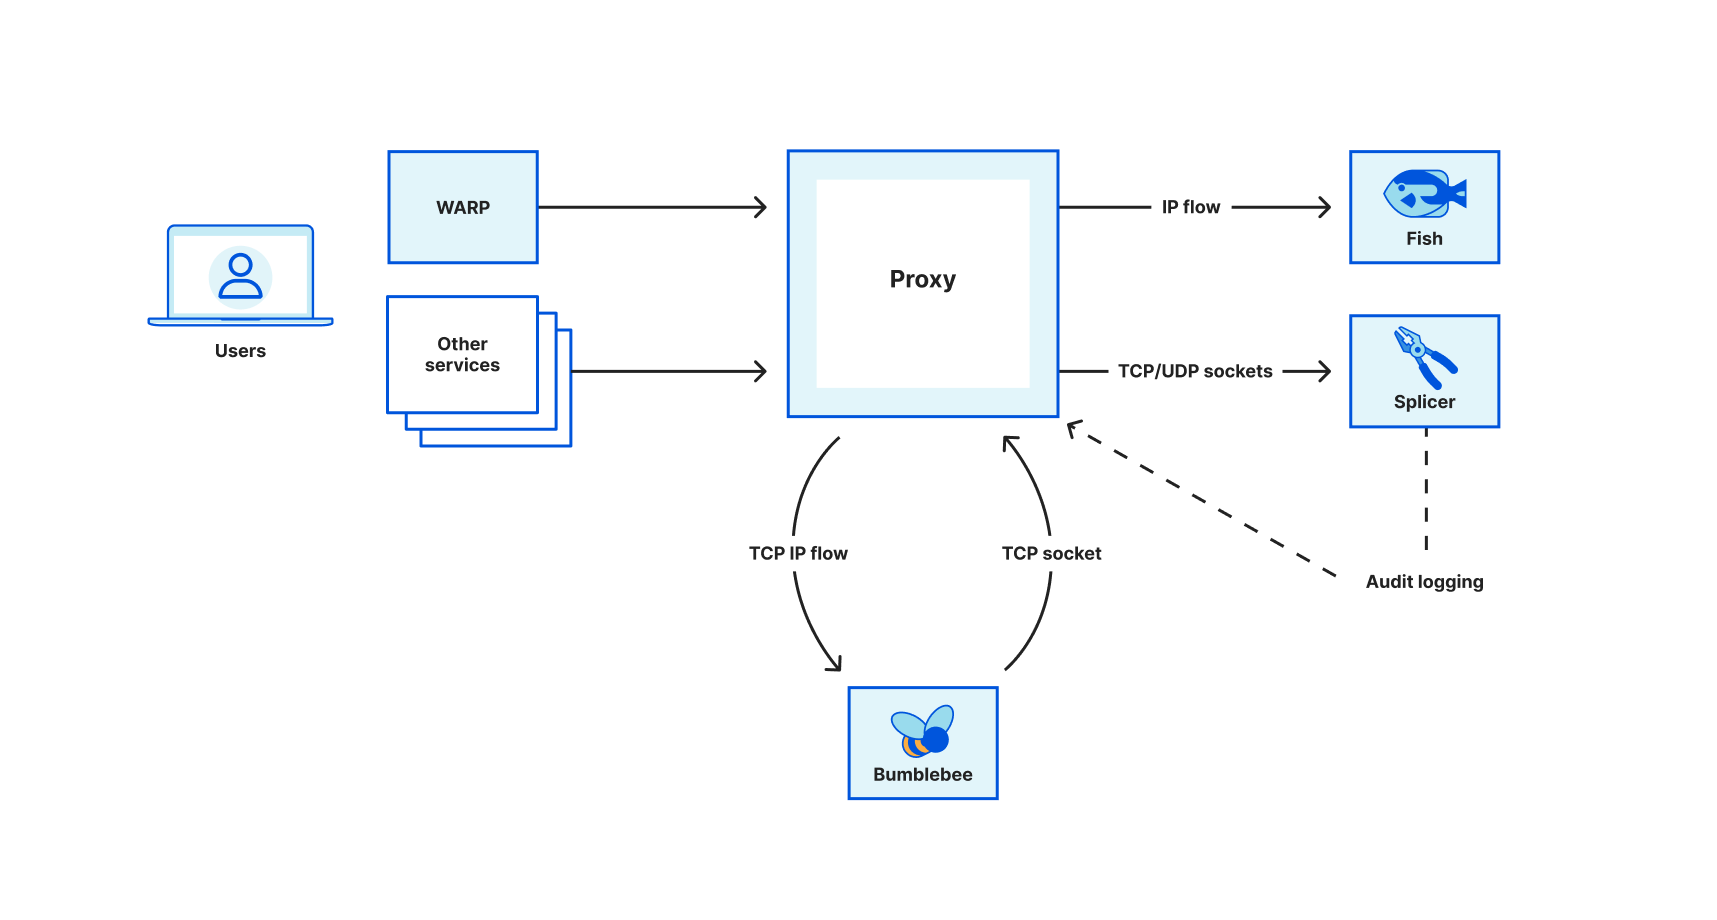
At Cloudflare, we are building proxy applications on top of Oxy that must be able to handle a huge amount of traffic. Besides high performance requirements, the applications must also be resilient against crashes or reloads. As the framework evolves, the complexity also increases. While migrating WARP to support soft-unicast (Cloudflare servers don’t own IPs anymore), we needed to add different functionalities to our proxy framework. Those additions increased not only the code size but also resource usage and states required to be preserved between process upgrades.

To address those issues, we opted to split a big proxy process into smaller, specialized services. Following the Unix philosophy, each service should have a single responsibility, and it must do it well. In this blog post, we will talk about how our proxy interacts with three different services – Splicer (which pipes data between sockets), Bumblebee (which upgrades an IP flow to a TCP socket), and Fish (which handles layer 3 egress using soft-unicast IPs). Those three services help us to improve system reliability and efficiency as we migrated WARP to support soft-unicast.

Oxy: Fish/Bumblebee/Splicer subsystems to improve reliability

Splicer

Most transmission tunnels in our proxy forward packets without making any modifications. In other words, given two sockets, the proxy just relays the data between them: read from one socket and write to the other. This is a common pattern within Cloudflare, and we reimplement very similar functionality in separate projects. These projects often have their own tweaks for buffering, flushing, and terminating connections, but they also have to coordinate long-running proxy tasks with their process restart or upgrade handling, too.

Turning this into a service allows other applications to send a long-running proxying task to Splicer. The applications pass the two sockets to Splicer and they will not need to worry about keeping the connection alive when restart. After finishing the task, Splicer will return the two original sockets and the original metadata attached to the request, so the original application can inspect the final state of the sockets – for example using TCP_INFO – and finalize audit logging if required.

Bumblebee

Many of Cloudflare’s on-ramps are IP-based (layer 3) but most of our services operate on TCP or UDP sockets (layer 4). To handle TCP termination, we want to create a kernel TCP socket from IP packets received from the client (and we can later forward this socket and an upstream socket to Splicer to proxy data between the eyeball and origin). Bumblebee performs the upgrades by spawning a thread in an anonymous network namespace with unshare syscall, NAT-ing the IP packets, and using a tun device there to perform TCP three-way handshakes to a listener. You can find a more detailed write-up on how we upgrade an IP flows to a TCP stream here.

In short, other services just need to pass a socket carrying the IP flow, and Bumblebee will upgrade it to a TCP socket, no user-space TCP stack involved! After the socket is created, Bumblebee will return the socket to the application requesting the upgrade. Again, the proxy can restart without breaking the connection as Bumblebee pipes the IP socket while Splicer handles the TCP ones.

Fish

Fish forwards IP packets using soft-unicast IP space without upgrading them to layer 4 sockets. We previously implemented packet forwarding on shared IP space using iptables and conntrack. However, IP/port mapping management is not simple when you have many possible IPs to egress from and variable port assignments. Conntrack is highly configurable, but applying configuration through iptables rules requires careful coordination and debugging iptables execution can be challenging. Plus, relying on configuration when sending a packet through the network stack results in arcane failure modes when conntrack is unable to rewrite a packet to the exact IP or port range specified.

Fish attempts to overcome this problem by rewriting the packets and configuring conntrack using the netlink protocol. Put differently, a proxy application sends a socket containing IP packets from the client, together with the desired soft-unicast IP and port range, to Fish. Then, Fish will ensure to forward those packets to their destination. The client’s choice of IP address does not matter; Fish ensures that egressed IP packets have a unique five-tuple within the root network namespace and performs the necessary packet rewriting to maintain this isolation. Fish’s internal state is also survived across restarts.

The Unix philosophy, manifest

To sum up what we are having so far: instead of adding the functionalities directly to the proxy application, we create smaller and reusable services. It becomes possible to understand the failure cases present in a smaller system and design it to exhibit reliable behavior. Then if we can remove the subsystems of a larger system, we can apply this logic to those subsystems. By focusing on making the smaller service work correctly, we improve the whole system’s reliability and development agility.

Although those three services’ business logics are different, you can notice what they do in common: receive sockets, or file descriptors, from other applications to allow them to restart. Those services can be restarted without dropping the connection too. Let’s take a look at how graceful restart and file descriptor passing work in our cases.

File descriptor passing

We use Unix Domain Sockets for interprocess communication. This is a common pattern for inter-process communication. Besides sending raw data, unix sockets also allow passing file descriptors between different processes. This is essential for our architecture as well as graceful restarts.

Oxy: Fish/Bumblebee/Splicer subsystems to improve reliability

There are two main ways to transfer a file descriptor: using pid_getfd syscall or SCM_RIGHTS. The latter is the better choice for us here as the use cases gear toward the proxy application “giving” the sockets instead of the microservices “taking” them. Moreover, the first method would require special permission and a way for the proxy to signal which file descriptor to take.

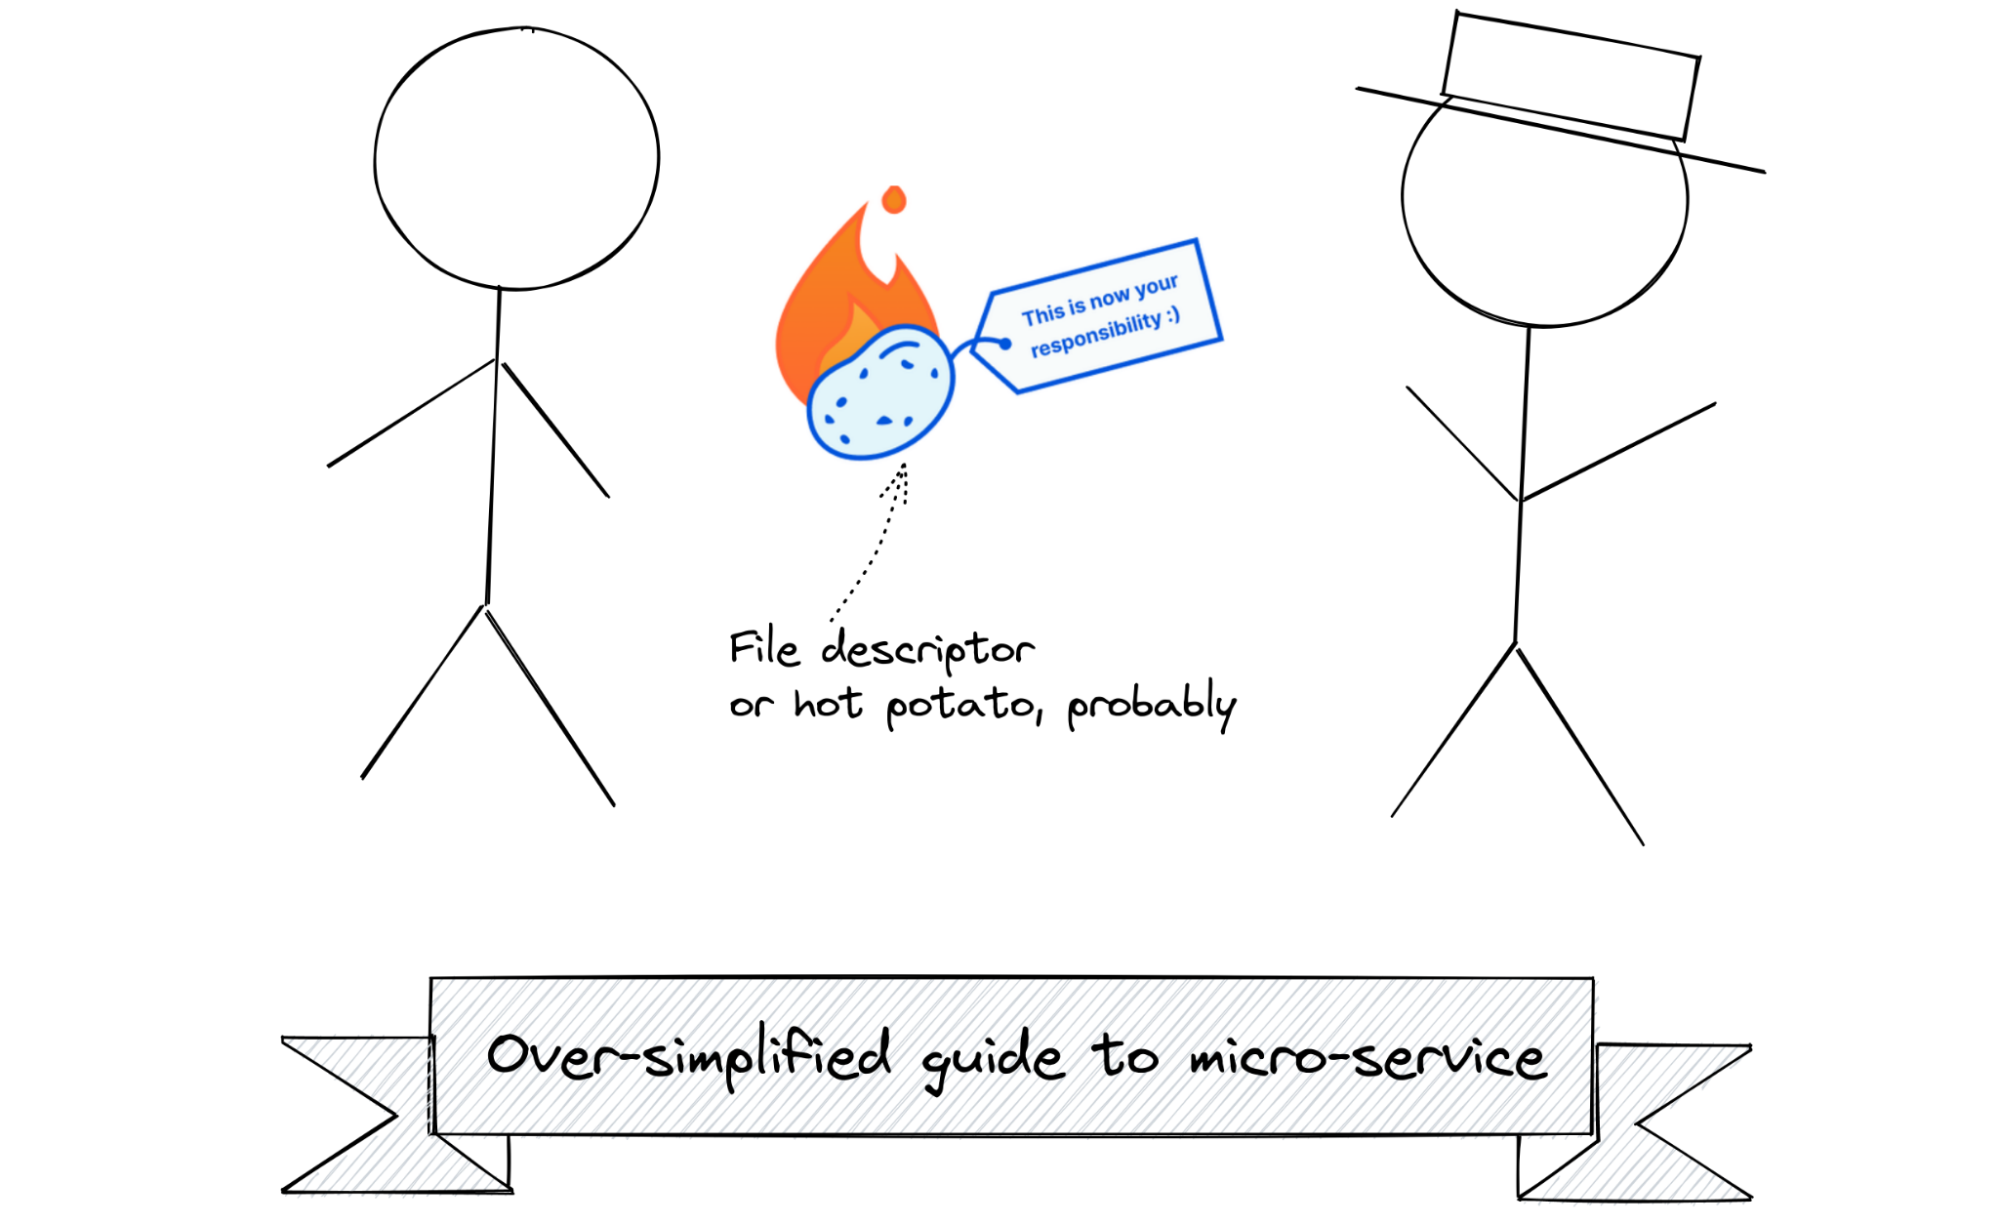
Currently we have our own internal library named hot-potato to pass the file descriptors around as we use stable Rust in production. If you are fine with using nightly Rust, you may want to consider the unix_socket_ancillary_data feature. The linked blog post above about SCM_RIGHTS also explains how that can be implemented. Still, we also want to add some “interesting” details you may want to know before using your SCM_RIGHTS in production:

  • There is a maximum number of file descriptors you can pass per message
    The limit is defined by the constant SCM_MAX_FD in the kernel. This is set to 253 since kernel version 2.6.38
  • Getting the peer credentials of a socket may be quite useful for observability in multi-tenant settings
  • A SCM_RIGHTS ancillary data forms a message boundary.
  • It is possible to send any file descriptors, not only sockets
    We use this trick together with memfd_create to get around the maximum buffer size without implementing something like length-encoded frames. This also makes zero-copy message passing possible.

Graceful restart

We explored the general strategy for graceful restart in “Oxy: the journey of graceful restarts” blog. Let’s dive into how we leverage tokio and file descriptor passing to migrate all important states in the old process to the new one. We can terminate the old process almost instantly without leaving any connection behind.

Passing states and file descriptors

Applications like NGINX can be reloaded with no downtime. However, if there are pending requests then there will be lingering processes that handle those connections before they terminate. This is not ideal for observability. It can also cause performance degradation when the old processes start building up after consecutive restarts.

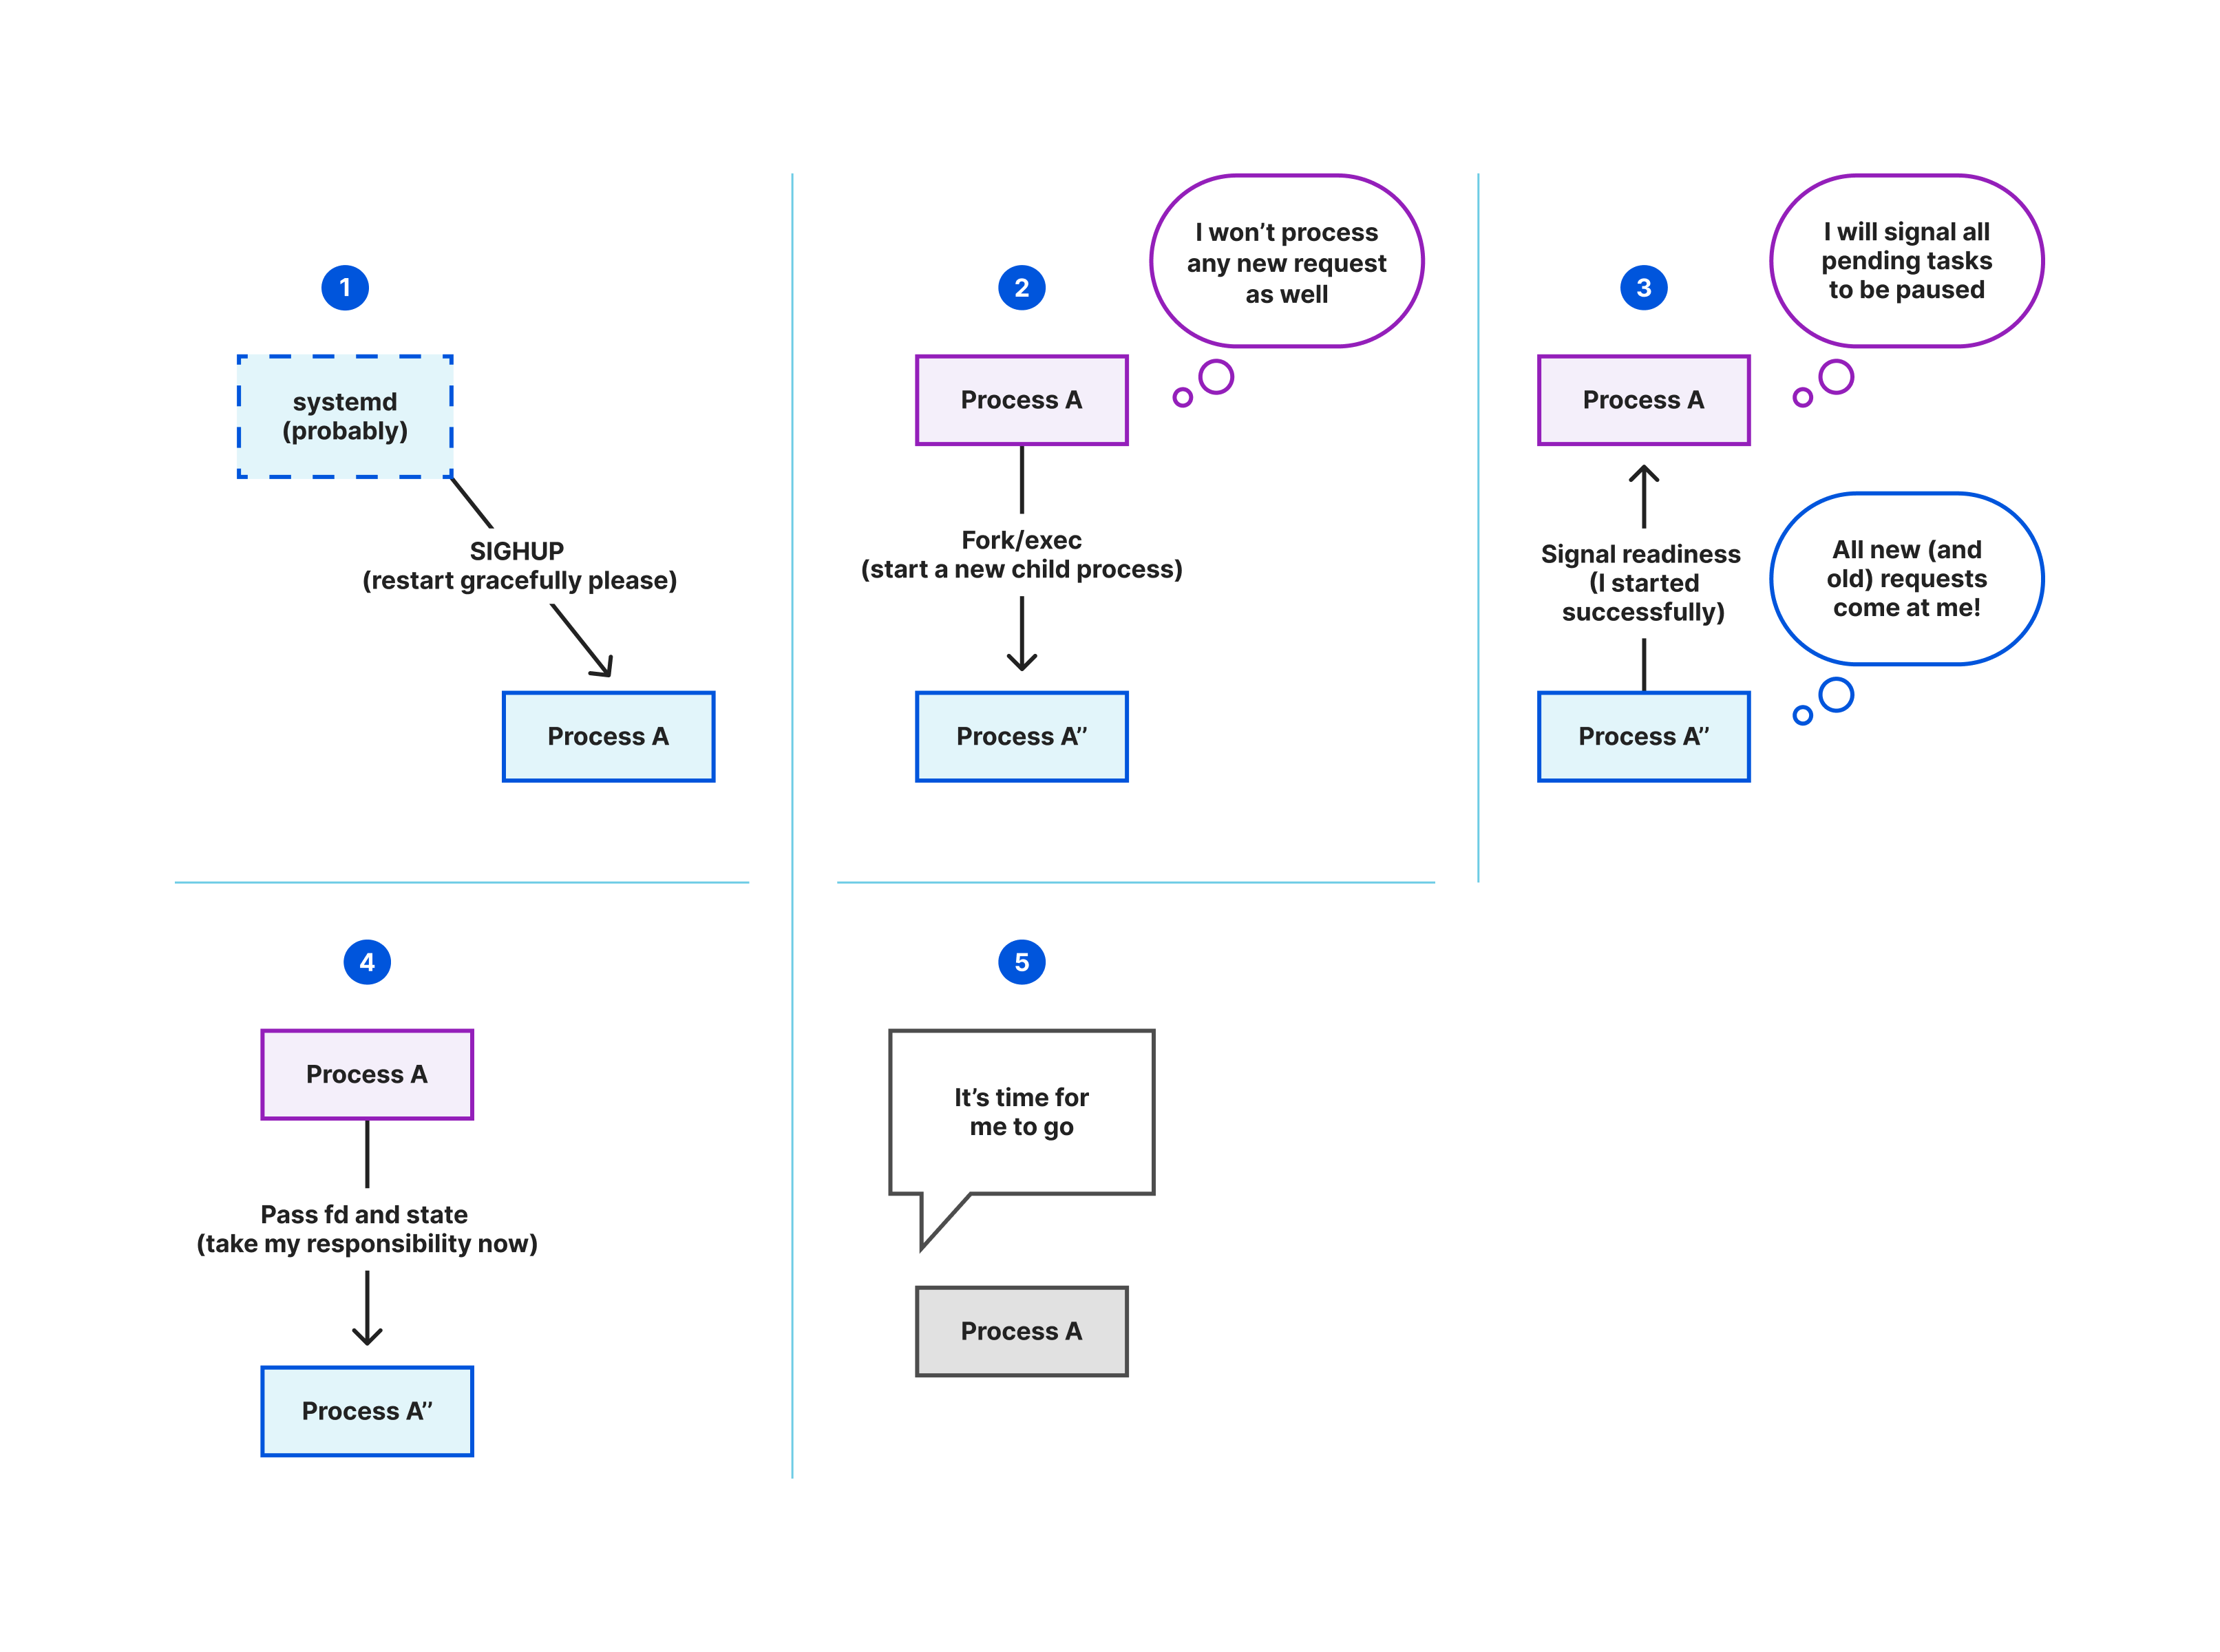
In three micro-services in this blog post, we use the state-passing concept, where the pending requests will be paused and transferred to the new process. The new process will pick up both new requests and the old ones immediately on start. This method indeed requires a higher complexity than keeping the old process running. At a high level, we have the following extra steps when the application receives an upgrade request (usually SIGHUP): pause all tasks, wait until all tasks (in groups) are paused, and send them to the new process.

Oxy: Fish/Bumblebee/Splicer subsystems to improve reliability

WaitGroup using JoinSet

Problem statement: we dynamically spawn different concurrent tasks, and each task can spawn new child tasks. We must wait for some of them to complete before continuing.

In other words, tasks can be managed as groups. In Go, waiting for a collection of tasks to complete is a solved problem with WaitGroup. We discussed a way to implement WaitGroup in Rust using channels in a previous blog. There also exist crates like waitgroup that simply use AtomicWaker. Another approach is using JoinSet, which may make the code more readable. Considering the below example, we group the requests using a JoinSet.

    let mut task_group = JoinSet::new();

    loop {
        // Receive the request from a listener
        let Some(request) = listener.recv().await else {
            println!("There is no more request");
            break;
        };
        // Spawn a task that will process request.
        // This returns immediately
        task_group.spawn(process_request(request));
    }

    // Wait for all requests to be completed before continue
    while task_group.join_next().await.is_some() {}

However, an obvious problem with this is if we receive a lot of requests then the JoinSet will need to keep the results for all of them. Let’s change the code to clean up the JoinSet as the application processes new requests, so we have lower memory pressure

    loop {
        tokio::select! {
            biased; // This is optional

            // Clean up the JoinSet as we go
            // Note: checking for is_empty is important 😉
            _task_result = task_group.join_next(), if !task_group.is_empty() => {}

            req = listener.recv() => {
                let Some(request) = req else {
                    println!("There is no more request");
                    break;
                };
                task_group.spawn(process_request(request));
            }
        }
    }

    while task_group.join_next().await.is_some() {}

Cancellation

We want to pass the pending requests to the new process as soon as possible once the upgrade signal is received. This requires us to pause all requests we are processing. In other terms, to be able to implement graceful restart, we need to implement graceful shutdown. The official tokio tutorial already covered how this can be achieved by using channels. Of course, we must guarantee the tasks we are pausing are cancellation-safe. The paused results will be collected into the JoinSet, and we just need to pass them to the new process using file descriptor passing.

For example, in Bumblebee, a paused state will include the environment’s file descriptors, client socket, and the socket proxying IP flow. We also need to transfer the current NAT table to the new process, which could be larger than the socket buffer. So the NAT table state is encoded into an anonymous file descriptor, and we just need to pass the file descriptor to the new process.

Conclusion

We considered how a complex proxy app can be divided into smaller components. Those components can run as new processes, allowing different life-times. Still, this type of architecture does incur additional costs: distributed tracing and inter-process communication. However, the costs are acceptable nonetheless considering the performance, maintainability, and reliability improvements. In the upcoming blog posts, we will talk about different debug tricks we learned when working with a large codebase with complex service interactions using tools like strace and eBPF.

New Zero-Click Exploits against iOS

Post Syndicated from Bruce Schneier original https://www.schneier.com/blog/archives/2023/04/new-zero-click-exploits-against-ios.html

Citizen Lab has identified three zero-click exploits against iOS 15 and 16. These were used by NSO Group’s Pegasus spyware in 2022, and deployed by Mexico against human rights defenders. These vulnerabilities have all been patched.

One interesting bit is that Apple’s Lockdown Mode (part of iOS 16) seems to have worked to prevent infection.

News article.

EDITED TO ADD (4/21): News article. Good Twitter thread.

Mission Space Lab 2022-23 – 294 teams achieved Flight Status

Post Syndicated from Fergus Kirkpatrick original https://www.raspberrypi.org/blog/294-teams-experiments-iss-astro-pi-mission-space-lab-2022-23/

In brief

We are excited to share that 294 teams of young people participating in this year’s Astro Pi Mission Space Lab achieved Flight Status: their programs will run on the Astro Pis installed on the International Space Station (ISS) in April.

Mission Space Lab is part of the European Astro Pi Challenge, an ESA Education project run in collaboration with the Raspberry Pi Foundation. It offers young people the amazing opportunity to conduct scientific investigations in space, by writing computer programs that run on Raspberry Pi computers on board the International Space Station.

In depth

To take part in Mission Space Lab, young people form teams and choose between two themes for their experiments, investigating either ‘Life in space’ or ‘Life on Earth’. They send us their experiment ideas in Phase 1, and in Phase 2 they write Python programs to execute their experiments on the Astro Pis onboard the ISS. As we sent upgraded Astro Pis to space at the end of 2021, Mission Space Lab teams can now also choose to use a machine learning accelerator during their experiment time.

In total, 771 teams sent us ideas during Phase 1 in September 2022, so achieving Flight Status is a huge accomplishment for the successful teams. We are delighted that 391 teams submitted programs for their experiments. Teams who submitted had their programs checked for errors and their experiments tested, resulting in 294 teams being granted Flight Status. 134 of these teams included some aspects of machine learning in their experiments using the upgraded Astro Pis’ machine learning accelerator.

The 294 teams to whom we were able to award Flight Status this year represent 1245 young people. 34% of team members are female, and the average participant age is 15. The 294 successful teams hail from 21 countries; Italy has the most teams progressing to the next phase (48), closely followed by Spain (37), the UK (34), Greece (25), and the Czech Republic (25).

Life in space

Two Astro Pis on board the International Space Station.
Mark II Astro Pis on the ISS

Teams can use the Astro Pis to investigate life inside ESA’s Columbus module of the ISS, by writing a program to detect things with at least one of the Astro Pi’s sensors. This can include for example the colour and intensity of light in the module, or the temperature and humidity.

81 teams that created ‘Life in space’ experiments have achieved Flight Status this year. Examples of experiments from this year are investigating how the Earth’s magnetic field is felt on the ISS, what environmental conditions the astronauts experience compared to those on Earth directly beneath the ISS as it orbits, or whether the cabin might be suitable for other lifeforms, such as plants or bacteria.

Life on Earth

An Astro Pi in a window on board the International Space Station.
Astro Pi VIS in the window on the ISS

In the ‘Life on Earth’ theme, teams investigate features on the Earth’s surface using the cameras on the Astro Pis, which are positioned to view Earth from a window on the ISS.

This year the Astro Pis will be located in the Window Observational Research Facility (WORF), which is larger than the window the computers were positioned in in previous years. This means that teams running ‘Life on Earth’ experiments can capture better images. 206 teams that created experiments in the ‘Life on Earth’ theme have achieved Flight Status.

Thanks to the upgraded Astro Pi hardware, this is the second year that teams could decide whether to use visible-light or infrared (IR) photography. Teams running experiments using IR photography have chosen to examine topics such as plant health in different regions, the effects of deforestation, and desertification. Teams collecting visible light photography have chosen to design experiments analysing clouds in different regions, changes in ocean colour, the velocity of the ISS, and classification of biomes (e.g. desert, forest, grassland, wetland).

Testing, testing

Four photographs of the Earth and cloud formations, taken from the International Space Station by an Astro Pi.
Images taken by Astro Pi VIS on the ISS in Mission Space Lab 2021/22

Each of this year’s 391 submissions has been through a number of tests to ensure they follow the challenge rules, meet the ISS security requirements, and can run without errors on the Astro Pis. Once the experiments have started, we can’t rely on astronaut intervention to resolve any issues, so we have to make sure that all of the programs will run without any problems. 

This means that the start of the year is a very busy time for us. We run tests on Mission Space Lab teams’ programs on a number of exact replicas of the Astro Pis, including a final test to run every experiment that has passed all tests for the full three-hour experiment duration. The 294 experiments that received Flight Status will take over 5 weeks to run.

97 programs submitted by teams during Phase 2 of Mission Space Lab this year did not pass testing and so could not be awarded Flight Status. We wish we could run every experiment that is submitted, but there is only limited time available for the Astro Pis to be positioned in the ISS window. Therefore, we have to be extremely rigorous in our selection, and many of the 97 teams were not successful because of only small issues in their programs. We recognise how much work every Mission Space Lab team does, and all teams can be very proud of designing and creating an experiment.

Even if you weren’t successful this year, we hope you enjoyed participating and will take part again in next year’s challenge.

What next?

Once all of the experiments have run, we will send the teams the data collected during their experiments. Teams will then have time to analyse their data and write a short report to share their findings. Based on these reports, we will select winners of this year’s Mission Space Lab. The winning and highly commended teams will receive a special surprise.

Congratulations to all successful teams! We are really looking forward to seeing your results.

The post Mission Space Lab 2022-23 – 294 teams achieved Flight Status appeared first on Raspberry Pi Foundation.

По изборите в Ихтиман

Post Syndicated from Александър Нуцов original https://www.toest.bg/po-izborite-v-ihtiman/

По изборите в Ихтиман

Последните предсрочни парламентарни избори отразяват хроничната апатия на българските избиратели, породена от усещането за безизходица, повторяемостта на политическите послания и неспособността на партиите да убедят широките обществени кръгове в смисъла от гласуването. За политическите играчи, разчитащи на твърдите си електорални ядра, общественото безразличие е предимство, което активно или мълчаливо подхранват, за да осигурят политическото си дълголетие. От апатията се възползват и онези, които купуват и контролират гласове – явление, особено характерно за малките населени места с висока безработица, нисък стандарт на живот, лошо образование и изградени зависимости от феодален тип.

И на тези избори станахме свидетели на разнородни нарушения. Четвъртото ми участие като независим наблюдател (второ в град Ихтиман) затвърди тези впечатления. Представлявах наскоро създадената платформа Обединение за честни избори (ОЧИ) в една от трите рискови секции в ромския квартал (№262000030). Тук надмощието на ГЕРБ и ДПС е осезаемо, а двете формации си оспорват политическото водачество. Двама са и местните тартори, които контролират обществените нагласи – Борис Аргиров (по-известен като Бони или Цар Бони, общински съветник от ДПС) и Рашко Стоянов (представител на ГЕРБ).

Работим в екип от двама души, за да извършим т.нар. тотално наблюдение – непрекъснат надзор над секцията в присъствието на поне един наблюдател до издаване на официалните протоколи от гласуването. Секционната избирателна комисия се състои от девет представители – председател, зам.-председател, секретар и шестима членове. Гласувалите в края на деня са 428 души от 999 (плюс 8 под черта) по избирателен списък. ДПС печели в секцията с 251 гласа срещу 123 за ГЕРБ, а останалите формации получават незначителна подкрепа. Невалидните бюлетини са цели 23, а бройката е изкуствено занижена заради немалкото компромиси при преброяването. Избирателната активност е малко по-висока спрямо изборите на 2 октомври, когато са гласували 330 души (при 1 недействителна бюлетина).

Всички членове на СИК са местни граждани, с изключение на Теодора Върбанова от квотата на „Демократична България“. Тя споделя, че Общината в Ихтиман е поканила председателите на секционните комисии в сградата на общинската администрация на 1 април, за да получат изборните книжа и материали. Условието е било да присъстват не повече от трима членове на СИК – председател, зам.-председател и секретар. При желание или липса на някого измежду изброените е можело да присъства и друг член на комисията.

Въпреки увещанията, че присъствието ѝ не е задължително, Теодора отива на уреченото място, за да предотврати потенциалния сценарий, известен като „индианска нишка“. Това е механизъм за контрол на вота, при който една бюлетина се откъсва от кочана и се попълва предварително. В изборния ден избирателят, на когото е връчена, пуска в урната попълнената бюлетина и изнася празната, която получава от комисията. Впоследствие я предава на друг гласоподавател, който отново я попълва предварително, а цикълът се повтаря. Така контролираният вот се отчита лесно и незабелязано. Усилията си Теодора не пести  и по време на изборния ден, в който отговаря за поставянето на печатите и следи изкъсо за нарушения.

Хронология на нередностите

Веднага след пристигането си насочваме внимание към състоянието и неадекватното разположение на ключови елементи от изборната секция. Както в цялата страна, и тук т.нар. паравани за гласуване представляват набързо сковани тъмни стаички. Причините за това са липсата на универсална спецификация за размера на параваните и решението на ЦИК да прехвърли отговорността за тяхното набавяне и поставяне на общините.

По изборите в Ихтиман
Снимка: Миролюба Бенатова

Целта на параваните е да запазят тайната на вота, но в същото време да осигурят видимост по начин, който възпира гласоподавателите (по подобие на гласуването с машина) от предприемане на нерегламентирани действия, като заснемане на вота и внасяне на предварително попълнени бюлетини. Затворените от всички страни тъмни стаички практически обезсмислят идеята за такъв тип прозрачност и са в разрез със закона.

Бедите обаче не свършват дотук. Членовете на комисията нямат възможност да изпълняват част от задълженията си по закон – например да спазват отстояние от поне три метра от машината за гласуване, защото няма достатъчно пространство в помещението (малка класна стая). Разбираме, че РИК е била предварително уведомена за подредбата в секцията, но едва по средата на изборния ден тя излиза с решение, според което нередности няма.

По изборите в Ихтиман

Междувременно от седящите места, предназначени за наблюдатели и застъпници, се открива ъгъл с видимост към една от двете тъмни стаички в помещението. Както се вижда на снимката, ъгълът е напълно достатъчен за гласоподавателя да покаже за кого е гласувал, без да бъде забелязан от член на СИК. С постоянното си присъствие на практика блокираме възможността за подобно отчитане на вота.

То обаче се извършва по друга схема. На няколко пъти изразяваме съмнения за манипулации след бъркане в джобове или пазва по време на гласуване, нетипично забавяне или шумолене в тъмната стаичка. Въпреки лошата видимост хващаме „на местопрестъплението“ няколко души, които заснемат вота си с включен звук на камерата. Незабавно уведомяваме СИК и бюлетините на прегрешилите биват обявени за невалидни. Идентични сигнали подават наблюдателите ни и в другите две секции. Следва да отбележим, че заснемането и отчитането на вота са едни от най-явните индикации за извършени манипулации.

Наблюдателите ни от съседната секция алармират за друг вид нарушение – гласуване със счупена, повредена или изтекла лична карта, което затруднява установяването на самоличността на избирателя. След множество сигнали до РИК и намесата на МВР тази практика е преустановена. Други примери за нарушения включват разговори на език, различен от български, подсказване между гласоподаватели за кого да гласуват, и отговаряне на телефонно обаждане по време на гласуване.

Агитационната дейност в изборния ден се извършва предимно извън територията на съответното училище. Наблюдават се съмнителни струпвания на групички от по няколко души в близките до училището улици, а някои хора (вероятно следящи кой е гласувал) остават около училището през целия ден. Вижда се и как влиятелни фигури в махалата или техни приближени водят гласоподаватели към секциите.

Броене

Броенето на гласовете е традиционно най-обтегнатият момент в изборния ден. Напрежението в нашата секция е породено от присъствието на Бони, на когото беше забранено да влиза в секциите поради липса на валиден документ. Все пак той намира начин да присъства на броенето като представител на ДПС, легитимирайки се с издадена междувременно акредитация.

Проблемите с невалидните бюлетини изплуват, а към това се добавя и грубият натиск на Бони върху СИК. Кулминацията настъпва в момента, когато представителят на ДПС заплашва председателката на комисията (пак от квотата на ДПС), че ще закрие училището, в което самата тя преподава.

Аз ще направя това училище да го закрият, да знаеш. Ще съжалявате за това, което го правите.

Това са точните думи на Аргиров, заснети от камерата за видеонаблюдение (виж тук, 23:40 – 24:00). Повод за ескалацията е решението на комисията да обяви бюлетина с плътно задраскано квадратче за невалидна (целият казус започва от 22:00). Всичко това се случва пред камерата (която не излъчва на живо) и в присъствието на независими наблюдатели, включително журналистката Миролюба Бенатова, с която наблюдаваме изборния процес през целия ден. Въпреки последвалите призиви на Теодора Върбанова към охраната и наши сигнали до РИК, Бони остава в помещението. След обаждане от РИК следва единствено устна забележка.

Бони продължава да прекъсва работата на СИК и шумно оспорва всяко нейно решение, с което комисията отхвърля дадена бюлетина като недействителна. За действителна е приета бюлетина, върху която е гласувано с кръг вместо с установените по образец знаци V или X. По правилник такава бюлетина е безспорно невалидна. След натиска на Бони обаче комисията подлага казуса на гласуване и приема бюлетината за действителна с аргумента, че гласоподавателят ясно е посочил коя партия подкрепя (виж тук, 48:25). Впоследствие комисията приема за действителни още две неправилно маркирани бюлетин (съответно с квадрат и две малки кръстчета, виж 59:30 и 1:05:30) под предлог, че трябва да бъдат приети, щом веднъж вече е направен компромис. Против и в трите случая гласува единствено Теодора Върбанова.

Много по-спокойно преминава броенето на бюлетините от машинното гласуване поради простата причина, че машината премахва възможността за недействителен вот. Това улеснява комисията, защото не създава спорни казуси, а самото броене изисква много по-малки усилия заради компактния формат на разписката и лесното отчитане на вота.

За хартиите и машините

Приетите от предишния парламент промени в Изборния кодекс са в полза само на онези, които контролират вота. Според повечето членове на секционната комисия машинният вот е много по-ползотворен за изборния процес, докато хартиеният създава хаос и усложнява неимоверно работата им. Показателно е единодушието и на представителите на ГЕРБ и ДПС, и на тези на „Продължаваме Промяната“, „Демократична България“ и „Възраждане“.

На основата на наблюдението бих откроил следните недостатъци на хартиения вот: улеснява изброените по-горе изборни нарушения; води до висок брой невалидни бюлетини; създава напрежение между членовете на комисията и избирателите, както и раздори в самата комисия (особено при броенето на бюлетините); води до огромен брой сгрешени протоколи (най-вече заради сложността им), което подкопава общественото доверие в изборния процес. Освен това хартиеният вот засилва влиянието на местните тартори и създава условия за натиск върху секционните комисии при броене.

Най-големият риск в действащото законодателство е свързан с отказа на все повече кадърни и честни хора с опит в изборния процес да участват в секционните комисии занапред. А тъкмо това са хората с най-много правомощия, на чиито плещи лежи и най-тежката отговорност за осигуряване на честността на вота. Част от членовете на СИК в Ихтиман изразиха нежелание да участват под същата форма в бъдещи избори заради бремето на смесеното гласуване.

Значението на гражданското наблюдение

Рисковите секции обикновено се намират в малки населени места или в отделни квартали, където влиянието на фигури като Бони и Рашко върху изборния процес е осезаемо. Тези лица познават лично членовете на СИК и натоварената да бди за изборни нарушения местна полиция. Това създава предпоставки за прилагане на добре познати незаконни практики. В секции с висок риск от купен и контролиран вот присъствието на независими наблюдатели е ключово за възпирането на манипулациите, дисциплинирането на секционните комисии и гарантирането на по-добро взаимодействие между всички отговорни институции в името на прозрачни избори.

Гражданското наблюдение е част от нов подход, необходим за подобряване на изборната среда и ограничаване на незаконните практики. Работата на наблюдателите се фокусира изцяло върху изборния ден. Тя зависи пряко от действията на МВР и прокуратурата за задушаване на контролирания и купения вот в зародиш още преди изборите. Усилията на гражданите и държавата обаче трябва да бъдат подплатени с мерки срещу структурните причини, които подтикват определени групи от населението да гласуват не по съвест, а по принуда или с корист. Такива са екстремната бедност, феодалните зависимости, лошото образование и липсата на гражданско самосъзнание – все проблеми, които заслужават много по-голямо политическо внимание. Човек би се зачудил дали съвсем нарочно не го получават.

Monitoring Amazon DevOps Guru insights using Amazon Managed Grafana

Post Syndicated from MJ Kubba original https://aws.amazon.com/blogs/devops/monitoring-amazon-devops-guru-insights-using-amazon-managed-grafana/

As organizations operate day-to-day, having insights into their cloud infrastructure state can be crucial for the durability and availability of their systems. Industry research estimates[1] that downtime costs small businesses around $427 per minute of downtime, and medium to large businesses an average of $9,000 per minute of downtime. Amazon DevOps Guru customers want to monitor and generate alerts using a single dashboard. This allows them to reduce context switching between applications, providing them an opportunity to respond to operational issues faster.

DevOps Guru can integrate with Amazon Managed Grafana to create and display operational insights. Alerts can be created and communicated for any critical events captured by DevOps Guru and notifications can be sent to operation teams to respond to these events. The key telemetry data types of logs and metrics are parsed and filtered to provide the necessary insights into observability.

Furthermore, it provides plug-ins to popular open-source databases, third-party ISV monitoring tools, and other cloud services. With Amazon Managed Grafana, you can easily visualize information from multiple AWS services, AWS accounts, and Regions in a single Grafana dashboard.

In this post, we will walk you through integrating the insights generated from DevOps Guru with Amazon Managed Grafana.

Solution Overview:

This architecture diagram shows the flow of the logs and metrics that will be utilized by Amazon Managed Grafana. Insights originate from DevOps Guru, each insight generating an event. These events are captured by Amazon EventBridge, and then saved as logs to Amazon CloudWatch Log Group DevOps Guru service metrics, and then parsed by Amazon Managed Grafana to create new dashboards.

This architecture diagram shows the flow of the logs and metrics that will be utilized by Amazon Managed Grafana, starting with DevOps Guru and then using Amazon EventBridge to save the insight event logs to Amazon CloudWatch Log Group DevOps Guru service metrics to be parsed by Amazon Managed Grafana and create new dashboards in Grafana from these logs and Metrics.

Now we will walk you through how to do this and set up notifications to your operations team.

Prerequisites:

The following prerequisites are required for this walkthrough:

  • An AWS Account
  • Enabled DevOps Guru on your account with CloudFormation stack, or tagged resources monitored.

Using Amazon CloudWatch Metrics


DevOps Guru sends service metrics to CloudWatch Metrics. We will use these to      track metrics for insights and metrics for your DevOps Guru usage; the DevOps Guru service reports the metrics to the AWS/DevOps-Guru namespace in CloudWatch by default.

First, we will provision an Amazon Managed Grafana workspace and then create a Dashboard in the workspace that uses Amazon CloudWatch as a data source.

Setting up Amazon CloudWatch Metrics

  1. Create Grafana Workspace
    Navigate to Amazon Managed Grafana from AWS console, then click Create workspace

a. Select the Authentication mechanism

i. AWS IAM Identity Center (AWS SSO) or SAML v2 based Identity Providers

ii. Service Managed Permission or Customer Managed

iii. Choose Next

b. Under “Data sources and notification channels”, choose Amazon CloudWatch

c. Create the Service.

You can use this post for more information on how to create and configure the Grafana workspace with SAML based authentication.

Next, we will show you how to create a dashboard and parse the Logs and Metrics to display the DevOps Guru insights and recommendations.

2. Configure Amazon Managed Grafana

a. Add CloudWatch as a data source:
From the left bar navigation menu, hover over AWS and select Data sources.

b. From the Services dropdown select and configure CloudWatch.

3. Create a Dashboard

a. From the left navigation bar, click on add a new Panel.

b. You will see a demo panel.

c. In the demo panel – Click on Data source and select Amazon CloudWatch.

The Amazon Grafana Workspace dashboard with the Grafana data source dropdown menu open. The drop down has 'Amazon CloudWatch (region name)' highlighted, other options include 'Mixed, 'Dashboard', and 'Grafana'.

d. For this panel we will use CloudWatch metrics to display the number of insights.

e. From Namespace select the AWS/DevOps-Guru name space, Insights as Metric name and Average for Statistics.

In the Amazon Grafana Workspace dashboard the user has entered values in three fields. "Grafana Query with Namespace" has the chosen value: AWS/DevOps-Guru. "Metric name" has the chosen value: Insights. "Statistic" has the chosen value: Average.

click apply

Time series graph contains a single new data point, indicting a recent event.

f. This is our first panel. We can change the panel name from the right-side bar under Title. We will name this panel “Insights”

g. From the top right menu, click save dashboard and give your new dashboard a name

Using Amazon CloudWatch Logs via Amazon EventBridge

For other insights outside of the service metrics, such as a number of insights per specific service or the average for a region or for a specific AWS account, we will need to parse the event logs. These logs first need to be sent to Amazon CloudWatch Logs. We will go over the details on how to set this up and how we can parse these logs in Amazon Managed Grafana using CloudWatch Logs Query Syntax. In this post, we will show a couple of examples. For more details, please check out this User Guide documentation. This is not done by default and we will need to use Amazon EventBridge to pass these logs to CloudWatch.

DevOps Guru logs include other details that can be helpful when building Dashboards, such as region, Insight Severity (High, Medium, or Low), associated resources, and DevOps guru dashboard URL, among other things.  For more information, please check out this User Guide documentation.

EventBridge offers a serverless event bus that helps you receive, filter, transform, route, and deliver events. It provides one to many messaging solutions to support decoupled architectures, and it is easy to integrate with AWS Services and 3rd-party tools. Using Amazon EventBridge with DevOps Guru provides a solution that is easy to extend to create a ticketing system through integrations with ServiceNow, Jira, and other tools. It also makes it easy to set up alert systems through integrations with PagerDuty, Slack, and more.


Setting up Amazon CloudWatch Logs

  1. Let’s dive in to creating the EventBridge rule and enhance our Grafana dashboard:

a. First head to Amazon EventBridge in the AWS console.

b. Click Create rule.

     Type in rule Name and Description. You can leave the Event bus to default and Rule type to Rule with an event pattern.

c. Select AWS events or EventBridge partner events.

    For event Pattern change to Customer patterns (JSON editor) and use:

{"source": ["aws.devops-guru"]}

This filters for all events generated from DevOps Guru. You can use the same mechanism to filter out specific messages such as new insights, or insights closed to a different channel. For this demonstration, let’s consider extracting all events.

As the user configures their EventBridge Rule, for the Creation method they have chosen "Custom pattern (JSON editor) write an event pattern in JSON." For the Event pattern editor just below they have entered {"source":["aws.devops-guru"]}

d. Next, for Target, select AWS service.

    Then use CloudWatch log Group.

    For the Log Group, give your group a name, such as “devops-guru”.

In the prompt for the new Target's configurations, the user has chosen AWS service as the Target type. For the Select a target drop down, they chose CloudWatch log Group. For the log group, they selected the /aws/events radio option, and then filled in the following input text box with the kebab case group name devops-guru.

e. Click Create rule.

f. Navigate back to Amazon Managed Grafana.
It’s time to add a couple more additional Panels to our dashboard.  Click Add panel.
    Then Select Amazon CloudWatch, and change from metrics to CloudWatch Logs and select the Log Group we created previously.

In the Grafana Workspace, the user has "Data source" selected as Amazon CloudWatch us-east-1. Underneath that they have chosen to use the default region and CloudWatch Logs. Below that, for the Log Groups they have entered /aws/events/DevOpsGuru

g. For the query use the following to get the number of closed insights:

fields @detail.messageType
| filter detail.messageType="CLOSED_INSIGHT"
| count(detail.messageType)

You’ll see the new dashboard get updated with “Data is missing a time field”.

New panel suggestion with switch to table or open visualization suggestions

You can either open the suggestions and select a gauge that makes sense;

New Suggestions display a dial graph, a bar graph, and a count numerical tracker

Or choose from multiple visualization options.

Now we have 2 panels:

Two panels are shown, one is the new dial graph, and the other is the time series graph that was created earlier.

h. You can repeat the same process. To create 3rd panel for the new insights using this query:

fields @detail.messageType 
| filter detail.messageType="NEW_INSIGHT" 
| count(detail.messageType)

Now we have 3 panels:

Grafana now shows three 3 panels. Two dial graphs, and the time series graph.

Next, depending on the visualizations, you can work with the Logs and metrics data types to parse and filter the data.

Setting up a 4th panel as table. Under the Query tab, in the query editor, the user has entered the text: fields detail.messageType, detail.insightSeverity, detail.insightUrlfilter | filter detail.messageType="CLOSED_INSIGHT" or detail.messageType="NEW_INSIGHT"

i. For our fourth panel, we will add DevOps Guru dashboard direct link to the AWS Console.

Repeat the same process as demonstrated previously one more time with this query:

fields detail.messageType, detail.insightSeverity, detail.insightUrlfilter 
| filter detail.messageType="CLOSED_INSIGHT" or detail.messageType="NEW_INSIGHT"                       

                        Switch to table when prompted on the panel.

Grafana now shows 4 panels. The new panel displays a data table that contains information about the most recent DevOps Guru insights. There are also the two dial graphs, and the time series graph from before.

This will give us a direct link to the DevOps Guru dashboard and help us get to the insight details and Recommendations.

Grafana now shows 4 panels. The new panel displays a data table that contains information about the most recent DevOps Guru insights. There are also the two dial graphs, and the time series graph from before.

Save your dashboard.

  1. You can extend observability by sending notifications through alerts on dashboards of panels providing metrics. The alerts will be triggered when a condition is met. The Alerts are communicated with Amazon SNS notification mechanism. This is our SNS notification channel setup.

Screenshot: notification settings show Name: DevopsGuruAlertsFromGrafana and Type: SNS

A previously created notification is used next to communicate any alerts when the condition is met across the metrics being observed.

Screenshot: notification setting with condition when count of query is above 5, a notification is sent to DevopsGuruAlertsFromGrafana with message, "More than 5 insights in the past 1 hour"

Cleanup

To avoid incurring future charges, delete the resources.

  • Navigate to EventBridge in AWS console and delete the rule created in step 4 (a-e) “devops-guru”.
  • Navigate to CloudWatch logs in AWS console and delete the log group created as results of step 4 (a-e) named “devops-guru”.
  • Amazon Managed Grafana: Navigate to Amazon Managed Grafana service and delete the Grafana services you created in step 1.

Conclusion

In this post, we have demonstrated how to successfully incorporate Amazon DevOps Guru insights into Amazon Managed Grafana and use Grafana as the observability tool. This will allow Operations team to successfully observe the state of their AWS resources and notify them through Alarms on any preset thresholds on DevOps Guru metrics and logs. You can expand on this to create other panels and dashboards specific to your needs. If you don’t have DevOps Guru, you can start monitoring your AWS applications with AWS DevOps Guru today using this link.

[1] https://www.atlassian.com/incident-management/kpis/cost-of-downtime

About the authors:

MJ Kubba

MJ Kubba is a Solutions Architect who enjoys working with public sector customers to build solutions that meet their business needs. MJ has over 15 years of experience designing and implementing software solutions. He has a keen passion for DevOps and cultural transformation.

David Ernst

David is a Sr. Specialist Solution Architect – DevOps, with 20+ years of experience in designing and implementing software solutions for various industries. David is an automation enthusiast and works with AWS customers to design, deploy, and manage their AWS workloads/architectures.

Sofia Kendall

Sofia Kendall is a Solutions Architect who helps small and medium businesses achieve their goals as they utilize the cloud. Sofia has a background in Software Engineering and enjoys working to make systems reliable, efficient, and scalable.

A sneak peek at the data protection sessions for re:Inforce 2023

Post Syndicated from Katie Collins original https://aws.amazon.com/blogs/security/a-sneak-peek-at-the-data-protection-sessions-for-reinforce-2023/

reInforce 2023

A full conference pass is $1,099. Register today with the code secure150off to receive a limited time $150 discount, while supplies last.


AWS re:Inforce is fast approaching, and this post can help you plan your agenda. AWS re:Inforce is a security learning conference where you can gain skills and confidence in cloud security, compliance, identity, and privacy. As a re:Inforce attendee, you have access to hundreds of technical and non-technical sessions, an Expo featuring AWS experts and security partners with AWS Security Competencies, and keynote and leadership sessions featuring Security leadership. AWS re:Inforce 2023 will take place in-person in Anaheim, CA, on June 13 and 14. re:Inforce 2023 features content in the following six areas:

  • Data Protection
  • Governance, Risk, and Compliance
  • Identity and Access Management
  • Network and Infrastructure Security
  • Threat Detection and Incident Response
  • Application Security

The data protection track will showcase services and tools that you can use to help achieve your data protection goals in an efficient, cost-effective, and repeatable manner. You will hear from AWS customers and partners about how they protect data in transit, at rest, and in use. Learn how experts approach data management, key management, cryptography, data security, data privacy, and encryption. This post will highlight of some of the data protection offerings that you can add to your agenda. To learn about sessions from across the content tracks, see the AWS re:Inforce catalog preview.
 

“re:Inforce is a great opportunity for us to hear directly from our customers, understand their unique needs, and use customer input to define solutions that protect sensitive data. We also use this opportunity to deliver content focused on the latest security research and trends, and I am looking forward to seeing you all there. Security is everyone’s job, and at AWS, it is job zero.”
— Ritesh Desai, General Manager, AWS Secrets Manager


Breakout sessions, chalk talks, and lightning talks

DAP301: Moody’s database secrets management at scale with AWS Secrets Manager
Many organizations must rotate database passwords across fleets of on-premises and cloud databases to meet various regulatory standards and enforce security best practices. One-time solutions such as scripts and runbooks for password rotation can be cumbersome. Moody’s sought a custom solution that satisfies the goal of managing database passwords using well-established DevSecOps processes. In this session, Moody’s discusses how they successfully used AWS Secrets Manager and AWS Lambda, along with open-source CI/CD system Jenkins, to implement database password lifecycle management across their fleet of databases spanning nonproduction and production environments.

DAP401: Security design of the AWS Nitro System
The AWS Nitro System is the underlying platform for all modern Amazon EC2 instances. In this session, learn about the inner workings of the Nitro System and discover how it is used to help secure your most sensitive workloads. Explore the unique design of the Nitro System’s purpose-built hardware and software components and how they operate together. Dive into specific elements of the Nitro System design, including eliminating the possibility of operator access and providing a hardware root of trust and cryptographic system integrity protections. Learn important aspects of the Amazon EC2 tenant isolation model that provide strong mitigation against potential side-channel issues.

DAP322: Integrating AWS Private CA with SPIRE and Ottr at Coinbase
Coinbase is a secure online platform for buying, selling, transferring, and storing cryptocurrency. This lightning talk provides an overview of how Coinbase uses AWS services, including AWS Private CA, AWS Secrets Manager, and Amazon RDS, to build out a Zero Trust architecture with SPIRE for service-to-service authentication. Learn how short-lived certificates are issued safely at scale for X.509 client authentication (i.e., Amazon MSK) with Ottr.

DAP331: AWS Private CA: Building better resilience and revocation techniques
In this chalk talk, explore the concept of PKI resiliency and certificate revocation for AWS Private CA, and discover the reasons behind multi-Region resilient private PKI. Dive deep into different revocation methods like certificate revocation list (CRL) and Online Certificate Status Protocol (OCSP) and compare their advantages and limitations. Leave this talk with the ability to better design resiliency and revocations.

DAP231: Securing your application data with AWS storage services
Critical applications that enterprises have relied on for years were designed for the database block storage and unstructured file storage prevalent on premises. Now, organizations are growing with cloud services and want to bring their security best practices along. This chalk talk explores the features for securing application data using Amazon FSx, Amazon Elastic File System (Amazon EFS), and Amazon Elastic Block Store (Amazon EBS). Learn about the fundamentals of securing your data, including encryption, access control, monitoring, and backup and recovery. Dive into use cases for different types of workloads, such as databases, analytics, and content management systems.

Hands-on sessions (builders’ sessions and workshops)

DAP353: Privacy-enhancing data collaboration with AWS Clean Rooms
Organizations increasingly want to protect sensitive information and reduce or eliminate raw data sharing. To help companies meet these requirements, AWS has built AWS Clean Rooms. This service allows organizations to query their collective data without needing to expose the underlying datasets. In this builders’ session, get hands-on with AWS Clean Rooms preventative and detective privacy-enhancing controls to mitigate the risk of exposing sensitive data.

DAP371: Post-quantum crypto with AWS KMS TLS endpoints, SDKs, and libraries
This hands-on workshop demonstrates post-quantum cryptographic algorithms and compares their performance and size to classical ones. Learn how to use AWS Key Management Service (AWS KMS) with the AWS SDK for Java to establish a quantum-safe tunnel to transfer the most critical digital secrets and protect them from a theoretical computer targeting these communications in the future. Find out how the tunnels use classical and quantum-resistant key exchanges to offer the best of both worlds, and discover the performance implications.

DAP271: Data protection risk assessment for AWS workloads
Join this workshop to learn how to simplify the process of selecting the right tools to mitigate your data protection risks while reducing costs. Follow the data protection lifecycle by conducting a risk assessment, selecting the effective controls to mitigate those risks, deploying and configuring AWS services to implement those controls, and performing continuous monitoring for audits. Leave knowing how to apply the right controls to mitigate your business risks using AWS advanced services for encryption, permissions, and multi-party processing.

If these sessions look interesting to you, join us in California by registering for re:Inforce 2023. We look forward to seeing you there!

 
If you have feedback about this post, submit comments in the Comments section below. If you have questions about this post, contact AWS Support.

Want more AWS Security news? Follow us on Twitter.

Katie Collins

Katie Collins

Katie is a Product Marketing Manager in AWS Security, where she brings her enthusiastic curiosity to deliver products that drive value for customers. Her experience also includes product management at both startups and large companies. With a love for travel, Katie is always eager to visit new places while enjoying a great cup of coffee.

A sneak peek at the application security sessions for re:Inforce 2023

Post Syndicated from Paul Hawkins original https://aws.amazon.com/blogs/security/a-sneak-peek-at-the-application-security-sessions-for-reinforce-2023/

reInforce 2023

A full conference pass is $1,099. Register today with the code secure150off to receive a limited time $150 discount, while supplies last.


AWS re:Inforce is a security learning conference where you can gain skills and confidence in cloud security, compliance, identity, and privacy. As a re:Inforce attendee, you have access to hundreds of technical and non-technical sessions, an Expo featuring AWS experts and security partners with AWS Security Competencies, and keynote and leadership sessions featuring Security leadership. AWS re:Inforce 2023 will take place in-person in Anaheim, CA, on June 13 and 14.

In line with recent updates to the Security Pillar of the Well-Architected Framework, we added a new track to the conference on application security. The new track will help you discover how AWS, customers, and AWS Partners move fast while understanding the security of the software they build.

In these sessions, you’ll hear directly from AWS leaders and get hands-on with the tools that help you ship securely. You’ll hear how organization and culture help security accelerate your business, and you’ll dive deep into the technology that helps you more swiftly get features to customers. You might even find some new tools that make it simpler to empower your builders to move quickly and ship securely.

To learn about sessions from across the content tracks, see the AWS re:Inforce catalog preview.

Breakout sessions, chalk talks, and lightning talks

APS221: From code to insight: Amazon Inspector & AWS Lambda in action
In this lightning talk, see a demo of Amazon Inspector support for AWS Lambda. Inspect a Java application running on Lambda for security vulnerabilities using Amazon Inspector for an automated and continual vulnerability assessment. In addition, explore how Amazon Inspector can help you identify package and code vulnerabilities in your serverless applications.

APS302: From IDE to code review, increasing quality and security
Attend this session to discover how to improve the quality and security of your code early in the development cycle. Explore how you can integrate Amazon Code Whisperer, Amazon CodeGuru reviewer, and Amazon Inspector into your development workflow, which can help you identify potential issues and automate your code review process.

APS201: How AWS and MongoDB raise the security bar with distributed ownership
In this session, explore how AWS and MongoDB have approached creating their Security Guardians and Security Champions programs. Learn practical advice on scoping, piloting, measuring, scaling, and managing a program with the goal of accelerating development with a high security bar, and discover tips on how to bridge the gap between your security and development teams. Learn how a guardians or champions program can improve security outside of your dev teams for your company as a whole when applied broadly across your organization.

APS202: AppSec tooling & culture tips from AWS & Toyota Motor North America
In this session, AWS and Toyota Motor North America (TMNA) share how they scale AppSec tooling and culture across enterprise organizations. Discover practical advice and lessons learned from the AWS approach to threat modeling across hundreds of service teams. In addition, gain insight on how TMNA has embedded security engineers into business units working on everything from mainframes to serverless. Learn ways to support teams at varying levels of maturity, the importance of differentiating between risks and vulnerabilities, and how to balance the use of cloud-native, third-party, and open-source tools at scale.

APS331: Shift security left with the AWS integrated builder experience
As organizations start building their applications on AWS, they use a wide range of highly capable builder services that address specific parts of the development and management of these applications. The AWS integrated builder experience (IBEX) brings those separate pieces together to create innovative solutions for both customers and AWS Partners building on AWS. In this chalk talk, discover how you can use IBEX to shift security left by designing applications with security best practices built in and by unlocking agile software to help prevent security issues and bottlenecks.

Hands-on sessions (builders’ sessions and workshops)

APS271: Threat modeling for builders
Attend this facilitated workshop to get hands-on experience creating a threat model for a workload. Learn some of the background and reasoning behind threat modeling, and explore tools and techniques for modeling systems, identifying threats, and selecting mitigations. In addition, explore the process for creating a system model and corresponding threat model for a serverless workload. Learn how AWS performs threat modeling internally, and discover the principles to effectively perform threat modeling on your own workloads.

APS371: Integrating open-source security tools with the AWS code services
AWS, open-source, and partner tooling works together to accelerate your software development lifecycle. In this workshop, learn how to use Automated Security Helper (ASH), a source-application security tool, to quickly integrate various security testing tools into your software build and deployment flows. AWS experts guide you through the process of security testing locally on your machines and within the AWS CodeCommit, AWS CodeBuild, and AWS CodePipeline services. In addition, discover how to identify potential security issues in your applications through static analysis, software composition analysis, and infrastructure-as-code testing.

APS352: Practical shift left for builders
Providing early feedback in the development lifecycle maximizes developer productivity and enables engineering teams to deliver quality products. In this builders’ session, learn how to use AWS Developer Tools to empower developers to make good security decisions early in the development cycle. Tools such as Amazon CodeGuru, Amazon CodeWhisperer, and Amazon DevOps Guru can provide continuous real-time feedback upon each code commit into a source repository and supplement this with ML capabilities integrated into the code review stage.

APS351: Secure software factory on AWS through the DoD DevSecOps lens
Modern information systems within regulated environments are driven by the need to develop software with security at the forefront. Increasingly, organizations are adopting DevSecOps and secure software factory patterns to improve the security of their software delivery lifecycle. In this builder’s session, we will explore the options available on AWS to create a secure software factory aligned with the DoD Enterprise DevSecOps initiative. We will focus on the security of the software supply chain as we deploy code from source to an Amazon Elastic Kubernetes Service (EKS) environment.

If these sessions look interesting to you, join us in California by registering for re:Inforce 2023. We look forward to seeing you there!

 
If you have feedback about this post, submit comments in the Comments section below. If you have questions about this post, contact AWS Support.

Want more AWS Security news? Follow us on Twitter.

Author

Paul Hawkins

Paul helps customers of all sizes understand how to think about cloud security so they can build the technology and culture where security is a business enabler. He takes an optimistic approach to security and believes that getting the foundations right is the key to improving your security posture.

Discover Building without Limits at AWS Developer Innovation Day

Post Syndicated from Steve Roberts original https://aws.amazon.com/blogs/aws/discover-building-without-limits-at-aws-developer-innovation-day/

We hope you can join us on Wednesday, April 26, for a free-to-attend online event, AWS Developer Innovation Day. AWS will stream the event simultaneously across multiple platforms, including LinkedIn Live, Twitter, YouTube, and Twitch.

Developer Innovation Day is a brand-new event designed specifically for developers and development teams. In the event, sessions throughout the day will show how you can improve productivity and collaboration, provide a first look at new product updates, and go deep on AWS tools for development and delivery. Topics to be addressed include how you can speed up web and mobile application development and how you can build and deliver faster by taking advantage of modern infrastructure, DevOps, and generative AI-enabled tools.

We’ll be starting the day with a keynote from Adam Seligman, Vice President of Developer Experience at AWS. And, to wrap up the event, there are closing sessions from Dr. Werner Vogels, CTO at Amazon, Harry Mower, Director, AWS Code Suite, and Doug Seven, Director of Software Development, Amazon CodeWhisperer. A panel of experts will join Werner to discuss the latest trends in generative AI and what it all means for developers. Harry and Doug will discuss trends in developer and team productivity. Of course, no event would be complete without our own Jeff Barr, VP of AWS Evangelism, who’ll be sharing a “Best practices and key takeaways” session with a recap of key stories, announcements, and moments from the day!

AWS staff will present the technical breakout sessions during the day, and AWS Heroes and Community Builders will also be involved, presenting community spotlights, which are an excellent chance to get involved with the global AWS community. During and after the event there’s also a chance to sign up for an AWS Amplify hackathon that will be held in May and also an Amazon CodeCatalyst immersion day. Other fun events are also in the works—watch the event details page for more information.

AWS Developer Innovation Day Event Banner

There’s no up-front registration required to join AWS Developer Innovation Day, which, I’ll remind you, is also free to attend. Simply head on over to the event page and select Add to calendar. I’m excited to be joined by colleagues from the AWS on Air team to host the event, and we all hope you’ll choose to join in the fun and learning opportunities at this brand-new event!

Get maximum value out of your cloud data warehouse with Amazon Redshift

Post Syndicated from Sana Ahmed original https://aws.amazon.com/blogs/big-data/get-maximum-value-out-of-your-cloud-data-warehouse-with-amazon-redshift/

Every day, customers are challenged with how to manage their growing data volumes and operational costs to unlock the value of data for timely insights and innovation, while maintaining consistent performance. Data creation, consumption, and storage are predicted to grow to 175 zettabytes by 2025, forecasted by the 2022 IDC Global DataSphere report.

As data workloads grow, costs to scale and manage data usage with the right governance typically increase as well. So how do organizational leaders drive their business forward with high performance, controlled costs, and high security? With the right analytics approach, this is possible.

In this post, we look at three key challenges that customers face with growing data and how a modern data warehouse and analytics system like Amazon Redshift can meet these challenges across industries and segments.

Building an optimal data system

As data grows at an extraordinary rate, data proliferation across your data stores, data warehouse, and data lakes can become a challenge. Different departments within an organization can place data in a data lake or within their data warehouse depending on the type of data and usage patterns of that department. Teams may place their unstructured data like social media feeds within their Amazon Simple Storage Service (Amazon S3) data lake and historical structured data within their Amazon Redshift data warehouse. Teams need access to both the data lake and the data warehouse to work seamlessly for best insights, requiring an optimal data infrastructure that can scale almost infinitely to accommodate a growing number of concurrent data users without impacting performance—all while keeping costs under control.

A quintessential example of a company managing analytics on billions of data points across the data lake and the warehouse in a mission-critical business environment is Nasdaq, an American stock exchange. Within 2 years of migration to Amazon Redshift, Nasdaq was managing 30–70 billion records, growing daily worth over 4 terabytes.

With Amazon Redshift, Nasdaq was able to query their warehouse and use Amazon Redshift Spectrum, a capability to query the data quickly in place without data loading, from their S3 data lakes. Nasdaq minimized time to insights with the ability to query 15 terabytes of data on Amazon S3 immediately without any extra data loading after writing data to Amazon S3. This performance innovation allows Nasdaq to have a multi-use data lake between teams.

Robert Hunt, Vice President of Software Engineering for Nasdaq, shared, “We have to both load and consume the 30 billion records in a time period between market close and the following morning. Data loading delayed the delivery of our reports. We needed to be able to write or load data into our data storage solution very quickly without interfering with the reading and querying of the data at the same time.”

Nasdaq’s massive data growth meant they needed to evolve their data architecture to keep up. They built their foundation of a new data lake on Amazon S3 so they could deliver analytics using Amazon Redshift as a compute layer. Nasdaq’s peak volume of daily data ingestion reached 113 billion records, and they completed data loading for reporting 5 hours faster while running 32% faster queries.

Enabling newer personas with data warehousing and analytics

Another challenge is enabling newer data users and personas with powerful analytics to meet business goals and perform critical decision-making. Where traditionally it was the data engineer and the database administrator who set up and managed the warehouse, today line of business data analysts, data scientists, and developers are all using the data warehouse to get to near-real-time business decision-making.
These personas who don’t have specialized data management or data engineering skills don’t want to be concerned with managing the capacity of their analytics systems to handle unpredictable or spiky data workloads or wait for IT to optimize for cost and capacity. Customers want to get started with analytics on large amounts of data instantly and scale analytics quickly and cost-effectively without infrastructure management.

Take the case of mobile gaming company Playrix. They were able to use Amazon Redshift Serverless to serve their key stakeholders with dashboards with financial data for quick decision-making.

Igor Ivanov, Technical Director of Playrix, stated, “Amazon Redshift Serverless is great for achieving the on-demand high performance that we need for massive queries.”

Playrix had a two-fold business goal, including marketing to its end-users (game players) with near-real-time data while also analyzing their historical data for the past 4–5 years. In seeking a solution, Playrix wanted to avoid disrupting other technical processes while also increasing cost savings. The company migrated to Redshift Serverless and scaled up to handle more complicated analytics on 600 TB from the past 5 years, all without storing two copies of the data or disrupting other analytics jobs. With Redshift Serverless, Playrix achieved a more flexible architecture and saved an overall 20% in costs of its marketing stack, decreasing its cost of customer acquisition.

“With no overhead and infrastructure management,” Ivanov shared, “we now have more time for experimenting, developing solutions, and planning new research.”

Breaking down data silos

Organizations need to easily access and analyze diverse types of structured and unstructured data, including log files, clickstreams, voice, and video. However, these wide-ranging data types are typically stored in silos across multiple data stores. To unlock the true potential of the data, organizations must break down these silos to unify and normalize all types of data and ensure that the right people have access to the right data.

Data unification can get expensive fast, with time and cost spent on building complex, custom extract, transform, load (ETL) pipelines that move or copy data from system to system. If not done right, you can end up with data latency issues, inaccuracies, and potential security and data governance risks. Instead, teams are looking for ways to share transactionally consistent, live, first-party and third-party data with each other or their end customers, without data movement or data copying.

Stripe, a payment processing platform for businesses, is an Amazon Redshift customer and a partner with thousands of end customers who require access to Stripe data for their applications. Stripe built the Stripe Data Pipeline, a solution for Stripe customers to access Stripe datasets within their Amazon Redshift data warehouses, without having to build, maintain, or scale custom ETL jobs. The Stripe Data Pipeline is powered by the data sharing capability of Amazon Redshift. Customers get a single source of truth, with low-latency data access, to speed up financial close and get better insights, analyzing best-performing payment methods, fraud by location, and more. Cutting down data engineering time and effort to access unified data creates new business opportunities from comprehensive insights and saves costs.

A modern data architecture with Amazon Redshift

These stories about harnessing maximum value from siloed data across the organization and applying powerful analytics for business insights in a cost-efficient way are possible because of AWS’s approach to a modern data architecture for their customers. Within this architecture, AWS’s data warehousing solution Amazon Redshift is a fully managed petabyte scale system, deeply integrated with AWS database, analytics, and machine learning (ML) services. Tens of thousands of customers use Amazon Redshift every day to run data warehousing and analytics in the cloud and process exabytes of data for business insights. Customers looking for a highly performing, cost-optimized cloud data warehouse solution choose Amazon Redshift for the following reasons:

  • Its leadership in price-performance
  • The ability to break through data silos for meaningful insights
  • Easy analytics capabilities that cut down data engineering and administrative requirements
  • Security and reliability features that are offered out of the box, at no additional cost

The price-performance in a cloud data warehouse benchmark metric is simply defined as the cost to perform a particular workload. Knowing how much your data warehouse is going to cost and how performance changes as your user base and data processing increases is crucial for planning, budgeting, and decision-making around choosing the best data warehouse.

Amazon Redshift is able to attain the best price-performance for customers (up to five times better than other cloud data warehouses) by optimizing the code for AWS hardware, high-performance and power-efficient compute hardware, new compression and caching algorithms, and autonomics (ML-based optimizations) within the warehouse to abstract the administrative activities away from the user, saving time and improving performance. Flexible pricing options such as pay-as-you-go with Redshift Serverless, separation of storage and compute scaling, and 1–3-year compute reservations with heavy discounts keep prices low.

The native integrations in Amazon Redshift with databases, data lakes, streaming data services, and ML services, employing zero-ETL approaches help you access data in place without data movement and easily ingest data into the warehouse without building complex pipelines. This keeps data engineering costs low and expands analytics for more users.

For example, the integration in Amazon Redshift with Amazon SageMaker allows data analysts to stay within the data warehouse and create, train, and build ML models in SQL with no need for ETL jobs or learning new languages for ML (see Jobcase Scales ML Workflows to Support Billions of Daily Predictions Using Amazon Redshift ML for an example). Every week, over 80 billion predictions happen in the warehouse with Amazon Redshift ML.

Finally, customers don’t have to pay more to secure their critical data assets. Security features offer comprehensive identity management with data encryption, granular access controls at row and column level, and data masking abilities to protect sensitive data and authorizations for the right users or groups. These features are available out of the box, within the standard pricing model.

Conclusion

Overall, customers who choose Amazon Redshift innovate in a new reality where the data warehouse scales up and down automatically as workloads change, and maximizes the value of data for all cornerstones of their business.

For market leaders like Nasdaq, they are able to ingest billions of data points daily for trading and selling at high volume and velocity, all in time for proper billing and trading the following business day. For customers like Playrix, choosing Redshift Serverless means marketing to customers with comprehensive analytics in near-real time without getting bogged down by maintenance and overhead. For Stripe, it also means taking the complexity and TCO out of ETL, removing silos and unifying data.

Although data will continue to grow at unprecedented amounts, your bottom line doesn’t need to suffer. While organizational leaders face the pressures of solving for cost optimization in all types of economic environments, Amazon Redshift gives market leaders a space to innovate without compromising their data value, performance, and budgets of their cloud data warehouse.

Learn more about maximizing the value of your data with a modern data warehouse like Amazon Redshift. For more information about the price-performance leadership of Amazon Redshift and to review benchmarks against other vendors, see Amazon Redshift continues its price-performance leadership. Additionally, you can optimize costs using a variety of performance and cost levers, including Amazon Redshift’s flexible pricing models, which cover pay-as-you-go pricing for variable workloads, free trials, and reservations for steady state workloads.


About the authors

Sana Ahmed is a  Sr. Product Marketing Manager for Amazon Redshift. She is passionate about people, products and problem-solving with product marketing. As a Product Marketer, she has taken 50+ products to market and worked at various different companies including Sprinklr, PayPal and Facebook. Her hobbies include tennis, museum-hopping and fun conversations with friends and family.

Sunaina AbdulSalah leads product marketing for Amazon Redshift. She focuses on educating customers about the impact of data warehousing and analytics and sharing AWS customer stories. She has a deep background in marketing and GTM functions in the B2B technology and cloud computing domains. Outside of work, she spends time with her family and friends and enjoys traveling.

The collective thoughts of the interwebz