Post Syndicated from Crosstalk Solutions original https://www.youtube.com/watch?v=BQtlHkhD1c8
What’s new in Amazon Redshift – 2021, a year in review
Post Syndicated from Manan Goel original https://aws.amazon.com/blogs/big-data/whats-new-in-amazon-redshift-2021-a-year-in-review/
Amazon Redshift is the cloud data warehouse of choice for tens of thousands of customers who use it to analyze exabytes of data to gain business insights. Customers have asked for more capabilities in Redshift to make it easier, faster, and secure to store, process, and analyze all of their data. We announced Redshift in 2012 as the first cloud data warehouse to remove the complexity around provisioning, managing, and scaling data warehouses. Since then, we have launched capabilities such as Concurrency scaling, Spectrum, and RA3 nodes to help customers analyze all of their data and support growing analytics demands across all users in the organization. We continue to innovate with Redshift on our customers’ behalf and launched more than 50 significant features in 2021. This post covers some of those features, including use cases and benefits.
Working backwards from customer requirements, we are investing in Redshift to bring out new capabilities in three main areas:
- Easy analytics for everyone
- Analyze all of your data
- Performance at any scale
Customers told us that the data warehouse users in their organizations are expanding from administrators, developers, analysts, and data scientists to the Line of Business (LoB) users, so we continue to invest to make Redshift easier to use for everyone. Customers also told us that they want to break free from data silos and access data across their data lakes, databases, and data warehouses and analyze that data with SQL and machine learning (ML). So we continue to invest in letting customers analyze all of their data. And finally, customers told us that they want the best price performance for analytics at any scale from Terabytes to Petabytes of data. So we continue to bring out new capabilities for performance at any scale. Let’s dive into each of these pillars and cover the key capabilities that we launched in 2021.
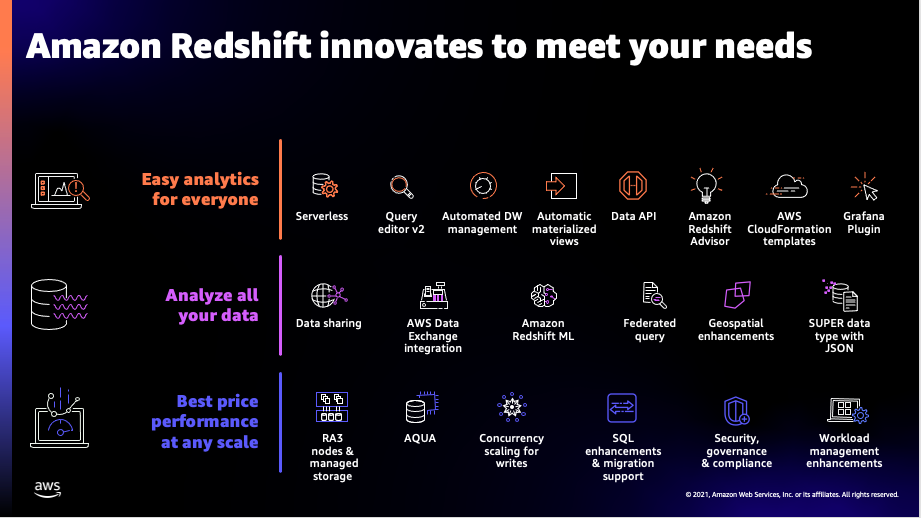
Amazon Redshift key innovations
Redshift delivers easy analytics for everyone
Easy analytics for everyone requires a simpler getting-started experience, automated manageability, and visual user interfaces that make is easier, simpler, and faster for both technical and non-technical users to quickly get started, operate, and analyze data in a data warehouse. We launched new features such as Redshift Serverless (in preview), Query Editor V2, and automated materialized views (in preview), as well as enhanced the Data API in 2021 to make it easier for customers to run their data warehouses.
Redshift Serverless (in preview) makes it easy to run and scale analytics in seconds without having to provision and manage data warehouse clusters. The serverless option lets all users, including data analysts, developers, business users, and data scientists use Redshift to get insights from data in seconds by simply loading and querying data into the data warehouse. Customers can launch a data warehouse and start analyzing the data with the Redshift Serverless option through just a few clicks in the AWS Management Console. There is no need to choose node types, node count, or other configurations. Customers can take advantage of pre-loaded sample data sets along with sample queries to kick start analytics immediately. They can create databases, schemas, tables, and load their own data from their desktop, Amazon Simple Storage Service (S3), via Amazon Redshift data shares, or restore an existing Amazon Redshift provisioned cluster snapshot. They can also directly query data in open formats, such as Parquet or ORC, in their Amazon S3 data lakes, as well as data in their operational databases, such as Amazon Aurora and Amazon RDS. Customers pay only for what they use, and they can manage their costs with granular cost controls.
Redshift Query Editor V2 is a web-based tool for data analysts, data scientists, and database developers to explore, analyze, and collaborate on data in Redshift data warehouses and data lake. Customers can use Query Editor’s visual interface to create and browse schema and tables, load data, author SQL queries and stored procedures, and visualize query results with charts. They can share and collaborate on queries and analysis, as well a track changes with built in version control. Query Editor V2 also supports SQL Notebooks (in preview), which provides a new Notebook interface that lets users such as data analysts and data scientists author queries, organize multiple SQL queries and annotations on a single document, and collaborate with their team members by sharing Notebooks.

Amazon Redshift Query Editor V2
Customers have long used Amazon Redshift materialized views (MV) for precomputed result sets, based on an SQL query over one or more base tables to improve query performance, particularly for frequently used queries such as those in dashboards and reports. In 2021, we launched Automated Materialized View (AutoMV) in preview to improve the performance of queries (reduce the total execution time) without any user effort by automatically creating and maintaining materialized views. Customers told us that while MVs offer significant performance benefits, analyzing the schema, data, and workload to determine which queries might benefit from having an MV or which MVs are no longer beneficial and should be dropped requires knowledge, time, and effort. AutoMV lets Redshift continually monitor the cluster to identify candidate MVs and evaluates the benefits vs costs. It creates MVs that have high benefit-to-cost ratios, while ensuring existing workloads are not negatively impacted by this process. AutoMV continually monitors the system and will drop MVs that are no longer beneficial. All of these are transparent to users and applications. Applications such as dashboards benefit without any code change thanks to automatic query re-write, which lets existing queries benefit from MVs even when not explicitly referenced. Customers can also set the MVs to autorefresh so that MVs always have up-to-date data for added convenience.
Customers have also asked us to simplify and automate data warehouse maintenance tasks, such as schema or table design, so that they can get optimal performance out of their clusters. Over the past few years, we have invested heavily to automate these maintenance tasks. For example, Automatic Table Optimization (ATO) selects the best sort and distribution keys to determine the optimal physical layout of data to maximize performance. We’ve extended ATO to modify column compression encodings to achieve high performance and reduce storage utilization. We have also introduced various features, such as auto vacuum delete and auto analyze, over the past few years to make sure that customer data warehouses continue to operate at peak performance.
Data API, which launched in 2020, has also seen major enhancements, such as multi-statement query execution, support for parameters to develop reusable code, and availability in more regions in 2021 to make it easier for customers to programmatically access data in Redshift. Data API lets Redshift enable customers to painlessly access data with all types of traditional, cloud-native, and containerized, serverless web services-based applications and event-driven applications. It simplifies data access, ingest, and egress from programming languages and platforms supported by the AWS SDK, such as Python, Go, Java, Node.js, PHP, Ruby, and C++. The Data API eliminates the need for configuring drivers and managing database connections. Instead, customers can run SQL commands to an Amazon Redshift cluster by simply calling a secured API endpoint provided by the Data API. The Data API takes care of managing database connections and buffering data. The Data API is asynchronous, so results can be retrieved later and are stored for 24 hours.
Finally in our easy analytics for everyone pillar, in 2021 we launched the Grafana Redshift Plugin to help customers gain a deeper understanding of their cluster’s performance. Grafana is a popular open-source tool for running analytics and monitoring systems online. The Grafana Redshift Plugin lets customers query system tables and views for the most complete set of operational metrics on their Redshift cluster. The Plugin is available in the Open Source Grafana repository, as well as in our Amazon Managed Grafana service. We also published a default in-depth operational dashboard to take advantage of this feature.
Redshift makes it possible for customers to analyze all of their data
Redshift gives customers the best of both data lakes and purpose-built data stores, such as databases and data warehouses. It enables customers to store any amount of data, at low cost, and in open, standards-based data formats such as parquet and JSON in data lakes, and run SQL queries against it without loading or transformations. Furthermore, it lets customers run complex analytic queries with high performance against terabytes to petabytes of structured and semi-structured data, using sophisticated query optimization, columnar storage on high-performance storage, and massively parallel query execution. Redshift lets customers access live data from the transactional databases as part of their business intelligence (BI) and reporting applications to enable operational analytics. Customers can break down data silos by seamlessly querying data in the data lakes, data warehouses, and databases; empower their teams to run analytics and ML using their preferred tool or technique; and manage who has access to data with the proper security and data governance controls. We launched new features in 2021, such as Data Sharing, AWS Data Exchange integration, and Redshift ML, to make it easier for customers to analyze all of their data.
Amazon Redshift data sharing lets customers extend the ease of use, performance, and cost benefits that Amazon Redshift offers in a single cluster to multi-cluster deployments while being able to share data. It enables instant, granular, and fast data access across Amazon Redshift clusters without the need to copy or move data around. Data sharing provides live access to data so that your users always see the most up-to-date and consistent information as it’s updated in the data warehouse. Customers can securely share live data with Amazon Redshift clusters in the same or different AWS accounts within the same region or across regions. Data sharing features several performance enhancements, including result caching and concurrency scaling, which allow customers to support a broader set of analytics applications and meet critical performance SLAs when querying shared data. Customers can use data sharing for use cases such as workload isolation and offer chargeability, as well as provide secure and governed collaboration within and across teams and external parties.
Customers also asked us to help them with internal or external data marketplaces so that they can enable use cases such as data as a service and onboard 3rd-party data. We launched the public preview of AWS Data Exchange for Amazon Redshift, a new feature that enables customers to find and subscribe to third-party data in AWS Data Exchange that they can query in an Amazon Redshift data warehouse in minutes. Data providers can list and offer products containing Amazon Redshift data sets in the AWS Data Exchange catalog, granting subscribers direct, read-only access to the data stored in Amazon Redshift. This feature empowers customers to quickly query, analyze, and build applications with these third-party data sets. AWS Data Exchange for Amazon Redshift lets customers combine third-party data found on AWS Data Exchange with their own first-party data in their Amazon Redshift cloud data warehouse, with no ETL required. Since customers are directly querying provider data warehouses, they can be certain that they are using the latest data being offered. Additionally, entitlement, billing, and payment management are all automated: access to Amazon Redshift data is granted when a data subscription starts and is removed when it ends, invoices are automatically generated, and payments are automatically collected and disbursed through AWS Marketplace.
Customers also asked for our help to make it easy to train and deploy ML models such as prediction, natural language processing, object detection, and image classification directly on top of the data in purpose-built data stores without having to perform complex data movement or learn new tools. We launched Redshift ML earlier this year to enable customers to create, train, and deploy ML models using familiar SQL commands. Amazon Redshift ML lets customers leverage Amazon SageMaker, a fully managed ML service, without moving their data or learning new skills. Furthermore, Amazon Redshift ML powered by Amazon SageMaker lets customers use SQL statements to create and train ML models from their data in Amazon Redshift, and then use these models for use cases such as churn prediction and fraud risk scoring directly in their queries and reports. Amazon Redshift ML automatically discovers the best model and tunes it based on training data using Amazon SageMaker Autopilot. SageMaker Autopilot chooses between regression, binary, or multi-class classification models. Alternatively, customers can choose a specific model type such as Xtreme Gradient Boosted tree (XGBoost) or multilayer perceptron (MLP), a problem type like regression or classification, and preprocessors or hyperparameters. Amazon Redshift ML uses customer parameters to build, train, and deploy the model in the Amazon Redshift data warehouse. Customers can obtain predictions from these trained models using SQL queries as if they were invoking a user defined function (UDF), and leverage all of the benefits of Amazon Redshift, including massively parallel processing capabilities. Customers can also import their pre-trained SageMaker Autopilot, XGBoost, or MLP models into their Amazon Redshift cluster for local inference. Redshift ML supports both supervised and unsupervised ML for advanced analytics use cases ranging from forecasting to personalization.
Customers want to combine live data from operational databases with the data in Amazon Redshift data warehouse and the data in Amazon S3 data lake environment to get unified analytics views across all of the data in the enterprise. We launched Amazon Redshift federated query to let customers incorporate live data from the transactional databases as part of their BI and reporting applications to enable operational analytics. The intelligent optimizer in Amazon Redshift pushes down and distributes a portion of the computation directly into the remote operational databases to help speed up performance by reducing data moved over the network. Amazon Redshift complements subsequent execution of the query by leveraging its massively parallel processing capabilities for further speed up. Federated query also makes it easier to ingest data into Amazon Redshift by letting customers query operational databases directly, applying transformations on the fly, and loading data into the target tables without requiring complex ETL pipelines. In 2021, we added support for Amazon Aurora MySQL and Amazon RDS for MySQL databases in addition to the existing Amazon Aurora PostgreSQL and Amazon RDS for PostgreSQL databases for federated query to enable customers to access more data sources for richer analytics.
Finally in our analyze all your data pillar in 2021, we added data types such as SUPER, GEOGRAPHY, and VARBYTE to enable customers to store semi-structured data natively in the Redshift data warehouse so that they can analyze all of their data at scale and with performance. The SUPER data type lets customers ingest and store JSON and semi-structured data in their Amazon Redshift data warehouses. Amazon Redshift also includes support for PartiQL for SQL-compatible access to relational, semi-structured, and nested data. Using the SUPER data type and PartiQL in Amazon Redshift, customers can perform advanced analytics that combine classic structured SQL data (such as string, numeric, and timestamp) with the semi-structured SUPER data (such as JSON) with superior performance, flexibility, and ease-of-use. The GEOGRAPHY data type builds on Redshift’s support of spatial analytics, opening-up support for many more third-party spatial and GIS applications. Moreover, it adds to the GEOMETRY data type and over 70 spatial functions that are already available in Redshift. The GEOGRAPHY data type is used in queries requiring higher precision results for spatial data with geographic features that can be represented with a spheroid model of the Earth and referenced using latitude and longitude as a spatial coordinate system. VARBYTE is a variable size data type for storing and representing variable-length binary strings.
Redshift delivers performance at any scale
Since we announced Amazon Redshift in 2012, performance at any scale has been a foundational tenet for us to deliver value to tens of thousands of customers who trust us every day to gain business insights from their data. Our customers span all industries and sizes, from startups to Fortune 500 companies, and we work to deliver the best price performance for any use case. Over the years, we have launched features such as dynamically adding cluster capacity when you need it with concurrency scaling, making sure that you use cluster resources efficiently with automatic workload management (WLM), and automatically adjusting data layout, distribution keys, and query plans to provide optimal performance for a given workload. In 2021, we launched capabilities such as AQUA, concurrency scaling for writes, and further enhancements to RA3 nodes to continue to improve Redshift’ price performance.
We introduced the RA3 node types in 2019 as a technology that allows the independent scaling of compute and storage. We also described how customers, including Codeacademy, OpenVault, Yelp, and Nielsen, have taken advantage of Amazon Redshift RA3 nodes with managed storage to scale their cloud data warehouses and reduce costs. RA3 leverages Redshift Managed Storage (RMS) as its durable storage layer which allows near-unlimited storage capacity where data is committed back to Amazon S3. This enabled new capabilities, such as Data Sharing and AQUA, where RMS is used as a shared storage across multiple clusters. RA3 nodes are available in three sizes (16XL, 4XL, and XLPlus) to balance price/performance. In 2021, we launched single node RA3 XLPlus clusters to help customers cost-effectively migrate their smaller data warehouse workloads to RA3s and take advantage of better price performance. We also introduced a self-service DS2 to RA3 RI migration capability that lets RIs be converted at a flat cost between equivalent node types.
AQUA (Advanced Query Accelerator) for Amazon Redshift is a new distributed and hardware-accelerated cache that enables Amazon Redshift to run an order of magnitude faster than other enterprise cloud data warehouses by automatically boosting certain query types. AQUA uses AWS-designed processors with AWS Nitro chips adapted to speed up data encryption and compression, and custom analytics processors, implemented in FPGAs, to accelerate operations such as scans, filtering, and aggregation. AQUA is available with the RA3.16xlarge, RA3.4xlarge, or RA3.xlplus nodes at no additional charge and requires no code changes.
Concurrency Scaling was launched in 2019 to handle spiky and unpredictable read workloads without having to pre-provision any capacity. Redshift offers one hour of free Concurrency Scaling for every 24 hours of usage that your main cluster is running. It also offers cost controls to monitor and limit your usage and associated costs for Concurrency Scaling. In addition to read queries, supporting write queries has been a big ask from customers to support ETL workloads. In 2021, we launched Redshift Concurrency Scaling write queries support in preview with common operations such as INSERT, DELETE, UPDATE, and COPY to handle unpredictable spikes in ETL workloads. If you are currently using Concurrency Scaling, this new capability is automatically enabled in your cluster. You can monitor your Concurrency Scaling usage using the Amazon Redshift Console and get alerts on any usage exceeding your defined limits. You can also create, modify, and delete usage limits programmatically by using the AWS Command Line Interface (CLI) and AWS API.
Finally we continue to ensure that AWS has comprehensive security capabilities to satisfy the most demanding requirements, and Amazon Redshift continues to provides data security out-of-the-box at no extra cost. We introduced new security features in 2021, such as cross-VPC support and default IAM roles, to continue to make Redshift more secure for customer workloads.
Summary
When it comes to making it easier, simpler, and faster for customers to analyze all of their data, velocity matters and we are innovating at a rapid pace to bring new capabilities to Redshift. We continue to make Redshift features available in more AWS regions worldwide to make sure that all customers have access to all capabilities. We have covered the key features above and the complete list is available here. We look forward to how you will use some of these capabilities to continue innovating with data and analytics.
About the Author
 Manan Goel is a Product Go-To-Market Leader for AWS Analytics Services including Amazon Redshift & AQUA at AWS. He has more than 25 years of experience and is well versed with databases, data warehousing, business intelligence, and analytics. Manan holds a MBA from Duke University and a BS in Electronics & Communications engineering.
[$] Lessons from Log4j
Post Syndicated from original https://lwn.net/Articles/878570/rss
By now, most readers will likely have seen something about the Log4j
vulnerability that has been making life miserable for system administrators
since its disclosure on December 9. This bug is relatively easy to
exploit, results in remote code execution, and lurks on servers all across
the net; it is not hyperbolic to call it one of the worst vulnerabilities
that has been disclosed in some years. In a sense, the lessons from Log4j
have little new to teach us, but this bug does highlight some problems in
the free-software ecosystem in an unambiguous way.
NAS and the Hybrid Cloud
Post Syndicated from Molly Clancy original https://www.backblaze.com/blog/nas-and-the-hybrid-cloud/

Upgrading to network attached storage (NAS) can be a game changer for your business. When you invest in NAS, you get easier collaboration, faster restores, 24/7 file availability, and added redundancy. But you can get an even bigger return on your investment by pairing it with cloud storage. When you combine NAS with a trusted cloud storage provider in a hybrid cloud strategy, you gain access to features that complement the security of your data and your ability to share files both locally and remotely.
In this post, we’ll look at how you can achieve a hybrid cloud strategy with NAS and cloud storage.
What Is Hybrid Cloud?
A hybrid cloud strategy uses a private cloud and public cloud in combination. To expand on that a bit, we can say that the hybrid cloud refers to a cloud environment made up of a mixture of typically on-premises, private cloud resources combined with third-party public cloud resources that use some kind of orchestration between them. A private cloud doesn’t necessarily need to live on-premises—some companies rent space in a data center to host the infrastructure for their private cloud—the important defining factor is that a private cloud is dedicated to only one “tenant” or organization.

In this case, your NAS device serves as the on-premises private cloud, as it’s dedicated to only you or your organization, and then you connect it to the public cloud.
What Are the Benefits of Hybrid Cloud?
A hybrid cloud model offers a number of benefits, including:
- Off-site backup protection.
- Added security features.
- Remote sync capabilities.
- Flexibility and cost savings.
Hybrid Cloud Benefit 1: Off-site Backup Protection
To start with, cloud storage provides off-site backup protection. This aligns your NAS setup with the industry standard for data protection: a 3-2-1 backup strategy—which ensures that you have three copies of your data on two different media (read: devices) with one stored off-site. When using NAS and the cloud in a hybrid strategy, you have three copies of your data—the source data and two backups. One of those backups lives on your NAS and one is stored off-site in the cloud. In the event of data loss, you can restore your systems directly from the cloud even if all the systems in your office are knocked out or destroyed.
Hybrid Cloud Benefit 2: Added Security Features
Data sent to the cloud is encrypted in-flight via SSL, and you can also encrypt your backups so that they are only openable with your team’s encryption key. The cloud can also give you advanced storage options for your backup files, like Object Lock. Object Lock allows you to store data using a Write Once, Read Many (WORM) model. Once you set Object Lock and the retention timeframe, your data stored with Object Lock is unchangeable for a defined period of time. You can also set custom data lifecycle rules at the bucket level to help match your ideal backup workflow.
Hybrid Cloud Benefit 3: Remote Sync Capabilities
Cloud storage provides valuable access to your data and documents from your NAS through sync capabilities. In case anyone on your team needs to access a file when they are away from the office, or as is more common now, when your entire team is working from home, they’ll be able to access the files that have been synced to the cloud through your NAS’s secure sync program. You can even sync across multiple locations using the cloud as a two-way sync to quickly replicate data across locations. For employees collaborating remotely, this helps to ensure they’re not waiting on the internet to deliver critical files: They’re already on-site.
What’s the Difference Between Cloud Sync, Cloud Backup, and Cloud Storage?
Sync services allow multiple users across multiple devices to access the same file. Backup stores a copy of those files somewhere remote from your work environment, usually in an off-site server—like cloud storage. It’s important to know that a “sync” is not a backup, but they can work well together when properly coordinated.
Hybrid Cloud Benefit 4: Flexibility and Cost Savings
Additionally, two of the biggest advantages of the hybrid cloud are flexibility and cost savings. Provisioning an additional device to store backups and physically separating it from your production data is time consuming and costly. The cloud eliminates the need to provision and maintain additional hardware while keeping your data protected with a 3-2-1 strategy, and it can be scaled up or down flexibly as needed.
With NAS on-site for fast, local access combined with the cloud for off-site backups and storage of less frequently used files, you get the best of both worlds.
How to Set Up a Hybrid Cloud With NAS
Some cloud providers are already integrated with NAS systems. (Backblaze B2 Cloud Storage is integrated with NAS systems from Synology and QNAP, for example.) Check if your preferred NAS system is already integrated with a cloud storage provider to ensure setting up cloud backup, storage, and sync is as easy as possible.
Your NAS should come with a built-in backup manager, like Hyper Backup from Synology or Hybrid Backup Sync from QNAP. Once you download and install the appropriate backup manager app, you can configure it to send backups to your preferred cloud provider. You can also fine-tune the behavior of the backup jobs, including what gets backed up and how often.
Now, you can send backups to the cloud as a third, off-site backup and use your cloud instance to access files anywhere in the world with an internet connection.
Wondering If NAS Is Right for You?
Our Complete NAS Guide provides comprehensive information on NAS and what it can do for your business, how to evaluate and purchase a NAS system, and how to deploy your NAS. Download the guide today for more on all things NAS.
The post NAS and the Hybrid Cloud appeared first on Backblaze Blog | Cloud Storage & Cloud Backup.
More Log4j News
Post Syndicated from Bruce Schneier original https://www.schneier.com/blog/archives/2021/12/more-log4j-news.html
Log4j is being exploited by all sorts of attackers, all over the Internet:
At that point it was reported that there were over 100 attempts to exploit the vulnerability every minute. “Since we started to implement our protection we prevented over 1,272,000 attempts to allocate the vulnerability, over 46% of those attempts were made by known malicious groups,” said cybersecurity company Check Point.
And according to Check Point, attackers have now attempted to exploit the flaw on over 40% of global networks.
And a second vulnerability was found, in the patch for the first vulnerability. This is likely not to be the last.
Serverless Scheduling with Amazon EventBridge, AWS Lambda, and Amazon DynamoDB
Post Syndicated from Peter Grman original https://aws.amazon.com/blogs/architecture/serverless-scheduling-with-amazon-eventbridge-aws-lambda-and-amazon-dynamodb/
Many applications perform scheduled tasks. For instance, you might want to automatically publish an article at a given time, change prices for offers which were defined weeks in advance, or notify customers 8 hours before a flight. These might be one-off tasks, or recurring ones.
On Unix-like operating systems, you might have opted for the cron utility. There are also similar alternatives for many web application frameworks, as well as advanced libraries, to schedule future one-off tasks. In a single server environment, this might seem like a simple solution. However, when you run dozens of instances of your application server, it gets harder to rely on those libraries to schedule tasks reliably at least once, without taking up too many resources. If you decide to build a serverless application, you need a new approach all together.
This post shows how you can build a scalable serverless job scheduler. You can use this method to scale to thousands, or even millions, of distributed jobs per minute. Because you are using serverless technologies, the underlying infrastructure is fully managed by AWS and you only pay for what you use. You can use this solution as an addition to your existing applications, regardless if they already use serverless technologies.
Similarly to a cron job running on a single instance, this solution uses an Amazon EventBridge rule, which starts new events periodically on a schedule. For recurring jobs, you would use this capability to start specific actions directly. This will work if you have only a few dozen periodic tasks, whose execution cycle can be defined as a cron expression. However, remember that there are limits to how many rules can be defined per event bus, and rules with a scheduled expression can only be defined on the default event bus. This post describes a method to multiplex a single Amazon EventBridge rule via an AWS Lambda function and Amazon DynamoDB, to scale beyond thousands of jobs. While this example focuses on one-off tasks, you can use the same approach for recurring jobs as well.
Overview of solution
The following diagram shows the architecture of the serverless scheduling solution.
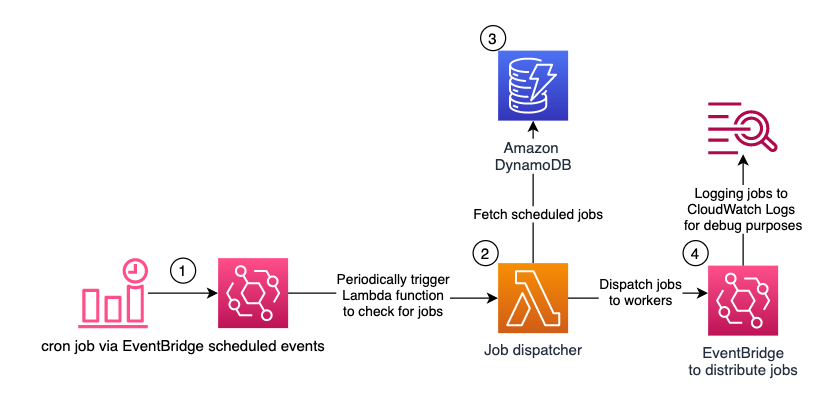
Figure 1 – Architecture diagram showing Serverless Scheduling with Amazon EventBridge, AWS Lambda, and Amazon DynamoDB
Amazon EventBridge with scheduled expressions periodically starts an AWS Lambda function. An Amazon DynamoDB table stores the future jobs. The Lambda function queries the table for due jobs and distributes them via Amazon EventBridge to the workers.
The following services are used:
Amazon EventBridge: to initiate the serverless scheduling solution. Amazon EventBridge is a serverless event bus that makes it easier to build event-driven applications at scale. It can also schedule events based on time intervals or cron expressions.
In this solution, you’ll use EventBridge for two things:
- to periodically start the AWS Lambda function, which checks for new jobs to be executed, and
- to distribute those jobs to the workers.
Here, you can control the granularity of your job executions. The fastest rate possible is once every minute. But if you don’t need a 1-minute precision, you can also opt for once every 5 minutes, or even once every hour. Remember that you cannot control at which second the event is started. It might be at the beginning of the minute, in the middle, or at the end.
AWS Lambda: to execute the scheduler logic. AWS Lambda is a serverless, event-driven compute service that lets you run code without provisioning or managing servers. The Lambda function queries the jobs from DynamoDB and distributes them via EventBridge. Based on your requirements, you can adjust this to use different mechanisms to notify the workers about the jobs, such as HTTP APIs, gRPC calls, or AWS services like Amazon Simple Notification Service (SNS) or Amazon Simple Queue Service (SQS).
Amazon DynamoDB: to store scheduled jobs. Amazon DynamoDB is a fully managed, serverless, key-value NoSQL database designed to run high-performance applications at any scale. Defining the right data model is important to be able to scale to thousands or even millions of scheduled and processed jobs per minute. The DynamoDB table in this solution has a partition key “pk” and a sort key “sk”. For the Lambda function, to be able to query all due jobs quickly and efficiently, jobs must be partitioned. For this, they are grouped together based on their scheduled times in intervals of 5 minutes. This value is the partition key “pk”. How to calculate this value is explained in detail, when you will test the solution.
The sort key “sk” contains the precise execution time concatenated with a unique identifier, such as a job ID, because the combination of “pk” and “sk” must be unique. To schedule a job in this example, you write it manually into the DynamoDB table. In your production code you can abstract the synchronous DynamoDB access, by implementing it in a shared library, or using Amazon API Gateway. You could also schedule jobs from a Lambda function reacting to events in your system.
Amazon EventBridge: to distribute the jobs. The Lambda function uses Amazon EventBridge as an example to distribute the jobs. The workers which should receive the jobs, must configure the corresponding rules upfront. For testing purposes, this solution comes with a rule which logs all events from the Lambda function into Amazon CloudWatch Logs.
Walkthrough
In this section, you will deploy the solution and test it.
- An AWS account
- An AWS user, which has access to the AWS Management Console and has the IAM permissions to launch the AWS CloudFormation stack and create the aforementioned resources.
Deploying the solution
To deploy it in your account:
1. Select Launch Stack.

2. Select the Region where you want to launch your serverless scheduler.
3. Define a name for your stack. Leave the parameters with the default values for now and select Next.

4. At the bottom of the page, acknowledge the required Capabilities and select Create stack.
5. Wait until the status of the stack is CREATE_COMPLETE, this can take a minute or two.
Testing the solution
In this section, you test the serverless scheduler. First, you’ll schedule a job for some time in the near future. Afterwards you will check that the job has been logged in CloudWatch Logs at the time, it was scheduled.
1. In the AWS Management Console, navigate to the DynamoDB service and select the Items sub-menu on the left side, between Tables and PartiQL editor.
2. Select the JobsTable which you created via the CloudFormation Stack; it should be empty for now:

3. Select Create item. Make sure you switch to the JSON editor at the top, and disable View DynamoDB JSON. Now copy this item into the editor:
{
  "pk": "j#2015-03-20T09:45",
  "sk": "2015-03-20T09:46:47.123Z#564ade05-efda-4a2e-a7db-933ad3c89a83",
  "detail": {
    "action": "send-reminder",
    "userId": "16f3a019-e3a5-47ed-8c46-f668347503d1",
    "taskId": "6d2f710d-99d8-49d8-9f52-92a56d0c6b81",
    "params": {
      "can_skip": false,
      "reminder_volume": 0.5
    }
  },
  "detail_type": "job-reminder"
}

This is a sample job definition. You will need to adjust it, to be started a few minutes from now. For this you need to adjust the first 2 attributes, the partition key “pk” and the sort key “sk”. Start with “sk”, this is the UTC timestamp for the due date of the job in ISO 8601 format (YYYY-MM-DDTHH:MM:SS), followed by a separator (“#”) and a unique identifier, to make sure that multiple jobs can have the same due timestamp.
Afterwards adjust “pk”. The “pk” looks like the ISO 8601 timestamp in the “sk” reduced to date and time in hours and minutes. The minutes for the partition key must be an integer multiple of 5. This value represents the grouping of the jobs, so they can be queried quickly and efficiently by the Lambda function. For instance, for me 2021-11-26T13:31:55.000Z is in the future and the corresponding partition would be 2021-11-26T13:30.
Note: your local time zone might not be UTC. You can get the current UTC time on timeanddate.com.
You can find in the following table for every “sk” minute the corresponding “pk” minute:

The corresponding python code would be:
f'{(sk_minutes – sk_minutes % 5):02d}'
4. Now that you defined your event in the near future, you can optionally adjust the content of the “detail” and “detail_type” attributes. These are forwarded to EventBridge as “detail” and “detail-type” and should be used by your workers to understand which task they are supposed to perform. You can find more details on EventBridge event structure in our documentation. After you configured the job correctly, select Create item.
5. It is time to navigate to CloudWatch Log groups and wait for the item to be due and to show up in the debug logs.

For now, the log streams should be empty:

After the item was due, you should see a new log stream with the item “detail” and “detail_type” attributes logged.
If you don’t see a new log stream with the item, check back in your DynamoDB table, if the “sk” is in the UTC time zone and the minutes of the “pk” are a multiple of 5. You can consult the table at the end of step 3, to check for the correct “pk” minutes based on your “sk” minutes.

You might notice that the timestamp of the message is within a minute after the job was scheduled. In my example, I scheduled the job for 2021-11-26T13:31:55.000Z and it was put into EventBridge at 2021-11-26T13:32:33Z. The delay comes from the Lambda function only starting once per minute. As I mentioned in the beginning, the function also isn’t started at second 00 but at a random second within that minute.
Exploring the Lambda function
Now, let’s have a look at the core logic. For this, navigate to AWS Lambda in the AWS Management console and open the SchedulerFunction.

In the function configuration, you can see that it is triggered by EventBridge via a scheduled expression at the rate, which was defined in the CloudFormation Stack.

When you open the Code tab, you can see that it is less than 100 lines of python code. The main part is the lambda_handler function:
def lambda_handler(event, context):
    event_time_in_utc = event['time']
    previous_partition, current_partition = get_partitions(event_time_in_utc)

    previous_jobs = query_jobs(previous_partition, event_time_in_utc)
    current_jobs = query_jobs(current_partition, event_time_in_utc)
    all_jobs = previous_jobs + current_jobs

    print('dispatching {} jobs'.format(len(all_jobs)))

    put_all_jobs_into_event_bridge(all_jobs)
    delete_all_jobs(all_jobs)

    print('dispatched and deleted {} jobs'.format(len(all_jobs)))
The function starts by calculating the current and previous partitions. This is done to ensure that no jobs stay unprocessed in the old partition, when a new one starts. Afterwards, jobs from these partitions are queried up to the current time, so no future jobs will be fetched from the current partition. Lastly, all jobs are put into EventBridge and deleted from the table.
Instead of pushing the jobs into EventBridge, they could be started via HTTP(S), gRPC, or pushed into other AWS services, like Amazon Simple Notification Service (SNS) or Amazon Simple Queue Service (SQS). Also remember that the communication with other AWS services is synchronous and does not use batching options when putting jobs into EventBridge or deleting them from the DynamoDB table. This is to keep the function simpler and easier to understand. When you plan to distribute thousands of jobs per minute, you’d want to adjust this, to improve the throughput of the Lambda function.
Cleaning up
To avoid incurring future charges, delete the CloudFormation Stack and all resources you created.
Conclusion
In this post, you learned how to build a serverless scheduling solution. Using only serverless technologies which scale automatically, don’t require maintenance, and offer a pay as you go pricing model, this scheduler solution can be implemented for use cases with varying throughput requirements for their scheduled jobs. These could range from publishing articles at a scheduled time to notifying hundreds of passengers per minute about their upcoming flight.
You can adjust the Lambda function to distribute the jobs with a technology more fitting to your application, as well as to handle recurring tasks. The grouping interval of 5 minutes for the partition key, can be also adjusted based on your throughput requirements. It’s important to note that for this solution to work, the interval by which the jobs are grouped must be longer than the rate at which the Lambda function is started.
Give it a try and let us know your thoughts in the comments!
Македонският въпрос в контекста на политическите промени в България
Post Syndicated from Александър Нуцов original https://toest.bg/makedonskiyat-vupros-v-konteksta-na-politicheskite-promeni-v-bulgaria/
Българо-македонските отношения в най-новата ни история се развиват в контекста на прехода от комунизъм към демокрация и геополитическото и културно преориентиране на Балканите към евро-атлантическото пространство. Още в началото на 90-те години България и Северна Македония (тогава Република Македония) обявяват курс на присъединяване към ЕС и НАТО като ключова част от стратегическите си програми. Така в тях се зараждат вътрешни процеси на европеизация, които постепенно трансформират различни аспекти от публичния им живот и двустранните отношения.
В международните отношения терминът „европеизация“ описва разнородни, но свързани по същност промени. Част от тях обхващат формалните процеси на адаптация на местните политики, законодателство и правна рамка към тези на Европейския съюз, както и прилагането на установени европейски принципи на управление – от процедури за вземане на решения до цялостна плурализация на политическата система. Други пък засягат промените в идентичността на обществото, сблъсъка между национална и европейска идентичност, (ре)конструкцията на националните и европейските идентичностни маркери, както и честотата, с която властимащи и институции интегрират понятия като „Европейски съюз“ и „европейски ценности“ в политическата си риторика и установените обществени дискурси. В своята цялост вътрешните за България и Северна Македония процеси на европеизация оформят и междусъседските им отношения през последните три десетилетия.
В исторически план България първа в света признава независимостта на югозападната си съседка.
Това става през 1992 г. при правителството на Филип Димитров, което реабилитира българската политика по Македонския въпрос и ѝ дава нов тласък. В следващите години България продължава да демонстрира добронамереното си отношение. Най-отчетливи са случаите, когато страната ни предоставя на Северна Македония достъп до бургаското пристанище заради наложеното ѝ от Гърция търговско ембарго през 1994 г. и оказва военна помощ на македонското правителство при конфликта му с албанските сепаратисти през 2001 г.
Приятелството си обаче двете страни официализират с подписаната от тогавашните премиери Иван Костов и Любчо Георгиевски Съвместна декларация от 22 февруари 1999 г. Като пряк резултат от процеса на европеизация документът поставя фундамента на двустранните отношения, „изхождайки от стремежите на двете страни за интеграция в европейските и евро-атлантически структури“. Подписан в два екземпляра – на „български език, съгласно Конституцията на Република България, и македонски език, съгласно Конституцията на Република Македония“, договорът предлага исторически консенсус по отношение на наболелия езиков спор. Съвместната декларация е препотвърдена с общ меморандум от 22 януари 2008 г., а през 2017-та се превръща в основа на Договора за приятелство, добросъседство и сътрудничество.
Идеята за сключване на широкомащабно двустранно споразумение, което да регулира отношенията между България и Северна Македония, е лансирана много преди 2017 г. До момента на подписването обаче българската политическа линия търпи изменение от безусловна подкрепа за присъединяването на Северна Македония към ЕС до обвързване на евентуално нейно членство с изпълнение на клаузите по договора. Периодът от подписването досега е маркиран от плавна трансформация на политическата риторика. Изначалната еуфория, която намира израз в наситената с оптимизъм двустранната комуникация, се запазва до средата на 2018 г., когато приключва и Българското председателство на Съвета на ЕС. Следва едногодишен период на затишие, в който политическата риторика придобива по-скоро неутрален характер.
Това обаче се променя към средата на 2019 г., а на 9 октомври същата година българското правителство одобрява и приема Рамкова позиция относно разширяването на ЕС. Ден по-късно тя е подкрепена с декларация от парламента, като и двата документа поставят конкретни изисквания към Северна Македония. Сред тях са отказ от идеята за македонско малцинство в България, препотвърждаване на езиковата формула от 1999 г. в нота до ООН, реабилитация на жертвите на югославския комунистически режим и постигане на ясни резултати в установената с Договора за приятелство историческа комисия. Анонсирането на червени линии, последователното втвърдяване на тона, провалените очаквания и българското вето върху преговорната рамка за присъединяване на Северна Македония довеждат до днешната криза в двустранните отношения.
В случая обаче корените на конфликта се крият не в политическите промени в двете страни, а в самия Договор за приятелство, добросъседство и сътрудничество. Защото неяснотата около основни клаузи, асиметричният характер на споразумението и оставените празни пространства за различно тълкуване породиха погрешни представи и очаквания у двете страни.
Най-проблематични се оказаха чл. 2 (2) и чл. 8 (2) от Договора за приятелство. Първият гласи, че двете страни ще си сътрудничат с цел „успешната подготовка на Република Македония за присъединяването ѝ към Европейския съюз и НАТО“, като „българската страна ще споделя своя опит с цел да съдейства на Република Македония да изпълни необходимите критерии за членство в Европейския съюз“. Член 8 (2) пък гарантира създаването на „Съвместна мултидисциплинарна експертна комисия по исторически и образователни въпроси, за да допринесе за обективното, основаващо се на автентични и основани на доказателства исторически извори, научно тълкуване на историческите събития“.
Тези формулировки ясно отразяват асиметричното отношение между Северна Македония като кандидат-членка и България като пълноправна членка на Европейския съюз. От тези властови позиции двете държави изграждат стратегията, целите и очакванията си спрямо споразумението. И докато България се стреми да предизвика решение на идентичностните спорове чрез създаването на историческа комисия, която „обективно“ да отсъди в нейна полза, Северна Македония се уповава на клаузата, която на практика гарантира българската подкрепа за присъединяването ѝ към Съюза.
Тъй като нито едно от двете изисквания не се изпълнява според очакванията на другата страна, България и Северна Македония взаимно се обвиняват в нарушаване на договорните отношения. Двете страни всъщност подписват споразумение, на което придават различен смисъл и значение, тълкувайки понятия като „обективна интерпретация на историята“, „европейски ценности и поведение“ и „европеизация“ по взаимно несъвместим начин. С други думи, Договорът за приятелство е плод не на общо съгласие, акумулирано в рамките на конструктивен преговорен процес, а на предварително конструирани несъвместими цели.
Какви обаче са изгледите за промяна на българската позиция в настоящата ситуация?
Политическите партии предвидливо избягваха темата за Северна Македония по време на кампанията и в предизборните си програми. Това, което знаем от преговорите за коалиционен кабинет, е, че поне две от формациите (БСП и ИТН) на този етап твърдо отказват да дадат зелена светлина за старт на преговорите за присъединяване на Северна Македония към ЕС.
От „Продължаваме промяната“ изразиха сходна позиция и предложиха алтернативен подход, характерен по-скоро за бизнес средите – да изместят фокуса от историческите спорове, като поканят експерти и представители на бизнеса за обсъждане на ползите от сътрудничество в икономическия сектор. Независимо от това формацията около Кирил Петков и Асен Василев все пак обвърза подкрепата си с прилагането на Договора за приятелство. Единствено „Демократична България“ ясно декларира, че никой не печели от факта, че Северна Македония остава извън ЕС, но и дясната коалиция не се ангажира с конкретни предложения за изменение на официалната политика.
С оглед на крехката политическа ситуация и необходимостта от сформиране на постоянно правителство, коалиционните партньори едва ли биха рискували промяна на курса по Македонския въпрос, около който има изграден широк обществен консенсус. Подобен ход не само ще предизвика атаки от опозицията, а допълнително ще делегитимира новата власт след рекордно ниската избирателна активност на последните избори.
Паралелно с това президентът Румен Радев открито заговори за запазване на културно-историческото наследство на България в спора със Северна Македония пред президентите на Германия и Франция – Франк-Валтер Щайнмайер и Еманюел Макрон. По време на консултациите за съставяне на правителство Радев прикани и лидерите на „Продължаваме промяната“ да изложат позициите си „по отношение на разширяването на ЕС, отстояването на правата на българските граждани, на нашата национална идентичност, история и култура“. Така Радев индиректно призова най-голямата парламентарна формация да подходи внимателно към тема, която носи със себе си висок заряд и постоянен риск от ескалация. Съобразно така оформилия се вътрешнополитически контекст, сериозният външнополитически натиск от ЕС и САЩ за бързо разрешаване на спора почти сигурно ще се окаже безплоден.
Достатъчно ли е обаче новата управленска коалиция да продължи да възпроизвежда политиката на старата власт, за да защити българските интереси? Както вече стана ясно, настоящата безизходица произлиза от неясните формулировки в Договора за приятелство и недалновидната и твърде повърхностна политика на предишното управление по отношение на Македонския въпрос, което постави България в състояние на международна изолация и под нарастващ външен натиск.
Македонската дипломация много по-рано прозря, че спорът ще се пренесе на европейско ниво, защото протакането му не кореспондира с геополитическите интереси и политиката по разширяване на ЕС. Дипломацията на югозападната ни съседка умело се възползва от ситуацията и успя да убеди западните лидери и институции в правдивостта на позициите си по отношение на спора с България, докато страната ни проспа четири години в опитите си да изключи ЕС от уравнението за намиране на решение.
Всичко това породи неразбиране у политическите ни партньори и у интелектуалци, историци и медии на Запад защо България блокира процеса на присъединяване на Северна Македония, каква в действителност е нейната позиция и каква е истинската същност на конфликта. Западните политически лидери, медии и историци често принизяват българската позиция до елементарен национализъм, езиков спор, извиване на ръце и архаизъм. Така представена, България си създава международен образ на държава с антиевропейско поведение, която блокира легитимните въжделения на един народ да се превърне в част от европейското семейство.
Въпреки това новото правителство все още може да подобри българските позиции,
като промени досегашния подход, усъвършенства аргументацията си и приложи целенасочена дипломация за изясняване на моралния корен на конфликта. Нужно е да се промени самият разказ и да се наблегне на отговорността към миналото и паметта като всеобща ценност, която да бъде разпозната от Европейския съюз. По този начин България ще превърне изискванията си към Северна Македония от чисто „български“ в „универсални“ и от „държавни“ в „човешки“.
Нека вземем следния пример: ако Гоце Делчев се е самоопределял, живял и загинал като българин, не е ли фалшифицирането на неговите искрени мечти, воля и мисъл морално престъпление най-вече спрямо човека Делчев, а чак след това спрямо държавата България? В този смисъл може ли да допуснем, че всеки човек или държава има право да преиначи смисъла на нашите собствени идеи, дела, мисли и съществуване за собствена изгода зад маската на „обективна историческа интерпретация“? И нима всяка несправедливост към паметта на отделния човек не се отнася към паметта на всеки от нас? Това е моралната, дълбока, общочовешка същност на конфликта, по която Европейският съюз трябва да вземе отношение. Спор, в чийто център стои човекът, а не държавата; несправедливостта, а не национализмът; моралът, а не интересите.
От този ъгъл българската дипломация може да превърне страната от пасивен абсорбатор на европейски ценности и разпореждания в активен партньор, който ги създава и оформя, в пълноправен член с визия за същността на Европейския съюз, който поставя въпроса за мястото на морала, паметта и отговорността към миналото като общочовешки ценности в модерна Европа. Докато ЕС отхвърля национализма като принцип, трудно ще се отрече от общочовешкото, защото самият той е изграден върху универсални ценности. Така пред България ще се отворят нови възможности за аргументация и включване в една рамка на общочовешки ценности вече залегнали в официалния български дискурс теми като кражба на история, език на омразата, правата на северномакедонските граждани с българско самосъзнание и реабилитацията на жертвите на югославския комунистически режим.
Накратко: ако България съумее да конструира спора като универсален, много по-лесно ще трансформира националистическия си образ и ще спечели доверието на европейските лидери и институции. На този етап обаче българският международен образ по отношение на Македонския въпрос остава твърде спорен. А доколко това ще се промени, зависи от волята и умението на новото правителство да води една по-амбициозна външна политика.
Заглавната снимка е от междуправителствена среща през ноември 2017 г., три месеца след подписването на Договора за приятелство, добросъседство и сътрудничество © Правителството на РСМ / Flickr
Security updates for Thursday
Post Syndicated from original https://lwn.net/Articles/878844/rss
Security updates have been issued by Debian (apache-log4j2 and mediawiki), Fedora (libmysofa, libolm, and vim), Oracle (httpd), Red Hat (go-toolset:rhel8), and Ubuntu (apache-log4j2 and mumble).
Cosplay with Steph – Portrait Tutorial
Post Syndicated from Matt Granger original https://www.youtube.com/watch?v=fPHgnP5Gdso
From 0 to 20 billion – How We Built Crawler Hints
Post Syndicated from Matt Boyle original https://blog.cloudflare.com/from-0-to-20-billion-how-we-built-crawler-hints/


In July 2021, as part of Impact Innovation Week, we announced our intention to launch Crawler Hints as a means to reduce the environmental impact of web searches. We spent the weeks following the announcement hard at work, and in October 2021, we announced General Availability for the first iteration of the product. This post explains how we built it, some of the interesting engineering problems we had to solve, and shares some metrics on how it’s going so far.
Before We Begin…
Search indexers crawl sites periodically to check for new content. Algorithms vary by search provider, but are often based on either a regular interval or cadence of past updates, and these crawls are often not aligned with real world content changes. This naive crawling approach may harm customer page rank and also works to the detriment of search engines with respect to their operational costs and environmental impact. To make the Internet greener and more energy efficient, the goal of Crawler Hints is to help search indexers make more informed decisions on when content has changed, saving valuable compute cycles/bandwidth and having a net positive environmental impact.
Cloudflare is in an advantageous position to help inform crawlers of content changes, as we are often the “front line” of the interface between site visitors and the origin server where the content updates take place. This grants us knowledge of some key data points like headers, content hashes, and site purges among others. For customers who have opted in to Crawler Hints, we leverage this data to generate a “content freshness score” using an ensemble of active and passive signals from our customer base and request flow. To help with efficiency, Crawler Hints helps to improve SEO for websites behind Cloudflare, improves relevance for search engine users, and improves origin responsiveness by reducing bot traffic to our customers’ origin servers.
A high level design of the system we built looks as follows:
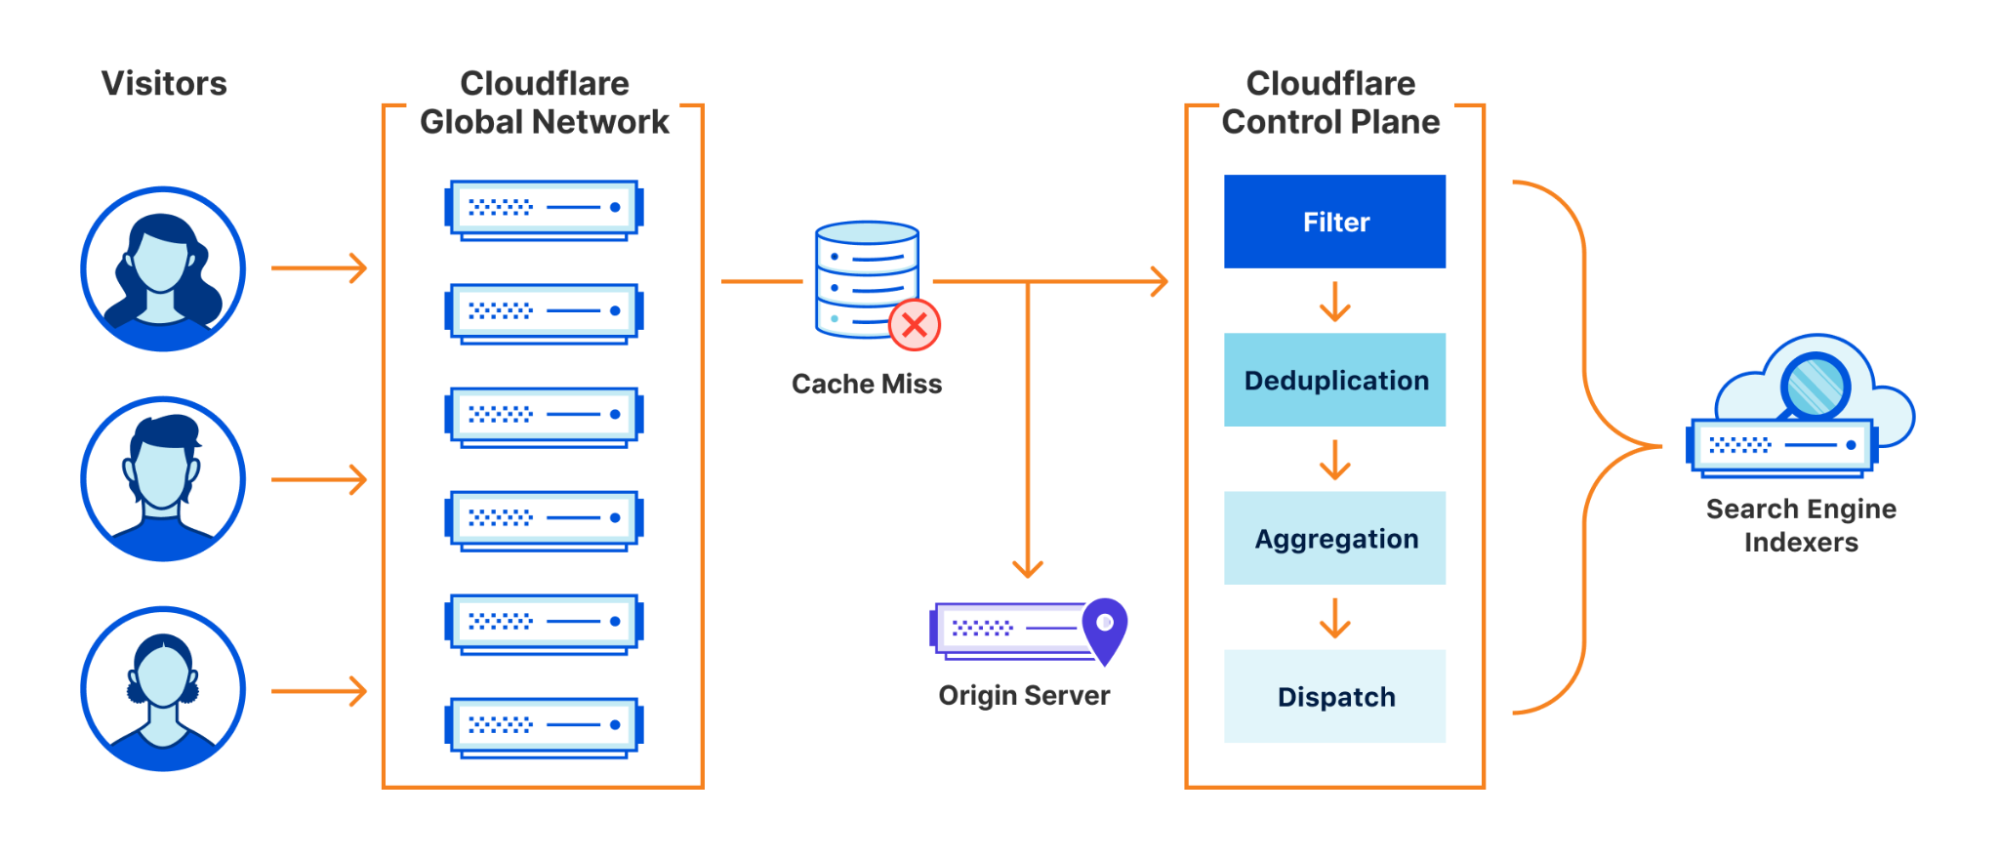
In this blog we will dig into each aspect of it in more detail.
Keeping Things Fresh
Cloudflare has a large global network spanning 250 cities. A popular use case for Cloudflare is to use our CDN product to cache your website’s assets so that users accessing your site can benefit from lightning fast response times. You can read more about how Cloudflare manages our cache here. The important thing to call out for the purpose of this post is that the cache is Data Center local. A cache hit in London might be a cache miss in San Francisco unless you have opted-in to tiered-caching, but that is beyond the scope of this post.
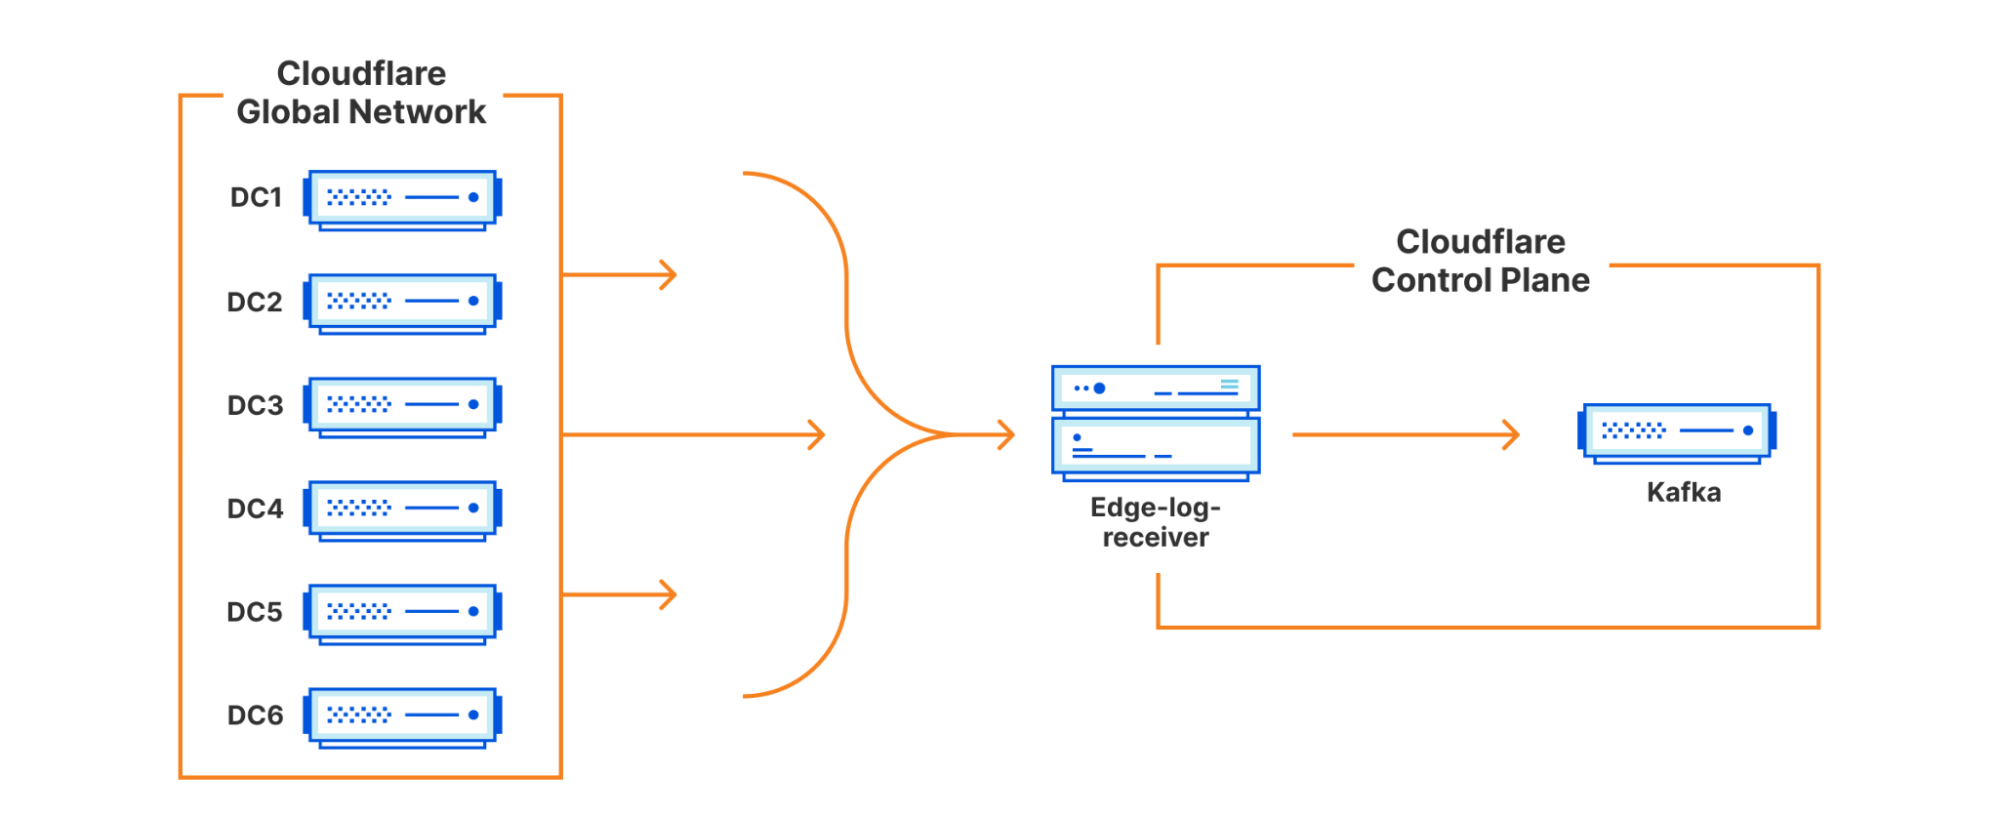
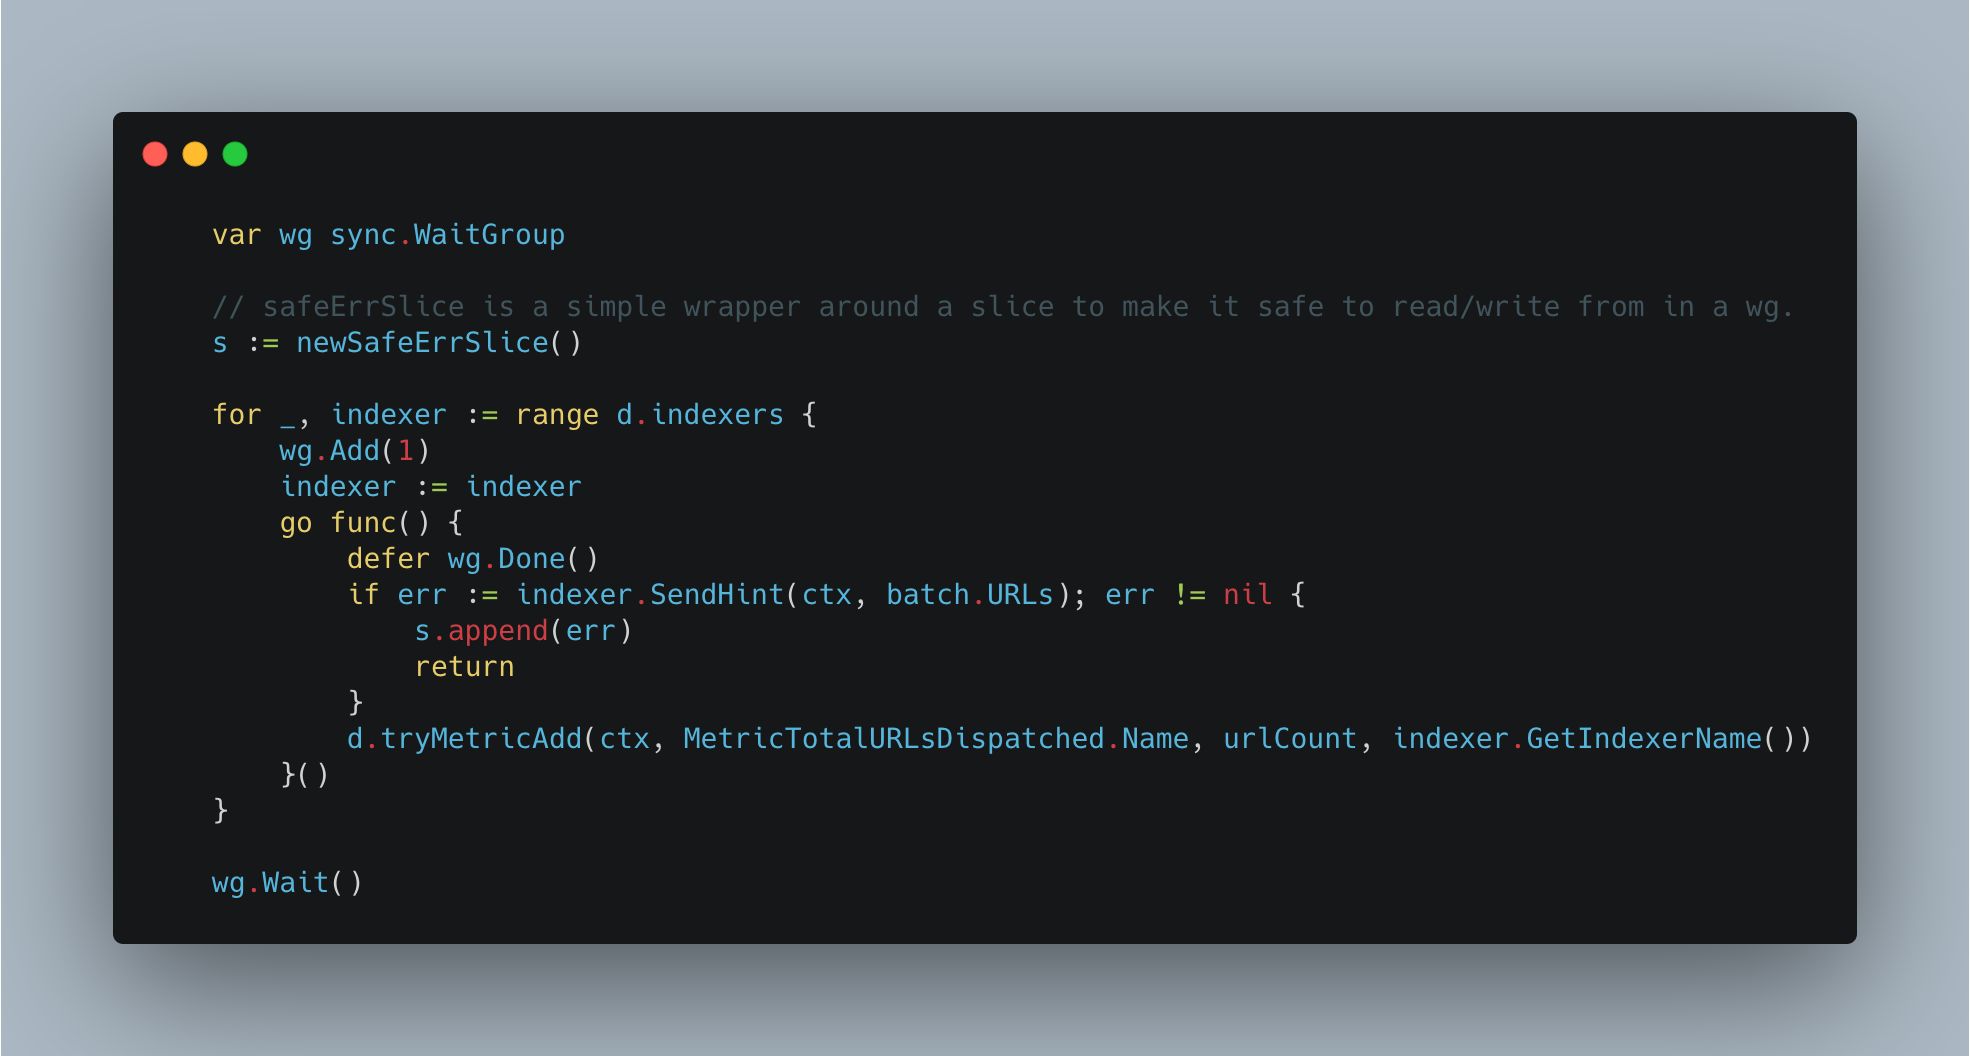
For Crawler Hints to work, we make use of a number of signals available at request time to make an informed decision on the “freshness” of content. For our first iteration of Crawler Hints, we used a cache miss from Cloudflare’s cache as a starting basis. Although a naive signal on its own, getting the data pipelines in place to forward cache miss data from our global network to our control plane meant we would have everything in place to iterate on and improve the signal processing quickly going forward. To do this, we leveraged some existing services from our data team that takes request data , marshalls it into Cap’n Proto format, and forwards it to a message bus (we use apache Kafka). These messages include the URLs of the resources that have met the signal criteria, along with some additional metadata for analytics/future improvement.
The amount of traffic our global network receives is substantial. We serve over 28 million HTTP requests per second on average, with more than 35 million HTTP requests per second at peak. Typically, Cloudflare teams sample this data to enable products such as being alerted when you are under attack. For Crawler Hints, every cache miss is important. Therefore, 100% of all cache misses for opted-in sites were sent for further processing, and we’ll discuss more on opt-in later.
Redis as a Distributed Buffer
With messages buffered in Kafka, we can now begin the work of aggregation and deduplication. We wrote a consumer service that we call an ingestor. The ingestor reads the data from Kafka. The ingestor performs validation to ensure proper sanitization and data integrity and passes this data onto the next stage of the system. We run the ingestor as part of a Kafka consumer group, allowing us to scale our consumer count up to the partition size as throughput increases.
We ultimately want to deliver a set of “fresh” content to our search partners on a dynamic interval. For example, we might want to send a batch of 10,000 URLs every two minutes. There are, however, a couple of important things to call out though:
- There should be no duplicate resources in each batch.
- We should strike a balance in our size and frequency such that overall request size isn’t too large, but big enough to remove some pressure on the receiving API by not sending too many requests at once.
For the deduplication, the simplest thing to do would be to have an in-memory map in our service to track resources between a pre-specified interval. A naive implementation in Go might look something like this.
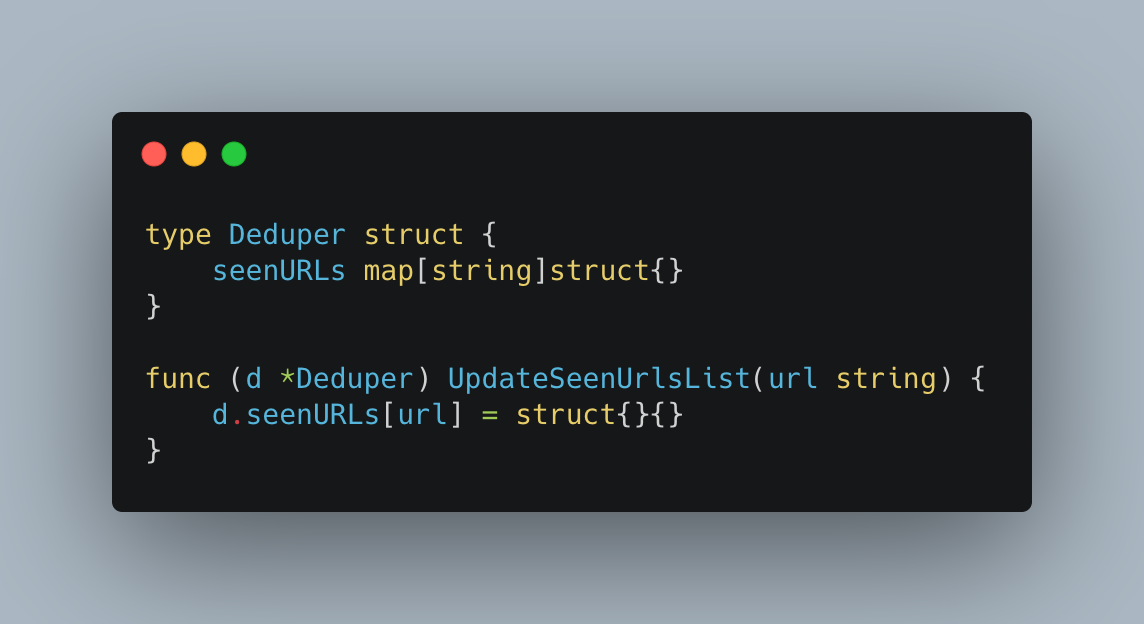
The problem with this approach is we have little resilience. If the service was to crash, we would lose all the data for our current batch. Furthermore, if we were to run multiple instances of our services, they would all have a different “view” of which resources they had seen before and therefore we would not be deduplicating.To mitigate this issue, we decided to use a specialist caching service. There are a number of distributed caches that would fit the bill, but we chose Redis given our team’s familiarity with operating it at scale.
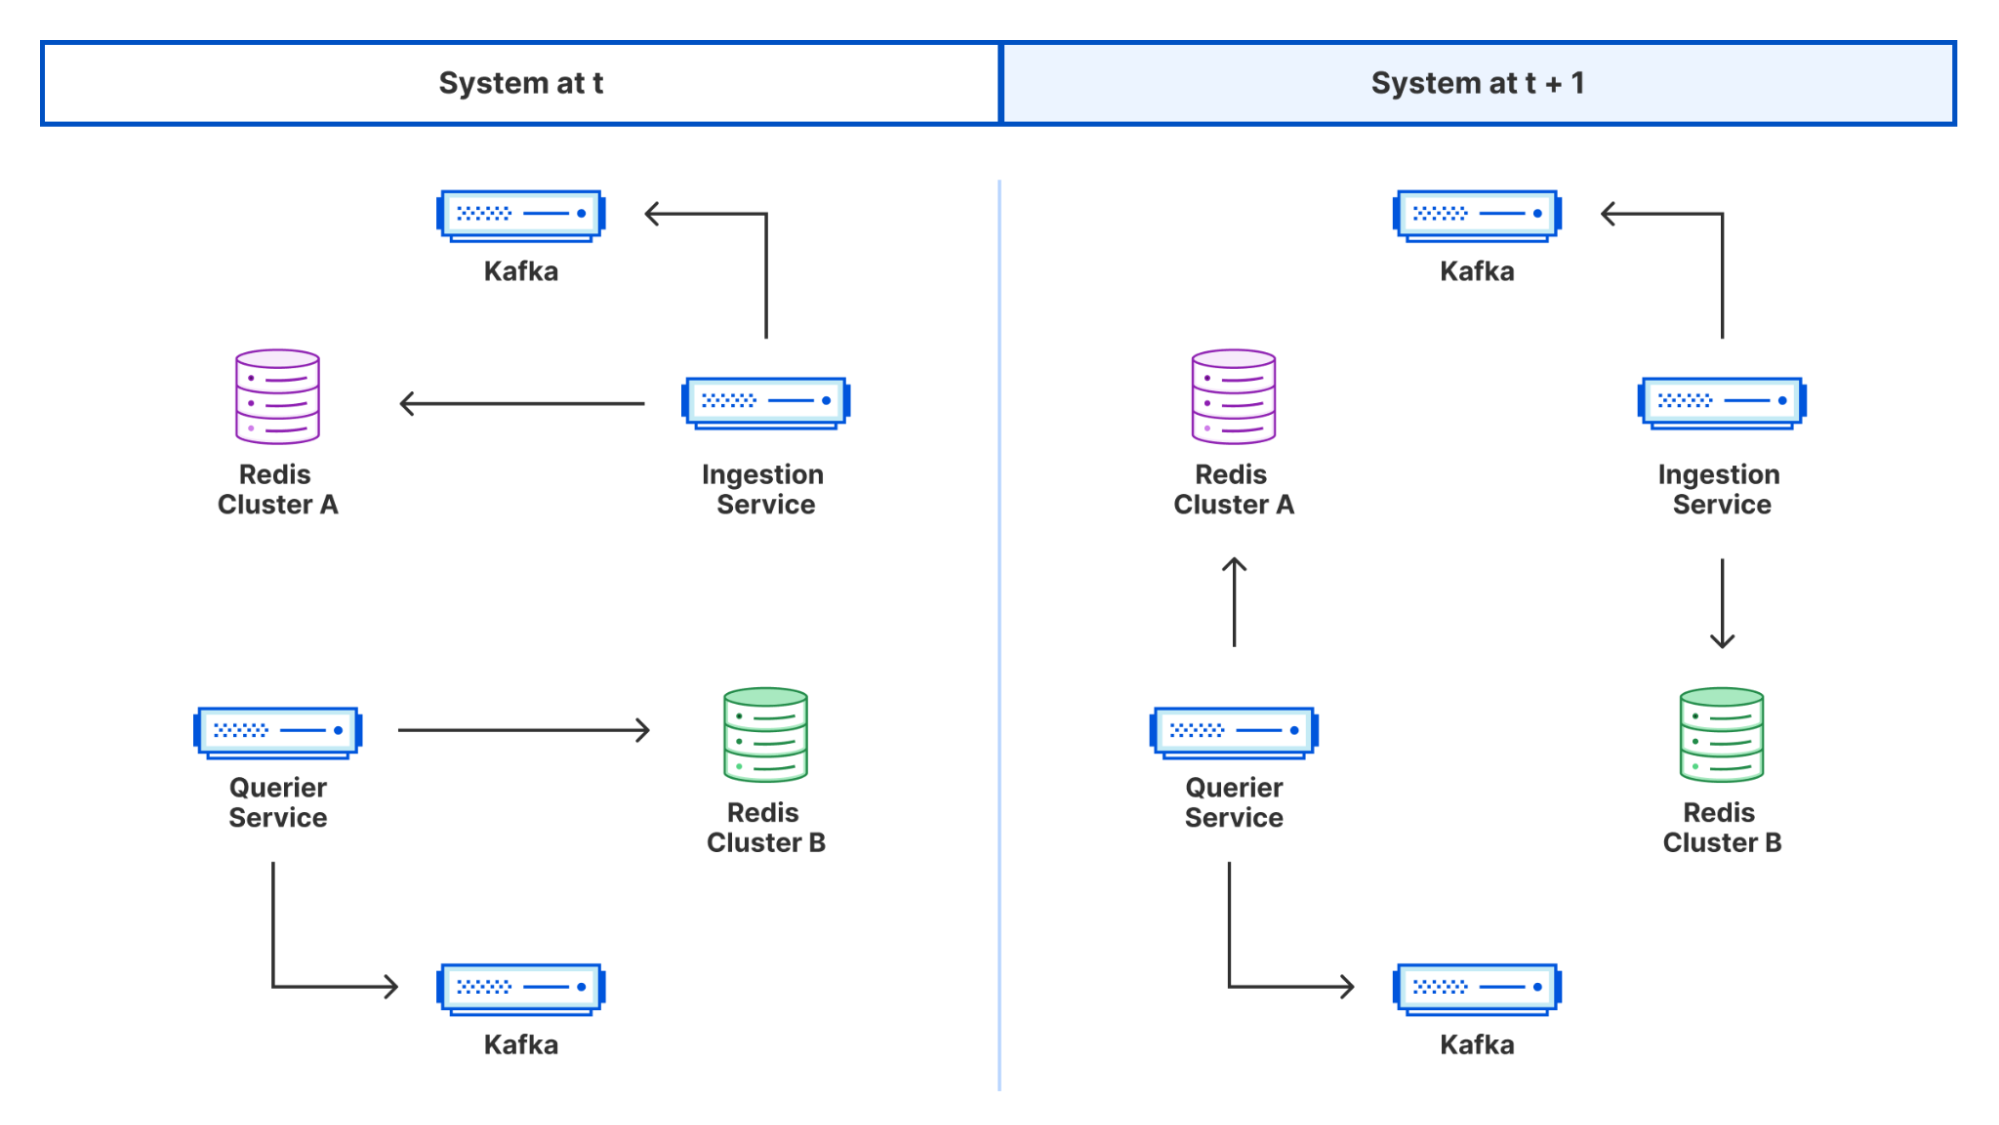
Redis is well known as a Key Value(KV) store often used for caching things,optionally with a specified Time To Live(TTL). Perhaps slightly less obvious is its value as a distributed buffer, housing ephemeral data with periodic flush/tear-downs. For Crawler Hints, we leveraged both these traits via a multi-generational, multi-cluster setup to achieve a highly available rolling aggregation service.
Two standalone Redis clusters were spun up. For each generation of request data, one cluster would be designated as the active primary. The validated records would be inserted as keys on the primary, serving the dual purpose of buffering while also deduplicating since Redis keys are unique. Separately, a downstream service (more on this later!) would periodically issue the command for these inserters to switch from the active primary (cluster A) to the inactive cluster (cluster B). Cluster A could then be flushed with records being batch read in a size of our choosing.
Buffering for Dispatch
At this point, we have clean, batched data. Things are looking good! However, there’s one small hiccup in the plan: we’re reading these batches from Redis at some set interval. What if it takes longer to dispatch than the interval itself? What if the search partner API is having issues?
We need a way to ensure the durability of the batch URLs and reduce the impact of any dispatch issues. To do this, we revisit an old friend from earlier: Kafka. The batches that get read from Redis are then fed into a Kafka topic. We wrote a Kafka consumer that we call the “dispatcher service” which runs within a consumer group to enable us to scale it if necessary just like the ingestor. The dispatcher reads from the Kafka topic and sends a batch of resources to each of our API partners.
Launching in tandem with Cloudflare, Crawler Hints was a joint venture between a few early adopters in the search engine space to provide a means for sites to inform indexers of content changes called IndexNow. You can read more about this launch here. IndexNow is a large part of what makes Crawler Hints possible. As part of its manifest, it provides a common API spec to publish resources that should be re-indexed. The standardized API makes abstracting the communication layer quite simple for the partners that support it. “Pushing” these signals to our search engine partners is a big step away from the inefficient “Pull” based model that is used today (you can read more about that here). We launched with Yandex and Bing as Search Engine Partners.
To ensure we can add more partners in the future, we defined an interface which we call a “Hinter”.
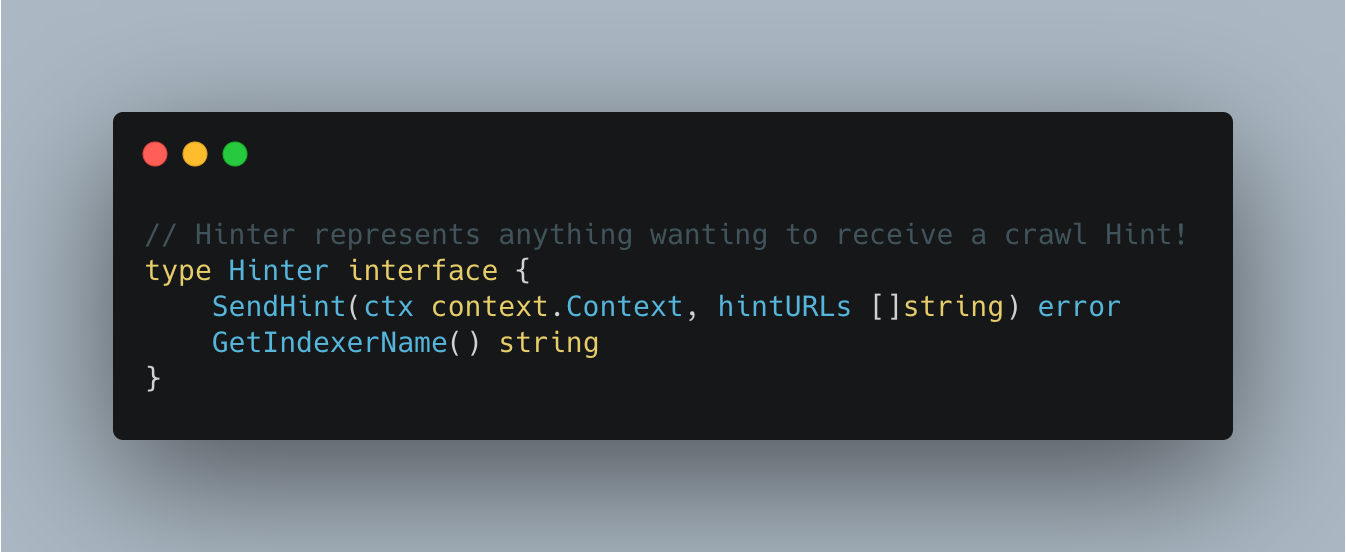
We then satisfy this interface for each partner that we work with. We return a custom error from the Hinter service that is of type *indexers.Error. The definition of which is:
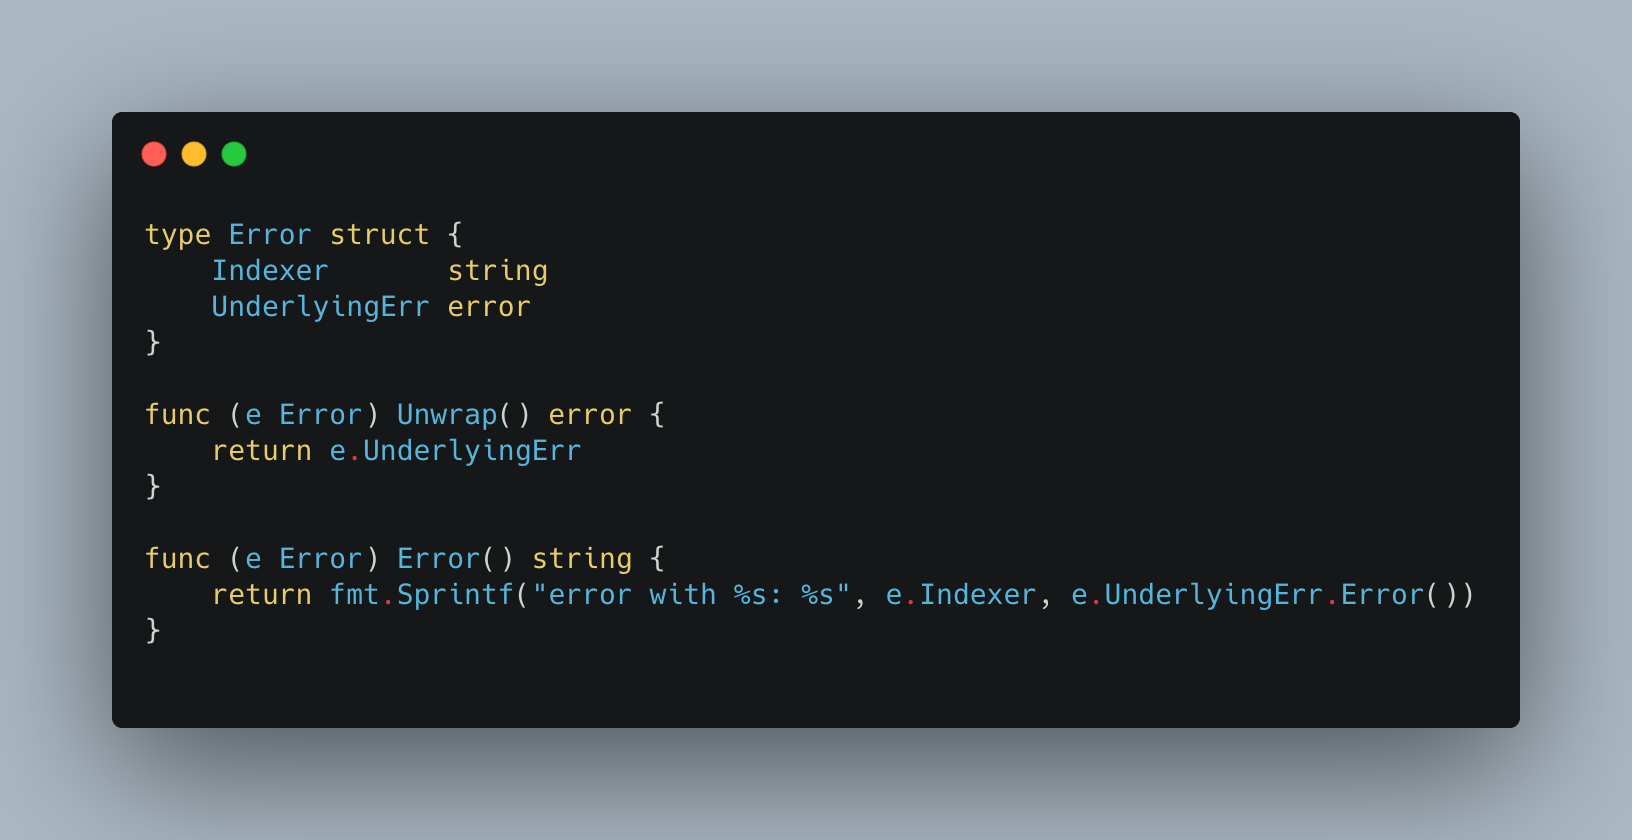
This allows us to “bubble up” information about which indexer has failed and increment metrics and retry only those calls to indexers which have failed.
This all culminates together with the following in our service layer:
Simple, performant, maintainable, AND easy to add more partners in the future.
Rolling out Crawler Hints
At Cloudflare, we often release things that haven’t been done before at scale. This project is a great example of that. Trying to gauge how many users would be interested in this product and what the uptake might be like on day one, day ten, and day one thousand is close to impossible. As engineers responsible for running this system, it is essential we build in checks and balances so that the system does not become overwhelmed and responds appropriately. For this particular project, there are three different types of “protection” we put in place. These are:
- Customer opt-in
- Monitoring & Alerts
- System resilience via “self-healing”
Customer opt-in
Cloudflare takes any changes that can impact customer traffic flow seriously. Considering Crawler Hints has the potential to change how sites are seen externally (even if in this instance the site’s viewers are robots!) and can impact things like SEO and bandwidth usage, asking customers to opt-in is a sensible default. By asking customers to opt-in to the service, we can start to get an understanding of our system’s capacity and look for bottle necks and how to remove them. To do this, we make extensive use of Prometheus, Grafana, and Kibana.
Monitoring & Alerting
We do our best to make our systems as “self-healing” and easy to run as possible, but as they say, “By failing to prepare, you are preparing to fail.” We therefore invest a lot of time creating ways to track the health and performance of our system and creating automated alerts when things fall outside of expected bounds.
Below is a small sample of the Grafana dashboard we created for this project. As you can see, we can track customer enablement and the rate of hint dispatch in real time. The bottom two panels show the throughput of our Kafka clusters by partition. Even just these four metrics give us a lot of insight into how things are going, but we also track (as well as other things):
- Lag on Kafka by partition (how far behind real time we are)
- Bad messages received from Kafka
- Amount of URLs processed per “run”
- Response code per index partner over time
- Response time of partner API over time
- Health of the Redis clusters (how much memory is used, frequency of commands we are using received by the cluster)
- Memory, CPU usage, and pods available against configured limits/requests

It seems a lot to track, but this information is invaluable to us, and we use it to generate alerts that notify the on-call engineer if a threshold is breached. For example, we have an alert that would escalate to an engineer if our Redis cluster approached 80% capacity. For some thresholds we specify, we may want the system to “self-heal.” In this instance, we would want an engineer to investigate as this is outside the bounds of “normal,” and it might be that something is not working as expected. An alternative reason that we might receive alerts is that our product has increased in popularity beyond our expectations, and we simply need to increase the memory limit. This requires context and is therefore best left to a human to make this decision.
System Resilience via “self-healing”
We do everything we can to not disturb on-call engineers, and therefore, we try to make the system as “self-healing” as possible. We also don’t want to have too much extra resource running as it can be expensive and use limited capacity that another Cloudflare service might need more – it’s a trade off. To do this, we make use of a few patterns and tools common in every distributed engineer’s toolbelt. Firstly, we deploy on Kubernetes. This enables us to make use of great features like Horizontal Pod Autoscaling. When any of our pods reach ~80% memory usage, a new pod is created which will pick up some of the slack up to a predefined limit.
Secondly, by using a message bus, we get a lot of control over the amount of “work” our services have to do in a given time frame. In general, a message bus is “pull” based. If we want more work, we ask for it. If we want less work, we pull less. This holds for the most part, but with a system where being close to real time is important, it is essential that we monitor the “lag” of the topic, or how far we are behind real time. If we are too far behind, we may want to introduce more partitions or consumers.
Finally, networks fail. We therefore add retry policies to all HTTP calls we make before reporting them a failure. For example, if we were to receive a 500 (Internal Server Error) from one of our partner APIs, we would retry up to five times using an exponential backoff strategy before reporting a failure.
Data from the first couple of months
Since the release of Crawler Hints on October 18, 2021 until December 15, 2021, Crawler Hints has processed over twenty five billion crawl signals, has been opted-in to by more than 81,000 customers, and has handled roughly 18,000 requests per second. It’s been an exciting project to be a part of, and we are just getting started.
What’s Next?
We will continue to work with our partners to improve the standard even further and continue to improve the signaling on our side to ensure the most valuable information is being pushed on behalf of our customers in a timely manner.
If you’re interested in building scalable services and solving interesting technical problems, we are hiring engineers on our team in Austin, Lisbon, and London.
Handy Tips #16: Automating Zabbix host deployment with autoregistration
Post Syndicated from Arturs Lontons original https://blog.zabbix.com/handy-tips-16-automating-zabbix-host-deployment-with-autoregistration/18232/
[$] LWN.net Weekly Edition for December 16, 2021
Post Syndicated from original https://lwn.net/Articles/878143/rss
The LWN.net Weekly Edition for December 16, 2021 is available.
[$] Wrangling the typing PEPs
Post Syndicated from original https://lwn.net/Articles/878675/rss
When last we looked in on the great typing PEP
debate for Python, back in August, two PEPs were still being
discussed as alternatives for handling annotations in the language.
The steering council was considering the issue after deferring on a
decision for the Python 3.10 release, but the question has been
deferred again for Python 3.11. More study is needed and the council
is looking for help from the Python community to guide its
decision. In the meantime, though, discussion about the deferral has led
to the understanding that annotations are not a general-purpose feature,
but are only meant for typing information. In addition, there is a growing
realization that typing information is effectively becoming mandatory
for Python libraries.
A Year-End Letter from our Executive Director
Post Syndicated from Let's Encrypt original https://letsencrypt.org/2021/12/16/ed-letter-2021.html
This letter was originally published in our 2021 annual report.
We can do a lot to improve security and privacy on the Internet by taking existing ideas and applying them in ways that benefit the general public at scale. Our work certainly does involve some research, as our name implies, but the success that we’ve had in pursuing our mission largely comes from our ability to go from ideas to implementations that improve the lives of billions of people around the world.
Our first major project, Let’s Encrypt, now helps to protect more than 260 million websites by offering free and fully automated TLS certificate issuance and management. Since it launched in 2015, encrypted page loads have gone from under 40% to 92% in the U.S. and 83% globally.
We didn’t invent certificate authorities. We didn’t invent automated issuance and management. We refined those ideas and applied them in ways that benefit the general public at scale.
We launched our Prossimo project in late 2020. Our hope is that this project will greatly improve security and privacy on the Internet by making memory safety vulnerabilities in the Internet’s most critical a thing of the past. We’re bringing a healthy dose of ambition to the table and we’re backing it up with effective strategies and strong partnerships.
Again, we didn’t invent any memory safe languages or techniques, and we certainly didn’t invent memory safety itself. We’re simply taking existing ideas and applying them in ways that benefit the general public at scale. We’re getting the work done.
With our latest project, Divvi Up for Privacy Preserving Metrics (PPM), the core ideas are a bit newer than the ideas behind our other projects, but we didn’t invent them either. Over the past decade or so some bright people have come up with a way to resolve the tension between wanting to collect metrics about populations and needing to collect data about individuals.
We believe those ideas have matured enough that it’s time to deploy them to the public’s benefit. We started by building and deploying a PPM service for Covid-19 Exposure Notification applications in late 2020, in partnership with Apple, Google, the Bill & Melinda Gates Foundation and the Linux Foundation. We’re expanding that service so any application can collect metrics in a privacy-preserving way.
Being ready to bring ideas to life means a few different things.
We need to have an excellent engineering team that knows how to build services at scale. It’s not enough to just build something that works – the quality and reliability of our work needs to inspire confidence. People need to be able to rely on us.
We also need to have the experience, perspective, and capacity to effectively consider ideas. We are not an organization that “throws things at the wall to see what sticks.” Between our staff, our board of directors, our partners, and our community, we’re able to do a great job evaluating opportunities to understand technical feasibility, potential impact, and alignment with our public benefit mission—to reduce financial, technological, and educational barriers to secure communication over the Internet.
Administrative and communications capabilities are essential. From fundraising and accounting to legal and social media, our administrative teams exist in order to support and amplify the critical work that we do. We’re proud to run a financially efficient organization that provides services for billions of people on only a few million dollars each year.
Finally, it means having the financial resources we need to function. As a nonprofit, 100% of our funding comes from charitable contributions from people like you and organizations around the world. But global impact doesn’t necessarily require million dollar checks: since 2015 tens of thousands of people have given to our work. They’ve made a case for corporate sponsorship, given through their DAFs, or set up recurring donations, sometimes to give $3 a month. That’s all added up to $17M that we’ve used to change the Internet for nearly everyone using it. I hope you’ll join these people and support us financially if you can.
Using AWS security services to protect against, detect, and respond to the Log4j vulnerability
Post Syndicated from Marshall Jones original https://aws.amazon.com/blogs/security/using-aws-security-services-to-protect-against-detect-and-respond-to-the-log4j-vulnerability/
January 7, 2022: The blog post has been updated to include using Network ACL rules to block potential log4j-related outbound traffic.
January 4, 2022: The blog post has been updated to suggest using WAF rules when correct HTTP Host Header FQDN value is not provided in the request.
December 31, 2021: We made a minor update to the second paragraph in the Amazon Route 53 Resolver DNS Firewall section.
December 29, 2021: A paragraph under the Detect section has been added to provide guidance on validating if log4j exists in an environment.
December 23, 2021: The GuardDuty section has been updated to describe new threat labels added to specific finding to give log4j context.
December 21, 2021: The post includes more info about Route 53 Resolver DNS query logging.
December 20, 2021: The post has been updated to include Amazon Route 53 Resolver DNS Firewall info.
December 17, 2021: The post has been updated to include using Athena to query VPC flow logs.
December 16, 2021: The Respond section of the post has been updated to include IMDSv2 and container mitigation info.
This blog post was first published on December 15, 2021.
Overview
In this post we will provide guidance to help customers who are responding to the recently disclosed log4j vulnerability. This covers what you can do to limit the risk of the vulnerability, how you can try to identify if you are susceptible to the issue, and then what you can do to update your infrastructure with the appropriate patches.
The log4j vulnerability (CVE-2021-44228, CVE-2021-45046) is a critical vulnerability (CVSS 3.1 base score of 10.0) in the ubiquitous logging platform Apache Log4j. This vulnerability allows an attacker to perform a remote code execution on the vulnerable platform. Version 2 of log4j, between versions 2.0-beta-9 and 2.15.0, is affected.
The vulnerability uses the Java Naming and Directory Interface (JNDI) which is used by a Java program to find data, typically through a directory, commonly a LDAP directory in the case of this vulnerability.
Figure 1, below, highlights the log4j JNDI attack flow.

Figure 1. Log4j attack progression. Source: GovCERT.ch, the Computer Emergency Response Team (GovCERT) of the Swiss government
As an immediate response, follow this blog and use the tool designed to hotpatch a running JVM using any log4j 2.0+. Steve Schmidt, Chief Information Security Officer for AWS, also discussed this hotpatch.
Protect
You can use multiple AWS services to help limit your risk/exposure from the log4j vulnerability. You can build a layered control approach, and/or pick and choose the controls identified below to help limit your exposure.
AWS WAF
Use AWS Web Application Firewall, following AWS Managed Rules for AWS WAF, to help protect your Amazon CloudFront distribution, Amazon API Gateway REST API, Application Load Balancer, or AWS AppSync GraphQL API resources.
- AWSManagedRulesKnownBadInputsRuleSet esp. the Log4JRCE rule which helps inspects the request for the presence of the Log4j vulnerability. Example patterns include ${jndi:ldap://example.com/}.
- AWSManagedRulesAnonymousIpList esp. the AnonymousIPList rule which helps inspect IP addresses of sources known to anonymize client information.
- AWSManagedRulesCommonRuleSet, esp. the SizeRestrictions_BODY rule to verify that the request body size is at most 8 KB (8,192 bytes).
You should also consider implementing WAF rules that deny access, if the correct HTTP Host Header FQDN value is not provided in the request. This can help reduce the likelihood of scanners that are scanning the internet IP address space from reaching your resources protected by WAF via a request with an incorrect Host Header, like an IP address instead of an FQDN. It’s also possible to use custom Application Load Balancer listener rules to achieve this.
If you’re using AWS WAF Classic, you will need to migrate to AWS WAF or create custom regex match conditions.
Have multiple accounts? Follow these instructions to use AWS Firewall Manager to deploy AWS WAF rules centrally across your AWS organization.
Amazon Route 53 Resolver DNS Firewall
You can use Route 53 Resolver DNS Firewall, following AWS Managed Domain Lists, to help proactively protect resources with outbound public DNS resolution. We recommend associating Route 53 Resolver DNS Firewall with a rule configured to block domains on the AWSManagedDomainsMalwareDomainList, which has been updated in all supported AWS regions with domains identified as hosting malware used in conjunction with the log4j vulnerability. AWS will continue to deliver domain updates for Route 53 Resolver DNS Firewall through this list.
Also, you should consider blocking outbound port 53 to prevent the use of external untrusted DNS servers. This helps force all DNS queries through DNS Firewall and ensures DNS traffic is visible for GuardDuty inspection. Using DNS Firewall to block DNS resolution of certain country code top-level domains (ccTLD) that your VPC resources have no legitimate reason to connect out to, may also help. Examples of ccTLDs you may want to block may be included in the known log4j callback domains IOCs.
We also recommend that you enable DNS query logging, which allows you to identify and audit potentially impacted resources within your VPC, by inspecting the DNS logs for the presence of blocked outbound queries due to the log4j vulnerability, or to other known malicious destinations. DNS query logging is also useful in helping identify EC2 instances vulnerable to log4j that are responding to active log4j scans, which may be originating from malicious actors or from legitimate security researchers. In either case, instances responding to these scans potentially have the log4j vulnerability and should be addressed. GreyNoise is monitoring for log4j scans and sharing the callback domains here. Some notable domains customers may want to examine log activity for, but not necessarily block, are: *interact.sh, *leakix.net, *canarytokens.com, *dnslog.cn, *.dnsbin.net, and *cyberwar.nl. It is very likely that instances resolving these domains are vulnerable to log4j.
AWS Network Firewall
Customers can use Suricata-compatible IDS/IPS rules in AWS Network Firewall to deploy network-based detection and protection. While Suricata doesn’t have a protocol detector for LDAP, it is possible to detect these LDAP calls with Suricata. Open-source Suricata rules addressing Log4j are available from corelight, NCC Group, from ET Labs, and from CrowdStrike. These rules can help identify scanning, as well as post exploitation of the log4j vulnerability. Because there is a large amount of benign scanning happening now, we recommend customers focus their time first on potential post-exploitation activities, such as outbound LDAP traffic from their VPC to untrusted internet destinations.
We also recommend customers consider implementing outbound port/protocol enforcement rules that monitor or prevent instances of protocols like LDAP from using non-standard LDAP ports such as 53, 80, 123, and 443. Monitoring or preventing usage of port 1389 outbound may be particularly helpful in identifying systems that have been triggered by internet scanners to make command and control calls outbound. We also recommend that systems without a legitimate business need to initiate network calls out to the internet not be given that ability by default. Outbound network traffic filtering and monitoring is not only very helpful with log4j, but with identifying other classes of vulnerabilities too.
Network Access Control Lists
Customers may be able to use Network Access Control List rules (NACLs) to block some of the known log4j-related outbound ports to help limit further compromise of successfully exploited systems. We recommend customers consider blocking ports 1389, 1388, 1234, 12344, 9999, 8085, 1343 outbound. As NACLs block traffic at the subnet level, careful consideration should be given to ensure any new rules do not block legitimate communications using these outbound ports across internal subnets. Blocking ports 389 and 88 outbound can also be helpful in mitigating log4j, but those ports are commonly used for legitimate applications, especially in a Windows Active Directory environment. See the VPC flow logs section below to get details on how you can validate any ports being considered.
Use IMDSv2
Through the early days of the log4j vulnerability researchers have noted that, once a host has been compromised with the initial JDNI vulnerability, attackers sometimes try to harvest credentials from the host and send those out via some mechanism such as LDAP, HTTP, or DNS lookups. We recommend customers use IAM roles instead of long-term access keys, and not store sensitive information such as credentials in environment variables. Customers can also leverage AWS Secrets Manager to store and automatically rotate database credentials instead of storing long-term database credentials in a host’s environment variables. See prescriptive guidance here and here on how to implement Secrets Manager in your environment.
To help guard against such attacks in AWS when EC2 Roles may be in use — and to help keep all IMDS data private for that matter — customers should consider requiring the use of Instance MetaData Service version 2 (IMDSv2). Since IMDSv2 is enabled by default, you can require its use by disabling IMDSv1 (which is also enabled by default). With IMDSv2, requests are protected by an initial interaction in which the calling process must first obtain a session token with an HTTP PUT, and subsequent requests must contain the token in an HTTP header. This makes it much more difficult for attackers to harvest credentials or any other data from the IMDS. For more information about using IMDSv2, please refer to this blog and documentation. While all recent AWS SDKs and tools support IMDSv2, as with any potentially non-backwards compatible change, test this change on representative systems before deploying it broadly.
Detect
This post has covered how to potentially limit the ability to exploit this vulnerability. Next, we’ll shift our focus to which AWS services can help to detect whether this vulnerability exists in your environment.

Figure 2. Log4j finding in the Inspector console
Amazon Inspector
As shown in Figure 2, the Amazon Inspector team has created coverage for identifying the existence of this vulnerability in your Amazon EC2 instances and Amazon Elastic Container Registry Images (Amazon ECR). With the new Amazon Inspector, scanning is automated and continual. Continual scanning is driven by events such as new software packages, new instances, and new common vulnerability and exposure (CVEs) being published.
For example, once the Inspector team added support for the log4j vulnerability (CVE-2021-44228 & CVE-2021-45046), Inspector immediately began looking for this vulnerability for all supported AWS Systems Manager managed instances where Log4j was installed via OS package managers and where this package was present in Maven-compatible Amazon ECR container images. If this vulnerability is present, findings will begin appearing without any manual action. If you are using Inspector Classic, you will need to ensure you are running an assessment against all of your Amazon EC2 instances. You can follow this documentation to ensure you are creating an assessment target for all of your Amazon EC2 instances. Here are further details on container scanning updates in Amazon ECR private registries.
GuardDuty
In addition to finding the presence of this vulnerability through Inspector, the Amazon GuardDuty team has also begun adding indicators of compromise associated with exploiting the Log4j vulnerability, and will continue to do so. GuardDuty will monitor for attempts to reach known-bad IP addresses or DNS entries, and can also find post-exploit activity through anomaly-based behavioral findings. For example, if an Amazon EC2 instance starts communicating on unusual ports, GuardDuty would detect this activity and create the finding Behavior:EC2/NetworkPortUnusual. This activity is not limited to the NetworkPortUnusual finding, though. GuardDuty has a number of different findings associated with post exploit activity, such as credential compromise, that might be seen in response to a compromised AWS resource. For a list of GuardDuty findings, please refer to this GuardDuty documentation.
To further help you identify and prioritize issues related to CVE-2021-44228 and CVE-2021-45046, the GuardDuty team has added threat labels to the finding detail for the following finding types:
Backdoor:EC2/C&CActivity.B
If the IP queried is Log4j-related, then fields of the associated finding will include the following values:
- service.additionalInfo.threatListName = Amazon
- service.additionalInfo.threatName = Log4j Related
Backdoor:EC2/C&CActivity.B!DNS
If the domain name queried is Log4j-related, then the fields of the associated finding will include the following values:
- service.additionalInfo.threatListName = Amazon
- service.additionalInfo.threatName = Log4j Related
Behavior:EC2/NetworkPortUnusual
If the EC2 instance communicated on port 389 or port 1389, then the associated finding severity will be modified to High, and the finding fields will include the following value:
- service.additionalInfo.context = Possible Log4j callback

Figure 3. GuardDuty finding with log4j threat labels
Security Hub
Many customers today also use AWS Security Hub with Inspector and GuardDuty to aggregate alerts and enable automatic remediation and response. In the short term, we recommend that you use Security Hub to set up alerting through AWS Chatbot, Amazon Simple Notification Service, or a ticketing system for visibility when Inspector finds this vulnerability in your environment. In the long term, we recommend you use Security Hub to enable automatic remediation and response for security alerts when appropriate. Here are ideas on how to setup automatic remediation and response with Security Hub.
VPC flow logs
Customers can use Athena or CloudWatch Logs Insights queries against their VPC flow logs to help identify VPC resources associated with log4j post exploitation outbound network activity. Version 5 of VPC flow logs is particularly useful, because it includes the “flow-direction” field. We recommend customers start by paying special attention to outbound network calls using destination port 1389 since outbound usage of that port is less common in legitimate applications. Customers should also investigate outbound network calls using destination ports 1388, 1234, 12344, 9999, 8085, 1343, 389, and 88 to untrusted internet destination IP addresses. Free-tier IP reputation services, such as VirusTotal, GreyNoise, NOC.org, and ipinfo.io, can provide helpful insights related to public IP addresses found in the logged activity.
Note: If you have a Microsoft Active Directory environment in the captured VPC flow logs being queried, you might see false positives due to its use of port 389.
Validation with open-source tools
With the evolving nature of the different log4j vulnerabilities, it’s important to validate that upgrades, patches, and mitigations in your environment are indeed working to mitigate potential exploitation of the log4j vulnerability. You can use open-source tools, such as aws_public_ips, to get a list of all your current public IP addresses for an AWS Account, and then actively scan those IPs with log4j-scan using a DNS Canary Token to get notification of which systems still have the log4j vulnerability and can be exploited. We recommend that you run this scan periodically over the next few weeks to validate that any mitigations are still in place, and no new systems are vulnerable to the log4j issue.
Respond
The first two sections have discussed ways to help prevent potential exploitation attempts, and how to detect the presence of the vulnerability and potential exploitation attempts. In this section, we will focus on steps that you can take to mitigate this vulnerability. As we noted in the overview, the immediate response recommended is to follow this blog and use the tool designed to hotpatch a running JVM using any log4j 2.0+. Steve Schmidt, Chief Information Security Officer for AWS, also discussed this hotpatch.

Figure 4. Systems Manager Patch Manager patch baseline approving critical patches immediately
AWS Patch Manager
If you use AWS Systems Manager Patch Manager, and you have critical patches set to install immediately in your patch baseline, your EC2 instances will already have the patch. It is important to note that you’re not done at this point. Next, you will need to update the class path wherever the library is used in your application code, to ensure you are using the most up-to-date version. You can use AWS Patch Manager to patch managed nodes in a hybrid environment. See here for further implementation details.
Container mitigation
To install the hotpatch noted in the overview onto EKS cluster worker nodes AWS has developed an RPM that performs a JVM-level hotpatch which disables JNDI lookups from the log4j2 library. The Apache Log4j2 node agent is an open-source project built by the Kubernetes team at AWS. To learn more about how to install this node agent, please visit the this Github page.
Once identified, ECR container images will need to be updated to use the patched log4j version. Downstream, you will need to ensure that any containers built with a vulnerable ECR container image are updated to use the new image as soon as possible. This can vary depending on the service you are using to deploy these images. For example, if you are using Amazon Elastic Container Service (Amazon ECS), you might want to update the service to force a new deployment, which will pull down the image using the new log4j version. Check the documentation that supports the method you use to deploy containers.
If you’re running Java-based applications on Windows containers, follow Microsoft’s guidance here.
We recommend you vend new application credentials and revoke existing credentials immediately after patching.
Mitigation strategies if you can’t upgrade
In case you either can’t upgrade to a patched version, which disables access to JDNI by default, or if you are still determining your strategy for how you are going to patch your environment, you can mitigate this vulnerability by changing your log4j configuration. To implement this mitigation in releases >=2.10, you will need to remove the JndiLookup class from the classpath: zip -q -d log4j-core-*.jar org/apache/logging/log4j/core/lookup/JndiLookup.class.
For a more comprehensive list about mitigation steps for specific versions, refer to the Apache website.
Conclusion
In this blog post, we outlined key AWS security services that enable you to adopt a layered approach to help protect against, detect, and respond to your risk from the log4j vulnerability. We urge you to continue to monitor our security bulletins; we will continue updating our bulletins with our remediation efforts for our side of the shared-responsibility model.
Given the criticality of this vulnerability, we urge you to pay close attention to the vulnerability, and appropriately prioritize implementing the controls highlighted in this blog.
If you have feedback about this post, submit comments in the Comments section below.
Want more AWS Security news? Follow us on Twitter.
The Everyperson’s Guide to Log4Shell (CVE-2021-44228)
Post Syndicated from boB Rudis original https://blog.rapid7.com/2021/12/15/the-everypersons-guide-to-log4shell-cve-2021-44228/

If you work in security, the chances are that you have spent the last several days urgently responding to the Log4Shell vulnerability (CVE-2021-44228), investigating where you have instances of Log4j in your environment, and questioning your vendors about their response. You have likely already read up on the implications and steps that need to be taken. This blog is for everyone else who wants to understand what’s going on and why the internet seems to be on fire again. And for you security professionals, we’ve also included some questions on the broader implications and long term view. You know, for all that spare time you have right now.
What is Log4Shell?
Log4Shell — also known as CVE-2021-44228 — is a critical vulnerability that enables remote code execution in systems using the Apache Foundation’s Log4j, which is an open-source Java library that is extensively used in commercial and open-source software products and utilities. For a more in-depth technical assessment of Log4Shell check out Rapid7’s AttackerKB analysis.
What is Log4j?
Log4j is one of the most common tools for sending text to be stored in log files and/or databases. It is used in millions of applications and websites in every organization all across the internet. For example, information is sent to keep track of website visitors, note when warnings or errors occur in processing, and help support teams’ triage problems.
Get answers to your Log4Shell questions from our experts
So what’s the problem?
It turns out that Log4j doesn’t just log plain strings. Text strings that are formatted a certain way will be executed just like a line from a computer program. The problem is that this allows malicious actors to manipulate computers all over the internet into taking actions without the computer owners’ wishes or permission. Cyberattacks can use this to steal information, force actions, or extort the computer owners or operators.
This vulnerability is what we’re referring to as Log4Shell, or CVE-2021-44228. Log4j is the vulnerable technology. As this is a highly evolving situation, you can always head over to our main live blog on Log4Shell.
Is it really that big of a deal?
In a word, yes.
Caitlin Kiska, an information security engineer at Cardinal Health, put it this way: “Imagine there is a specific kind of bolt used in most of the cars and car parts in the world, and they just said that bolt needs to be replaced.” Glenn Thorpe, Rapid7’s Emergent Threat Response Manager added, “… and the presence of that bolt allows anyone to just take over the car.”
The first issue is Log4j’s widespread use. This little tool is used in countless systems across the internet, which makes remediation or mitigation of this into a huge task — and makes it more likely something might get missed.
The second issue is that attackers can use it in a variety of ways, so the sky is sort of the limit for them.
Perhaps the biggest concern of all is that it’s actually pretty easy to use the vulnerability for malicious purposes. Remote code execution vulnerabilities are always concerning, but you hope that they will be complicated to exploit and require specialist technical skill, limiting who can take advantage of them and slowing down the pace of attacks so that defenders can ideally take remediation action first. That’s not the case with Log4Shell. The Log4j tool is designed to send whatever data is inputted in the right format, so as long as attackers know how to form their commands into that format (which is not a secret), they can take advantage of this bug, and they currently are doing just that.
That sounds pretty bad. Is the situation hopeless?
Definitely not. The good news is that the Apache Foundation has updated Log4j to address the vulnerability. All organizations urgently need to check for the presence of this vulnerability in their environment and update affected systems to the latest patched version.
The first update — version 2.15.0 — was released on December 6, 2021. As exploitation ramped up in the wild, it became clear that the update did not fully remediate the issue in all use cases, a vulnerability that the National Vulnerability Database (NVD) codified as CVE-2021-45046.
As a result, on December 13, the Apache Foundation released version 2.16.0, which completely removes support for message lookup patterns, thus slamming the door on JNDI functionality completely and possibly adding to development team backlogs to update material sections on their codebase that handle logging.
That sounds straightforward, right?
Unfortunately, it’s likely going to be a pretty huge undertaking and likely require different phases of discovery and remediation/mitigation.
Remediation
The first course of action is to identify all vulnerable applications, which can be a mix of vendor-supplied solutions and in-house developed applications. NCSC NL is maintaining a list of impacted software, but organizations are encouraged to monitor vendor advisories and releases directly for the most up-to-date information.
For in-house developed applications, organizations — at a minimum — need to update their Log4j libraries to the latest version (which, as of 2021-12-14, is 2.16) and apply the mitigations described in Rapid7’s initial blog post on CVE-2021-44228, which includes adding a parameter to all Java startup scripts and strongly encourages updating Java virtual machine installations to the latest, safest versions. An additional resource, published by the Apache Security Team, provides a curated list of all affected Apache projects, which can be helpful to expedite identification and discovery.
If teams are performing “remote” checks (i.e., exploiting the vulnerability remotely as an attacker would) versus local filesystems “authenticated” checks, the remote checks should be both by IP address and by fully qualified domain name/virtual host name, as there may be different routing rules in play that scanning by IP address alone will not catch.
These mitigations must happen everywhere there is a vulnerable instance of Log4j. Do not assume that the issue applies only to internet-facing systems or live-running systems. There may be batch jobs that run hourly, daily, weekly, monthly, etc., on stored data that may contain exploit strings that could trigger execution.
Forensics
Attacks have been active since at least December 1, 2021, and there is evidence this weakness has been known about since at least March of 2021. Therefore, it is quite prudent to adopt an “assume breach” mindset. NCSC NL has a great resource page on ways you can detect exploitation attempts from application log files. Please be aware that this is not just a web-based attack. Initial, quite public, exploit showcases included changing the name of iOS devices and Tesla cars. Both those companies regularly pull metadata from their respective devices, and it seems those strings were passed to Log4j handlers somewhere in the processing chain. You should review logs from all internet-facing systems, as well as anywhere Log4j processing occurs.
Exploitation attempts will generally rely on pulling external resources in (as is the case with any attack after gaining initial access), so behavioral detections may have already caught or stopped some attacks. The Log4j weakness allows for rather clever data exfiltration paths, especially DNS. Attackers are pulling values from environment variables and files with known filesystems paths and creating dynamic domain names from them. That means organizations should review DNS query logs going as far back as possible. Note: This could take quite a bit of time and effort, but it must be done to ensure you’re not already a victim.
Proactive response
Out of an abundance of caution, organizations should also consider re-numbering critical IP segments (where Log4j lived), changing host names on critical systems (where Log4j lived), and resetting credentials — especially those associated with Amazon AWS and other cloud providers — in the event they have already been exfiltrated.
Who should be paying attention to this?
Pretty much every organization, regardless of size, sector, or geography. If you have any kind of web presence or internet connectivity, you need to pay attention and check your status. If you outsource all the technical aspects of your business, ask your vendors what they are doing about this issue.
Who is exploiting it and how?
Kind of… everyone.
“Benign” researchers (some independent, some part of cybersecurity firms) are using the exploit to gain an initial understanding of the base internet-facing attack surface.
Cyberattackers are also very active and are racing to take advantage of this vulnerability before organizations can get their patches in place. Botnets, such as Mirai, have been adapted to use the exploit code to both exfiltrate sensitive data and gain initial access to systems (some deep within organizations).
Ransomware groups have already sprung into action and weaponized the Log4j weakness to compromise organizations. Rapid7’s Project Heisenberg is collecting and publishing samples of all the unique attempts seen since December 11, 2021.
How are things likely to develop?
These initial campaigns are only the beginning. Sophisticated attacks from more serious and capable groups will appear over the coming days, weeks, and months, and they’ll likely focus on more enterprise-grade software that is known to be vulnerable.
Most of the initial attack attempts are via website-focused injection points (input fields, search boxes, headers, etc.). There will be more advanced campaigns that hit API endpoints (even “hidden” APIs that are part of company mobile apps) and try to find sneaky ways to get exploit strings past gate guards (like the iOS device renaming example).
Even organizations that have remediated deployed applications might miss some virtual machine or container images that get spun up regularly or infrequently. The Log4Shell attacks are easily automatable, and we’ll be seeing them as regularly as we see WannaCry and Conficker (yes, we still see quite a few exploits on the regular for those vulnerabilities).
Do we need to worry about similar vulnerabilities in other systems?
In the immediate term, security teams should narrow their attention to identify systems with the affected Log4j packages.
For the longer term, while it is impossible to forecast identification of similar vulnerabilities, we do know the ease and prevalence of CVE-2021-44228 demands the continued attention (been a long weekend for many) of security, infrastructure, and application teams.
Along with Log4Shell, we also have CVE-2021-4104 — reported on December 9, 2021 — a flaw in the Java logging library Apache Log4j in version 1.x. JMSAppender that is vulnerable to deserialization of untrusted data. This allows a remote attacker to execute code on the server if the deployed application is configured to use JMSAppender and to the attacker’s JMS Broker. Note this flaw only affects applications that are specifically configured to use JMSAppender, which is not the default, or when the attacker has write-access to the Log4j configuration for adding JMSAppender to the attacker’s JMS Broker.
Exploit vectors of Log4Shell and mitigations reported on Friday continue to evolve as reported by our partners at Snyk.io and Java Champion, Brian Vermeer — see “Editor’s note (Dec. 13, 2021)” — therefore, continued vigilance on this near and present threat is time well spent. Postmortem exercises (and there will be many) should absolutely include efforts to evolve software, open-source, and package dependency inventories and, given current impacts, better model threats from packages with similar uninspected lookup behavior.
Does this issue indicate that we should stop compiling systems and go back to building from scratch?
There definitely has been chatter regarding the reliance upon so many third-party dependencies in all areas of software development. We’ve seen many attempts at poisoning numerous ecosystems this year, everything from Python to JavaScript, and now we have a critical vulnerability in a near-ubiquitous component.
On one hand, there is merit in relying solely on code you develop in-house, built on the core features in your programming language of choice. You can make an argument that this would make attackers’ lives harder and reduce the bang they get for their buck.
However, it seems a bit daft to fully forego the volumes of pre-built, feature-rich, and highly useful components. And let’s not forget that not all software is created equally. The ideal is that community built and shared software will benefit from many more hands to the pump, more critical eyes, and a longer period to mature.
The lesson from the Log4Shell weakness seems pretty clear: Use, but verify, and support! Libraries such as Log4j benefit from wide community adoption, since they gain great features that can be harnessed quickly and effectively. However, you cannot just assume that all is and will be well in any given ecosystem, and you absolutely need to be part of the community vetting change and feature requests. If more eyes were on the initial request to add this fairly crazy feature (dynamic message execution) and more security-savvy folks were in the approval stream, you would very likely not be reading this post right now (and it’d be one of the most boring Marvel “What If…?” episodes ever).
Organizations should pull up a seat to the table, offer code creation and review support, and consider funding projects that become foundational or ubiquitous components in your application development environment.
How would a Software Bill of Materials (SBOM) have impacted this issue?
A Bill of Materials is an inventory, by definition, and conceptually should contribute to speeding the discovery timeline during emergent vulnerability response exercises, such as the Log4j incident we are communally involved in now.
An SBOM is intended to be a formal record that contains the details and supply chain relationships of various components used in software, kind of like an ingredients list for technology. In this case, those components would include java libraries used for logging (e.g. Log4j2).
SBOM requirements were included in the US Executive Order issued in May 2021. While there may be international variations, the concept and intended objects are uniform. For that reason, I will reference US progress for simplicity.
From: The Minimum Elements For a Software Bill of Materials (SBOM), issued Department of Commerce, in coordination with the National Telecommunications and Information Administration (NTIA), Jul 12, 2021
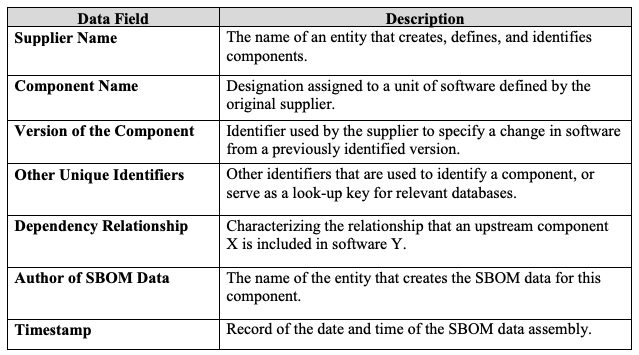
The question many Log4Shell responders — including CISOs, developers, engineers, sys admins, clients, and customers — are still grappling with is simply where affected versions of Log4j are in use within their technical ecosystems. Maintaining accurate inventories of assets has become increasingly challenging as our technical environments have become more complicated, interconnected, and wide-reaching. Our ever-growing reliance on internet-connected technologies, and the rise of shadow IT only make this problem worse.
Vulnerabilities in tools like Log4j, which is used broadly in a vast array of technologies and systems, highlight the need for more transparency and automation for asset and inventory management. Perhaps the longer-term substantive impact from Log4Shell will be to refocus investments and appreciation for the cruciality of an accurate inventory of software and associated components through an SBOM that can easily be queried and linked to dependencies.
The bottom line is that if we had lived in a timeline where SBOMs were required and in place for all software projects, identifying impacted products, devices, and ecosystems would have been much easier than it has been for Log4Shell and remediation would likely be faster and more effective.
How does Log4Shell impact my regulatory status — do I need to take special action to ensure compliance?
According to Rapid7’s resident policy and compliance expert, Harley Geiger, “Regulators may not have seen Log4Shell coming, but now that the vulnerability has been discovered, there will be an expectation that regulated companies address it. As organizations’ security programs address this widespread and serious vulnerability, those actions should be aligned with compliance requirements and reporting. For many regulated companies, the discovery of Log4Shell triggers a need to re-assess the company’s risks, the effectiveness of their safeguards to protect sensitive systems and information (including patching to the latest version), and the readiness of their incident response processes to address potential log4j exploitation. Many regulations also require these obligations to be passed on to service providers. If a Log4j exploitation results in a significant business disruption or breach of personal information, regulations may require the company to issue an incident report or breach notification.”
We also asked Harley whether we’re likely to see a public policy response. Here’s what he said…
“On a federal policy level, organizations should expect a renewed push for adoption of SBOM to help identify the presence of Log4j (and other vulnerabilities) in products and environments going forward. CISA has also required federal agencies to expedite mitigation of Log4j and has ramped up information sharing related to the vulnerability. This may add wind to the sails of cyber incident reporting legislation that is circulating in Congress at present.”
How do we know about all of this?
Well, a bunch of kids started wreaking havoc with Minecraft servers, and things just went downhill from there. While there is some truth to that, the reality is that an issue was filed on the Log4j project in late November 2021. Proof-of-concept code was released in early December, and active attacks started shortly thereafter. Some cybersecurity vendors have evidence of preliminary attacks starting on December 1, 2021.
Anyone monitoring the issue discussions (something both developers, defenders, and attackers do on the regular) would have noticed the gaping hole this “feature” created.
How long has it been around?
There is evidence of a request for this functionality to be added dating back to 2013. A talk at Black Hat USA 2016 mentioned several JNDI injection remote code execution vectors in general but did not point to Log4j directly.
Some proof-of-concept code targeting the JNDI lookup weakness in Log4j 2.x was also discovered back in March of 2021.
Fear, Uncertainty, and Doubt (FUD) is in copious supply today and likely to persist into the coming weeks and months. While adopting an “assumed breach” mindset isn’t relevant for every celebrity vulnerability, the prevalence and transitive dependency of the Log4j library along with the sophisticated obfuscation exploit techniques we are witnessing in real time point out that the question we should be considering isn’t, “How long has it been around?” Rather, it is, “How long should we be mentally preparing ourselves (and setting expectations) to clean it up?”
Get more critical insights about defending against Log4Shell
Introducing new features for Amazon Redshift COPY: Part 1
Post Syndicated from Dipankar Kushari original https://aws.amazon.com/blogs/big-data/part-1-introducing-new-features-for-amazon-redshift-copy/
Amazon Redshift is a fast, scalable, secure, and fully managed cloud data warehouse that makes it simple and cost-effective to analyze all your data using standard SQL. Amazon Redshift offers up to three times better price performance than any other cloud data warehouse. Tens of thousands of customers use Amazon Redshift to process exabytes of data per day and power analytics workloads such as high-performance business intelligence (BI) reporting, dashboarding applications, data exploration, and real-time analytics.
Loading data is a key process for any analytical system, including Amazon Redshift. Loading very large datasets can take a long time and consume a lot of computing resources. How your data is loaded can also affect query performance. You can use many different methods to load data into Amazon Redshift. One of the fastest and most scalable methods is to use the COPY command. This post dives into some of the recent enhancements made to the COPY command and how to use them effectively.
Overview of the COPY command
A best practice for loading data into Amazon Redshift is to use the COPY command. The COPY command loads data in parallel from Amazon Simple Storage Service (Amazon S3), Amazon EMR, Amazon DynamoDB, or multiple data sources on any remote hosts accessible through a Secure Shell (SSH) connection.
The COPY command reads and loads data in parallel from a file or multiple files in an S3 bucket. You can take maximum advantage of parallel processing by splitting your data into multiple files, in cases where the files are compressed. The COPY command appends the new input data to any existing rows in the target table. The COPY command can load data from Amazon S3 for the file formats AVRO, CSV, JSON, and TXT, and for columnar format files such as ORC and Parquet.
Use COPY with FILLRECORD
In situations when the contiguous fields are missing at the end of some of the records for data files being loaded, COPY reports an error indicating that there is mismatch between the number of fields in the file being loaded and the number of columns in the target table. In some situations, columnar files (such as Parquet) that are produced by applications and ingested into Amazon Redshift via COPY may have additional fields added to the files (and new columns to the target Amazon Redshift table) over time. In such cases, these files may have values absent for certain newly added fields. To load these files, you previously had to either preprocess the files to fill up values in the missing fields before loading the files using the COPY command, or use Amazon Redshift Spectrum to read the files from Amazon S3 and then use INSERT INTO to load data into the Amazon Redshift table.
With the FILLRECORD parameter, you can now load data files with a varying number of fields successfully in the same COPY command, as long as the target table has all columns defined. The FILLRECORD parameter addresses ease of use because you can now directly use the COPY command to load columnar files with varying fields into Amazon Redshift instead of achieving the same result with multiple steps.
With the FILLRECORD parameter, missing columns are loaded as NULLs. For text and CSV formats, if the missing column is a VARCHAR column, zero-length strings are loaded instead of NULLs. To load NULLs to VARCHAR columns from text and CSV, specify the EMPTYASNULL keyword. NULL substitution only works if the column definition allows NULLs.
Use FILLRECORD while loading Parquet data from Amazon S3
In this section, we demonstrate the utility of FILLRECORD by using a Parquet file that has a smaller number of fields populated than the number of columns in the target Amazon Redshift table. First we try to load the file into the table without the FILLRECORD parameter in the COPY command, then we use the FILLRECORD parameter in the COPY command.
For the purpose of this demonstration, we have created the following components:
- An Amazon Redshift cluster with a database, public schema, awsuser as admin user, and an AWS Identity and Access Management (IAM) role, used to perform the COPY command to load the file from Amazon S3, attached to the Amazon Redshift cluster. For details on authorizing Amazon Redshift to access other AWS services, refer to Authorizing Amazon Redshift to access other AWS services on your behalf.
- An Amazon Redshift table named
call_center_parquet. - A Parquet file already uploaded to an S3 bucket from where the file is copied into the Amazon Redshift cluster.
The following code is the definition of the call_center_parquet table:
The table has 31 columns.
The Parquet file doesn’t contain any value for the cc_gmt_offset and cc_tax_percentage fields. It has 29 columns. The following screenshot shows the schema definition for the Parquet file located in Amazon S3, which we load into Amazon Redshift.

We ran the COPY command two different ways: with or without the FILLRECORD parameter.
We first tried to load the Parquet file into the call_center_parquet table without the FILLRECORD parameter:
It generated an error while performing the copy.
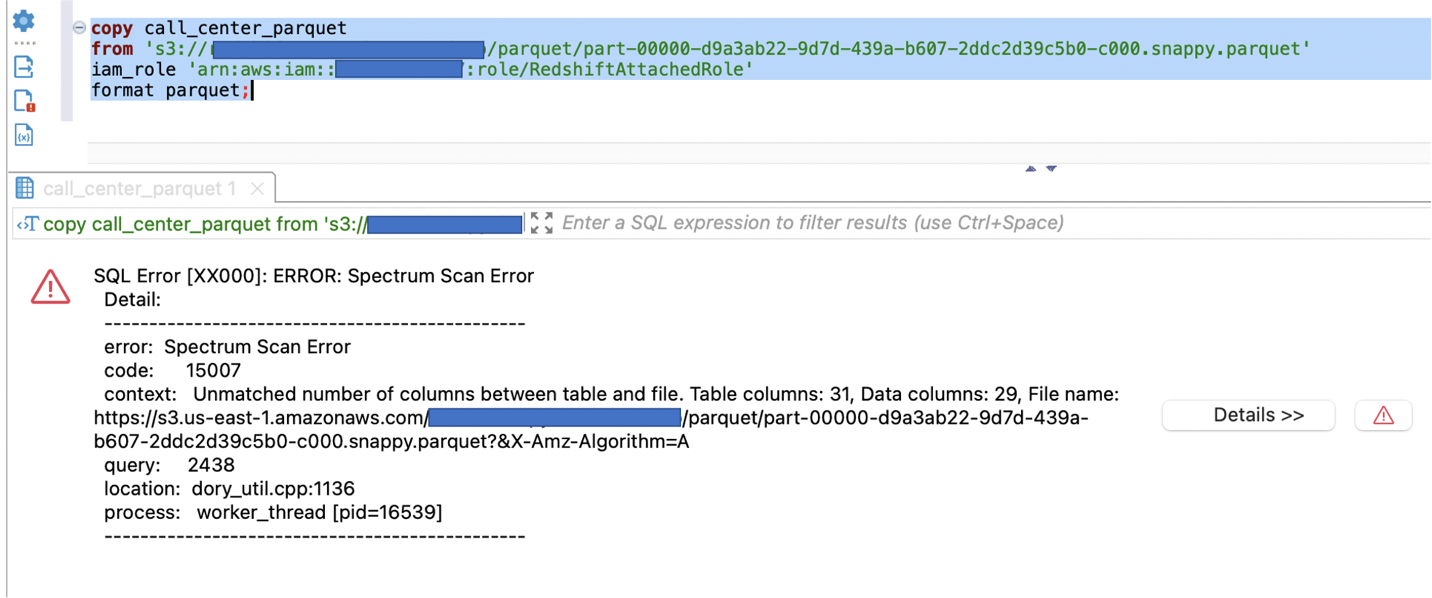
Next, we tried to load the Parquet file into the call_center_parquet table and used the FILLRECORD parameter:
The Parquet data was loaded successfully in the call_center_parquet table, and NULL was entered into the cc_gmt_offset and cc_tax_percentage columns.
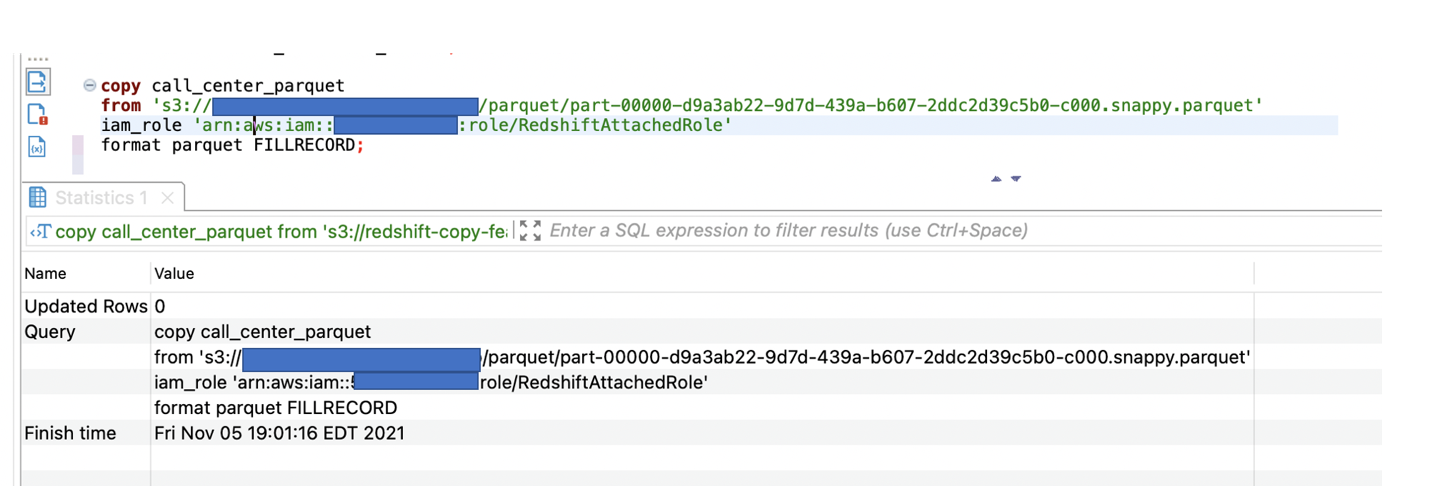
Split large text files while copying
The second new feature we discuss in this post is automatically splitting large files to take advantage of the massive parallelism of the Amazon Redshift cluster. A best practice when using the COPY command in Amazon Redshift is to load data using a single COPY command from multiple data files. This loads data in parallel by dividing the workload among the nodes and slices in the Amazon Redshift cluster. When all the data from a single file or small number of large files is loaded, Amazon Redshift is forced to perform a much slower serialized load, because the Amazon Redshift COPY command can’t utilize the parallelism of the Amazon Redshift cluster. You have to write additional preprocessing steps to split the large files into smaller files so that the COPY command loads data in parallel into the Amazon Redshift cluster.
The COPY command now supports automatically splitting a single file into multiple smaller scan ranges. This feature is currently supported only for large uncompressed delimited text files. More file formats and options, such as COPY with CSV keyword, will be added in the near future.
This helps improve performance for COPY queries when loading a small number of large uncompressed delimited text files into your Amazon Redshift cluster. Scan ranges are implemented by splitting the files into 64 MB chunks, which get assigned to each Amazon Redshift slice. This change addresses ease of use because you don’t need to split large uncompressed text files as an additional preprocessing step.
With Amazon Redshift’s ability to split large uncompressed text files, you can see performance improvements for the COPY command with a single large file or a few files with significantly varying relative sizes (for example, one file 5 GB in size and 20 files of a few KBs). Performance improvements for the COPY command are more significant as the file size increases even with keeping the same Amazon Redshift cluster configuration. Based on tests done, we observed a more than 1,500% performance improvement for the COPY command for loading a 6 GB uncompressed text file when the auto splitting feature became available.
There are no changes in the COPY query or keywords to enable this change, and splitting of files is automatically applied for the eligible COPY commands. Splitting isn’t applicable for the COPY query with the keywords CSV, REMOVEQUOTES, ESCAPE, and FIXEDWIDTH.
For the test, we used a single 6 GB uncompressed text file and the following COPY command:
The Amazon Redshift cluster without the auto split option took 102 seconds to copy the file from Amazon S3 to the Amazon Redshift store_sales table. When the auto split option was enabled in the Amazon Redshift cluster (without any other configuration changes), the same 6 GB uncompressed text file took just 6.19 seconds to copy the file from Amazon S3 to the store_sales table.
Summary
In this post, we showed two enhancements to the Amazon Redshift COPY command. First, we showed how you can add the FILLRECORD parameter in the COPY command in order to successfully load data files even when the contiguous fields are missing at the end of some of the records, as long as the target table has all the columns. Secondly, we described how Amazon Redshift auto splits large uncompressed text files into 64 MB chunks before copying the files into the Amazon Redshift cluster to enhance COPY performance. This automatic split of large files allows you to use the COPY command on large uncompressed text files—Amazon Redshift auto splits the file without needing you to add a preprocessing step to the split the large files yourself. Try these features to make your data loading to Amazon Redshift much simpler by removing custom preprocessing steps.
In Part 2 of this series, we will discuss additional new features of Amazon Redshift COPY command and demonstrate how you can take benefits of those to optimize your data loading process.
About the Authors
 Dipankar Kushari is a Senior Analytics Solutions Architect with AWS.
 Cody Cunningham is a Software Development Engineer with AWS, working on data ingestion for Amazon Redshift.
 Joe Yong is a Senior Technical Product Manager on the Amazon Redshift team and a relentless pursuer of making complex database technologies easy and intuitive for the masses. He has worked on database and data management systems for SMP, MPP, and distributed systems. Joe has shipped dozens of features for on-premises and cloud-native databases that serve IoT devices through petabyte-sized cloud data warehouses. Off keyboard, Joe tries to onsight 5.11s, hunt for good eats, and seek a cure for his Australian Labradoodle’s obsession with squeaky tennis balls.
 Anshul Purohit is a Software Development Engineer with AWS, working on data ingestion and query processing for Amazon Redshift.
A brief history of code search at GitHub
Post Syndicated from Pavel Avgustinov original https://github.blog/2021-12-15-a-brief-history-of-code-search-at-github/
We recently launched a technology preview for the next-generation code search we have been building. If you haven’t signed up already, go ahead and do it now!
We want to share more about our work on code exploration, navigation, search, and developer productivity. Recently, we substantially improved the precision of our code navigation for Python, and open-sourced the tools we developed for this. The stack graph formalism we developed will form the basis for precise code navigation support for more languages, and will even allow us to empower language communities to build and improve support for their own languages, similarly to how we accept contributions to github/linguist to expand GitHub’s syntax highlighting capabilities.
This blog post is part of the same series, and tells the story of why we built a new search engine optimized for code over the past 18 months. What challenges did we set ourselves? What is the historical context, and why could we not continue to build on off-the-shelf solutions? Read on to find out.
What’s our goal?
We set out to provide an experience that could become an integral part of every developer’s workflow. This has imposed hard constraints on the features, performance, and scalability of the system we’re building. In particular:
- Searching code is different: many standard techniques (like stemming and tokenization) are at odds with the kind of searches we want to support for source code. Identifier names and punctuation matter. We need to be able to match substrings, not just whole “words”. Specialized queries can require wildcards or even regular expressions. In addition, scoring heuristics tuned for natural language and web pages do not work well for source code.
- The scale of the corpus size: GitHub hosts over 200 million repositories, with over 61 million repositories created in the past year. We aim to support global queries across all of them, now and in the foreseeable future.
- The rate of change: over 170 million pull requests were merged in the past year, and this does not even account for code pushed directly to a branch. We would like our index to reflect the updated state of a repository within a few minutes of a push event.
- Search performance and latency: developers want their tools to be blazingly fast, and if we want to become part of every developer’s workflow we have to satisfy that expectation. Despite the scale of our index, we want p95 query times to be (well) under a second. Most user queries, or queries scoped to a set of repositories or organizations, should be much faster than that.
Over the years, GitHub has leveraged several off-the-shelf solutions, but as the requirements evolved over time, and the scale problem became ever more daunting, we became convinced that we had to build a bespoke search engine for code to achieve our objectives.
The early years
In the beginning, GitHub announced support for code search, as you might expect from a website with the tagline of “Social Code Hosting.” And all was well.

Except… you might note the disclaimer “GitHub Public Code Search.” This first iteration of global search worked by indexing all public documents into a Solr instance, which determined the results you got. While this nicely side-steps visibility and authorization concerns (everything is public!), not allowing private repositories to be searched would be a major functionality gap. The solution?
Image credit: Patrick Linskey on Stack Overflow
The repository page showed a “Search source code” field. For public repos, this was still backed by the Solr index, scoped to the active repository. For private repos, it shelled out to git grep.
Quite soon after shipping this, the then-in-beta Google Code Search began crawling public repositories on GitHub too, thus giving developers an alternative way of searching them. (Ultimately, Google Code Search was discontinued a few years later, though Russ Cox’s excellent blog post on how it worked remains a great source of inspiration for successor projects.)
Unfortunately, the different search experience for public and private repositories proved pretty confusing in practice. In addition, while git grep is a widely understood gold standard for how to search the contents of a Git repository, it operates without a dedicated index and hence works by scanning each document—taking time proportional to the size of the repository. This could lead to resource exhaustion on the Git hosts, and to an unresponsive web page, making it necessary to introduce timeouts. Large private repositories remained unsearchable.
Scaling with Elasticsearch
By 2010, the search landscape was seeing considerable upheaval. Solr joined Lucene as a subproject, and Elasticsearch sprang up as a great way of building and scaling on top of Lucene. While Elasticsearch wouldn’t hit a 1.0.0 release until February 2014, GitHub started experimenting with adopting it in 2011. An initial tentative experiment that indexed gists into Elasticsearch to make them searchable showed great promise, and before long it was clear that this was the future for all search on GitHub, including code search.
Indeed in early 2013, just as Google Code Search was winding down, GitHub launched a whole new code search backed by an Elasticsearch cluster, consolidating the search experience for public and private repositories and updating the design. The search index covered almost five million repositories at launch.

The scale of operations was definitely challenging, and within days or weeks of the launch GitHub experienced its first code search outages. The postmortem blog post is quite interesting on several levels, and it gives a glimpse of the cluster size (26 storage nodes with 2 TB of SSD storage each), utilization (67% of storage used), environment (Elasticsearch 0.19.9 and 0.20.2, Java 6 and 7), and indexing complexity (several months to backfill all repository data). Several bugs in Elasticsearch were identified and fixed, allowing GitHub to resume operations on the code search service.
In November 2013, Elasticsearch published a case study on GitHub’s code search cluster, again including some interesting data on scale. By that point, GitHub was indexing eight million repositories and responding to 5 search requests per second on average.
In general, our experience working with Elasticsearch has been truly excellent. It powers all kinds of search on GitHub.com, doing an excellent job throughout. The code search index is by far the largest cluster we operate , and it has grown in scale by another 20-40x since the case study (to 162 nodes, comprising 5184 vCPUs, 40TB of RAM, and 1.25PB of backing storage, supporting a query load of 200 requests per second on average and indexing over 53 billion source files). It is a testament to the capabilities of Elasticsearch that we have got this far with essentially an off-the-shelf search engine.
My code is not a novel
Elasticsearch excelled at most search workloads, but almost immediately some wrinkles and friction started cropping up in connection with code search. Perhaps the most widely observed is this comment from the code search documentation:
You can’t use the following wildcard characters as part of your search query:
. , : ; / \ ` ' " = * ! ? # $ & + ^ | ~ < > ( ) { } [ ] @. The search will simply ignore these symbols.
Source code is not like normal text, and those “punctuation” characters actually matter. So why are they ignored by GitHub’s production code search? It comes down to how our ingest pipeline for Elasticsearch is configured.
Click here to read the full details
When documents are added to an Elasticsearch index, they are passed through a process called text analysis, which converts unstructured text into a structured format optimized for search. Commonly, text analysis is configured to normalize away details that don’t matter to search (for example, case folding the document to provide case-insensitive matches, or compressing runs of whitespace into one, or stemming words so that searching for “ingestion” also finds “ingest pipeline”). Ultimately, it performs tokenization, splitting the normalized input document into a list of tokens whose occurrence should be indexed.
Many features and defaults available to text analysis are geared towards indexing natural-language text. To create an index for source code, we defined a custom text analyzer, applying a carefully selected set of normalizations (for example, case-folding and compressing whitespace make sense, but stemming does not). Then, we configured a custom pattern tokenizer, splitting the document using the following regular expression: %q_[.,:;/\\\\`'"=*!@?#$&+^|~<>(){}\[\]\s]_. If you look closely, you’ll recognise the list of characters that are ignored in your query string!
The tokens resulting from this split then undergo a final round of splitting, extracting word parts delimited in CamelCase and snake_case as additional tokens to make them searchable. To illustrate, suppose we are ingesting a document containing this declaration: pub fn pthread_getname_np(tid: ::pthread_t, name: *mut ::c_char, len: ::size_t) -> ::c_int;. Our text analysis phase would pass the following list of tokens to Elasticsearch to index: pub fn pthread_getname_np pthread getname np tid pthread_t pthread t name mut c_char c char len size_t size t c_int c int. The special characters simply do not figure in the index; instead, the focus is on words recovered from identifiers and keywords.
Designing a text analyzer is tricky, and involves hard trade-offs between index size and performance on the one hand, and the types of queries that can be answered on the other. The approach described above was the result of careful experimentation with different strategies, and represented a good compromise that has allowed us to launch and evolve code search for almost a decade.
Another consideration for source code is substring matching. Suppose that I want to find out how to get the name of a thread in Rust, and I vaguely remember the function is called something like thread_getname. Searching for thread_getname org:rust-lang will give no results on our Elasticsearch index; meanwhile, if I cloned rust-lang/libc locally and used git grep, I would instantly find pthread_getname_np. More generally, power users reach for regular expression searches almost immediately.
The earliest internal discussions of this that I can find date to October 2012, more than a year before the public release of Elasticsearch-based code search. We considered various ways of refining the Elasticsearch tokenization (in fact, we turn pthread_getname_np into the tokens pthread, getname, np, and pthread_getname_np—if I had searched for pthread getname rather than thread_getname, I would have found the definition of pthread_getname_np). We also evaluated trigram tokenization as described by Russ Cox. Our conclusion was summarized by a GitHub employee as follows:
The trigram tokenization strategy is very powerful. It will yield wonderful search results at the cost of search time and index size. This is the approach I would like to take, but there is work to be done to ensure we can scale the ElasticSearch cluster to meet the needs of this strategy.
Given the initial scale of the Elasticsearch cluster mentioned above, it wasn’t viable to substantially increase storage and CPU requirements at the time, and so we launched with a best-effort tokenization tuned for code identifiers.
Over the years, we kept coming back to this discussion. One promising idea for supporting special characters, inspired by some conversations with Elasticsearch experts at Elasticon 2016, was to use a Lucene tokenizer pattern that split code on runs of whitespace, but also on transitions from word characters to non-word characters (crucially, using lookahead/lookbehind assertions, without consuming any characters in this case; this would create a token for each special character). This would allow a search for ”answer >= 42” to find the source text answer >= 42 (disregarding whitespace, but including the comparison). Experiments showed this approach took 43-100% longer to index code, and produced an index that was 18-28% larger than the baseline. Query performance also suffered: at best, it was as fast as the baseline, but some queries (especially those that used special characters, or otherwise split into many tokens) were up to 4x slower. In the end, a typical query slowdown of 2.1x seemed like too high a price to pay.
By 2019, we had made significant investments in scaling our Elasticsearch cluster simply to keep up with the organic growth of the underlying code corpus. This gave us some performance headroom, and at GitHub Universe 2019 we felt confident enough to announce an “exact-match search” beta, which essentially followed the ideas above and was available for allow-listed repositories and organizations. We projected around a 1.3x increase in Elasticsearch resource usage for this index. The experience from the limited beta was very illuminating, but it proved too difficult to balance the additional resource requirements with ongoing growth of the index. In addition, even after the tokenization improvements, there were still numerous unsupported use cases (like substring searches and regular expressions) that we saw no path towards. Ultimately, exact-match search was sunset in just over half a year.
Project Blackbird
Actually, a major factor in pausing investment in exact-match search was a very promising research prototype search engine, internally code-named Blackbird. The project had been kicked off in early 2020, with the goal of determining which technologies would enable us to offer code search features at GitHub scale, and it showed a path forward that has led to the technology preview we launched last week.
Let’s recall our ambitious objectives: comprehensively index all source code on GitHub, support incremental indexing and document deletion, and provide lightning-fast exact-match and regex searches (specifically, a p95 of under a second for global queries, with correspondingly lower targets for org-scoped and repo-scoped searches). Do all this without using substantially more resources than the existing Elasticsearch cluster. Integrate other sources of rich code intelligence information available on GitHub. Easy, right?
We found that no off-the-shelf code indexing solution could satisfy those requirements. Russ Cox’s trigram index for code search only stores document IDs rather than positions in the posting lists; while that makes it very space-efficient, performance degrades rapidly with a large corpus size. Several successor projects augment the posting lists with position information or other data; this comes at a large storage and RAM cost (Zoekt reports a typical index size of 3.5x corpus size) that makes it too expensive at our scale. The sharding strategy is also crucial, as it determines how evenly distributed the load is. And any significant per-repo overhead becomes prohibitive when considering scaling the index to all repositories on GitHub.
In the end, Blackbird convinced us to go all-in on building a custom search engine for code. Written in Rust, it creates and incrementally maintains a code search index sharded by Git blob object ID; this gives us substantial storage savings via deduplication and guarantees a uniform load distribution across shards (something that classic approaches sharding by repo or org, like our existing Elasticsearch cluster, lack). It supports regular expression searches over document content and can capture additional metadata—for example, it also maintains an index of symbol definitions. It meets our performance goals: while it’s always possible to come up with a pathological search that misses the index, it’s exceptionally fast for “real” searches. The index is also extremely compact, weighing in at about ⅔ of the (deduplicated) corpus size.
One crucial realization was that if we want to index all code on GitHub into a single index, result scoring and ranking are absolutely critical; you really need to find useful documents first. Blackbird implements a number of heuristics, some code-specific (ranking up definitions and penalizing test code), and others general-purpose (ranking up complete matches and penalizing partial matches, so that when searching for thread an identifier called thread will rank above thread_id, which will rank above pthread_getname_np). Of course, the repository in which a match occurs also influences ranking. We want to show results from popular open-source repositories before a random match in a long-forgotten repository created as a test.
All of this is very much a work in progress. We are continuously tuning our scoring and ranking heuristics, optimizing the index and query process, and iterating on the query language. We have a long list of features to add. But we want to get what we have today into the hands of users, so that your feedback can shape our priorities.
We have more to share about the work we’re doing to enhance developer productivity at GitHub, so stay tuned.
The shoulders of giants
Modern software development is about collaboration and about leveraging the power of open source. Our new code search is no different. We wouldn’t have gotten anywhere close to its current state without the excellent work of tens of thousands of open source contributors and maintainers who built the tools we use, the libraries we depend on, and whose insightful ideas we could adopt and develop. A small selection of shout-outs and thank-yous:
- The communities of the languages and frameworks we build on: Rust, Go, and React. Thanks for enabling us to move fast.
- @BurntSushi: we are inspired by Andrew’s prolific output, and his work on the
regexandaho-corasickcrates in particular has been invaluable to us. - @lemire’s work on fast bit packing is integral to our design, and we drew a lot of inspiration from his optimization work more broadly (especially regarding the use of SIMD). Check out his blog for more.
- Enry and Tree-sitter, which power Blackbird’s language detection and symbol extraction, respectively.
Mold (linker) 1.0 released
Post Syndicated from original https://lwn.net/Articles/878759/rss
Version
1.0 of the mold linker has been released.
mold 1.0 is the first stable and production-ready release of the
high-speed linker. On Linux-based systems, it should “just work” as
a faster drop-in replacement for the default GNU linker for most
user-land programs. If you are building a large executable which
takes a long time to link, mold is worth a try to see if it can
shorten your build time.
How Goldman Sachs built persona tagging using Apache Flink on Amazon EMR
Post Syndicated from Balasubramanian Sakthivel original https://aws.amazon.com/blogs/big-data/how-goldman-sachs-built-persona-tagging-using-apache-flink-on-amazon-emr/
The Global Investment Research (GIR) division at Goldman Sachs is responsible for providing research and insights to the firm’s clients in the equity, fixed income, currency, and commodities markets. One of the long-standing goals of the GIR team is to deliver a personalized experience and relevant research content to their research users. Previously, in order to customize the user experience for their various types of clients, GIR offered a few distinct editions of their research site that were provided to users based on broad criteria. However, GIR did not have any way to create a personally curated content flow at the individual user level. To provide this functionality, GIR wanted to implement a system to actively filter the content that is recommended to their users on a per-user basis, keyed on characteristics such as the user’s job title or working region. Having this kind of system in place would both improve the user experience and simplify the workflows of GIR’s research users, by reducing the amount of time and effort required to find the research content that they need.
The first step towards achieving this is to directly classify GIR’s research users based on their profiles and readership. To that end, GIR created a system to tag users with personas. Each persona represents a type or classification that individual users can be tagged with, based on certain criteria. For example, GIR has a series of personas for classifying a user’s job title, and a user tagged with the “Chief Investment Officer” persona will have different research content highlighted and have a different site experience compared to one that is tagged with the “Corporate Treasurer” persona. This persona-tagging system can both efficiently carry out the data operations required for tagging users, as well as have new personas created as needed to fit use cases as they emerge.
In this post, we look at how GIR implemented this system using Amazon EMR.
Challenge
Given the number of contacts (i.e., millions) and the growing number of publications maintained in GIR’s research data store, creating a system for classifying users and recommending content is a scalability challenge. A newly created persona could potentially apply to almost every contact, in which case a tagging operation would need to be performed on several million data entries. In general, the number of contacts, the complexity of the data stored per contact, and the amount of criteria for personalization can only increase. To future-proof their workflow, GIR needed to ensure that their solution could handle the processing of large amounts of data as an expected and frequent case.
GIR’s business goal is to support two kinds of workflows for classification criteria: ad hoc and ongoing. An ad hoc criteria causes users that currently fit the defining criteria condition to immediately get tagged with the required persona, and is meant to facilitate the one-time tagging of specific contacts. On the other hand, an ongoing criteria is a continuous process that automatically tags users with a persona if a change to their attributes causes them to fit the criteria condition. The following diagram illustrates the desired personalization flow:

In the rest of this post, we focus on the design and implementation of GIR’s ad hoc workflow.
Apache Flink on Amazon EMR
To meet GIR’s scalability demands, they determined that Amazon EMR was the best fit for their use case, being a managed big data platform meant for processing large amounts of data using open source technologies such as Apache Flink. Although GIR evaluated a few other options that addressed their scalability concerns (such as AWS Glue), GIR chose Amazon EMR for its ease of integration into their existing systems and possibility to be adapted for both batch and streaming workflows.
Apache Flink is an open source big data distributed stream and batch processing engine that efficiently processes data from continuous events. Flink offers exactly-once guarantees, high throughput and low latency, and is suited for handling massive data streams. Also, Flink provides many easy-to-use APIs and mitigates the need for the programmer to worry about failures. However, building and maintaining a pipeline based on Flink comes with operational overhead and requires considerable expertise, in addition to provisioning physical resources.
Amazon EMR empowers users to create, operate, and scale big data environments such as Apache Flink quickly and cost-effectively. We can optimize costs by using Amazon EMR managed scaling to automatically increase or decrease the cluster nodes based on workload. In GIR’s use case, their users need to be able to trigger persona-tagging operations at any time, and require a predictable completion time for their jobs. For this, GIR decided to launch a long-running cluster, which allows multiple Flink jobs to be submitted simultaneously to the same cluster.
Ad hoc persona-tagging infrastructure and workflow
The following diagram illustrates the architecture of GIR’s ad hoc persona-tagging workflow on the AWS Cloud.
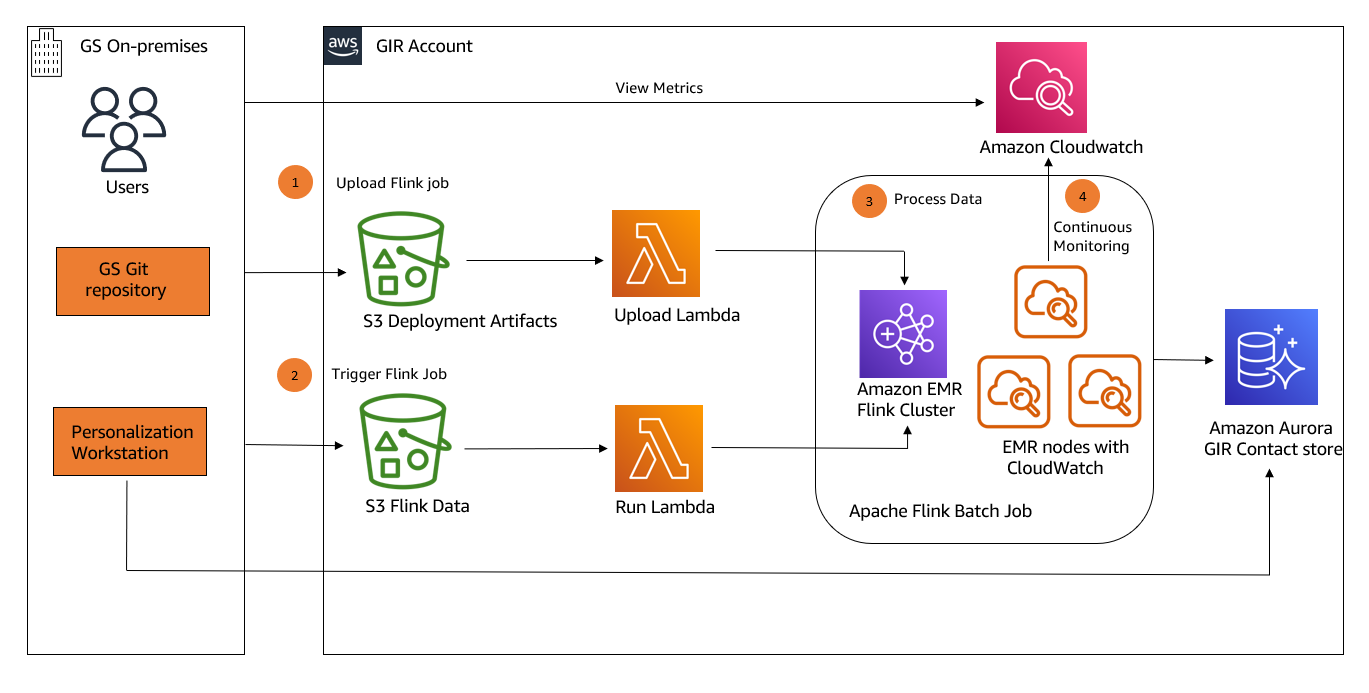
This is a broad overview, and the specifics of networking and security between components are out of scope for this post.
At a high level, we can discuss GIR’s workflow in four parts:
- Upload the Flink job artifacts to the EMR cluster.
- Trigger the Flink job.
- Within the Flink job, transform and then store user data.
- Continuous monitoring.
You can interact with Flink on Amazon EMR via the Amazon EMR console or the AWS Command Line Interface (AWS CLI). After launching the cluster, GIR used the Flink API to interact with and submit work to the Flink application. The Flink API provided a bit more functionality and was much easier to invoke from an AWS Lambda application.
The end goal of the setup is to have a pipeline where GIR’s internal users can freely make requests to update contact data (which in this use case is tagging or untagging contacts with various personas), and then have the updated contact data uploaded back to the GIR contact store.
Upload the Flink job artifacts to Amazon EMR
GIR has a GitLab project on-premises for managing the contents of their Flink job. To trigger the first part of their workflow and deploy a new version of the Flink job onto the cluster, a GitLab pipeline is run that first creates a .zip file containing the Flink job JAR file, properties, and config files.

The preceding diagram depicts the sequence of events that occurs in the job upload:
- The GitLab pipeline is manually triggered when a new Flink job should be uploaded. This transfers the .zip file containing the Flink job to an Amazon Simple Storage Service (Amazon S3) bucket on the GIR AWS account, labeled as “S3 Deployment artifacts”.
- A Lambda function (“Upload Lambda”) is triggered in response to the create event from Amazon S3.
- The function first uploads the Flink job JAR to the Amazon EMR Flink cluster, and retrieves the application ID for the Flink session.
- Finally, the function uploads the application properties file to a specific S3 bucket (“S3 Flink Job Properties”).
Trigger the Flink job
The second part of the workflow handles the submission of the actual Flink job to the cluster when job requests are generated. GIR has a user-facing web app called Personalization Workbench that provides the UI for carrying out persona-tagging operations. Admins and internal Goldman Sachs users can construct requests to tag or untag contacts with personas via this web app. When a request is submitted, a data file is generated that contains the details of the request.

The steps of this workflow are as follows:
- Personalization Workstation submits the details of the job request to the Flink Data S3 bucket, labeled as “S3 Flink data”.
- A Lambda function (“Run Lambda”) is triggered in response to the create event from Amazon S3.
- The function first reads the job properties file uploaded in the previous step to get the Flink job ID.
- Finally, the function makes an API call to run the required Flink job.
Process data
Contact data is processed according to the persona-tagging requests, and the transformed data is then uploaded back to the GIR contact store.

The steps of this workflow are as follows:
- The Flink job first reads the application properties file that was uploaded as part of the first step.
- Next, it reads the data file from the second workflow that contains the contact and persona data to be updated. The job then carries out the processing for the tagging or untagging operation.
- The results are uploaded back to the GIR contact store.
- Finally, both successful and failed requests are written back to Amazon S3.
Continuous monitoring
The final part of the overall workflow involves continuous monitoring of the EMR cluster in order to ensure that GIR’s tagging workflow is stable and that the cluster is in a healthy state. To ensure that the highest level of security is maintained with their client data, GIR wanted to avoid unconstrained SSH access to their AWS resources. Being constrained from accessing the EMR cluster’s primary node directly via SSH meant that GIR initially had no visibility into the EMR primary node logs or the Flink web interface.
By default, Amazon EMR archives the log files stored on the primary node to Amazon S3 at 5-minute intervals. Because this pipeline serves as a central platform for processing many ad hoc persona-tagging requests at a time, it was crucial for GIR to build a proper continuous monitoring system that would allow them to promptly diagnose any issues with the cluster.
To accomplish this, GIR implemented two monitoring solutions:
- GIR installed an Amazon CloudWatch agent onto every node of their EMR cluster via bootstrap actions. The CloudWatch agent collects and publishes Flink metrics to CloudWatch under a custom metric namespace, where they can be viewed on the CloudWatch console. GIR configured the CloudWatch agent configuration file to capture relevant metrics, such as CPU utilization and total running EMR instances. The result is an EMR cluster where metrics are emitted to CloudWatch at a much faster rate than waiting for periodic S3 log flushes.
- They also enabled the Flink UI in read-only mode by fronting the cluster’s primary node with a network load balancer and establishing connectivity from the Goldman Sachs on-premises network. This change allowed GIR to gain direct visibility into the state of their running EMR cluster and in-progress jobs.
Observations, challenges faced, and lessons learned
The personalization effort marked the first-time adoption of Amazon EMR within GIR. To date, hundreds of personalization criteria have been created in GIR’s production environment. In terms of web visits and clickthrough rate, site engagement with GIR personalized content has gradually increased since the implementation of the persona-tagging system.
GIR faced a few noteworthy challenges during development, as follows:
Restrictive security group rules
By default, Amazon EMR creates its security groups with rules that are less restrictive, because Amazon EMR can’t anticipate the specific custom settings for ingress and egress rules required by individual use cases. However, proper management of the security group rules is critical to protect the pipeline and data on the cluster. GIR used custom-managed security groups for their EMR cluster nodes and included only the needed security group rules for connectivity, in order to fulfill this stricter security posture.
Custom AMI
There were challenges in ensuring that the required packages were available when using custom Amazon Linux AMIs for Amazon EMR. As part of Goldman Sachs development SDLC controls, any Amazon Elastic Compute Cloud (Amazon EC2) instances on Goldman Sachs-owned AWS accounts are required to use internal Goldman Sachs-created AMIs. When GIR began development, the only compliant AMI that was available under this control was a minimal AMI based on the publicly available Amazon Linux 2 minimal AMI (amzn2-ami-minimal*-x86_64-ebs). However, Amazon EMR recommends using the full default Amazon 2 Linux AMI because it has all the necessary packages pre-installed. This resulted in various start up errors with no clear indication of the missing libraries.
GIR worked with AWS support to identify and resolve the issue by comparing the minimal and full AMIs, and installing the 177 missing packages individually (see the appendix for the full list of packages). In addition, various AMI-related files had been set to read-only permissions by the Goldman Sachs internal AMI creation process. Restoring these permissions to full read/write access allowed GIR to successfully start up their cluster.
Stalled Flink jobs
During GIR’s initial production rollout, GIR experienced an issue where their EMR cluster failed silently and caused their Lambda functions to time out. On further debugging, GIR found this issue to be related to an Akka quarantine-after-silence timeout setting. By default, it was set to 48 hours, causing the clusters to refuse more jobs after that time. GIR found a workaround by setting the value of akka.jvm-exit-on-fatal-error to false in the Flink config file.
Conclusion
In this post, we discussed how the GIR team at Goldman Sachs set up a system using Apache Flink on Amazon EMR to carry out the tagging of users with various personas, in order to better curate content offerings for those users. We also covered some of the challenges that GIR faced with the setup of their EMR cluster. This represents an important first step in providing GIR’s users with complete personalized content curation based on their individual profiles and readership.
Acknowledgments
The authors would like to thank the following members of the AWS and GIR teams for their close collaboration and guidance on this post:
- Elizabeth Byrnes, Managing Director, GIR
- Moon Wang, Managing Director, GIR
- Ankur Gurha, Vice President, GIR
- Jeremiah O’Connor, Solutions Architect, AWS
- Ley Nezifort, Associate, GIR
- Shruthi Venkatraman, Analyst, GIR
About the Authors
 Balasubramanian Sakthivel is a Vice President at Goldman Sachs in New York. He has more than 16 years of technology leadership experience and worked on many firmwide entitlement, authentication and personalization projects. Bala drives the Global Investment Research division’s client access and data engineering strategy, including architecture, design and practices to enable the lines of business to make informed decisions and drive value. He is an innovator as well as an expert in developing and delivering large scale distributed software that solves real world problems, with demonstrated success envisioning and implementing a broad range of highly scalable platforms, products and architecture.
 Victor Gan is an Analyst at Goldman Sachs in New York. Victor joined the Global Investment Research division in 2020 after graduating from Cornell University, and has been responsible for developing and provisioning cloud infrastructure for GIR’s user entitlement systems. He is focused on learning new technologies and streamlining cloud systems deployments.
 Manjula Nagineni is a Solutions Architect with AWS based in New York. She works with major Financial service institutions, architecting, and modernizing their large-scale applications while adopting AWS cloud services. She is passionate about designing big data workloads cloud-natively. She has over 20 years of IT experience in Software Development, Analytics and Architecture across multiple domains such as finance, manufacturing and telecom.
Appendix
GIR ran the following command to install the missing AMI packages: