Code that is added to the kernel can stay there for a long time; there is
code in current kernels that has been present for over 30 years.
Nothing is forever, though. The kernel development community is currently
discussing the removal of two architectures and one filesystem, all of
which seem to have mostly fallen out of use. But, as we will see, removal
of code from the kernel is not easy and is subject to reconsideration even
after it happens.
Using food or grocery delivery apps is great. It really is. Sure, there’s a fee, but when you can’t bring yourself to leave the house, it’s a nice treat to get what you want delivered. As a result, adoption of food apps has been incredibly fast and they are now a ubiquitous part of everyday culture. However, the tradeoff for that convenience is risk. In the past few years, cybercriminals have turned their gaze upon food and grocery delivery apps.
According to McKinsey, food delivery has a global market worth of over $150 billion, more than tripling since 2017. That equates to a lot of people entering usernames, passwords, and credit card numbers into these apps. That’s a lot of growth at an extremely rapid pace, and presents the age-old challenge of security trying to keep pace with that growth. Oftentimes it’s not a successful venture; specifically, credential stuffing (no relation to Thanksgiving stuffing or simply stuffing one’s face) is one of the major attacks of choice for bad actors attempting to break into user accounts or deploy other nefarious attacks inside of these apps.
Sounding the alarm
The FBI, among its many other cybercrime worries, recently raised the alert on credential stuffing attacks on customer app accounts across many industries. The usual-suspect industries—like healthcare and media—are there, but now the report includes “restaurant groups and food-delivery,” as well. This is notable due to that sector’s rapid adoption of apps, their growth in popularity among global consumers, and the previously mentioned challenges of security keeping pace with development instead of slowing it down.
The FBI report notes that, “In particular, media companies and restaurant groups are considered lucrative targets for credential stuffing attacks due to the number of customer accounts, the general demand for their services, and the relative lack of importance users place on these types of accounts.” Combine that with things like tutorial videos on hacker forums that make credential stuffing attacks relatively easy to learn, and it’s a (to continue with the food-centric puns) recipe for disaster.
Some background on credential stuffing
This OWASP cheat sheet describes credential stuffing as a situation when attackers test username/password pairs to gain access to one website or application after obtaining those credentials from the breach of another site or app. The pairs are often part of large lists of credentials sold on attacker forums and/or the dark web. Credential stuffing is typically part of a larger account takeover (ATO), targeting individual user accounts, of which there are so, so many on today’s popular delivery apps.
To get a bit deeper into it, the FBI report goes on to detail how bad actors often opt for the proxy-less route when conducting credential stuffing attacks. This method actually requires less time and money to successfully execute, all without the use of proxies. And even when leveraging a proxy, many existing security protocols don’t regularly flag them. Add to that the recent rise in the use of bots when scaling credential stuffing attacks and the recipe for disaster becomes a dessert as well (the puns continue).
All of these aspects contributing to the current state of vulnerability and security on grocery and food-delivery apps are worrying enough, but also creating concern is the fact that mobile apps (the primary method of interaction for food delivery services) typically permit a higher rate of login attempts for faster customer verification. In fairness, that can contribute to a better customer experience, but clearly leaves these types of services more vulnerable to attacks.
Cloud services like AWS and Google Cloud can help their clients fend off credential stuffing attacks with defenses like multifactor authentication (MFA) or a defense-in-depth approach that combines several layers of protection to prevent credential stuffing attacks. Enterprise customers can also take cloud security into their own hands—on behalf of their own customers actually using these apps—when it comes to operations in the cloud. Solutions like InsightCloudSec by Rapid7 help to further govern identity and access management (IAM) by implementing least-privilege access (LPA) for cloud workloads, services, and data.
Solutions to breed customer confidence
In addition to safeguards like MFA and LPA, the FBI report details a number of policies that food or grocery-delivery apps can leverage to make it harder for credential thieves to gain access to the app’s user-account base, such as:
Downloading publicly available credential lists and testing them against customer accounts to identify problems and gauge their severity.
Leveraging fingerprinting to detect unusual activity, like attempts by a single address to log into several different accounts.
Identifying and monitoring for default user-agent strings leveraged by credential-stuffing attack tools.
Detection and response (D&R) solutions like InsightIDR from Rapid7 can also leverage the use of deception technology to lure attackers attempting to use stolen credentials. By deploying fake honey credentials onto your endpoints to deceive attackers, InsightIDR can automatically raise an alert if those credentials are used anywhere else on the network.
At the end of the day, a good meal is essential. It’s also essential to protect your organization against credential stuffing attacks. Our report, Good Passwords for Bad Bots, offers practical, actionable advice on how to reduce the risk of credential-related attacks to your organization.
Version 3.0 of the Pandoc
document-conversion tool has been released; the list of new features is
quite long, including “chunked” HTML output, support for complex figures,
and much more.
Security updates have been issued by Debian (firefox-esr, libitext5-java, sudo, and webkit2gtk), Fedora (firefox and qemu), Red Hat (java-11-openjdk and java-17-openjdk), Slackware (sudo), SUSE (sudo), and Ubuntu (python-urllib3 and sudo).
Leveraging the power and versatility of Cloudflare’s Ruleset Engine, Waiting Room now offers customers more fine-tuned control over their waiting room traffic. Queue only the traffic you want to with Waiting Room Bypass Rules, now available to all Enterprise customers with an Advanced Purchase of Waiting Room.
Customers depend on Waiting Room for always-on protection from unexpected and overwhelming traffic surges that would otherwise bring their site down. Waiting Room places excess users in a fully customizable virtual waiting room, admitting new visitors dynamically as spots become available on a customer’s site. Instead of throwing error pages or delivering poorly-performing site pages, Waiting Room empowers customers to take control of their end-user experience during unmanageable traffic surges.
Take control of your customer experience with a fully customizable virtual waiting room
Additionally, customers use Waiting Room Event Scheduling to manage user flow and ensure reliable site performance before, during, and after online events such as product restocks, seasonal sales, and ticket sales. With Event Scheduling, customers schedule changes to their waiting rooms’ settings and custom queuing page ahead of time, with options to pre-queue early arrivers and offload event traffic from their origins after the event has concluded.
As part of the simple, no-coding-necessary process for deploying a waiting room, customers specify a hostname and path combination, which defines the location of their waiting room on their site. When a site visitor makes a preliminary request to that hostname and path or any of its subpaths, they will be issued a waiting room cookie and placed in the queue if the waiting room is queuing at that time.
The hostname and path approach to defining the placement of a waiting room is intuitive and makes it easy to deploy a waiting room to a site. But, many customers needed more granular control over what traffic and parts of their site their waiting room did or did not cover under a waiting room’s configured hostname and path. Use cases for allowing specific traffic to bypass a waiting room were varied.
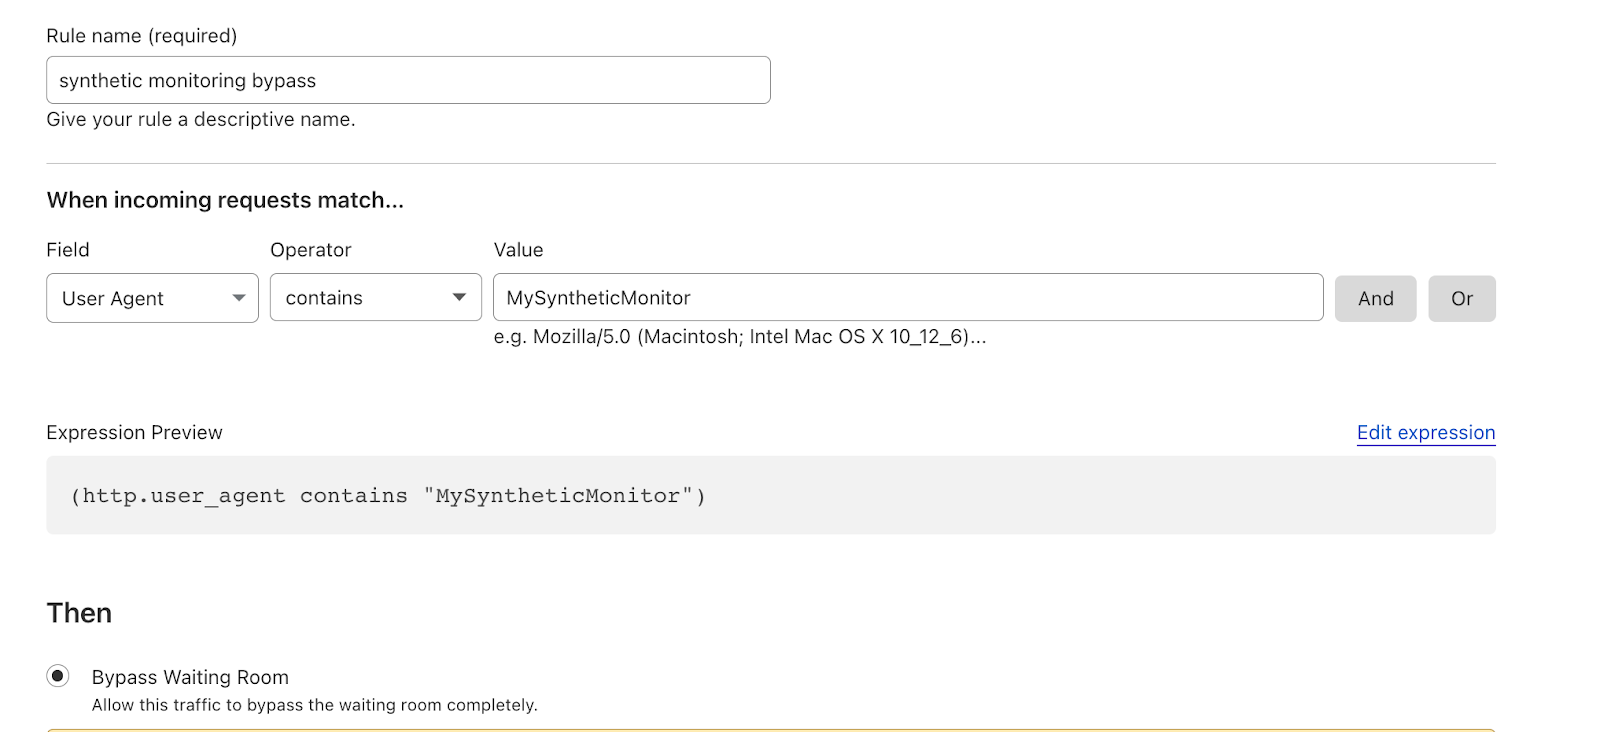
Examples included allowing internal administrators site access at all times, never blocking internal user agents performing operations like synthetic monitoring, not applying waiting room to specific subpaths or query strings, or queuing only traffic from certain countries. Given the diversity of our customers’ requests to exclude traffic from a waiting room’s coverage, we built a bypass feature that gave customers the versatility necessary to deploy waiting rooms aligned with their existing site architecture and use cases. With the release of Event Scheduling, Waiting Room customers could queue when they wanted to; now, we are excited to announce that customers now have more flexibility to queue who and where they want to with Waiting Room Bypass Rules.
Who gets queued is up to you
Waiting Room Bypass Rules allow customers to write expressions that define what traffic should bypass their waiting room. A waiting room will not apply to incoming requests matching conditions based on one or more available fields, like IP address, URI path, query string, and country. Bypass rules supersede all Waiting Room features; even in Queue-all mode, event pre-queuing, or any other waiting room state, traffic matching your enabled rules’ expressions will never be queued or issued a waiting room cookie. Waiting Room rules are created via the Waiting Room API or the Waiting Room dashboard using a familiar rule management interface found throughout the Cloudflare dashboard. Waiting Room rules are managed at the individual waiting room level for precise control over each waiting room’s traffic.
Use the familiar rule builder found throughout the Cloudflare dashboard to define which traffic should bypass your waiting room.Manage bypass rules at the individual waiting room level for precise control over each waiting room’s traffic coverage.
Built with the Ruleset Engine
We love building Cloudflare products on top of Cloudflare products; we knew that the versatility we wanted to offer to our customers with regard to what traffic a waiting room should apply to would best be achieved by integrating with Cloudflare’s powerful Ruleset Engine. The Ruleset Engine provides the infrastructure for many of our highly customizable products, such as the new Origin Rules feature and our WAF Managed Rulesets, by providing a unified way to represent the concept of “rules” and an easy-to-integrate software library for consistently executing those rules. This allows all sorts of Cloudflare products to provide extremely similar rules capabilities, with the same language for defining conditions (which can grow quite complex!) and very similar APIs.
We’ve even found that some of Waiting Room’s product functionality can be best implemented on top of the Ruleset Engine; earlier this year we migrated some select core Waiting Room logic into the Ruleset Engine, implemented as rulesets that we now transparently deploy to every zone with a waiting room. This newly migrated implementation has been running for months, and the flexibility of the Ruleset Engine will make certain future Waiting Room features easier than ever to build.
The Ruleset Engine works on two major concepts: rulesets and rules. A ruleset is a list of rules that the engine executes in order. A rule consists of a condition and an action, with the action being executed if the condition evaluates to “true”.
Under the hood, when you create the first rule for a waiting room, we create a hidden ruleset attached to that waiting room. We put together a ruleset of our own which runs on every request to your zone, dispatching to your custom ruleset if a request matches the attached waiting room. This all sounds somewhat complicated, but don’t worry. You simply manage rules at the individual waiting room level, while we abstract away the complexity of the underlying rulesets.
The Waiting Room Bypass action’s core implementation is quite simple: when the condition on one of your bypass rules is true for a request, the bypass action simply clears the flag on the request that would have told the waiting room code to kick in. This way, the bypass action ensures that Waiting Room doesn’t touch your request and the request doesn’t affect your waiting room’s statistics or queuing.
Bypass rules in action
Creating a bypass rule is easy and requires no coding or application changes. Let’s walk through a couple of real-world scenarios to demonstrate how easy it is to deploy a bypass rule from the Waiting Room dashboard or API.
Set up an Administrative IP Bypass Rule via the Waiting Room Dashboard
As mentioned before, many customers wanted to ensure that their site administrators and other internal employees–which they identify by IP address–could access their site at all times, regardless of a waiting room’s queueing status. Allowing unrestricted access to specific internal employees is especially important before online events when customers pre-queue early site visitors ahead of an event’s start time. Without the ability to bypass the waiting room before the event starts, internal employees could not review their event pages in a production environment, adding friction and uncertainty to their review process. Let’s see how we can fix that with a Waiting Room bypass rule.
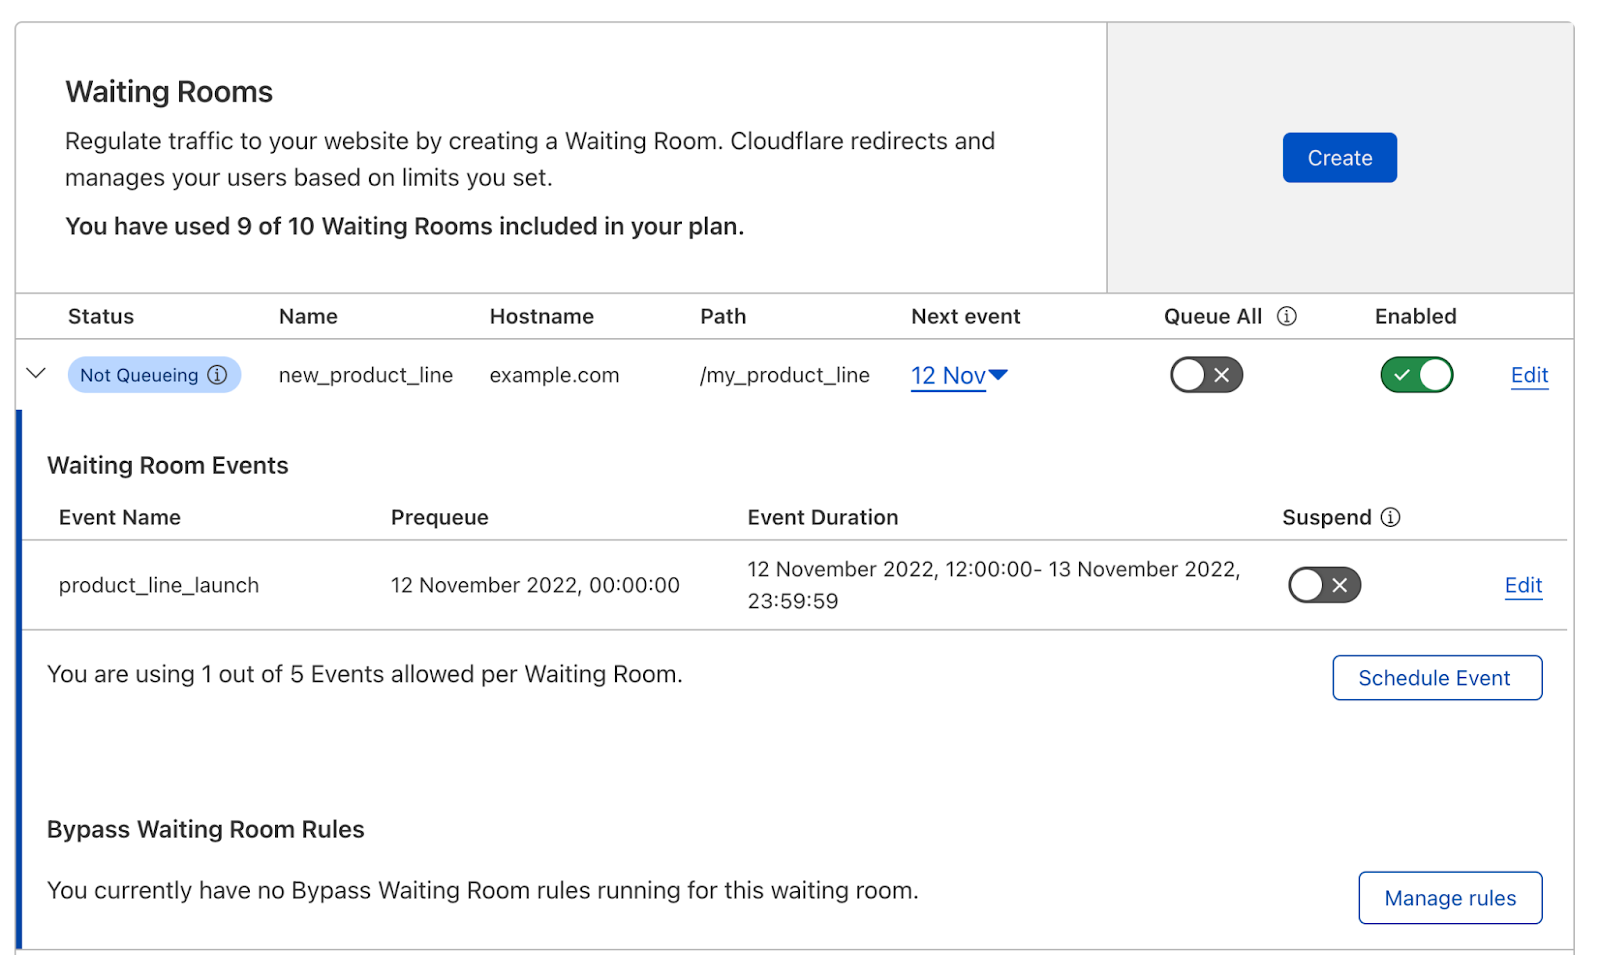
Before setting up your administrator bypass rule, you can create an IP list if you have more than a handful of IPs you’d like to bypass your waiting room. Then, you will need to configure a waiting room from the Waiting Room dashboard. From that waiting room’s expanded view, navigate to Manage rules, where you can create, disable, and delete rules for a waiting room.
Once you have created your waiting room, from that waiting room’s expanded view, select Manage rules to create Waiting Room bypass rules.
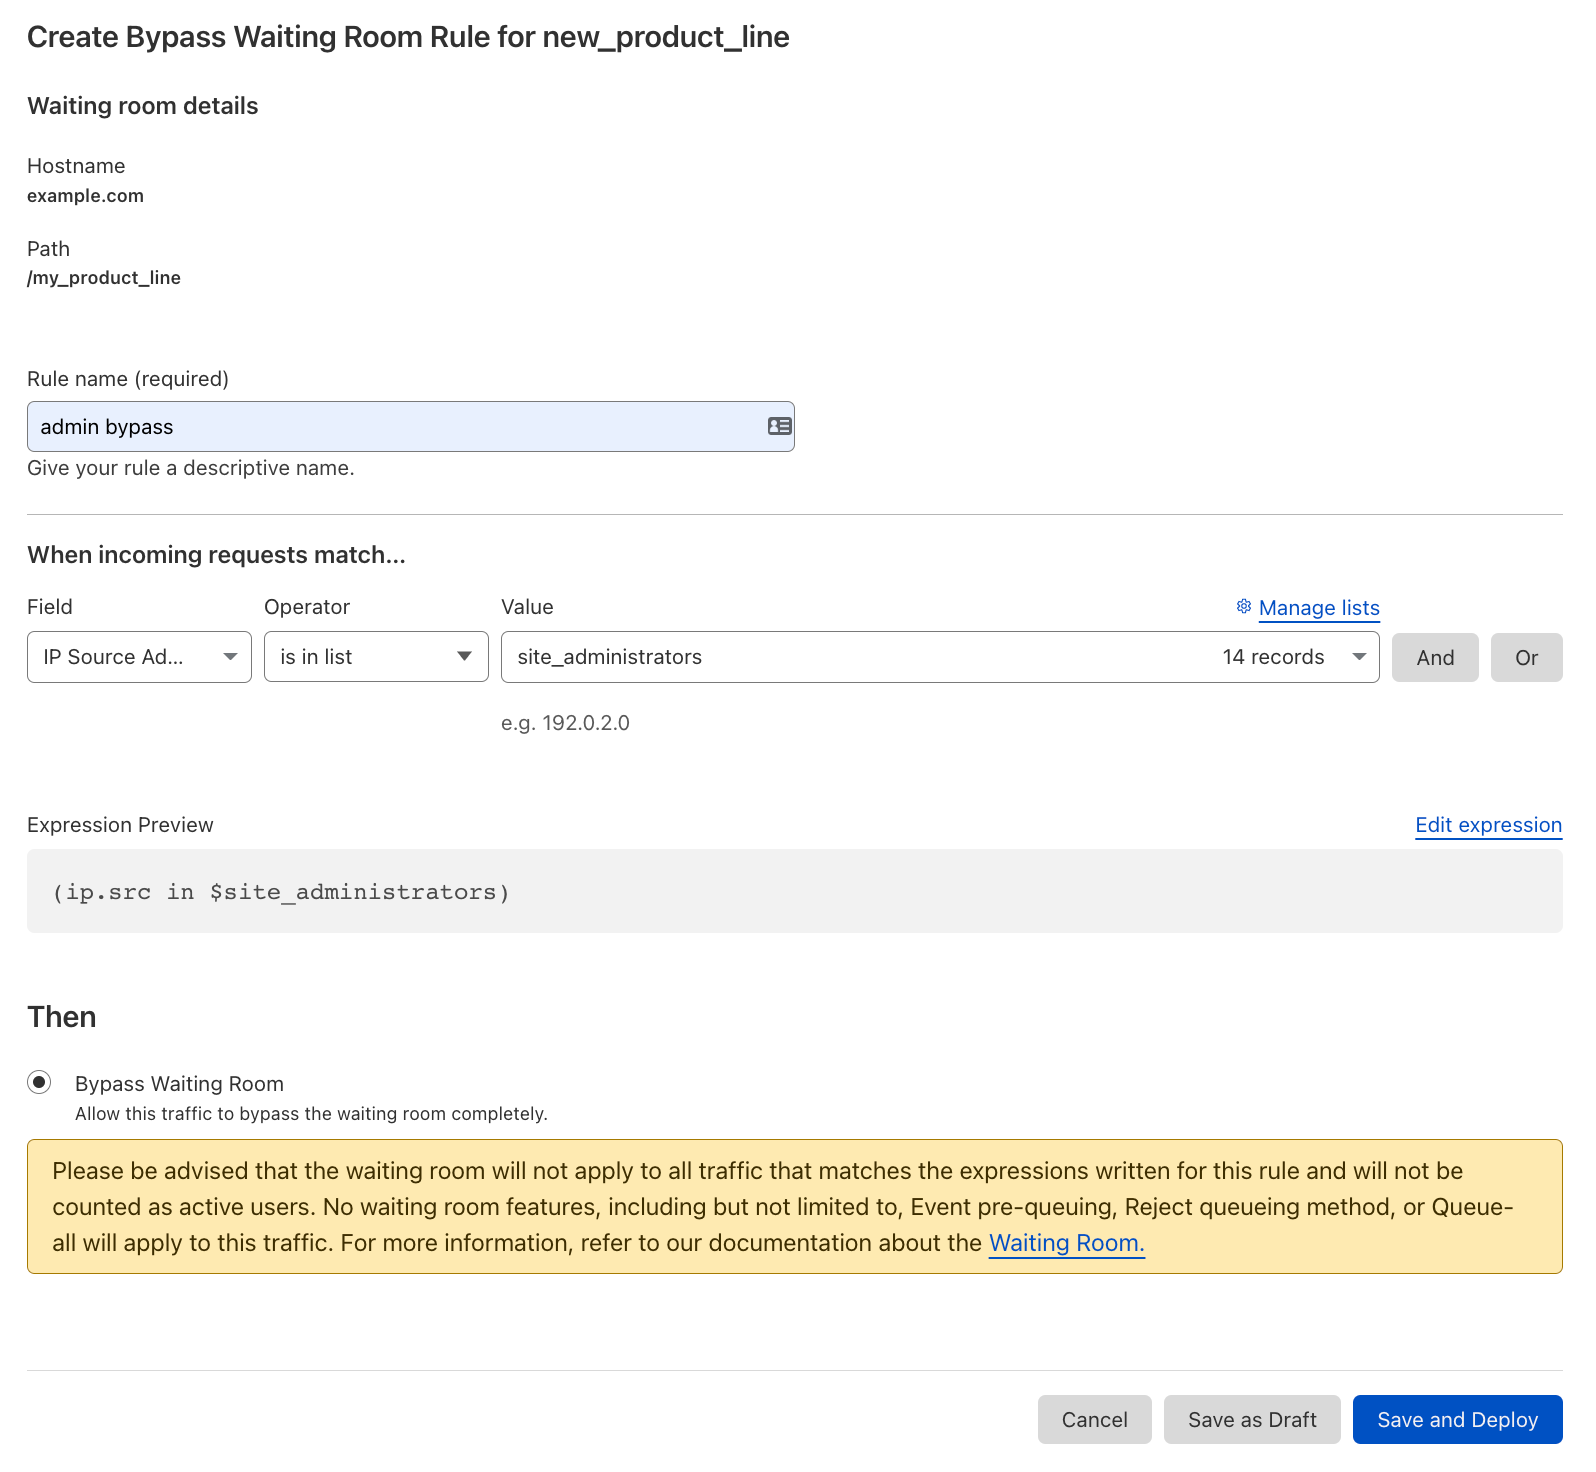
Using the rule builder, give your rule a descriptive name and build your expression. To build an expression for this example, we will select “IP Source Address” from the Field drop-down, “is in list” from the Operator drop-down, and then select the name of the IP list we created earlier. Once we’ve built the expression, we can either save this rule as a draft and deploy it later or save the rule and deploy it now.
Allow site administrators to bypass your waiting room by creating a Waiting Room bypass rule via the Waiting Room dashboard.
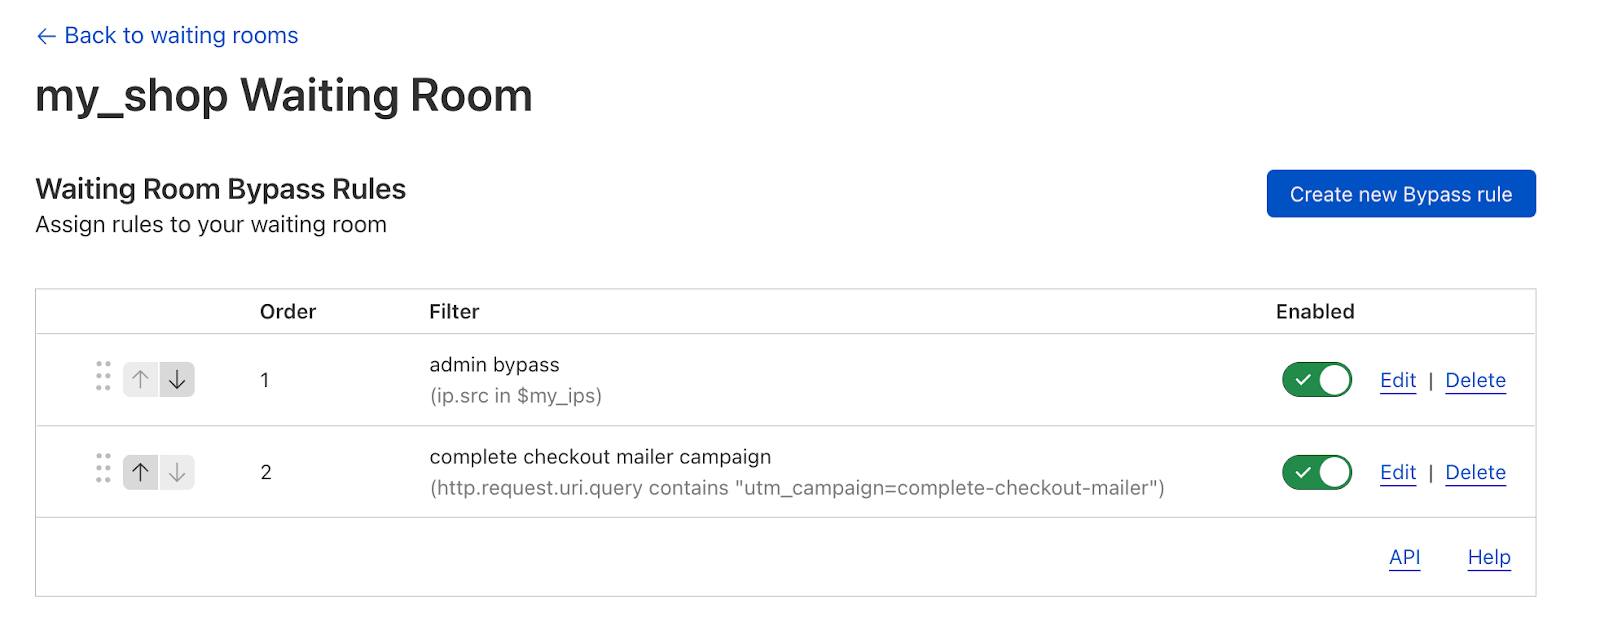
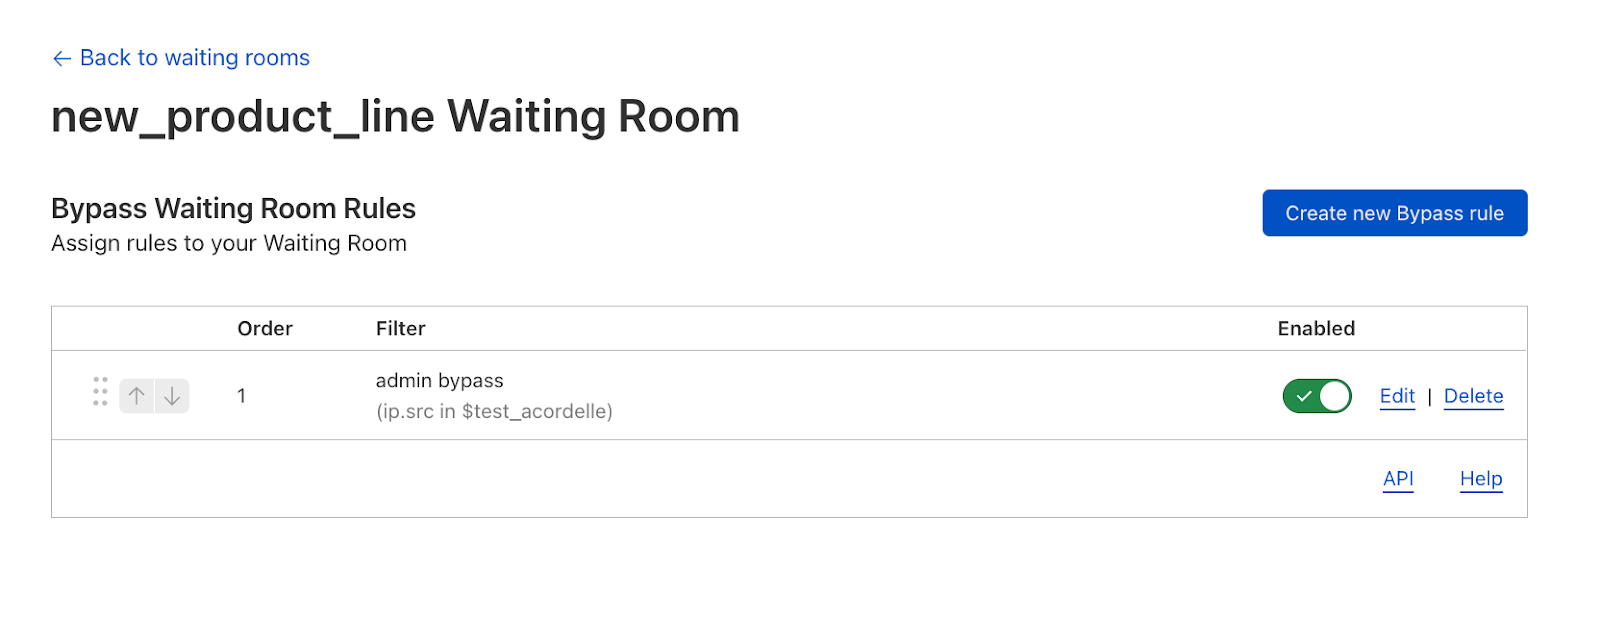
Once saved, the rule will appear on this waiting room’s rules management page along with all other rules for this waiting room. All requests for which this rule’s expression evaluates to true will bypass the waiting room. Thus, any user with an IP address from this managed list will never be queued when this rule is enabled.
Enable or disabled Waiting Room rules from an individual waiting room’s rule management dashboard.
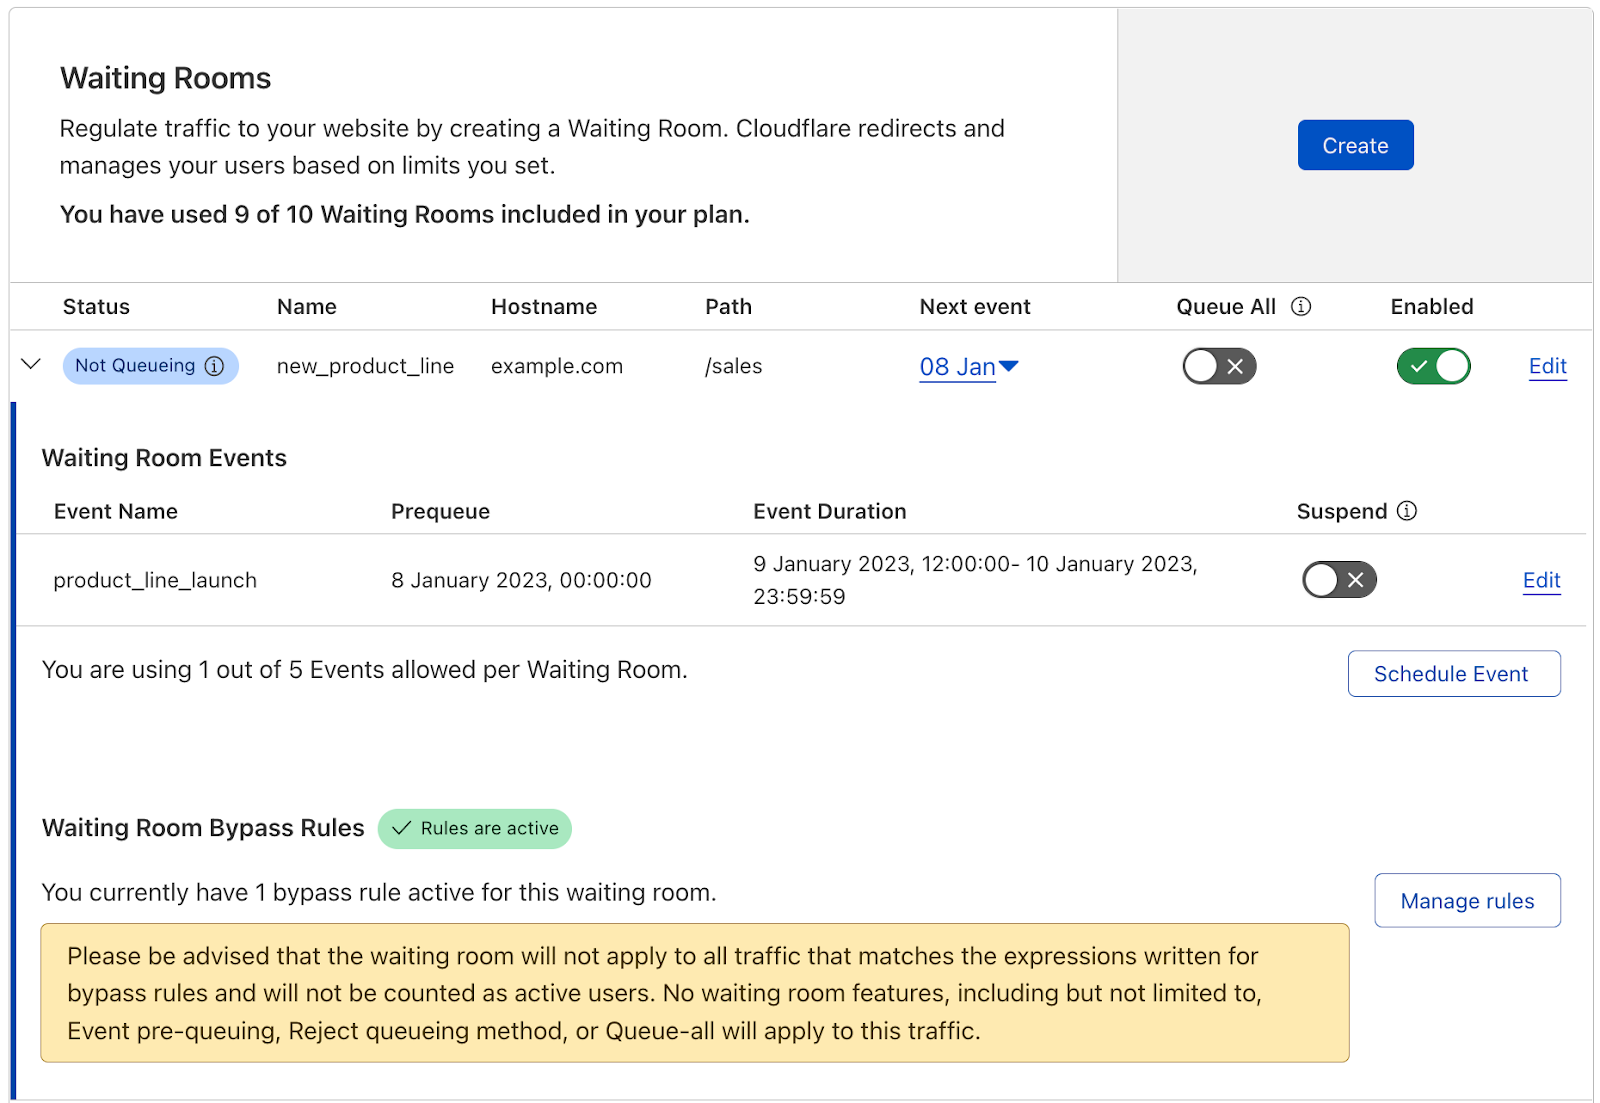
For added oversight, there are indicators on the Waiting Room dashboard that clearly signal if a waiting room has any bypass rules enabled. Now that we have deployed the admin bypass rule, we can see from the Waiting Room table that there is an active rule for this waiting room.
Easily glean which waiting rooms have bypass rules active from the Waiting Room table.
Bypass rules via the Waiting Room API – path bypass example
Another common customer request now achievable using Waiting Room Bypass Rules is path exclusions. As mentioned previously, a waiting room applies to all requests hitting the hostname and path combination of the configured waiting room and any URLs under that path. For many Waiting Room customers, there were specific URLs, paths, or query strings that they did not want a waiting room to apply to under their configured hostname and path. There are various reasons why a customer would want to make exceptions like this but let’s consider the following use case to illustrate the utility of bypassing specific parts of a site or application.
Consider a movie ticketing platform that wants to protect its ticketing web application from purchasing surges due to blockbuster releases. They create a waiting room to cover their ticketing web app by placing it at ticketing.example.com/. After tickets are purchased, the ticketing platform sends movie-goers an email or a text which links back to a URL under ticketing.example.com/. The URL the user receives via text or email is: ticketing.example.com/myaccount/mobiletickets/userverified?ticketid=<ticketID>
This link opens a page in the user’s mobile browser containing a QR code that the movie theater will scan in place of a physical ticket. They want to ensure that the waiting room does not apply to customers trying to open their mobile tickets.
To do this, they would create the following bypass rule via the Waiting Room API as follows:
Let’s break down this call. First, there is the URL, which needs to be populated with the zone id and the waiting room id. Then we pass our API token in the Authorization header. This call will create a new Waiting Room rule that will be added after any existing rules for this waiting room.
Within the body of the call, first define an optional description parameter. Give the rule an optional description to indicate the purpose of the rule for easy reference later.
Next, write the expression, which defines the exact traffic which should bypass the waiting room. In this example, customers using the direct link sent via text should bypass the waiting room. These direct links end with the path userverified so create an ends_with condition.
When creating a bypass rule for path, query string, or URLs, make sure to include in the expression exclusions for subrequests that load assets on the pages covered by a waiting room. Let’s assume in this example we are hosting assets on a different subdomain not covered by the waiting room. Therefore, we do not need to include these subrequests in the expression.
Lastly, set the action parameter to bypass_waiting_room to indicate that this traffic should bypass the waiting room and deploy the rule. This customer’s waiting room now covers precisely the parts of their application they want to cover. Their waiting room will protect their web application from ticket purchasing traffic while ensuring that customers who need to display their mobile tickets at the movie theater can do so reliably without being placed in a Waiting Room queue.
With the addition of Waiting Room Bypass Rules, customers now have more flexibility to deploy waiting rooms on their terms, to cover exactly the traffic they want. For more on Waiting Room Bypass Rules and Waiting Room, check out our developer documentation.
Not using Cloudflare yet? Start now with our Business plan which includes one basic Waiting Room or contact us about our advanced Waiting Room with Event Scheduling, Customized Templates, and Waiting Room Bypass Rules available on our Enterprise plan.
A group of Swiss researchers have published an impressive security analysis of Threema.
We provide an extensive cryptographic analysis of Threema, a Swiss-based encrypted messaging application with more than 10 million users and 7000 corporate customers. We present seven different attacks against the protocol in three different threat models. As one example, we present a cross-protocol attack which breaks authentication in Threema and which exploits the lack of proper key separation between different sub-protocols. As another, we demonstrate a compression-based side-channel attack that recovers users’ long-term private keys through observation of the size of Threema encrypted back-ups. We discuss remediations for our attacks and draw three wider lessons for developers of secure protocols.
Threema has more than 10 million users, which include the Swiss government, the Swiss army, German Chancellor Olaf Scholz, and other politicians in that country. Threema developers advertise it as a more secure alternative to Meta’s WhatsApp messenger. It’s among the top Android apps for a fee-based category in Switzerland, Germany, Austria, Canada, and Australia. The app uses a custom-designed encryption protocol in contravention of established cryptographic norms.
The company is performing the usual denials and deflections:
In a web post, Threema officials said the vulnerabilities applied to an old protocol that’s no longer in use. It also said the researchers were overselling their findings.
“While some of the findings presented in the paper may be interesting from a theoretical standpoint, none of them ever had any considerable real-world impact,” the post stated. “Most assume extensive and unrealistic prerequisites that would have far greater consequences than the respective finding itself.”
Left out of the statement is that the protocol the researchers analyzed is old because they disclosed the vulnerabilities to Threema, and Threema updated it.
No, there is no news in Die Welt and POLITICO’s articles, the secret weapons deliveries to Ukraine were first exposed by investigative journalism outlet Bivol in partnership with Polish investigative…
Не, няма новина в статиите на Die Welt и POLITICO, пръв разкри тайните доставки на оръжия за Украйна Сайтът за разследваща журналистика “Биволъ” в партньорство с изданието на полските разследващи…
At ISRG, we often say, “as a nonprofit, 100% of our funding comes from charitable contributions.” But what does that actually look like? For nearly a decade, the vast majority of our funding has come from sponsorships—in fact, more than $17 million dollars has been donated to ISRG since 2015. Looking to the year ahead, we wanted to take a moment to thank our renewing sponsors who, quite literally, make our work possible:
With us since the beginning
In 2015, the work ISRG set out to do was viewed by many as audacious, if not incredible. Back then, SSL/TLS was used by less than 40% of page loads. Getting a certificate was costly and complicated. Our aim was to make access to SSL certificates easy, free, and automated. That same year nineteen sponsors came on board to help us realize this mission. Today, seventeen of those sponsors and grantmakers have stayed on board every year! Now in their eighth year as a sponsor, Hostpoint has renewed their support for 2023. Their Co-founder and CEO, Markus Gebert, commented:
“We have supported Let’s Encrypt since the very beginning. It is very valuable and important that nowadays any website can be equipped with an SSL certificate free of charge.”
Our thanks to Akamai, Cisco, Mozilla, Google, OVHcloud, Internet Society, Shopify, Hostpoint, SiteGround, Cyon, IdenTrust, Vultr, Automattic, Electronic Frontier Foundation, infomaniak, PlanetHoster, and Discourse for their eight years of support.
Committed to a better Internet
We know that finding sponsorship dollars is often anything but a straightforward path. That’s why we approach sponsorship as an ongoing conversation, not a one-time transactional interaction. As a result, we’re proud that each year we see on average 80% of our sponsors renew their support. From large organizations with thousands of staff to one-person shops, our sponsors come in all shapes and sizes—but all share a common goal of helping to make our work happen.
We are grateful to the 70 sponsors renewing their support for 2023 who combined provide close to 60% of our operating budget. Their continued support means we begin 2023 well on our way towards our fundraising need for the year. Shopify, a sponsor since 2015 has renewed their Gold sponsorship for 2023. Their Founder and CEO, Tobi Lütke, commented:
“Let’s Encrypt makes it easy for everyone to do the right thing to secure the Internet. We couldn’t be happier to give our support to such a great effort.”
Together, these organizations make the mission of ISRG, and its impact for billions of people around the world, possible. Powered by their support, we look forward to continuing to build a Web that works for everyone, everywhere.
Supporting Let’s Encrypt
As a project of the Internet Security Research Group (ISRG), 100% of our funding comes from contributions from our community of users and supporters. We depend on their support in order to provide our public benefit services. If your company or organization would like to sponsor Let’s Encrypt please email us at [email protected]. If you can support us with a donation, we ask that you make an individual contribution.
On today’s Fedora systems, a reboot cycle—for a kernel update,
say—is normally a fairly quick affair, but that is not always true. The
system will
wait for services to shut down cleanly and will wait for up to two minutes
before killing a service and moving on. A recent proposal to change the
default timeout to 15 seconds, while still allowing some services to
require more time, ran into more opposition than was perhaps anticipated.
Not everyone was comfortable shortening the timeout period, though the
decision has now been made to reduce it, but not as far as was proposed.
We continue to expand the scope of our assurance programs at Amazon Web Services (AWS), and we are pleased to announce that AWS has successfully completed the 2022 Cloud Computing Compliance Controls Catalogue (C5) attestation cycle with 156 services in scope. This alignment with C5 requirements demonstrates our ongoing commitment to adhere to the heightened expectations for cloud service providers. AWS customers in Germany and across Europe can run their applications on AWS Regions in scope of the C5 report with the assurance that AWS aligns with C5 requirements.
The C5 attestation scheme is backed by the German government and was introduced by the Federal Office for Information Security (BSI) in 2016. AWS has adhered to the C5 requirements since their inception. C5 helps organizations demonstrate operational security against common cyberattacks when using cloud services within the context of the German Government’s Security Recommendations for Cloud Computing Providers.
Independent third-party auditors evaluated AWS for the period October 1, 2021, through September 30, 2022. The C5 report illustrates AWS’ compliance status for both the basic and additional criteria of C5. Customers can download the C5 report through AWS Artifact. AWS Artifact is a self-service portal for on-demand access to AWS compliance reports. Sign in to AWS Artifact in the AWS Management Console, or learn more at Getting Started with AWS Artifact.
AWS has added the following 16 services to the current C5 scope:
At present, the services offered in the Frankfurt, Dublin, London, Paris, Milan, Stockholm and Singapore Regions are in scope of this certification. For up-to-date information, see the AWS Services in Scope by Compliance Program page and choose C5.
AWS strives to continuously bring services into the scope of its compliance programs to help you meet your architectural and regulatory needs. If you have questions or feedback about C5 compliance, reach out to your AWS account team.
To learn more about our compliance and security programs, see AWS Compliance Programs. As always, we value your feedback and questions; reach out to the AWS Compliance team through the Contact Us page.
If you have feedback about this post, submit comments in the Comments section below.
Want more AWS Security how-to content, news, and feature announcements? Follow us on Twitter.
In the last post, OfferUp modernized its DevOps platform with Amazon EKS and Flagger to accelerate time to market, we talked about hypergrowth and the technical challenges encountered by OfferUp in its existing DevOps platform. As a reminder, we presented how OfferUp modernized its DevOps platform with Amazon Elastic Kubernetes Service (Amazon EKS) and Flagger to gain developer’s velocity, automate faster deployment, and achieve lower cost of ownership.
In this post, we discuss the technical steps to build a DevOps platform that enables the progressive deployment of microservices on Amazon Managed Amazon EKS. Progressive delivery exposes a new version of the software incrementally to ingress traffic and continuously measures the success rate of the metrics before allowing all of the new traffics to a newer version of the software. Flagger is the Graduate project of Cloud Native Computing Foundations (CNCF) that enables progressive canary delivery, along with bule/green and A/B Testing, while measuring metrics like HTTP/gRPC request success rate and latency. Flagger shifts and routes traffic between app versions using a service mesh or an Ingress controller
We leverage Gloo Ingress Controller for traffic routing, Prometheus, Datadog, and Amazon CloudWatch for application metrics analysis and Slack to send notification. Flagger will post messages to slack when a deployment has been initialized, when a new revision has been detected, and if the canary analysis failed or succeeded.
Prerequisite steps to build the modern DevOps platform
You need an AWS Account and AWS Identity and Access Management (IAM) user to build the DevOps platform. If you don’t have an AWS account with Administrator access, then create one now by clicking here. Create an IAM user and assign admin role. You can build this platform in any AWS region however, I will you us-west-1 region throughout this post. You can use a laptop (Mac or Windows) or an Amazon Elastic Compute Cloud (AmazonEC2) instance as a client machine to install all of the necessary software to build the GitOps platform. For this post, I launched an Amazon EC2 instance (with Amazon Linux2 AMI) as the client and install all of the prerequisite software. You need the awscli, git, eksctl, kubectl, and helm applications to build the GitOps platform. Here are the prerequisite steps,
Create a named profile(eks-devops) with the config and credentials file:
aws configure --profile eks-devops
AWS Access Key ID [None]: xxxxxxxxxxxxxxxxxxxxxx
AWS Secret Access Key [None]: xxxxxxxxxxxxxxxxxx
Default region name [None]: us-west-1
Default output format [None]:
View and verify your current IAM profile:
export AWS_PROFILE=eks-devops
aws sts get-caller-identity
If the Amazon EC2 instance doesn’t have git preinstalled, then install git in your Amazon EC2 instance:
sudo yum update -y
sudo yum install git -y
Check git version
git version
Git clone the repo and download all of the prerequisite software in the home directory.
Amazon ECR is a fully-managed container registry that makes it easy for developers to share and deploy container images and artifacts. ecr setup.sh script will create a new Amazon ECR repository and also push the podinfo images (6.0.0, 6.0.1, 6.0.2, 6.1.0, 6.1.5 and 6.1.6) to the Amazon ECR. Run ecr-setup.sh script with the parameter, “ECR repository name” (e.g. ps-flagger-repository) and region (e.g. us-west-1)
Technical steps to build the modern DevOps platform
This post shows you how to use the Gloo Edge ingress controller and Flagger to automate canary releases for progressive deployment on the Amazon EKS cluster. Flagger requires a Kubernetes cluster v1.16 or newer and Gloo Edge ingress 1.6.0 or newer. This post will provide a step-by-step approach to install the Amazon EKS cluster with managed node group, Gloo Edge ingress controller, and Flagger for Gloo in the Amazon EKS cluster. Now that the cluster, metrics infrastructure, and Flagger are installed, we can install the sample application itself. We’ll use the standard Podinfo application used in the Flagger project and the accompanying loadtester tool. The Flagger “podinfo” backend service will be called by Gloo’s “VirtualService”, which is the root routing object for the Gloo Gateway. A virtual service describes the set of routes to match for a set of domains. We’ll automate the canary promotion, with the new image of the “podinfo” service, from version 6.0.0 to version 6.0.1. We’ll also create a scenario by injecting an error for automated canary rollback while deploying version 6.0.2.
Use myeks-cluster.yaml to create your Amazon EKS cluster with managed nodegroup. myeks-cluster.yaml deployment file has “cluster name” value as ps-eks-66, region value as us-west-1, availabilityZones as [us-west-1a, us-west-1b], Kubernetes version as 1.24, and nodegroup Amazon EC2 instance type as m5.2xlarge. You can change this value if you want to build the cluster in a separate region or availability zone.
Create a namespace “gloo-system” and Install Gloo with Helm Chart. Gloo Edge is an Envoy-based Kubernetes-native ingress controller to facilitate and secure application traffic.
[Optional] If you’re using Datadog as a monitoring tool, then deploy Datadog agents as a DaemonSet using the Datadog Helm chart. Replace RELEASE_NAME and DATADOG_API_KEY accordingly. If you aren’t using Datadog, then skip this step. For this post, we leverage the Prometheus open-source monitoring tool.
Integrate Amazon EKS/ K8s Cluster with the Datadog Dashboard – go to the Datadog Console and add the Kubernetes integration.
[Optional] If you’re using Slack communication tool and have admin access, then Flagger can be configured to send alerts to the Slack chat platform by integrating the Slack alerting system with Flagger. If you don’t have admin access in Slack, then skip this step.
Create a namespace “apps”, and applications and load testing service will be deployed into this namespace.
kubectl create ns apps
Create a deployment and a horizontal pod autoscaler for your custom application or service for which canary deployment will be done.
kubectl -n apps apply -k app
kubectl get deployment -A
kubectl get hpa -n apps
Deploy the load testing service to generate traffic during the canary analysis.
kubectl -n apps apply -k tester
kubectl get deployment -A
kubectl get svc -n apps
Use apps-vs.yaml to create a Gloo virtual service definition that references a route table that will be generated by Flagger.
kubectl apply -f ./apps-vs.yaml
kubectl get vs -n apps
[Optional] If you have your own domain name, then open apps-vs.yaml in vi editor and replace podinfo.example.com with your own domain name to run the app in that domain.
Use canary.yaml to create a canary custom resource. Review the service, analysis, and metrics sections of the canary.yaml file.
kubectl apply -f ./canary.yaml
After a couple of seconds, Flagger will create the canary objects. When the bootstrap finishes, Flagger will set the canary status to “Initialized”.
kubectl -n apps get canary podinfo
NAME STATUS WEIGHT LASTTRANSITIONTIME
podinfo Initialized 0 2023-xx-xxTxx:xx:xxZ
Gloo automatically creates an ELB. Once the load balancer is provisioned and health checks pass, we can find the sample application at the load balancer’s public address. Note down the ELB’s Public address:
kubectl get svc -n gloo-system --field-selector 'metadata.name==gateway-proxy' -o=jsonpath='{.items[0].status.loadBalancer.ingress[0].hostname}{"\n"}'
Validate if your application is running, and you’ll see an output with version 6.0.0.
curl <load balancer’s public address> -H "Host:podinfo.example.com"
Trigger progressive deployments and monitor the status
You can Trigger a canary deployment by updating the application container image from 6.0.0 to 6.01.
kubectl -n apps set image deployment/podinfo podinfod=<ECR URI>:6.0.1
Flagger detects that the deployment revision changed and starts a new rollout.
kubectl -n apps describe canary/podinfo
Monitor all canaries, as the promoted status condition can have one of the following statuses: initialized, Waiting, Progressing, Promoting, Finalizing, Succeeded, and Failed.
watch kubectl get canaries --all-namespaces
curl < load balancer’s public address> -H "Host:podinfo.example.com"
Once canary is completed, validate your application. You can see that the version of the application is changed from 6.0.0 to 6.0.1.
[Optional] Open podinfo application from the laptop browser
Find out both of the IP addresses associated with load balancer.
dig < load balancer’s public address >
Open /etc/hosts file in the laptop and add both of the IPs of load balancer in the host file.
sudo vi /etc/hosts
<Public IP address of LB Target node> podinfo.example.com
e.g.
xx.xx.xxx.xxx podinfo.example.com
xx.xx.xxx.xxx podinfo.example.com
Type “podinfo.example.com” in your browser and you’ll find the application in form similar to this:
Figure 1: Greetings from podinfo v6.0.1
Automated rollback
While doing the canary analysis, you’ll generate HTTP 500 errors and high latency to check if Flagger pauses and rolls back the faulted version. Flagger performs automatic Rollback in the case of failure.
Introduce another canary deployment with podinfo image version 6.0.2 and monitor the status of the canary.
kubectl -n apps set image deployment/podinfo podinfod=<ECR URI>:6.0.2
Run HTTP 500 errors or a high-latency error from a separate terminal window.
Generate HTTP 500 errors:
watch curl -H 'Host:podinfo.example.com' <load balancer’s public address>/status/500
Generate high latency:
watch curl -H 'Host:podinfo.example.com' < load balancer’s public address >/delay/2
When the number of failed checks reaches the canary analysis threshold, the traffic is routed back to the primary, the canary is scaled to zero, and the rollout is marked as failed.
kubectl get canaries --all-namespaces
kubectl -n apps describe canary/podinfo
Cleanup
When you’re done experimenting, you can delete all of the resources created during this series to avoid any additional charges. Let’s walk through deleting all of the resources used.
Delete Amazon EKS Cluster After you’ve finished with the cluster and nodes that you created for this tutorial, you should clean up by deleting the cluster and nodes with the following command:
This post explained the process for setting up Amazon EKS cluster and how to leverage Flagger for progressive deployments along with Prometheus and Gloo Ingress Controller. You can enhance the deployments by integrating Flagger with Slack, Datadog, and webhook notifications for progressive deployments. Amazon EKS removes the undifferentiated heavy lifting of managing and updating the Kubernetes cluster. Managed node groups automate the provisioning and lifecycle management of worker nodes in an Amazon EKS cluster, which greatly simplifies operational activities such as new Kubernetes version deployments.
We encourage you to look into modernizing your DevOps platform from monolithic architecture to microservice-based architecture with Amazon EKS, and leverage Flagger with the right Ingress controller for secured and automated service releases.
Further Reading
Journey to adopt Cloud-Native DevOps platform Series #1: OfferUp modernized DevOps platform with Amazon EKS and Flagger to accelerate time to market
Customers storing data in Backblaze B2 Cloud Storage enjoy zero-cost downloads via our Content Delivery Network (CDN) partners: Cloudflare, Fastly, and Bunny.net. Configuring a CDN to proxy access to a Backblaze B2 Bucket is straightforward and improves the user experience, since the CDN caches data close to end-users. Ensuring that end-users can only access content via the CDN, and not directly from the bucket, requires a little more effort. A new technical article, Cloudflare Workers for Backblaze B2, provides the steps to serve content from Backblaze B2 via your own Cloudflare Worker.
In this blog post, I’ll explain why you might want to prevent direct downloads from your Backblaze B2 Bucket, and how you can use a Cloudflare Worker to do so.
Why Prevent Direct Downloads?
As mentioned above, Backblaze’s partnerships with CDN providers allow our customers to deliver content to end users with zero costs for data egress from Backblaze to the CDN. To illustrate why you might want to serve data to your end users exclusively through the CDN, let’s imagine you’re creating a website, storing your website’s images in a Backblaze B2 Bucket with public-read access, acme-images.
For the initial version, you build web pages with direct links to the images of the form https://acme-images.s3.us-west-001.backblazeb2.com/logos/acme.png. As users browse your site, their browsers will download images directly from Backblaze B2. Everything works just fine for users near the Backblaze data center hosting your bucket, but the further a user is from that data center, the longer it will take each image to appear on screen. No matter how fast the network connection, there’s no getting around the speed of light!
Aside from the degraded user experience, there are costs associated with end users downloading data directly from Backblaze. The first GB of data downloaded each day is free, then we charge $0.01 for each subsequent GB. Depending on your provider’s pricing plan, adding a CDN to your architecture can both reduce download costs and improve the user experience, as the CDN will transfer data through its own network and cache content close to end users. Another detail to note when comparing costs is that Backblaze and Cloudflare’s Bandwidth Alliance means that data flows from Backblaze to Cloudflare free of download charges, unlike data flowing from, for example, Amazon S3 to Cloudflare.
Typically, you need to set up a custom domain, say images.acme.com, that resolves to an IP address at the CDN. You then configure one or more origin servers or backends at the CDN with your Backblaze B2 Buckets’ S3 endpoints. In this example, we’ll use a single bucket, with endpoint acme-images.s3.us-west-001.backblazeb2.com, but you might use Cloud Replication to replicate content between buckets in multiple regions for greater resilience.
Now, after you update the image links in your web pages to the form https://images.acme.com/logos/acme.png, your users will enjoy an improved experience, and your operating costs will be reduced.
As you might have guessed, however, there is one chink in the armor. Clients can still download images directly from the Backblaze B2 Bucket, incurring charges on your Backblaze account. For example, users might have bookmarked or shared links to images in the bucket, or browsers or web crawlers might have cached those links.
The solution is to make the bucket private and create an edge function: a small piece of code running on the CDN infrastructure at the images.acme.com endpoint, with the ability to securely access the bucket.
Both Cloudflare and Fastly offer edge computing platforms; in this blog post, I’ll focus on Cloudflare Workers and cover Fastly Compute@Edge at a later date.
Proxying Backblaze B2 Downloads With a Cloudflare Worker
API clients, such as Workers, downloading data from a private Backblaze B2 Bucket via the Backblaze S3 Compatible API must digitally sign each request with a Backblaze Application Key ID (access key ID in AWS parlance) and Application Key (secret access key). On receiving a signed request, the Backblaze B2 service verifies the identity of the sender (authentication) and that the request was not changed in transit (integrity) before returning the requested data.
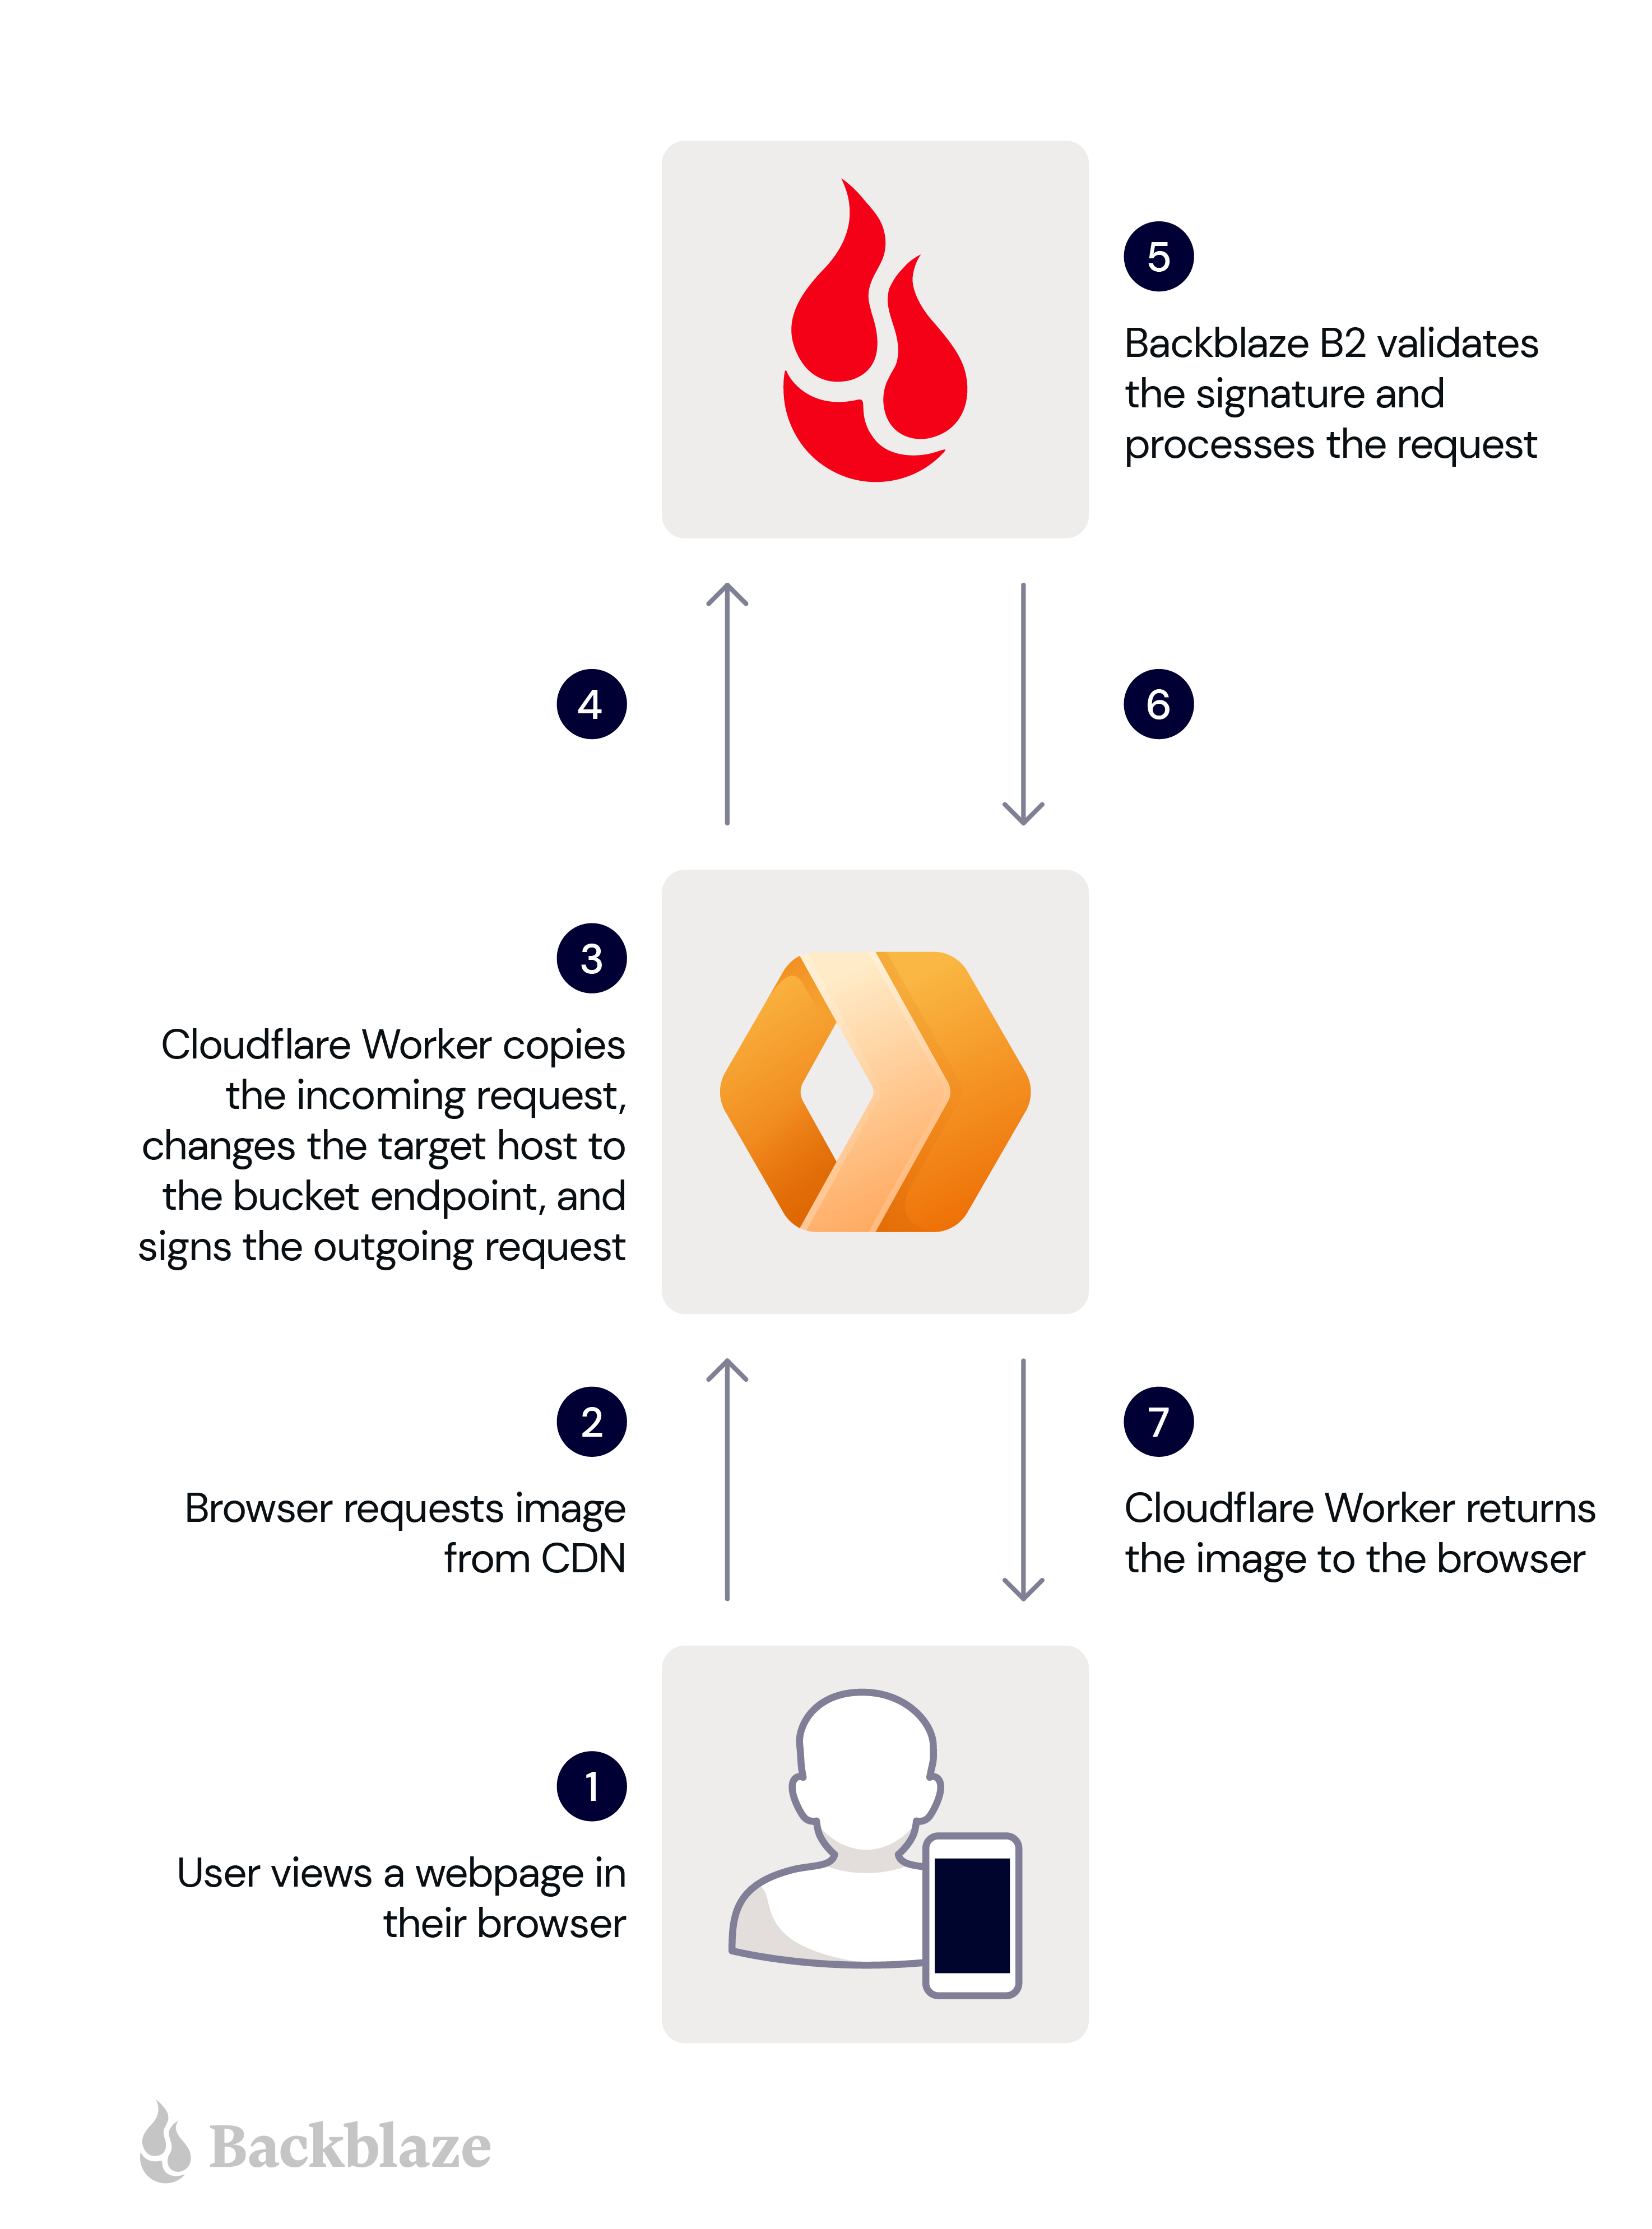
So when the Worker receives an unsigned HTTP request from an end user’s browser, it must sign it, forward it to Backblaze B2, and return the response to the browser. Here are the steps in more detail:
A user views a web page in their browser.
The user’s browser requests an image from the Cloudflare Worker.
The Worker makes a copy of the incoming request, changing the target host in the copy to the bucket endpoint, and signs the copy with its application key and key ID.
The Worker sends the signed request to Backblaze B2.
Backblaze B2 validates the signature, and processes the request.
Backblaze B2 returns the image to the Worker.
The Worker forwards the image to the user’s browser.
These steps are illustrated in the diagram below.
The signing process imposes minimal overhead, since GET requests have no payload. The Worker need not even read the incoming response payload into memory, instead returning the response from Backblaze B2 to the Cloudflare Workers framework to be streamed directly to the user’s browser.
Now you understand the use case, head over to our newly published technical article, Cloudflare Workers for Backblaze B2, and follow the steps to serve content from Backblaze B2 via your own Cloudflare Worker.
Put the Proxy to Work!
The Cloudflare Worker for Backblaze B2 can be used as-is to ensure that clients download files from one or more Backblaze B2 Buckets via Cloudflare, rather than directly from Backblaze B2. At the same time, it can be readily adapted for different requirements. For example, the Worker could verify that clients pass a shared secret in an HTTP header, or route requests to buckets in different data centers depending on the location of the edge server. The possibilities are endless.
This post is co-authored with Girish Kumar Chidananda from redBus.
redBus is one of the earliest adopters of AWS in India, and most of its services and applications are hosted on the AWS Cloud. AWS provided redBus the flexibility to scale their infrastructure rapidly while keeping costs extremely low. AWS has a comprehensive suite of services to cater to most of their needs, including providing customer support that redBus can vouch for.
In this post, we share redBus’s data platform architecture, and how various components are connected to form their data highway. We also discuss the challenges redBus faced in building dashboards for their real-time business intelligence (BI) use cases, and how they used Amazon QuickSight, a fast, easy-to-use, cloud-powered business analytics service that makes it easy for all employees within redBus to build visualizations and perform ad hoc analysis to gain business insights from their data, any time, and on any device.
About redBus
redBus is the world’s largest online bus ticketing platform built in India and serving more than 36 million happy customers around the world. Along with its bus ticketing vertical, redBus also runs a rail ticketing service called redRails and a bus and car rental service called rYde. It is part of the GO-MMT group, which is India’s leading online travel company, with an extensive brand portfolio that includes other prominent online travel brands like MakeMyTrip and Goibibo.
redBus’s data highway 1.0
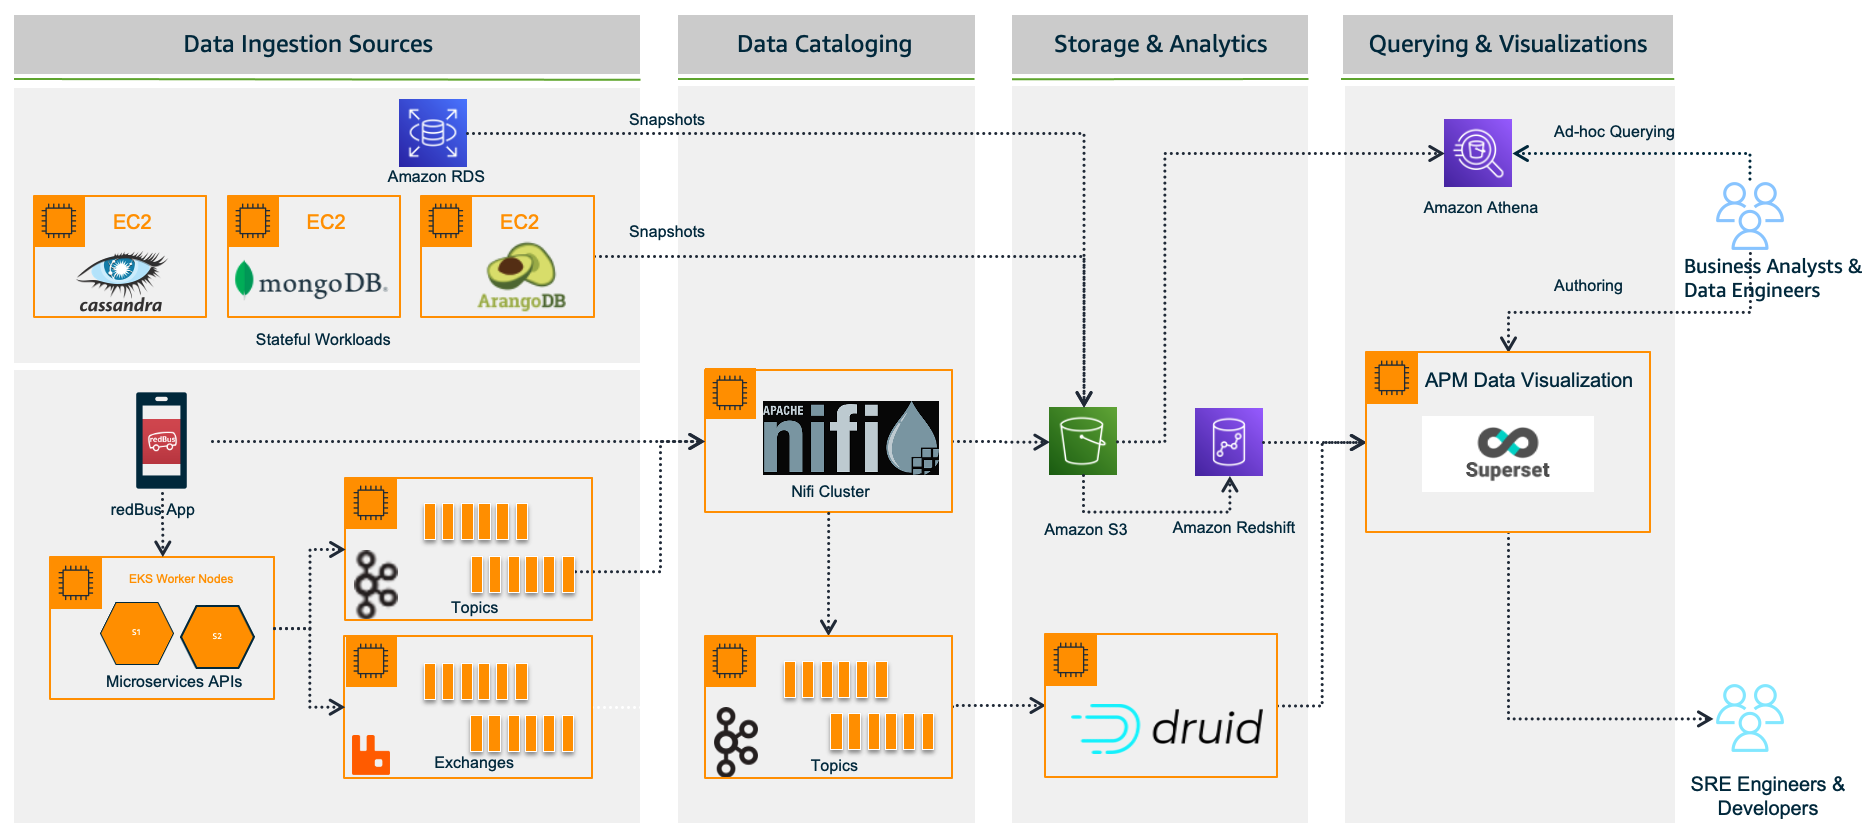
redBus relies heavily on making data-driven decisions at every level, from its traveler journey tracking, forecasting demand during high traffic, identifying and addressing bottlenecks in their bus operators signup process, and more. As redBus’s business started growing in terms of the number of cities and countries they operated in and the number of bus operators and travelers using the service in each city, the amount of incoming data also increased. The need to access and analyze the data in one place required them to build their own data platform, as shown in the following diagram.
In the following sections, we look at each component in more detail.
Data ingestion sources
With the data platform 1.0, the data is ingested from various sources:
Real time – The real-time data flows from redBus mobile apps, the backend microservices, and when a passenger, bus operator, or application does any operation like booking bus tickets, searching the bus inventory, uploading a KYC document, and more
Batch mode – Scheduled jobs fetch data from multiple persistent data stores like Amazon Relational Database Service (Amazon RDS), where the OLTP data from all its applications are stored, Apache Cassandra clusters, where the bus inventory from various operators is stored, Arango DB, where the user identity graphs are stored, and more
Data cataloging
The real-time data is ingested into their self-managed Apache Nifi clusters, an open-source data platform that is used to clean, analyze, and catalog the data with its routing capabilities before sending the data to its destination.
Storage and analytics
redBus uses the following services for its storage and analytical needs:
Amazon Simple Storage Service (Amazon S3), an object storage service that provides the foundation for their data lake because of its virtually unlimited scalability and higher durability. Real-time data flows from Apache Druid and data from the data stores flow at regular intervals based on the schedules.
Apache Druid, an OLAP-style data store (data flows via Kafka Druid data loader), which computes facts and metrics against various dimensions during the data loading process.
Amazon Redshift, a cloud data warehouse service that helps you analyze exabytes of data and run complex analytical queries. redBus uses Amazon Redshift to store the processed data from Amazon S3 and the aggregated data from Apache Druid.
Querying and visualization
To make redBus as data-driven as possible, they ensured that the data is accessible to their SRE engineers, data engineers, and business analysts via a visualization layer. This layer features dashboards being served using Apache SuperSet, an open-source data visualization application, and Amazon Athena, an interactive query service to analyze data in Amazon S3 using standard SQL for ad hoc querying requirements.
The challenges
Initially, redBus handled data that was being ingested at the rate of 10 million events per day. Over time, as its business started growing, so did the data volume (from gigabytes to terabytes to petabytes), data ingestion per day (from 10 million to 320 million events), and its business intelligence dashboard needs. Soon after, they started facing challenges with their self-managed Superset’s BI capabilities, and the increased operational complexities.
Limited BI capabilities
redBus encountered the following BI limitations:
Inability to create visualizations from multiple data sources – Superset doesn’t allow creating visualizations from multiple tables within its data exploration layer. redBus data engineers had to have the tables joined beforehand at the data source level itself. In order to create a 360-degree view for redBus’s business stakeholders, it became inconvenient for data engineers to maintain multiple tables supporting the visualization layer.
No global filter for visuals in a dashboard – A global or primary filter across visuals in a dashboard is not supported in Superset. For example, consider there are visuals like Sales Wins by Region, YTD Revenue Realized by Region, Sales Pipeline by Region, and more in a dashboard, and a filter Region is added to the dashboard with values like EMEA, APAC, and US. The filter Region will only apply to one of the visuals, not the entire dashboard. However, dashboard users expected filtering across the dashboard.
Not a business-user friendly tool – Superset is highly developer centric when it comes to customization. For example, if a redBus business analyst had to customize a timed refresh that automatically re-queries every slice on a dashboard according to a pre-set value, then the analyst has to update the dashboard’s JSON metadata field. Therefore, having knowledge of JSON and its syntax is mandatory for doing any customization on the visuals or dashboard.
Increased operational cost
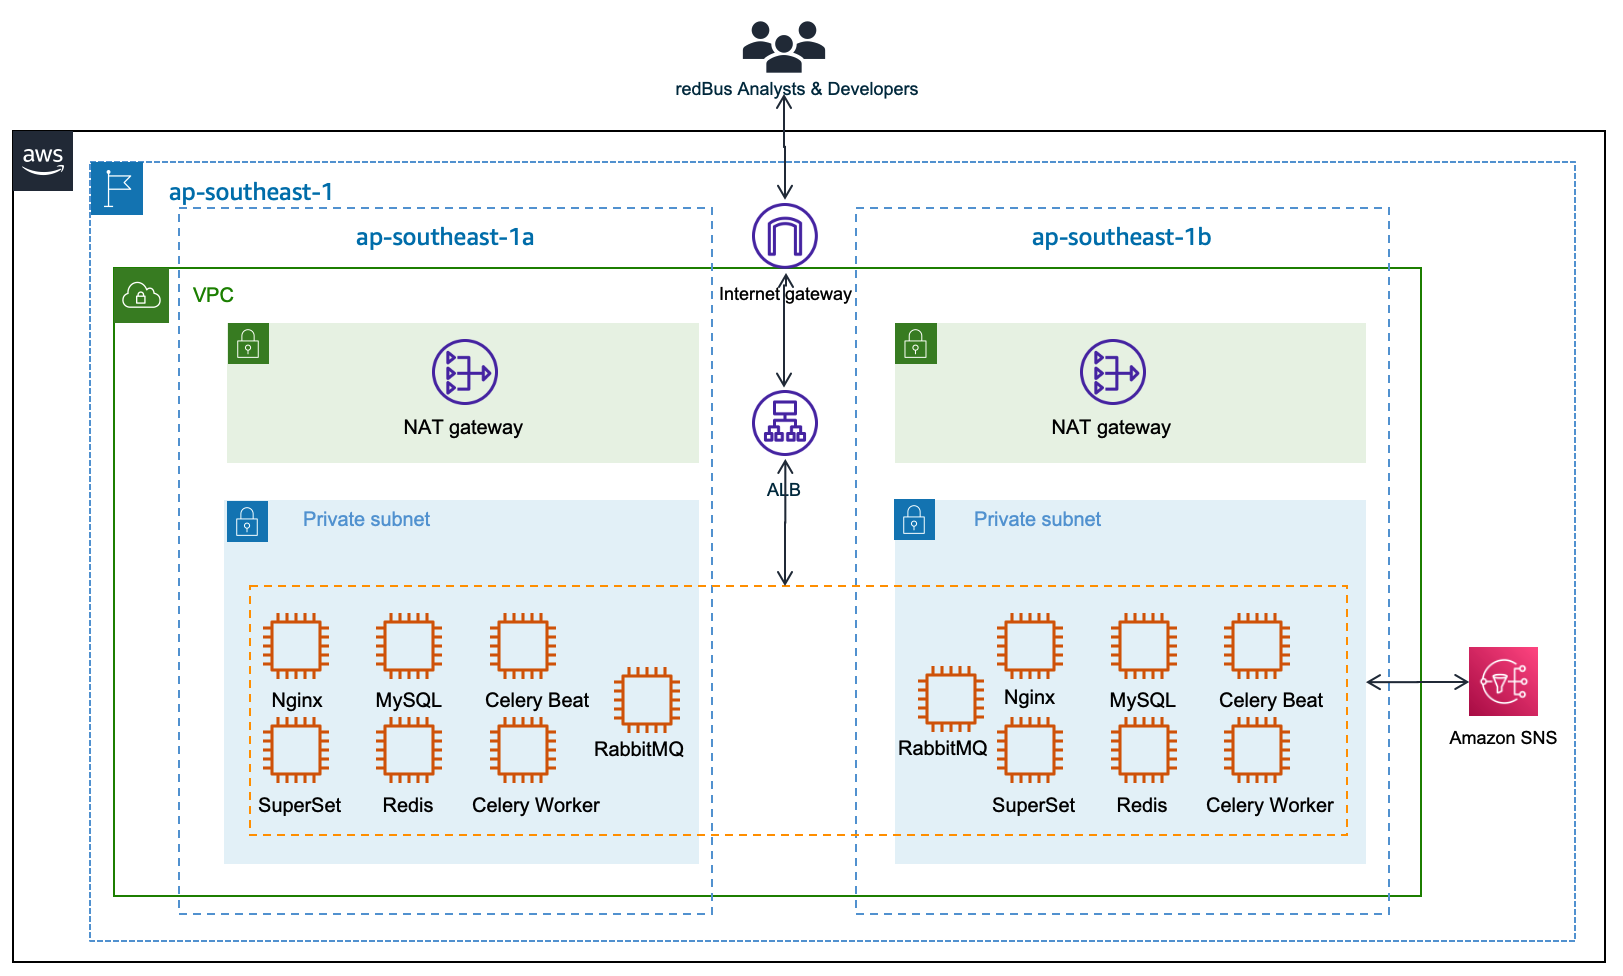
Although Superset is open source, which means there are no licensing costs, it also means there is more effort in maintaining all the components required for it to function as an enterprise-grade BI tool. redBus has deployed and maintained a web server (Nginx) fronted by an Application Load Balancer to do the load balancing; a metadata database server (MySQL) where Superset stores its internal information like users, slices, and dashboard definitions; an asynchronous task queue (Celery) for supporting long-running queries; a message broker (RabbitMQ); and a distributed caching server (Redis) for caching the results, charting data, and more on Amazon Elastic Compute Cloud (Amazon EC2) instances. The following diagram illustrates this architecture.
redBus’s DevOps team had to do the heavy lifting of provisioning the infrastructure, taking backups, scaling the components manually as needed, upgrading the components individually, and more. It also required a Python web developer to be around for making the configurational changes so all the components work together seamlessly. All these manual operations increased the total cost of ownership for redBus.
Journey towards QuickSight
redBus started exploring BI solutions primarily around a couple of its dashboarding requirements:
BI dashboards for business stakeholders and analysts, where the data is sourced via Amazon S3 and Amazon Redshift.
A real-time application performance monitoring (APM) dashboard to help their SRE engineers and developers identify the root cause of an issue in their microservices deployment so they can fix the issues before they affect their customer’s experience. In this case, the data is sourced via Druid.
QuickSight fit into most of redBus’s BI dashboard requirements, and in no time their data platform team started with a proof of concept (POC) for a couple of their complex dashboards. At the end of the POC, which spanned a month’s time, the team shared their findings.
First, QuickSight is rich in BI capabilities, including the following:
It’s a self-service BI solution with drag-and-drop features that could help redBus analysts comfortably use it without any coding efforts.
Visualizations from multiple data sources in a single dashboard could help redBus business stakeholders get a 360-degree view of sales, forecasting, and insights in a single pane of glass.
Cascading filters across visuals and across sheets in a dashboard are much-needed features for redBus’s BI requirements.
QuickSight offers Excel-like visuals—tables with calculations, pivot tables with cell grouping, and styling are attractive for the viewers.
The Super-fast, Parallel, In-memory Calculation Engine (SPICE) in QuickSight could help redBus scale to hundreds of thousands of users, who can all simultaneously perform fast interactive analysis across a wide variety of AWS data sources.
Off-the-shelf ML insights and forecasting at no additional cost would allow redBus’s data science team to focus on ML models besides sales forecasting and similar models.
Built-in row-level security (RLS) could allow redBus to grant filtered access for their viewers. For example, redBus has many business analysts who manage different countries. With RLS, each business analyst only sees data related to their assigned country within a single dashboard.
redBus uses OneLogin as its identity provider, which supports Security Assertion Markup Language 2.0 (SAML 2.0). With the help of identity federation and single sign-on support from QuickSight, redBus could provide a simple onboarding flow for their QuickSight users.
QuickSight offers built-in alerts and email notification capabilities.
Secondly, QuickSight is a fully managed, cloud-native, serverless BI service offering from AWS, with the following features:
redBus engineers don’t need to focus on the heavy lifting of provisioning, scaling, and maintaining their BI solution on EC2 instances.
QuickSight offers native integration with AWS services like Amazon Redshift, Amazon S3, and Athena, and other popular frameworks like Presto, Snowflake, Teradata, and more. QuickSight connects to most of the data sources that redBus already has except Apache Druid, because native integration with Druid was not available as of December 2022. For a complete list of the supported data sources, see Supported data sources.
The outcome
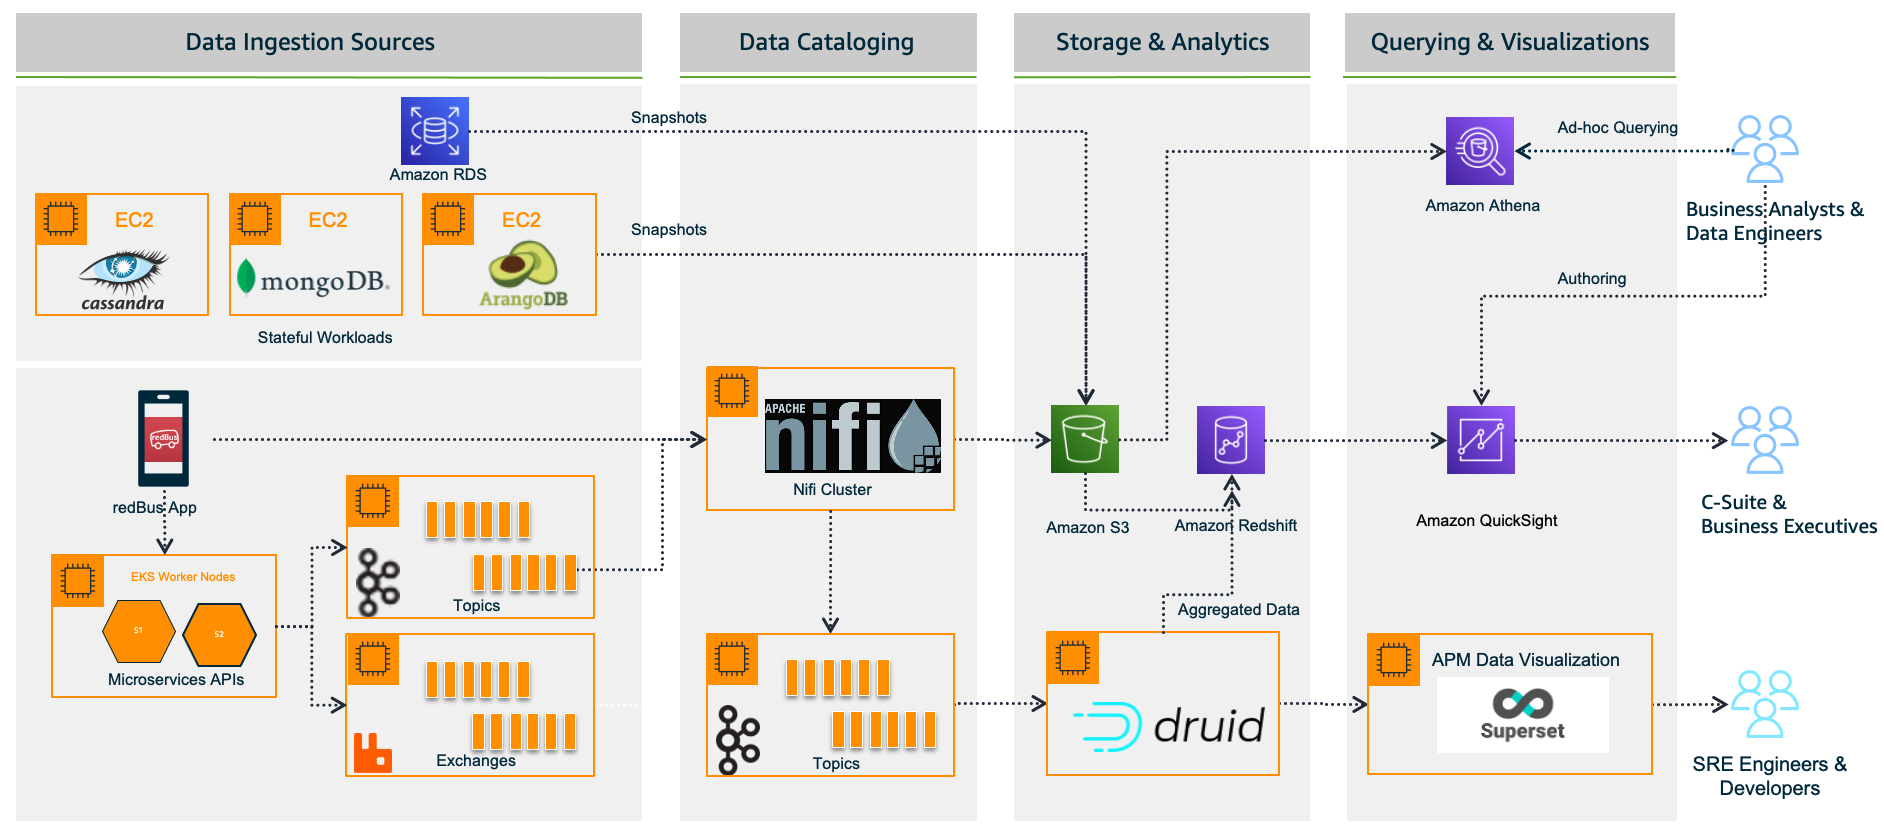
Considering all the rich features and lower total cost of ownership, redBus chose QuickSight for their BI dashboard requirements. With QuickSight, redBus’s data engineers have built a number of dashboards in no time to give insights from petabytes of data to business stakeholders and analysts. The redBus data highway evolved to bring business intelligence to a much wider audience in their organization, with better performance and faster time-to-value. As of November 2022, it combines QuickSight for business users and Superset for real-time APM dashboards (at the time of writing, QuickSight doesn’t offer a native connector to Druid), as shown in the following diagram.
Sales anomaly detection dashboard
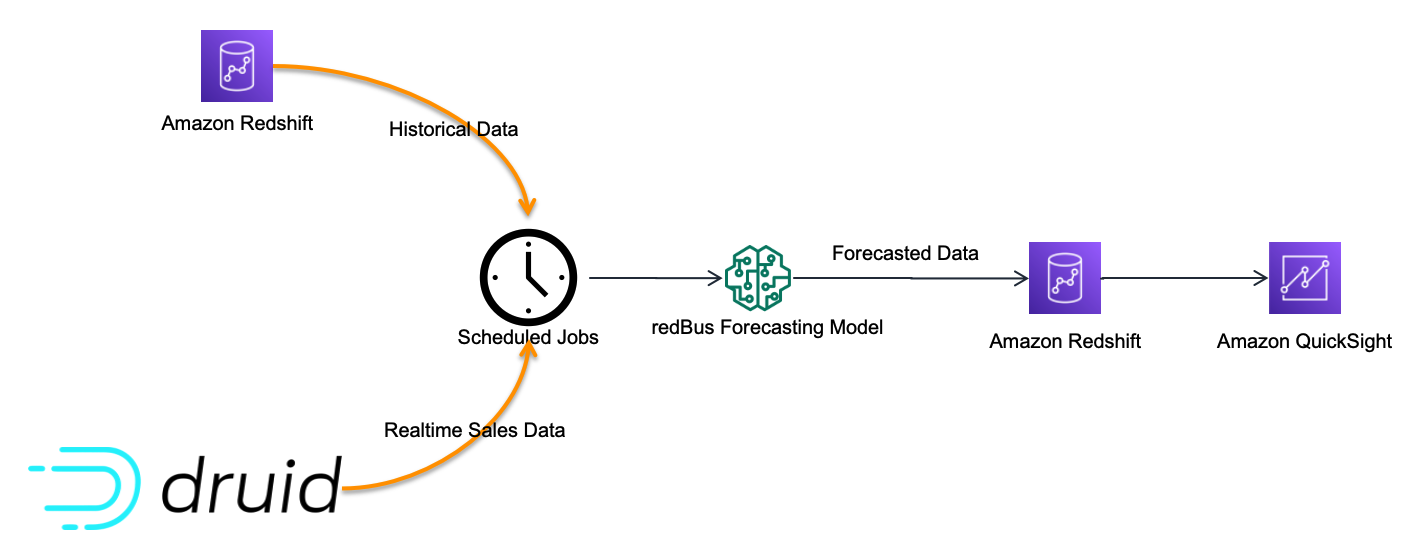
Although there are many dashboards that redBus deployed to production, sales anomaly detection is one of the interesting dashboards that redBus built. It uses redBus’s proprietary sales forecasting model, which in turn is sourced by historical sales data from Amazon Redshift tables and real-time sales data from Druid tables, as shown in the following figure.
At regular intervals, the scheduled jobs feed the redBus forecasting model with real-time and historical sales data, and then the forecasted data is pushed into an Amazon Redshift table. The sales anomaly detection dashboard in QuickSight is served by the resultant Amazon Redshift table.
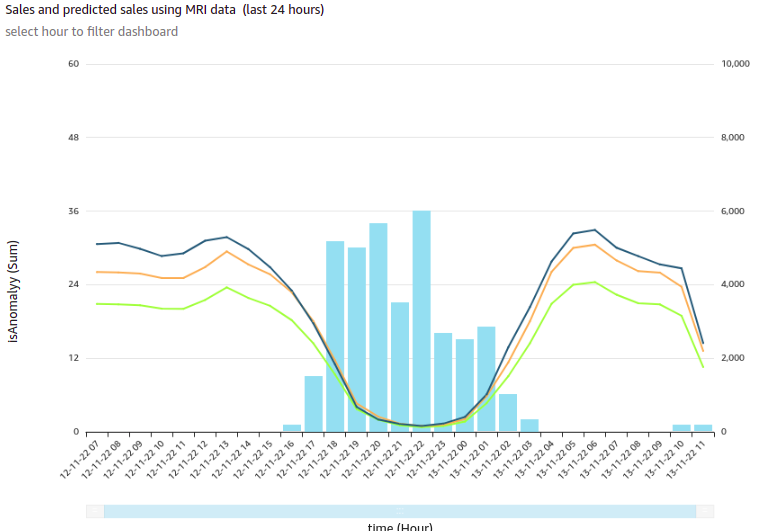
The following is one of the visuals from the sales anomaly detection dashboard. It’s built using a line chart representing hourly actual sales, predicted sales, and an alert threshold for a time series for a particular business cohort in redBus.
In this visual, each bar represents the number of sales anomalies triggered at a particular point in the time series.
redBus’s analysts could further drill down to the sales details and anomalies at the minute level, as shown in the following diagram. This drill-down feature comes out of the box with QuickSight.
Apart from the visuals, it has become one of viewers’ favorite dashboards at redBus due to the following notable features:
Because filtering across visuals is an out-of-the-box feature in QuickSight, a timestamp-based filter is added to the dashboard. This helps in filtering multiple visuals in the dashboard in a single click.
URL actions configured on the visuals help the viewers navigate to the context-sensitive in-house applications.
Email alerts configured on KPIs and Gauge visuals help the viewers get notifications on time.
Next steps
Apart from building new dashboards for their BI dashboard needs, redBus is taking the following next steps:
Exploring QuickSight Embedded Analytics for a couple of their application requirements to accelerate time to insights for users with in-context data visuals, interactive dashboards, and more directly within applications
Exploring QuickSight Q, which could enable their business stakeholders to ask questions in natural language and receive accurate answers with relevant visualizations that can help them gain insights from the data
Building a unified dashboarding solution using QuickSight covering all their data sources as integrations become available
Conclusion
In this post, we showed you how redBus built its data platform using various AWS services and Apache frameworks, the challenges the platform went through (especially in their BI dashboard requirements and challenges while scaling), and how they used QuickSight and lowered the total cost of ownership.
To know more about engineering at redBus, check out their medium blog posts. To learn more about what is happening in QuickSight or if you have any questions, reach out to the QuickSight Community, which is very active and offers several resources.
About the Authors
Girish Kumar Chidananda works as a Senior Engineering Manager – Data Engineering at redBus, where he has been building various data engineering applications and components for redBus for the last 5 years. Prior to starting his journey in the IT industry, he worked as a Mechanical and Control systems engineer in various organizations, and he holds an MS degree in Fluid Power Engineering from University of Bath.
Kayalvizhi Kandasamy works with digital-native companies to support their innovation. As a Senior Solutions Architect (APAC) at Amazon Web Services, she uses her experience to help people bring their ideas to life, focusing primarily on microservice architectures and cloud-native solutions using AWS services. Outside of work, she likes playing chess and is a FIDE rated chess player. She also coaches her daughters the art of playing chess, and prepares them for various chess tournaments.
The collective thoughts of the interwebz
Manage Consent
To provide the best experiences, we use technologies like cookies to store and/or access device information. Consenting to these technologies will allow us to process data such as browsing behavior or unique IDs on this site. Not consenting or withdrawing consent, may adversely affect certain features and functions.
Functional
Always active
The technical storage or access is strictly necessary for the legitimate purpose of enabling the use of a specific service explicitly requested by the subscriber or user, or for the sole purpose of carrying out the transmission of a communication over an electronic communications network.
Preferences
The technical storage or access is necessary for the legitimate purpose of storing preferences that are not requested by the subscriber or user.
Statistics
The technical storage or access that is used exclusively for statistical purposes.The technical storage or access that is used exclusively for anonymous statistical purposes. Without a subpoena, voluntary compliance on the part of your Internet Service Provider, or additional records from a third party, information stored or retrieved for this purpose alone cannot usually be used to identify you.
Marketing
The technical storage or access is required to create user profiles to send advertising, or to track the user on a website or across several websites for similar marketing purposes.