Save orchards from pests with Raspberry Pi

Post Syndicated from Ashley Whittaker original https://www.raspberrypi.org/blog/save-orchards-from-pests-with-raspberry-pi/

Researchers from the University of Trento have developed a Raspberry Pi-powered device that automatically detects pests in fruit orchards so they can get sorted out before they ruin a huge amount of crop. There’s no need for farmer intervention either, saving their time as well as their harvest.

orchard pest detection prototype
One of the prototypes used during indoor testing

The researchers devised an embedded system that uses machine learning to process images captured inside pheromone traps. The pheromones lure the potential pests in to have their picture taken.

Hardware

Each trap is built on a custom hardware platform that comprises:

  • Sony IMX219 image sensor to collect images (chosen because it’s small and low-power)
  • Intel Neural Compute module for machine learning optimisation
  • Long-range radio chip for communication
  • Solar energy-harvesting power system
Fig. 2: Solar energy harvester and power management circuit schematic block.
Here’s a diagram showing how all the hardware works together

The research paper mentions that Raspberry Pi 3 was chosen because it offered the best trade-off between computing capability, energy demand, and cost. However, we don’t know which Raspberry Pi 3 they used. But we’re chuffed nonetheless.

How does it work?

The Raspberry Pi computer manages the sensor, processing the captured images and transmitting them for classification.

Then the Intel Neural Compute Stick is activated to perform the machine learning task. It provides a boost to the project by reducing the inference time, so we can tell more quickly whether a potentially disruptive bug has been caught, or just a friendly bug.

In this case, it’s codling moths we want to watch out for. They are major pests to agricultural crops, mainly fruits, and they’re the reason you end up with apples that look like they’ve been feasted on by hundreds of maggots.

codling moth detection
Red boxes = bad codling moths
Blue boxes = friendly bugs

When this task is done manually, farmers typically check codling moth traps twice a week. But this automated system checks the pheromone traps twice every day, making it much more likely to detect an infestation before it gets out of hand.

The brains behind the project

This work was done by Andrea Albanese, Matteo Nardello and Davide Brunelli from the University of Trento. All the images used here are from the full research paper, Automated Pest Detection with DNN on the Edge for Precision Agriculture, which you can read for free.

The post Save orchards from pests with Raspberry Pi appeared first on Raspberry Pi.

Cro: Maintain it With Zig

Post Syndicated from original https://lwn.net/Articles/868781/rss

This blog post by
Loris Cro
makes the claim that the Zig
language
is
the solution to a lot of low-level programming problems:

Freeing the art of systems programming from the grips of C/C++
cruft is the only way to push for real change in our industry, but
rewriting everything is not the answer. In the Zig project we’re
making the C/C++ ecosystem more fun and productive. Today we have a
compiler, a linker and a build system, and soon we’ll also have a
package manager, making Zig a complete toolchain that can fetch
dependencies and build C/C++/Zig projects from any target, for any
target.

(LWN looked at Zig last year).

Embed multi-tenant dashboards in SaaS apps using Amazon QuickSight without provisioning or managing users

Post Syndicated from Raji Sivasubramaniam original https://aws.amazon.com/blogs/big-data/embed-multi-tenant-dashboards-in-saas-apps-using-amazon-quicksight-without-provisioning-or-managing-users/

Amazon QuickSight is a fully-managed, cloud-native business intelligence (BI) service that makes it easy to connect to your data, create interactive dashboards, and share these with tens of thousands of users, either within QuickSight itself, or embedded in software as a service (SaaS) apps.

QuickSight Enterprise Edition recently added row-level security (RLS) using tags, a new feature that allows developers to share a single dashboard with tens of thousands of users, while ensuring that each user can only see and have access to particular data. This means that when an independent software vendor (ISV) adds a QuickSight-embedded dashboard in their app, they don’t have to provision their end-users in QuickSight, and can simply set up tags to filter data based on who the dashboard is being served to. For example, if an ISV wanted to set up a dashboard that was to be shared with 20,000 users across 100 customers of an app, with all users within a customer having access to identical data, this new feature allows you to share a single dashboard for all users, without having to set up or manage the 20,000 users in QuickSight.

RLS enforced using tags makes sure that each end-user only sees data that is relevant to them, while QuickSight automatically scales to meet user concurrency to ensure every end-user sees consistently fast performance. In this post, we look at how this can be implemented.

Solution overview

To embed dashboards without user provisioning, we use the API GenerateEmbedURLForAnonymousUser, which works with QuickSight’s session capacity pricing. With this API, the embedding server (logic in the SaaS app) determines and manages the identity of the user to whom the dashboard is being displayed (as opposed to this identity being provisioned and managed within QuickSight).

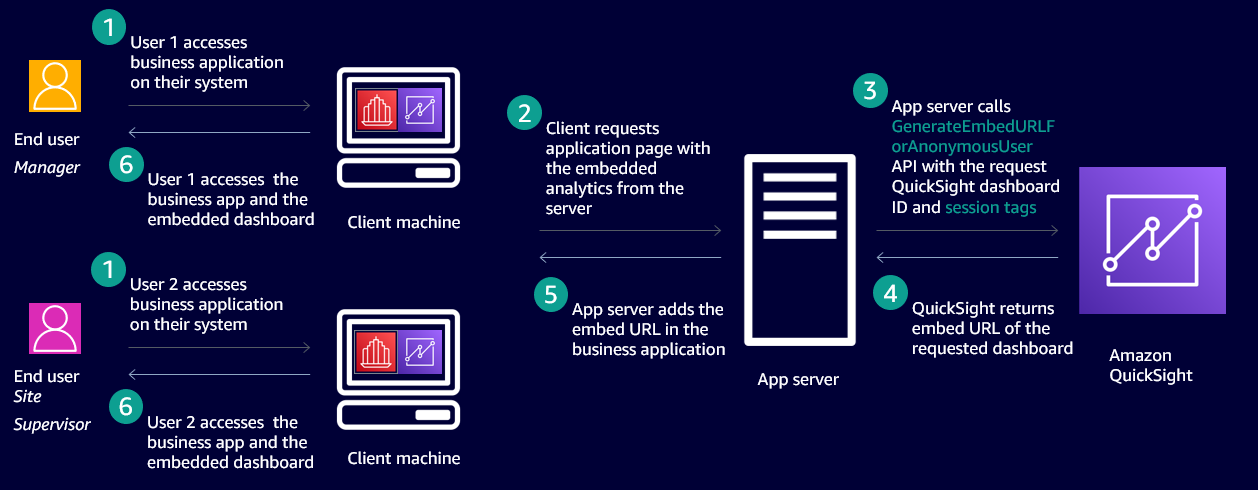
The following diagram shows an example workflow of embedded dashboards that secures data based on who is accessing the application using RLS with tags.

In this case, an ISV has a SaaS application that is accessed by two end-users. One is a manager and other is a site supervisor. Both users access the same application and the same QuickSight dashboard embedded in the application and they’re not provisioned in QuickSight. When the site supervisor accesses the dashboard, they only see data pertaining to their site, and when the manager accesses the dashboard, they see data pertaining to all the sites they manage.

To achieve this behavior, we use a new feature that enables configuring the row-level security using tags. This method of securing data on embedded dashboards works only when dashboards are embedded without user provisioning (also called anonymous embedding). The process includes two steps:

  1. Set up tag keys on the columns of the datasets used to build the dashboard.
  2. Set values for the tag keys at runtime when embedding the dashboard anonymously.

Set up tag keys on columns in the datasets used to build the dashboard

ISVs or developers can set columns on the datasets using the CreateDataset or UpdateDataset APIs as follows:

create-data-set
--aws-account-id 
--data-set-id 
--name 
--physical-table-map 
[--logical-table-map ]
--import-mode 
[--column-groups ]
[--field-folders ]
[--permissions ]
[--row-level-permission-data-set ]
[--column-level-permission-rules ]
[--tags ]
[--cli-input-json ]
[--generate-cli-skeleton ]
[--row-level-permission-tag-configuration //upto 50 tagkeys can be added at this time
    '{
       "Status": "ENABLED",
       "TagRules": 
        [
            {
               "TagKey": "tag_name_1", //upto 128 characters
               "ColumnName": "column_name_1",
               "TagMultiValueDelimiter": ",",
               "MatchAllValue": "*"
            },
            {
               "TagKey": "tag_name_2", //upto 128 characters
               "ColumnName": "column_name_2"
            }
        ]
    }'
]
update-data-set
--aws-account-id <value>
--data-set-id <value>
--name <value>
--physical-table-map <value>
[--logical-table-map <value>]
--import-mode <value>
[--column-groups <value>]
[--field-folders <value>]
[--row-level-permission-data-set <value>]
[--column-level-permission-rules <value>]
[--cli-input-json <value>]
[--generate-cli-skeleton <value>]
[--row-level-permission-tag-configuration //upto 50 tagkeys can be added at this time
    '{
       "Status": "ENABLED",
       "TagRules": 
        [
            {
               "TagKey": "tag_name_1", //upto 128 characters
               "ColumnName": "column_name_1",
               "TagMultiValueDelimiter": ",",
               "MatchAllValue": "*"
            },
            {
               "TagKey": "tag_name_2", //upto 128 characters
               "ColumnName": "column_name_2",
               "MatchAllValue": "*"
            },
           {
               "TagKey": "tag_name_3", //upto 128 characters
               "ColumnName": "column_name_3"
           } 
        ]
    }'
]

In the preceding example code, row-level-permission-tag-configuration is the element that you can use to define tag keys on the columns of a dataset. For each tag, you can define the following optional items:

  1. TagMultiValueDelimiter – This option when set on a column enables you to pass more than one value to the tag at runtime, and the values are delimited by the string set for this option. In this sample, a comma is set as a delimiter string.
  2. MatchAllValue – This option when set on a column enables you to pass all values of a column at runtime, and the values are represented by the string set for this option. In this sample, an asterisk is set as a match all string.

After we define our tags, we can enable or disable these rules using the Status element of the API. In this case the value is set to ENABLED. To disable the rules, the value is DISABLED. After the tags are enabled, we can pass values to the tags at runtime to secure the data displayed based on who is accessing the dashboard.

Each dataset can have up to 50 tag keys.

We receive the following response for the CreateDataset or UpdateDataset API:

{
"Status": 201,
“Arn”: “string”, //ARN of the dataset
“DataSetId”: “string”, //ID of the dataset
“RequestId”: “string”
}

Enable authors to access data protected by tag keys when authoring analysis

After tags keys are set and enabled on the dataset, it is secured. Authors when using this dataset to author a dashboard don’t see any data. They must be given permissions to see any of the data in the dataset when authoring a dashboard. To give QuickSight authors permission to see data in the dataset, create a permissions file or a rules dataset. For more information, see Creating Dataset Rules for Row-Level Security. The following is an example rules dataset.

UserName column_name_1 column_name_2 column_name_3
admin/sampleauthor

In this sample dataset, we have the author’s username listed in the UserName column. The other three columns are the columns from the dataset on which we set tag keys. The values are left empty for these columns for the author added to this table. This enables the author to see all the data in these columns without any restriction when they’re authoring analyses.

Set values to the tag keys at runtime when embedding the dashboard

After the tag keys are set for columns of the datasets, developers set values to the keys at runtime when embedding the dashboard. Developers call the API GenerateDashboardEmbedURLForAnonymousUser to embed the dashboard and pass values to the tag keys in the element SessionTags, as shown in the following example code:

POST /accounts//embed-url/anonymous-user HTTP/1.1
Content-type: application/json
{
    "AwsAccountId": "string",
    "SessionLifetimeInMinutes": integer,
    "Namespace": "string", 
    "SessionTags": 
        [ 
            {
                "Key": "tag_name_1", // Length: [1-128]
                "Value": "value1, value2" // Length: [0-256]
            }
            {
               "Key": "tag_name_2", // Length: [1-128]
               "Value": "*" // Length: [0-256]
            }
            {
               "Key": "tag_name_3", // Length: [1-128]
               "Value": "value3" // Length: [0-256]
            }
        ],
    "AuthorizedResourceArns": 
        [ 
            // Length: [1-25]
            // Dashboard ARNs in the same AWS Account
            "string" 
        ],
        
        "ExperienceConfiguration": 
        {
            "Dashboard": 
            {
                "InitialDashboardId": "string" 
            }
        }
    }
} 

Because this feature secures data for users not provisioned in QuickSight, the API call is for AnonymousUser only and therefore this feature works only with the API GenerateDashboardEmbedURLForAnonymousUser.

The preceding example code has the following components:

  • For tag_name_1, you set two values (value1 and value2) using the TagMultiValueDelimiter defined when setting the tag keys (in this case, a comma).
  • For tag_name_2, you set one value as an asterisk. This enables this tag key to have all values for that column assigned because we defined asterisk as the MatchAllValue when setting a tag key on the column earlier.
  • For tag_name_3, you set one value (value3).

API response definition

The response of the API has the EmbedURL, Status, and RequestID. You can embed this URL in your HTML page. Data in this dashboard is secured based on the values passed to the tag keys when calling the embedding API GenerateDashboardEmbedURLForAnonymousUser:

  • EmbedUrl (string) – A single-use URL that you can put into your server-side webpage to embed your dashboard. This URL is valid for 5 minutes. The API operation provides the URL with an auth_code value that enables one (and only one) sign-on to a user session that is valid for up to 10 hours. This URL renders the dashboard with RLS rules applied based on the values set for the RLS tag keys.
  • Status (integer) – The HTTP status of the request.
  • RequestId (string) – The AWS request ID for this operation.

Fine-grained access control

You can achieve fine-grained access control by using dynamic AWS Identity and Access Management (IAM) policy generation. For more information, see Isolating SaaS Tenants with Dynamically Generated IAM Policies. When using the GenerateEmbedUrlForAnonymousUser API for embedding, you need to mention two resource types in the IAM policy: the namespace ARNs your anonymous users virtually belong to, and the dashboard ARNs that can be used in the AuthorizedResourceArns input parameter value. The sessions generated using this API can access the authorized resources and the ones (dashboards) shared with the namespace.

Because anonymous users are part of a namespace, any dashboards shared with the namespace are accessible to them, regardless of whether they are passed explicitly via the AuthorizedResourceArns parameter.

To allow the caller identity to generate a URL for any user and any dashboard, the Resource block of the policy can be set to *. To allow the caller identity to generate a URL for any anonymous user in a specific namespace (such as Tenant1), the Resource part of the policy can be set to arn:aws:quicksight:us-east-1:<YOUR_AWS_ACCOUNT_ID>:namespace/Tenant1. This is the same for the dashboard ID. For dynamic policy generation, you can also use placeholders for the namespace and users.

The following code is an example IAM policy:

{
  "Version": "2012-10-17",
  "Statement": [
    {
      "Sid": "QuickSightEmbeddingRole",
      "Effect": "Allow",
      "Action": [
        "quicksight:GenerateEmbedUrlForAnonymousUser"
      ],
      "Resource": [
        "arn:aws:quicksight:us-east-1::namespace/tenant1",
        "arn:aws:quicksight:us-east-1::dashboard/dashboard-id-123"
 
        // You can add specific Namespace IDs (tenant IDs), or namespace prefixes here
        // e.g. "arn:aws:quicksight:us-east-1::namespace/{{tenant-id}}" will allow the role to
        // generate embedding URL for namespace dynamically substituted
        // into the placeholder {{tenant-id}}
 
        // or "arn:aws:quicksight:us-east-1::namespace/MyTenantIdPrefix*" will allow the role to
        // generate embedding URL for namespaces having prefix MyTenantIdPrefix.
        
        
        // You can add specific Dashboard IDs, or ID prefixes here
        // e.g. "arn:aws:quicksight:us-east-1::dashboard/{{dashboard-id}}" will allow the role to
        // generate embedding URL for dashboard dynamically substituted
        // into the placeholder {{dashboard-id}}
 
        // or "arn:aws:quicksight:us-east-1::dashboard/MyDashboardIdPrefix*" will allow the role to
        // generate embedding URL for namespaces having prefix MyDashboardIdPrefix.
      ]
    }
  ]
}

Use case

OkTank is an ISV in the healthcare space. They have a SaaS application that is used by different hospitals across different regions of the country to manage their revenue. OkTank has thousands of healthcare employees accessing their application and has embedded operations related to their business in a QuickSight dashboard in their application. OkTank doesn’t want to manage their users in QuickSight separately, and wants to secure data based on which user from which hospital is accessing their application. OkTank is securing the data on the dashboards at runtime using row-level security using tags.

OkTank has hospitals (North Hospital, South Hospital, and Downtown Hospital) in regions Central, East, South, and West.

In this example, the following users access OkTank’s application and the embedded dashboard. Each user has a certain level of restriction rules that define what data they can access in the dashboards. PowerUser is a super user that can see the data for all hospitals and regions.

OkTank’s application’s user Hospital Region
NorthUser North Hospital Central and East
NorthAdmin North Hospital All regions
SouthUser South Hospital South
SouthAdmin South Hospital All regions
PowerUser All hospitals All regions

None of these users have been provisioned in QuickSight. OkTank manages these users in its own application and therefore knows which region and hospital each user belongs to. When any of these users access the embedded QuickSight dashboard in the application, OkTank must secure the data on the dashboard so that users can only see the data for their region and hospital.

First, OkTank created tag keys on the dataset they’re using to power the dashboard. In their UpdateDataset API call, the RowLevelPermissionTagConfiguration element on the dataset is as follows:

"RowLevelPermissionTagConfiguration": 
        {
            "Status": "ENABLED",
            "TagRules": [
                {
                    "TagKey": "customer_region",
                    "ColumnName": "region",
                    "TagMultiValueDelimiter": ",",
                    "MatchAllValue": "*"
                },
                {
                    "TagKey": "customer_hospital",
                    "ColumnName": "hospital",
                    "TagMultiValueDelimiter": ",",
                    "MatchAllValue": "*"
                }
            ]
        }

Second, at runtime when embedding the dashboard via the GenerateDashboardEmbedURLForAnonymousUser API, they set SessionTags for each user.

SessionTags for NorthUser in the GenerateDashboardEmbedURLForAnonymousUser API call are as follows:

"SessionTags": 
        [ 
            {
                "Key": "customer_hospital",
                "Value": "North Hospital"
            },
            {
               "Key": " customer_region",
               "Value": "Central, East"
            }
        ]

SessionTags for NorthAdmin are as follows:

"SessionTags": 
        [ 
            {
                "Key": " customer_hospital",
                "Value": "North Hospital"
            },
            {
               "Key": " customer_region",
               "Value": "*"
            }
        ]

SessionTags for SouthUser are as follows:

"SessionTags": 
        [ 
            {
                "Key": " customer_hospital",
                "Value": "South Hospital"
            },
            {
               "Key": " customer_region",
               "Value": "South"
            }
        ]

SessionTags for SouthAdmin are as follows:

"SessionTags": 
        [ 
            {
                "Key": " customer_hospital",
                "Value": "South Hospital"
            },
            {
               "Key": " customer_region",
               "Value": "*"
            }
        ]

SessionTags for PowerUser are as follows:

"SessionTags": 
        [ 
            {
                "Key": " customer_hospital",
                "Value": "*"
            },
            {
               "Key": " customer_region",
               "Value": "*"
            }
        ]

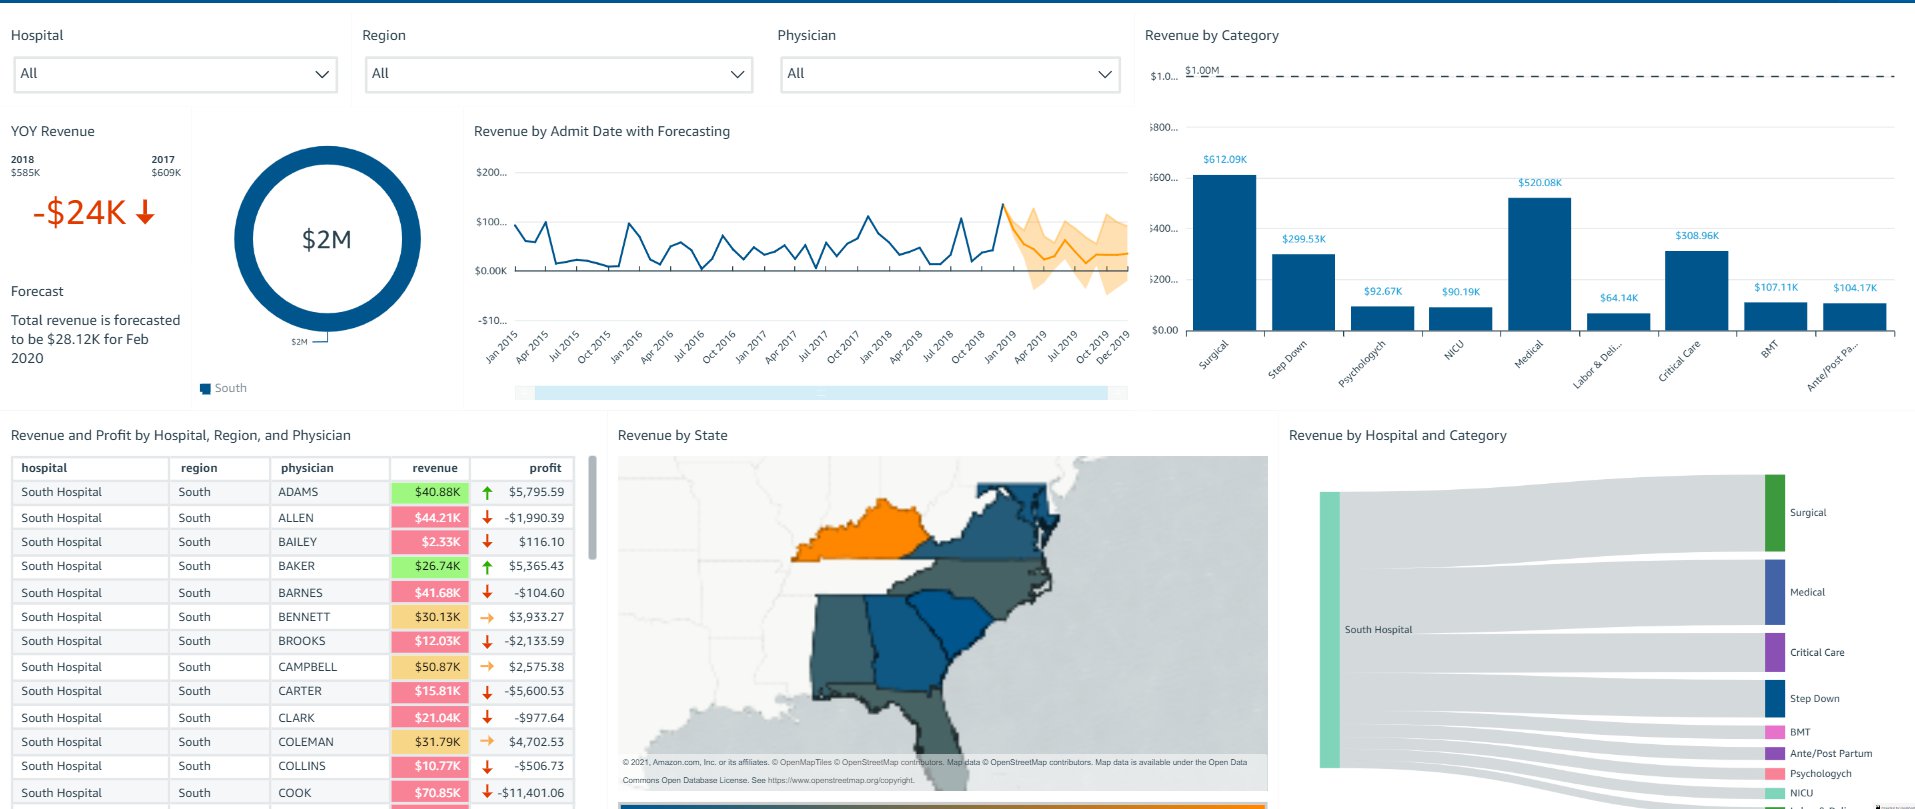
The following screenshot shows what SouthUser sees pertaining to South Hospital in the South region.

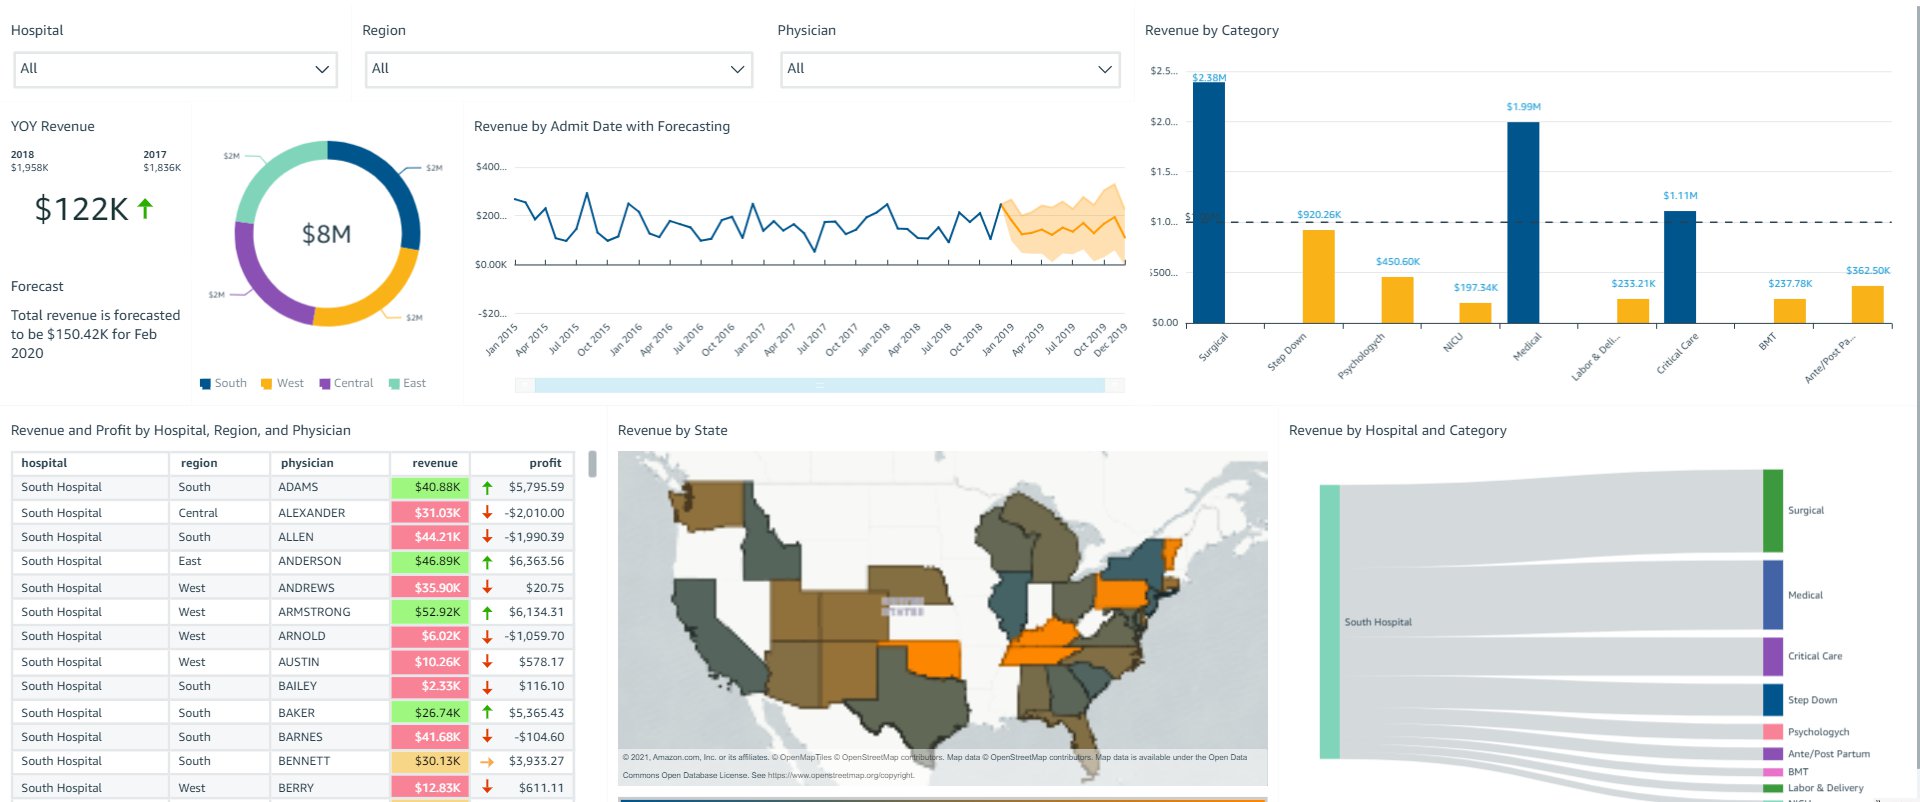
The following screenshot shows what SouthAdmin sees pertaining to South Hospital in all regions.

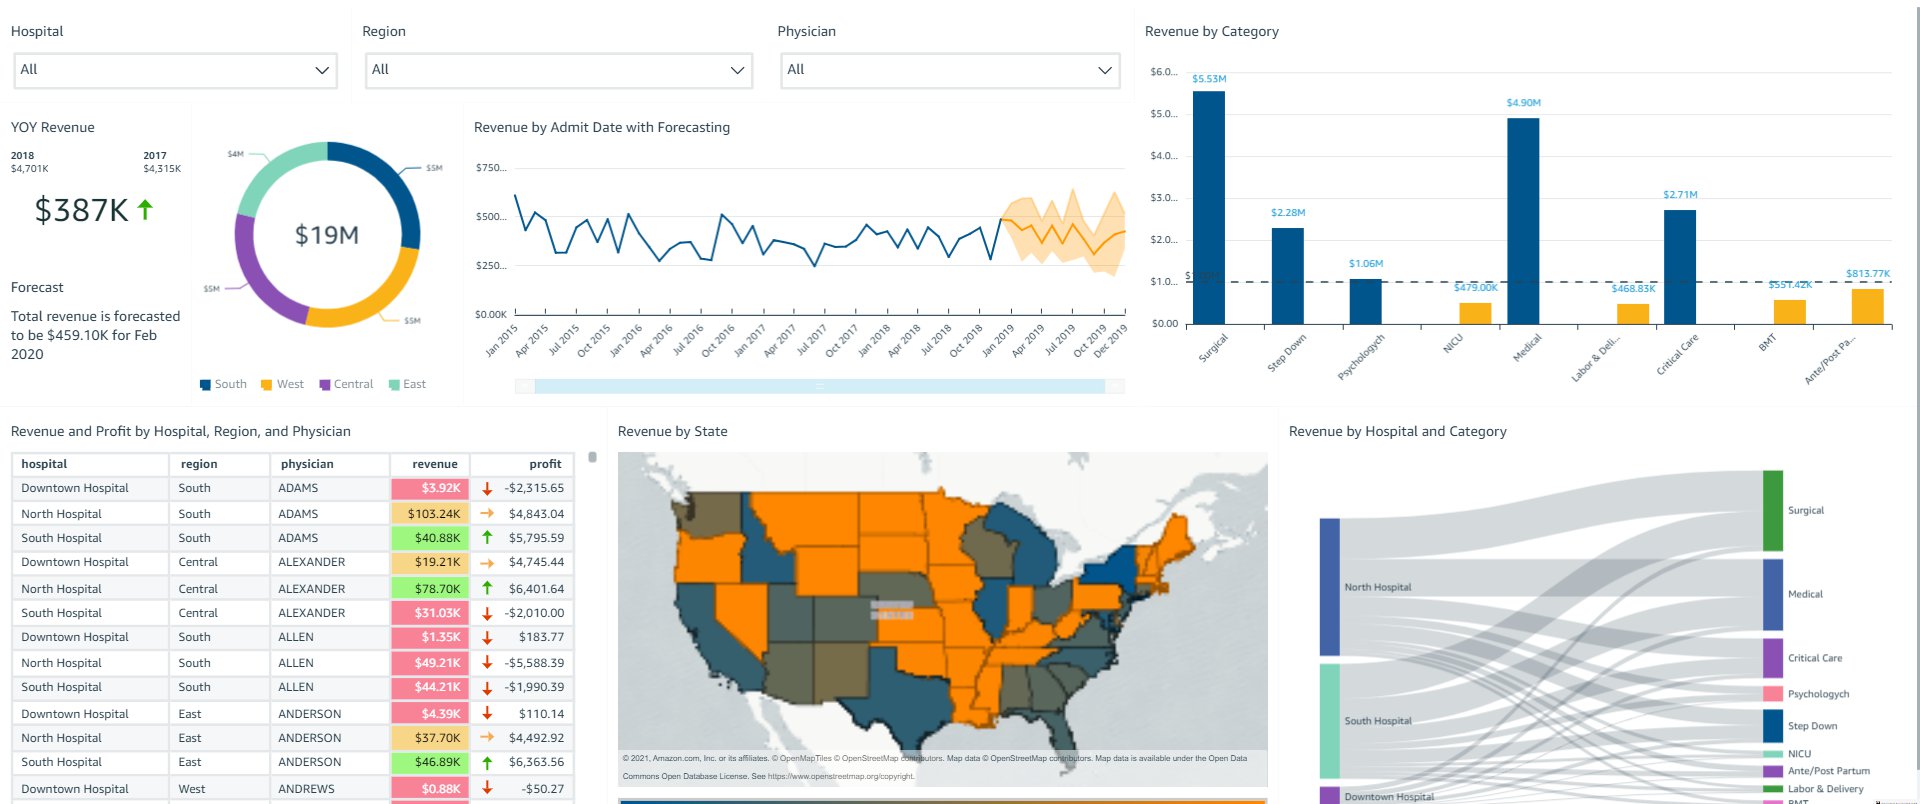
The following screenshot shows what PowerUser sees pertaining to all hospitals in all regions.

Based on session tags, OkTank has secured data on the embedded dashboards such that each user only sees specific data based on their access. You can access the dashboard as one of the users (by changing the user in the drop-down menu on the top right) and see how the data changes based on the user selected.

Overall, with row-level security using tags, OkTank is able to provide a compelling analytics experience within their SaaS application, while making sure that each user only sees the appropriate data without having to provision and manage users in QuickSight. QuickSight provides a highly scalable, secure analytics option that you can set up and roll out to production in days, instead of weeks or months previously.

Conclusion

The combination of embedding dashboard for users not provisioned in QuickSight and row-level security using tags enables developers and ISVs to quickly and easily set up sophisticated, customized analytics for their application users—all without any infrastructure setup or management while scaling to millions of users. For more updates from QuickSight embedded analytics, see What’s New in the Amazon QuickSight User Guide.


About the Authors

Raji Sivasubramaniam is a Specialist Solutions Architect at AWS, focusing on Analytics. Raji has 20 years of experience in architecting end-to-end Enterprise Data Management, Business Intelligence and Analytics solutions for Fortune 500 and Fortune 100 companies across the globe. She has in-depth experience in integrated healthcare data and analytics with wide variety of healthcare datasets including managed market, physician targeting and patient analytics. In her spare time, Raji enjoys hiking, yoga and gardening.

Srikanth Baheti is a Specialized World Wide Sr. Solution Architect for Amazon QuickSight. He started his career as a consultant and worked for multiple private and government organizations. Later he worked for PerkinElmer Health and Sciences & eResearch Technology Inc, where he was responsible for designing and developing high traffic web applications, highly scalable and maintainable data pipelines for reporting platforms using AWS services and Serverless computing.

Kareem Syed-Mohammed is a Product Manager at Amazon QuickSight. He focuses on embedded analytics, APIs, and developer experience. Prior to QuickSight he has been with AWS Marketplace and Amazon retail as a PM. Kareem started his career as a developer and then PM for call center technologies, Local Expert and Ads for Expedia. He worked as a consultant with McKinsey and Company for a short while.

The True Cost of Ransomware

Post Syndicated from Molly Clancy original https://www.backblaze.com/blog/the-true-cost-of-ransomware/

The True Cost of Ransomware - Backblaze

Editor’s Note

This article has been updated since it was originally published in 2021.

When we first published this article, a $70 million ransom demand was unprecedented. Today, demands have reached as high as $240 million, a sum that the Hive ransomware group opened negotiations with in an attack on MediaMarkt, Europe’s largest consumer electronics retailer. 

But then, as now, the ransoms themselves are just a portion, and often a small portion, of the overall cost of ransomware. Ransomware attacks are crimes of opportunity, and there’s a lot more opportunity in the mid-market, where the odd $1 million demand doesn’t make headlines and the victims are less likely to be adequately prepared to recover. And, the cost of those recoveries is what we’ll get into today.

In this post, we’re breaking down the true cost of ransomware and the drivers of those costs.  

Read More About Ransomware

This post is a part of our ongoing series on ransomware. Take a look at our other posts for more information on how businesses can defend themselves against a ransomware attack, important industry trends, and more.

Read About Ransomware ➔ 

Ransom Payments Are the First Line Item

The Sophos State of Ransomware 2023 report, a survey of 3,000 IT decision makers from mid-sized organizations in 14 countries, found the average ransom payment was $1.54 million. This is almost double the 2022 figure of $812,380, and almost 10 times the 2020 average of $170,404, when we last published this article. Coveware, a security consulting firm, found that the average ransom payment for Q2 2023 was $740,144, also representing a big spike over previous quarters. While the specific numbers vary depending on sampling, both reports point to ransoms going up and up.

A graph showing the rising trend in the cost of ransomware payments.
Source.

But, Ransoms Are Far From the Only Cost

Sophos found that the mean recovery cost excluding the ransom payment was $2.6 million when the targeted organization paid the ransom and got their data back. And, that cost was still $1.6 million when businesses used backups to restore data.

The cost of recovery comes from a wide range of factors, including:

  • Downtime.
  • People hours.
  • Investment in stronger cybersecurity protections.
  • Repeat attacks.
  • Higher insurance premiums.
  • Legal defense and settlements.
  • Lost reputation.
  • Lost business.

Downtime

When a company’s systems and data are compromised and operations come to a halt, the consequences are felt across the organization. Financially, downtime results in immediate revenue loss. And, productivity takes a significant hit as employees are unable to access critical resources, leading to missed deadlines and disrupted workflows. According to Coveware, the average downtime in Q2 2022 (the last quarter they collected data on downtime) amounted to over three weeks (24 days). And according to Sophos, 53% of survey respondents took more than one month to recover from the attack. This time should be factored in when calculating the true cost of ransomware.

People Hours

In the aftermath of a ransomware attack, a significant portion, if not all, of a company’s resources will be channeled towards the recovery process. The IT department will be at the forefront, working around the clock to restore systems to full functionality. The marketing and communications teams will shoulder the responsibility of managing crisis communications, while the finance team may find themselves in negotiations with the ransomware perpetrators. Meanwhile, human resources will be addressing employee inquiries and concerns stemming from the incident. Calculating the total hours spent on recovery may not be possible, but it’s a factor to consider in planning.

After recovery, the long term effects of a cybersecurity breach can still be felt in the workforce. In a study of the mental health impacts of cybersecurity on employees, Northwave found that physical and mental health symptoms were still existent up to a year after the cybersecurity attack, and affected both employee morale and business goals. 

Investment in Stronger Cybersecurity Protections

It is highly probable that a company will allocate a greater portion of its budget towards bolstering its cybersecurity measures after being attacked by ransomware, and rightfully so. It’s a prudent and necessary response. As attacks continue to increase in frequency, cyber insurance providers will continue to tighten requirements for coverage. In order to maintain coverage, companies will need to bring systems up to speed.

man working on a laptop with a ransomware demand message

Repeat Attacks

One of the cruel realities of being attacked by ransomware is that it makes businesses a target for repeat attacks. Unsurprisingly, cybercriminals don’t always keep their promises when companies pay ransoms. In fact, paying ransoms lets cybercriminals know you’re an easy future mark. They know you’re willing to pay.

Repeat attacks happen when the vulnerability that allowed cybercriminals access to systems remained susceptible to exploitation. Copycat ransomware operators can easily exploit vulnerabilities that go unaddressed even for a few days. 

Higher Insurance Premiums

As more and more companies file claims for ransomware attacks and recoveries and ransom demands continue to increase, insurers are upping their premiums. In essence, insurers have been confronted with the stark reality that the financial toll exacted by ransomware incidents far exceeds what was once anticipated. In response to this growing financial strain, insurance providers are left with little choice but to raise their premiums. This uptick in premiums reflects the increasing risk landscape of the digital age, where the ever-evolving tactics and sophistication of cybercriminals necessitate a recalibration of risk assessment models and pricing structures within the insurance industry. 

Legal Defense and Settlements

When attacks affect consumers or customers, victims can expect to hear from the lawyers. After a 2021 ransomware attack, payroll services provider UKG agreed to a $6 million settlement. And, big box stores like Target and Home Depot both paid settlements in the tens of millions of dollars following breaches. Even if your information security practices would hold up in court, for most companies, it’s cheaper to settle than to suffer a protracted legal battle.

Lost Reputation and Lost Business

When ransomware attacks make headlines and draw public attention, they can erode trust among customers, partners, and stakeholders. The perception that a company’s cybersecurity measures were insufficient to protect sensitive data and systems can lead to a loss of credibility. Customers may question the safety of their personal information. 

Rebuilding a damaged reputation is a challenging and time-consuming process, requiring transparent communication, proactive security improvements, and a commitment to regaining trust. Ultimately, the impact of reputation loss goes beyond financial losses, as it can significantly affect an organization’s long-term viability and competitiveness in the market.

lock over an image of a woman working on a computer

What You Can Do About It: Defending Against Ransomware

The business of ransomware is booming with no signs of slowing down, and the cost of recovery is enough to put some ill-prepared companies out of business. If it feels like the cost of a ransomware recovery is out of reach, that’s all the more reason to invest in harder security protocols and disaster recovery planning sooner rather than later.

For more information on the ransomware economy, the threat small to mid-sized businesses (SMBs) are facing, and steps you can take to protect your business, download The Complete Guide to Ransomware.

Download the Ransomware Guide ➔ 

Cost of Ransomware FAQs

1. What is the highest ransomware ransom ever demanded?

Today, ransom demands have reached as high as $240 million, a sum demanded by the Hive ransomware group in an attack on MediaMarkt, Europe’s largest consumer electronics retailer.

2. What is the average ransom payment in 2023?

Average ransom payments vary depending on how reporting entities sample data. Some estimates put the average ransom payment in 2023 in the hundreds of thousands of dollars up to over half a million dollars.

3. How much does ransomware recovery cost?

Ransomware recovery can easily cost in the multiple millions of dollars. The cost of recovery comes from a wide range of factors, including downtime, people hours, investment in stronger cybersecurity protections, repeat attacks, higher insurance premiums, legal defense, lost reputation, and lost business.

4. How long does ransomware recovery take?

When a company’s systems and data are compromised, and operations come to a halt, the consequences are felt across the organization. Ransomware recovery can take anywhere from a few days, if you’re well prepared, or up to six months or longer. 

The post The True Cost of Ransomware appeared first on Backblaze Blog | Cloud Storage & Cloud Backup.

Using AWS Serverless to Power Event Management Applications

Post Syndicated from Cheryl Joseph original https://aws.amazon.com/blogs/architecture/using-aws-serverless-to-power-event-management-applications/

Most large events have common activities such as event registration, check-in upon arrival, and requesting of amenities. When designing applications, factors such as high availability, low latency, reliability, and security must be considered.

In this blog post, we’d like to show how Amazon Web Services (AWS) can assist you in event planning activities. We’ll share an architecture that follows best practices, and one that can be used in developing other solutions.

Serverless to the Rescue

Serverless architecture enables you to focus on your application development without having to worry about managing servers and runtimes. You can quickly build, fix, and add new features to your applications. A microservices-based approach provides you the ability to scale and optimize each component of your event management application.

Let’s start by looking at some activities that an event guest might perform, and how they might be displayed in a mobile application:

  • Event registration: A guest can register either from a website or from a mobile device, see Figure 1. Events might have heavy traffic initially, or a large push toward the end. This requires building applications that are highly scalable.
Figure 1. Event registration

Figure 1. Event registration

  • Check-In: Check-In can be a manual and cumbersome process – some mobile options are shown in Figure 2. Attendees must queue up to register, pick up badges, receive agendas, and collect other meeting materials.
Figure 2. Guest check-in kiosk

Figure 2. Guest check-in kiosk

  • Guest requests: While the event is underway, a participant might request hand-outs or want to purchase food or beverages, see Figure 3.
Figure 3. Guest requests

Figure 3. Guest requests

  • Session notification: At popular events, there are some sessions that fill up quickly. Guests must queue up to get into the session. Figure 4 shows a notification screen.
Figure 4. Session notification on guest device

Figure 4. Session notification on guest device

Solution overview for event planning

The serverless architecture presented here is highly scalable and provides low latency. It follows the Serverless Application Lens of the AWS Well-Architected Framework. This enables you to build secure, high-performing, resilient, and efficient applications.

Frontend user interface using AWS Amplify

The event website is hosted on AWS Amplify. Amplify provides a fully managed service for deploying and hosting applications with built-in CI/CD workflows. An alternative for hosting the event website could be Amazon Simple Storage Service (S3) or even by provisioning Amazon EC2 instances. However, Amplify is well suited for native mobile apps and JavaScript-based web apps.

The event website uses Amazon Cognito for management of user authentication and authorization. Amazon Cognito is a good choice here as it allows federating with external identity providers.

Backend serverless microservices

The backend of the event management application uses Amazon API Gateway and AWS Lambda. They provide the ability to expose API operations. If the application has a flurry of requests coming in together, the backend serverless microservices will scale up or down seamlessly. However, there are service limits, and it is important to keep these in mind while designing your applications.

Amazon DynamoDB is the NoSQL database, which saves the guest registration data and other event-related information. DynamoDB is a good fit here, as it delivers single-digit millisecond performance at any scale and provides high availability, fault tolerance, and automatic capacity scaling.

Amazon Pinpoint is used to send notifications to guests via email and SMS. Amazon Pinpoint allows your app to connect with customers over channels like email, SMS, push, or voice.

Let’s take a closer look at some of the activities we’ve outlined.

Solution architecture – Event registration and check-in

Figure 5. Event registration and check-in

Figure 5. Event registration and check-in

Numbered items following refer to Figure 5:

  1. Developers upload code to AWS CodeCommit
  2. CodeCommit pushes the code to Amplify
  3. Guests access the website via Amazon Route 53
  4. Route 53 resolves incoming requests and forwards them to Amplify
  5. Guest authentication is performed by Amazon Cognito user pools
  6. Amplify sends the REST API requests to API Gateway
  7. API Gateway uses Amazon Cognito user pools as the authorizer
  8. API Gateway proxies the request to Lambda
  9. Lambda stores guest data in DynamoDB
  10. Lambda uses Amazon Pinpoint to notify the guest

The guest registration process begins with loading the web application hosted on Amplify. The application creates the user in the Amazon Cognito user pool and routes the request to API Gateway to complete the registration process. Amazon Cognito integrates with third-party authentication systems such as Google, Facebook, and Amazon. This allows guests to use their existing social media accounts to register.

The guest check-in process consists of loading a web application onto kiosks. Guest information is saved in a DynamoDB table. Upon registration, a QR code is sent to the guests, then scanned upon arrival at a kiosk. Guest information is then retrieved from a DynamoDB table. This allows guests to print their badges and other event materials.

Well-Architected guidance:

  • Enable active tracing with AWS X-Ray to provide distributed tracing capabilities and visual service maps for faster troubleshooting of the backend APIs.
  • For Lambda functions, follow least-privileged access and only allow the access required to perform a given operation.
  • Throttle API operations to enforce access patterns established by the event management application service contract.
  • Set appropriate logging levels and remove unnecessary logging information to optimize log ingestion. Use environment variables to control application logging level.

Solution architecture – Guest requests

Figure 6. Guest requests

Figure 6. Guest requests

Numbered items refer to Figure 6:

  1. Guests access the website via Route 53
  2. Route 53 resolves incoming requests and forwards them to Amplify
  3. Guest authentication is performed by Amazon Cognito user pools
  4. Amplify sends the REST API requests to API Gateway
  5. API Gateway uses Amazon Cognito user pools as the authorizer
  6. API Gateway proxies the request to Lambda
  7. Lambda validates and stores guest data in DynamoDB
  8. Lambda uses Amazon Pinpoint to notify the guest
  9. Amazon DynamoDB Streams are enabled which triggers a Lambda function
  10. Lambda notifies the employees via Amazon Simple Notification Service (SNS) to fulfill the request

Once a guest request is made for session handouts or food or beverages, it is stored in DynamoDB. DynamoDB Streams are enabled, see Figure 7, which captures a time-ordered sequence of item-level modifications in a DynamoDB table. It durably stores the information for up to 24 hours. This generates an event, which triggers a Lambda function. The Lambda function sends an SNS notification via SMS or email to the event employees who can address the guest requests.

Figure 7. Sample DynamoDB Streams record

Figure 7. Sample DynamoDB Streams record

Well-Architected guidance:

  • Standardize application logging across components, and business outcomes
  • Enable caching on API Gateway to improve application performance
  • Use an On-Demand Instance for DynamoDB when traffic is unpredictable, otherwise use provisioned mode when consistent
  • Amazon DynamoDB Accelerator (DAX) can be used as an in-memory cache to improve read performance

Solution architecture – Session notification

Figure 8. Session notification

Figure 8. Session notification

Numbered items refer to Figure 8:

  1. An Amazon EventBridge rule runs on a schedule and invokes a Lambda function
  2. Lambda retrieves guest and session information from DynamoDB
  3. Lambda notifies the guest via Amazon Pinpoint

Amazon Pinpoint can send notifications to registered guests to let them know when to queue up for the session.

Conclusion

This solution provides a powerful approach for deploying highly scalable applications, while providing low latency and low cost. Build a Serverless Web Application can get you started. Large events require a considerable amount of planning and coordination. We hope the guidance provided here will help you build a scalable and a robust event management application.

[$] Extended attributes for special files

Post Syndicated from original https://lwn.net/Articles/868505/rss

The Linux extended-attribute mechanism allows the attachment of metadata to
files within a filesystem. It tends to be little used — at least, in the
absence of a security module like SELinux. There is interest in how these
attributes work, though, as evidenced by the discussions that have
followed the posting of revisions of this
patch by Vivek Goyal
, which seeks to make a seemingly small change to
the rules regarding extended attributes and special files.

Cloud Challenges in the Age of Remote Work: Rapid7’s 2021 Cloud Misconfigurations Report

Post Syndicated from Shelby Matthews original https://blog.rapid7.com/2021/09/09/cloud-challenges-in-the-age-of-remote-work-rapid7s-2021-cloud-misconfigurations-report/

Cloud Challenges in the Age of Remote Work: Rapid7’s 2021 Cloud Misconfigurations Report

A lot changed in 2020, and the way businesses use the cloud was no exception. According to one study, 90% of organizations plan to increase their use of cloud infrastructure following the COVID-19 pandemic, and 61% are planning to optimize the way they currently use the cloud. The move to the cloud has increased organizations’ ability to innovate, but it’s also significantly impacted security risks.

Cloud misconfigurations have been among the leading sources of attacks and data breaches in recent years. One report found the top causes of cloud misconfigurations were lack of awareness of cloud security and policies, lack of adequate controls and oversight, and the presence of too many APIs and interfaces. As employees started working from home, the problem only got worse. IBM’s 2021 Cost of a Data Breach report found the difference in cost of a data breach involving remote work was 24.2% higher than those involving non-remote work.

What’s causing misconfigurations?

Rapid7 researchers found and studied 121 publicly reported cases of data exposures in 2020 that were directly caused by a misconfiguration in the organization’s cloud environment. The good news is that 62% of these cases were discovered by independent researchers and not hackers. The bad news? There are likely many more data exposures that hackers have found but the impacted organizations still don’t know about.

Here are some of our key findings:

  • A lot of misconfigurations happen because an organization wants to make access to a resource easier
  • The top three industries impacted by data exposure incidents were information, entertainment, and healthcare.
  • AWS S3 and ElasticSearch databases accounted for 45% of the incidents.
  • On average, there were 10 reported incidents a month across 15 industries.
  • The median data exposure was 10 million records.

Traditionally, security has been at the end of the cycle, allowing for vulnerabilities to get missed — but we’re here to help. InsightCloudSec is a cloud-native security platform meant to help you shift your cloud security programs left to allow security to become an earlier part of the cycle along with increasing workflow automation and reducing noise in your cloud environment.

Check out our full report that goes deeper into how and why these data breaches are occurring.

The Open Source Initiative’s new executive director

Post Syndicated from original https://lwn.net/Articles/868744/rss

The Open Source Initiative has announced the
appointment of Stefano Maffulli as its executive director.
‘Bringing Stefano Maffulli on board as OSI’s first Executive
Director is the culmination of a years-long march toward
professionalization, so that OSI can be a stronger and more responsive
advocate for open source,’ says Joshua Simmons, Board Chair of OSI.

Security updates for Thursday

Post Syndicated from original https://lwn.net/Articles/868743/rss

Security updates have been issued by Fedora (lynx, matrix-synapse, and proftpd), openSUSE (ntfs-3g_ntfsprogs), Oracle (kernel), Red Hat (RHV-H), Scientific Linux (kernel), and Ubuntu (libapache2-mod-auth-mellon, linux, linux-aws, linux-aws-5.11, linux-azure, linux-azure-5.11, linux-gcp, linux-hwe-5.11, linux-kvm, linux-oracle, linux-oracle-5.11, linux-raspi, linux, linux-aws, linux-aws-5.4, linux-azure, linux-azure-5.4, linux-gcp, linux-gcp-5.4, linux-gke, linux-gke-5.4, linux-gkeop, linux-gkeop-5.4, linux-kvm, linux-oracle, linux-oracle-5.4, and linux-azure-5.8, linux-oem-5.10).

Setting up manual ticket creation using Zabbix frontend scripts

Post Syndicated from Nathan Liefting original https://blog.zabbix.com/setting-up-manual-ticket-creation-using-zabbix-frontend-scripts/15550/

In this blog post, you will learn how to set up manual ticket creation through the use of Zabbix frontend scripts. We will use Jira Service Desk as an example, but this guide should work for any type of service desk or help desk system, as we can apply this technique for other systems in a similar fashion.


Introduction

Zabbix already has the ability to automatically create tickets through the use of Media Types and Actions. This way we can filter out certain issues based on host groups, severity, tags and a lot more. But what if your action misses a problem because of your filters? Or what if you simply want to limit the number of tickets that are created by actions? That’s when we can use Zabbix Frontend Scripts to manually create a ticket from the Zabbix Frontend, while automatically filling in the ticket info with a click of a button.

Let’s check take a look at how we can achieve this.

How to

Setting up Jira

As mentioned, in this example we’ll use Jira. Why? Simply because personally I am a big fan of the Atlassian product suite and it’s what I had available on hand. Feel free to apply this technique to any service desk system out there though, as we are definitely not limited to Jira Service Desk.

To make the frontend script work we are going to need a working integration (Media Type in Zabbix terminology). You can check out https://zabbix.com/integrations to see if the service desk system of your choosing is already available out of the box. If not, you can always use a community solution or build your own integration. Jira Service Desk is already available though, meaning we can use the settings pre-defined in Zabbix. For Jira Service Desk we’ll need:

  • jira_url – The actual URL of your Jira instance. For example: https://company.atlassian.net/
  • jira_user– Jira user login, in our instance this is my email.
  • jira_project_key– Numeric key of the Jira project. We can find this in the URL once we go to our Jira Service Desk project settings. For example: pid=10054
  • jira_issue_type– Number of the issue type to be used when creating new issues from Zabbix. Check out the Project Settings -> Request types and use the number in the URL for the request type you’d like to use.
  • jira_password– Password or API token. We can create this at: https://id.atlassian.com/manage/api-tokens

Make sure to save the API token somewhere, as you can only copy it over once.

Setting up the frontend script

Now once you have set up everything on the Jira (or which ever other service desk you use) side, we can continue with the next step which is setting up the Frontend script. If we look at the particular Zabbix Media Type, we can see something interesting.

The Jira ServiceDesk default Media Type is of course already set up, but that’s not the most interesting part – although super useful nevertheless. Looking at the Media Type we have our Parameters and the Javascript script. If we take a look at the Frontend Script configuration and compare it with our Media Type, that’s when it gets interesting:

With release of Zabbix 5.4 it is now possible possible for us to execute webhooks directly with a Frontend script, as we can see we have the same Parameter and Script options available in this section. Meaning that most of what we have to do is navigate to Administration -> Scripts and copy over the Media Type Parameters and script. So, let’s do that and fill in the parameters with default values:

Do not forget to do the same thing for the script part:

Once you’ve set this up, we aren’t completely done yet. We have copied the default parameter values as defined by Zabbix in the default Jira ServiceDesk Media Type. Now that we’ve copied those from the Media Type to the Frontend script, we still need to edit them to reflect our Jira ServiceDesk parameters. We need to edit the following fields:

alert_message: We can add our own alert message here, which will be filling out the body of our Jira Service Desk ticket. Use the Zabbix built-in macro’s wisely here. Something like:

There is a problem on {HOST.HOST} - {EVENT.NAME} with severity: {EVENT.SEVERITY} since {EVENT.DATE}

alert_subject: This will be the subject of our Jira ticket, again heavily reliant on Built-in Macro’s. It can be something like:

Severity:{EVENT.SEVERITY} Problem on:{HOST.HOST} - {EVENT.NAME}

event_source: We set this to 0, meaning it is a problem. Normally this is dynamic, but we can make it static for the script.

0


Then, as discussed in the earlier part of this post we need to edit the following parameters:

jira_password 

jira_request_type_id 

jira_servicedesk_id

jira_url 

jira_user 


Once you have set up all of those parameters, it should now look like this:

The result

Now, if all of the information from the previous steps is filled in, we can test the integration. Navigate to Monitoring -> Problems and click on any of the problem names:

Which will open a dropdown menu. Go to ServiceDesk and click the Create Jira ticket button.

This will then kick of our new Zabbix frontend script. The webhook script will be using the Jira API to create a ticket and voila:

A ticket is created, right from the frontend. It’s just that easy.

Conclusion

Using Media Types is great and I would definitely recommend using them. If you have set up the correct filtering using host groups, severities, tags and perhaps more than that, you can already keep the ticket count to a minimum. But there’s always a downside to using a lot of filters, you might miss something. That’s where our Frontend Script implementation kicks in. Maybe your filter missed a ticket, maybe you don’t want automated tickets at all. We can use the script to manually create tickets, quickly from the frontend and solve that issue.

You’ve now got a powerful way to do so, fully compatible with Zabbix most of the times out of the box! As Zabbix adds more and more of this functionality it becomes easier and easier to do so, if you just know where to look.

I hope you enjoyed reading this blog post and if you have any questions or need help configuring anything on your Zabbix setup feel free to contact me and the team at Opensource ICT Solutions. We build a ton of cool integrations like this and much more!

Nathan Liefting

https://oicts.com

A close up of a logo Description automatically generated

Native Rust support on Cloudflare Workers

Post Syndicated from Steve Manuel original https://blog.cloudflare.com/workers-rust-sdk/

Native Rust support on Cloudflare Workers

Native Rust support on Cloudflare Workers

You can now write Cloudflare Workers in 100% Rust, no JavaScript required. Try it out: https://github.com/cloudflare/workers-rs

Cloudflare Workers has long supported the building blocks to run many languages using  WebAssembly. However, there has always been a challenging “trampoline” step required to allow languages like Rust to talk to JavaScript APIs such as fetch().

In addition to the sizable amount of boilerplate needed, lots of “off the shelf” bindings between languages don’t include support for Cloudflare APIs such as KV and Durable Objects. What we wanted was a way to write a Worker in idiomatic Rust, quickly, and without needing knowledge of the host JavaScript environment. While we had a nice “starter” template that made it easy enough to pull in some Rust libraries and use them from JavaScript, the barrier was still too high if your goal was to write a full program in Rust and ship it to our edge.

Not anymore!

Introducing the worker crate, available on GitHub and crates.io, which makes Rust developers feel right at home on the Workers platform by running code inside the V8 WebAssembly engine. In the snippet below, you can see how the worker crate does all the heavy lifting by providing Rustacean-friendly Workers APIs.

use worker::*;

#[event(fetch)]
pub async fn main(req: Request, env: Env) -> Result<Response> {
    console_log!(
        "{} {}, located at: {:?}, within: {}",
        req.method().to_string(),
        req.path(),
        req.cf().coordinates().unwrap_or_default(),
        req.cf().region().unwrap_or("unknown region".into())
    );

    if !matches!(req.method(), Method::Post) {
        return Response::error("Method Not Allowed", 405);
    }

    if let Some(file) = req.form_data().await?.get("file") {
        return match file {
            FormEntry::File(buf) => {
                Response::ok(&format!("size = {}", buf.bytes().await?.len()))
            }
            _ => Response::error("`file` part of POST form must be a file", 400),
        };
    }

    Response::error("Bad Request", 400)
}

Get your own Worker in Rust started with a single command:

# see installation instructions for our `wrangler` CLI at https://github.com/cloudflare/wrangler
# (requires v1.19.2 or higher)
$ wrangler generate --type=rust my-project

We’ve  stripped away all the glue code, provided an ergonomic HTTP framework, and baked in what you need to build small scripts or full-fledged Workers apps in Rust. You’ll find fetch, a router, easy-to-use HTTP functionality, Workers KV stores and Durable Objects, secrets, and environment variables too. It’s all open source, and we’d love your feedback!

Why are we doing this?

Cloudflare Workers is on a mission to simplify the developer experience. When we took a hard look at the previous experience writing non-JavaScript Workers, we knew we could do better. Rust happens to be a great language for us to kick-start our mission: it has first-class support for WebAssembly, and a wonderful, growing ecosystem. Tools like wasm-bindgen, libraries like web-sys, and Rust’s powerful macro system gave us a significant starting-off point. Plus, Rust’s popularity is growing rapidly, and if our own use of Rust at Cloudflare is any indication, there is no question that Rust is staking its claim as a must-have in the developer toolbox.

So give it a try, leave some feedback, even open a PR! By the way, we’re always on the lookout for great people to join us, and we are hiring for many open roles (including Rust engineers!) — take a look.

The collective thoughts of the interwebz