Post Syndicated from The History Guy: History Deserves to Be Remembered original https://www.youtube.com/watch?v=hHf3dtoqqKc
A Taxonomy of Cognitive Security
Post Syndicated from Bruce Schneier original https://www.schneier.com/blog/archives/2026/04/a-taxonomy-of-cognitive-security.html
Last week, I listened to a fascinating talk by K. Melton on cognitive security, cognitive hacking, and reality pentesting. The slides from the talk are here, but—even better—Menton has a long essay laying out the basic concepts and ideas.
The whole thing is important and well worth reading, and I hesitate to excerpt. Here’s a taste:
The NeuroCompiler is where raw sensory data gets interpreted before you’re consciously aware of it. It decides what things mean, and it does this fast, automatic, and mostly invisible. It’s also where the majority of cognitive exploits actually land, right in this sweet spot between perception and conscious thought.
This is my term for what Daniel Kahneman called System 1 thinking. If the Sensory Interface is the intake port, the NeuroCompiler is what turns that input into “filtered meaning” before the Mind Kernel ever sees it. It takes raw signal (e.g., photons, sound waves, chemical gradients, pressure) and translates it into something actionable based on binary categories like threat or safe, familiar or novel, trustworthy or suspicious.
The speed is both an evolutionary feature and a modern bug. Processing here is fast enough to get you out of the way of a thrown object before you’ve consciously registered it. But “good enough most of the time” means “predictably wrong some of the time….
A critical architectural feature: the NeuroCompiler can route its output directly back to the Sensory Interface and out as behavior, skipping the conscious awareness of the Mind Kernel entirely. Reflex and startle responses use this mechanism, making this bypass pathway enormously useful for survival. Yet it leaves a wide-open backdoor. If the layer that holds access to skepticism and deliberate evaluation can be bypassed completely, a host of exploits become possible that would otherwise fail.
That’s just one of the five levels Melton talks about: sensory interface, neurocompiler, mind kernel, the mesh, and cultural substrate.
Melton’s taxonomy is compelling, and her parallels to IT systems are fascinating. I have long said that a genius idea is one that’s incredibly obvious once you hear it, but one that no one has said before. This is the first time I’ve heard cognition described in this way.
Мистерията Петрохан: Тайният ‘оракул’ на политици: сеанси, записи и изповеди
Post Syndicated from Екип на Биволъ original https://bivol.bg/petrohan_profit.html
сряда 1 април 2026

Отвъд аванссцената Случаят „Петрохан“ предизвика силен обществен отзвук, съпроводен от множество версии, интерпретации и спекулации. В отсъствието на ясна и проверена фактология, публичният дебат бързо се поляризира. Настоящото разследване има…
Материалът <span style='color:#ff0000;font-size:12px;'>Мистерията Петрохан:</span> <BR> <H1 class='post-title single-post-title entry-title'>Тайният ‘оракул’ на политици: сеанси, записи и изповеди</H1> е публикуван за пръв път на Bivol!.
Highlights from Astro Pi 2025–2026 community events
Post Syndicated from Fergus Kirkpatrick original https://www.raspberrypi.org/blog/highlights-from-astro-pi-2025-2026-community-events/
We have now reached the end of the European Astro Pi Challenge 2025/2026 cycle and it’s been a busy and rewarding time for the Raspberry Pi Foundation team. Alongside supporting thousands of young people taking part in the challenge across Europe and beyond, we’ve also been out in the UK community running hands-on Astro Pi events and delivering training to schools and educators.

A few highlights from this year include the Astro Pi tenth anniversary celebrations at the London Science Museum; a series of Mission Zero workshops delivered during Science Festivals in Bradford, Belfast and Norwich; and hosting a Mission Space Lab hackathon at the Raspberry Pi Foundation headquarters.
Mission Zero on the road: Creativity in coding
In Astro Pi Mission Zero, participants write a simple Python program that displays an image or animation on an Astro Pi computer aboard the ISS. Their program also uses data from the Astro Pi’s colour and luminosity sensor to set the background colour.
Since Astro Pi 2025/26 launched in September, the Raspberry Pi team have been running Mission Zero workshops at science events and providing training to lots of different organisations. We kicked off our outreach at Bradford Science Festival in October with workshops happening all through the half term at the Bradford Science Museum. Over 260 young people took part and submitted their entries during the festival.

In November, we ran a series of online training and livestreamed sessions for Education Scotland’s Computer Science Week, and for STEM Ambassadors in Wales. We provided teacher CPD sessions for facilitators and even livestreamed a Mission Zero lesson direct to the classrooms of primary schools around Scotland.
December was a particularly big milestone as we celebrated ten years of Astro Pi at the London Science Museum with UK Astronaut, Tim Peake, who launched Astro Pi way back in 2015. We hosted families and schools with a series of workshops over two days at the museum, and Tim even joined us for one of the workshops to meet participants.
January found the team running training for computer science teachers at the Harris Foundation, a network of schools around Greater London, and the Meridian Trust, a school network in the East of England. After the training, we visited Nene Park Academy in Peterborough UK, part of the Meridian Trust, to run mission zero with groups of students there.
In February, we visited the Waterloo Park Pavilion to host a fringe event to the Norwich Science festival. These workshops ran alongside space-themed craft activities organised by the volunteer group, Friends of Waterloo Park, creating an inclusive and welcoming environment for families. Younger children could take part in the crafts, while older participants explored text-based programming.
Although participants could follow a ready-made example, many chose to design their own personalised images. This creativity, combined with the knowledge that their code would run in space, made for a highly engaging session.

Meanwhile, another team of Raspberry Pi Foundation colleagues were out running Mission Zero at the Northern Ireland Science Festival in Belfast.

Mission Space Lab: A day of problem-solving
In February 2026, we hosted a Mission Space Lab hackathon at the Code Club in the Foundation’s Cambridge office. Four teams of young people worked together to tackle a real scientific task: calculating the speed of the International Space Station (ISS) as accurately as possible.

Teams wrote two short Python programs: one that collected data from the Astro Pi computers’ sensors and camera, and one that calculated speed using historical images from the ISS. Then they combined the two programs and edited them to work on the Astro Pi computers aboard the ISS using the Astro Pi Replay tool.

To test their programs, teams used a trolley rigged up with a Camera Module to simulate motion and refine their calculations. The day ended with teams submitting their programs and sharing what they learned, including the challenges they faced and how they overcame them.
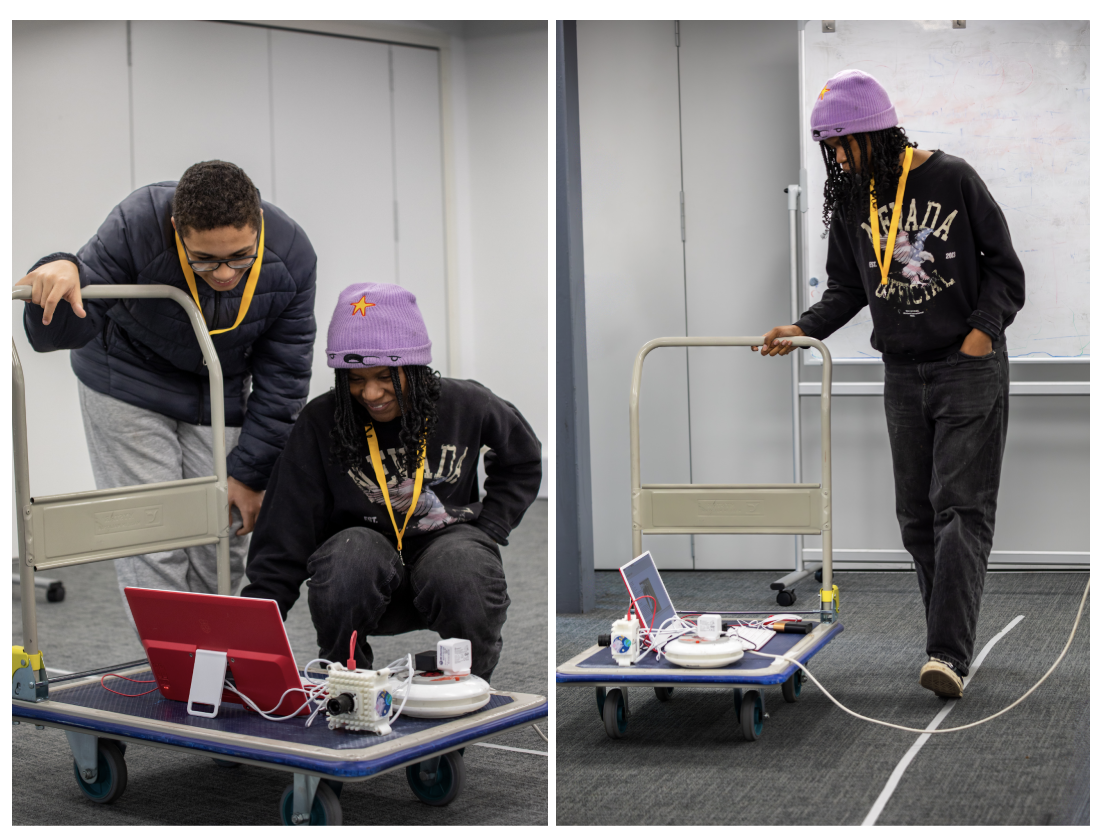
Bringing Astro Pi to more communities
All these events and workshops are a reminder of what makes Astro Pi special. Young people are not just learning to code; they are exploring their creativity with it, and applying their skills to a real-world setting — the awesome vastness of space!
If you’d like us to help run an Astro Pi event for teachers or students in your school or community in the UK, then we’d love to hear from you.
Get in touch to find out more: [email protected]
If you are in another ESA member state, you can reach out to your local European Space Education Resource Office (ESERO).
The post Highlights from Astro Pi 2025–2026 community events appeared first on Raspberry Pi Foundation.
Тодора Радева: Културата е крайният хоризонт, който виждаме
Post Syndicated from Ина Иванова original https://www.toest.bg/todora-radeva-kulturata-e-krayniyat-horizont-koyto-vizhdame/

Тодора Радева е завършила първия випуск на специалност „Културология“ в Софийския университет. И до ден днешен тя смята, че висшето образование формира начин на мислене. Дава съзнанието, че се нуждаеш от важна тема и метод на работа, с чиято помощ да постигнеш дълбочина на внушението. Събитията, които Тодора Радева и нейният екип създават, защитават нуждата от подобен подход, а познанията ѝ по история, теория и философия на културата ѝ помагат не само да структурира проектите хоризонтално, но и да предлага на публиката различни нива на преживяване.
От Гьоте насам сме наясно, че „човек вижда толкова, колкото знае“, но интердисциплинарният подход винаги дава възможност да свържеш повече гледни точки и да предложиш паноптикум от идеи. Именно това отличава събитията на Тодора Радева и Фондация „Прочети София“.
Широтата на погледа и умението да виждаш нещата в цялост, как си взаимодействат и по какъв начин си влияят те – това ми даде културологията. През всички тези години работя с разбирането за културата като крайния хоризонт, който можеш да видиш. И всеки опит да го тематизираш, изследваш, да се приближаваш или отдалечаваш, да търсиш мястото си спрямо този хоризонт всъщност е постоянно усилие да го промениш, разшириш, да видиш какво има отвъд.
В периода 2013–2020 г. Тодора Радева е програмен директор на Софийския международен литературен фестивал. Тя е и създателка на Фондация „Прочети София“, която свързва литературата с други изкуства и провокира преоткриването на градското пространство. Сред разпознаваемите проекти на Фондацията са: „Скритите букви“, „Литературни маршрути“ и „Литературни срещи“.
Тодора определя себе си като екипен играч и смята, че в сферата, в която работи, вниманието към другия и към неговия начин на мислене е основополагащо. Единомишлениците също имат идеи, които се разминават. А многопосочността на търсенията може да съчетае качествата на всеки член от екипа.
Важно е и партнирането. Фестивалите, организирани от Тодора Радева, често са в диалог с отделни сфери на науката или спорта и разчитат на съвместното участие, на свързаността, която обогатява и участници, и посетители. Търсенето на различни валенции между различни културни сфери е и опит да бъде предложена на публиката една по-сложна картина.
Мисля за фестивала като за един цял свят, в който ще попаднеш за три дни. Който освен възможността да срещнеш автори ти предлага и различна реалност – такава, каквато я предполагат различните прочити на темата. Вътре отделните събития си говорят помежду си, влизат в диалог и те повличат, задават въпроси, вдъхновяват, карат те не просто да преживееш нещо, но и да го осмислиш, и да го отнесеш със себе си.
Между концепцията и вдъхновението – това е полето, на което се раждат идеите на Тодора Радева. Реализацията им обаче минава през ежедневното, конкретно усилие, което не бива да обезсърчава.
Много е важно как най-точно може да бъде изразена една концепция. Ще използвам добре позната метафора. Аз ходя често на планина, съпругът ми е планинар, там се запознахме, там си почивам и се зареждам и до днес. Планината освен утешителка е и голяма учителка. Сигурно всеки е виждал някакъв много красив връх, който изглежда недостижим от подножието, невъзможен за изкачване. Но път винаги има. И когато тръгнеш, „номерът“ е да го разделиш на части, да си казваш: „Хайде, само до следващия завой, а после и до следващия“, да си даваш почивки, да преборваш изтощението с малки усилия, без да се губиш и отказваш. В главата си удържаш голямата идея, върхът е ясен, но в същото време си съсредоточен върху всяка крачка към целта. Има, разбира се, и моменти на лекота и на вдъхновение, защото след всеки завой гледката е нова и ти припомня какво и защо търсиш.
Подборът на теми и локации на събитията също е част от фината мрежа, която тъче екипът на „Прочети София“ – мрежа, в която впоследствие публиката е приканена да влезе, за да съпреживява събитието с всичките си сетива. За „Археология на паметта“ например бяха използвани пространствата на софийското Ларго и Археологическия музей, което буквално визуализира метафората за пластовете на историята.
Програмирането на всеки фестивал е в намирането на баланс между концепцията и реално възможното. Много често темата на фестивала се формулира накрая – така стана и с „Археология на паметта“, така е и с предстоящото издание на „Литературни срещи“ от 23 до 25 април, което ще бъде с тема „Дистопии и съпротива“. Разбира се, ние започваме с една много широка основа и работим по актуална за времето ни тема, която ни занимава и която откриваме в произведенията на авторите, които харесваме. Но чак след като разберем кои от чуждестранните гости ще имат възможност да участват във фестивала, даваме по-конкретна тема и подреждаме всички останали събития.
Когато говорим за литература обаче, за Тодора Радева темата е особено лична. Като автор тя битува в книжното пространство с два сборника с разкази: „Седем начина да увиеш сари около тялото“ и „Едно възможно начало“.
Когато разказва легендата за сарито, което жената увива около тялото си, дебютната ѝ книга всъщност акцентира върху непознаваемата психична природа на жената. Колкото и да се опитват да я съблекат, тя винаги остава с един слой тъкан върху себе си. Това, което една жена не желае да открие, остава скрито.
Каквито и сюжети да следват разказите ми, в крайна сметка като че ли винаги се въртя около въпросите колко сме автентични и верни на себе си, на какво ниво общуваме с другия, защо сме такива, каквито сме. Историите ми са взрени в междучовешките отношения.
Писането ми дава усещане за друг свят, друг вид задоволяване на нуждата ми да минавам отвъд хоризонта, да търся нещо ново. А понякога е вид спасение.
Случва се да започна да пиша нещо лично заради самата себе си, но след няколко изречения отварям друг файл и вече разказвам история, която не знам откъде идва. Тя ме повлича, завихря се и ми дава удоволствието да я следвам и разкривам от различни страни. Може би предпочитам да пиша разкази, защото са кратки и в тях мога да влизам спорадично, романът не позволява голямо прекъсване във времето, в което да вършиш другата си работа. Ти се променяш, обстоятелствата се променят и ако не успееш да завършиш един текст в някакъв срок, се обричаш на безкрайни редакции.
Убежище за Тодора Радева винаги е било изкуството.
Не мога да си представя живот без това, което изкуството дава. То те владее, поставя въпроси, тревожи те и в това е красотата му. В него са възможни много различни светове. И аз обичам да потъвам в тях. Но те също така вдъхновяват – независимо дали филм, книга или картина могат да породят у теб желание да създадеш нещо твое, да продължиш диалога.
Другото ми съхранително нещо са хората около мен. Аз имам щастието да съм отраснала в семейство, което ми е дало много любов и подкрепа. С времето разбирам какво спокойствие съм получила от майка ми, баща ми и сестра ми, от тази сигурност, че си приет и си обичан. Дори когато не са били съгласни с моите избори, те са ме подкрепяли.
Оттук и моята вяра, че може да си на различно мнение с някого, но да съществувате заедно, без противоречия.
В началото на май Тодора Радева планира една акция на обич, свързана със скорошната загуба на майка си. В Пловдив тя ще изложи плетива, създавани за семейството в годините, когато беше трудно да намериш дреха, която да не е унифициращата конфекция. Публиката ще бъде приканена да донесе или да дефилира и със свои плетива.
Сега, вече като родител, в моето семейство също получавам обич. Това ми дава сила да преминавам по-леко през болката и да продължавам.
От споделената любов Тодора Радева твърди, че черпи, когато трябва да се бори с нормалните делнични трудности, провали и неудачи.
Детството ѝ преминава в Пловдив. Но тя истински обиква града по-късно, след като се премества да следва висше образование в София, където веднага се е почувствала приобщена и на мястото си. Вероятно дотогава Пловдив е бил част от дома – не избор, а сцена на порастването. Преоткрива го основно през писането. То я връща към тихите улички и безгрижието, с което е опознавала махалата с детската си тайфа. Сега разбира, че неизследваните пространства на някой град също те формират. Заради свой ръкопис Тодора проучва старите пловдивски хроники, размишлява върху връзките между делничното съществуване и съдбата на града и хората. И за себе си приема, че каквито и драматични събития да преживяваме,
ние сме малки за градовете. Може би дори сме им безразлични с дребните си човешки тревоги. Преоткрих Пловдив и през стиховете на Иван Теофилов и Йордан Велчев, както и през неговия тритомен труд „Балканският човек“. През изкуството.
Ако обаче трябва да се обясни в любов на други световни градове, избира Ню Йорк – заради еуфорията, която я завладява там абсолютно без обяснение. И усещането, че всичко е възможно.
Аз обичам големи градове. Имам един недовършен проект, който се казва „Места за разказване“. В него искам да събера текстове за градове, които са ми давали истории дори без да съм живяла дълго там, събуждали са представа за герои и събития, които се раждат от неповторимата им атмосфера. Имам такива записки за едно конкретно кътче от Париж; за няколко квартала на Берлин; за Аладжа манастир; за Загреб.
И, разбира се, Италия, където е покорена от малкото градче Сирмионе, в което остава само четири часа, но то ѝ дава сюжет за разказ, върху който работи в момента. Изобщо, като свое място Тодора Радева припознава Италия, защото
следите на времето там пребивават автентично и в синхрон и като че ли по-лесно ги откриваш и наместваш и в себе си.
А когато говорим за отминалото, не можем да не стигнем до трудностите. И до уроците като неделима част от нас.
Предизвикателствата и препятствията в моя живот просто са нещо, през което трябва да минеш, да се справиш по един или друг начин. Аз винаги съм осъзнавала колко е опасно, ако човек вижда само тях, ако дълбае прекалено и им се остави. Имам съпротива към това колко лесно се подхлъзваме към мрака. Винаги съм предпочитала да избирам светлата страна.
Хората, които тихо и кротко променят средата, формират общности и задават посоки, в които има смисъл да тръгнем заедно. Тук ви срещаме с тях. Това са „Тези хора“.
Highway Monitoring with Zabbix and Nova Rota Oeste
Post Syndicated from Michael Kammer original https://blog.zabbix.com/highway-monitoring-with-zabbix-and-nova-rota-oeste/32810/

Nova Rota do Oeste (formerly Rota do Oeste) is a Brazilian highway concessionaire founded in 2014, responsible for managing more than 850 kilometers of highway that connects the cities of Sinop (MT), to the states of Mato Grosso and Mato Grosso do Sul.
Due to the demands of ensuring road safety, Nova Rota do Oeste restructured its highway monitoring strategy by replacing a legacy tool with Zabbix, achieving greater visibility and operational control as well as 85% cost savings.
The challenge
Nova Rota do Oeste operates an enormous technological infrastructure, including:
- 10 data centers
- 833 surveillance cameras
- Radio repeater towers for vehicle communication
- Electronic toll systems
- An extensive optical fiber infrastructure
- Intelligent signalling equipment
In total, the company manages nine toll plazas and maintains 24/7 operations focused on traffic safety and flow. It is also responsible for the largest highway construction project in Brazil.
Nova Rota do Oeste previously relied on a licensed commercial legacy monitoring tool to support its infrastructure, but it did not meet the need for constant scalability.
In 2024, the company began searching for a new highway monitoring solution that met requirements such as scalability, robustness, ease of learning, and training availability. Key needs included the ability to:
- Monitor critical devices and services distributed along 850 km of highway
- Provide operational visibility into communications status, connectivity, and systems
- Reduce incident identification and response time
- Create automated alerts for proactive action
- Integrate infrastructure monitoring, road safety, and business systems
After market research and internal technical analysis, the company concluded that Zabbix was the most suitable tool for its challenges. The migration process from the commercial legacy tool then began.
The solution
The infrastructure monitoring transformation approach was structured in complementary phases, led by Zabbix Premium Delivery Partner JLCP in partnership with the Nova Rota do Oeste IT team.
Phase 1: Foundation and base configuration
The first stage focused on gathering requirements and building the foundation. After analyzing the existing environment and cleaning up legacy data, the necessary architecture was defined, culminating in the implementation and validation of the Zabbix infrastructure.
Phase 2: Priority-based expansion
The second phase focused on the incremental onboarding of devices based on criticality, including:
- Multiple servers
- 833 surveillance cameras
- Radio repeater towers
- Toll system
- Power infrastructure
- Solar plants via customized API
- Wi-Fi equipment (Unifi API integration
- Optical fiber (testing phase)
Monitoring the implementation
The highway monitoring system implemented at Nova Rota do Oeste follows a distributed, layered architecture that integrates different areas into Zabbix:
- IT infrastructure
- Operating systems
- Field devices
- Business services
Each layer has specific objectives, connected within a unified ecosystem of data and alerts. Data collected from monitored items is processed by the central Zabbix server, which applies triggers and conditions to identify anomalies. When a metric exceeds a configured threshold, Zabbix generates automatic alerts displayed in real time to the infrastructure team via dashboards that remain constantly open in the operations center.
Data is organized into visual dashboards that provide:
- Data center view (consolidated status of each of the 10 locations)
- Device-type view (cameras, towers, servers, power)
- Criticality view (essential versus secondary services)
- Topological maps visually representing the highway and its components
The team now has real-time visibility over more than 1,700 hosts distributed along the highway.
Results
The implementation of Zabbix delivered significant operational improvements, including:
- An 80–85% reduction in detection time – from an average of 1 hour to less than 15 minutes
- 85% cost savings compared to maintaining the legacy tool
- Full coverage of critical infrastructure with 1,702 hosts currently monitored
- Complete operational visibility over 10 data centers, 833 cameras, radio towers, power systems, and more
- Internal notification before users or operators report issues
- Direct dispatch of field teams or ticket opening with telecom providers
- Early communication of potential impacts
- Activation of contingency plans when necessary
In addition to support for the development and integration of all supported Zabbix items, Nova Rota do Oeste also obtained a Zabbix Technical Support Subscription, expanding the tool’s scope and ensuring better usage and technical support.
Conclusion
Monitoring with Zabbix increased the availability of radio towers for vehicle communication, enabled real-time surveillance camera status visualization, guaranteed connectivity for toll systems, and provided continuous monitoring of power infrastructure, all of which has directly contributed to better service and user safety.
The post Highway Monitoring with Zabbix and Nova Rota Oeste appeared first on Zabbix Blog.
Comic for 2026.04.01 – Point Out The Suspect
Post Syndicated from Explosm.net original https://explosm.net/comics/point-out-the-suspect
New Cyanide and Happiness Comic
Creation
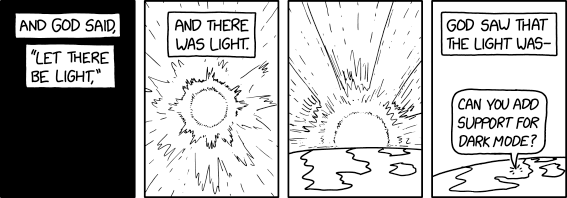
Post Syndicated from xkcd.com original https://xkcd.com/3227/
Leverage Agentic AI for Autonomous Incident Response with AWS DevOps Agent
Post Syndicated from Janardhan Molumuri original https://aws.amazon.com/blogs/devops/leverage-agentic-ai-for-autonomous-incident-response-with-aws-devops-agent/
Introduction
Teams running distributed workloads face a persistent operational challenge: when something breaks, the information needed to resolve it is scattered across logs, deployment pipelines, configuration histories, and third-party monitoring tools. A Site Reliability Engineer (SRE) responding to a 2 AM page must manually correlate telemetry from multiple sources, trace dependencies across services, and form hypotheses — a process that routinely takes hours. As systems grow in complexity, the need for an AI-powered operational teammate — an SRE agent — has become increasingly clear.
The Do It Yourself (DIY) path and its limits
Teams exploring this space often start by using their favorite AI coding tools to help during an investigation, a thin wrapper over an large language model (LLM). On-call engineers wake up and looks at the incident details, tickets, give coding tools access to logs, monitoring tools and ask it to launch investigation. These approaches can deliver value for straightforward scenarios, but real world application architectures at scale require context across accounts, monitoring systems, and application topology awareness, enforce governance and access controls, and retained learning from past incidents to ensure a comprehensive incident management. As environments scale, the gap between a simple coding tool with limited context and a production-grade operational agentic teammate widens.
A fully managed alternative
AWS DevOps Agent is your always-available operations teammate that resolves and proactively prevents incidents, optimizes application reliability and performance, and handles on-demand SRE tasks across AWS, multicloud, and on-prem environments. DevOps Agent delivers a comprehensive agentic SRE paradigm, shifting teams from reactive firefighting to proactive, AI-driven operational excellence.
But what makes AWS DevOps Agent more powerful than what individual SREs can do with their coding agent? In this post, we walk through a serverless URL shortener application on AWS and demonstrate how DevOps Agent — built on topology intelligence, a three-tier skills hierarchy, cross-account investigation, and continuous learning — delivers capabilities that a simple LLM wrapper cannot replicate, acting as a true operational teammate at scale that reduces Mean Time to Resolution (MTTR) from hours to minutes.
Prerequisites
Before getting started with DevOps Agent, ensure you have:
- An active AWS account with an eligible AWS Support plan (contact your AWS account team for supported tiers)
- Appropriate IAM permissions to configure cross-account observability
- AWS services deployed in a supported Region
- Amazon CloudWatch and AWS CloudTrail (included by default)
- additional integrations connected for enhanced capabilities — ServiceNow for ticketing, Slack for team notifications, or PagerDuty for on-call management
Application Overview
You are an SRE Engineer at a SaaS company that offers URL shortener service deployed on AWS. The application uses fully serverless architecture, creates short codes, redirects to original URLs, and tracks analytics.
- Amazon CloudFront serves static assets from an Amazon S3 bucket
- Amazon API Gateway routes API requests to AWS Lambda functions
- Amazon DynamoDB stores URL mappings accessed by Lambda functions
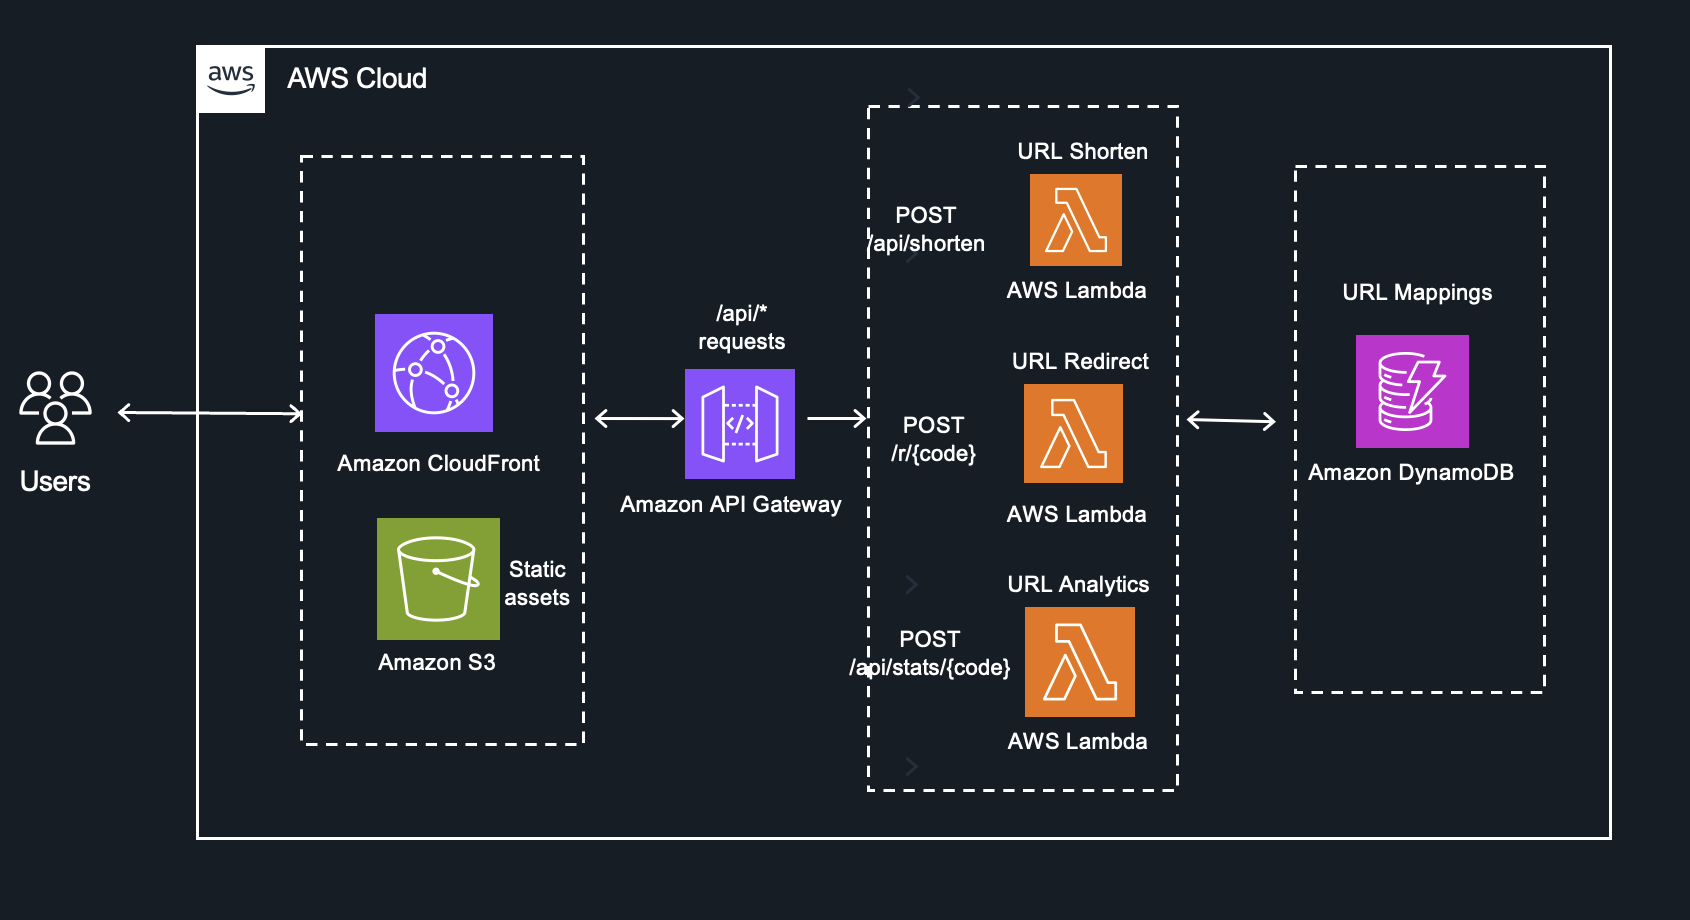
Fig 1 – URL Shortener Application
This architecture is straightforward to build but operationally complex to troubleshoot. A latency spike in the Redirect function could stem from DynamoDB throttling, a Lambda cold start regression, an API Gateway configuration change, or a CloudFront cache invalidation — and the signals live in different log groups, metrics namespaces, and trace spans. This is exactly where DevOps Agent demonstrates its value as an autonomous operational teammate.
An Investigation in Action
This workflow demonstrates the DevOps Agent autonomously detecting and diagnosing a production incident in just 4 minutes without human intervention, starting when a CloudWatch alarm triggers due to elevated 5xx errors and systematically testing hypotheses until it identifies DynamoDB write throttling caused by a recent code deployment. The DevOps Agent then autonomously posts a complete root cause analysis with specific mitigation recommendations to Slack, including the problematic commit and suggesting either on-demand capacity or a rollback—all accomplished in under 5 minutes from initial alarm to actionable solution.

Fig 2. Logical Investigation workflow
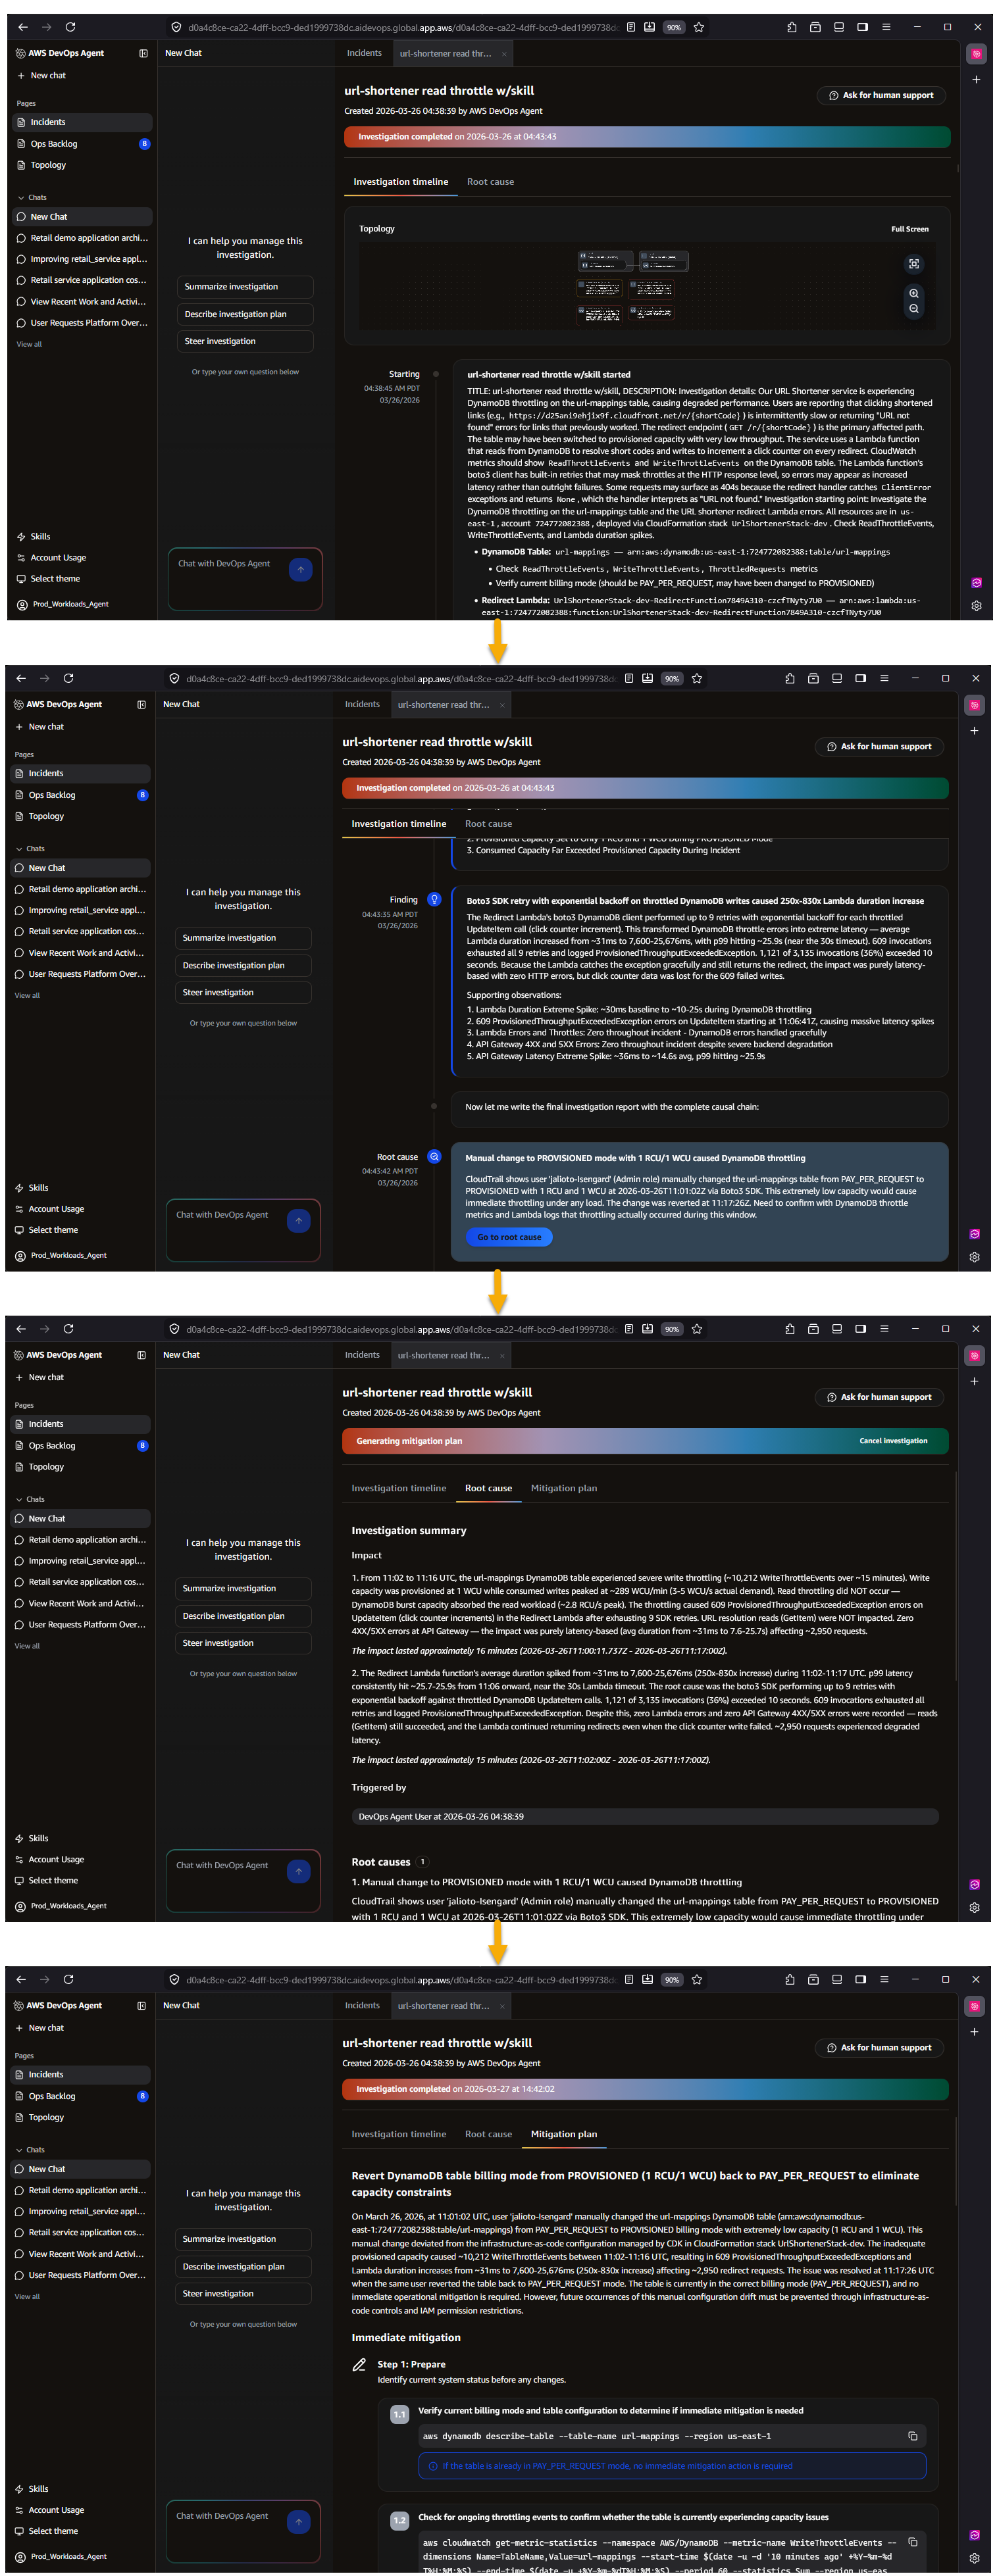
Figure 3 – AWS DevOps Agent investigation workflow demonstrating the automated flow from initial incident detection through root cause analysis to actionable mitigation recommendations
Why DevOps Agent is Different
DevOps Agent is not a chat interface layered over a large language model. It is built on Amazon Bedrock AgentCore with dedicated infrastructure for memory, policies, evaluations, and observability. Below, we break down six key capabilities — the 6 Cs — that collectively make DevOps Agent a fully functional nextgen operational teammate.
1. Context
An LLM without operational context is limited to generic suggestions. DevOps Agent solves this through Agent Spaces — isolated logical containers that provide cross-account access to cloud resources, telemetry sources, code repositories, CI/CD pipelines, and ticketing systems. Within each Agent Space, DevOps Agent builds an application resource topology by auto-discovering resources — containers, network components, log groups, alarms, and deployments — and mapping their interconnections across AWS, Azure, and on-prem environments. A learning agent runs in the background, analyzing infrastructure, telemetry, and code to generate an inferred topology at the application and service layer . DevOps Agent maintains deep, AWS-native integrations with services like Amazon Elastic Kubernetes Service (EKS), providing introspection into Kubernetes clusters, pod logs, and cluster events for both public and private environments — capabilities that require privileged access external tools don’t have. DevOps Agent doesn’t just know your resource topology, it knows your telemetry, deployment timeline, and infrastructure and application code. It discovers and knows the relationship between resources, alarms, metrics, and log groups. When it detects a latency spike, it automatically checks GitHub, GitLab, Azure DevOps for recent merges, correlates deployment timestamps with metric anomalies, and determines whether a code change is the probable cause. In the URL shortener example, the agent identifies that a commit adding batch DynamoDB writes was deployed 47 minutes before throttling began — a correlation a human SRE might take 30 minutes to discover manually.
In our URL shortener, DevOps Agent maps the dependency chain from CloudFront through API Gateway to each Lambda function and down to the DynamoDB table. When a latency spike hits the URL Redirect function, the agent traces the relationship graph to determine whether the root cause is DynamoDB read throttling, a Lambda concurrency limit, or an API Gateway timeout configuration — correlating CloudWatch metrics, Lambda traces, and DynamoDB consumed capacity in a single investigation.
2. Control
Context without governance creates risk. Agent Spaces provide centralized control over what the agent can access and how it operates. Administrators define which AWS and Azure accounts, telemetry and code integrations, and MCP servers are available within each Agent Space using granular IAM permissions, This eliminates the inconsistency of individual developers configuring their own toolchains — some thoroughly, some partially, some not at all — and removes the need for ad-hoc onboarding processes for new team members. Every reasoning step and action is logged in immutable audit journals that the agent cannot modify after recording, providing complete transparency into decision-making. AWS DevOps Agent is secured from day one with immutable audit trails logging every reasoning step and tool invocation, AWS CloudTrail integration, IAM Identity Center authentication with granular permissions, and Agent Space-level data governance that isolates investigation data and respects organizational security configurations.
For the URL shortener, the administrator configures a single Agent Space with read access to the production account’s CloudWatch logs, the DynamoDB table metrics, the GitHub repository, and the Slack channel for incident coordination. Every SRE on the team inherits this consistent, controlled configuration — no individual setup required.
3. Convenience
Once an Agent Space is configured, every developer and SRE on the team gets immediate, zero-setup access to the agent’s full operational context — topology, telemetry, code repositories, and ticketing integrations — without configuring anything themselves. This is a meaningful departure from the alternative, where each engineer individually connects their coding agent to Model Context Protocol (MCP) servers for CloudWatch, their observability tool, their source repository, and their ticketing system. In practice, some engineers will complete that setup, some will partially configure it, and some never will — resulting in inconsistent tooling across the team and an onboarding burden for every new hire. With DevOps Agent, the admin configures the Agent Space once, and engineers simply log in to the Operator Web App, or interact through Slack — whichever tool they already use. The agent provides context-aware responses, maintains conversation history, and supports natural language queries against the application topology without any per-user setup.
For the URL shortener team, a new SRE joining the on-call rotation doesn’t need to spend a day wiring up access to the three Lambda function log groups, the DynamoDB metrics dashboard, and the GitHub repository. They log in to the Agent Space and immediately ask, “Show me all Lambda functions connected to this DynamoDB table” — the topology, telemetry access, and code context are already there.
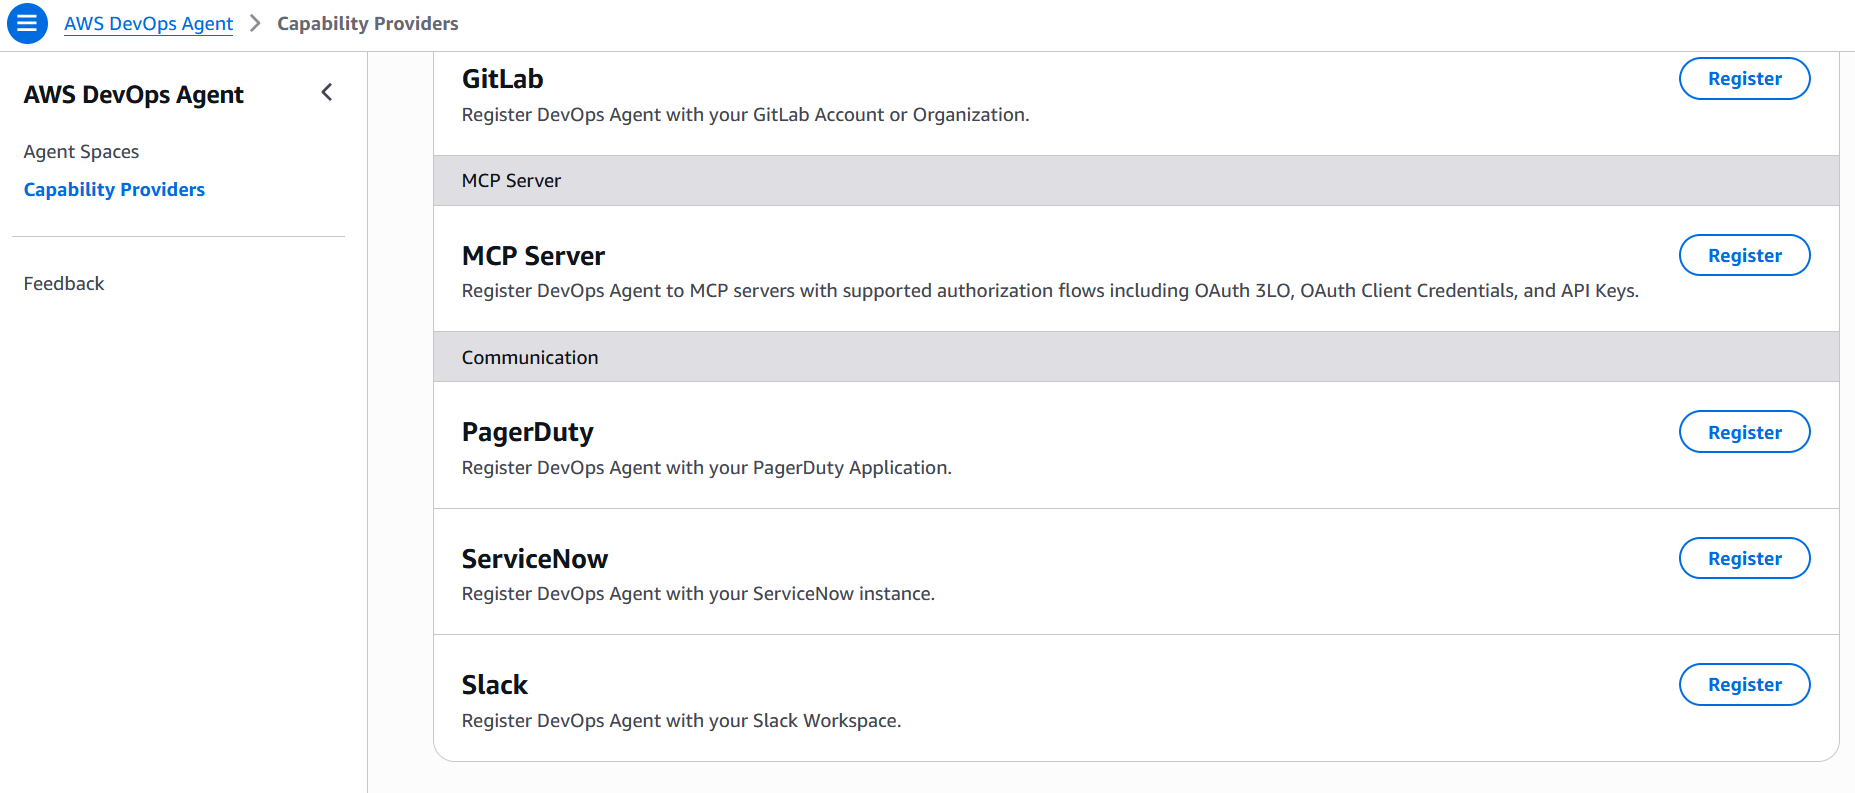
Fig 4 – AWS DevOps Agent MCP server and Communications integrations
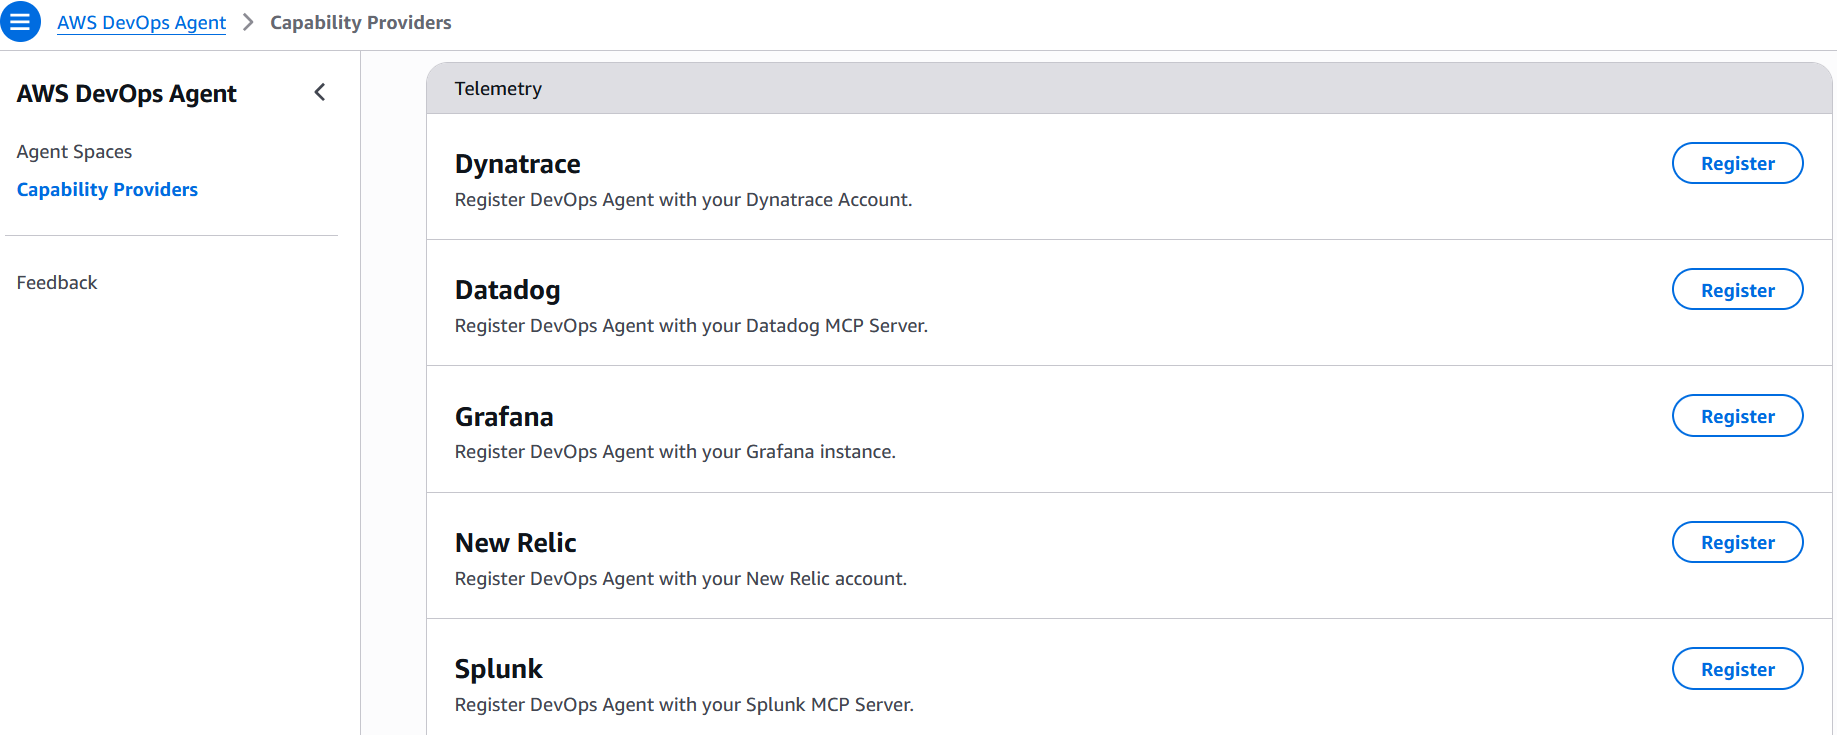
Fig 5 – AWS DevOps Agent Telemetry integrations
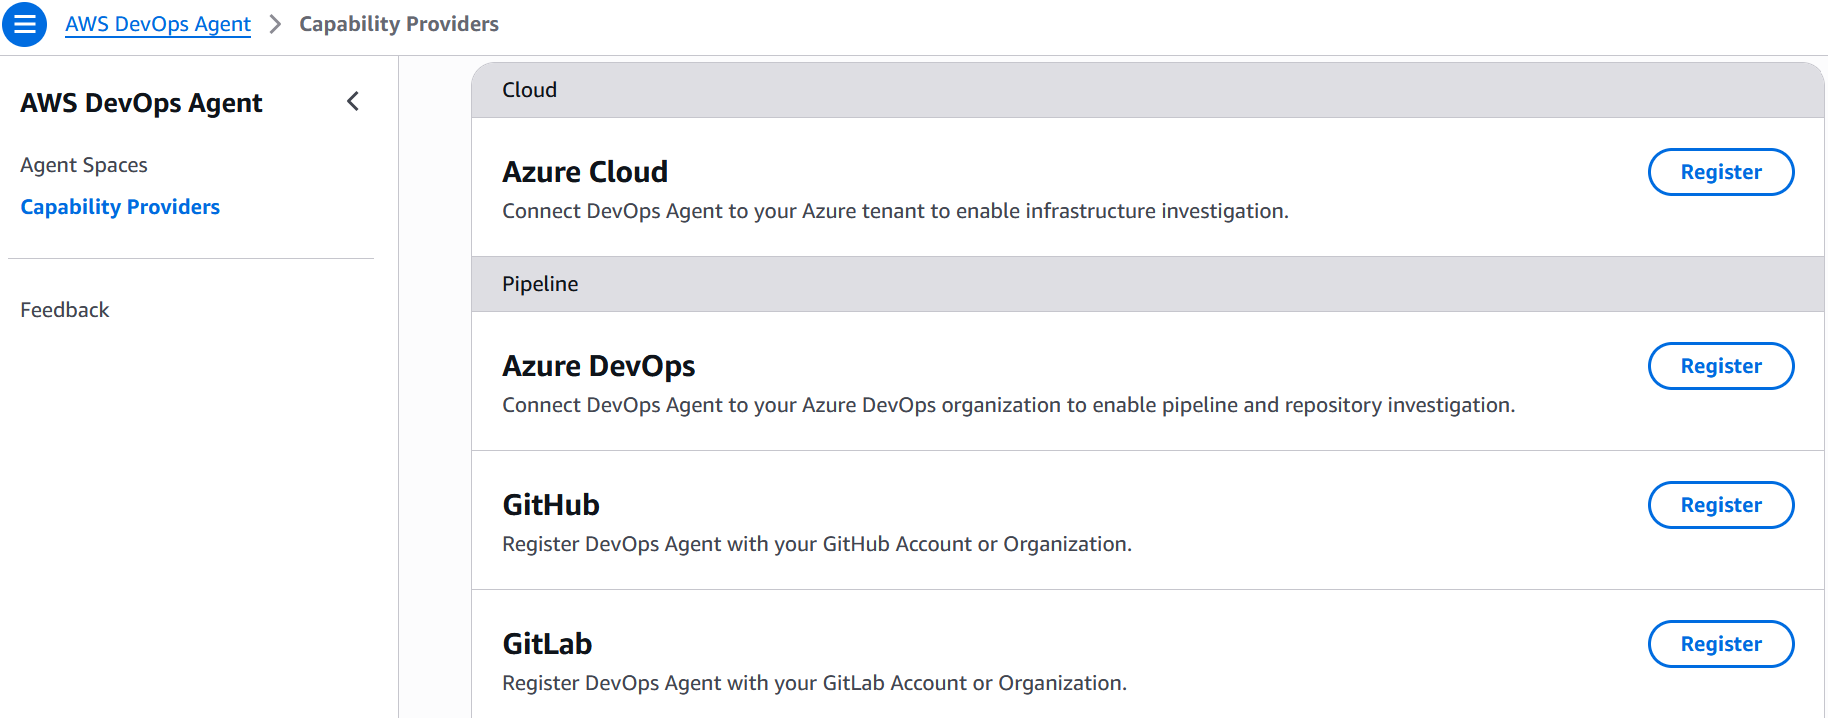
Fig 6 – AWS DevOps Agent Multi-Cloud and pipeline integrations
4. Collaboration
DevOps Agent is not a passive Q&A tool, it is an autonomous teammate. When an incident triggers via a CloudWatch alarm, PagerDuty alert, Dynatrace Problem, ServiceNow ticket, or any other event source you configure through the webhook, the agent begins investigating immediately without human prompting. It generates hypotheses, queries telemetry and code data sources to test them, and coordinates across collaboration channels — posting investigation timelines in Slack, updating ServiceNow tickets, and routing findings to stakeholders. Extensibility through the MCP and built-in integrations with CloudWatch, Datadog, Dynatrace, New Relic, Splunk, Grafana, GitHub, GitLab, and Azure DevOps ensures the agent can pull signals from wherever the team’s operational data lives. The agent also performs proactive weekly prevention recommendations, analyzing recent incidents to suggest specific improvements across code optimization, observability coverage, infrastructure resilience, and governance practices. Additionally, DevOps Agent operates within the broader frontier agent ecosystem, where investigation findings can include agent-ready instructions for Kiro to implement fixes.
When the URL shortener experiences a DynamoDB throttling event at 3 AM, DevOps Agent detects the alarm, investigates autonomously, identifies that a traffic spike exceeded the table’s provisioned capacity, and posts a mitigation plan in Slack — all before the on-call engineer finishes reading the page. The weekly prevention evaluation then recommends switching to on-demand capacity mode and adding a CloudWatch alarm on ConsumedWriteCapacityUnits to catch future spikes earlier.
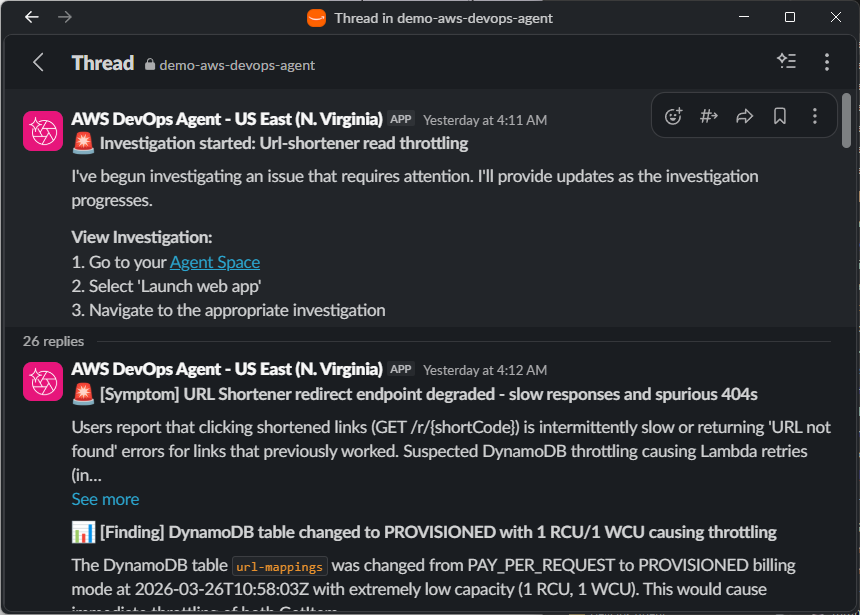
Fig 7 – AWS DevOps Agent Slack investigation notifications
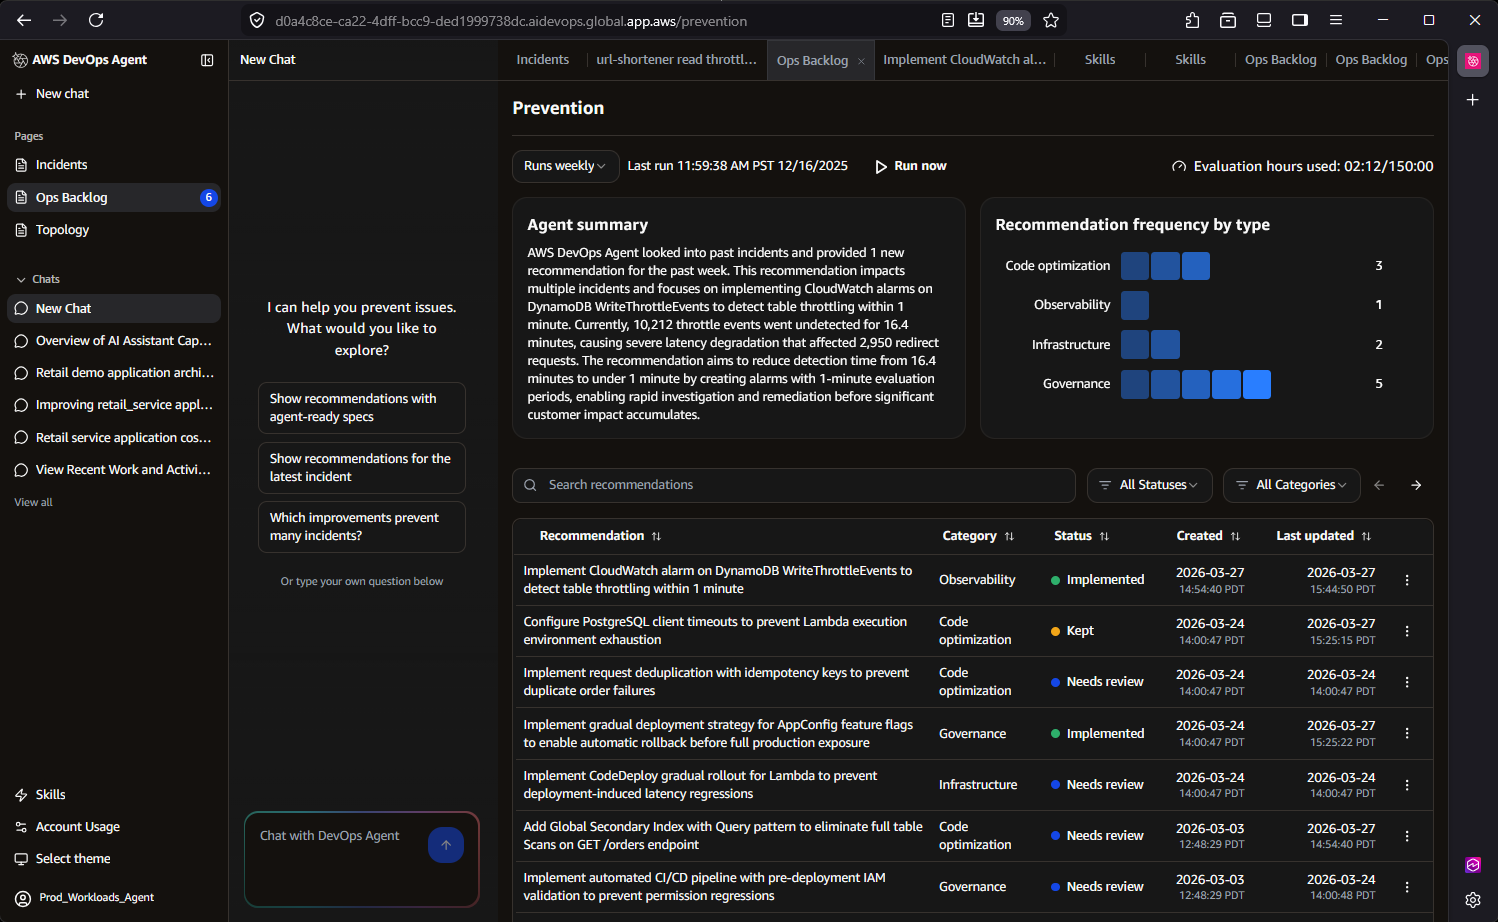
Fig 8 – AWS DevOps Agent prevention recommendations in the Ops Backlog
5. Continuous Learning
This is where AWS DevOps Agent most clearly separates itself from thin LLM wrappers. The agent implements a sophisticated three-tier skill hierarchy:
- AWS-provided skills – Built-in capabilities developed by AWS engineers and scientists that reflect proven operational approaches and are continuously maintained under the hood.
- User-defined skills – Custom skills that you define to help the agent work more effectively within your specific organizational context and workflows.
- Learned skills – Operating continuously in the background, AWS DevOps Agent includes a learning sub-agent that performs two critical functions. First, it scans your cloud infrastructure, telemetry data, and code repositories to continuously learn and update your application topology—understanding resources and their relationships to help zero in on key logs related to specific alarms. Second, it analyzes past investigations to identify patterns and optimize future troubleshooting workflows, becoming more effective over time.
For the URL shortener, after DevOps Agent resolves three DynamoDB throttling incidents over a month, the Learning Agent identifies the recurring pattern and generates a learned skill that accelerates future investigations of the same class. The next time throttling occurs, the agent skips exploratory hypotheses and immediately checks provisioned capacity against consumed capacity, reducing investigation time further. The SRE team also uploads a runbook describing their canary deployment process, which the agent references when evaluating whether a recent deployment correlates with an incident.
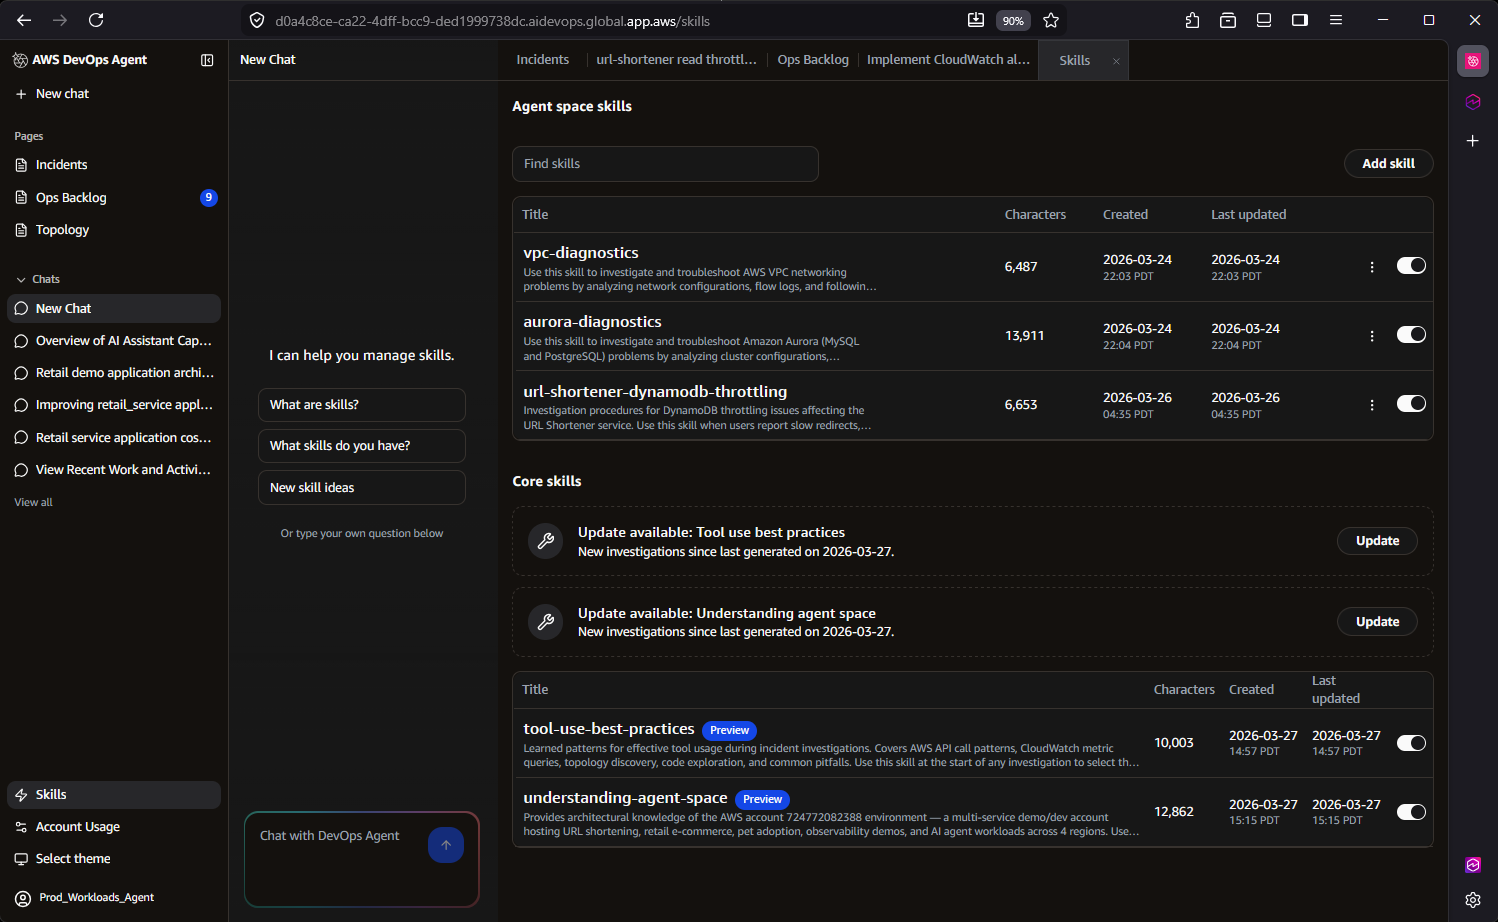
Fig 9 – AWS DevOps Agent user-defined and learned skills
6. Cost Effective
You could build your own agent, but you would still need to pay for the model tokens it consumes. More importantly, you would need to staff a team to develop, maintain, and operate the agent and its integrations. You would also need to periodically evaluate model quality, latency, and costs as underlying models change. With AWS DevOps Agent, you get a team of AWS engineers and scientists who do all of that for you.
DevOps Agent uses usage-based pricing — you pay only for the time the agent actively works on a task. There is no per-seat licensing or idle infrastructure cost. The agent works at machine speed, completing investigations in minutes that would take a human engineer hours, and only charges for the actual seconds of active computation.
Behind the scenes, DevOps Agent employs significant data retrieval optimizations that reduce cost while improving accuracy. Its query optimization techniques across tools achieve up to 15x faster querying across massive datasets by leveraging AWS-specific access patterns and data characteristics. These optimizations mean the agent consumes less compute per investigation while delivering more precise results — a direct benefit of deep AWS integration that generic LLM wrappers cannot replicate.
For the URL shortener, instead of an SRE spending two hours manually querying CloudWatch Logs Insights across three Lambda function log groups and correlating with DynamoDB metrics, DevOps Agent completes the same investigation in minutes using optimized queries — at a fraction of the cost of engineering time.
Proven real-world results
Customers and partners using AWS DevOps Agent in preview report up to 75% lower MTTR, 80% faster investigations, and 94% root cause accuracy, enabling 3–5x faster incident resolution.
Western Governor’s University (WGU), a leading online university serving over 191,000 students, was among the first organizations to deploy Amazon DevOps Agent into production, doing so even ahead of the preview launch at re:Invent. As a large-scale Dynatrace user, WGU leverages the DevOps Agent’s native Dynatrace integration, enabling Dynatrace Intelligence to automatically route problem records to the Agent for investigation and return enriched findings directly back into Dynatrace.
During a recent production investigation, WGU’s SRE team used the AWS DevOps Agent to analyze a service disruption scenario, reducing total resolution time from an estimated two hours to just 28 minutes—a 77% improvement in MTTR. AWS DevOps Agent quickly pinpointed the root cause within an AWS Lambda function’s configuration, surfacing critical operational knowledge that had previously existed only in undiscovered internal documentation.
Zenchef is a restaurant technology platform that helps restaurants manage reservations, table operations, digital menus, payments, and guest marketing from a single commission-free system. With a focused DevOps team managing several production environments across multiple business units, they faced a real test when an API integration issue affecting a downstream partner surfaced during a company hackathon, with engineers engaged in the event and nothing significant showing up in monitoring to point them in the right direction.
Rather than pulling engineers off the hackathon, the team brought the issue to AWS DevOps Agent. It worked through the problem systematically, ruling out authentication as a contributing factor, shifting investigation focus on Amazon Elastic Container Service (Amazon ECS) deployments, and ultimately tracing the root cause to a code regression in which a new version failed to handle an unrecognized enum value in the database. The full investigation wrapped in 20-30 minutes, roughly a 75% reduction compared to the 1-2 hours it would have taken manually, and the findings were shared directly with the responsible engineer.
Conclusion
AWS DevOps Agent is architecturally distinct from LLM wrappers. Its topology intelligence service maps AWS service relationships to understand application dependencies. Its three-tier skill hierarchy with a validation-based Learning Agent creates compounding operational knowledge specific to each customer environment. Its cross-account investigation capability, governed autonomy model, and immutable audit trails address enterprise requirements that no external wrapper can satisfy.
The 6 Cs — Context, Control, Convenience, Collaboration, Continuous Learning, and Cost Effective — are not marketing categories. They represent concrete engineering investments: Agent Spaces for isolation, topology, optimized log queries for performance, federated credential management for cross-account access, and a skills architecture that learns and improves with every investigation. For any team operating distributed and complex architectural applications on AWS — DevOps Agent reduces the operational burden of incident response while building institutional knowledge that makes every future investigation faster and more accurate.
Ready to get started? Visit the AWS DevOps Agent documentation to explore the setup process, join the AWS DevOps Agent workshop for hands-on experience, and/or contact your AWS account team to configure your first Agent Space.
Graeme Wood: Trump’s Unclear Iran Messaging Leave U.S. Vulnerable to Propaganda
Post Syndicated from The Atlantic original https://www.youtube.com/shorts/jwjchH-rqLY
Ruthie Rogers on Her New Book and How Food Tells Stories
Post Syndicated from The Atlantic original https://www.youtube.com/shorts/p9_q8UGPx58
New compliance guide available: ISO/IEC 27001:2022 on AWS
Post Syndicated from Ted Tanner original https://aws.amazon.com/blogs/security/new-compliance-guide-available-iso-iec-270012022-on-aws-compliance-guide/
We’re excited to announce the release of our latest compliance guide, ISO/IEC 27001:2022 on AWS, which provides practical guidance for organizations designing and operating an Information Security Management System (ISMS) using AWS services.
As organizations migrate critical workloads to the cloud, aligning with globally recognized standards such as ISO/IEC 27001:2022 becomes an important step toward strengthening governance, risk management, and information security practices. This guide helps cloud architects, security teams, compliance leaders, and DevOps practitioners understand how to implement and operate ISO 27001-aligned controls using AWS services while applying the AWS Shared Responsibility Model.
The guide explains how organizations can integrate AWS services into their ISMS to support the requirements defined in ISO 27001:2022 clauses 4–10 and selected Annex A controls. It also highlights how AWS security, monitoring, and automation capabilities can help customers maintain visibility, improve operational consistency, and prepare audit-ready evidence.
While AWS provides a secure and compliant cloud infrastructure, customers remain responsible for defining their ISMS scope, implementing controls, and demonstrating conformity during certification audits.
Inside the guide:
- Overview of the ISO/IEC 27001:2022 framework, including ISMS clauses 4–10 and the Annex A control
- Mapping of selected ISO 27001:2022 Annex A controls to AWS services and architectural capabilities
- Guidance for implementing complementary customer controls within AWS environments
- Recommendations for evidence collection, documentation, and audit readiness using AWS native tooling
- Governance and risk management considerations for organizations establishing an ISMS on AWS
- Best practices for operationalizing compliance activities through automation and infrastructure-as-code.
By combining ISO 27001 best practices with AWS security services, organizations can build scalable environments that support continuous security improvement, operational visibility, and certification readiness.
Download: ISO/IEC 27001:2022 on AWS Compliance Guide
For further assistance, contact AWS Security Assurance Services
If you have feedback about this post, please submit comments in the Comments section below.
Announcing the AWS Sustainability console: Programmatic access, configurable CSV reports, and Scope 1–3 reporting in one place
Post Syndicated from Sébastien Stormacq original https://aws.amazon.com/blogs/aws/announcing-the-aws-sustainability-console-programmatic-access-configurable-csv-reports-and-scope-1-3-reporting-in-one-place/
As many of you are, I’m a parent. And like you, I think about the world I’m building for my children. That’s part of why today’s launch matters for many of us. I’m excited to announce the launch of the AWS Sustainability console, a standalone service that consolidates all AWS sustainability reporting and resources in one place.
With the The Climate Pledge, Amazon set a goal in 2019 to reach net-zero carbon across our operations by 2040. That commitment shapes how AWS builds its data centers and services. In addition, AWS is also committed to helping you measure and reduce the environmental footprint of your own workloads. The AWS Sustainability console is the latest step in that direction.
The AWS Sustainability console builds on the Customer Carbon Footprint Tool (CCFT), which lives inside the AWS Billing console, and introduces a new set of capabilities for which you’ve been asking.
Until now, accessing your carbon footprint data required billing-level permissions. That created a practical problem: sustainability professionals and reporting teams often don’t have (and shouldn’t need) access to cost and billing data. Getting the right people access to the right data meant navigating permission structures that weren’t designed with sustainability workflows in mind. The AWS Sustainability console has its own permissions model, independent of the Billing console. Sustainability professionals can now get direct access to emissions data without requiring billing permissions to be granted alongside it.
The console includes Scope 1, 2, and 3 emissions attributed to your AWS usage and shows you a breakdown by AWS Region, service, such as Amazon CloudFront, Amazon Elastic Compute Cloud (Amazon EC2), and Amazon Simple Storage Service (Amazon S3). The underlying data and methodology haven’t changed with this launch; these are the same as the ones used by the CCFT. We changed how you can access and work with the data.
As sustainability reporting requirements have grown more complex, teams need more flexibility accessing and working with their emissions data. The console now includes a Reports page where you can download preset monthly and annual carbon emissions reports covering both market-based method (MBM) and location-based method (LBM) data. You can also build a custom comma-separated values (CSV) report by selecting which fields to include, the time granularity, and other filters.
If your organization’s fiscal year doesn’t align with the calendar year, you can now configure the console to match your reporting period. When that is set, all data views and exports reflect your fiscal year and quarters, which removes a common friction point for finance and sustainability teams working in parallel.
You can also use the new API or the AWS SDKs to integrate emissions data into your own reporting pipelines, dashboards, or compliance workflows. This is useful for teams that need to pull data for a specific month across a large number of accounts without setting up a data export or for organizations that need to establish custom account groupings that don’t align with their existing AWS Organizations structure.
You can read about the latest features released and methodology updates directly on the Release notes page on the Learn more tab.
Lets see it in action
To show you the Sustainability console, I opened the AWS Management Console and searched for “sustainability” in the search bar at the top of the screen.
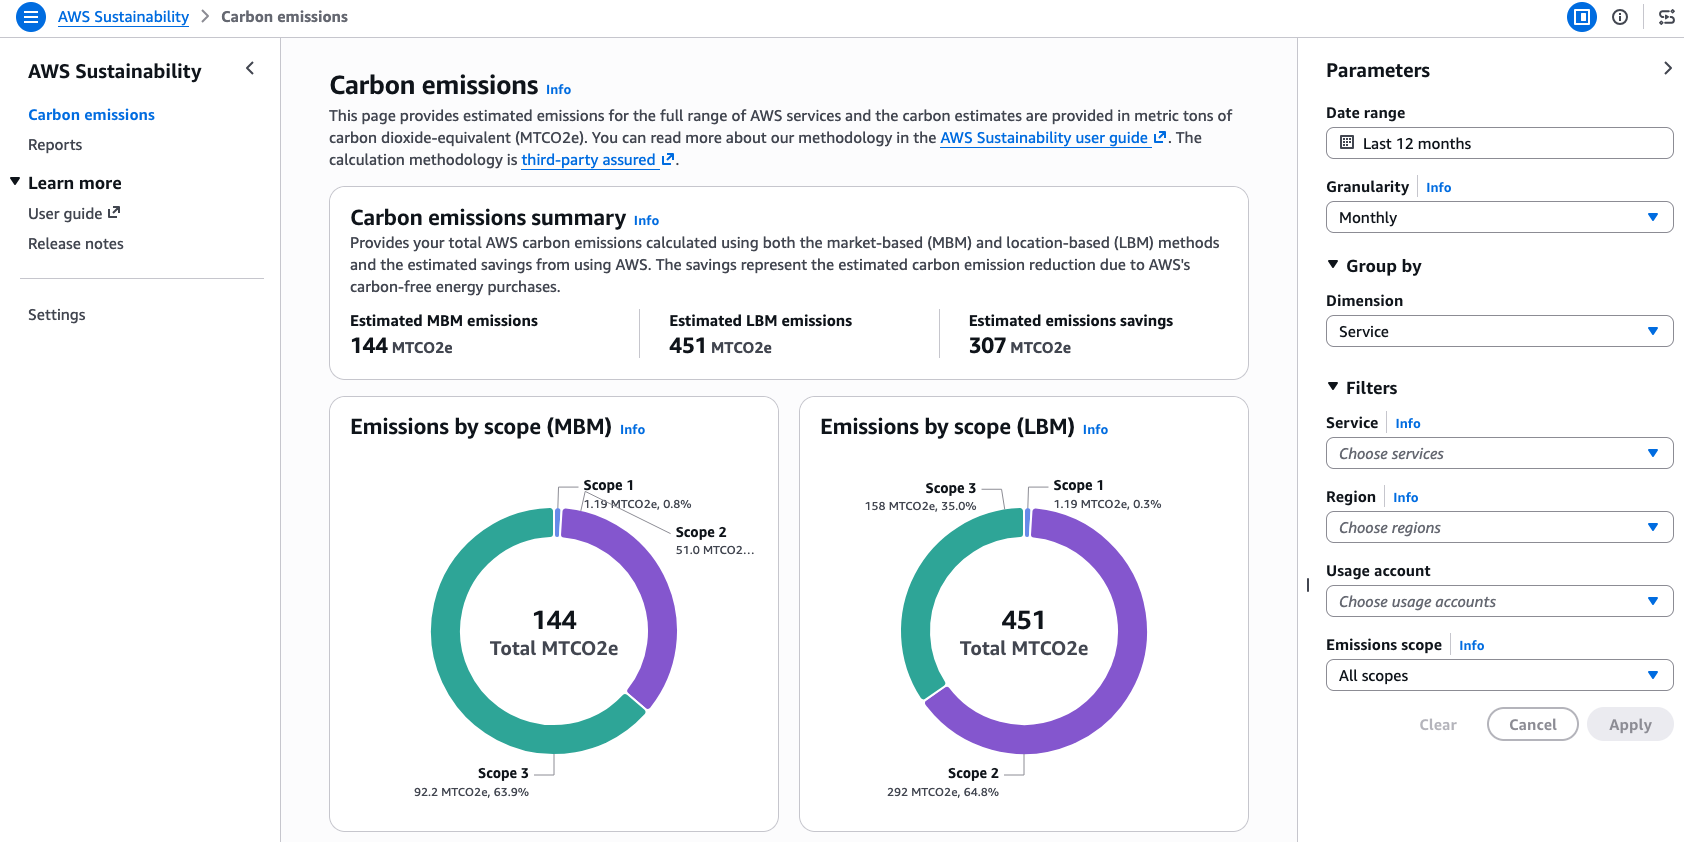
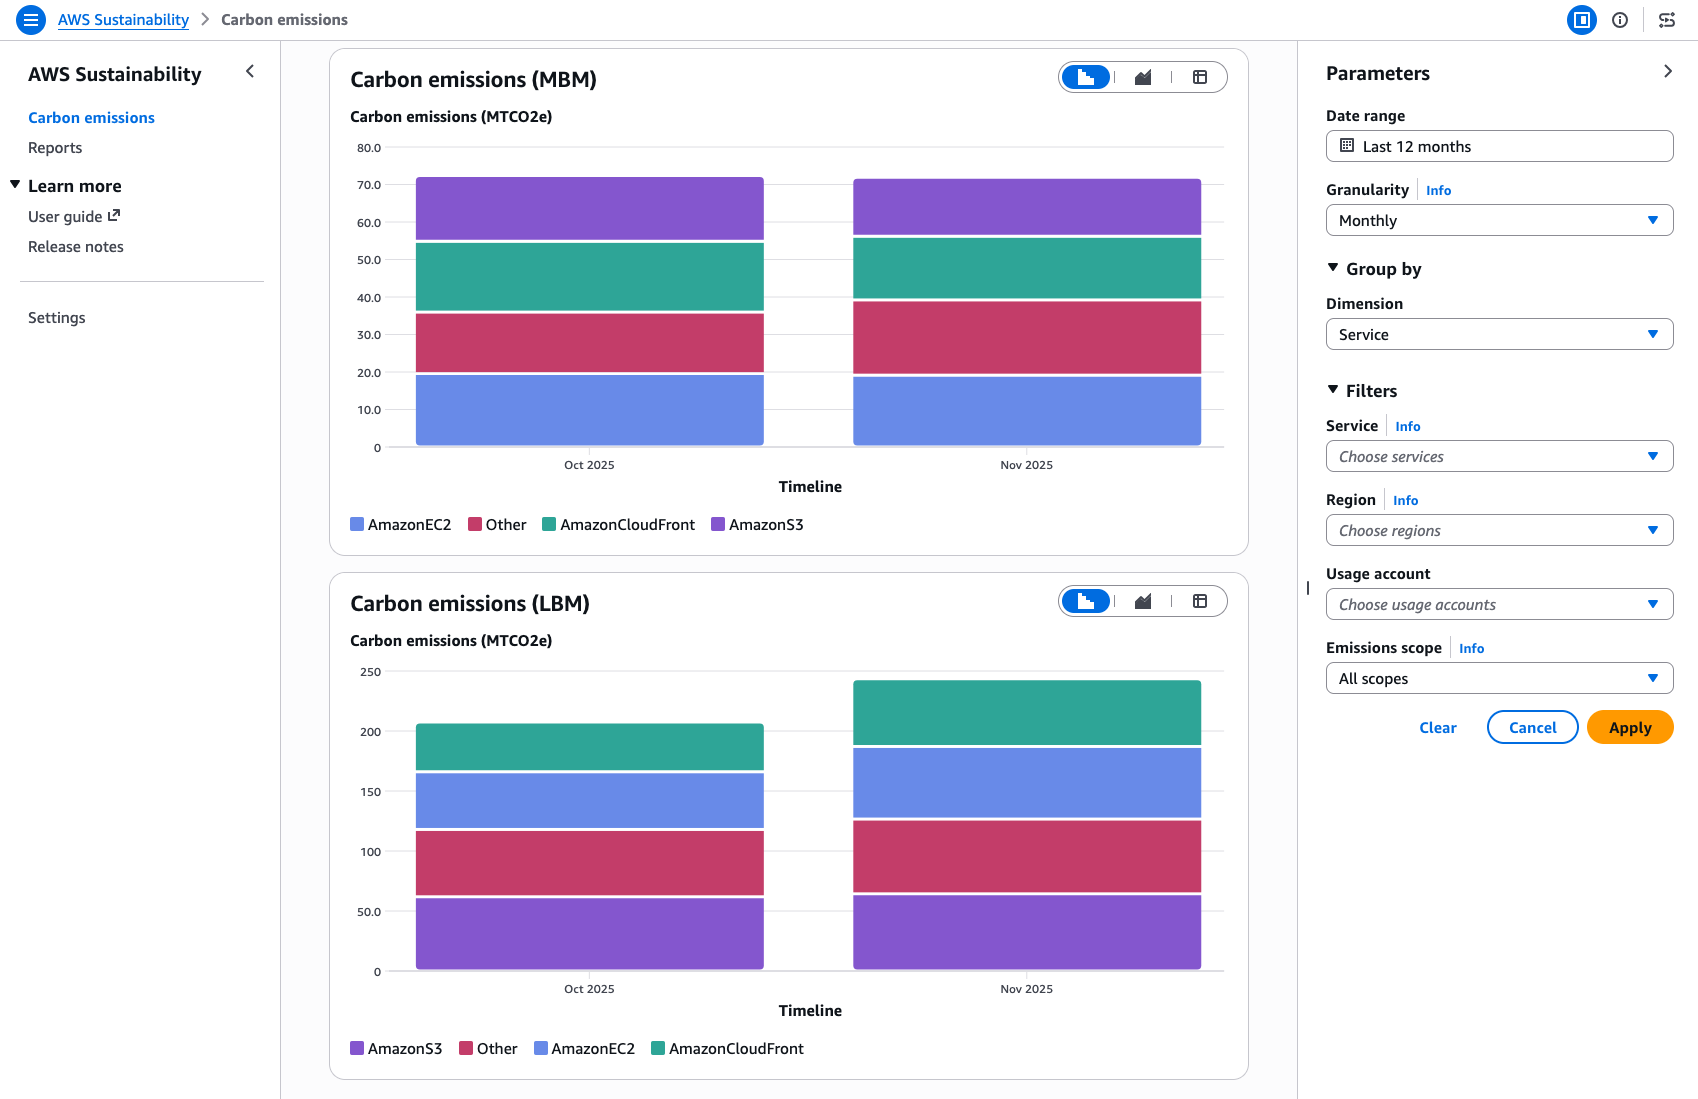
The Carbon emissions section gives an estimate on your carbon emissions, expressed in metric tons of carbon dioxide equivalent (MTCO2e). It shows the emissions by scope, expressed in the MBM and the LBM. On the right side of the screen, you can adjust the date range or filter by service, Regions, and more.
For those unfamiliar: Scope 1 includes direct emissions from owned or controlled sources (for example, data center fuel use); Scope 2 covers indirect emissions from the production of purchased energy (with MBM accounting for energy attribute certificates and LBM using average local grid emissions); and Scope 3 includes other indirect emissions across the value chain, such as server manufacturing and data center construction. You can read more about this in our methodology document, which was independently verified by Apex, a third-party consultant.
I can also use API or AWS Command Line Interface (AWS CLI) to programmatically pull the emissions data.
aws sustainability get-estimated-carbon-emissions \
     --time-period='{"Start":"2025-03-01T00:00:00Z","End":"2026-03-01T23:59:59.999Z"}'

{
    "Results": [
        {
            "TimePeriod": {
                "Start": "2025-03-01T00:00:00+00:00",
                "End": "2025-04-01T00:00:00+00:00"
            },
            "DimensionsValues": {},
            "ModelVersion": "v3.0.0",
            "EmissionsValues": {
                "TOTAL_LBM_CARBON_EMISSIONS": {
                    "Value": 0.7,
                    "Unit": "MTCO2e"
                },
                "TOTAL_MBM_CARBON_EMISSIONS": {
                    "Value": 0.1,
                    "Unit": "MTCO2e"
                }
            }
        },
...
The combination of the visual console and the new API gives you two additional ways to work with your data, in addition to the Data Exports still available. You can now explore and identify hotspots on the console and automate the reporting you want to share with stakeholders.
The Sustainability console is designed to grow. We plan to continue to release new features as we grow the console’s capabilities alongside our customers.
Get started today
The AWS Sustainability console is available today at no additional cost. You can access it from the AWS Management Console. Historical data is available going back to January 2022, so you can start exploring your emissions trends right away.
Get started on the console today. If you want to learn more about the AWS commitment to sustainability, visit the AWS Sustainability page.
Streamlining access to powerful disaster recovery capabilities of AWS
Post Syndicated from Jennifer Moran original https://aws.amazon.com/blogs/architecture/streamlining-access-to-powerful-disaster-recovery-capabilities-of-aws/
Learn how you can use AWS services like AWS Backup and AWS Elastic Disaster Recovery (AWS DRS), along with AWS Resilience Competency Partner solutions like Arpio to implement powerful and comprehensive Disaster Recovery solutions.
Resilience is the ability of your application to keep running even when “bad stuff” happens. A critical part of your resilience strategy is Disaster Recovery (DR). DR is what protects you against less frequent, but bigger faults like natural disasters, technical faults, and bad actors. To maintain critical business continuity, disaster recovery requires recovering your workload to a new site, such as a different AWS Region or AWS account.
AWS provides powerful tools for all aspects of resilience. However, achieving a comprehensive Disaster Recovery solution for your cloud workloads using native AWS services requires planning and engineering effort. This is because, as the Shared Responsibility Model for Resiliency states, resilience is a shared responsibility between AWS and the customer. This blog post will help you understand your responsibilities and show you how to reduce the work required to access the powerful DR capabilities of AWS.
In this blog post, we take a building blocks approach. Starting with the tools like AWS Backup to protect your data, we then add protection for Amazon Elastic Compute Cloud (Amazon EC2) compute using AWS Elastic Disaster Recovery (AWS DRS). Finally, we show how to use the full capabilities of AWS to restore your entire workload—data, infrastructure, networking, and configuration, using Arpio disaster recovery automation.
Your recovery site
For DR, your recovery site is usually going to be a different AWS Region (cross-Region) or a different AWS account (cross-account) than where your workload runs.
Cross-Region backup and recovery are essential for disaster recovery. This helps to keep your workloads protected if an event causes your source Region to be unable to run your workload. AWS Regions are strong fault isolation boundaries, so the event in your source is highly unlikely to affect your recovery Region.
Cross-account backup is a critical security measure to enable recovery from malware and ransomware. By storing copies of your data in a separate clean room recovery account with distinct credentials, you create an isolated environment that can’t be accessed, even if the source account is compromised.
Protecting your data
We start with your data—your data is the foundation of your workload.
Each AWS data storage resource offers the ability to back up or replicate your data. For example, Amazon Elastic Block Store (Amazon EBS) snapshots, Amazon Relational Database Service (Amazon RDS) for Db2) Backups, and Amazon Simple Storage Service (Amazon S3) replication, offer data protection for Amazon EBS volumes, Amazon RDS Databases instances, and Amazon S3 Buckets respectively. Figure 1, for example, illustrates the several methods and destinations of backup and replication for Amazon RDS.
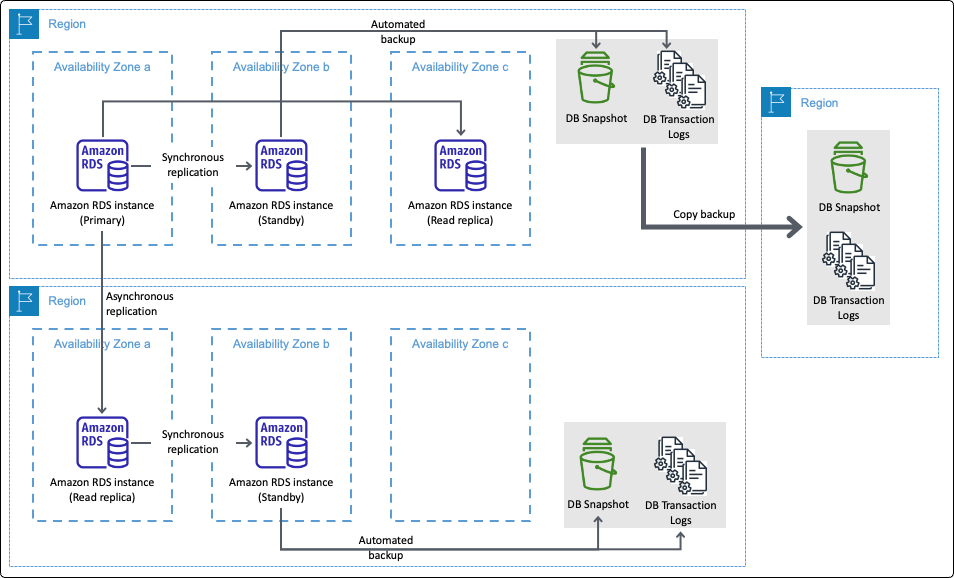
Figure 1. AWS Backup and replication for Amazon RDS
AWS Backup takes this further, tying together many of these disparate backup technologies, giving a single plane of glass to configure data backup plans across resources. AWS Backup also added backup capabilities for AWS resources that previously didn’t have them such as Amazon Elastic File System (Amazon EFS) and Amazon FSx. It also provides the ability to back up your data to a different AWS Region or AWS account. It even enabled cross-Region backup for services like Amazon DynamoDB, which previously didn’t have that capability.
AWS Backup is a powerful tool for protecting your data. With your data protected, you will then need additional automation to get to a fully recovered workload. If you want to build this yourself, AWS offers the tools to do this. In this prior blog post on Backup and Restore, we go more into detail about adding automation using Amazon EventBridge and AWS Lambda functions for automated recovery. For more information, see figures 6 and 7.
With its ability to create vaults for secure storage, define policies for governance, and set schedules for automation, AWS Backup centralizes and streamlines the backup process. Instead of managing backups service by service, you can enforce consistent protection across resources, reduce manual effort, and streamline recovery when it matters most.
Protecting your Amazon EC2 compute
As important as data is, only restoring your data isn’t a complete solution to recovering from disaster. You must also restore your compute resources.
For static Amazon EC2 instances, you can create snapshots of your instances as Amazon Machine Images (AMIs), or use AWS Backup to manage this for you. By static instances, we mean those you create directly and maintain, as opposed to those created by Amazon EC2 Auto Scaling. Such a strategy can deliver a Recovery Points Objective (RPO) and Recovery Time Objective (RTO) of minutes to hours. The size (and growth in size) of your EC2 instances determines the time to back them up. Their size and launch time determines the time to restore them.
If you need real-time RPO (near-zero data loss) and RTO (recovery) in minutes or less, then AWS DRS is the solution here. AWS DRS provides a nearly continuous block-level replication, recovery orchestration, and automated server conversion capabilities. With these, you to achieve a crash-consistent recovery point objective of seconds, and a recovery time objective typically ranging between 5–20 minutes. You can also use AWS DRS to configure your recovery Amazon Virtual Private Cloud (Amazon VPC). So, with the right settings, you can get your EC2 networking to look like your primary environment.
Protecting everything in your entire workload
Restoring data and static EC2 instances is only part of the disaster recovery solution that you need. Modern workloads often rely on a broader range of compute services, including EC2 Auto Scaling, AWS Lambda, Amazon ECS, and Amazon Elastic Kubernetes Service (Amazon EKS). For ECS and EKS, you can run on EC2 instances or go serverless with AWS Fargate. You will need a solution that can restore either of these.
The challenge with these services is making sure that they are recreated with the right configuration and metadata. For example, EC2 instance types and volume sizes, EC2 user data, or AWS Lambda function code, and not everything here is stateless. Both ECS and EKS can rely on persistent Amazon EBS volumes or Amazon Elastic File System (Amazon EFS). In those cases, recovery requires restoring the data and reattaching volumes restored from backup to the correct ECS tasks or EKS pods.
You can build automation to do all of this, or you can rely on an AWS Resilience Software Competency Partner solution to take care of this for you. Arpio is a software as a service (SaaS) product focused on discovering and backing up everything it takes to run your workload on AWS, and recovering it cross-Region and cross-account as a fully functional workload.
Figure 2 illustrates how AWS tools (left) establish a powerful foundation for robust workload recovery. Beyond these foundational building blocks, full recovery requires additional resources (right), including AWS compute options as discussed. Furthermore, complex networking (potentially spanning VPCs and accounts), infrastructure, and IAM principals are critical. Arpio uses and extends AWS Backup, AWS DRS, and other AWS service capabilities to back up and restore a functional AWS workload, including all its necessary components. This unburdens you from the undifferentiated heavy lifting of building your own automation. You still have responsibilities in the shared responsibility model, but Arpio takes on most of the work of getting you backed up and recovered.
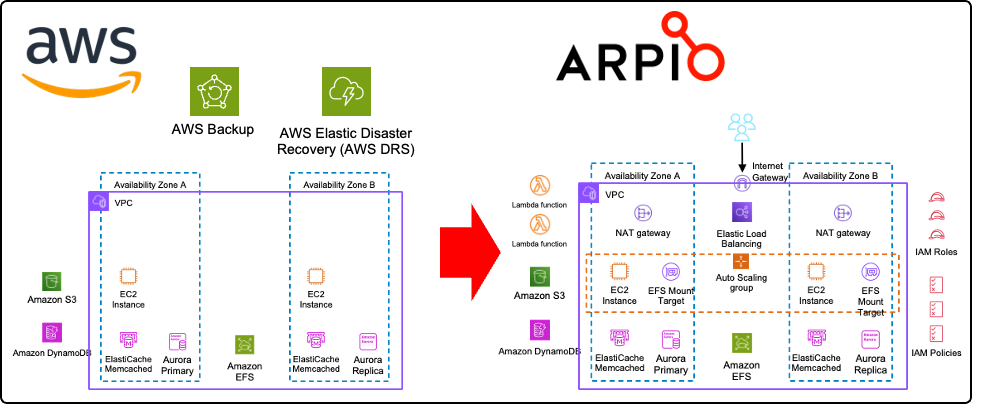
Figure 2. AWS tools on the left provide a powerful foundation for full recovery on the right
Even with data, compute, networking, infrastructure, and IAM principals restored, there is another requirement to achieve full recovery: translation of your configuration. For example, an application that accesses the Amazon RDS database requires configuration information about the DB endpoint and credentials. When restoring your RDS instance into your recovery environment, it will have a new endpoint. Arpio addresses this using a two-fold strategy. First Arpio will find all references to the early database endpoint name and translate them to the new database endpoint name. Next, Arpio will also create an Amazon Route 53 private hosted zone in the recovered VPC, mapping the early endpoint to the new one using a CNAME record. This way, applications still using the early name still connect to the newly recovered database. Arpio also securely backs up the credentials in your recovery account, for every database backup taken, ready to be recovered for the point in time that you recover your database from. Figure 3 shows how your recovered application can seamlessly access your restored database.
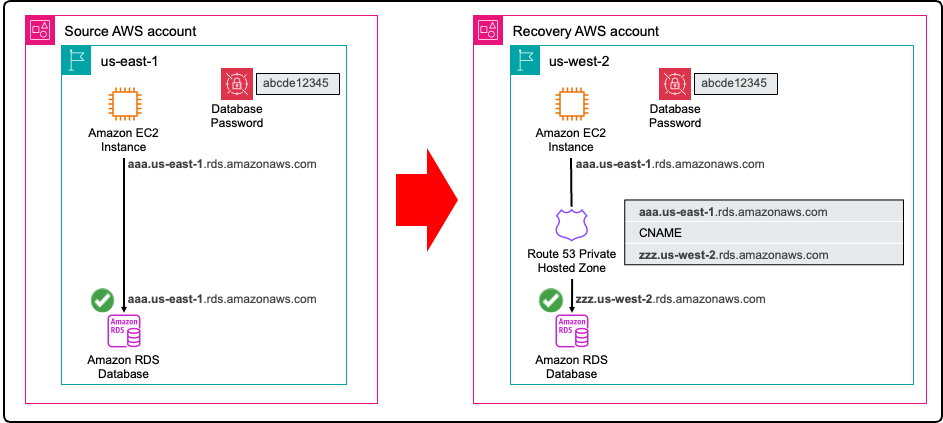
Figure 3. Arpio automation ensures your applications can access your restored database in the recovery environment
Figure 4 shows a sample AWS workload protected by Arpio. In the standby state, you can see how Arpio is coordinating multiple AWS services. When a disaster or ransomware event occurs, you can launch a recovery. This will create a fully recovered workload as seen in the recovery stage on the right.
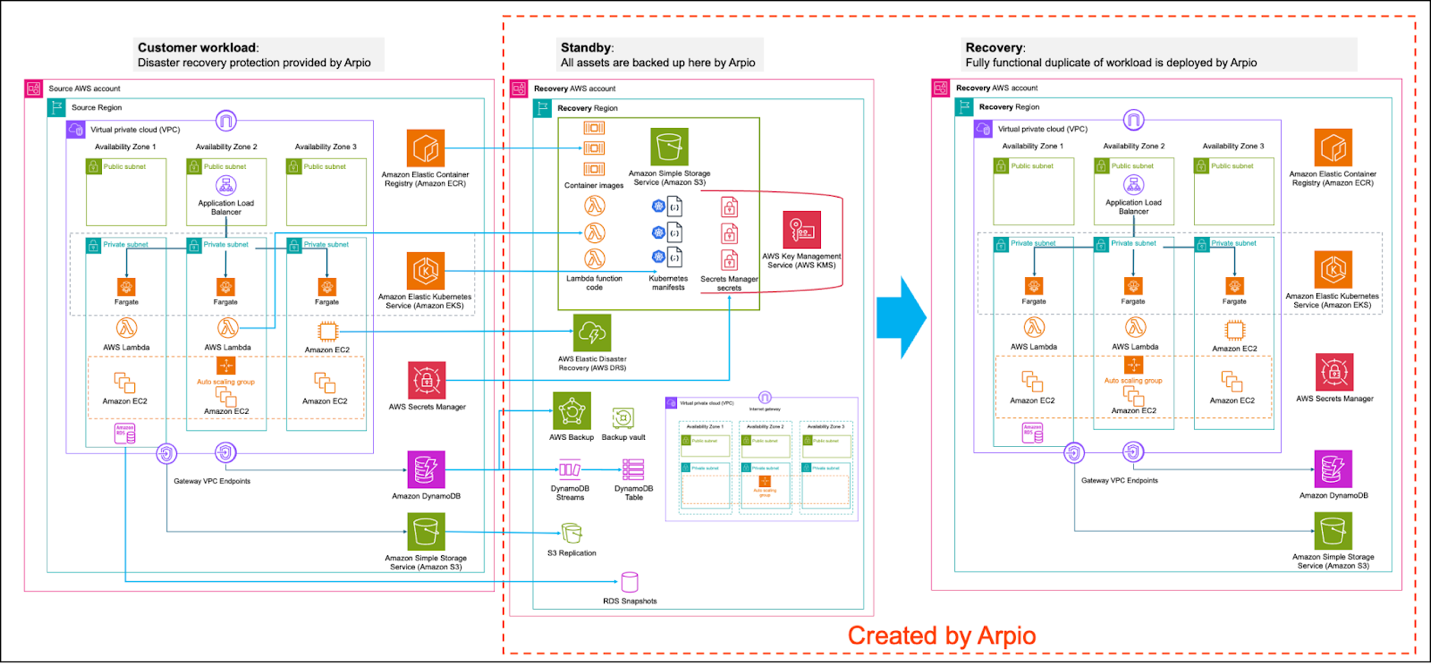
Figure 4. Sample AWS workload protected by Arpio
Arpio does all of this in your accounts, on your behalf. To enable this, Arpio applies AWS Well-Architected Tool (AWS WA Tool) best practices for security, using only IAM roles with least-privilege permissions. For example, the IAM role used to access your source AWS account is incapable of changing or mutating your source workload and is explicitly denied from reading or exfiltrating any data.
With its ability to back up over 140 AWS resources and restore them as fully functioning AWS workloads in a cross-Region cross-account recovery environment, Arpio builds on top of the powerful AWS tooling to streamline your complete workload recovery.
Conclusion
Disaster recovery (DR) is essential for a robust resilience strategy. By using the powerful tools offered by AWS and complementing them with AWS Resilience Competency Partner solutions like Arpio, organizations can significantly streamline access to comprehensive and powerful disaster recovery capabilities for their AWS workloads.
About the authors
ASRock Rack TURIND8-2L2T Review A Flexible AMD EPYC SP5 Motherboard
Post Syndicated from Patrick Kennedy original https://www.servethehome.com/asrock-rack-turind8-2l2t-review-a-flexible-amd-epyc-sp5-motherboard/
In our ASRock Rack TURIND8-2L2T review, we see how this motherboard manages to fit big processors while also exposing 128 PCIe Gen5 lanes
The post ASRock Rack TURIND8-2L2T Review A Flexible AMD EPYC SP5 Motherboard appeared first on ServeTheHome.
AWS Security Agent on-demand penetration testing now generally available
Post Syndicated from Ayush Singh original https://aws.amazon.com/blogs/security/aws-security-agent-on-demand-penetration-testing-now-generally-available/
AWS Security Agent on-demand penetration testing is now generally available, enabling you to run comprehensive security tests across all your applications, not only your most critical ones. This milestone transforms penetration testing from a periodic bottleneck into an on-demand capability that scales with your development velocity across AWS, Azure, GCP, other cloud-providers, and on-premises. With multicloud support, AWS Security Agent allows you to consolidate penetration testing across your entire infrastructure.
AWS Security Agent delivers autonomous penetration testing that operates 24/7 at a fraction of the cost than manual penetration tests. Most organizations limit manual penetration testing to their most critical applications and conduct these tests periodically due to time and cost limitations. This approach can leave the majority of their application portfolio exposed to vulnerabilities in the periods between tests. Security Agent allows you to increase the penetration testing speed, frequency, and coverage across all applications, not just your top critical applications. The Security Agent approach compresses the penetration testing timeline from weeks to days, dramatically reducing your exposure window while maintaining development velocity.
In preview, HENNGE K.K. shared, “AWS Security Agent delivered valuable insights that enhance the robustness of HENNGE’s products and services—insights we hadn’t discovered through manual testing. The contextually aware agentic AI approach provides different insights than traditional methods, while surfacing valuable application improvements beyond pure security findings. This allows us to rapidly accelerate our security lifecycle, reducing the typical testing duration by more than 90%.”
How on-demand penetration testing works
AWS Security Agent represents a new class of frontier agents – autonomous systems that work independently to achieve goals, scale massively to tackle concurrent tasks, and run persistently without constant human oversight. It deploys specialized AI agents to help discover, validate, and report security vulnerabilities through sophisticated multi-step attack scenarios. Unlike traditional scanners that generate findings without validation, AWS Security Agent operates penetration tester, helping to identify potential vulnerabilities, then attempting to exploit them with targeted payloads and attack chains to confirm they are legitimate security risks.
Consider the example of deploying a new payment processing feature. With traditional penetration testing, you would either delay the release until the next scheduled assessment, which could be weeks or months away, or you would deploy with uncertainty. With AWS Security Agent, you initiate a penetration test in minutes and receive validated findings within hours, as shown in the following figure, which you can use to help identify and remediate critical vulnerabilities before they reach production and deploy more confidently.
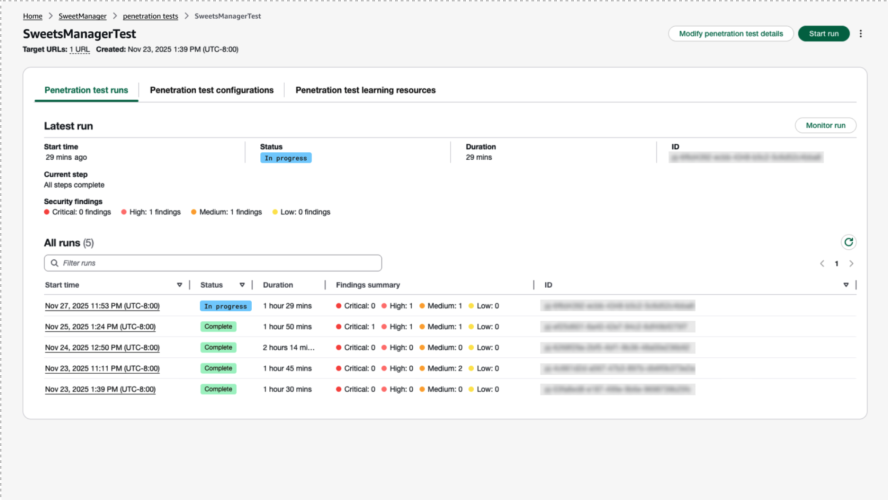
Figure 1: Initiate a pen test in minutes and receive validated findings within hours.
This validation approach helps minimize false positives and provides visibility into the agent’s reasoning. The agent shows how it plans attacks, what payloads it uses, the tools it builds to execute exploits, and how it verifies successful exploitation, providing transparency. Each finding includes Common Vulnerability Scoring System (CVSS) risk scores, application-specific severity ratings, and detailed reproduction steps, as shown in the following figure, so your team can focus on confirmed vulnerabilities rather than investigating scanner noise.
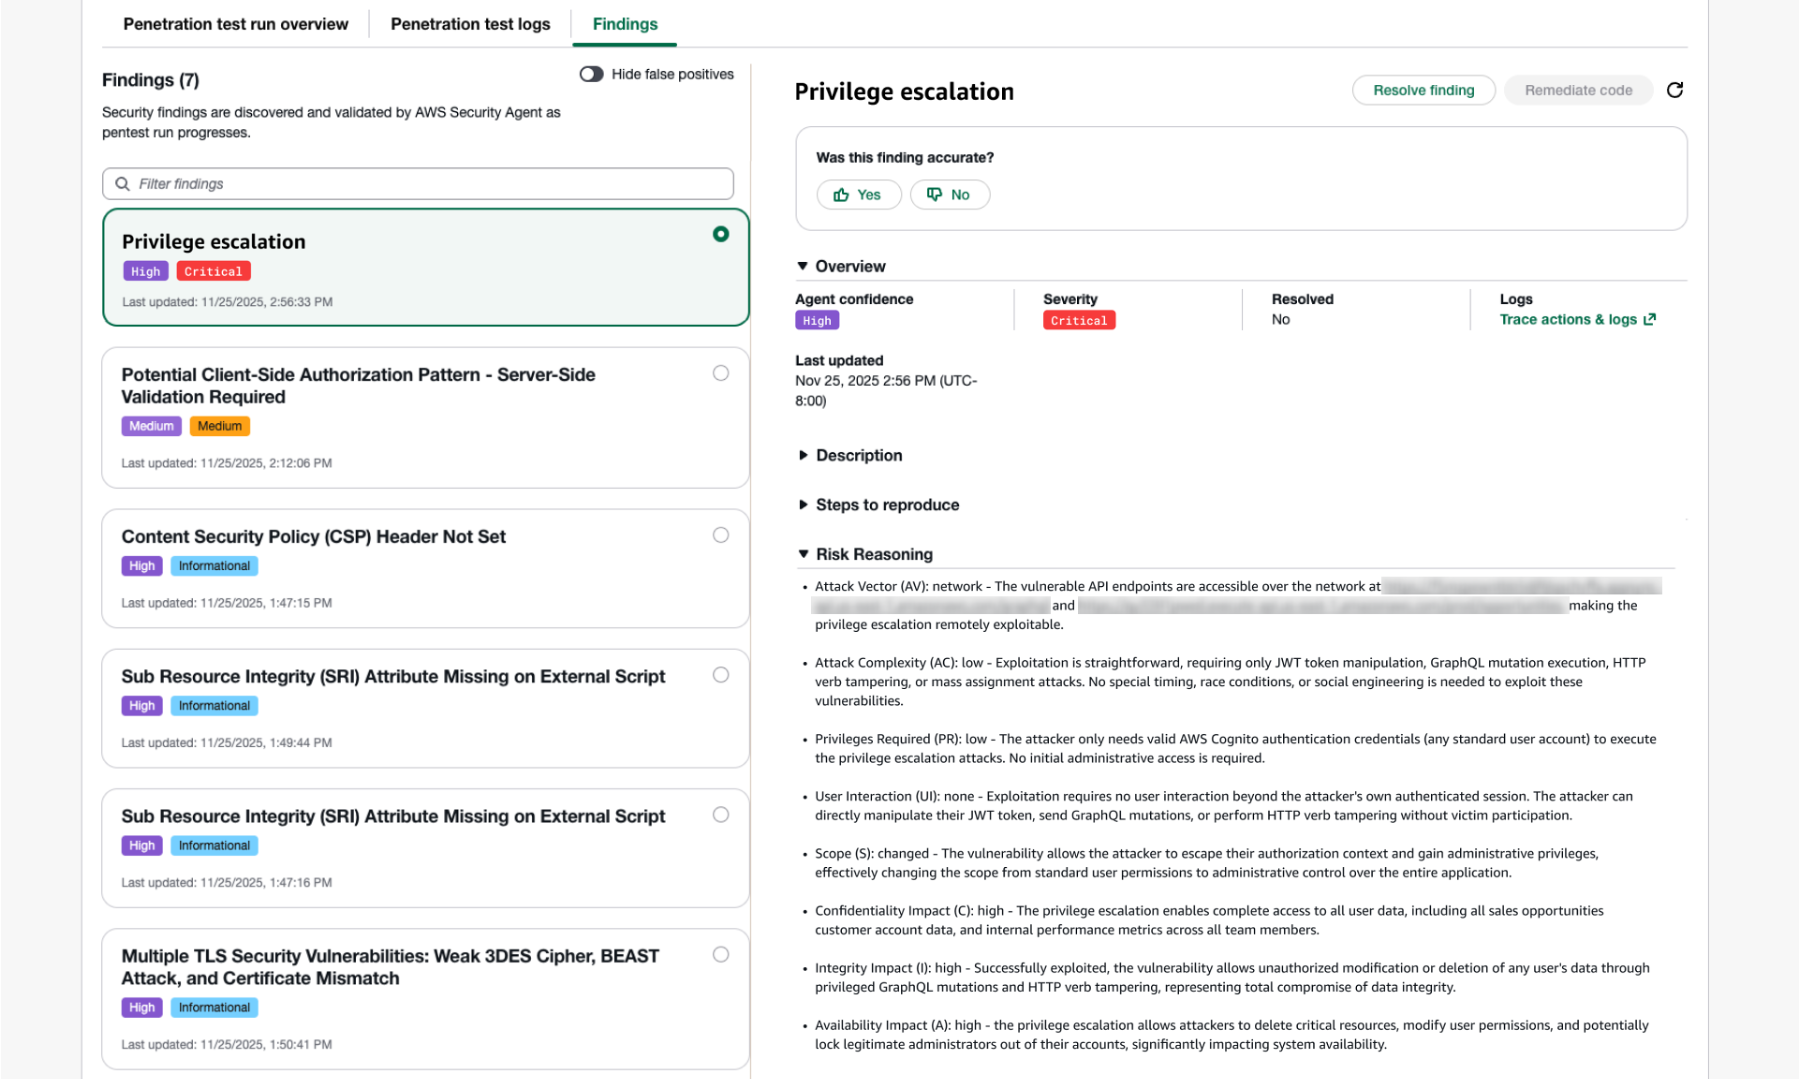
Figure 2: Each finding includes Common Vulnerability Scoring System (CVSS) risk scores, application-specific severity ratings, and detailed reproduction steps.
How AWS Security Agent delivers proactive, context-aware application security
AWS Security Agent combines static application security testing (SAST), dynamic application security testing (DAST), and penetration testing into a single context-aware agent. The agent ingests design documents, architecture diagrams, infrastructure-as-code, source code, user stories, and threat models to understand how you designed, built, and deployed your application. It then identifies how individual vulnerabilities connect into higher-severity attack chains. Richer context produces higher-quality findings and more actionable remediation recommendations.
Consider three findings detected by AWS Security Agent
These might have been discovered by other tools, but if they were detected, they might not have been properly prioritized in isolation because those tools lack contextual awareness of how the application was designed, built, and used, and how each finding is being used as part of an attack chain. These findings exist in custom code written by the customer, so there might not be a Common Vulnerabilities and Exposures (CVE) vulnerability to detect in all cases, making these zero-day vulnerability discoveries.
- Finding1 – Stored cross-site scripting (XSS) (CVSS 6.1, Medium): A threat actor could inject a script into a comment field that captures an admin’s session cookie inside standard HTTPS traffic. SAST and DAST might flag this as an isolated, medium-severity input validation issue competing with hundreds of other findings in a backlog. Without application context, these tools struggle to recognize it as the entry point to a critical chain.
- Finding 2 – Session hijack through admin access (unscored): A threat actor could use a hijacked admin session to reach restricted endpoints. This step goes undetected by every tool category, SAST analyzes code not runtime sessions, DAST crawls as a standard user, Endpoint Detection and Response (EDR) and Extended Detection and Response (XDR) see a valid HTTPS session hidden among other valid traffic. No finding is generated and no alerts are fired.
- Finding 3 – Database credential exfiltration through admin config endpoint (CVSS 9.8, Critical — never discovered):The admin panel exposes an
/admin/configendpoint returning environment variables, including the production database connection string with credentials in plaintext. A threat actor could use a hijacked admin session to call this endpoint, extract credentials, connect directly to the production database containing customer personally identifiable information (PII), and exfiltrate the full customer dataset. SAST doesn’t flag this because the code functions as designed. DAST never reaches the admin panel. EDR and XDR see a legitimate authenticated API call.
AWS Security Agent connects the dots
By ingesting the source code and documentation, AWS Security Agent identifies that the /admin/config endpoint exposes database credentials, something SAST, DAST, or a Software Composition Analysis (SCA) scanner would struggle to identify. SAST and DAST might flag Finding 1 as isolated and medium severity without recognizing it as the entry point to a critical chain. Finding 2 goes undetected, because SAST analyzes code not sessions, DAST crawls as a standard user, EDR and XDR see valid HTTPS traffic hidden among other valid traffic. Finding 3 goes unflagged because SAST doesn’t flag endpoints functioning as designed, DAST never reaches the admin panel, and EDR and XDR see legitimate API calls. The program requirements document (PRD) provided the key context that the endpoint was designed for legitimate troubleshooting but assumed the authentication gateway would prevent unauthorized access. AWS Security Agent chains all three findings, tests each step, and proves the full attack works.
The chain is the vulnerability
A deprioritized CVSS 6.1 XSS unlocks a critical CVSS 9.8 database credential exfiltration through steps that are beyond the capabilities of most automated SAST or DAST tools. Finding 1 sits in a backlog for weeks, contributing to alert fatigue for developers and security teams. Finding 2 generates no finding. Finding3 functions as designed. Developers fix critical and high findings first, but a CVSS 6.1 among hundreds of others waits, leaving customers exposed. AWS Security Agent, informed with application context, elevates the entire sequence from three isolated findings to a critical, validated vulnerability. This means deeper insights and recommended remediations, fewer false positives, and more cost-effective penetration testing. Security teams can now confidently scale continuous penetration testing across a wider application portfolio than is being tested today, or isn’t being tested as frequently while it’s being developed. AWS Security Agent delivers these insights and recommended remediations within hours instead of weeks, helping customers ship more secured applications faster.
Scout24 confirmed the value of these capabilities directly:
“AWS Security Agent outperformed traditional DAST by combining agentic testing with source-code context to deliver code-aware application security testing. It identified a critical publicly exploitable issue that other approaches had not surfaced. Its transparent reasoning gave us confidence in the attack paths explored and the coverage achieved.” – Abdul Al-Kibbe, Tech Lead, Security, Scout24 SE
Bamboo Health validated the depth of context-aware discovery in their own usage:
“AWS Security Agent surfaced findings that no other tool has uncovered by truly understanding the application, its code, and connecting that context to what it discovered during testing. Legacy scanners simply could not match what Security Agent revealed. It gave us visibility into issues we typically would not see, even from human pentesting teams. For the first time, it felt like I had an AI tool on my side as a defender.” – Travis Allen, Manager of Security Operations at Bamboo Health
Set up your first penetration test
Setting up a penetration test is straightforward and includes the following steps.
Create agent spaces as logical boundaries
Start by creating an agent space for each application or project. An agent space serves as a logical boundary where you can connect documents and code repositories for your application. The agent uses this application context from your documentation and code to create targeted test cases specific to your implementation. For example, create an Ecommerce Platform agent space and connect your GitHub repository, API specifications, and architecture documentation. By analyzing these materials to understand how your application handles payment processing, sessions, and user stories, the agent creates targeted test cases for payment manipulation vulnerabilities and session hijacking risks specific to your implementation.
Complete domain ownership validation
Before testing begins, complete domain ownership validation by adding a DNS TXT record or uploading a verification file to your domain. This required step helps ensure you have authorization to test the target application, protecting both you and AWS. Complete this one-time setup for all domains during initial configuration to prevent delays when running penetration tests.
Add application context for improved accuracy and deeper findings
While optional, providing source code and documentation considerably improves testing accuracy. Include the following:
- Source code: Enables white-box testing to identify implementation-specific vulnerabilities. You can directly connect your source code repositories with GitHub integration
- API specifications (OpenAPI or Swagger): Documents all endpoints, parameters, and authentication requirements so the agent tests comprehensively rather than discovering endpoints through trial and error
- Architecture documentation: Helps the agent understand service interactions and potential attack chains
- Product requirements documents: Helps the agent understand purpose, features, functionality, and user stories when using the application
- Existing threat models: Guides the agent to focus on your highest-risk areas and known concerns
Test across any environment
AWS Security Agent operates across AWS, Azure, GCP, other cloud-providers, and on-premises. Configure public endpoints directly by providing the URL, or connect private endpoints through a VPC for secure testing of internal applications without internet exposure. By using this multicloud support, you can consolidate security testing across your entire infrastructure using AWS Security Agent.
Testing authenticated applications
Most vulnerabilities exist in authenticated areas of applications, and you can’t find them without signing in. Configure multiple credentials for different user roles to enable comprehensive testing:
- Standard user credentials for customer-facing functionality
- Privileged user credentials for administrative functions
- Service account credentials for API-to-API authentication
- Multi-factor authentication (MFA), including MFA and two-factor authentication (2FA) and
By testing with multiple credential sets, AWS Security Agent identifies privilege escalation vulnerabilities, for example, discovering that a standard user can access admin functions by manipulating API parameters.
Provide sign-in guidance for complex authentication
AWS Security Agent uses large language model (LLM)-based sign-in capabilities to navigate authentication flows including OAuth, SAML, Okta, and MFA. Providing clear sign-in guidance significantly improves success rates, for example:
- Navigate to
app.example.com/auth/login - Enter
usernamein the Email or Username field - Enter
passwordin the Password field - Choose Sign In
Specific instructions, sequential steps, and success verification criteria help the agent navigate your authentication flow reliably.
From findings to fixes: The complete security lifecycle
Review the findings and take actions to remediate with AWS Security Agent.
Validated, actionable findings
AWS Security Agent validates potential vulnerabilities by attempting exploitation to confirm the security risk exists. This validation approach minimizes false positives and reduces the time your team spends manually verifying findings, so you can focus on legitimate vulnerabilities that require fixes. The agent achieved a 92.5% success rate on CVE Bench v2.0, demonstrating its capability to discover and validate real-world vulnerabilities.
Each finding includes CVSS risk scores, application-specific severity ratings, detailed reproduction steps, and impact analysis that explains the business risk. In an ecommerce application, the agent might discover a price manipulation vulnerability and show that attackers can modify product prices during checkout, allowing customers to obtain items for free and directly impacting revenue.
The agent also identifies how vulnerabilities chain together, showing how lower-severity findings can become gateways to critical exploits.
You can export reports as PDF files for executive reporting, compliance documentation, developer handoffs, and audit trails.
Remediation with code fix suggestion completes the process
Traditional penetration testing ends with a report, then weeks or months pass while developers research, implement, and deploy fixes. AWS Security Agent completes the security lifecycle:
- Run penetration test and identify confirmed vulnerabilities
- Review findings and prioritize critical issues
- Trigger remediation to generate pull requests with code fixes
- Developer review and merge the ready-to-implement fixes in hours instead of days
- Retest to confirm vulnerabilities are resolved
- Deploy with confidence knowing security issues are addressed
Get started with on-demand penetration testing
AWS Security Agent on-demand penetration testing is now available in the following AWS Regions:
- US East (N. Virginia)
- US West (Oregon)
- Europe (Ireland)
- Europe (Frankfurt)
- Asia Pacific (Sydney)
- Asia Pacific (Tokyo)
Pricing
Pricing is straightforward and transparent: $50 per task-hour, metered per second. A task-hour represents the time AWS Security Agent actively works on testing your application. Based on current metrics, an average application test takes approximately 24 task-hours, resulting in a typical cost of $1,200 per comprehensive penetration test and remediation. See the AWS Security Agent pricing page for more details on pricing and free trial.
Sample bill:
- Small web application (8 task-hours): $400
- Medium ecommerce platform (24 task-hours): $1,200
- Large enterprise application (48 task-hours): $2,400
Note: The preceding sample bills and estimated costs are for illustrative purposes only and are not guaranteed. Actual costs can vary based on multiple factors including application complexity, number of endpoints, authentication mechanisms, code base size, and the depth of testing required. Your actual penetration test duration and cost will depend on your specific application characteristics.
By using AWS Security Agent, you can perform penetration testing more quickly, frequently, and on more of your applications at a reduced cost. For example, some customers found that AWS Security Agent provided up to 70–90% savings compared to traditional manual penetration testing approaches.
Ready to transform your security testing?
Create your first agent space and run your first penetration test in minutes:
- Visit the AWS Management Console for AWS Security Agent
- Create an agent space for your application
- Complete domain ownership validation
- Connect your code repository and add documentation
- Configure and run your first penetration test
Conclusion
By using on-demand penetration testing in AWS Security Agent, you can test all your applications continuously, not just your most critical ones periodically. Start with one application, experience validated findings and automatic remediation in action, then scale comprehensive security testing across your entire portfolio.
Visit AWS Security Agent to begin testing today.
Washington DC: The Seat of Power #sponsored
Post Syndicated from Geographics original https://www.youtube.com/watch?v=6wJSgqg2SfY
Julia Minson | How to Disagree Better | Talks at Google
Post Syndicated from Talks at Google original https://www.youtube.com/watch?v=GigRB6bZ0MI
Agent-driven development in Copilot Applied Science
Post Syndicated from Tyler McGoffin original https://github.blog/ai-and-ml/github-copilot/agent-driven-development-in-copilot-applied-science/
I may have just automated myself into a completely different job…
This is a familiar pattern among software engineers, who often, through inspiration, frustration, or sometimes even laziness, build systems to remove toil and focus on more creative work. We then end up owning and maintaining those systems, unlocking that automated goodness for the rest of those around us.
As an AI researcher, I recently took this beyond what was previously possible and have automated away my intellectual toil. And now I find myself maintaining this tool to enable all my peers on the Copilot Applied Science team to do the same.
During this process, I learned a lot about how to effectively create and collaborate using GitHub Copilot. Applying these learnings has unlocked an incredibly fast development loop for myself as well as enabled my team mates to build solutions to fit their needs.
Before I get into explaining how I made this possible, let me set the stage for what spawned this project so you better understand the scope of what you can do with GitHub Copilot.
The impetus
A large part of my job involves analyzing coding agent performance as measured against standardized evaluation benchmarks, like TerminalBench2 or SWEBench-Pro. This often involves poring through tons of what are called trajectories, which are essentially lists of the thought processes and actions agents take while performing tasks.
Each task in an evaluation dataset produces its own trajectory, showing how the agent attempted to solve that task. These trajectories are often .json files with hundreds of lines of code. Multiply that over dozens of tasks in a benchmark set and again over the many benchmark runs needing analysis on any given day, and we’re talking hundreds of thousands of lines of code to analyze.
It’s an impossible task to do alone, so I would typically turn to AI to help. When analyzing new benchmark runs, I found that I kept repeating the same loop: I used GitHub Copilot to surface patterns in the trajectories then investigated them myself—reducing the number of lines of code I had to read from hundreds of thousands to a few hundred.
However, the engineer in me saw this repetitive task and said, “I want to automate that.” Agents provide us with the means to automate this kind of intellectual work, and thus eval-agents was born.
The plan
Engineering and science teams work better together. That was my guiding principle as I set about solving this new challenge.
Thus, I approached the design and implementation strategy of this project with a couple of goals in mind:
- Make these agents easy to share and use
- Make it easy to author new agents
- Make coding agents the primary vehicle for contributions
Bullets one and two are in GitHub’s lifeblood and are values and skills I’ve gained throughout my career, especially during my stint as an OSS maintainer on the GitHub CLI.
However, goal three shaped the project the most. I noticed that when I set GitHub Copilot up to help me build the tool effectively, it also made the project easier to use and collaborate on. That experience taught me a few key lessons, which ultimately helped push the first and second goals forward in ways I didn’t expect.
Making coding agents your primary contributor
I’ll start by describing my agentic coding setup:
- Coding agent: Copilot CLI
- Model used: Claude Opus 4.6
- IDE: VSCode
It’s also noteworthy that I leveraged the Copilot SDK to accelerate agent creation, which is powered under the hood by the Copilot CLI. This gave me access to existing tools and MCP servers, a way to register new tools and skills, and a whole bunch of other agentic goodness out of the box that I didn’t have to reinvent myself.
With that out of the way, I could streamline the whole development process very quickly by following a few core principles:
- Prompting strategies: agents work best when you’re conversational, verbose, and when you leverage planning modes before agent modes.
- Architectural strategies: refactor often, update docs often, clean up often.
- Iteration strategies: “trust but verify” is now “blame process, not agents.”
Uncovering and following these strategies led to an incredible phenomenon: adding new agents and features was fast and easy. We had five folks jump into the project for the first time, and we created a total of 11 new agents, four new skills, and the concept of eval-agent workflows (think scientist streams of reasoning) in less than three days. That amounted to a change of +28,858/-2,884 lines of code across 345 files.
Holy crap!
Below, I’ll go into detail about these three principles and how they enabled this amazing feat of collaboration and innovation.
Prompting strategies
We know that AI coding agents are really good at solving well-scoped problems but need handholding for the more complex problems you’d only entrust to your more senior engineers.
So, if you want your agent to act like an engineer, treat it like one. Guide its thinking, over-explain your assumptions, and leverage its research speed to plan before jumping into changes. I found it far more effective to put some stream-of-consciousness musings about a problem I was chewing on into a prompt and working with Copilot in planning mode than to give it a terse problem statement or solution.
Here’s an example of a prompt I wrote to add more robust regression tests to the tool:
> /plan I've recently observed Copilot happily updating tests to fit its new paradigms even though those tests shouldn't be updated. How can I create a reserved test space that Copilot can't touch or must reserve to protect against regressions?This resulted in a back and forth that ultimately led to a series of guardrails akin to contract testing that can only be updated by humans. I had an idea of what I wanted, and through conversation, Copilot helped me get to the right solution.
It turns out that the things that make human engineers the most effective at doing their jobs are the same things that make these agents effective at doing theirs.
Architectural strategies
Engineers, rejoice! Remember all those refactors you wanted to do to make the codebase more readable, the tests you never had time to write, and the docs you wish had existed when you onboarded? They’re now the most important thing you can be working on when building an agent-first repository.
Gone are the days where deprioritizing this work over new feature work was necessary, because delivering features with Copilot becomes trivial when you have a well-maintained, agent-first project.
I’ve spent most of my time on this project refactoring names and file structures, documenting new features or patterns, and adding test cases for problems that I’ve uncovered as I go. I’ve even spent a few cycles cleaning up the dead code that the agents (like your junior engineers) may have missed while implementing all these new features and changes.
This work makes it easy for Copilot to navigate the codebase and understand the patterns, just like it would for any other engineer.
I can even ask, “Knowing what I know now, how would I design this differently?” And I can then justify actually going back and rearchitecting the whole project (with the help of Copilot, of course).
It’s a dream come true!
And this leads me to my last bit of guidance.
Iteration strategies
As agents and models have improved, I have moved from a “trust but verify” mindset to one that is more trusting than doubtful. This mirrors how the industry treats human teams: “blame process, not people.” It’s how the most effective teams operate, because people make mistakes, so we build systems around that reality.
This idea of blameless culture provides psychological safety for teams to iterate and innovate, knowing that they won’t be blamed if they make a mistake. The core principle is that we implement processes and guardrails to protect against mistakes, and if a mistake does happen, we learn from it and introduce new processes and guardrails so that our teams won’t make the same mistake again.
Applying this same philosophy to agent-driven development has been fundamental to unlocking this incredibly rapid iteration pipeline. That means we add processes and guardrails to help prevent the agent from making mistakes, but when it does make a mistake, we add additional guardrails and processes—like more robust tests and better prompts—so the agent can’t make the same mistake again. Taking this one step further means that practicing good CI/CD principles is a must.
Practices like strict typing ensure the agent conforms to interfaces. Robust linters impose implementation rules on the agent that keep it following good patterns and practices. And integration, end-to-end, and contract tests—which can be expensive to build manually—become much cheaper to implement with agent assistance, while giving you confidence that new changes don’t break existing features.
When Copilot has these tools available in its development loop, it can check its own work. You’re setting it up for success, much in the same way you’d set up a junior engineer for success in your project.
Putting it all together
Here’s what all this means for your development loop when you’ve got your codebase set up for agent-driven development:
- Plan a new feature with Copilot using
/plan.- Iterate on the plan.
- Ensure that testing is included in the plan.
- Ensure that docs updates are included in the plan and done before code is implemented. These can serve as additional guidelines that live beside your plan.
- Let Copilot implement the feature on
/autopilot. - Prompt Copilot to initiate a review loop with the Copilot Code Review agent. For me, it’s often something like:
request Copilot Code Review, wait for the review to finish, address any relevant comments, and then re-request review. Continue this loop until there are no more relevant comments. - Human review. This is where I enforce the patterns I discussed in the previous sections.
Additionally, outside of your feature loop, be sure you’re prompting Copilot early and often with the following:
/plan Review the code for any missing tests, any tests that may be broken, and dead code/plan Review the code for any duplication or opportunities for abstraction/plan Review the documentation and code to identify any documentation gaps. Be sure to update the copilot-instructions.md to reflect any relevant changes
I have these run automatically once a week, but I often find myself running them throughout the week as new features and fixes go in to maintain my agent-driven development environment.
Take this with you
What started as a frustration with an impossibly repetitive analysis task turned into something far more interesting: a new way of thinking about how we build software, how we collaborate, and how we grow as engineers.
Building agents with a coding agent-first mindset has fundamentally changed how I work. It’s not just about the automation wins—though watching four scientists ship 11 agents, four skills, and a brand-new concept in under three days is nothing short of remarkable. It’s about what this style of development forces you to prioritize: clean architecture, thorough documentation, meaningful tests, and thoughtful design—the things we always knew mattered but never had time for.
The analogy to a junior engineer keeps proving itself out. You onboard them well, give them clear context, build guardrails so their mistakes don’t become disasters, and then trust them to grow. If something goes wrong, you blame the process. Not the agent. If there’s one thing I want you to take away from this, it’s that the skills that make you a great engineer and a great teammate are the same skills that make you great at building with Copilot. The technology is new. The principles aren’t.
So go clean up that codebase, write that documentation you’ve been putting off, and start treating your Copilot like the newest member of your team. You might just automate yourself into the most interesting work of your career.
Think I’m crazy? Well, try this:
- Download Copilot CLI
- Activate Copilot CLI in any repo:
cd <repo_path> && copilot - Paste in the following prompt:
/plan Read <link to this blog post> and help me plan how I could best improve this repo for agent-first development
The post Agent-driven development in Copilot Applied Science appeared first on The GitHub Blog.
Viktor Orbán #lastweektonight
Post Syndicated from LastWeekTonight original https://www.youtube.com/shorts/RqdBxcnvtOA