Enabling data classification for Amazon RDS database with Macie

Post Syndicated from Bruno Silveira original https://aws.amazon.com/blogs/security/enabling-data-classification-for-amazon-rds-database-with-amazon-macie/

Customers have been asking us about ways to use Amazon Macie data discovery on their Amazon Relational Database Service (Amazon RDS) instances. This post presents how to do so using AWS Database Migration Service (AWS DMS) to extract data from Amazon RDS, store it on Amazon Simple Storage Service (Amazon S3), and then classify the data using Macie. Macie’s resulting findings will also be made available to be queried with Amazon Athena by appropriate teams.

The challenge

Let’s suppose you need to find sensitive data in an RDS-hosted database using Macie, which currently only supports S3 as a data source. Therefore, you will need to extract and store the data from RDS in S3. In addition, you will need an interface for audit teams to audit these findings.

Solution overview

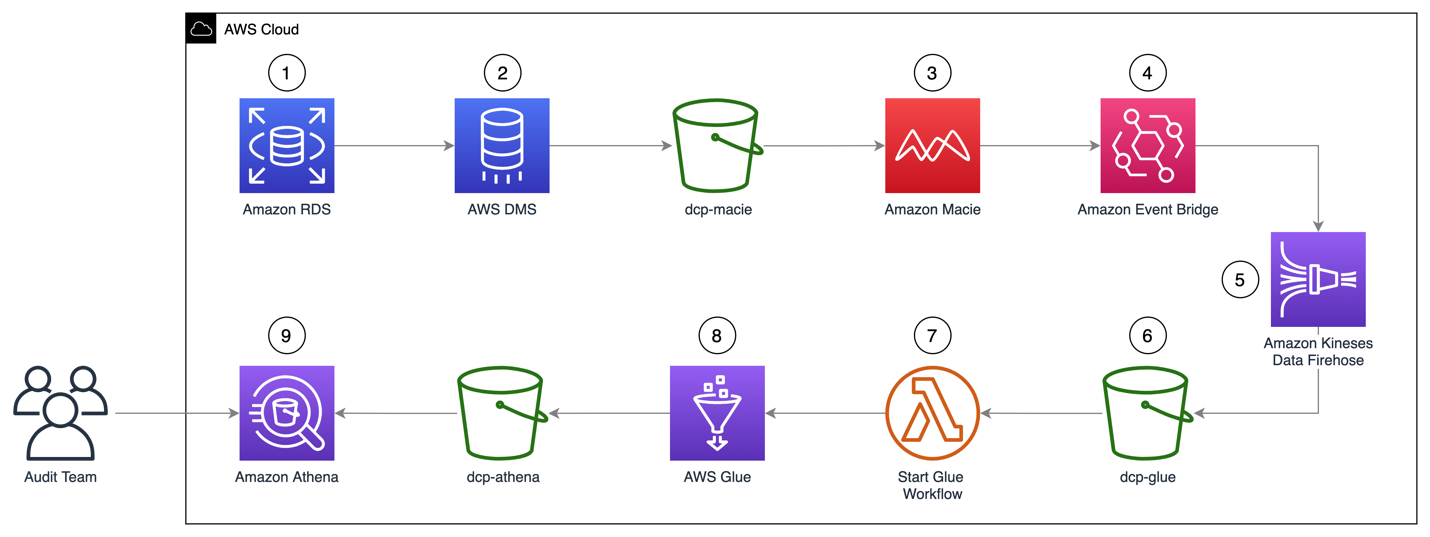
Figure 1: Solution architecture workflow

Figure 1: Solution architecture workflow

The architecture of the solution in Figure 1 can be described as:

  1. A MySQL engine running on RDS is populated with the Sakila sample database.
  2. A DMS task connects to the Sakila database, transforms the data into a set of Parquet compressed files, and loads them into the dcp-macie bucket.
  3. A Macie classification job analyzes the objects in the dcp-macie bucket using a combination of techniques such as machine learning and pattern matching to determine whether the objects contain sensitive data and to generate detailed reports on the findings.
  4. Amazon EventBridge routes the Macie findings reports events to Amazon Kinesis Data Firehose.
  5. Kinesis Data Firehose stores these reports in the dcp-glue bucket.
  6. S3 event notification triggers an AWS Lambda function whenever an object is created in the dcp-glue bucket.
  7. The Lambda function named Start Glue Workflow starts a Glue Workflow.
  8. Glue Workflow transforms the data from JSONL to Apache Parquet file format and places it in the dcp-athena bucket. This provides better performance during data query and optimized storage usage using a binary optimized columnar storage.
  9. Athena is used to query and visualize data generated by Macie.

Note: For better readability, the S3 bucket nomenclature omits the suffix containing the AWS Region and AWS account ID used to meet the global uniqueness naming requirement (for example, dcp-athena-us-east-1-123456789012).

The Sakila database schema consists of the following tables:

  • actor
  • address
  • category
  • city
  • country
  • customer

Building the solution

Prerequisites

Before configuring the solution, the AWS Identity and Access Management (IAM) user must have appropriate access granted for the following services:

You can find an IAM policy with the required permissions here.

Step 1 – Deploying the CloudFormation template

You’ll use CloudFormation to provision quickly and consistently the AWS resources illustrated in Figure 1. Through a pre-built template file, it will create the infrastructure using an Infrastructure-as-Code (IaC) approach.

  1. Download the CloudFormation template.
  2. Go to the CloudFormation console.
  3. Select the Stacks option in the left menu.
  4. Select Create stack and choose With new resources (standard).
  5. On Step 1 – Specify template, choose Upload a template file, select Choose file, and select the file template.yaml downloaded previously.
  6. On Step 2 – Specify stack details, enter a name of your preference for Stack name. You might also adjust the parameters as needed, like the parameter CreateRDSServiceRole to create a service role for RDS if it does not exist in the current account.
  7. On Step 3 – Configure stack options, select Next.
  8. On Step 4 – Review, check the box for I acknowledge that AWS CloudFormation might create IAM resources with custom names, and then select Create Stack.
  9. Wait for the stack to show status CREATE_COMPLETE.

Note: It is expected that provisioning will take around 10 minutes to complete.

Step 2 – Running an AWS DMS task

To extract the data from the Amazon RDS instance, you need to run an AWS DMS task. This makes the data available for Amazon Macie in an S3 bucket in Parquet format.

  1. Go to the AWS DMS console.
  2. In the left menu, select Database migration tasks.
  3. Select the task Identifier named rdstos3task.
  4. Select Actions.
  5. Select the option Restart/Resume.

When the Status changes to Load Complete the task has finished and you will be able to see migrated data in your target bucket (dcp-macie).

Inside each folder you can see parquet file(s) with names similar to LOAD00000001.parquet. Now you can use Macie to discover if you have sensitive data in your database contents as exported to S3.

Step 3 – Running a classification job with Amazon Macie

Now you need to create a data classification job so you can assess the contents of your S3 bucket. The job you create will run once and evaluate the complete contents of your S3 bucket to determine whether it can identify PII among the data. As mentioned earlier, this job only uses the managed identifiers available with Macie – you could also add your own custom identifiers.

  1. Go to the Macie console.
  2. Select the S3 buckets option in the left menu.
  3. Choose the S3 bucket dcp-macie containing the output data from the DMS task. You may need to wait a minute and select the Refresh icon if the bucket names do not display.

  4. Select Create job.
  5. Select Next to continue.
  6. Create a job with the following scope.
    1. Sensitive data Discovery options: One-time job
    2. Sampling Depth: 100%
    3. Leave all other settings with their default values
  7. Select Next to continue.
  8. Select Next again to skip past the Custom data identifiers section.
  9. Give the job a name and description.
  10. Select Next to continue.
  11. Verify the details of the job you have created and select Submit to continue.

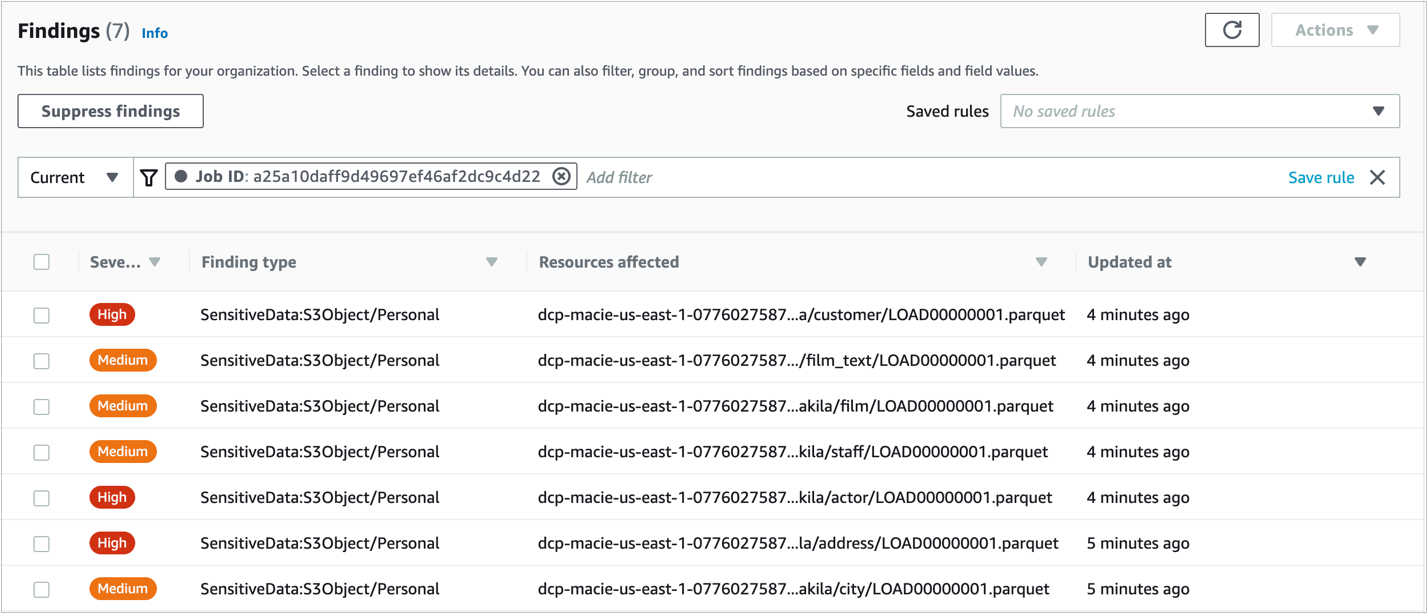
You will see a green banner stating that The Job was successfully created. The job can take up to 15 minutes to conclude and the Status will change from Active to Complete. To open the findings from the job, select the job’s check box, choose Show results, and select Show findings.
 

Figure 2: Macie Findings screen

Figure 2: Macie Findings screen

Note: You can navigate in the findings and select each checkbox to see the details.

Step 4 – Enabling querying on classification job results with Amazon Athena

  1. Go to the Athena console and open the Query editor.
  2. If it’s your first-time using Athena you will see a message Before you run your first query, you need to set up a query result location in Amazon S3. Learn more. Select the link presented with this message.
  3. In the Settings window, choose Select and then choose the bucket dcp-assets to store the Athena query results.
  4. (Optional) To store the query results encrypted, check the box for Encrypt query results and select your preferred encryption type. To learn more about Amazon S3 encryption types, see Protecting data using encryption.
  5. Select Save.

Step 5 – Query Amazon Macie results with Amazon Athena.

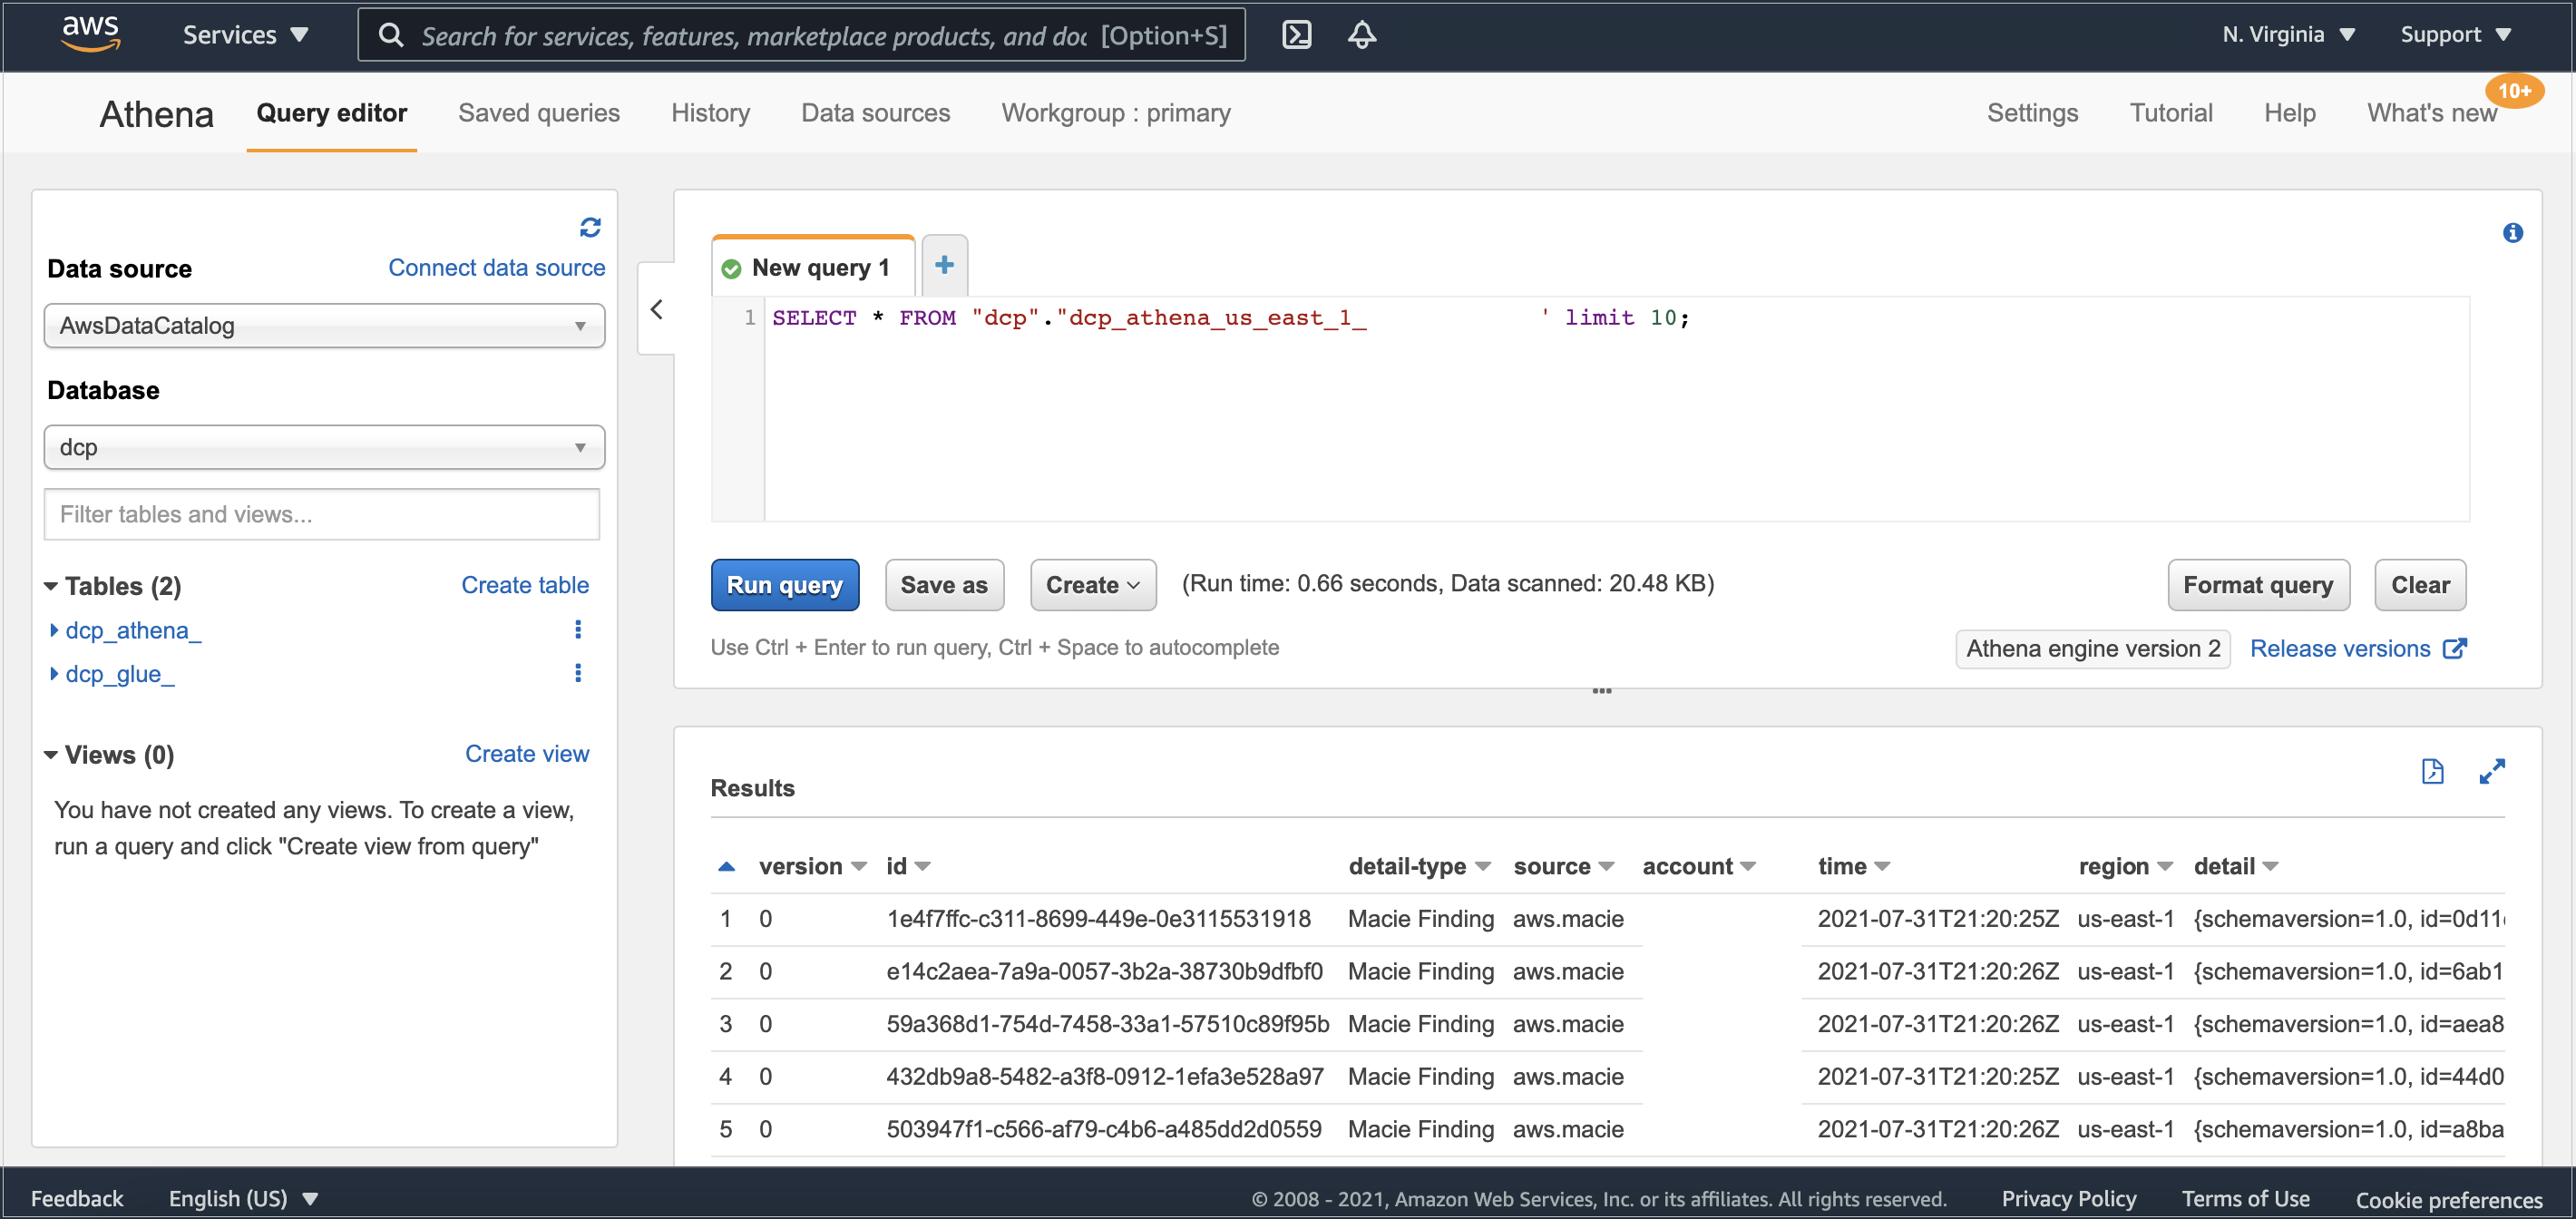
It might take a few minutes for the data to complete the flow between Amazon Macie and AWS Glue. After it’s finished, you’ll be able to see in Athena’s console the table dcp_athena within the database dcp.

Then, select the three dots next to the table dcp_athena and select the Preview table option to see a data preview, or run your own custom queries.
 

Figure 3: Athena table preview

Figure 3: Athena table preview

As your environment grows, this blog post on Top 10 Performance Tuning Tips for Amazon Athena can help you apply partitioning of data and consolidate your data into larger files if needed.

Clean up

After you finish, to clean up the solution and avoid unnecessary expenses, complete the following steps:

  1. Go to the Amazon S3 console.
  2. Navigate to each of the buckets listed below and delete all its objects:
    • dcp-assets
    • dcp-athena
    • dcp-glue
    • dcp-macie
  3. Go to the CloudFormation console.
  4. Select the Stacks option in the left menu.
  5. Choose the stack you created in Step 1 – Deploying the CloudFormation template.
  6. Select Delete and then select Delete Stack in the pop-up window.

Conclusion

In this blog post, we show how you can find Personally Identifiable Information (PII), and other data defined as sensitive, in Macie’s Managed Data Identifiers in an RDS-hosted MySQL database. You can use this solution with other relational databases like PostgreSQL, SQL Server, or Oracle, whether hosted on RDS or EC2. If you’re using Amazon DynamoDB, you may also find useful the blog post Detecting sensitive data in DynamoDB with Macie.

By classifying your data, you can inform your management of appropriate data protection and handling controls for the use of that data.

If you have feedback about this post, submit comments in the Comments section below.

Want more AWS Security how-to content, news, and feature announcements? Follow us on Twitter.

Author

Bruno Silveira

Bruno is a Solutions Architect Manager in the Public Sector team with a focus on educational institutions in Brazil. His previous career was in government, financial services, utilities, and nonprofit institutions. Bruno is an enthusiast of cloud security and an appreciator of good rock’n roll with a good beer.

Author

Thiago Pádua

Thiago is Solutions Architect in the AWS Worldwide Public Sector team working in the development and support of partners. He is experienced in software development and systems integration, mainly in the telecommunications industry. He has a special interest in microservices, serverless, and containers.

Firefox 93.0

Post Syndicated from original https://lwn.net/Articles/871966/rss

Firefox 93.0 has been released. With this version Firefox supports the new
AVIF image format, which is based on the modern and royalty free AV1 video
codec. The PDF viewer supports filling more forms, such as XFA-based forms
used by multiple governments and banks. Downloads that rely on insecure
connections are blocked, protecting against potentially malicious or unsafe
downloads. Details on these features and more can be found in the release notes.

Security updates for Tuesday

Post Syndicated from original https://lwn.net/Articles/871948/rss

Security updates have been issued by Fedora (cryptopp), Mageia (kernel, kernel-linus, and sqlite), openSUSE (rabbitmq-server), Red Hat (kernel and samba), SUSE (glibc and webkit2gtk3), and Ubuntu (containerd, docker.io, imlib2, ledgersmb, mercurial, mongodb, and node-bl).

Политици в Белград и в София “Биволъ” в #PandoraPapers: Финансистът на Сърбия Nr.1 и Делян Пеевски

Post Syndicated from Николай Марченко original https://bivol.bg/%D0%B1%D0%B8%D0%B2%D0%BE%D0%BB%D1%8A-%D0%B2-pandorapapers-%D1%84%D0%B8%D0%BD%D0%B0%D0%BD%D1%81%D0%B8%D1%81%D1%82%D1%8A%D1%82-%D0%BD%D0%B0-%D1%81%D1%8A%D1%80%D0%B1%D0%B8%D1%8F-nr-1-%D0%B8-%D0%B4.html

вторник 5 октомври 2021


Две разследвания с участие на Сайта за разследваща журналистика „Биволъ“ са от ключово значение в поредицата „Досиетата на Пандора“ за политическата ситуация в Сърбия и България. Единият от близките съратници…

What’s New in InsightIDR: Q3 2021 in Review

Post Syndicated from Margaret Wei original https://blog.rapid7.com/2021/10/05/whats-new-in-insightidr-q3-2021-in-review/

What's New in InsightIDR: Q3 2021 in Review

This post offers a closer look at some of the recent updates and releases in InsightIDR, our extended detection and response solution, from Q3 2021.

Welcome IntSights to the Rapid7 Insight Platform family!

As you may have seen in recent communications, Rapid7 acquired IntSights, a leading provider of external threat intelligence and remediation. We’re excited to introduce their flagship external threat intelligence product, Threat Command, as part of our Rapid7 portfolio. Threat Command allows any SecOps team, regardless of size or capability maturity, to expand identification and remediation across an ever-expanding attack surface, while automating threat mitigation.

New detection rule management experience

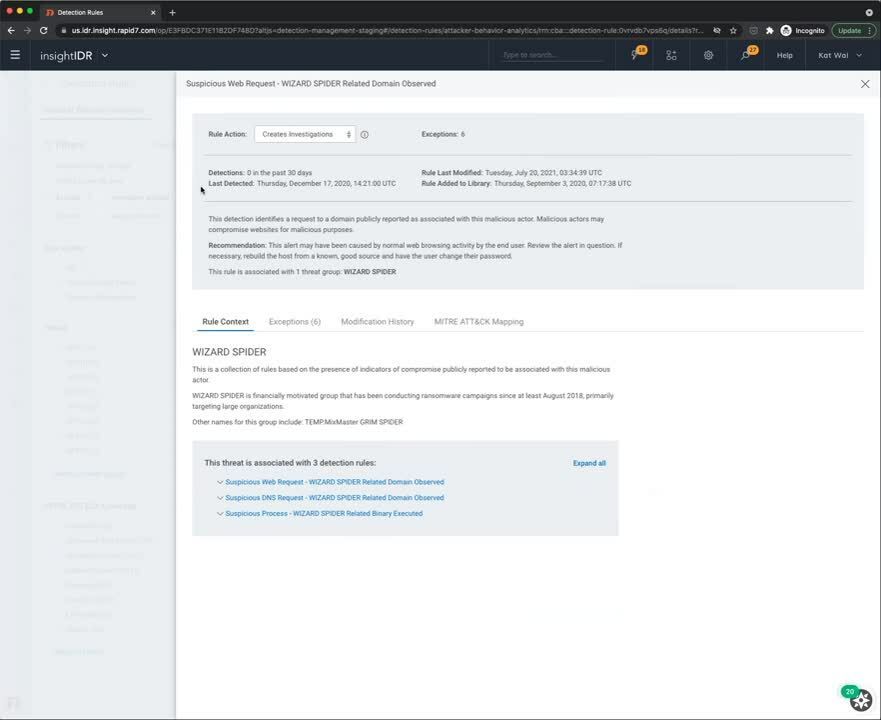
We’re excited to announce that InsightIDR customers now have more customization and increased visibility for Attacker Behavior Analytics (ABA) detections. We’re continuing to make improvements and additions to our detections management experience — here are the latest additions:

  • Detection rules — Filter detection rules by threat group, rule behavior, and attributes for more visibility into your alerts and investigations.
  • MITRE ATT&CK mapping — View and filter detections by specific MITRE ATT&CK framework tactics and techniques for more context to the alerts in your environment.
  • Create exceptions to a detection rule — In the past, IDR customers could only turn alerts on or off for notable events. Now, you can create an exception that allows you to filter out noise and turn off detections based on key value pairs.

See the latest detection management experience in the demo below:

What's New in InsightIDR: Q3 2021 in Review

526 new ABA detection rules added to IDR

We’ve also added 526 new ABA detection rules into InsightIDR to expand its coverage of Windows, Mac, and Linux suspicious process threats, covering a wide variety of techniques on the MITRE ATT&CK matrix. These detection rules can be tuned to your environment by creating exceptions and modifying the rule action to only receive the alerts you care about. Visit the Detection Library for actionable descriptions and recommendations.

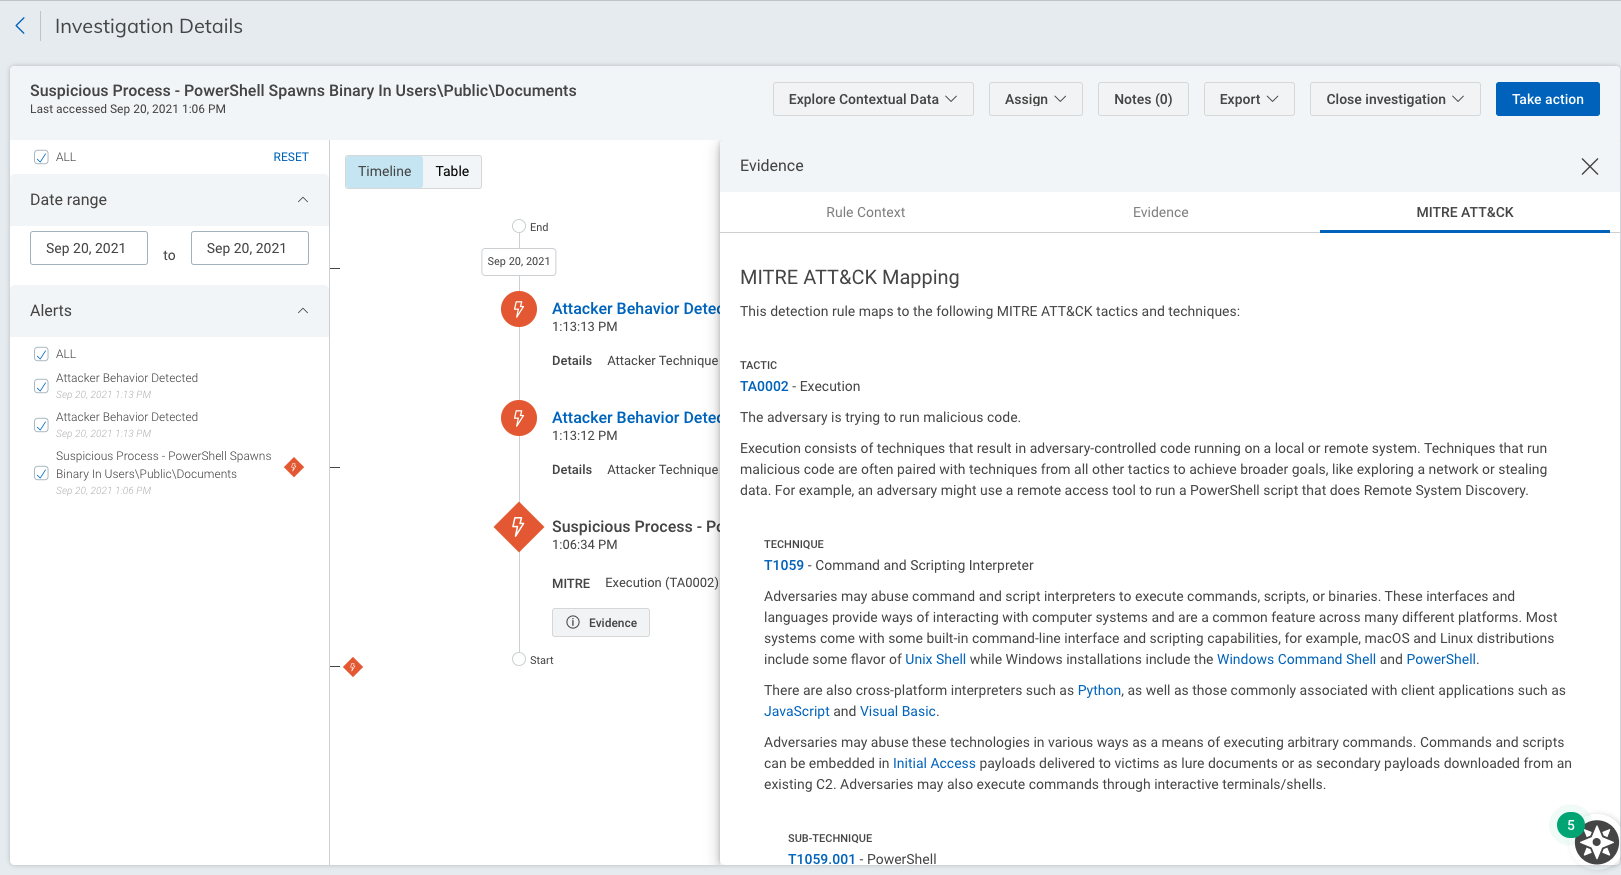
MITRE ATT&CK details in investigations

In addition to our detections updates, we’ve made improvements to our investigations experience to provide deeper insight into an attacker’s position in the killchain and give context into the nature of an alert.

When performing an investigation in InsightIDR, detections will be mapped to a description of the associated MITRE tactics, techniques, and sub-techniques. You’ll also be prompted to visit attack.mitre.org to view context rich adversary behavior profiles with descriptions, mitigation strategies, and detection recommendations for each tactic, technique and sub-technique, developed by MITRE.

What's New in InsightIDR: Q3 2021 in Review

Monitor event source health

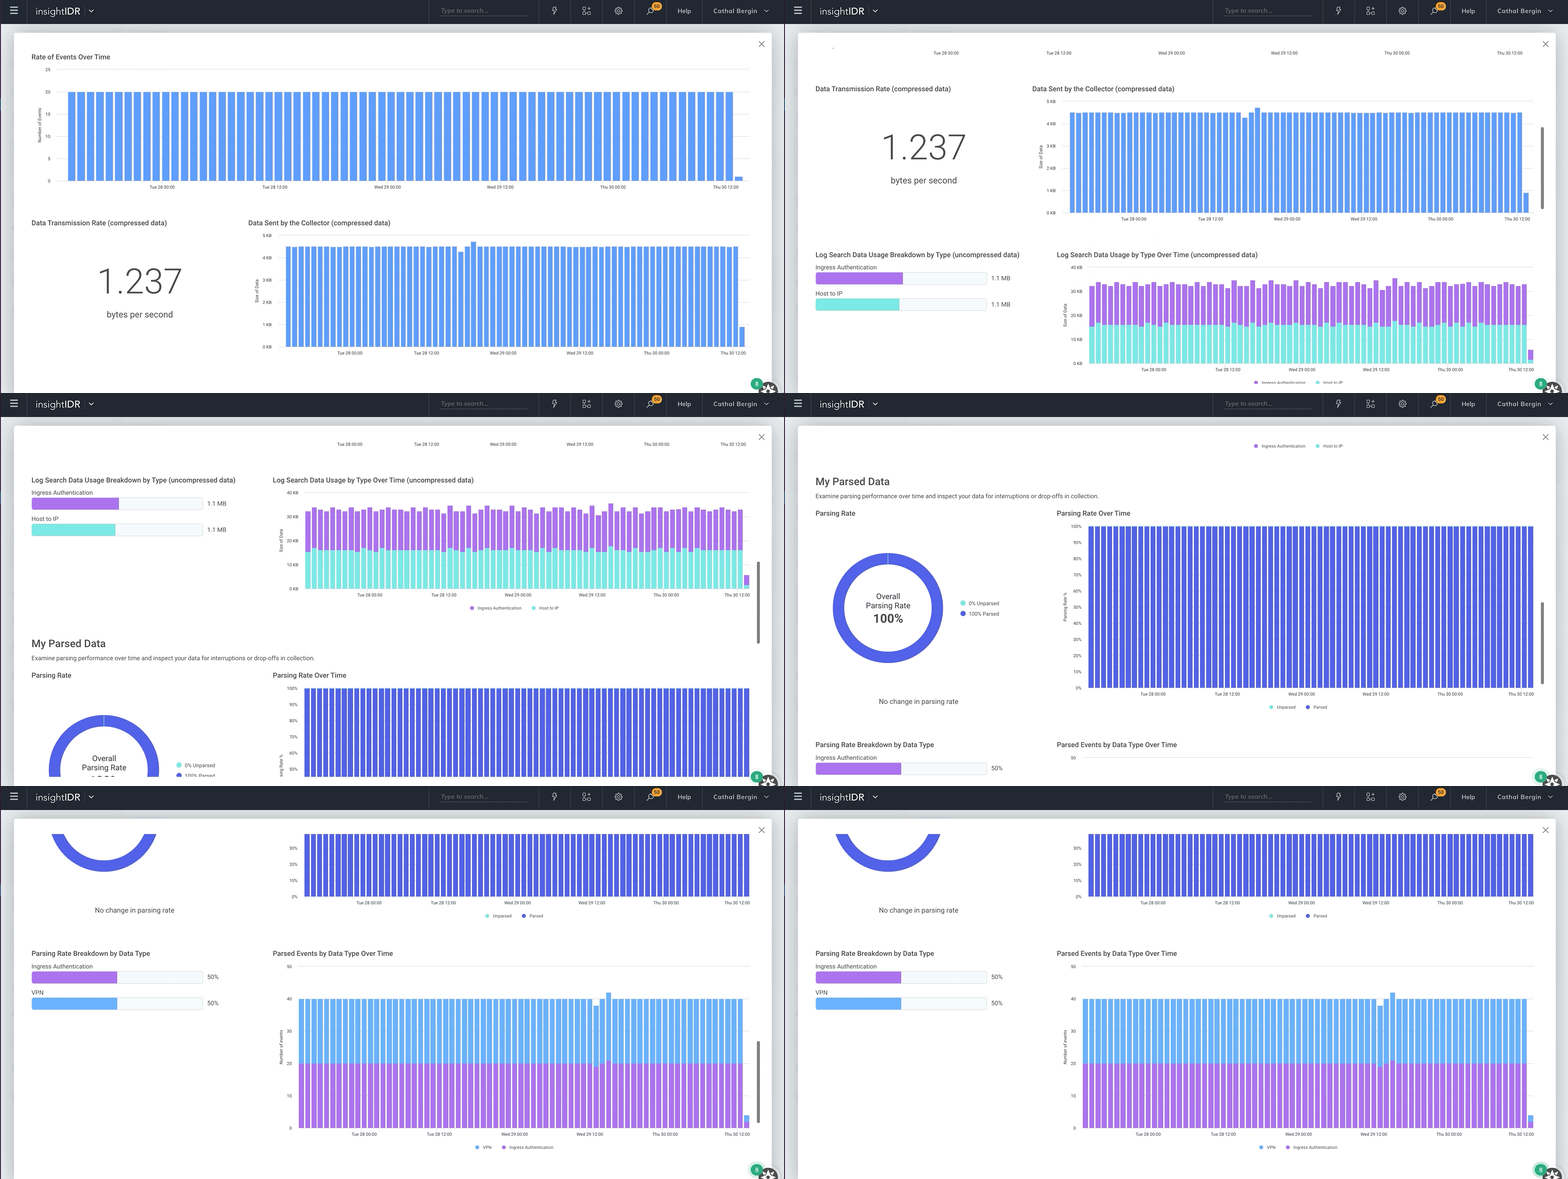
We recently released new visual tools to help you easily view the health of your event source data. You now have extensive visibility into data transmission and parsing rates of your event source. This allows you to check if an event source is running as intended, quickly identify any issues or unusual activity, or visually compare data for each event source.

What's New in InsightIDR: Q3 2021 in Review

New pre-built dashboards for HIPAA, ISO 27001, and more

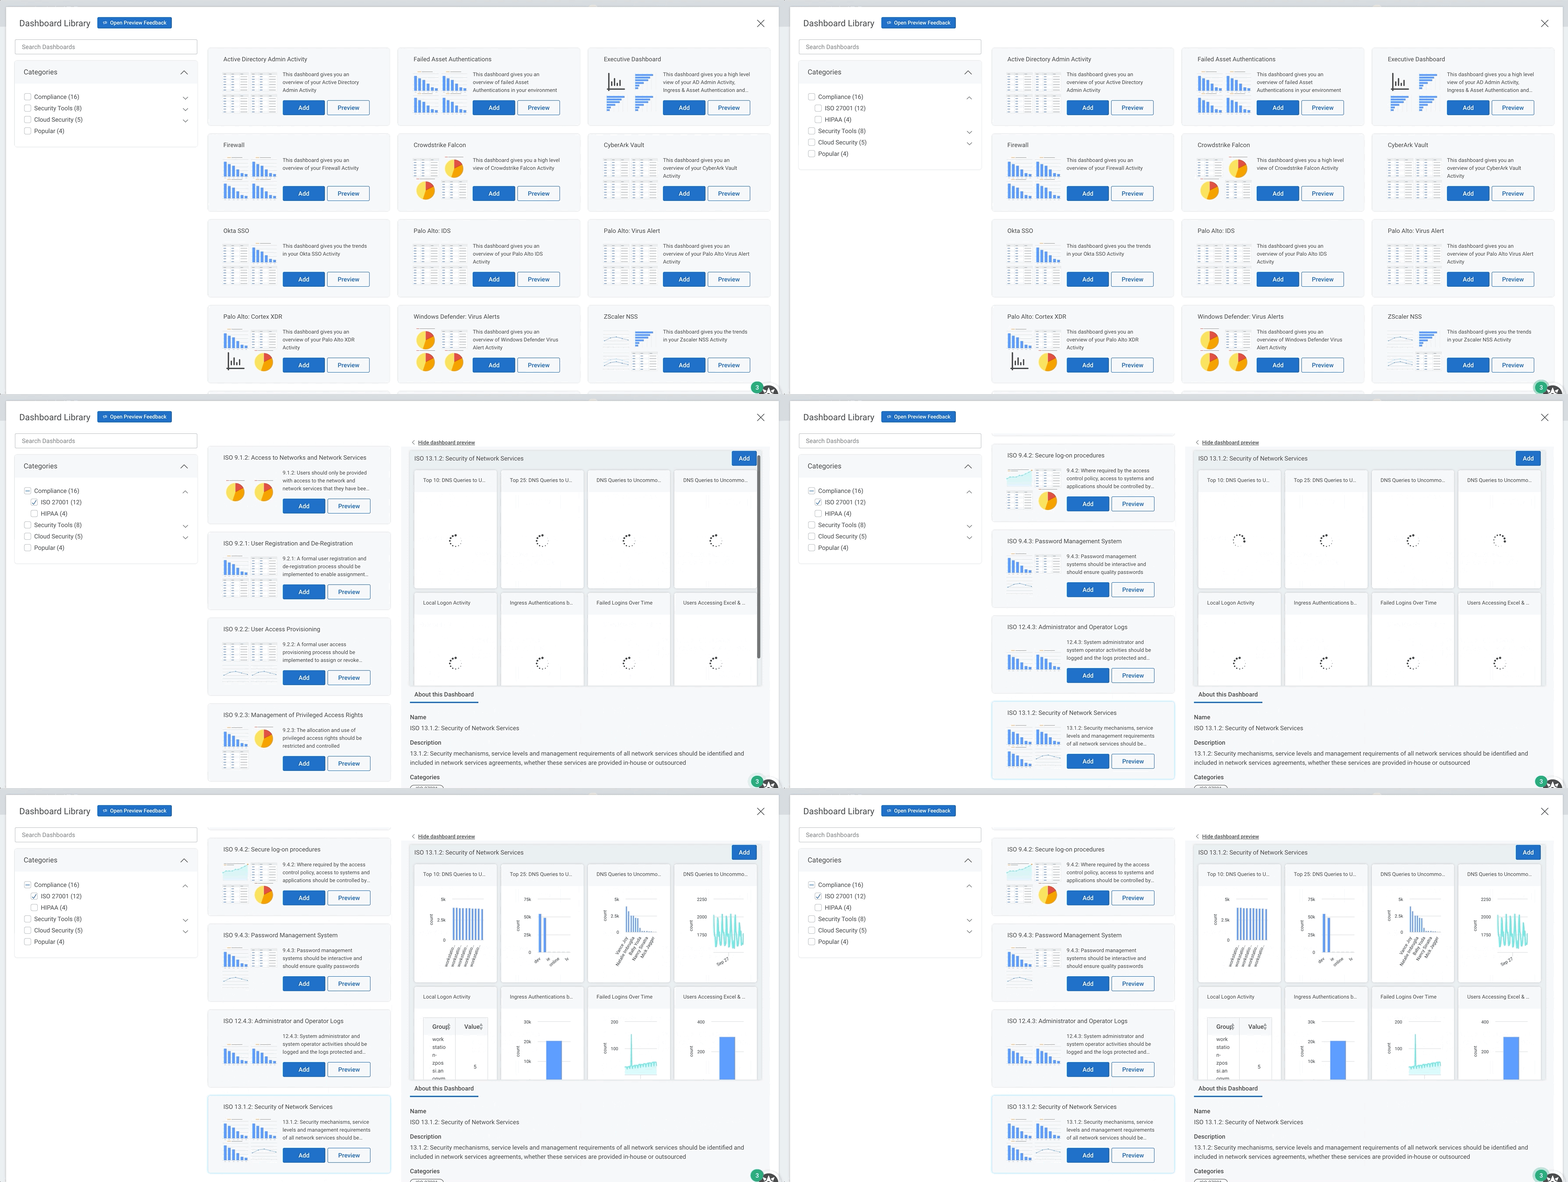
We recently introduced a library of pre-built dashboards that make it easier than ever to get insight from your environment. Entire dashboards, created by our Rapid7 experts, can be set up in just a few clicks. Our dashboards cover a variety of topics, including key compliance frameworks like PCI, ISO 27001, and HIPAA; security tools like Zscaler and Okta; and more general dashboards covering Asset Authentication and Firewall activity.

What's New in InsightIDR: Q3 2021 in Review

The Lost Bots vlog series

Rapid7’s latest vlog series, The Lost Bots, hosted by Detection and Response Practice Advisor and former CISO Jeffrey Gardner, offers a look into the latest and greatest in security. In each episode, Jeffrey talks with fellow industry experts about current events and trends in the security space, best practices, and lessons from our Rapid7 SOC team. Each episode is available on our blog, as well as our Rapid7 YouTube channel.

Rapid7 MDR named an IDC MarketScape Leader

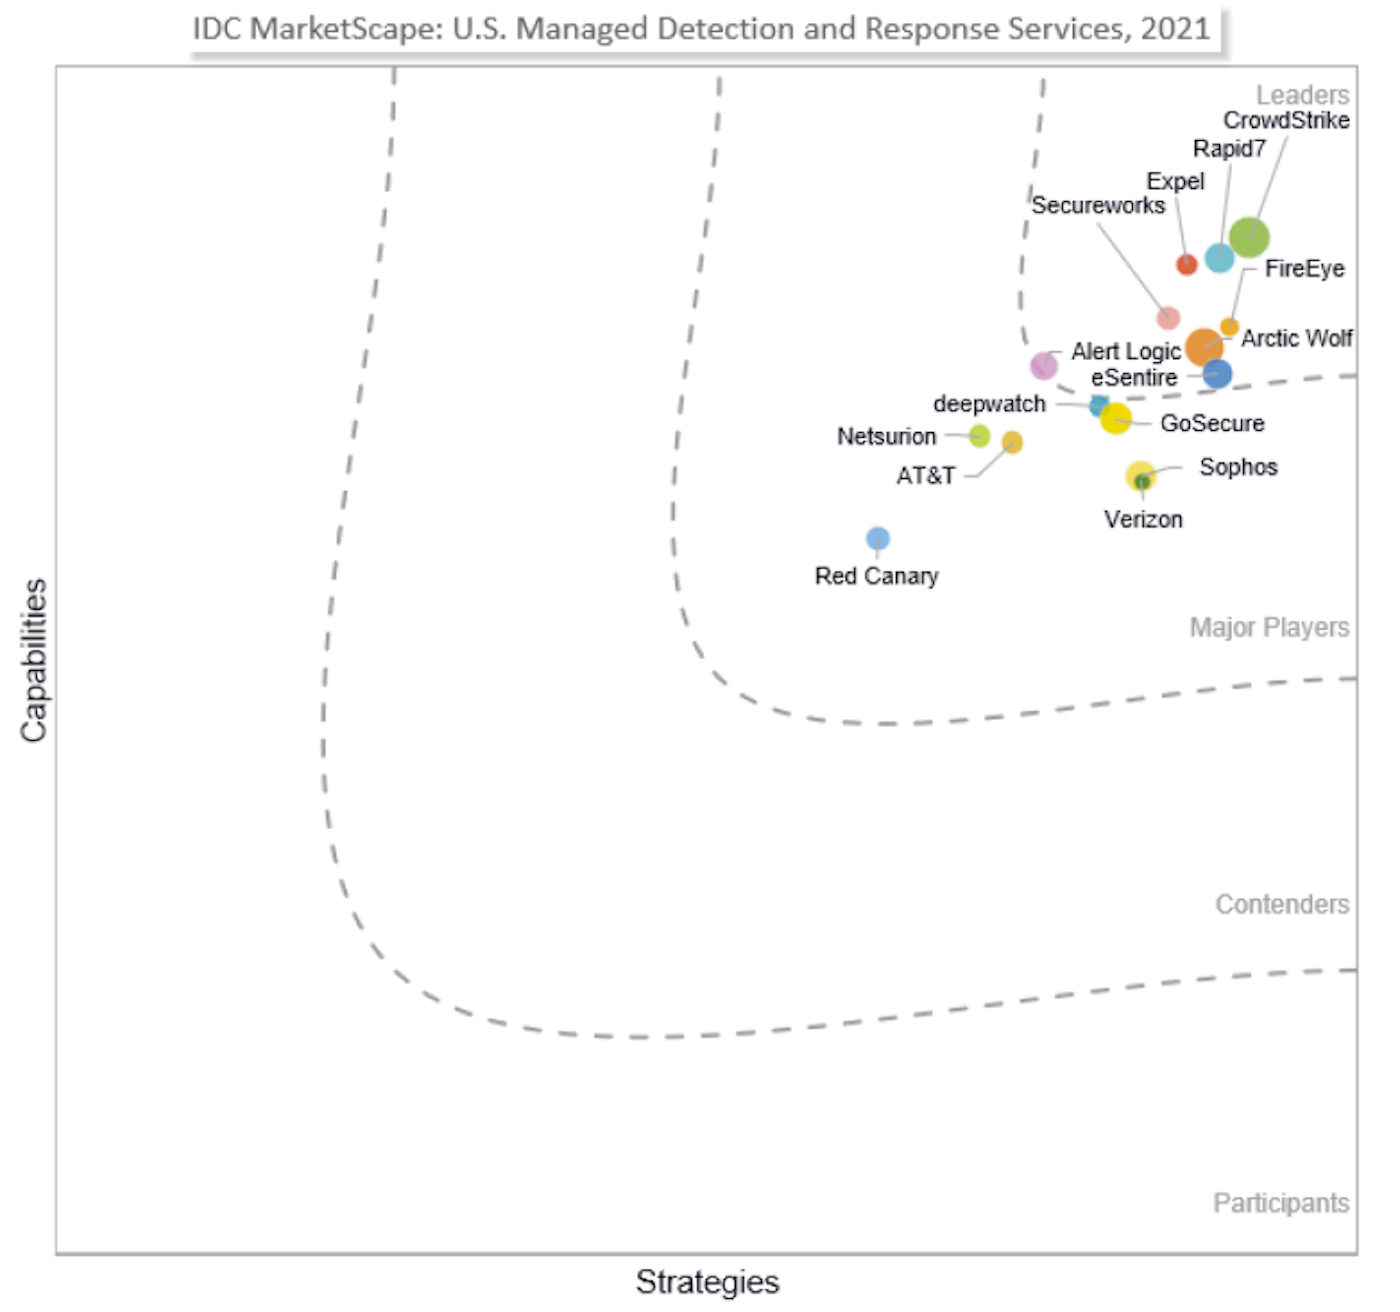
We’re thrilled that Rapid7’s MDR was recognized as a Leader in the IDC MarketScape: Managed Detection and Response 2021 Vendor Assessment. This IDC MarketScape report shows an unbiased look at 15 MDR players in the US market, evaluating each on capabilities. We credit this recognition to customers like you who provide the critical feedback and guidance to improve our service — thank you!

What's New in InsightIDR: Q3 2021 in Review

Attack Surface Visibility, now in MDR Essentials

Our goal with Attack Surface Visibility — built exclusively for our MDR Essentials — is to help customers act proactively with a monthly snapshot of how exposed their attack surface looks to an opportunistic attacker. While this certainly is not a replacement for a true vulnerability management program, Attack Surface Visibility lets your team see obvious weak points that attackers may exploit and helps optimize your efforts with clear, prioritized actions to remediate risks and improve your security posture.

Stay tuned!

As always, we’re continuing to work on exciting product enhancements and releases throughout the year. Keep an eye on our blog and release notes as we continue to highlight the latest in detection and response at Rapid7.

NEVER MISS A BLOG

Get the latest stories, expertise, and news about security today.

Measuring Hyper-Threading and Turbo Boost

Post Syndicated from Sung Park original https://blog.cloudflare.com/measuring-hyper-threading-and-turbo-boost/

Measuring Hyper-Threading and Turbo Boost

Measuring Hyper-Threading and Turbo Boost

We often put together experiments that measure hardware performance to improve our understanding and provide insights to our hardware partners. We recently wanted to know more about Hyper-Threading and Turbo Boost. The last time we assessed these two technologies was when we were still deploying the Intel Xeons (Skylake/Purley), but beginning with our Gen X servers we switched over to the AMD EPYC (Zen 2/Rome). This blog is about our latest attempt at quantifying the performance impact of Hyper-Threading and Turbo Boost on our AMD-based servers running our software stack.

Intel briefly introduced Hyper-Threading with NetBurst (Northwood) back in 2002, then reintroduced Hyper-Threading six years later with Nehalem along with Turbo Boost. AMD presented their own implementation of these technologies with Zen in 2017, but AMD’s version of Turbo Boost actually dates back to AMD K10 (Thuban), in 2010, when it used to be called Turbo Core. Since Zen, Hyper-Threading and Turbo Boost are known as simultaneous multithreading (SMT) and Core Performance Boost (CPB), respectively. The underlying implementation of Hyper-Threading and Turbo Boost differs between the two vendors, but the high-level concept remains the same.

Hyper-Threading or simultaneous multithreading creates a second hardware thread within a processor’s core, also known as a logical core, by duplicating various parts of the core to support the context of a second application thread. The two hardware threads execute simultaneously within the core, across their dedicated and remaining shared resources. If neither hardware threads contend over a particular shared resource, then the throughput can be drastically increased.

Turbo Boost or Core Performance Boost opportunistically allows the processor to operate beyond its rated base frequency as long as the processor operates within guidelines set by Intel or AMD. Generally speaking, the higher the frequency, the faster the processor finishes a task.

Simulated Environment

CPU Specification

Measuring Hyper-Threading and Turbo Boost

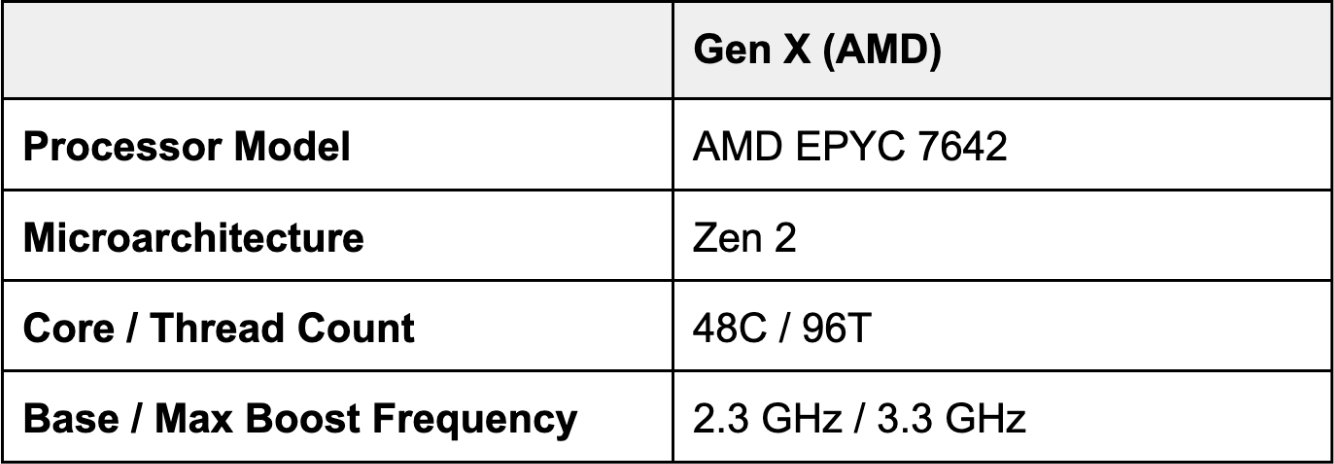
Our Gen X or 10th generation servers are powered by the AMD EPYC 7642, based on the Zen 2 microarchitecture. The vast majority of the Zen 2-based processors along with its successor Zen 3 that our Gen 11 servers are based on, supports simultaneous multithreading and Core Performance Boost.

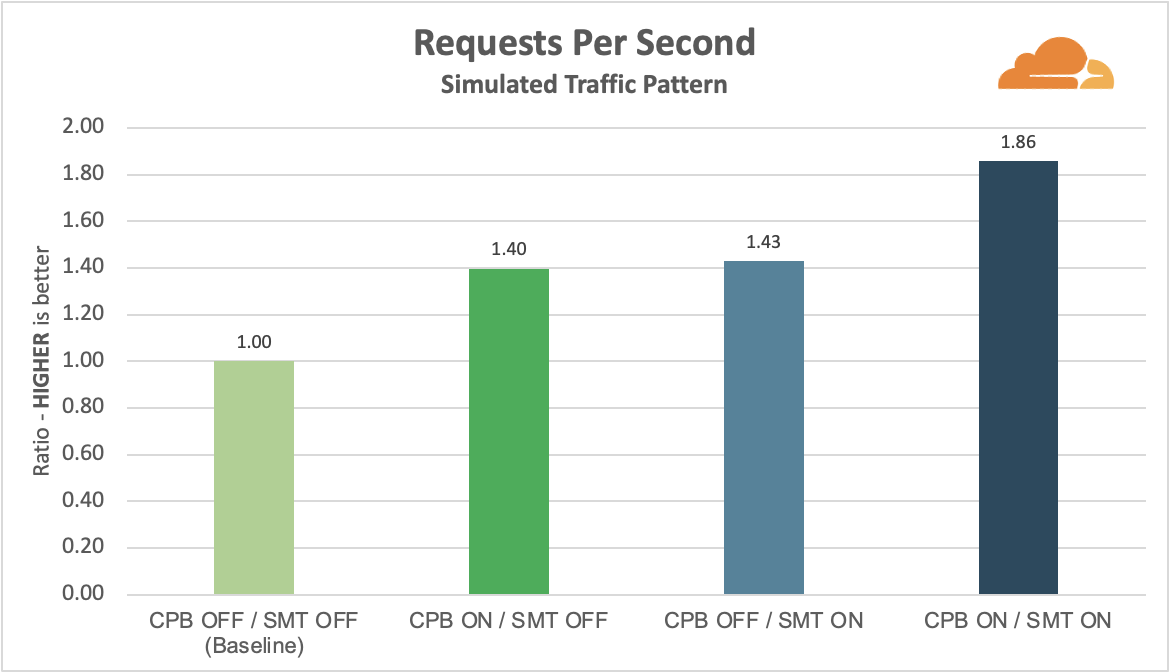
Similar to Intel’s Hyper-Threading, AMD implemented 2-way simultaneous multithreading. The AMD EPYC 7642 has 48 cores, and with simultaneous multithreading enabled it can simultaneously execute 96 hardware threads. Core Performance Boost allows the AMD EPYC 7642 to operate anywhere between 2.3 to 3.3 GHz, depending on the workload and limitations imposed on the processor. With Core Performance Boost disabled, the processor will operate at 2.3 GHz, the rated base frequency on the AMD EPYC 7642. We took our usual simulated traffic pattern of 10 KiB cached assets over HTTPS, provided by our performance team, to generate a sustained workload that saturated the processor to 100% CPU utilization.

Results

After establishing a baseline with simultaneous multithreading and Core Performance Boost disabled, we started enabling one feature at a time. When we enabled Core Performance Boost, the processor operated near its peak turbo frequency, hovering between 3.2 to 3.3 GHz which is more than 39% higher than the base frequency. Higher operating frequency directly translated into 40% additional requests per second. We then disabled Core Performance Boost and enabled simultaneous multithreading. Similar to Core Performance Boost, simultaneous multithreading alone improved requests per second by 43%. Lastly, by enabling both features, we observed an 86% improvement in requests per second.

Measuring Hyper-Threading and Turbo Boost

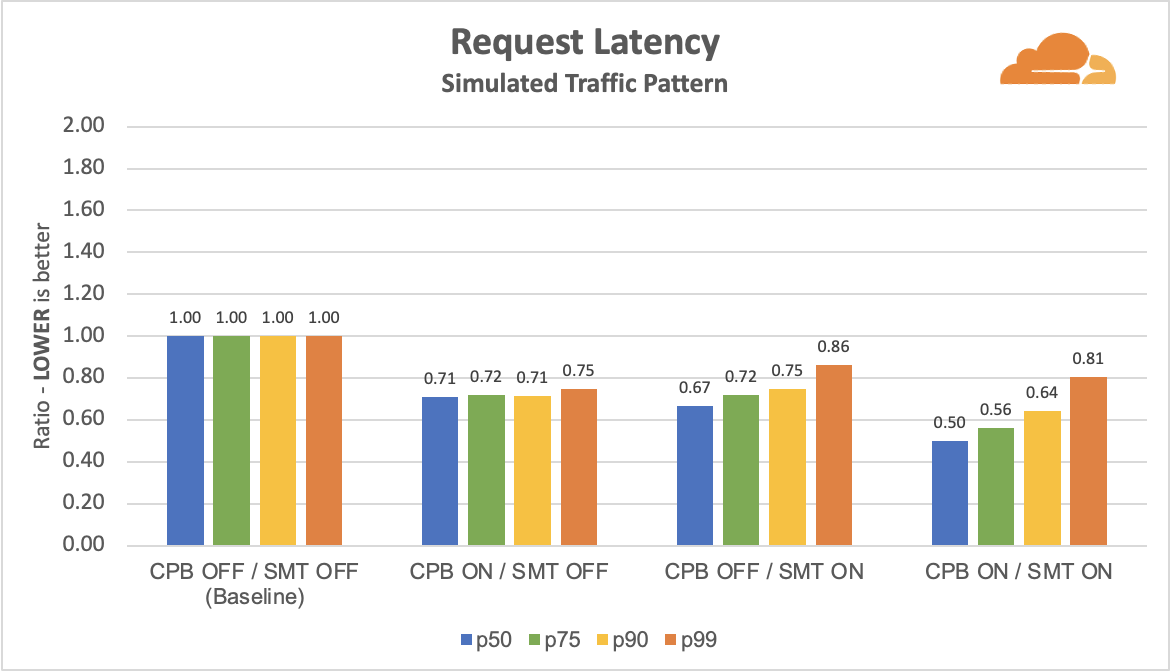
Latencies were generally lowered by either or both Core Performance Boost and simultaneous multithreading. While Core Performance Boost consistently maintained a lower latency than the baseline, simultaneous multithreading gradually took longer to process a request as it reached tail latencies. Though not depicted in the figure below, when we examined beyond p9999 or 99.99th percentile, simultaneous multithreading, even with the help of Core Performance Boost, exponentially increased in latency by more than 150% over the baseline, presumably due to the two hardware threads contending over a shared resource within the core.

Measuring Hyper-Threading and Turbo Boost

Production Environment

Moving into production, since our traffic fluctuates throughout the day, we took four identical Gen X servers and measured in parallel during peak hours. The only changes we made to the servers were enabling and disabling simultaneous multithreading and Core Performance Boost to create a comprehensive test matrix. We conducted the experiment in two different regions to identify any anomalies and mismatching trends. All trends were alike.

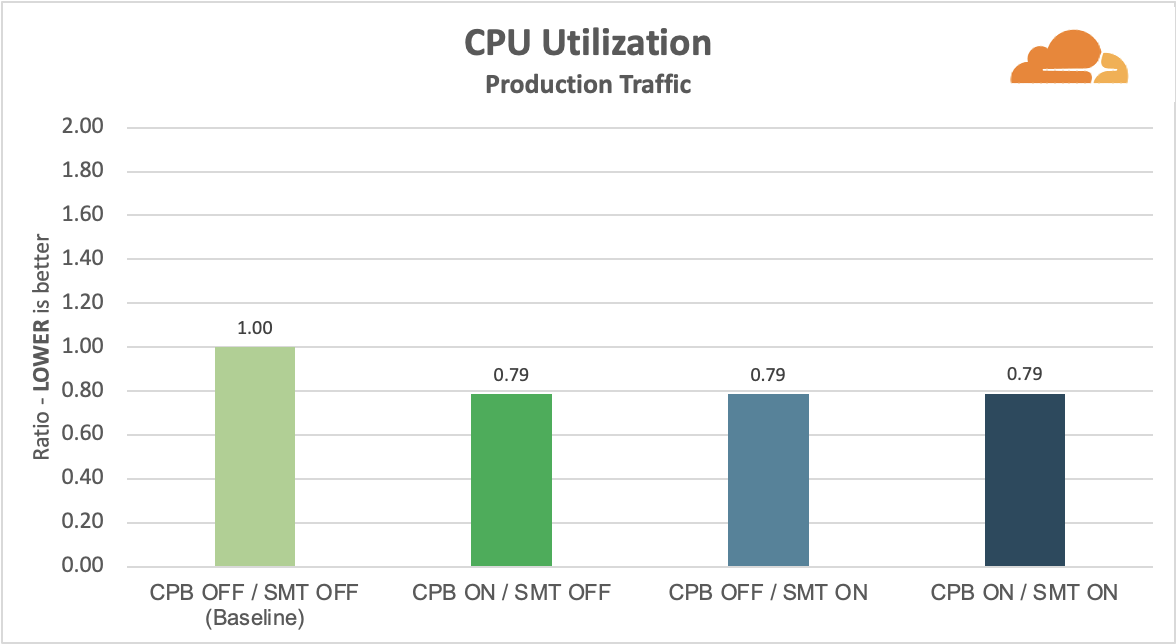
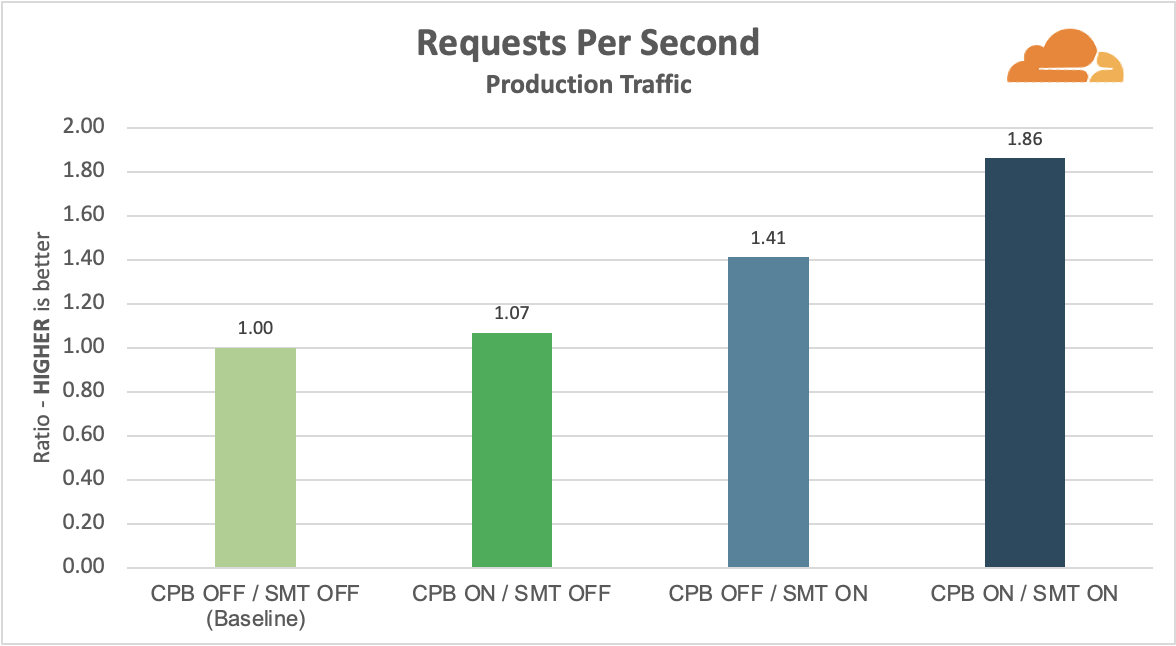
Before diving into the results, we should preface that the baseline server operated at a higher CPU utilization than others. Every generation, our servers deliver a noticeable improvement in performance. So our load balancer, named Unimog, sends a different number of connections to the target server based on its generation to balance out the CPU utilization. When we disabled simultaneous multithreading and Core Performance Boost, the baseline server’s performance degraded to the point where Unimog encountered a “guard rail” or the lower limit on the requests sent to the server, and so its CPU utilization rose instead. Given that the baseline server operated at a higher CPU utilization, the baseline server processed more requests per second to meet the minimum performance threshold.

Measuring Hyper-Threading and Turbo Boost

Results

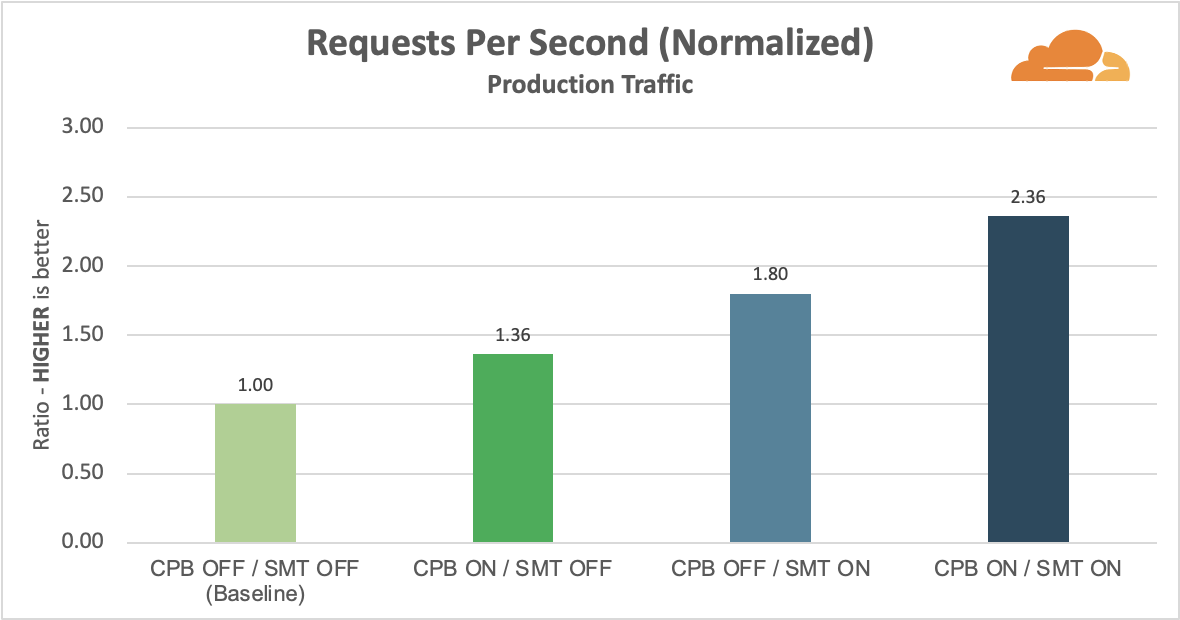
Due to the skewed baseline, when core performance boost was enabled, we only observed 7% additional requests per second. Next, simultaneous multithreading alone improved requests per second by 41%. Lastly, with both features enabled, we saw an 86% improvement in requests per second.

Measuring Hyper-Threading and Turbo Boost

Though we lack concrete baseline data, we can normalize requests per second by CPU utilization to approximate the improvement for each scenario. Once normalized, the estimated improvement in requests per second from core performance boost and simultaneous multithreading were 36% and 80%, respectively. With both features enabled, requests per second improved by 136%.

Measuring Hyper-Threading and Turbo Boost

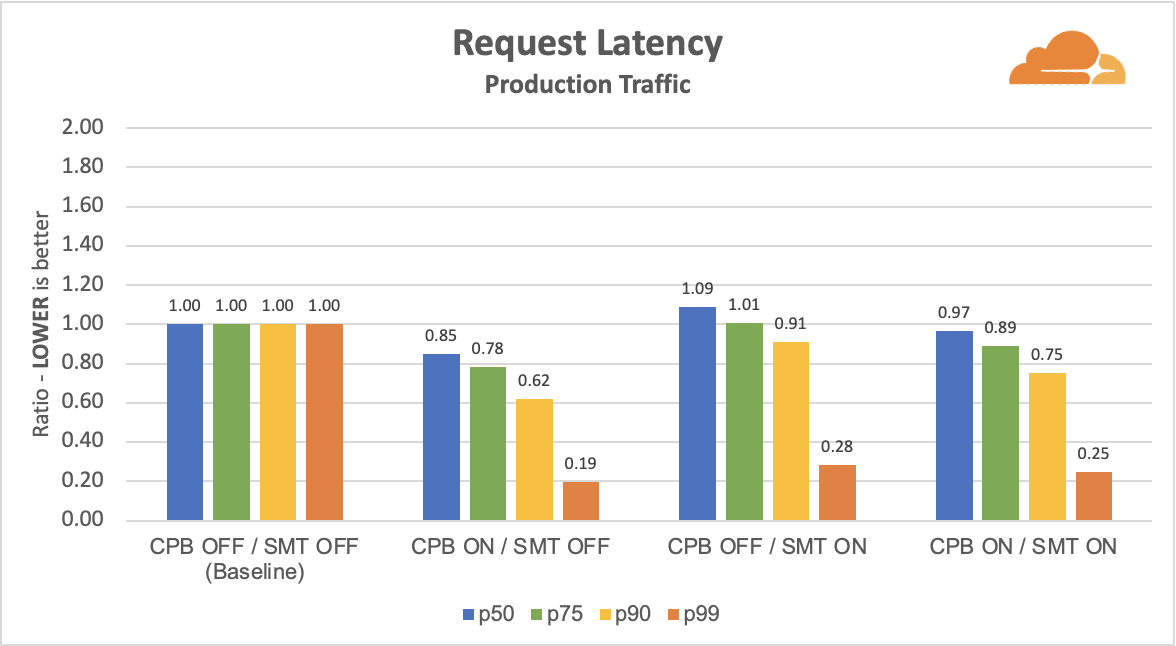
Latency was not as interesting since the baseline server operated at a higher CPU utilization, and in turn, it produced a higher tail latency than we would have otherwise expected. All other servers maintained a lower latency due to their lower CPU utilization in conjunction with Core Performance Boost, simultaneous multithreading, or both.

Measuring Hyper-Threading and Turbo Boost

At this point, our experiment did not go as we had planned. Our baseline is skewed, and we only got half useful answers. However, we find experimenting to be important because we usually end up finding other helpful insights as well.

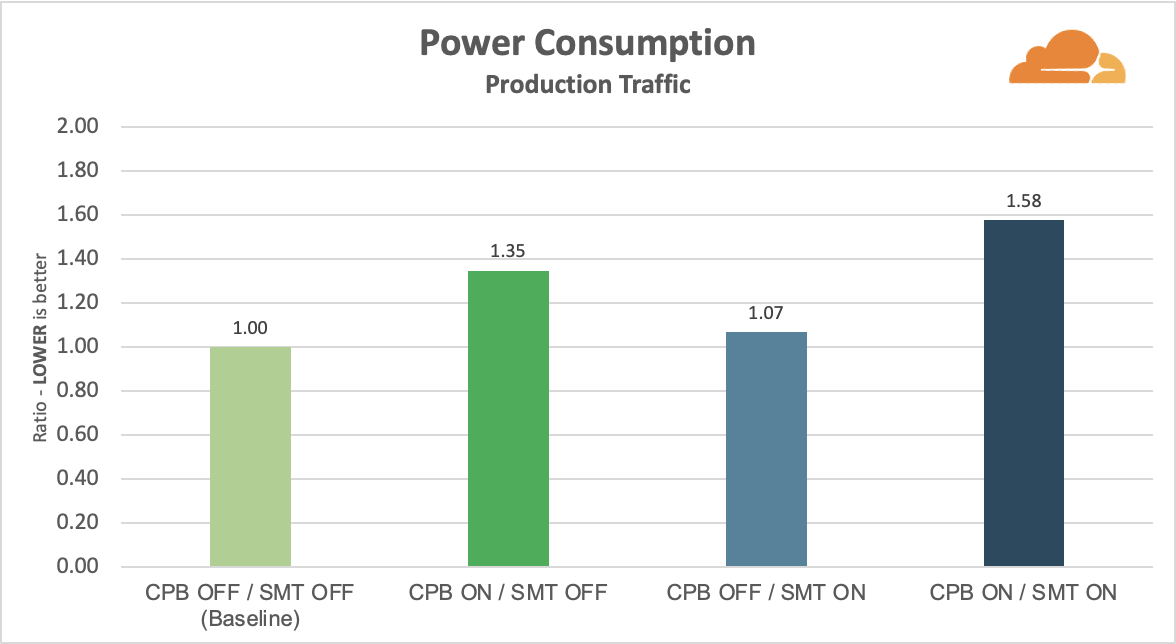
Let’s add power data. Since our baseline server was operating at a higher CPU utilization, we knew it was serving more requests and therefore, consumed more power than it needed to. Enabling Core Performance Boost allowed the processor to run up to its peak turbo frequency, increasing power consumption by 35% over the skewed baseline. More interestingly, enabling simultaneous multithreading increased power consumption by only 7%. Combining Core Performance Boost with simultaneous multithreading resulted in 58% increase in power consumption.

Measuring Hyper-Threading and Turbo Boost

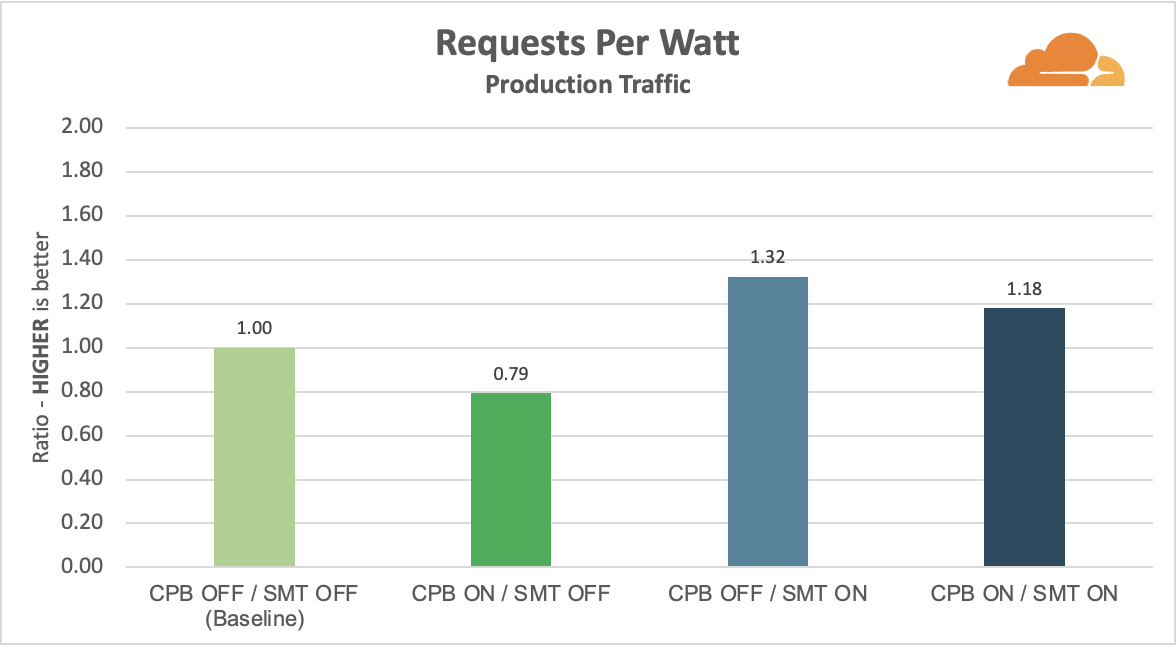
AMD’s implementation of simultaneous multithreading appears to be power efficient as it achieves 41% additional requests per second while consuming only 7% more power compared to the skewed baseline. For completeness, using the data we have, we bridged performance and power together to obtain performance per watt to summarize power efficiency. We divided the non-normalized requests per second by power consumption to produce the requests per watt figure below. Our Gen X servers attained the best performance per watt by enabling just simultaneous multithreading.

Measuring Hyper-Threading and Turbo Boost

Conclusion

In our assessment of AMD’s implementation of Hyper-Threading and Turbo Boost, the original experiment we designed to measure requests per second and latency did not pan out as expected. As soon as we entered production, our baseline measurement was skewed due to the imbalance in CPU utilization and only partially reproduced our lab results.

We added power to the experiment and found other meaningful insights. By analyzing the performance and power characteristics of simultaneous multithreading and Core Performance Boost, we concluded that simultaneous multithreading could be a power-efficient mechanism to attain additional requests per second. Drawbacks of simultaneous multithreading include long tail latency that is currently curtailed by enabling Core Performance Boost. While the higher frequency enabled by Core Performance Boost provides latency reduction and more requests per second, we are more mindful that the increase in power consumption is quite significant.

Do you want to help shape the Cloudflare network? This blog was a glimpse of the work we do at Cloudflare. Come join us and help complete the feedback loop for our developers and hardware partners.

VMware Cloud on AWS Outposts Brings VMware SDDC as a Fully Managed Service on Premises

Post Syndicated from Channy Yun original https://aws.amazon.com/blogs/aws/vmware-cloud-on-aws-outposts-brings-vmware-sddc-as-a-fully-managed-service-on-premises/

In 2017, AWS and VMware brought VMware Cloud on AWS, the VMware enterprise-class Software-Defined Data Center (SDDC) software for all vSphere-based workloads, to the AWS Cloud with optimized access to native AWS services. VMware Cloud on AWS provides dedicated, single-tenant cloud infrastructure, delivered on the next-generation bare-metal AWS infrastructure based on the latest Amazon EC2 storage optimized high I/O instances and featuring low-latency non-volatile memory express (NVMe) based SSDs.

Some customers have certain workloads that will likely need to remain on premises, such as applications that are latency-sensitive, have to meet specific data residency to the requirement for data to be stored locally, and proceed local data to the need to run apps closer to where data resides or need to be in close proximity to on-premises assets. These customers would like to be able to use the same VMware tools, APIs, and skill sets that they’ve been using to run their infrastructure on premises and seamlessly integrate these on-premises workloads with the rest of their applications in the AWS Cloud.

AWS and VMware are bringing the VMware Cloud on AWS experience on premises by announcing the general availability of VMware Cloud on AWS Outposts, VMware’s enterprise-class SDDC software deployed on AWS Nitro System-based EC2 bare-metal instances in AWS Outposts, a fully managed service that brings AWS infrastructure and services on premises for a truly consistent hybrid experience. VMware Cloud on AWS Outposts runs on AWS infrastructure within any location provided to us by the customer to support applications that require low latency and to accommodate local data processing and data residency needs as long as the network requirements are met.

AWS Outposts VMware Cloud on AWS Outposts VMware Cloud on AWS
Use cases Low-latency compute, Local data processing, Data residency, Migration and modernization Low-latency compute, Local data processing, Data residency, Migration and modernization with consistent VMware environments Cloud Migrations, Data center extension, Disaster Recovery, Scalable VDI and DevTest, and App modernization
Control Plane AWS console VMware Cloud portal
Software AWS services VMware SDDC built on AWS services*
Infrastructure AWS custom-built hardware
Hardware Location Customers’ datacenters, co-location space, or on-premises facilities AWS Regions

* VMware Cloud runs on Amazon Nitro System-based EC2 bare-metal instances provisioned in AWS Outposts or AWS Regions.

With VMware Cloud on AWS Outposts, you can remove the overhead associated with designing, procuring, and managing IT infrastructure, thereby improving IT efficiency. You can get operational consistency with a single pane of glass in vCenter that allows you to manage your SDDCs in the AWS Regions, on VMware Cloud on AWS Outposts, and in your self-managed on-premises VMware environments.

Preview with VMware on AWS Outposts
To get started with VMware Cloud on AWS Outposts, a group of experts from AWS or VMware will help you understand your specific requirements and sizing needs. Please contact your usual sales representatives from either AWS or VMware before the order.

After your requirements and site conditions are collected, you can simply log into the VMware Cloud Service Portal. Choose VMware Cloud on AWS Outposts from My Services, and start an order. This ordering process via the VMware Cloud Service Portal will be generally available by the end of VMware’s Q3FY22 fiscal quarter (October 29, 2021). If you need to order VMware Cloud on AWS Outposts sooner, contact your AWS or VMware representative.

This order initiates a process for us to collect the necessary site and installation information. You will receive an email confirmation once the order is successfully submitted and confirmed.

AWS will contact you to schedule and perform the site assessment. If your site is compliant with all requirements, then your Outpost will be ordered and installed on your site. Once the VMware Cloud on AWS Outposts capacity is delivered to your site and plugged into power and network connections, AWS will provision the Amazon EC2 instances for SDDC consumption. VMware will perform additional validation and notify you when the VMware Cloud on AWS Outposts service is available.

Next, you will be able to see the available capacity on the VMware Cloud Service Portal and create your SDDC as needed. The connection to your on-premises network is already configured based on the information we collected from the previous steps.

You will need to configure or use your own Virtual Private Cloud (VPC) and subnet to connect as you use in AWS. Workloads running on VMware Cloud on AWS Outpost communicate with other resources in your VPC through elastic network interface (ENI) the same way they do for VMware Cloud on AWS. Performance is subject to the service link connection to the parent AWS Region.

Things to Know
Here are a couple of things to keep in mind about VMware Cloud on AWS Outposts:

Support Process: Unlike AWS Outposts, the VMware Cloud on AWS Outposts service is operated and managed by AWS and VMware. VMware will be your first line of support for VMware Cloud on AWS Outposts. AWS will contact you regarding hardware-related maintenance and replacement. For all other issues, you can use the in-service chat support, which is available 24×5 in English across all global Regions or contact your enterprise support personnel from VMware.

Hybrid with Other Outposts: Similar to VMware Cloud on AWS, you can use ENI to connect your SDDCs to AWS services running on another AWS Outpost or in an AWS Region. VMware Cloud on AWS Outposts has been validated to function with native AWS services such as Amazon CloudWatch, AWS Systems Manager, and Amazon S3 from the connected VPC in the AWS Region. Also, it can fully integrate with all native AWS services such as Amazon EC2, S3, and Amazon RDS that are supported on a native AWS Outposts rack that exists in the same location. Please reach out to your AWS or VMware representative for additional assistance in setting up the connectivity between your Outpost and the nearest AWS Region.

Network Connectivity: While VMware Cloud on AWS Outposts requires reliable network connectivity to the nearest AWS Region, the SDDC continues functioning if network connectivity to the AWS Region is temporarily unavailable. However, the VMware Cloud control plane will be unavailable when network connectivity is down. SDDC configurations can be accessed but network functions such as creating a new logical network , deleting an existing logical network and modifying a logical network will fail. However, you can still access vCenter to perform VM operations, and your data remains safely stored on your Outpost during periods of disconnect.

Data Residency: Your data will remain on VMware Cloud on AWS Outposts by default. This is enabled through the local storage and VMware vSAN technology. You may choose to replicate some or all of your data to AWS Regions or VMware Cloud on AWS based on your specific residency requirements. Some limited metadata will flow back to the AWS Region and the VMware Cloud Service Platform. As an example, information about instance health, instance activity (launched, stopped), and the underlying hypervisor system may be sent back to the parent AWS Region. This information enables AWS to provide alerting on instance health and capacity and apply patches and updates to the Outpost.

Get started with VMware Cloud on AWS Outposts
We’re pleased to announce the general availability of VMware Cloud on AWS Outposts. It can be shipped to the United States and connected to an AWS Region where VMware Cloud on AWS is supported: US East (N. Virginia) or US West (Oregon). If you want to deploy VMware Cloud on AWS Outposts outside the United States or connect VMware Cloud on AWS Outposts to other AWS Regions, please contact your AWS or VMware sales representative.

You can contact your AWS or VMware sales representative to place an order. You will also be able to place an order via the VMware Cloud Service Portal by October 29, 2021. When purchasing through AWS, you can also take advantage of your existing AWS enterprise contracts and AWS field promotional programs such as Migration Acceleration Program (MAP).

To learn more, visit the VMware Cloud on AWS Outposts page. Please send feedback to the VMware forum for VMware on AWS or through your usual AWS support contacts.

– Channy

Growing Raspberry Pi’s presence in Africa

Post Syndicated from Ken Okolo original https://www.raspberrypi.org/blog/growing-raspberry-pis-presence-in-africa/

Raspberry Pi is growing our presence in Africa, and we’re keen to talk to businesses and educational organisations in the region to learn and to build partnerships.

Developing partnerships

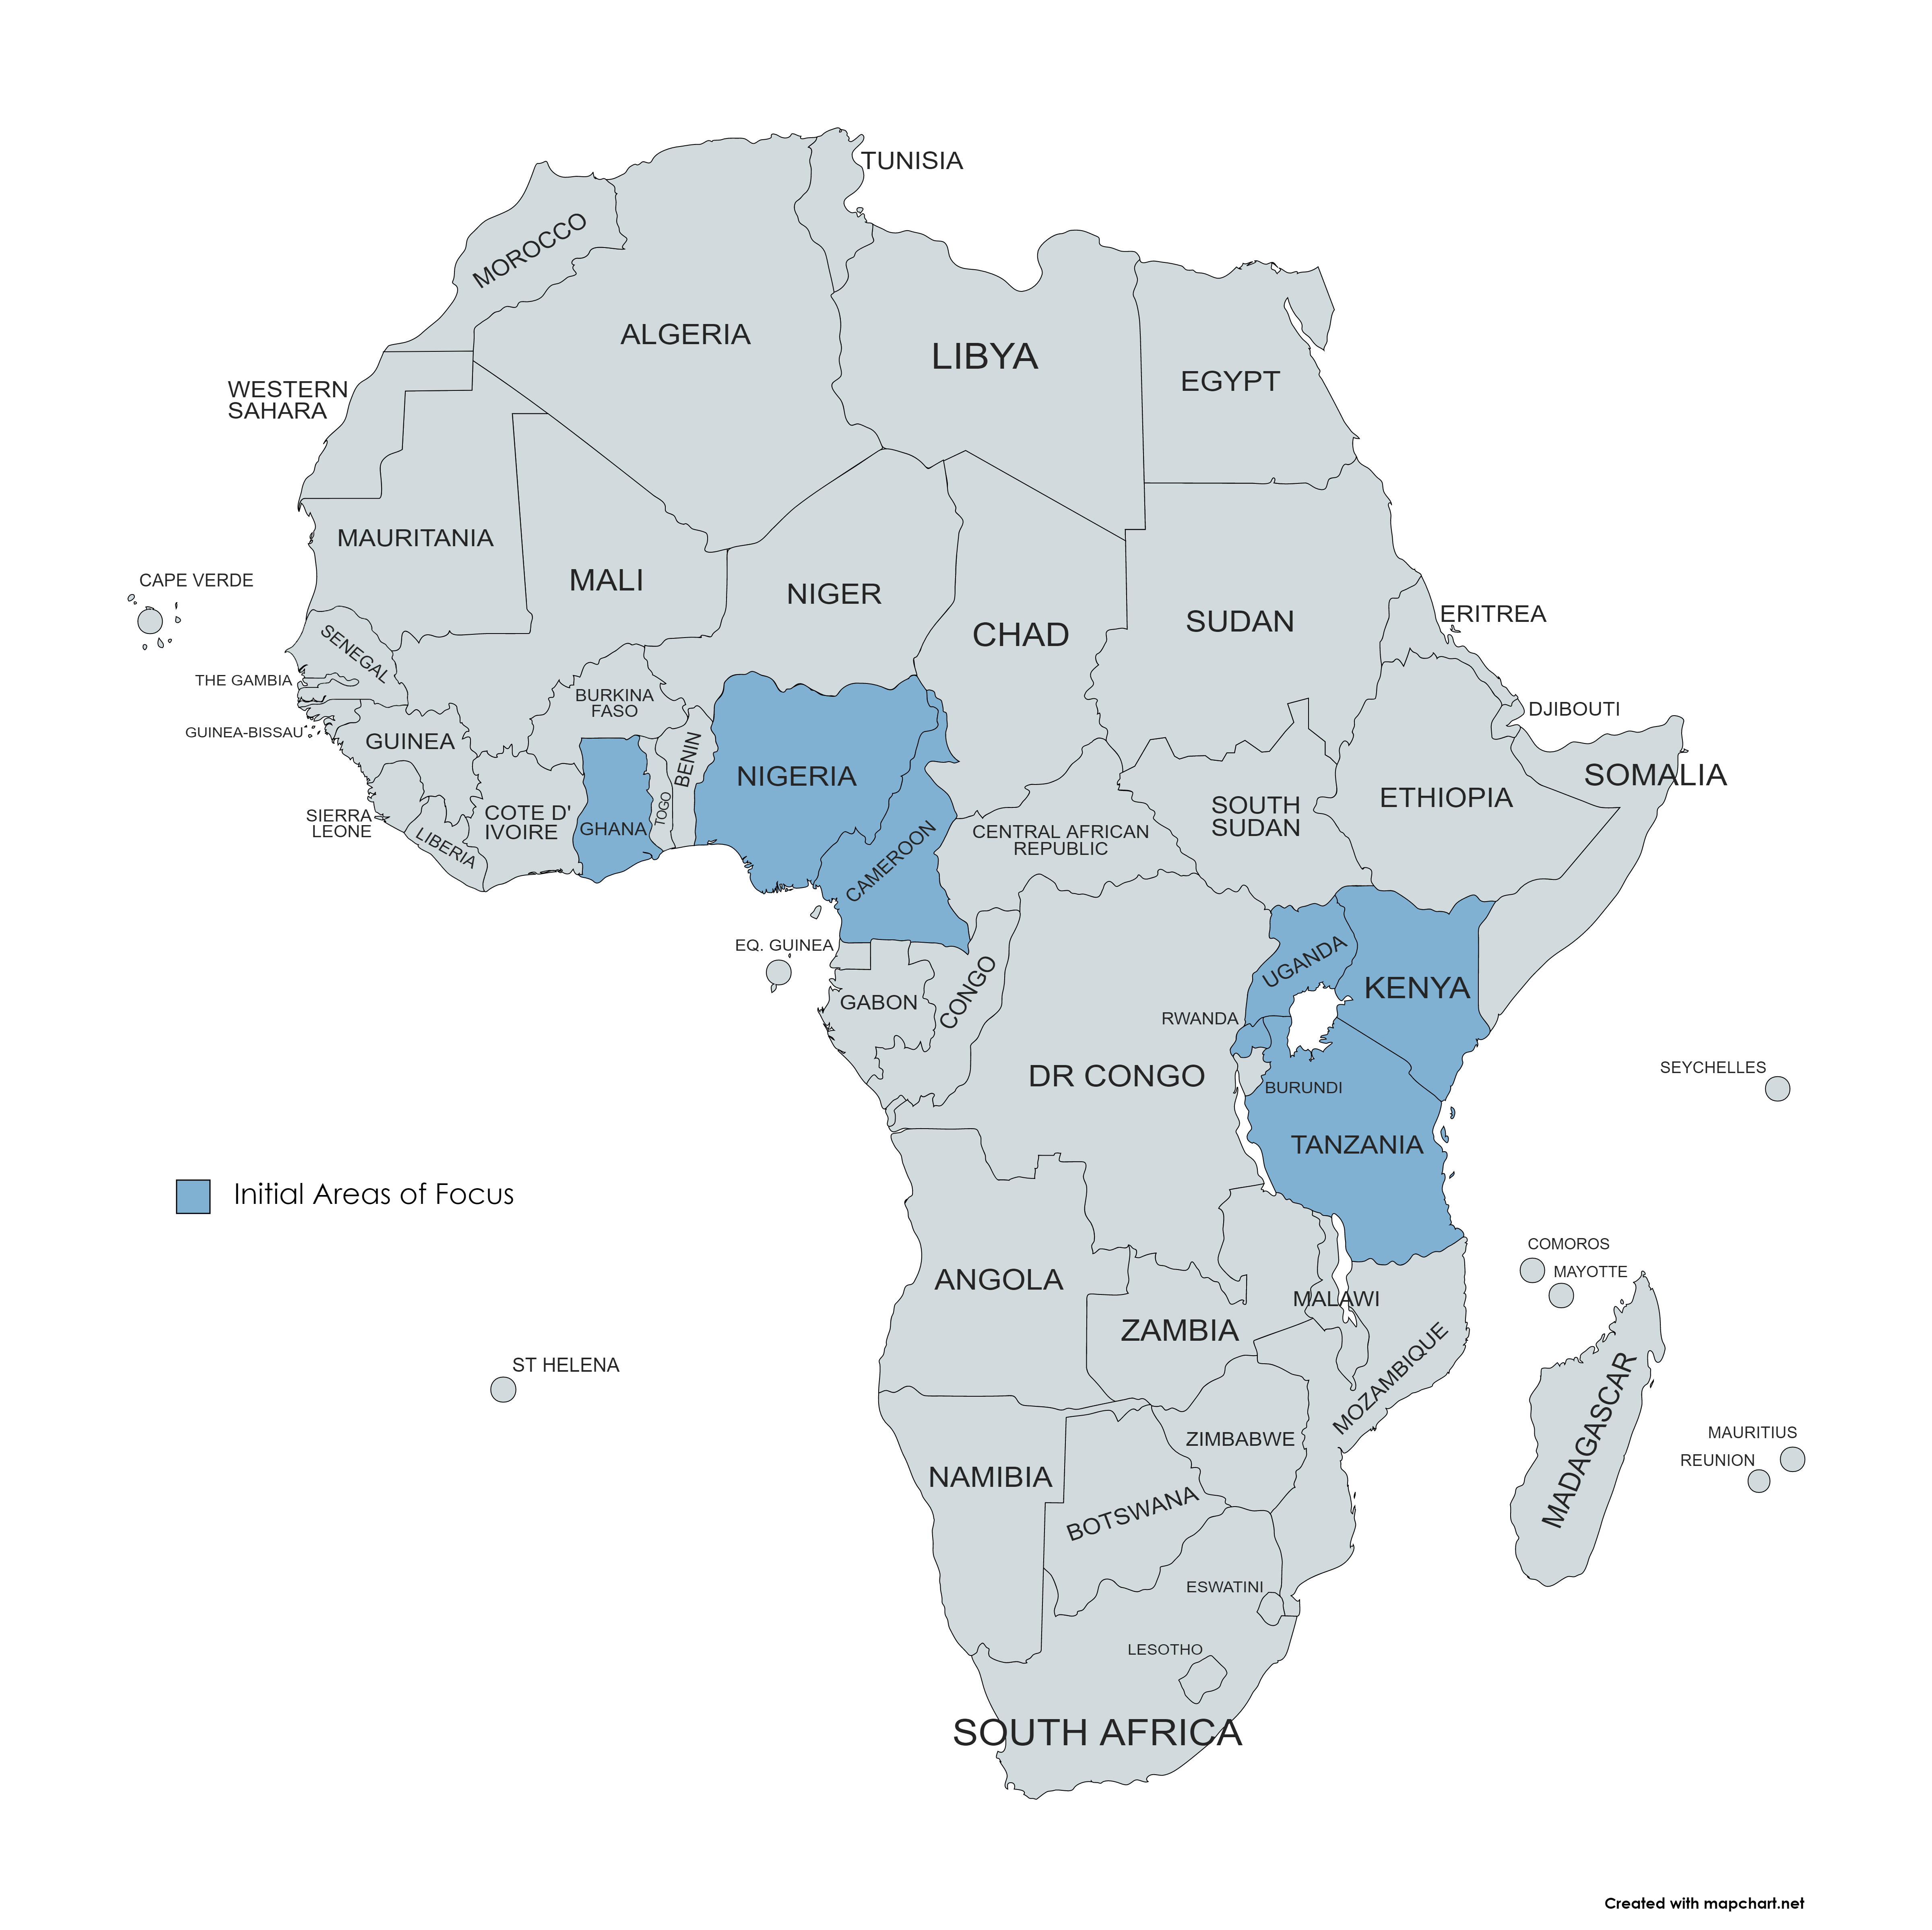
As part of our investments in the region, I am delighted to join Raspberry Pi as Strategic Partnerships Manager, and initially I will be focusing on Nigeria, Kenya, Ghana, Tanzania, Rwanda, Cameroon, and Uganda. We will prioritise building a network of Raspberry Pi Approved Resellers and developing the right partnerships across industry and the education sector.

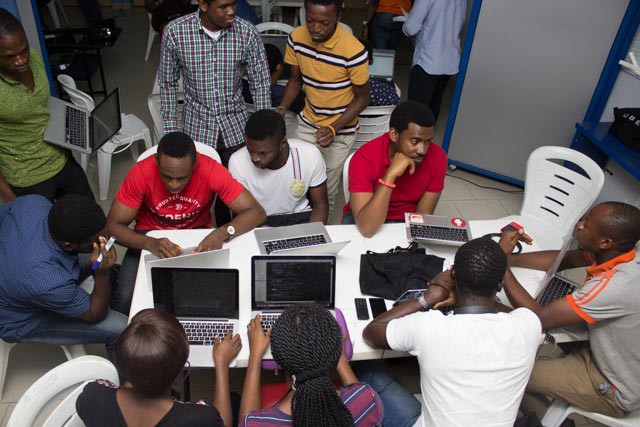
Uber's First Hackathon in Lagos
Uber’s First Hackathon in Lagos, Nigeria

Ensuring affordability with Raspberry Pi Approved Resellers

Over the last decade, Raspberry Pi has established a strong presence in the European and North American markets through partnership with our network of excellent Raspberry Pi Approved Resellers, providing access to affordable technology for the home, for business, and for education. Customers in many areas across Asia and the Pacific, too, have a choice of Approved Resellers offering Raspberry Pi products.

So far, our presence in Africa has been through our approved reseller PiShop in South Africa, which also has some commercial operations into other countries in southern Africa. Much of West, East, and North Africa has been underserved, and consumers in these regions have often obtained Raspberry Pi products via e-commerce websites in Europe, North America, and sometimes China. This has meant high costs of shipping products into Africa, which undermines our goal of ensuring affordability and availability across the continent. To address this, we have begun work to provide African customers with easy and reliable access to Raspberry Pi products at an affordable price point.

Supporting technological innovation

Africa has seen an explosion of technological advances in recent years, with investors funding innovative businesses built around technology. The continent is facing challenges ranging from accessibility to uninterrupted energy supplies, climate change, enabling agricultural potential, and building smart cities, and Africa’s mainly young population is meeting them head on.

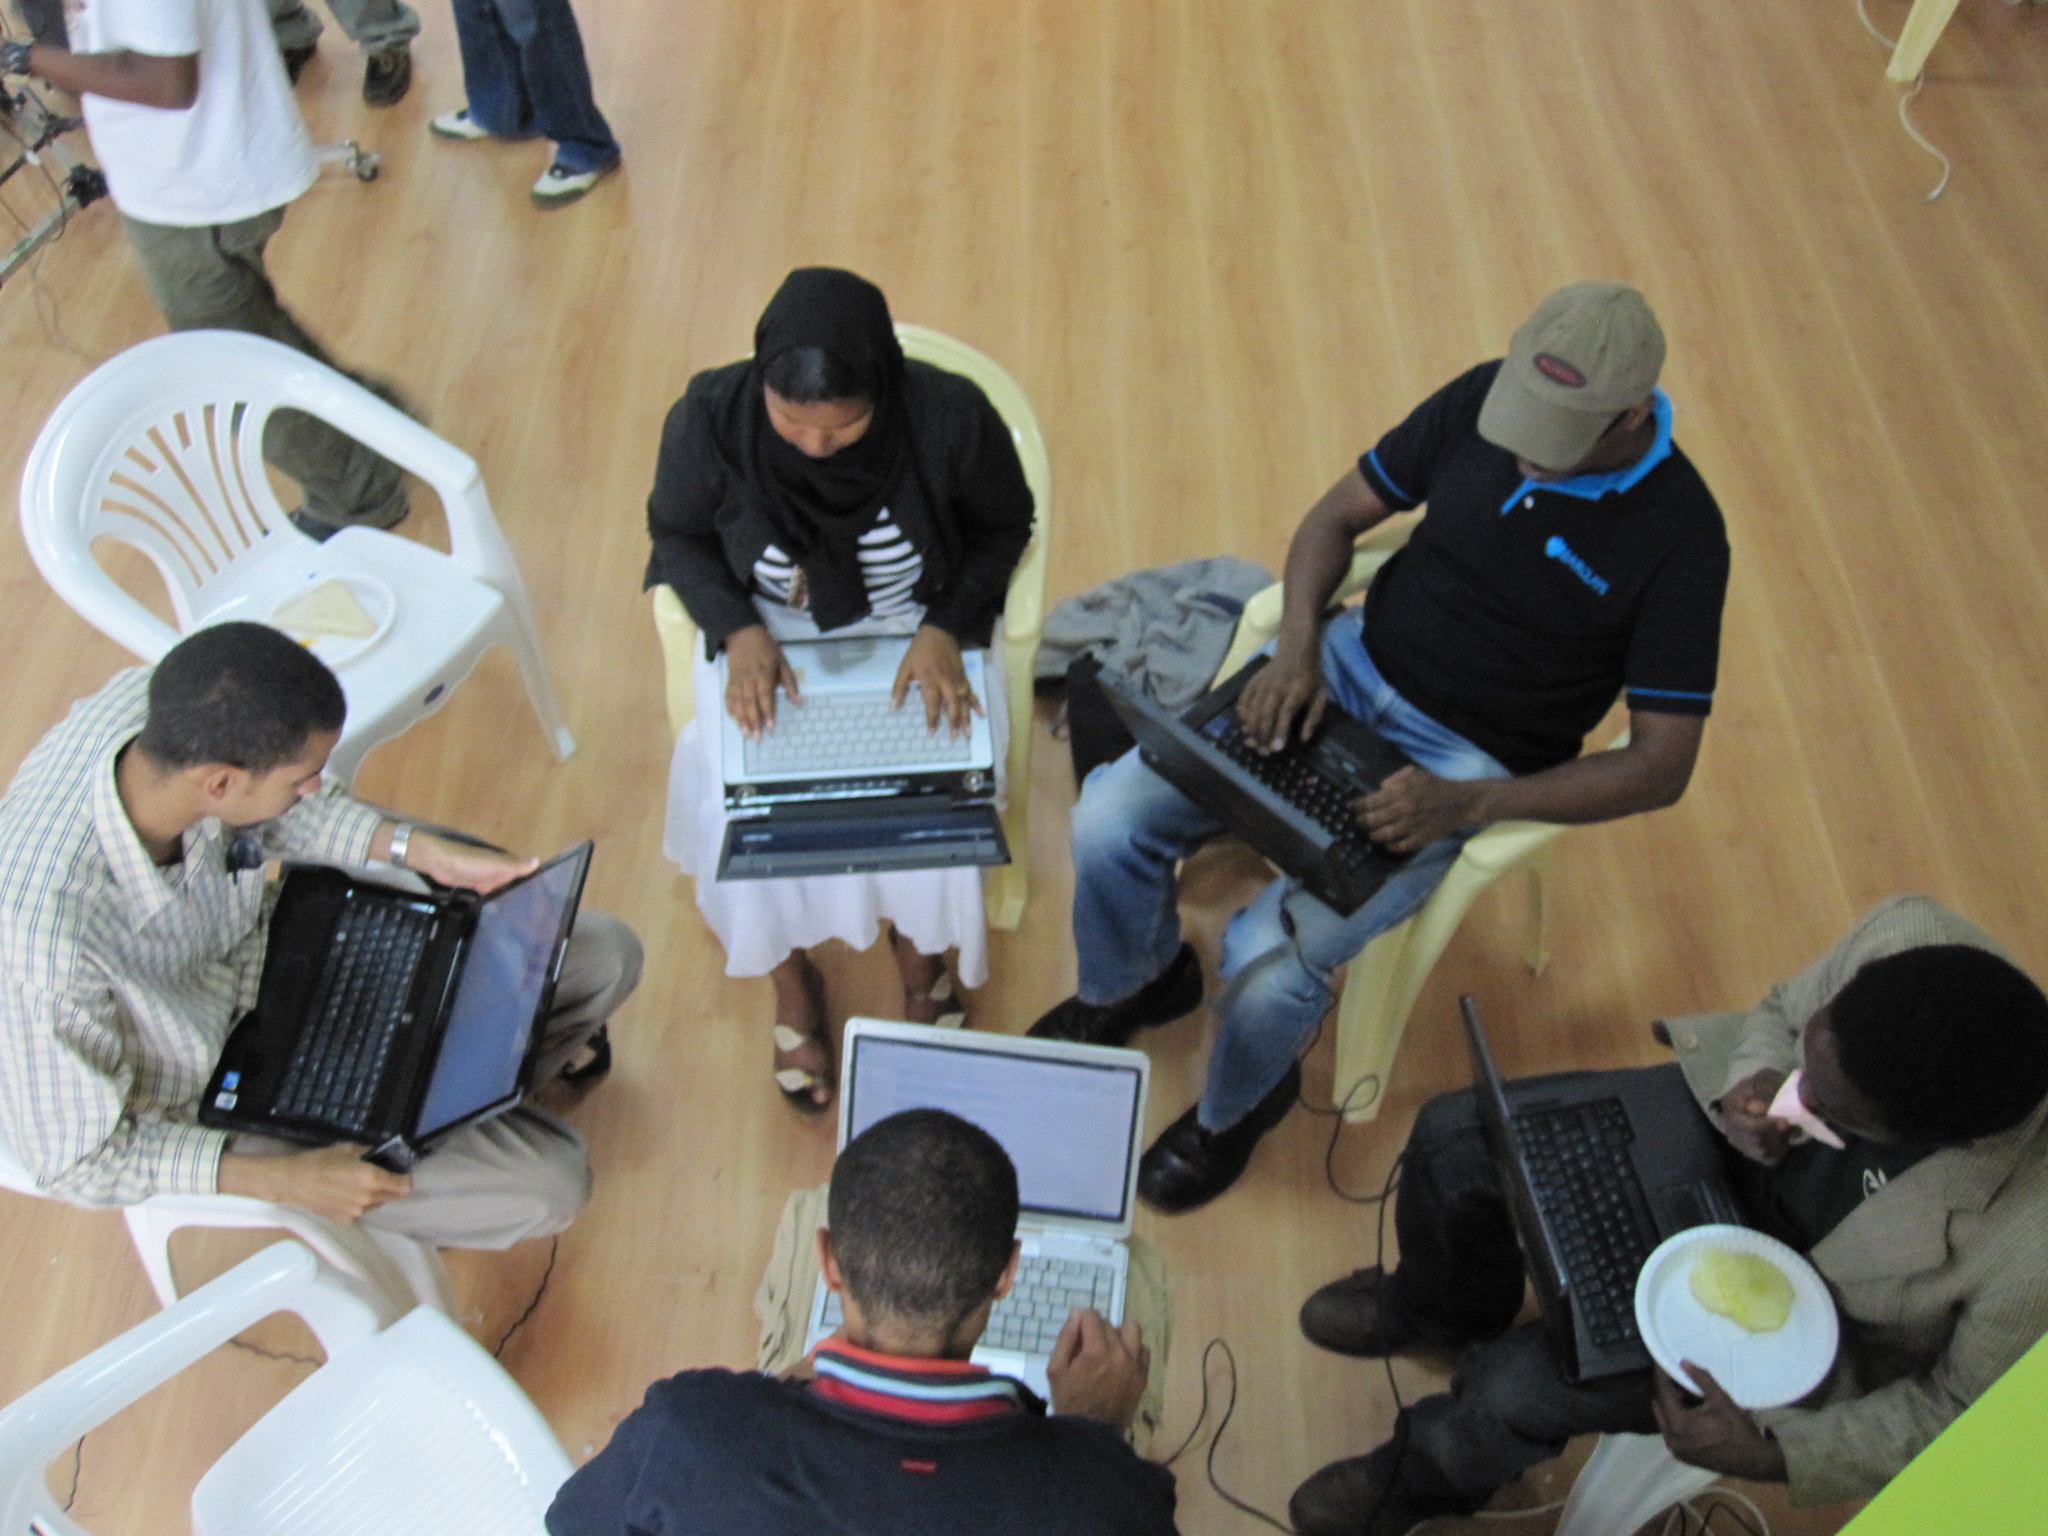
Random Hacks of Kindness, a two-day hackathon. “RHoK Nairobi, Kenya” by Erik (HASH) Hersman / CC BY

While there is no shortage of innovative ideas, there is a real need for the right equipment and tools to support this ecosystem of makers, hobbyists, innovators, and entrepreneurs. Raspberry Pi is poised to close this gap.

Get in touch

Over the next couple of months, we will be planning a tour of our focus countries to visit the leadership of engineering associations and bodies, engaging with engineering student communities and maker spaces on the continent and building strategic alliances to deepen our inroads in the region. As Covid restrictions are eased, we will be visiting several countries on the continent to help us discover how we can best provide products and services that directly impact the region by ensuring access to low-cost, high-quality technology.

ken okolo crop
Ken Okolo

Could your African retail business meet our high standards for Raspberry Pi Approved Resellers, or could your educational organisation or your enterprise benefit from affordable desktop computers? Do your products require embedded computing power, or could your business grow with low-cost, low-power process monitoring or control? Get in touch with us by emailing: [email protected]. We’re looking forward to hearing from you.

The post Growing Raspberry Pi’s presence in Africa appeared first on Raspberry Pi.

Monitoring MongoDB nodes and clusters with Zabbix

Post Syndicated from Dmitry Lambert original https://blog.zabbix.com/monitoring-mongodb-nodes-and-clusters-with-zabbix/16031/

Zabbix Agent 2 enables our users to monitor a whole set of new systems with minimal configuration required on the monitored systems. Forget about writing custom monitoring scripts, deploying additional packages, or configuring ODBC. A great use-case for Zabbix Agent 2  is monitoring one of the most popular NoSQL DB backends – MongoDB. Below, you can read a detailed description and step-by-step guide through the use case or refer to the video available here.

Zabbix MongoDB template

For this example, we will be using Zabbix version 5.4, but MongoDB monitoring by Zabbix Agent 2 is supported starting from version 5.0. If you have a fresh deployment of Zabbix version 5.0 or newer, you will be able to find the MongoDB template in your ‘Configuration‘ – ‘Templates‘ section.

MongoDB Node and Cluster templates

On the other hand, if you have an instance that you deployed before the release of Zabbix 5.0 and then upgraded to Zabbix 5.0 or newer, you will have to import the template manually from our git page. Let’s remember that Zabbix DOES NOT apply new templates or modify existing templates during an upgrade. Therefore, newly released templates have to be IMPORTED MANUALLY!

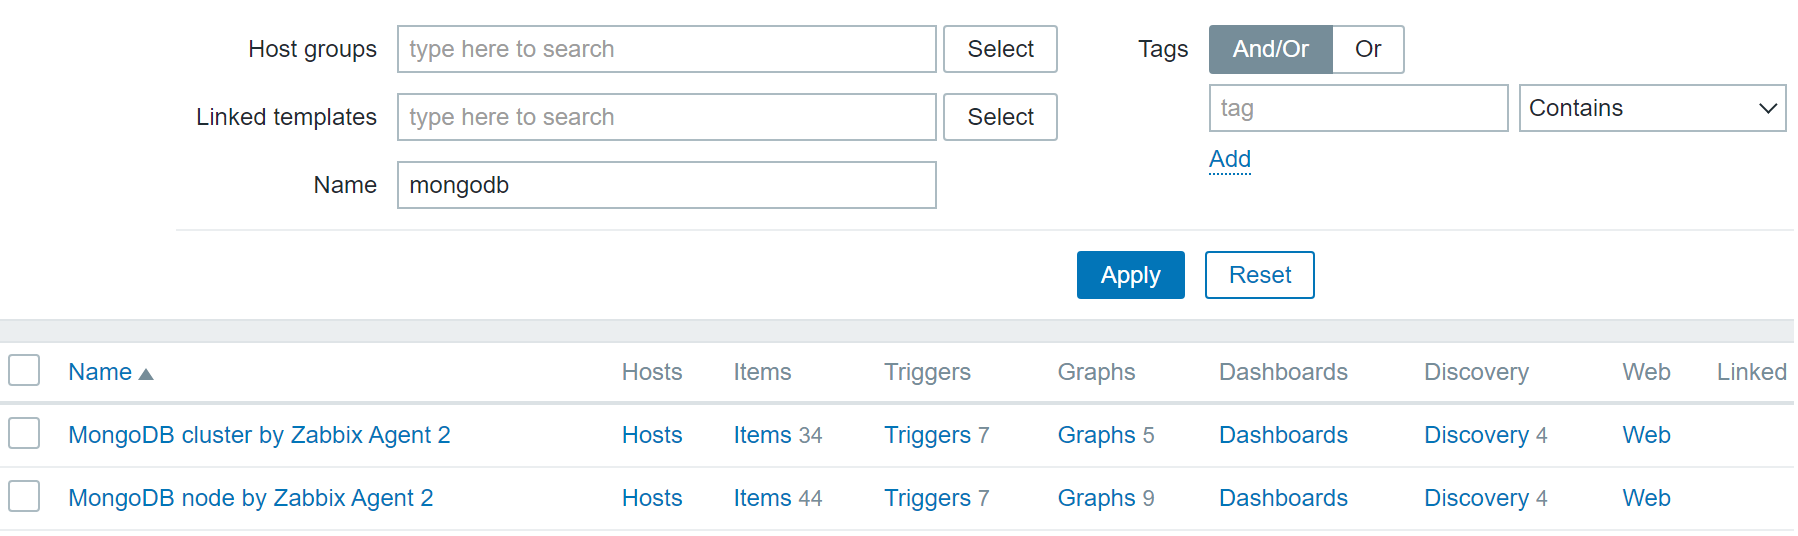
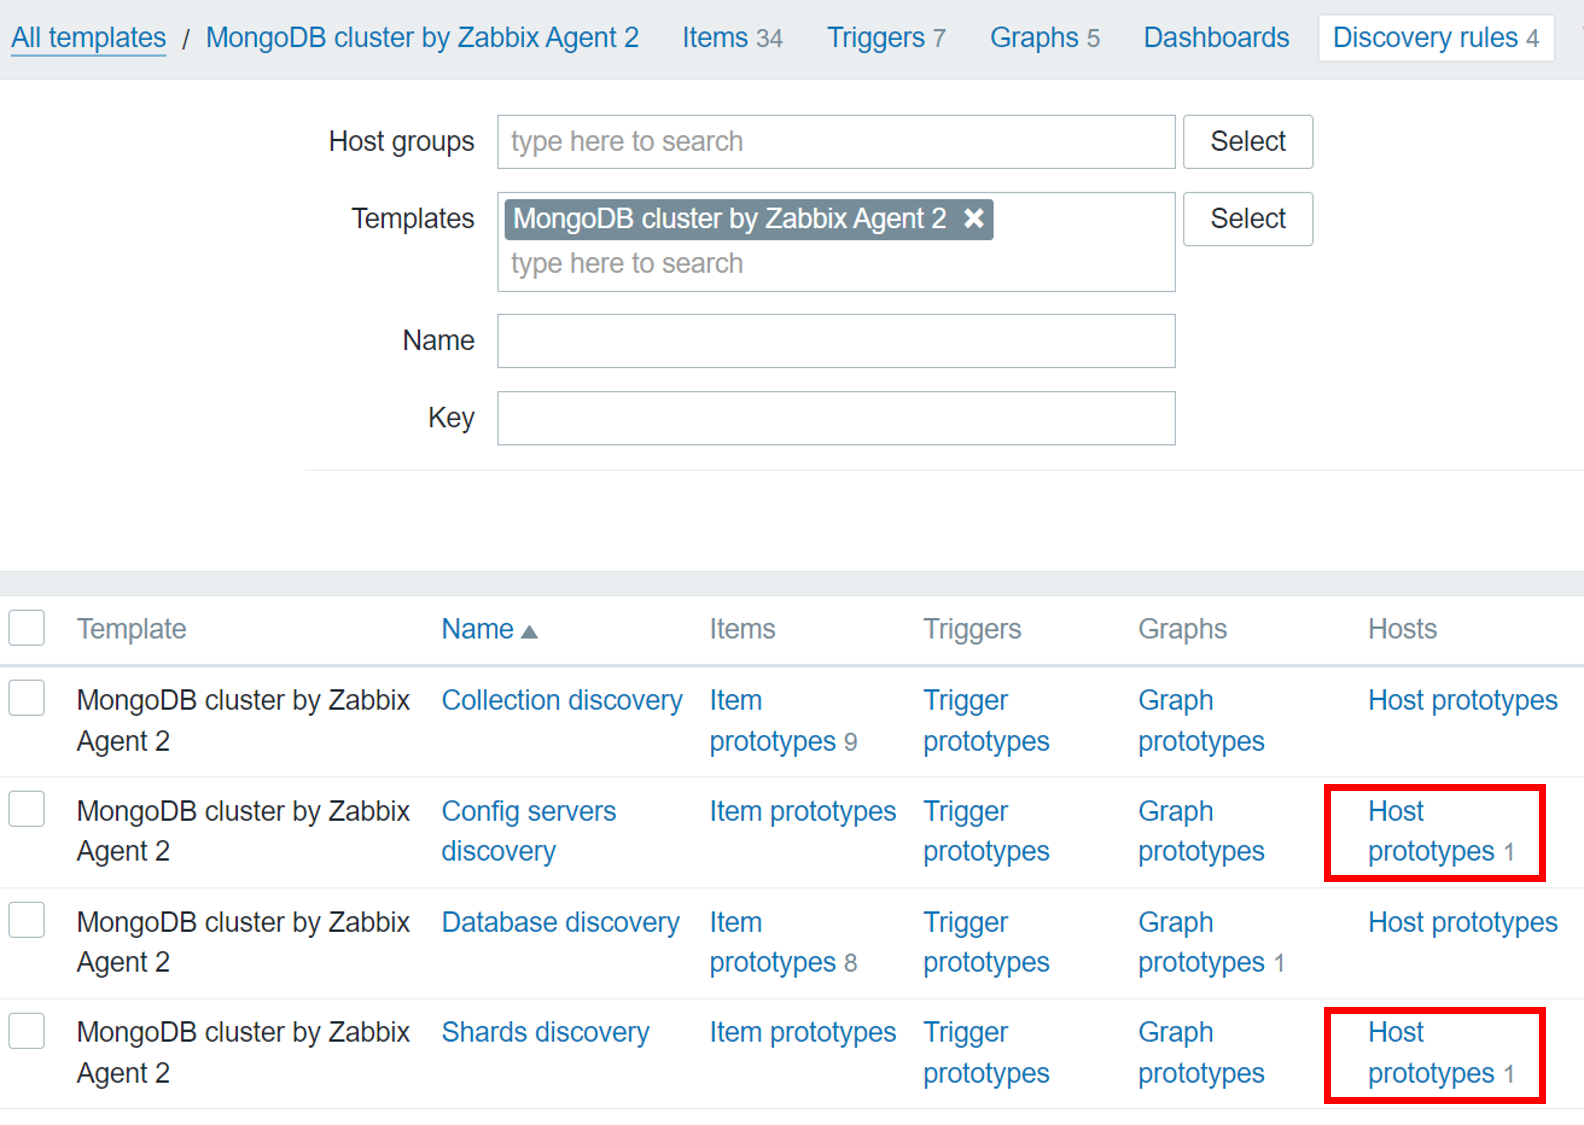
We can see that we have two MongoDB templates – ‘MongoDB cluster by Zabbix Agent 2’ and ‘MongoDB node by Zabbix agent 2’. Depending on your MongoDB setup – individual nodes or a cluster, apply the corresponding template. Note that the MongoDB cluster template can automatically create hosts for your config servers and shards and apply the MongoDB node template on these hosts.

Host prototypes for config servers and shards

Deploying Zabbix Agent 2 on your Host

Since the data collection is done by Zabbix Agent 2, first, let’s deploy Zabbix Agent 2 on our MongoDB node or cluster host. Let’s start with adding the Zabbix 5.4 repository and install the Zabbix Agent 2 via a  package.

Add the Zabbix 5.4 repository:

rpm -Uvh https://repo.zabbix.com/zabbix/5.4/rhel/8/x86_64/zabbix-release-5.4-1.el8.noarch.rpm

Install Zabbix Agent 2:

yum install zabbix-agent2

What if you already have the regular Zabbix Agent running on this machine? In this case, we have two options for how we can proceed. We can simply remove the regular Zabbix Agent and Deploy Zabbix Agent 2. In this case, make sure you make a backup of the Zabbix Agent configuration file and migrate all of the changes to the Zabbix Agent 2 configuration file.

The second option is running both of the Zabbix Agents in parallel. In this case, we need to make sure that both agents – Zabbix Agent and Zabbix Agent 2 are listening on their own specific ports because, by default, both agents are listening for connections on port 10050. This can be configured in the Zabbix Agent configuration file by changing the ‘ListenPort’ parameter.

Don’t forget to specify the ‘Server‘ parameter in the Zabbix Agent 2 configuration file. This parameter should contain your Zabbix Server address or DNS name. By defining it here, you will allow Zabbix Agent 2 to accept the metric poll requests from Zabbix Server.

After you have made the configuration changes in the Zabbix Agent 2 configuration file, don’t forget to restart Zabbix Agent 2 to apply the changes:

systemctl restart zabbix-agent2

Creating a MongoDB user for monitoring

Once the agent has been deployed and configured, you need to ensure that you have a MongoDB database user that we can use for monitoring purposes. Below you can find a brief example of how you can create a MongoDB user:

Access the MongoDB shell:

mongosh

Switch to the MongoDB admin database:

use admin

Create a user with ‘userAdminAnyDatabase‘ permissions:

db.createUser(
... {
..... user: "zabbix_mon",
..... pwd: "zabbix_mon",
..... roles: [ { role: "userAdminAnyDatabase", db: "admin" } ]
..... }
... )

The username for the newly created user is ‘zabbix_mon’. The password is also ‘zabbix_mon‘ – feel free to change these as per your security policy.

Creating and configuring a MongoDB host

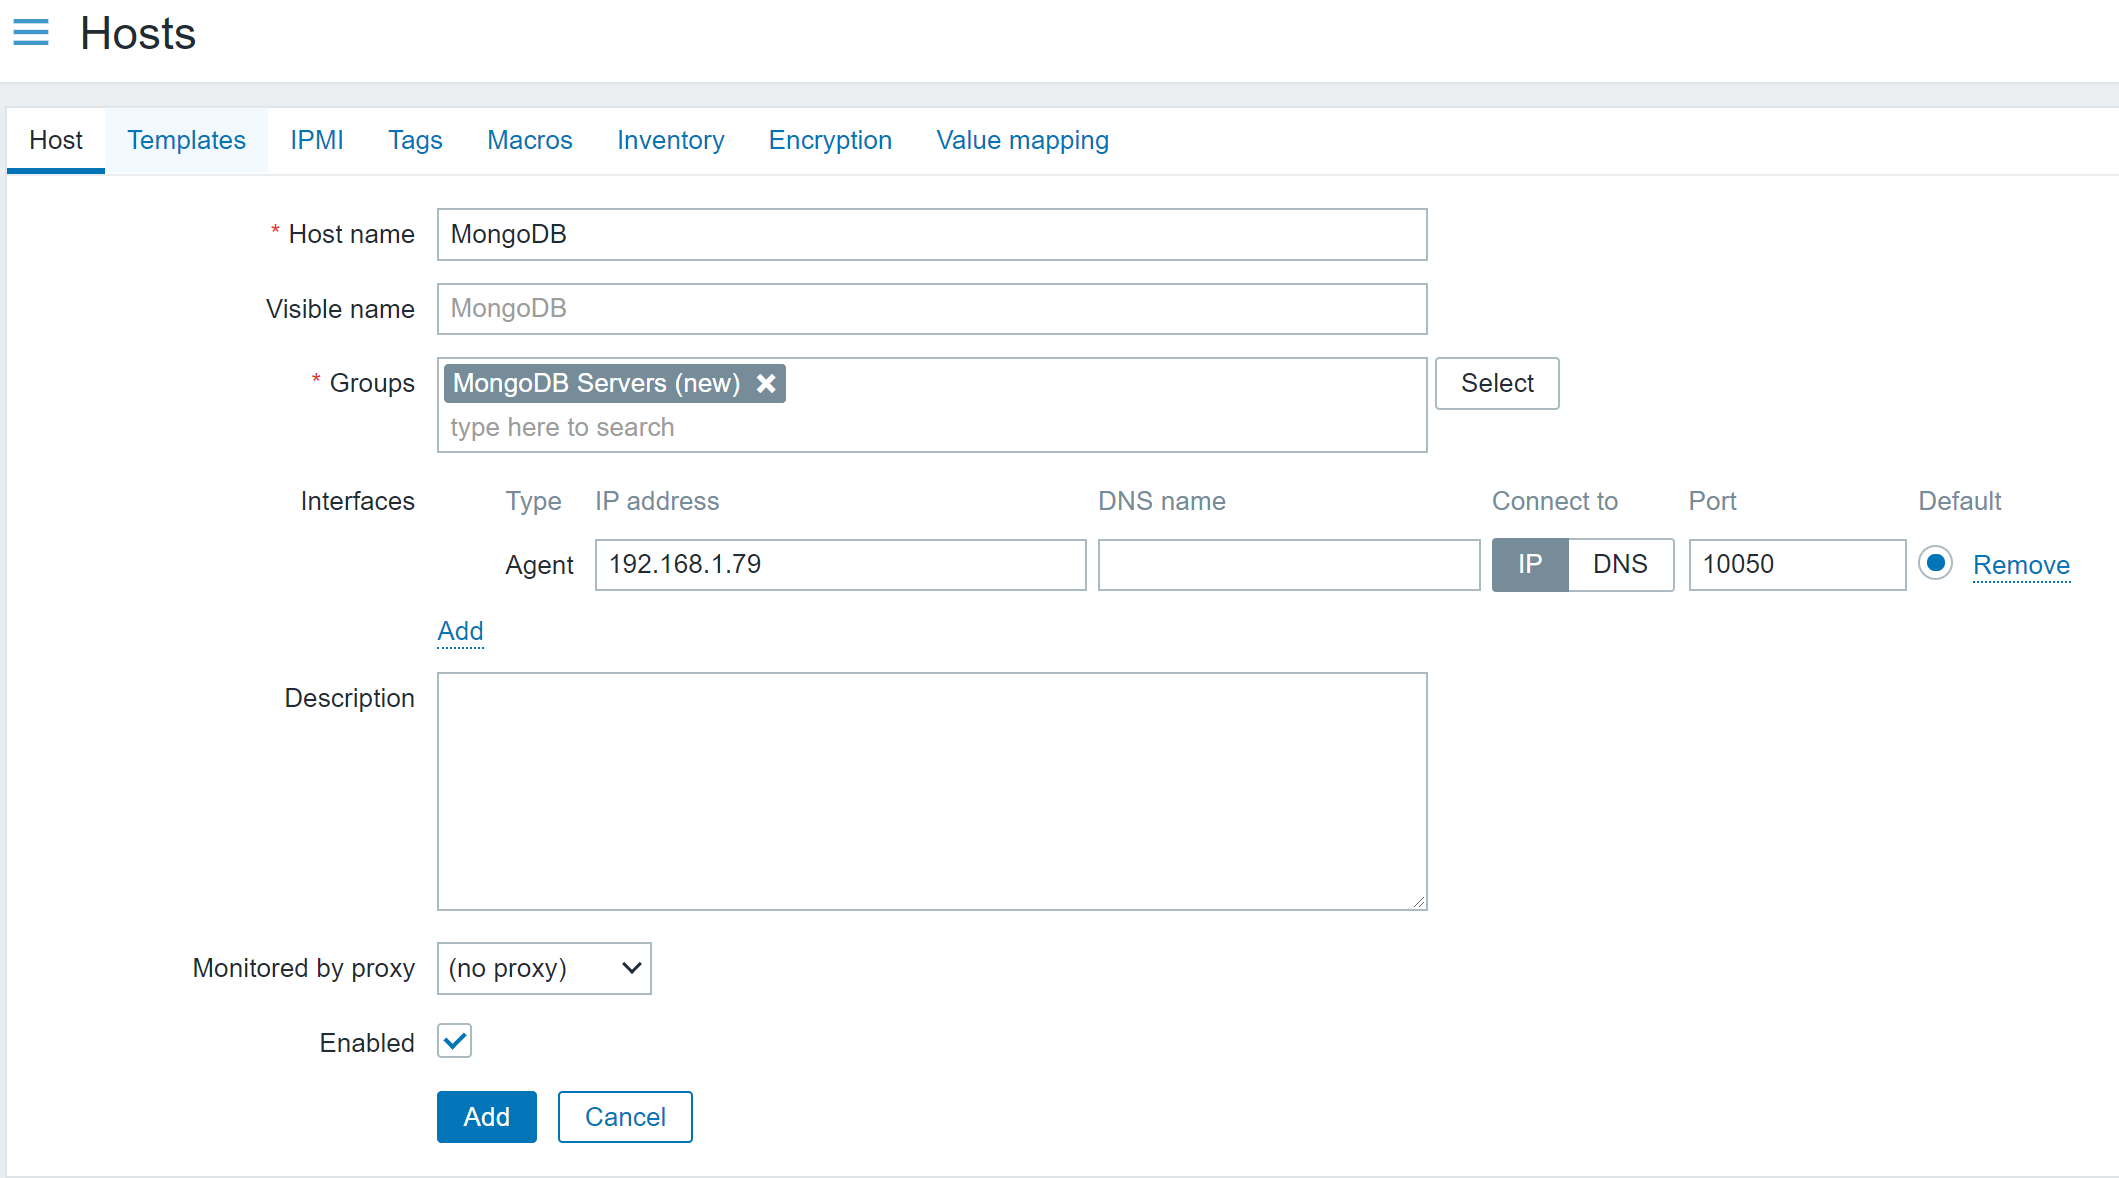
Next, you need to open your Zabbix frontend and create a new host representing your MongoDB node. You can see that in our example, we called our node ‘MongoDB’ and assigned it to a ‘MongoDB Servers’ host group. You can use more detailed naming in a production environment and use your own host group assignment logic. But remember – a host needs to belong to AT LEAST a single host group! 

Since the metrics are collected by Zabbix Agent 2, you must also create an Agent interface on the host. Zabbix Server will connect to this interface and request the metrics from the Zabbix Agent 2. Define the IP address or DNS name of your MongoDB host, where you previously deployed Zabbix Agent 2. Mind the port – by default, we have port 10050 defined over here, but if you have modified the ‘ListenPort’ parameter in the Zabbix Agent 2 config and changed the value from the default one (10050) to something else, you also need to use the same port number here.

MongoDB host configuration example

Next, navigate to the ‘Templates’ tab and assign the corresponding template – either ‘MongoDB node by Zabbix agent 2’ or ‘MongoDB cluster by Zabbix Agent 2’. In our example, we will assign the MongoDB node template.

Before adding the host, you also need to provide authentication and connection parameters by editing the corresponding User Macros. These User Macros are used by the items that specify which metrics should we be collecting. Essentially, we are forwarding the connectivity and authentication information to Zabbix Agent 2, telling it to use these values when collecting the metrics from our MongoDB instance.

To do this, navigate to the ‘Macros’ tab in the host configuration screen. Then, select ‘Inherited and host macros’ to display macros inherited from the MongoDB template.

We can see a bunch of macros here – some of them are related to trigger thresholds and discovery filters, but what we’re interested in right now are the following macros:

  • {$MONGODB.PASSWORD} –  MongoDB username. For our example, we will set this to zabbix_mon
  • {$MONGODB.USER} – MongoDB password. For our example, we will set this to zabbix_mon
  • {$MONGODB.CONNSTRING} – MongoDB connection string. Specify the MongoDB address and port here to which the Zabbix Agent 2 should connect and perform the metric collection

Now we are ready to add the host. Once the host has been added, we might have to wait for a minute or so before Zabbix begins to monitor the host. This is because Zabbix Server doesn’t instantly pick up the configuration changes. By default, Zabbix Server updates the Configuration Cache once a minute.

Fine-tuning MongoDB monitoring

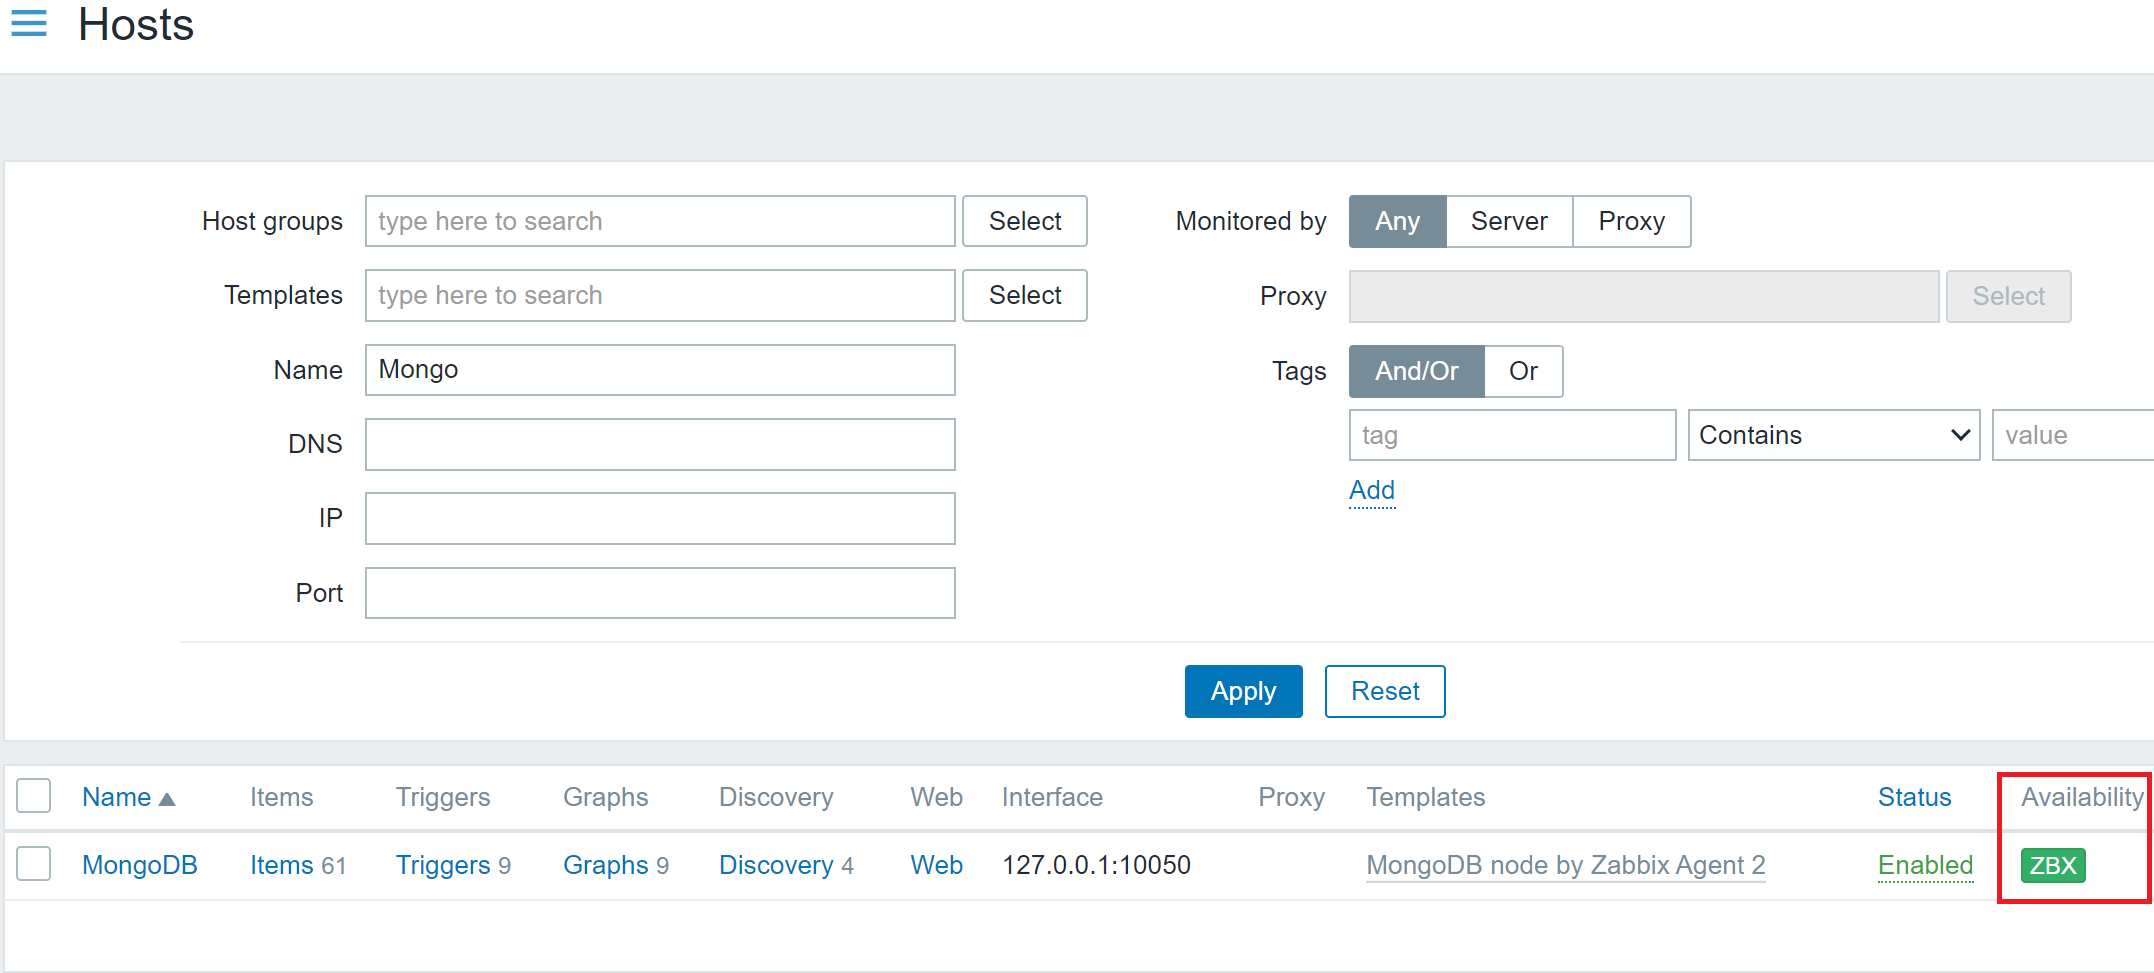
At this point, we should see a green ZBX Icon next to our MongoDB host.

Data collection on the MongoDB host has started – note the green ‘ZBX’ icon.

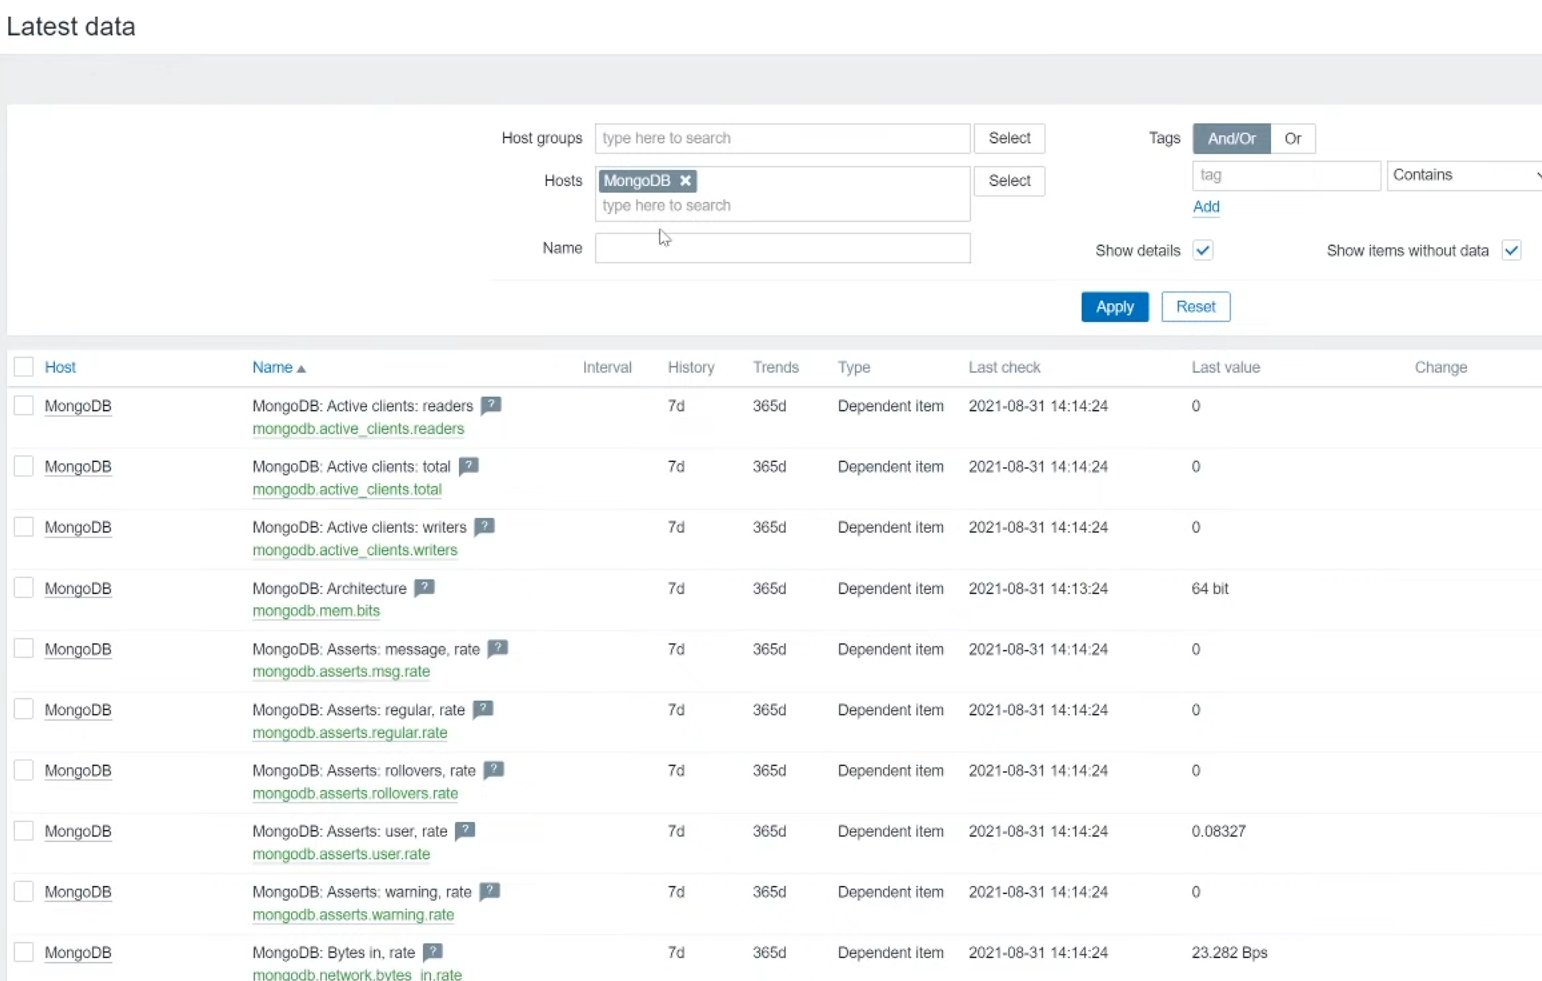
This means that the Zabbix Server has successfully connected to our Zabbix Agent 2, and the metric collection has begun. You can now navigate to the ‘Monitoring’ – ‘Latest data’ section, filter the view by your MongoDB host, and you should see all of the collected metrics here.

MongoDB metrics in ‘Monitoring’ – ‘Latest data’

The final task is to tune the MongoDB monitoring on your hosts, collecting only the required metrics. Navigate to ‘Configuration’ – ‘Hosts’, find your MongoDB hosts, and go through the different entity types on the host – items, triggers, discovery rules. See an item that you don’t wish to collect metrics for? Feel free to disable it. Open up the discovery rules – change the update intervals on them or disable the unnecessary ones.

Note: Be careful not to disable master items. Many of the items and discovery rules here are of type ‘Dependent item’ which means, that they require a so-called ‘Master item’. Feel free to read more about dependent items here.

Remember the ‘Macros’ section in the host configuration? Let’s return to it. here we can see some macros which are used in our trigger thresholds, like:

  • {$MONGODB.REPL.LAG.MAX.WARN} – Maximum replication lag in seconds
  • {$MONGODB.CURSOR.OPEN.MAX.WARN} – Maximum number of open cursors

Feel free to change these as per your problem threshold requirements.

One last thing here – we can filter which elements get discovered by our discovery rules. This is once again defined by user macros like:

  • {$MONGODB.LLD.FILTER.DB.MATCHES} – Databases that should be discovered (By default, the value here is ‘.*’, which will match everything)
  • {$MONGODB.LLD.FILTER.DB.NOT_MATCHES} – Databases that should be excluded from the discovery

And that’s it! After some additional tuning has been applied, we are good to go – our MongoDB entities are being discovered, metrics are getting collected, and problem thresholds have been defined. And all of it has been done with the native Zabbix Agent 2 functionality and an out-of-the-box MongoDB template!

За консерваторите, либералите и променящия се свят

Post Syndicated from original http://www.gatchev.info/blog/?p=2381

Този запис се роди като коментар под пост във Фейсбук. След това реших, че може би е добре да го пусна и в блога си, леко допипнат. Ще е полезен като минимум за мен самия, по-късно.

—-

Наскоро проведох два разговора, може би ще драсна за тях някой ден. Те ме накараха да се замисля откъде идва съвременният вид тъпота – антиваксърство, конспиромания, вярване на измамници.

Той всъщност хич не е нов. Първите антиваксъри са противници на ваксината на Дженър, преди столетия. И по-късно тази ваксина е била посрещана с яростни кампании и злобни карикатури по вестници. Но именно напоследък тази тъпота стана масова, като пандемия. Не намерим ли средство срещу нея, рискуваме да ни унищожи… А за да намерим средство, е нужно да знаем причината за нея.

Според мен причината е, че светът напоследък се променя много по-бързо отпреди. Светът, с който сме свикнали като деца, приспособили сме към него и можем да се справяме в него, вече го няма. На негово място е дошъл нов, различен свят. Свят, в който навиците ни и наученото от нас често не работи. И вместо до успех ни води до провали.

Някои могат да се приспособят към този нов свят, като поддържат знанията и уменията си адекватни. Така те запазват мястото си в света, на което тежат, нужни са и усилията им биват възнаграждавани както усещат за нужно или могат да приемат.

Много хора не успяват. Нямат нужните гъвкавост и интелект. Те остават без истинско място в света си – и с усещането, че са изгубили почва под краката си. Че са им отнети опората и стабилността, не могат да се справят с живота и съществуването им е под заплаха.

(Затова това усещане е особено масово сред консервативните и дясно мислещите. Техните позиции и убеждения – привързаност към отминаващи, изоставяни от развитието неща – ги правят по-уязвими на този ефект. Затова често дори не особено интелигентни либерали запазват адекватността и баланса си там, където високо интелигентни консерватори не смогват.

Друга уязвима група са страдащите от латентни тревожни разстройства – може би около 15% от населението. При тях усещането за несигурност е засилено от латентното страдание, със същия ефект.)

Това усещане е изключително дискомфортно и жертвите му търсят успокоение. А най-добре успокоява мисълта, че те знаят и разбират от нещо, което имащите своето място в този нов свят не знаят. И че скоро палачинката ще се обърне и те ще са пак отгоре. (А в България е силен стимул и другата половина от тази мисъл – че омразните оправни, запазили позициите и стабилността си, тогава ще отидат отдолу…)

Лъжезнанието дава тази мисъл. Затова тези хора масово вярват в плоскоземие, антиваксерство, хомеопатия, вечни двигатели, американците-не-са-кацали-на-Луната и подобни. И пак затова са особено популярни сред тях „червеното хапче“ и други мемове, според които те са нормалните, а реално адекватните хора са промити мозъци и т.н.

Разбира се, нужно е обяснение как така „официалните“ наука, политика, технология и т.н. са на обратните позиции. Затова тези хора обикновено вярват в могъщи световни конспирации – рептили, илюминати, билдерберги, еврейски заговори и прочее. Тези световни конспирации според тях владеят света и му налагат „Голямата Лъжа“ (всъщност истината за реалността). Това дава убедителност на мисълта, че светът е крив, а те са прави.

Тези хора получават от заблудите си усещане за стабилност и надежда, те са психическата им опора. Опитите да бъдат върнати в реалността са за тях опити да им се отнемат надеждата и опората. Затова те посрещат тези опити с ирационална, психотична съпротива. Демонстрират неспособност за възприемане на очевидното и неприемане на неоспорими логически аргументи, в степен непонятна за нормалните. Дори ако приемат дадено доказателство, те веднага намират друг аргумент в подкрепа на заблудите си. Ако и той им бъде отнет, прескачат на трети. Ако арсеналът им бъде изчерпан, те се връщат отново на първия, игнорирайки факта, че той е опроверган и те са приели това преди малко. Нерядко дори стандартна доза антипсихотици се оказва недостатъчна.

Единственият начин тези хора да бъдат излекувани е като им се намери как да имат стабилност и опора в реалния свят. Само по себе си това най-често е недостатъчно – необходима е и много психотерапия, а в по-тежки случаи и медикаментозно лечение. Без него обаче най-често психотерапията и медикаментозното лечение остават учудващо неефективни. А дори да успеят, резултатът най-често е нестабилна личност, която се пречупва по някакъв начин при първите сблъсъци с реалността и нейните проблеми, и лудостта им релапсира.

Най-лошото е, че прогресът продължава да ускорява хода си – тоест, тези хора ще стават все повече и по-радикални. Възможно е дори да се наложи забавяне на прогреса, за да не се стигне до граждански войни. А това забавяне пък ще доведе до забавяне или дори подминаване на ключови научни открития, с ключови социални ефекти от липсата им.

Мисля си – колко е прав Карл Сейгън в „Свят, населен с демони“…

Цитирам няколко откъса от нея. Може би заради това ще ме съдят за нарушение на авторски права, и сигурно ще ме осъдят. Но си мисля – ако дори един човек ги е прочел и разбрал заради този ми запис, ще си струва да плащам глоби или дори да лежа в затвора. Да, именно толкова е важно повече хора да разбират тези неща.

Всъщност, би трябвало да я цитирам цялата. В нея буквално няма пасаж, който да не си струва четенето… Има я онлайн – в „Моята библиотека“ (http://chitanka.info/text/22917-svjat-naselen-s-demoni). Сайт, много пъти преследван заради книгите в него. Не от зли цензори, решили да скрият от нас знания – от адвокати, загрижени за доходите на правособствениците на тези книги. От „добри“ герои в живота… Само че резултатът е точно същият. Така че прочетете я, докато го има сайтът. Най-малкото защото не е трудно да се сети човек какво ще стане с четенето на книги изобщо, ако глупостта в света надделее и се спусне мракът на ново Средновековие.

И ако я откриете да се продава някъде, си я купете и я предлагайте на всеки свой познат, на децата и роднините си, дори на поразените от чумата на лъжезнанието – току-виж стигне до някого. Рано или късно ще дойде ден този някой да ви е благодарен.

—-

Докато се настанявахме в колата преди дългото пътуване, а чистачките ритмично скърцаха по предното стъкло, той ми каза, че се радва, че аз съм „онзи учен“ — имал толкова много въпроси относно науката. Дали имам нещо против?

Не, нямах.

И така, започнахме да си говорим. Но, както скоро стана ясно, не за наука. Той искаше да говорим за замразени извънземни, скрити в базата на Военновъздушните сили край Сан Антонио, за „канализирането“ (метод за подслушване на това, за което си мислят мъртвите — всъщност за нищо особено, както се оказва), за кристали, астрология, пророчествата на Нострадамус, Торинската плащаница… Въвеждаше всяка нова зловеща тема с жизнерадостен ентусиазъм. И всеки път трябваше да го разочаровам.

— Доказателствата са спорни — повтарях аз. — Има много по-просто обяснение.

От определена гледна точка, той беше много начетен. Например познаваше различните спекулативни нюанси на „потъналите континенти“ Атлантида и Лемурия. Знаеше всичко за това коя подводна експедиция уж тъкмо се била отправила да открие изчезнала велика цивилизация, чиито паднали колони и порутени минарета сега са посещавани единствено от дълбоководни светещи риби и гигантски морски чудовища. И все пак…, въпреки че океаните крият много тайни, аз знам, че няма абсолютно никакви океанографски или геофизични данни, които да подкрепят съществуването на Атлантида и Лемурия. Поне доколкото науката може да се произнесе, те никога не са съществували. Казах му го, макар и с известно нежелание.

Докато карахме през дъжда, усетих как той става все по-навъсен и по-навъсен. Аз опровергавах не просто някакви псевдодоктрини, а една скъпоценна част от неговия вътрешен живот.

И все пак в истинската наука има толкова много неща, които са също толкова вълнуващи, по-загадъчни са и освен това поставят по-големи интелектуални предизвикателства — като в същото време са значително по-близо до истината. Дали той знаеше за молекулярните градивни единици на живота, които се намират там някъде в студения разреден газ на междузвездното пространство? Дали беше чувал за стъпките на нашите прадеди, открити във вулканична пепел отпреди четири милиона години? Ами за издигането на Хималаите, когато Индия се е сблъскала с Азия? Или за вирусите, които действат на принципа на подкожната инжекция, които промъкват своето ДНК покрай защитите на приемния организъм и преобръщат механизмите за възпроизводство на клетката? Или за търсенето на извънземен разум посредством радиовълни? Или за току-що откритата древна цивилизация Ебла, която е рекламирала достойнствата на своята бира? Не, не беше чувал. Нито пък знаеше нещо — колкото и малко да е — за квантовата неопределеност. За него ДНК бяха просто три главни букви, които често се срещат заедно.

Г-н „Бъкли“ — надарен с красноречие, интелигентен, любопитен — на практика не беше чувал нищо за модерната наука. Имаше естествен апетит към чудесата на вселената. Искаше да знае за науката. Просто беше станало така, че — преди да успее да стигне до него — цялата наука беше минала през няколко филтъра. Нашите културни мотиви, образователната ни система, средствата за масово осведомяване — всички те бяха заблудили този човек. Всичко, на което обществото беше позволило да се промъкне, се свеждаше до измами и объркване. То не го беше научило да прави разлика между истинска наука и евтина имитация. Той не знаеше нищо за това как всъщност работи науката.

Има стотици книги за Атлантида — митичният континент, за който се твърди, че е съществувал преди около 10 000 години в Атлантическия океан. (Или някъде другаде. Една появила се наскоро книга го локализира на Антарктида.) Историята започва от Платон, който преразказва легенда, дошла до него от далечни времена. Последните книги авторитетно описват високото ниво на атлантските технологии, морал и духовност, както и голямата трагедия на един, цял обитаем континент, потънал под морските вълни. Има и една Ню Ейдж[1]-Атлантида — „легендарна цивилизация с напреднали науки“, свеждащи се най-вече до „науката“ за кристалите. Според трилогията на Катрина Рафаел „Кристалното просветление“ — книгите, които са основната причина за кристалната мания в Америка — атлантските кристали могат да четат мисли и да препредават мисли. Те освен това се явяват хранилища на древното познание, както и модел и основа на египетските пирамиди. В полза на тези твърдения не е предложено нищо, което дори малко да наподобява факти. (Ново възраждане на кристалната мания може да последва скорошното откритие на науката сеизмология, че вътрешното ядро на планетата може би представлява един-единствен огромен, почти съвършен кристал — само че железен.)

Някои книги — сред тях и „Легендите на света“ на Дороти Виталиано — се опитват да разберат първоначалните митове за Атлантида като разказ за унищожен от вулканично изригване малък остров в Средиземно море или пък за древен град, свлякъл се в Коринтския залив при земетресение. Доколкото въобще можем да кажем нещо, това биха могли да са корените на легендата. Те обаче са твърде далеч от гибелта на континент, на който се е развила загадъчна цивилизация с неестествено развита технология.

Това, което почти никога не намираме — в обществените библиотеки, в списанията по вестникарските будки и в най-гледаните телевизионни програми, — са фактите за разширяването на океанското дъно и за тектониката на плочите. Няма ги получените при картирането на океаните данни, които показват, че в предложените хронологични рамки не е възможно да е имало континент между двете Америки и Европа.

Много е лесно да се откроят лъжливите теории, които оплитат лековерните. Скептичните изследвания са много по-недостъпни. Скептицизмът просто не се продава добре. Всеки интелигентен и любопитен човек, който разчита единствено на масовата култура да го информира относно нещо като Атлантида, е стотици или дори хиляди пъти по-вероятно да попадне на безкритично изложена измислица, отколкото на трезва и балансирана оценка.

Така че г-н „Бъкли“ трябва да подхожда по-скептично към нещата, които му поднася масовата култура. Но като се изключи това, ще бъде много трудно да го обвиним в нещо. Той просто е приел това, което най-разпространените и леснодостъпните източници на информация са представили като вярно. Вследствие от своята наивност систематично е бил подвеждан и баламосван.

Науката поражда извисяващо чувство на удивление. Но същото прави и псевдонауката. Редките и некачествени популяризации на науката оставят екологични ниши, които бързо биват запълнени от псевдонауката. Ако всички хора разбираха, че — за да бъдат приети — претенциите за познание трябва да бъдат подплатени с адекватни доказателства, то за псевдонауката просто нямаше да има място. Но в масовата култура господства един вид закон на Грешам, според който лошата наука измества добрата.

—-

Дори и в най-добрите си времена домодерната медицинска практика не е спасила много хора. Кралица Ана е последният монарх на Великобритания от династията на Стюардите. През последните седемнадесет години на XVII в. тя забременява осемнадесет пъти. Само пет от децата се раждат живи и само едно момче преживява бебешката възраст. То умира, преди да е навършило пълнолетие и преди коронацията на кралицата през 1702 година. Не изглежда да има доказателства за някакъв генетичен проблем. Кралица Ана е имала най-добрата медицинска помощ, която парите са можели да й осигурят.

Постепенно науката е ограничила и излекувала болестите, които някога трагично са отнасяли безброй много бебета и деца — вследствие откриването на света на микробите; поради прозрението, че лекарите и акушерките трябва да мият ръцете си и да стерилизират своите инструменти; като резултат от промените в храненето, здравеопазването и обществената хигиена; благодарение на антибиотиците, лекарствата, ваксините, разгадаването на молекулярната структура на ДНК, молекулярната биология и новите генни терапии. В сравнение с наследника на трона на една от най-могъщите държави на планетата от края на XVII в. днес поне в развитите страни родителите имат несравнимо по-голям шанс да видят децата си да доживеят до пълнолетие. Едрата шарка е изкоренена по целия свят. Драстично са намалели териториите, обитавани от маларийния комар. Всяка година средната продължителност на живота на дете с диагноза левкемия се увеличава. Науката е позволила на планетата да изхранва около сто пъти повече хора — в сравнение със ситуацията преди няколко хиляди години, — при това при далеч не толкова сурови условия.

Можем да се молим над някоя жертва на холерата, или можем да й даваме по 500 милиграма тетрациклин на всеки дванадесет часа. (Все още съществува една религия — Християнската наука, — която отрича бацилната теория за заболяванията. Ако молитвата не даде необходимия резултат, вярващият би предпочел да види децата си умиращи, отколкото да им даде антибиотици.) Можем да приложим — почти без никакъв успех — терапията на психоанализата (основаваща се на говоренето) към пациент, страдащ от шизофрения, или всеки ден да му даваме между 300 и 500 милиграма клозапин. Научните методи на лечение са стотици хиляди пъти по-ефективни от алтернативните. (А дори когато алтернативните методи, изглежда, сработват, просто не сме сигурни дали те са изиграли някаква роля: спонтанното възстановяване от холера и шизофрения може да настъпи и без молитви и психоанализа.) Да изоставим науката, означава много повече от това да се откажем от климатичните инсталации, стерео уредбите, сешоарите и бързите коли.

В епохата на лова и събирателството — преди появата на земеделието — средната продължителност на човешкия живот е била между 20 и 30 години. Същото се отнася и за Западна Европа през Късноримския и Средновековния период. Увеличава се до около 40 години едва около 1870 г., достига 50 през 1916 г., 60 през 1930 г. и 70 през 1955 година. Днес се доближава до 80 години (малко повече за жените, малко по-малко за мъжете). Останалата част от света следва европейския напредък в дълголетието. Каква е причината за този невероятен, безпрецедентен хуманитарен преход? Бацилната теория за болестите, мерките на общественото здравеопазване, лекарствата и медицинската технология. Може би дълголетието е възможно най-добрата мярка за физическото качество на живота. (Едва ли можете да допринесете с нещо за своето щастие, ако сте мъртъв.) Това е безценният подарък, който науката е направила на човечеството — дарът на живота, ни повече, ни по-малко.

—-

Популяризирането на науката — да се опиташ да направиш нейните методи и открития достъпни за неспециалисти — се зароди непосредствено и естествено от моята мечта. Да не обясниш науката, ми се струва извратено. Когато си влюбен, искаш целият свят да го знае. Тази книга е мое лично изявление, което отразява моя доживотен романс с науката.

Но има и друга причина. Науката е нещо повече от натрупани знания. Тя е начин на мислене. Имам лошо предчувствие за тази Америка, в която ще живеят моите деца и внуци — когато Съединените щати ще бъдат икономика от услуги и информация; когато почти всички ключови производства ще са преместени в други страни; когато огромната технологична мощ ще бъде концентрирана в ръцете на малцина и нито един представител на обществените интереси няма да може дори да се докосне до проблемите; когато хората ще са загубили способността да контролират съдбата си и да задават на управляващите осведомени въпроси; когато всеки ще е сграбчил своя кристал и нервно ще прелиства хороскопа си; когато — лишени от критичното си мислене и неспособни да правим разлика между истината и това, което ни кара да се чувстваме добре — ще се плъзнем, почти без да забележим, назад към суеверията и тъмнината.

Затъпяването на Америка е най-очевидно в бавния упадък на същественото съдържание на имащите огромно влияние медии, в 30-секундните звукови откъслеци (сега вече по 10 секунди или дори по-малко), в съставянето на програмата според най-ниския общ знаменател, в представянето на псевдонауката и суеверията като нещо достоверно, но най-вече в един вид величаене на невежеството. Докато пиша тези редове, най-търсената видеокасета в Америка е „От глупав по-глупав“. „Бийвис и Бътхед“ продължават да са популярни сред младите телевизионни зрители. Очевидната поука е, че ученето и образованието — не само в областта на науката, но въобще — съвсем не са задължителни. Напротив, дори са вредни.

Създали сме глобална цивилизация, в която най-жизненоважните елементи зависят изцяло от науката и технологиите. Става дума за транспорта, комуникациите и всички промишлени производства; за селското стопанство, медицината, образованието, забавленията, опазването на околната среда; дори за ключовата демократична институция — гласуването. Освен това сме се погрижили почти никой да не разбира науката и технологиите. Това е рецепта за катастрофа. Може би ще ни се размине за известно време, но рано или късно тази взривоопасна смес от сила и невежество ще избухне в ръцете ни.

„Свещ в мрака“ е заглавието на една смела книга на Томас Ади, публикувана в Лондон през 1656 година. Тя стъпва основно на Библията и е насочена срещу вилнеещия по това време лов на вещици, който авторът заклеймява като измама „за заблуда на хората“. В тази епоха народът приписва на вещерството всяка болест или буря и изобщо всичко необичайно. Вещиците трябва да съществуват — тук Ади цитира твърденията на обвинителите, — „иначе как би било възможно да има и да са се случили подобни неща“? През по-голямата част от своята история ние дотолкова сме се страхували от външния свят и неговите непредсказуеми опасности, че с радост сме приемали всичко, което ни е обещавало да смекчи и обясни този ужас. Науката представлява опит — до голяма степен успешен — да разберем света, да проумеем нещата, да установим контрол над самите нас, да намерим верния курс. Днес микробиологията и метеорологията обясняват явления, които само допреди няколко века са били разглеждани като достатъчна причина за това жени да бъдат изгаряни живи.

Освен това Ади предупреждава за опасността от това, че „нациите ще загинат поради липсата на знание“. Предотвратимото човешко нещастие далеч по-често е причинено не от глупост, а от невежество — и най-вече от невежеството ни за самите нас. Тревожа се — особено сега, когато наближава краят на хилядолетието — че от година на година суеверията и псевдонауката ще стават все по-привлекателни, а песента на сирените на безумието — все по-звучни и омайни. Нима не сме ги чували и преди? Всеки път когато нашите етнически и национални предразсъдъци са се пробуждали; във времена на недоимък; когато сме посрещали предизвикателства срещу националното ни самочувствие и характер; когато сме били тласкани към агония от принизеното ни място в космическия ред и липсата на висша цел; когато фанатизмът е бушувал около нас — тогава тези мисловни навици, които са наследство от далечни епохи, са протягали ръце към властта.

Пламъкът на свещта пращи. Малкото кръгче светлина потрепва. Мракът се сгъстява. Демоните се раздвижват.

—-

Григор: Моля ви, не се задоволявайте с тези откъси. Прочетете цялата книга. Сериалът „Космос“ е велико постижение на Карл Сейгън, приносите му към американската космическа програма също са огромни. Но тази книга вероятно затъмнява всичко друго заедно.

Прочетете я.
Facebook Is Down

Post Syndicated from Bruce Schneier original https://www.schneier.com/blog/archives/2021/10/facebook-is-down.html

Facebook — along with Instagram and WhatsApp — went down globally today. Basically, someone deleted their BGP records, which made their DNS fall apart.

…at approximately 11:39 a.m. ET today (15:39 UTC), someone at Facebook caused an update to be made to the company’s Border Gateway Protocol (BGP) records. BGP is a mechanism by which Internet service providers of the world share information about which providers are responsible for routing Internet traffic to which specific groups of Internet addresses.

In simpler terms, sometime this morning Facebook took away the map telling the world’s computers how to find its various online properties. As a result, when one types Facebook.com into a web browser, the browser has no idea where to find Facebook.com, and so returns an error page.

In addition to stranding billions of users, the Facebook outage also has stranded its employees from communicating with one another using their internal Facebook tools. That’s because Facebook’s email and tools are all managed in house and via the same domains that are now stranded.

What I heard is that none of the employee keycards work, since they have to ping a now-unreachable server. So people can’t get into buildings and offices.

And every third-party site that relies on “log in with Facebook” is stuck as well.

The fix won’t be quick:

As a former network admin who worked on the internet at this level, I anticipate Facebook will be down for hours more. I suspect it will end up being Facebook’s longest and most severe failure to date before it’s fixed.

We all know the security risks of monocultures.

EDITED TO ADD (10/6): Good explanation of what happened. Shorter from Jonathan Zittrain: “Facebook basically locked its keys in the car.”

Understanding How Facebook Disappeared from the Internet

Post Syndicated from Tom Strickx original https://blog.cloudflare.com/october-2021-facebook-outage/

Understanding How Facebook Disappeared from the Internet

Understanding How Facebook Disappeared from the Internet

“Facebook can’t be down, can it?”, we thought, for a second.

Today at 1651 UTC, we opened an internal incident entitled “Facebook DNS lookup returning SERVFAIL” because we were worried that something was wrong with our DNS resolver 1.1.1.1.  But as we were about to post on our public status page we realized something else more serious was going on.

Social media quickly burst into flames, reporting what our engineers rapidly confirmed too. Facebook and its affiliated services WhatsApp and Instagram were, in fact, all down. Their DNS names stopped resolving, and their infrastructure IPs were unreachable. It was as if someone had “pulled the cables” from their data centers all at once and disconnected them from the Internet.

How’s that even possible?

Meet BGP

BGP stands for Border Gateway Protocol. It’s a mechanism to exchange routing information between autonomous systems (AS) on the Internet. The big routers that make the Internet work have huge, constantly updated lists of the possible routes that can be used to deliver every network packet to their final destinations. Without BGP, the Internet routers wouldn’t know what to do, and the Internet wouldn’t work.

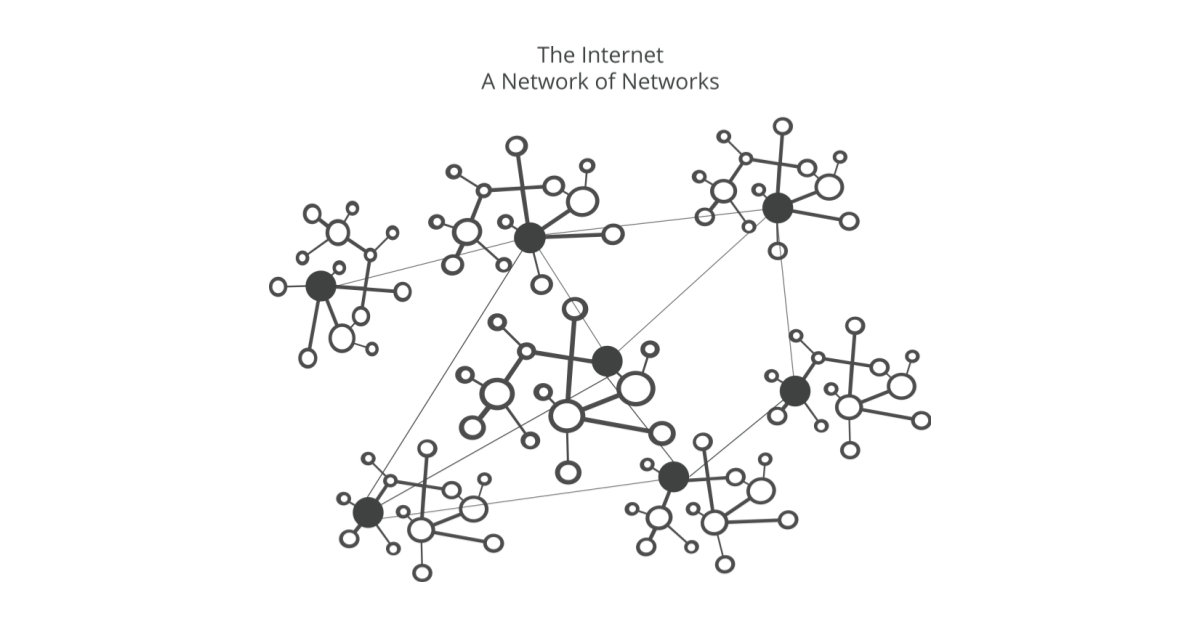
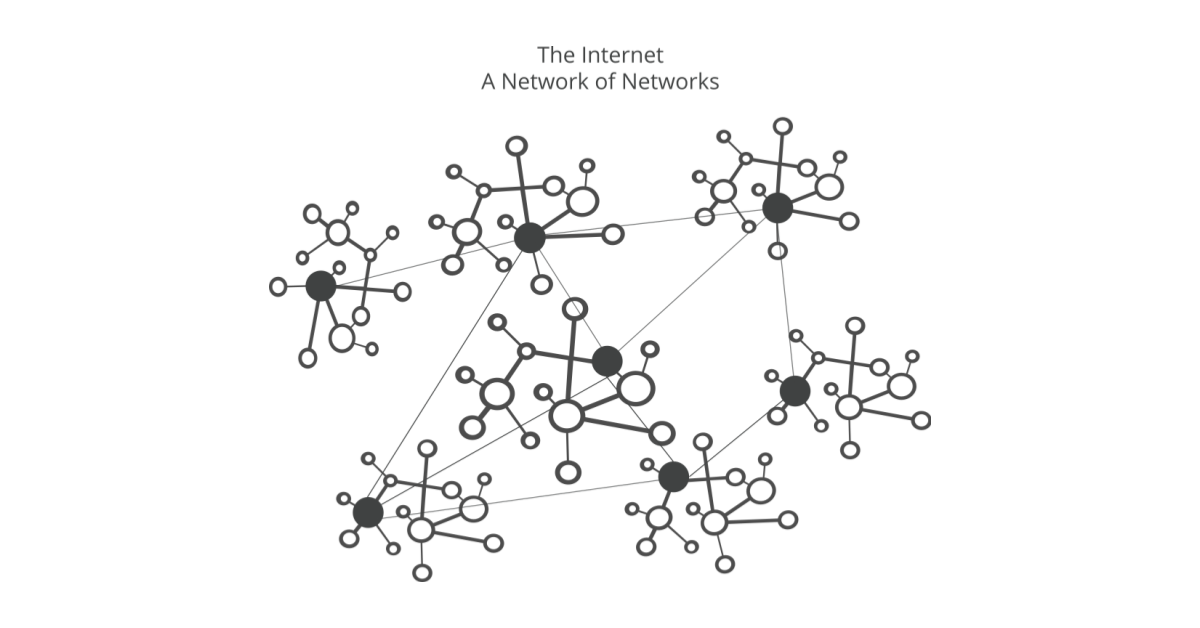
The Internet is literally a network of networks, and it’s bound together by BGP. BGP allows one network (say Facebook) to advertise its presence to other networks that form the Internet. As we write Facebook is not advertising its presence, ISPs and other networks can’t find Facebook’s network and so it is unavailable.

The individual networks each have an ASN: an Autonomous System Number. An Autonomous System (AS) is an individual network with a unified internal routing policy. An AS can originate prefixes (say that they control a group of IP addresses), as well as transit prefixes (say they know how to reach specific groups of IP addresses).

Cloudflare’s ASN is AS13335. Every ASN needs to announce its prefix routes to the Internet using BGP; otherwise, no one will know how to connect and where to find us.

Our learning center has a good overview of what BGP and ASNs are and how they work.

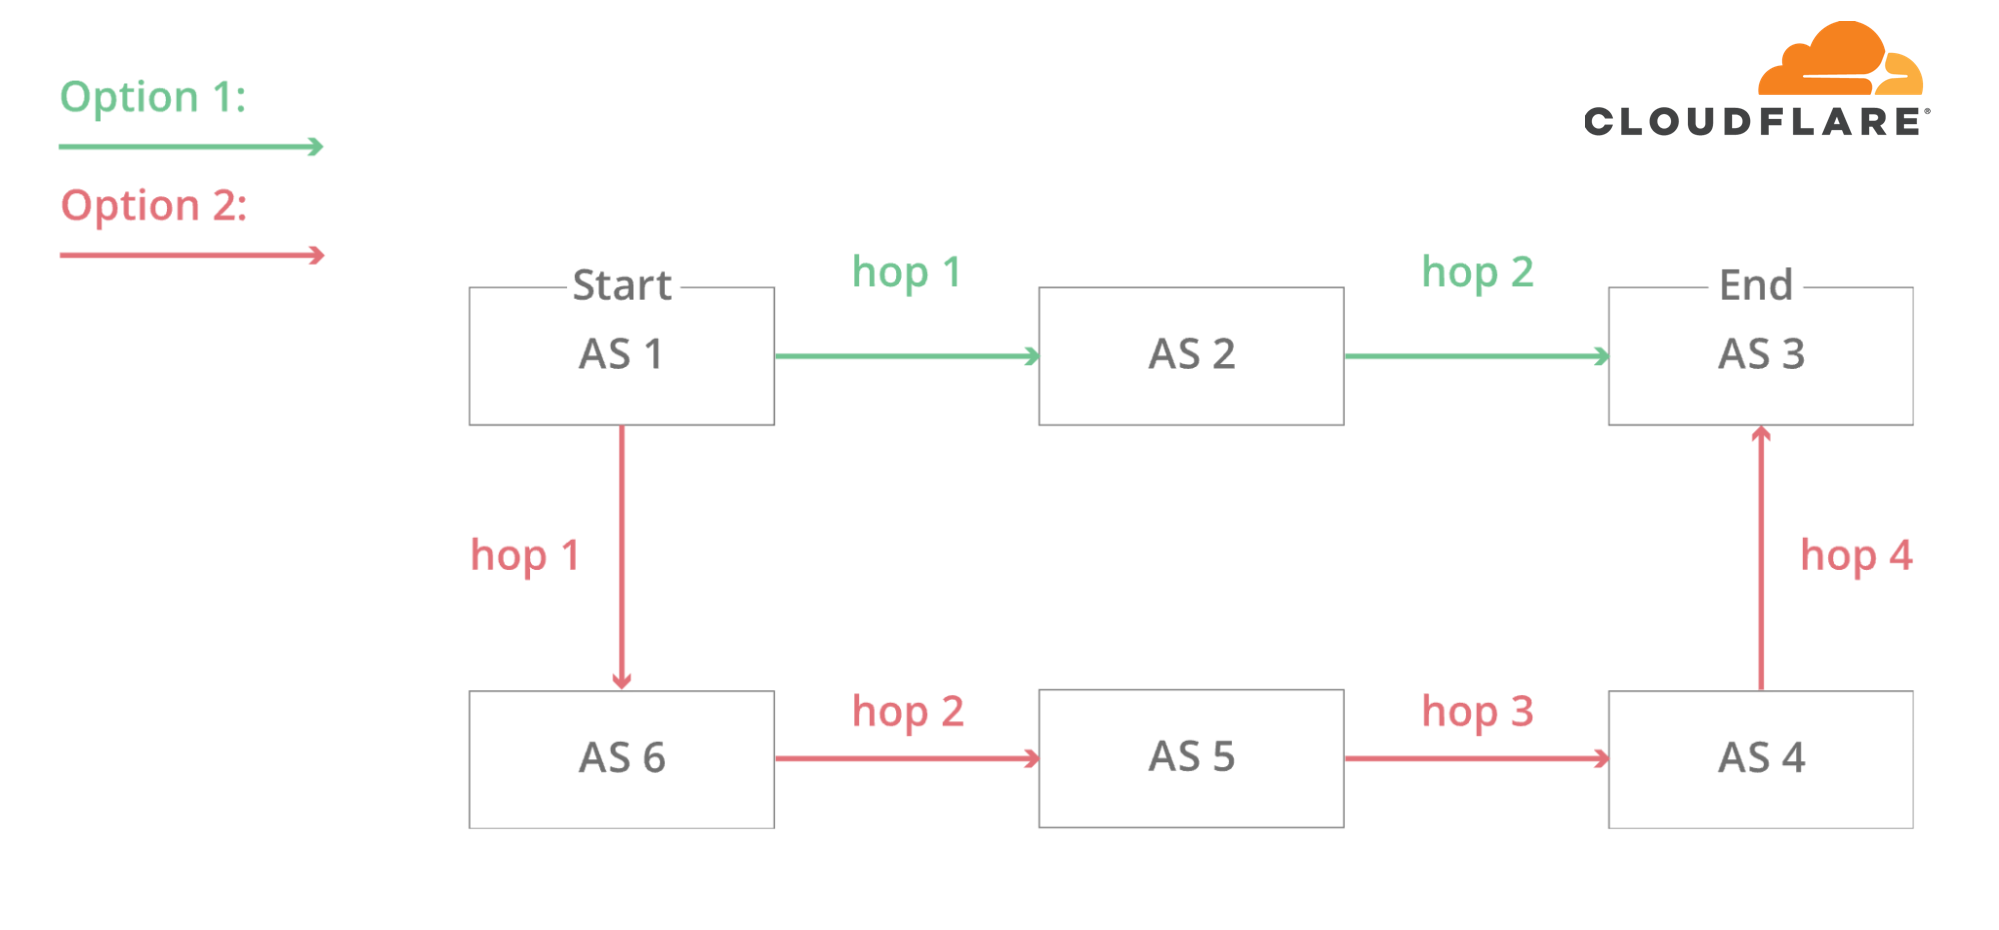
In this simplified diagram, you can see six autonomous systems on the Internet and two possible routes that one packet can use to go from Start to End. AS1 → AS2 → AS3 being the fastest, and AS1 → AS6 → AS5 → AS4 → AS3 being the slowest, but that can be used if the first fails.

Understanding How Facebook Disappeared from the Internet

At 1658 UTC we noticed that Facebook had stopped announcing the routes to their DNS prefixes. That meant that, at least, Facebook’s DNS servers were unavailable. Because of this Cloudflare’s 1.1.1.1 DNS resolver could no longer respond to queries asking for the IP address of facebook.com or instagram.com.

route-views>show ip bgp 185.89.218.0/23
% Network not in table
route-views>

route-views>show ip bgp 129.134.30.0/23
% Network not in table
route-views>

Meanwhile, other Facebook IP addresses remained routed but weren’t particularly useful since without DNS Facebook and related services were effectively unavailable:

route-views>show ip bgp 129.134.30.0   
BGP routing table entry for 129.134.0.0/17, version 1025798334
Paths: (24 available, best #14, table default)
  Not advertised to any peer
  Refresh Epoch 2
  3303 6453 32934
    217.192.89.50 from 217.192.89.50 (138.187.128.158)
      Origin IGP, localpref 100, valid, external
      Community: 3303:1004 3303:1006 3303:3075 6453:3000 6453:3400 6453:3402
      path 7FE1408ED9C8 RPKI State not found
      rx pathid: 0, tx pathid: 0
  Refresh Epoch 1
route-views>

We keep track of all the BGP updates and announcements we see in our global network. At our scale, the data we collect gives us a view of how the Internet is connected and where the traffic is meant to flow from and to everywhere on the planet.

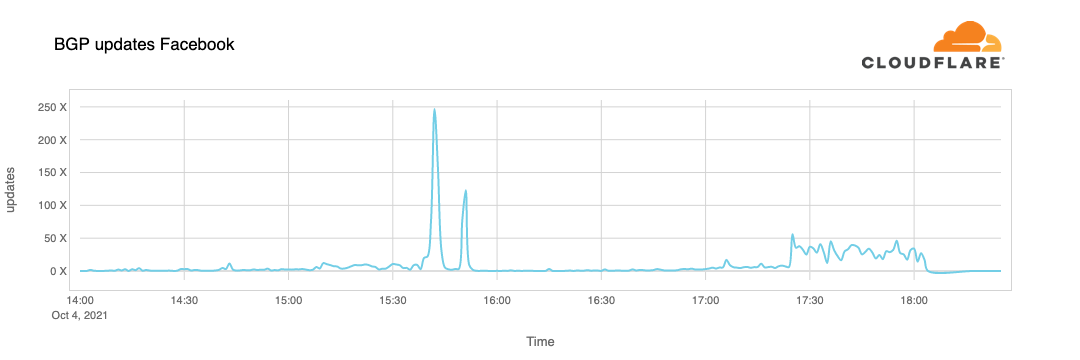
A BGP UPDATE message informs a router of any changes you’ve made to a prefix advertisement or entirely withdraws the prefix. We can clearly see this in the number of updates we received from Facebook when checking our time-series BGP database. Normally this chart is fairly quiet: Facebook doesn’t make a lot of changes to its network minute to minute.

But at around 15:40 UTC we saw a peak of routing changes from Facebook. That’s when the trouble began.

Understanding How Facebook Disappeared from the Internet

If we split this view by routes announcements and withdrawals, we get an even better idea of what happened. Routes were withdrawn, Facebook’s DNS servers went offline, and one minute after the problem occurred, Cloudflare engineers were in a room wondering why 1.1.1.1 couldn’t resolve facebook.com and worrying that it was somehow a fault with our systems.

Understanding How Facebook Disappeared from the Internet

With those withdrawals, Facebook and its sites had effectively disconnected themselves from the Internet.

DNS gets affected

As a direct consequence of this, DNS resolvers all over the world stopped resolving their domain names.

➜  ~ dig @1.1.1.1 facebook.com
;; ->>HEADER<<- opcode: QUERY, status: SERVFAIL, id: 31322
;facebook.com.			IN	A
➜  ~ dig @1.1.1.1 whatsapp.com
;; ->>HEADER<<- opcode: QUERY, status: SERVFAIL, id: 31322
;whatsapp.com.			IN	A
➜  ~ dig @8.8.8.8 facebook.com
;; ->>HEADER<<- opcode: QUERY, status: SERVFAIL, id: 31322
;facebook.com.			IN	A
➜  ~ dig @8.8.8.8 whatsapp.com
;; ->>HEADER<<- opcode: QUERY, status: SERVFAIL, id: 31322
;whatsapp.com.			IN	A

This happens because DNS, like many other systems on the Internet, also has its routing mechanism. When someone types the https://facebook.com URL in the browser, the DNS resolver, responsible for translating domain names into actual IP addresses to connect to, first checks if it has something in its cache and uses it. If not, it tries to grab the answer from the domain nameservers, typically hosted by the entity that owns it.

If the nameservers are unreachable or fail to respond because of some other reason, then a SERVFAIL is returned, and the browser issues an error to the user.

Again, our learning center provides a good explanation on how DNS works.

Understanding How Facebook Disappeared from the Internet

Due to Facebook stopping announcing their DNS prefix routes through BGP, our and everyone else’s DNS resolvers had no way to connect to their nameservers. Consequently, 1.1.1.1, 8.8.8.8, and other major public DNS resolvers started issuing (and caching) SERVFAIL responses.

But that’s not all. Now human behavior and application logic kicks in and causes another exponential effect. A tsunami of additional DNS traffic follows.

This happened in part because apps won’t accept an error for an answer and start retrying, sometimes aggressively, and in part because end-users also won’t take an error for an answer and start reloading the pages, or killing and relaunching their apps, sometimes also aggressively.

This is the traffic increase (in number of requests) that we saw on 1.1.1.1:

Understanding How Facebook Disappeared from the Internet

So now, because Facebook and their sites are so big, we have DNS resolvers worldwide handling 30x more queries than usual and potentially causing latency and timeout issues to other platforms.

Fortunately, 1.1.1.1 was built to be Free, Private, Fast (as the independent DNS monitor DNSPerf can attest), and scalable, and we were able to keep servicing our users with minimal impact.

The vast majority of our DNS requests kept resolving in under 10ms. At the same time, a minimal fraction of p95 and p99 percentiles saw increased response times, probably due to expired TTLs having to resort to the Facebook nameservers and timeout. The 10 seconds DNS timeout limit is well known amongst engineers.

Understanding How Facebook Disappeared from the Internet

Impacting other services

People look for alternatives and want to know more or discuss what’s going on. When Facebook became unreachable, we started seeing increased DNS queries to Twitter, Signal and other messaging and social media platforms.

Understanding How Facebook Disappeared from the Internet

We can also see another side effect of this unreachability in our WARP traffic to and from Facebook’s affected ASN 32934. This chart shows how traffic changed from 15:45 UTC to 16:45 UTC compared with three hours before in each country. All over the world WARP traffic to and from Facebook’s network simply disappeared.

Understanding How Facebook Disappeared from the Internet

The Internet

Today’s events are a gentle reminder that the Internet is a very complex and interdependent system of millions of systems and protocols working together. That trust, standardization, and cooperation between entities are at the center of making it work for almost five billion active users worldwide.

Update

At around 21:00 UTC we saw renewed BGP activity from Facebook’s network which peaked at 21:17 UTC.

Understanding How Facebook Disappeared from the Internet

This chart shows the availability of the DNS name ‘facebook.com’ on Cloudflare’s DNS resolver 1.1.1.1. It stopped being available at around 15:50 UTC and returned at 21:20 UTC.

Understanding How Facebook Disappeared from the Internet

Undoubtedly Facebook, WhatsApp and Instagram services will take further time to come online but as of 22:28 UTC Facebook appears to be reconnected to the global Internet and DNS working again.

[$] New features coming in Julia 1.7

Post Syndicated from original https://lwn.net/Articles/871486/rss

Julia is an open-source programming
language and ecosystem for high-performance scientific computing; its
development team has made the first release candidate for version 1.7
available for testing on Linux, BSD, macOS, and Windows. Back in May, we looked at the increased performance that
arrived with Julia 1.6, its last major release. In this article we describe some of
the changes and new features in the language and its libraries that are
coming in 1.7.

Building Modern Applications with Amazon EKS on Amazon Outposts

Post Syndicated from Emma White original https://aws.amazon.com/blogs/compute/building-modern-applications-with-amazon-eks-on-amazon-outposts/

This post is written by Brad Kirby, Principal Outposts Specialist, and Chris Lunsford, Senior Outposts SA. 

Customers are modernizing applications by deconstructing monolithic architectures and migrating application components into container–based, service-oriented, and microservices architectures. Modern applications improve scalability, reliability, and development efficiency by allowing services to be owned by smaller, more focused teams.

This post shows how you can combine Amazon Elastic Kubernetes Service (Amazon EKS) with AWS Outposts to deploy managed Kubernetes application environments on-premises alongside your existing data and applications.

For a brief introduction to the subject matter, the watch this video, which demonstrates:

  • The benefits of application modernization
  • How containers are an ideal enabling technology for microservices architectures
  • How AWS Outposts combined with Amazon container services enables you to unwind complex service interdependencies and modernize on-premises applications with low latency, local data processing, and data residency requirements

Understanding the Amazon EKS on AWS Outposts architecture

Amazon EKS

Many organizations chose Kubernetes as their container orchestration platform because of its openness, flexibility, and a growing pool of Kubernetes literate IT professionals. Amazon EKS enables you to run Kubernetes clusters on AWS without needing to install and manage the Kubernetes control plane. The control plane, including the API servers, scheduler, and cluster store services, runs within a managed environment in the AWS Region. Kubernetes clients (like kubectl) and cluster worker nodes communicate with the managed control plane via public and private EKS service endpoints.

AWS Outposts

The AWS Outposts service delivers AWS infrastructure and services to on-premises locations from the AWS Global Cloud Infrastructure. An Outpost functions as an extension of the Availability Zone (AZ) where it is anchored. AWS operates, monitors, and manages AWS Outposts infrastructure as part of its parent Region. Each Outpost connects back to its anchor AZ via a Service Link connection (a set of encrypted VPN tunnels). AWS Outposts extend Virtual Private Cloud (VPC) environments from the Region to on-premises locations and enables you to deploy VPC subnets to Outposts in your data center and co-location spaces. The Outposts Local Gateway (LGW) routes traffic between Outpost VPC subnets and the on-premises network.

Amazon EKS on AWS Outposts

You deploy Amazon EKS worker nodes to Outposts using self-managed node groups. The worker nodes run on Outposts and register with the Kubernetes control plane in the AWS Region. The worker nodes, and containers running on the nodes, can communicate with AWS services and resources running on the Outpost and in the region (via the Service Link) and with on-premises networks (via the Local Gateway).


You use the same AWS and Kubernetes tools and APIs to work with EKS on Outposts nodes that you use to work with EKS nodes in the Region. You can use eksctl, the AWS Management Console, AWS CLI, or infrastructure as code (IaC) tools like AWS CloudFormation or HashiCorp Terraform to create self-managed node groups on AWS Outposts.

Amazon EKS self-managed node groups on AWS Outposts

Like many customers, you might use managed node groups when you deploy EKS worker nodes in your Region, and you may be wondering, “what are self-managed node groups?”

Self-managed node groups, like managed node groups, use standard Amazon Elastic Compute Cloud (Amazon EC2) instances in EC2 Auto Scaling groups to deploy, scale-up, and scale-down EKS worker nodes using Amazon EKS optimized Amazon Machine Images (AMIs). Amazon configures the EKS optimized AMIs to work with the EKS service. The images include Docker, kubelet, and the AWS IAM Authenticator. The AMIs also contain a specialized bootstrap script /etc/eks/bootstrap.sh that allows worker nodes to discover and connect to your cluster control plane and add Kubernetes labels that identify the nodes in the cluster.

What makes the node groups self-managed? Managed node groups have additional features that simplify updating nodes in the node group. With self-managed nodes, you must implement a process to update or replace your node group when you want to update the nodes to use a new Amazon EKS optimized AMI.

You create self-managed node groups on AWS Outposts using the same process and resources that you use to deploy EC2 instances using EC2 Auto Scaling groups. All instances in a self-managed node group must:

  • Be the same Instance type
  • Be running the same Amazon Machine Image (AMI)
  • Use the same Amazon EKS node IAM role
  • Be tagged with the io/cluster/<cluster-name>=owned tag

Additionally, to deploy on AWS Outposts, instances must:

  • Use encrypted EBS volumes
  • Launch in Outposts subnets

Kubernetes authenticates all API requests to a cluster. You must configure an EKS cluster to allow nodes from a self-managed node group to join the cluster. Self-managed nodes use the node IAM role to authenticate with an EKS cluster. Amazon EKS clusters use the AWS IAM Authenticator for Kubernetes to authenticate requests and Kubernetes native Role Based Access Control (RBAC) to authorize requests. To enable self-managed nodes to register with a cluster, configure the AWS IAM Authenticator to recognize the node IAM role and assign the role to the system:bootstrappers and system:nodes RBAC groups.

In the following tutorial, we take you through the steps required to deploy EKS worker nodes on an Outpost and register those nodes with an Amazon EKS cluster running in the Region. We created a sample Terraform module aws-eks-self-managed-node-group to help you get started quickly. If you are interested, you can dive into the module sample code to see the detailed configurations for self-managed node groups.

Deploying Amazon EKS on AWS Outposts (Terraform)

To deploy Amazon EKS nodes on an AWS Outposts deployment, you must complete two high-level steps:

Step 1: Create a self-managed node group

Step 2: Configure Kubernetes to allow the nodes to register

We use Terraform in this tutorial to provide visibility (through the sample code) into the details of the configurations required to deploy self-managed node groups on AWS Outposts.

Prerequisites

To follow along with this tutorial, you should have the following prerequisites:

  • An AWS account.
  • An operational AWS Outposts deployment (Outpost) associated with your AWS account.
  • AWS Command Line Interface (CLI) version 1.25 or later installed and configured on your workstation.
  • HashiCorp Terraform version 14.6 or later installed on your workstation.
  • Familiarity with Terraform HashiCorp Configuration Language (HCL) syntax and experience using Terraform to deploy AWS resources.
  • An existing VPC that meets the requirements for an Amazon EKS cluster. For more information, see Cluster VPC considerations. You can use the Getting started with Amazon EKS guide to walk you through creating a VPC that meets the requirements.
  • An existing Amazon EKS cluster. You can use the Creating an Amazon EKS cluster guide to walk you through creating the cluster.
  • Tip: We recommend creating and using a new VPC and Amazon EKS cluster to complete this tutorial. Procedures like modifying the aws-auth ConfigMap on the cluster may impact other nodes, users, and workloads on the cluster. Using a new VPC and Amazon EKS cluster will help minimize the risk of impacting other applications as you complete the tutorial.
  • Note: Do not reference subnets deployed on AWS Outposts when creating Amazon EKS clusters in the Region. The Amazon EKS cluster control plane runs in the Region and attaches to VPC subnets in the Region availability zones.
  • A symmetric KMS key to encrypt the EBS volumes of the EKS worker nodes. You can use the alias/aws/ebs AWS managed key for this prerequisite.

Using the sample code

The source code for the amazon-eks-self-managed-node-group Terraform module is available in AWS-Samples on GitHub.

Setup

To follow along with this tutorial, complete the following steps to setup your workstation:

  1. Open your terminal.
  2. Make a new directory to hold your EKS on Outposts Terraform configurations.
  3. Change to the new directory.
  4. Create a new file named providers.tf with the following contents:
    terraform {
      required_providers {
        aws = {
          source  = "hashicorp/aws"
          version = "~> 3.27"
        }
    
        kubernetes = {
          source  = "hashicorp/kubernetes"
          version = "~> 1.13.3"
        }
      }
    }

  5. Keep your terminal open and do all the work in this tutorial from this directory.

Step 1: Create a self-managed node group

To create a self-managed node group on your Outpost

  1. Create a new Terraform configuration file named self-managed-node-group.tf.
  2. Configure the aws Terraform provider with your AWS CLI profile and Outpost parent Region:
    provider "aws" {
      region  = "us-west-2"
      profile = "default"
    }
    

  3. Configure the aws-eks-self-managed-node-group module with the following (minimum) arguments:
    • eks_cluster_name the name of your EKS cluster
    • instance_type an instance type supported on your AWS Outposts deployment
    • desired_capacity, min_size, and max_size as desired to control the number of nodes in your node group (ensure that your Outpost has sufficient resources available to run the desired number nodes of the specified instance type)
    • subnets the subnet IDs of the Outpost subnets where you want the nodes deployed
    • (Optional) Kubernetes node_labels to apply to the nodes
    • Allow ebs_encrypted and configure the ebs_kms_key_arn with KMS key you want to use to encrypt the nodes’ EBS volumes (required for Outposts deployments)

Example:

module "eks_self_managed_node_group" {
  source = "github.com/aws-samples/amazon-eks-self-managed-node-group"

  eks_cluster_name = "cmluns-eks-cluster"
  instance_type    = "m5.2xlarge"
  desired_capacity = 1
  min_size         = 1
  max_size         = 1
  subnets          = ["subnet-0afb721a5cc5bd01f"]

  node_labels = {
    "node.kubernetes.io/outpost"    = "op-0d4579457ff2dc345"
    "node.kubernetes.io/node-group" = "node-group-a"
  }

  ebs_encrypted   = true
  ebs_kms_key_arn = "arn:aws:kms:us-west-2:799838960553:key/0e8f15cc-d3fc-4da4-ae03-5fadf45cc0fb"
}

You may configure other optional arguments as appropriate for your use case – see the module README for details.

Step 2: Configure Kubernetes to allow the nodes to register

Use the following procedures to configure Terraform to manage the AWS IAM Authenticator (aws-auth) ConfigMap on the cluster. This adds the node-group IAM role to the IAM authenticator and Kubernetes RBAC groups.

Configure the Terraform Kubernetes Provider to allow Terraform to interact with the Kubernetes control plane.

Note: If you add a node group to a cluster with existing node groups, mapped IAM roles, or mapped IAM users, the aws-auth ConfigMap may already be configured on your cluster. If the ConfigMap exists, you must download, edit, and replace the ConfigMap on the cluster using kubectl. We do not provide a procedure for this operation as it may affect workloads running on your cluster. Please see the section Managing users or IAM roles for your cluster in the Amazon EKS User Guide for more information.

To check if your cluster has the aws-auth ConfigMap configured

  1. Run the aws eks --region <region> update-kubeconfig --name <cluster-name> command to update your workstation’s ~/.kube/config with the information needed to connect to your cluster, substituting your <region> and <cluster-name>.
❯ aws eks --region us-west-2 update-kubeconfig --name cmluns-eks-cluster
Updated context arn:aws:eks:us-west-2:799838960553:cluster/cmluns-eks-cluster in ~/.kube/config
  1. Run the kubectl describe configmap -n kube-system aws-auth
  • If you receive an error stating, Error from server (NotFound): configmaps "aws-auth" not found, then proceed with the following procedures to use Terraform to apply the ConfigMap.
❯ kubectl describe configmap -n kube-system aws-auth
Error from server (NotFound): configmaps "aws-auth" not found
  • If you do not receive the preceding error, and kubectl returns an aws-auth ConfigMap, then you should not use Terraform to manage the ConfigMap.

To configure the Terraform Kubernetes provider

  1. Create a new Terraform configuration file named aws-auth-config-map.tf.
  2. Add the aws_eks_cluster Terraform data source, and configure it to look up your cluster by name.
data "aws_eks_cluster" "selected" {
  name = "cmluns-eks-cluster"
}
  1. Add the aws_eks_cluster_auth Terraform data source, and configure it to look up your cluster by name.
data "aws_eks_cluster_auth" "selected" {
  name = "cmluns-eks-cluster"
}
  1. Configure the kubernetes provider with your cluster host (endpoint address), cluster_ca_certificate, and the token from the aws_eks_cluster and aws_eks_cluster_auth data sources.
provider "kubernetes" {
  load_config_file       = false
  host                   = data.aws_eks_cluster.selected.endpoint
  cluster_ca_certificate = base64decode(data.aws_eks_cluster.selected.certificate_authority[0].data)
  token                  = data.aws_eks_cluster_auth.selected.token
}

To configure the AWS IAM Authenticator on the cluster

  1. Open the aws-auth-config-map.tf Terraform configuration file you created in the last step.
  2. Add a kubernetes_config_map Terraform resource to add the aws-auth ConfigMap to the kube-system
  3. Configure the data argument with a YAML format heredoc string that adds the Amazon Resource Name (ARN) for your IAM role to the mapRoles
resource "kubernetes_config_map" "aws_auth" {
  metadata {
    name      = "aws-auth"
    namespace = "kube-system"
  }

  data = {
    mapRoles = <<-EOT
      - rolearn: ${module.eks_self_managed_node_group.role_arn}
        username: system:node:{{EC2PrivateDNSName}}
        groups:
          - system:bootstrappers
          - system:nodes
    EOT
  }
}

Apply the configuration and verify node registration

You have created the Terraform configurations to deploy an EKS self-managed node group to your Outpost and configure Kubernetes to authenticate the nodes. Now you apply the configurations and verify that the nodes register with your Kubernetes cluster.

To apply the Terraform configurations

  1. Run the terraform init command to download the providers, self-managed node group module, and prepare the directory for use.
  2. Run the terraform apply
  3. Review the resources that will be created.
  4. Enter yes to confirm that you want to create the resources.
    ❯ terraform apply
    
    Terraform used the selected providers to generate the following execution plan. Resource actions are indicated with the following symbols:
      + create
    
    Terraform will perform the following actions:
    
    <-- Output omitted for brevity -->
    
    Plan: 9 to add, 0 to change, 0 to destroy.
    
    Do you want to perform these actions?
      Terraform will perform the actions described above.
      Only 'yes' will be accepted to approve.
    
      Enter a value: yes
    

  5. Press Enter.
    <-- Output omitted for brevity -->
    
    Apply complete! Resources: 9 added, 0 changed, 0 destroyed.
    

  6. Run the aws eks --region <region> update-kubeconfig --name <cluster-name> command to update your workstation’s ~/.kube/config with the information required to connect to your cluster – substituting your <region> and <cluster-name>.
    ❯ aws eks --region us-west-2 update-kubeconfig --name cmluns-eks-cluster
    Updated context arn:aws:eks:us-west-2:799838960553:cluster/cmluns-eks-cluster in ~/.kube/config
    

  7. Run the kubectl get nodes command to view the status of your cluster nodes.
  8. Verify your new nodes show up in the list with a STATUS of Ready.
    ❯ kubectl get nodes
    NAME                                          STATUS   ROLES    AGE   VERSION
    ip-10-253-46-119.us-west-2.compute.internal   Ready    <none>   37s   v1.18.9-eks-d1db3c
    

  9. (Optional) If your nodes are registering, and their STATUS does not show Ready, run the kubectl get nodes --watch command to watch them come online.
  10. (Optional) Run the kubectl get nodes --show-labels command to view the node list with the labels assigned to each node. The nodes created by your AWS Outposts node group will have the labels you assigned in Step 1.

To verify the Kubernetes system pods deploy on the worker nodes

  1. Run the kubectl get pods --namespace kube-system
  2. Verify that each pod shows READY 1/1 with a STATUS of Running.
❯ kubectl get pods --namespace kube-system
NAME                       READY   STATUS    RESTARTS   AGE
aws-node-84xlc             1/1     Running   0          2m16s
coredns-559b5db75d-jxqbp   1/1     Running   0          5m36s
coredns-559b5db75d-vdccc   1/1     Running   0          5m36s
kube-proxy-fspw4           1/1     Running   0          2m16s

The nodes in your AWS Outposts node group should be registered with the EKS control plane in the Region and the Kubernetes system pods should successfully deploy on the new nodes.

Clean up

One of the nice things about using infrastructure as code tools like Terraform is that they automate stack creation and deletion. Use the following procedure to remove the resources you created in this tutorial.

To clean up the resources created in this tutorial

  1. Run the terraform destroy
  2. Review the resources that will be destroyed.
  3. Enter yes to confirm that you want to destroy the resources.
❯ terraform destroy

An execution plan has been generated and is shown below.
Resource actions are indicated with the following symbols:
  - destroy

Terraform will perform the following actions:

Plan: 0 to add, 0 to change, 9 to destroy.

Do you really want to destroy all resources?
  Terraform will destroy all your managed infrastructure, as shown above.
  There is no undo. Only 'yes' will be accepted to confirm.

  Enter a value: yes
  1. Press Enter.

Destroy complete! Resources: 9 destroyed.

  1. Clean up any resources you created for the prerequisites.

Conclusion

In this post, we discussed how containers sit at the heart of the application modernization process, making it easy to adopt microservices architectures that improve application scalability, availability, and performance. We also outlined the challenges associated with modernizing on-premises applications with low latency, local data processing, and data residency requirements. In these cases, AWS Outposts brings cloud services, like Amazon EKS, close to the workloads being refactored. We also walked you through deploying Amazon EKS worker nodes on-premises on AWS Outposts.

Now that you have deployed Amazon EKS worker nodes on in a test VPC using Terraform, you should adapt the Terraform module(s) and resources to prepare and deploy your production Kubernetes clusters on-premises on Outposts. If you don’t have an Outpost and you want to get started modernizing your on-premises applications with Amazon EKS and AWS Outposts, contact your local AWS account Solutions Architect (SA) to help you get started.

The collective thoughts of the interwebz