Preparing for agentic AI: A financial services approach

Post Syndicated from Raphael Fuchs original https://aws.amazon.com/blogs/security/preparing-for-agentic-ai-a-financial-services-approach/

Deploying agentic AI in financial services requires additional security controls that address AI-specific risks. This post walks you through comprehensive observability and fine-grained access controls—two critical capabilities for maintaining explainability and accountability in AI systems. You will learn seven design principles and get implementation guidance for meeting regulatory requirements while deploying secure AI solutions.

Financial institutions navigating this landscape face a dual challenge. They must comply with an evolving regulatory environment—including frameworks such as SR 11-7 in the US, SS1/23 in the UK, and ECB guidelines in the EU—while simultaneously addressing the unique security considerations that agentic AI introduces. Unlike traditional software systems, agentic AI can make autonomous decisions and take actions that potentially impact customers, operations, and institutional reputation. This autonomy demands a security approach that goes beyond conventional controls.

Organizations aligning to established frameworks such as ISO 27001 and the NIST Cybersecurity Framework have a strong foundation, but you need to add AI-specific security measures to address the unique risks of agentic AI. Using agentic AI requires augmentation of these traditional controls with AI-specific security measures. The non-deterministic nature of AI systems, their ability to act with significant autonomy, and the complexity of multi-agent interactions introduce new dimensions of risk that must be carefully managed.

In financial services, you need clear explainability and accountability for effective model risk management. When AI agents make decisions or take actions on behalf of your organization, you need clear visibility into what was done, why it was done, and who—or what—was responsible. This transparency helps you maintain trust, meet regulatory obligations, and deploy AI responsibly according to AWS Responsible AI practices.

This post outlines security principles for implementing agentic AI in financial services. We focus on two critical enablers: comprehensive observability of agentic workflows and fine-grained control over agent tool access permissions. Together, these capabilities provide the foundation for explainability and create a control environment that facilitates accountability.

Our approach is structured in two parts. First, we explore seven core design principles that serve a dual purpose: guiding solution architects during the design of AI systems and providing risk management teams with a framework for identifying critical risk factors. Second, we provide detailed implementation guidance with practical insights to help you deploy secure and compliant AI solutions in the financial sector. Consult with your compliance and legal teams to determine specific requirements for your situation. Regulatory requirements establish minimum baselines, but organizational risk considerations—including reputational risk and potential customer harm—often require additional controls.

Core design principles for agentic AI observability and tool access control

In this section, we outline key design principles for agentic AI systems in financial services. These principles help address fundamental observability and access control requirements for secure AI implementations. While specific compliance requirements vary by jurisdiction and use case, these design principles provide a foundation for secure and governable AI systems.

  • Human-AI security homology
    Understand the human controls and determine applicability to agents and agentic workflows and document the agent personas. Implement agent identities in addition to traditional role and attribute-based permissions, logging and behavioral monitoring. Ensure critical actions have supervision (agentic or human), define agent scope in workflows and consider change and incident management, segregation of agent duties for actions and tool usage, maker-checker verification, logging, and behavior monitoring.
  • Modular agent workflow architecture
    Use specialized sub-agents in workflows. Attach fine-grained permissions to narrow the focus of sub-agents to reduce the scope of permissions each agent requires, increase modularity and reusability, simplify maintenance, and enhance observability and therefore explainability.
  • Workflow and agent logging and tracing
    Implement comprehensive logging and tracing to track decisions, actions, activity workflows, specific caller context, and reasoning steps to enable better explainability. AI systems explainability—and monitoring of inter-agent interactions, context sharing, and emergent behaviors—enables a holistic observability of the multi-agent workflow operations and dynamics.
  • Segregated AI least-privilege
    Enforce least privilege and segregation of duties in automated workflows through clearly defined operational boundaries for AI agents. The boundaries should be supported by authorization controls, bound to the caller permissions with support for contextual verification, and supported by circuit breakers such as human oversight. This approach helps ensure that agents operate within appropriate limits and boundaries while enabling necessary human intervention, balancing automation with security and control.
  • Governance integration
    Integrate agent observability into existing governance frameworks through alignment with established risk management and compliance processes, while implementing standardized evaluation frameworks and test harnesses that measure agent performance, compliance, and business value alignment.
  • Agentic operational controls
    Provide business-friendly guardrails for defining and managing agent behavior policies while maintaining comprehensive cost controls through monitoring and optimization of resource utilization at both individual and workflow levels. Through this approach, business users can manage agent constraints.
  • Risk management and compliance
    Integrate comprehensive activity tracing (see Workflow and agent logging and tracing) with existing governance frameworks to support audit requirements, regulatory compliance, and align with established risk management processes. This approach helps ensure thorough oversight and compliance across all agent activities within the organization’s existing governance structure.

Implementation guidance

In the following sections, we provide specific implementation guidance and recommendations that directly help you apply the seven core design principles discussed above. With these guidelines in place, your solution architects can design and deploy secure AI agent systems on AWS. Our aim is not to provide exhaustive technical solutions, but rather to guide implementations. We recommend that enterprise customers work closely with their assigned AWS Solutions Architect to discuss and develop detailed implementation practices tailored to their specific architecture.

Monitor and understand AI agent behavior

The following guidance aligns with the Human-AI security homology and Workflow and agent logging and tracing principles in the previous section.

Implement end-to-end agent workflow visibility
Document agent workflows and personas, implement comprehensive tracing of agent workflows that captures inputs, reasoning steps, outputs, and tool usage. Amazon Bedrock AgentCore Observability provides purpose-built solutions for tracing, debugging, identifying, and monitoring agent performance in production environments. This visibility provides data for understanding how agents interact with critical financial systems and data. Implement a tagging strategy for agents to enhance visibility, use descriptive role names for intended use cases for agents, and anticipate use of these tags to be used in downstream agentic permissions and upstream workflows.

Establish agent activity dashboards
Deploy operational dashboards, with Amazon CloudWatch for example, that provide a view into agents’ operational health. These dashboards should track key metrics including successful completions, failures, latency, and resource utilization.

Integrate agent telemetry with existing monitoring systems
Use common standards such as OpenTelemetry (OTel) using AWS Distro for OpenTelemetry to integrate agent telemetry with your existing monitoring infrastructure. Common standards mean that financial institutions can maintain their investments in monitoring tools while extending visibility to agent activities.

Establish agent server-side (tool-side) checks
Implement a standardized access control for agents using tools to apply consistent controls following AWS security best practices for tool integration. Ensure validation and sanitization checks are in place on inputs at the point of tool usage to detect unintended behavior for both user-to-agent and agent-to-agent interactions.

Manage change in agentic AI environments

The following guidance aligns with the Governance integration and Agentic operational controls principles.

Adapt change management for AI agent workflows
Modify your current change management processes to accommodate the dynamic nature of AI agents while maintaining appropriate controls. Review approval processes integrated into agent deployment pipelines, adapt those approval processes to an iterative nature of small increment improvements, implement human in the loop breaks into agentic operations.

Monitor for agent behavior drift
Implement continuous monitoring of agent traces into a test harness with tools such as Amazon CloudWatch and AWS X-Ray to watch for changes in agent behavior patterns that might indicate execution drift or unexpected learning. This is particularly important for maintaining compliance with regulatory requirements that might dictate specific operational boundaries.

Implement the principle of least privilege for AI agents

The following guidance aligns with the Human-AI security homology and Segregated AI least-privilege principles.

Define granular permission boundaries for agent actions
Implement fine-grained permission controls to limit permissions to those necessary for agent functions using, for example, Amazon Bedrock AgentCore Policy. Consider separation of duties for agents by segregating functions and tool access permissions to reduce the scope of impact of unintended actions. Ensure user prompt-driven agent actions and agent-to-agent actions are separately identifiable.

Implement authorization monitoring
Deploy observability tools, such as Amazon Bedrock AgentCore Observability, that continuously monitor agent authorization patterns and flag anomalous access attempts.

Establish agent action audit trails
Maintain comprehensive audit trails of agent actions that affect production systems and sensitive data. These audit trails should be immutable and integrated with existing compliance reporting systems. This is to help ensure that agent-to-agent actions and the original source and lineage of the request be preserved.

Implement guardrails and behavioral controls for AI agents

The following guidance aligns with the Agentic operational controls and Risk management and compliance principles. It’s recommended to take a crawl, walk, run approach to control implementation, start with the minimum required set of controls and evolve over time using feedback from monitoring.

Deploy policy configuration Implement user-friendly interfaces for defining agent behavioral policies and compliance rules. Through such interfaces, risk and compliance teams can directly manage agent guardrails without technical intervention.

Enable real-time guardrail enforcement Deploy automated systems that validate agent actions against defined policies in real time. For example, use Amazon Bedrock Guardrails to implement content filtering, personally identifiable information (PII) detection, and response validation before agent outputs reach production systems.

Establish human oversight workflows Implement review workflows as control points for critical agent actions with clear escalation paths. Define triggers for human review and maintain feedback collection mechanisms for continuous improvement.

Detecting and recovering from AI agent failures

The following guidance aligns with the Workflow and agent logging and tracing and Risk management and compliance.

Implement agent health and performance monitoring
Deploy comprehensive health and performance monitoring for AI agents that can detect both hard failures and degraded performance. Amazon Bedrock AgentCore Observability provides specialized capabilities for understanding agent health beyond traditional application metrics.

Establish agent failure recovery procedures
As in traditional deployment pipelines, develop and test automated recovery and manual behavioral modification procedures for different types of agent failures. These procedures should include appropriate circuit breakers and human escalation paths for scenarios requiring judgment.

Monitor for reasoning quality degradation
Implement monitoring for subtle degradation in agent reasoning quality that might not trigger traditional failure alerts.

Ensuring consistent agent performance across environments

The following guidance aligns with the Workflow and agent logging and tracing, Agentic operational controls, and Risk management and compliance principles.

Implement modular agents with performance baselines
Implement modular, reusable agents with established performance baselines for agent operations across development, testing, and production environments. Monitor for deviations that might indicate environment-specific issues.

Deploy canary testing for agent behavior monitoring and resilience testing
Implement small-scale release testing practices for agent changes, with comprehensive observability to detect unexpected behavior changes before full deployment and at runtime. Use positive testing where valid inputs produce expected outputs and negative testing where improper inputs still achieve the desired output. Test agent resilience under various failure conditions. Use change control for canary tests to ensure tracking over time as testing expands and matures.

Managing multi-agent workflow interactions

The following guidance aligns with Modular agent workflow architecture and Workflow and agent logging and tracing principles.

Monitor agent collaboration patterns
Implement monitoring for agent-to-agent communications within predefined workflows and dynamic workflows, context sharing, and collective behaviors. Track interaction patterns to identify potential risks or inefficiencies.

Detect emergent behaviors
Deploy behavioral trace tests to identify unexpected patterns or outcomes arising from multi-agent interactions. Establish baselines for normal collaborative behavior and alert on deviations, include extreme scenarios in testing.

Maintain interaction audit trails
Record non-repudiable and comprehensive logs of agent interactions, including context exchanges, handoffs, and outputs. Ensuring agent-to-agent actions, the original source and lineage of the request must be preserved.

Optimize AI agent resource utilization & costs

The following guidance aligns with the Agentic operational controls principle.

Implement agent resource and cost consumption monitoring
Deploy monitoring for agent resource consumption patterns, including compute, memory, API usage, and costs using (for example) Amazon CloudWatch. This enables optimization of resource allocation and cost management.

Establish agent performance metrics
Define and monitor key performance indicators specific to agent operations, such as reasoning step performance efficiency, tool usage patterns, and completion times.

Implement agent performance anomaly detection
Deploy anomaly detection for agent performance metrics to identify potential issues before they impact business operations.

Conclusion

The adoption of agentic AI in financial services requires carefully balancing innovation with control. The seven core design principles outlined here provide a framework for implementing explainable, governable, and in general responsible AI systems that align with existing security and compliance requirements. By treating AI agents with the same security rigor applied to human employees—through robust access control, role and attribute-based permissions, and comprehensive monitoring—organizations can safely deploy these systems while maintaining compliance with key regulatory frameworks.

The purpose-built solutions available from AWS provide the technical foundation, but success also requires clear policies and human oversight mechanisms. Financial institutions that establish these fundamental security and governance capabilities will be well-positioned to leverage agentic AI while contributing to the security, explainability and compliance with industry standards of their systems.


If you have feedback about this post, submit comments in the Comments section below. If you have questions about this post, start a new thread on the AWS Security, Identity, & Compliance re:Post or contact AWS Support.
 

Raphael Fuchs

Raphael Fuchs

Raphael is a Principal Security and Compliance Specialist for AWS Financial Services in Switzerland and EMEA. He helps financial services customers translate compliance and regulatory requirements into technical and organizational measures in the AWS Cloud. Raphael previously served as Chief Information Security Officer at TWINT AG, the leading Swiss mobile payment solution, bringing deep industry expertise to his current role.

Raphael Fuchs

Simon Lawrie

Simon is a Principal Security Solutions Architect and leads a team of Security and Compliance Specialists across Asia. Working with the largest Financial Services organizations, he helps them efficiently deploy security controls and assurance in the AWS Cloud. Simon previously served as the Head of Cyber Security Defense APAC and EMEA for Bank of America.

Customize your AWS Management Console experience with visual settings including account color, region and service visibility

Post Syndicated from Channy Yun (윤석찬) original https://aws.amazon.com/blogs/aws/customize-your-aws-management-console-experience-with-visual-settings-including-account-color-region-and-service-visibility/

In August 2025, we introduced AWS User Experience Customization (UXC) capability to tailor user interfaces (UIs) to meet your specific needs and complete your tasks efficiently. With this capability, your account administrator can customize some UI component of AWS Management Console, such as assigning a color to an AWS account for easier identification.

Today, we’re announcing additional customization capability in UXC that enables selective display of relevant AWS Regions and services for your team members. By hiding unused Regions and services, you can reduce cognitive load and eliminate unnecessary clicks and scrolling, helping you focus better and work faster. With this launch, we offer the ability to customize account color, Region, and service visibility together.

Categorize account by color
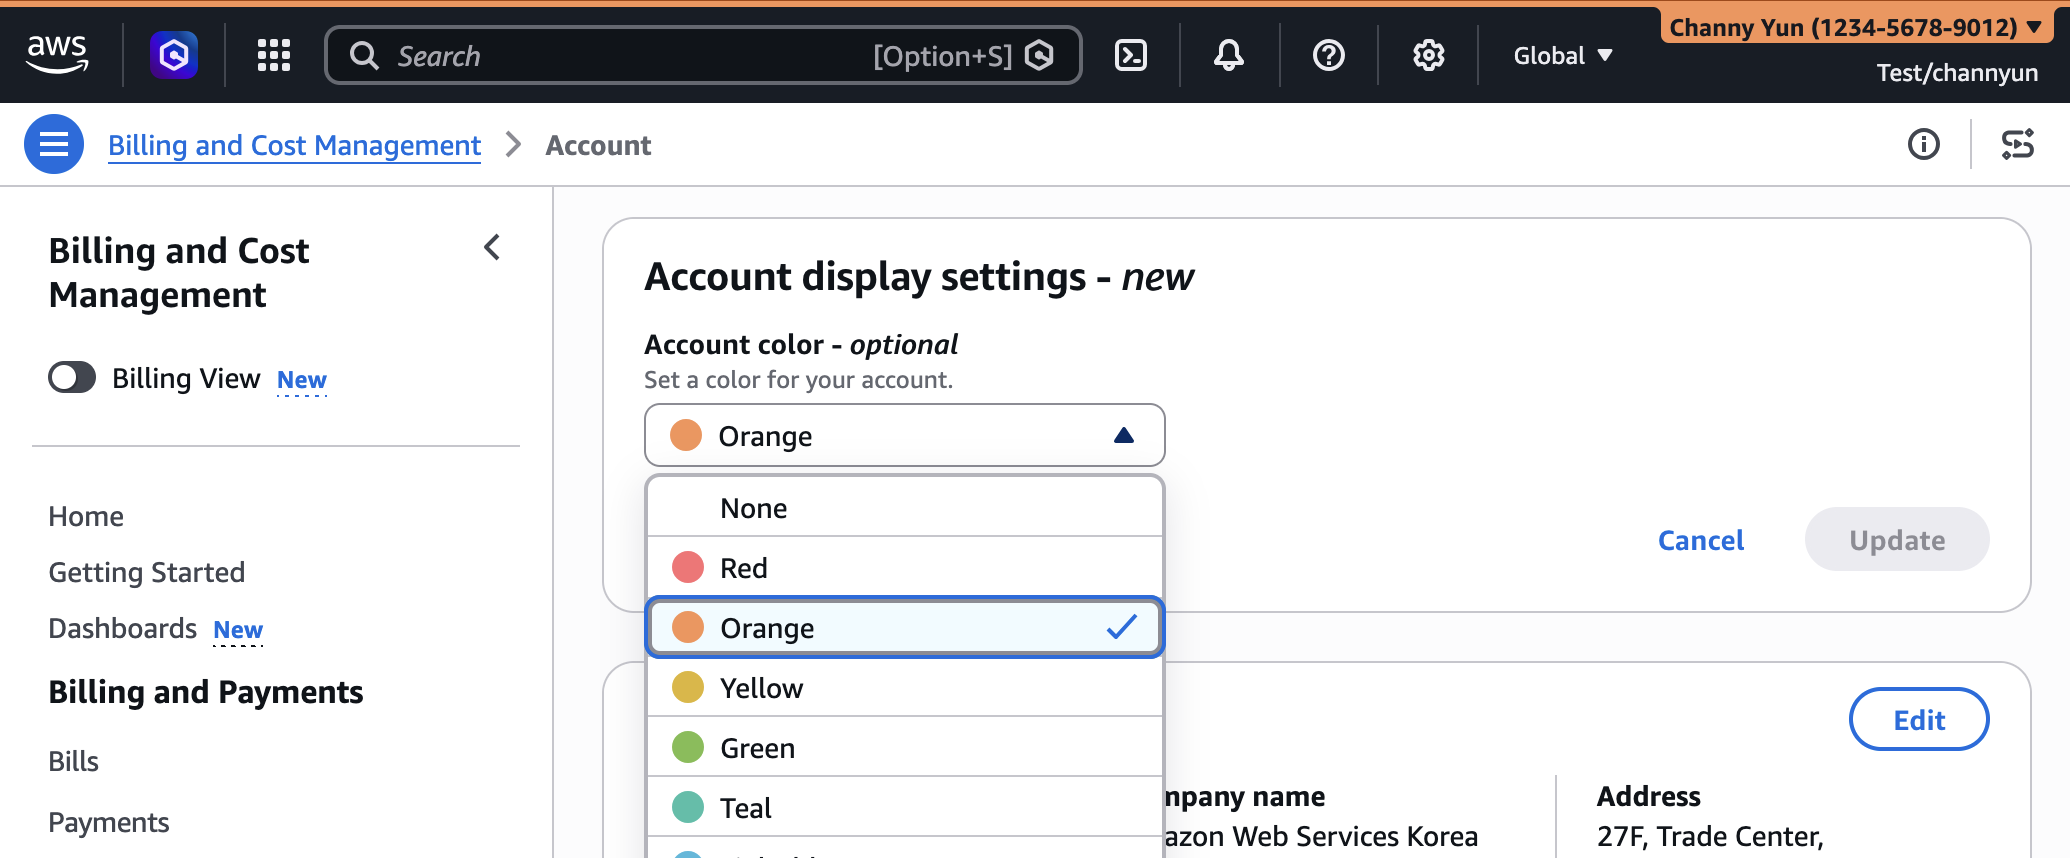
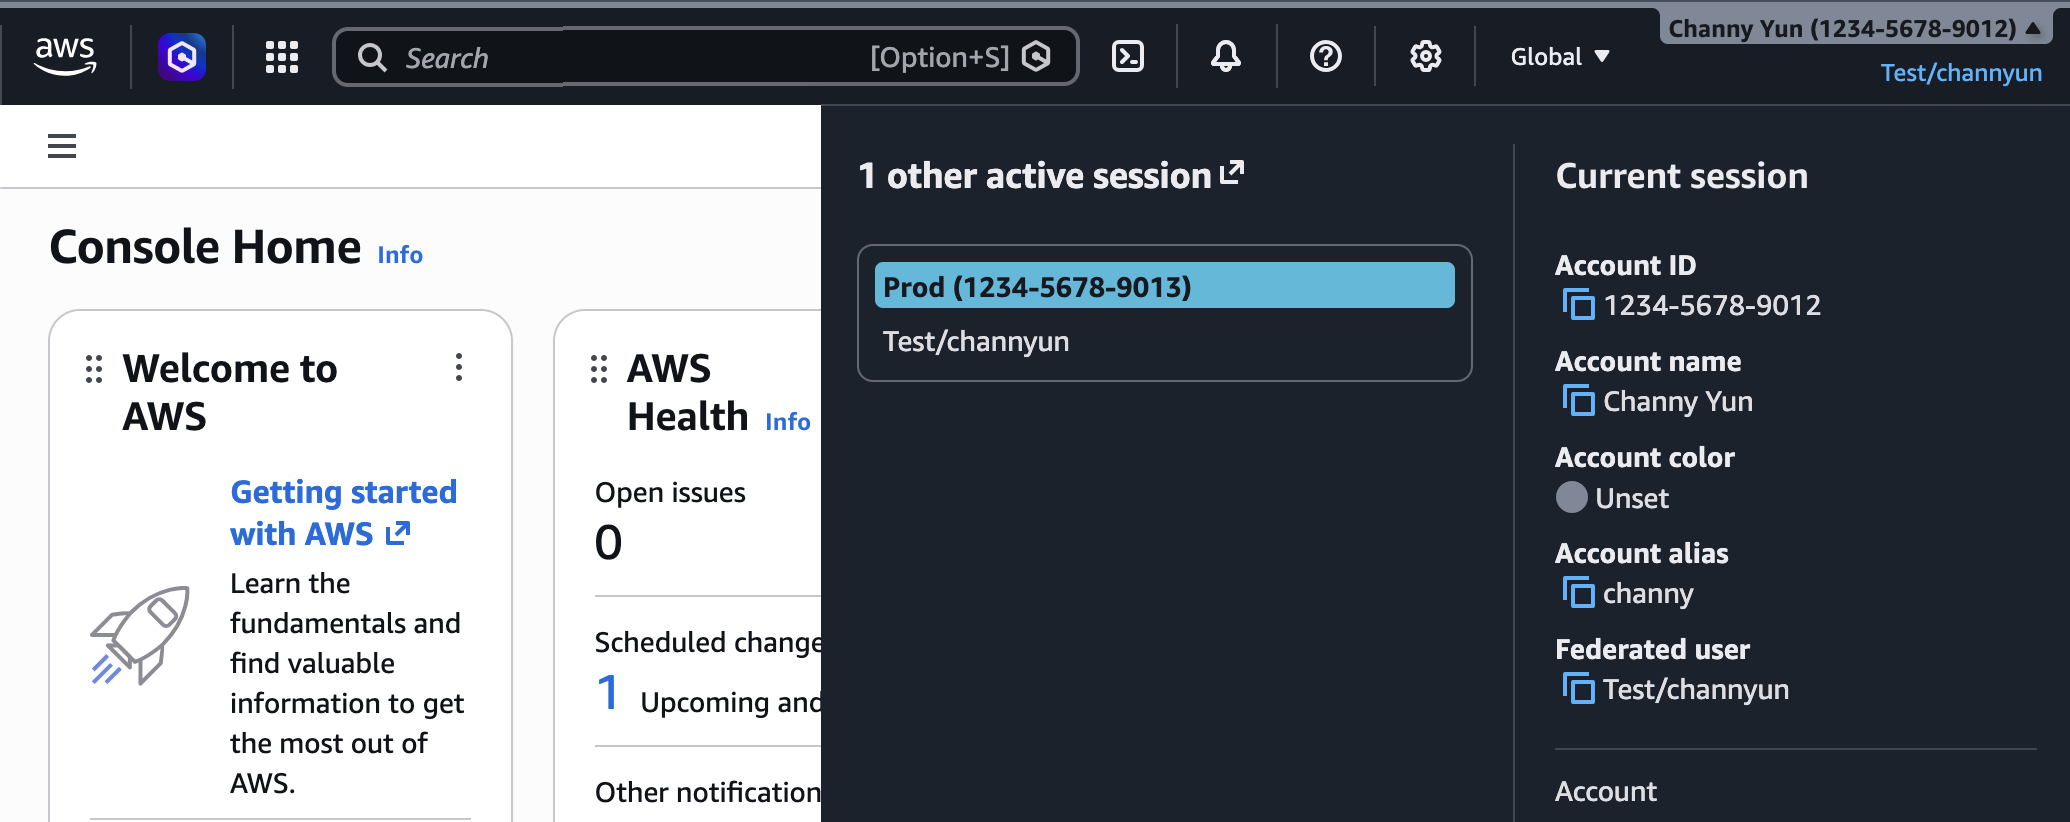
You can set a color for your accounts to visually distinguish between them. To get started, sign in to the AWS Management Console and choose your account name on the navigation bar. Your account color isn’t set yet. To set the color, choose Account.

In the Account display settings, select your preferred account color and choose Update. You can see the chosen color in the navigation bar.

By changing the account color, you can clearly distinguish the account’s purpose. For example, you can use orange for development accounts, light blue for test accounts, and red for production accounts.

Customize Regions and services visibility
You can control which AWS Regions appear in the Region selector or which AWS services appear in the console navigation. In other words, you can set to show only the Regions and services that are relevant to your account.

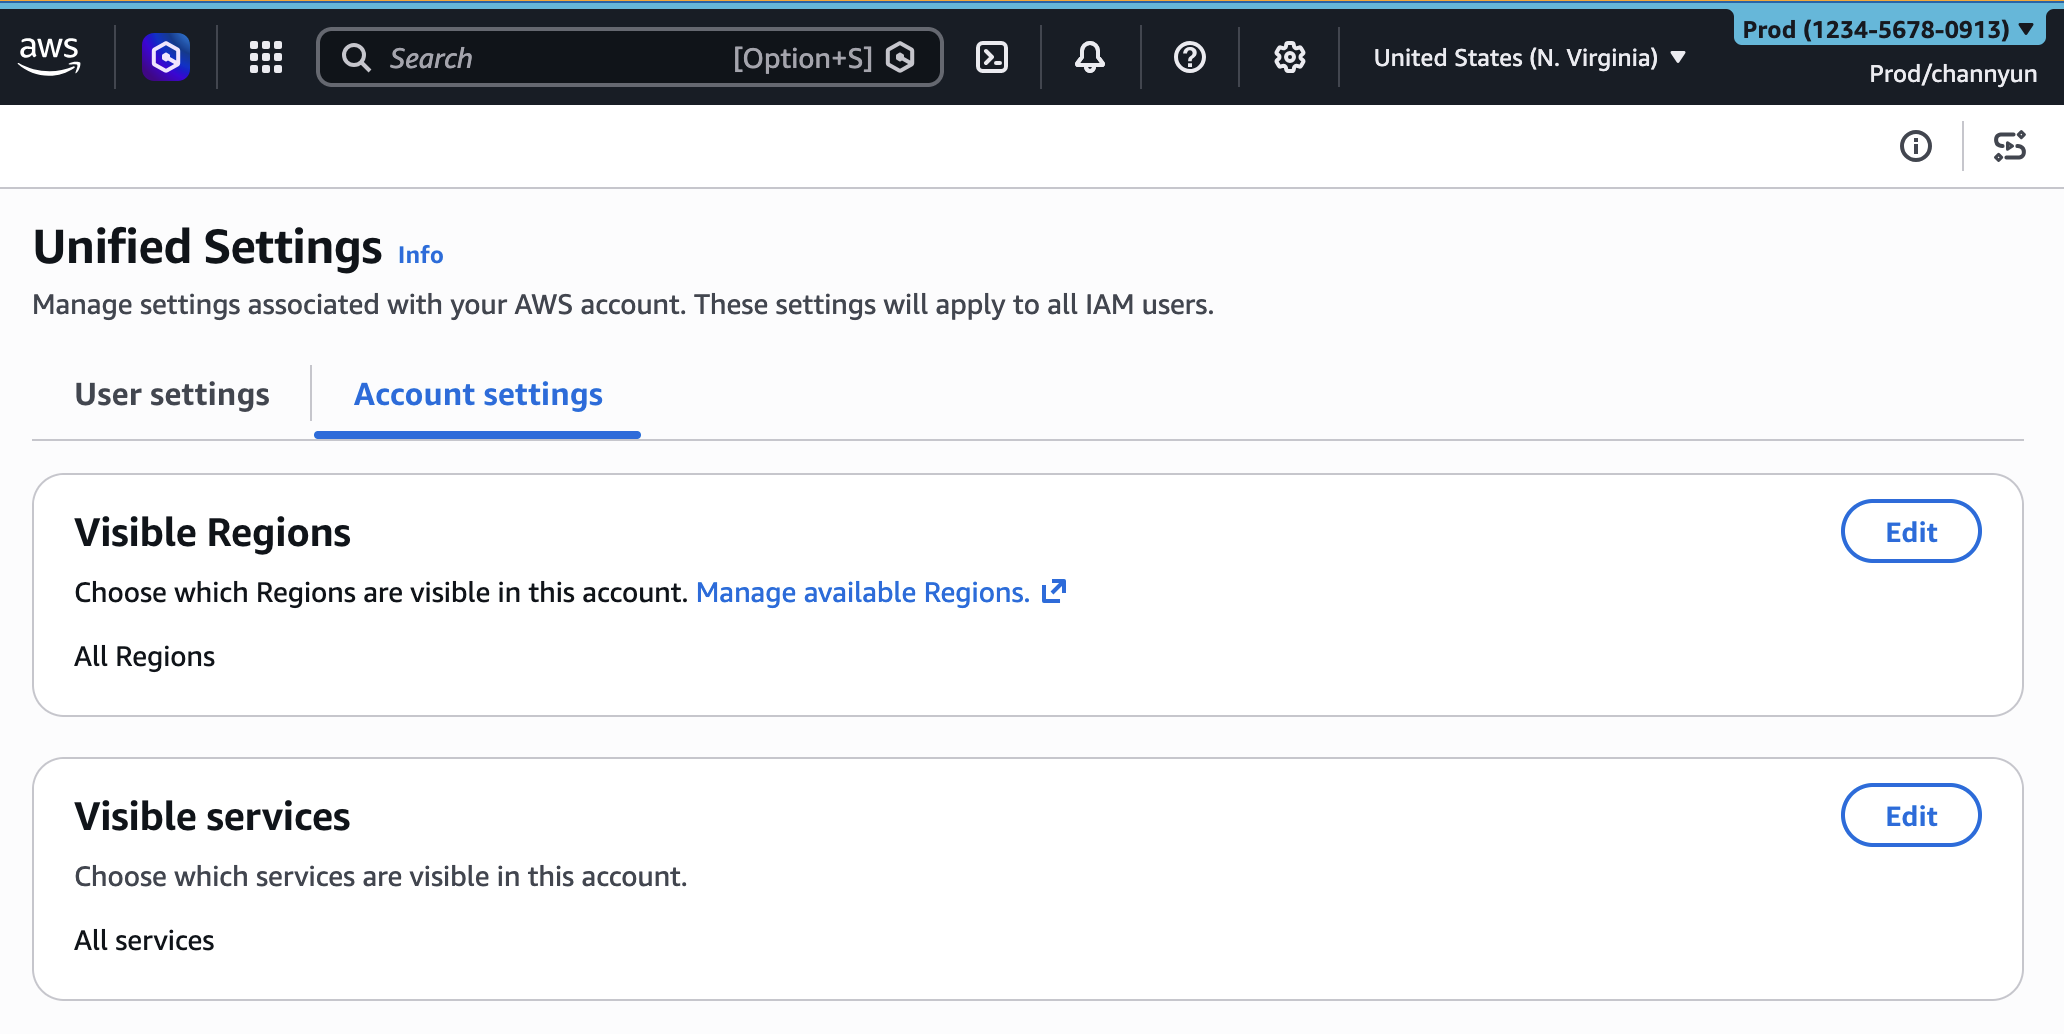
To get started, choose the gear icon on the navigation bar and choose See all user settings. If you are in an administrator role, you can see a new Account settings tab in the unified settings. If you have not configured a setting, all Regions and services are visible.

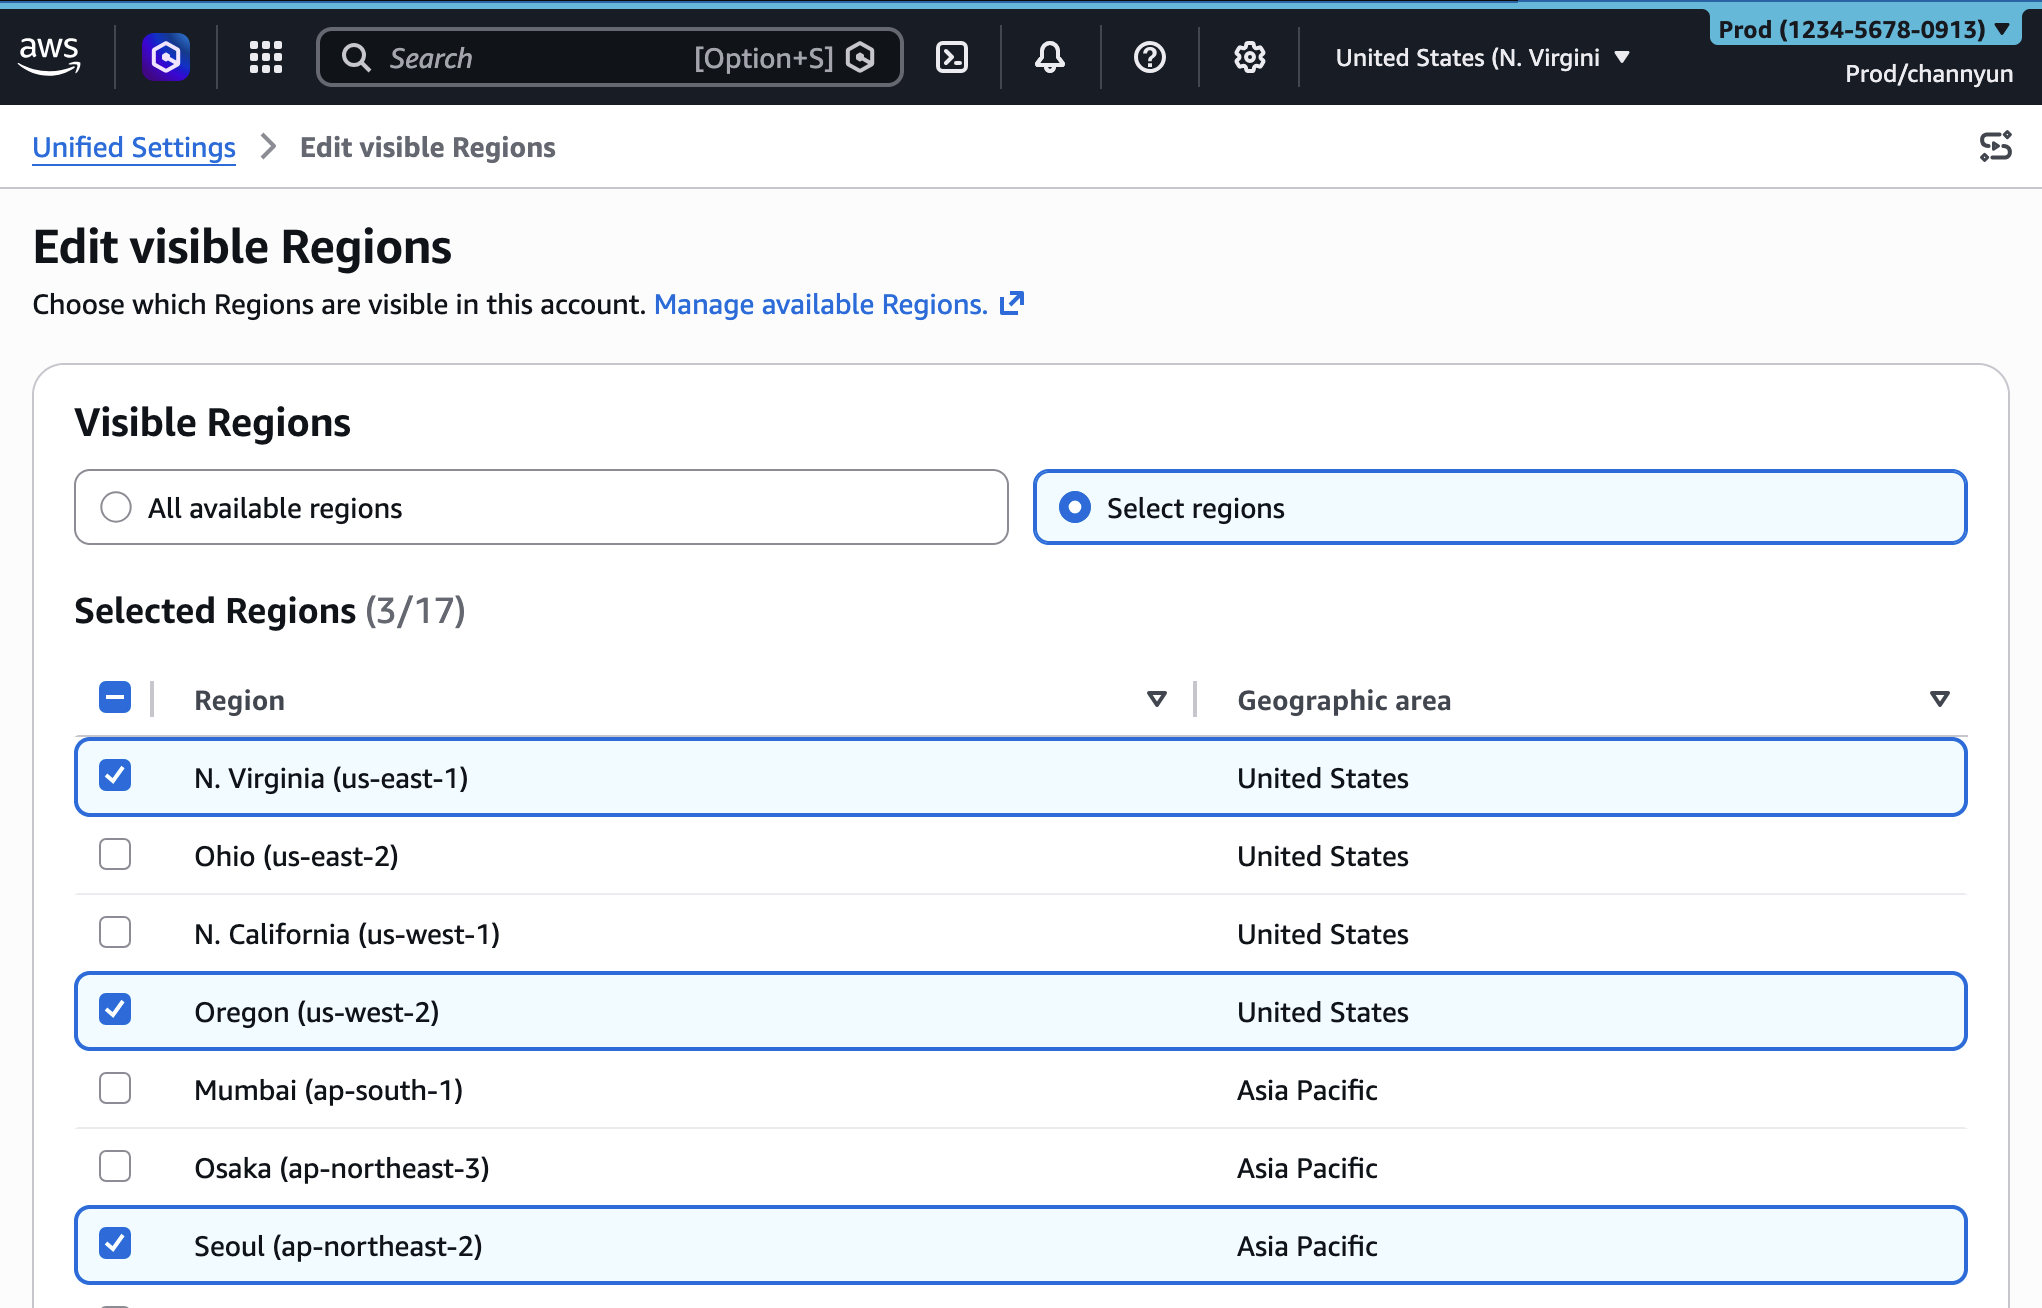
To set visible Regions, choose Edit in the Visible Regions section. Select your visible Regions to All available Regions or Select Regions and configure your list. Choose Save changes.

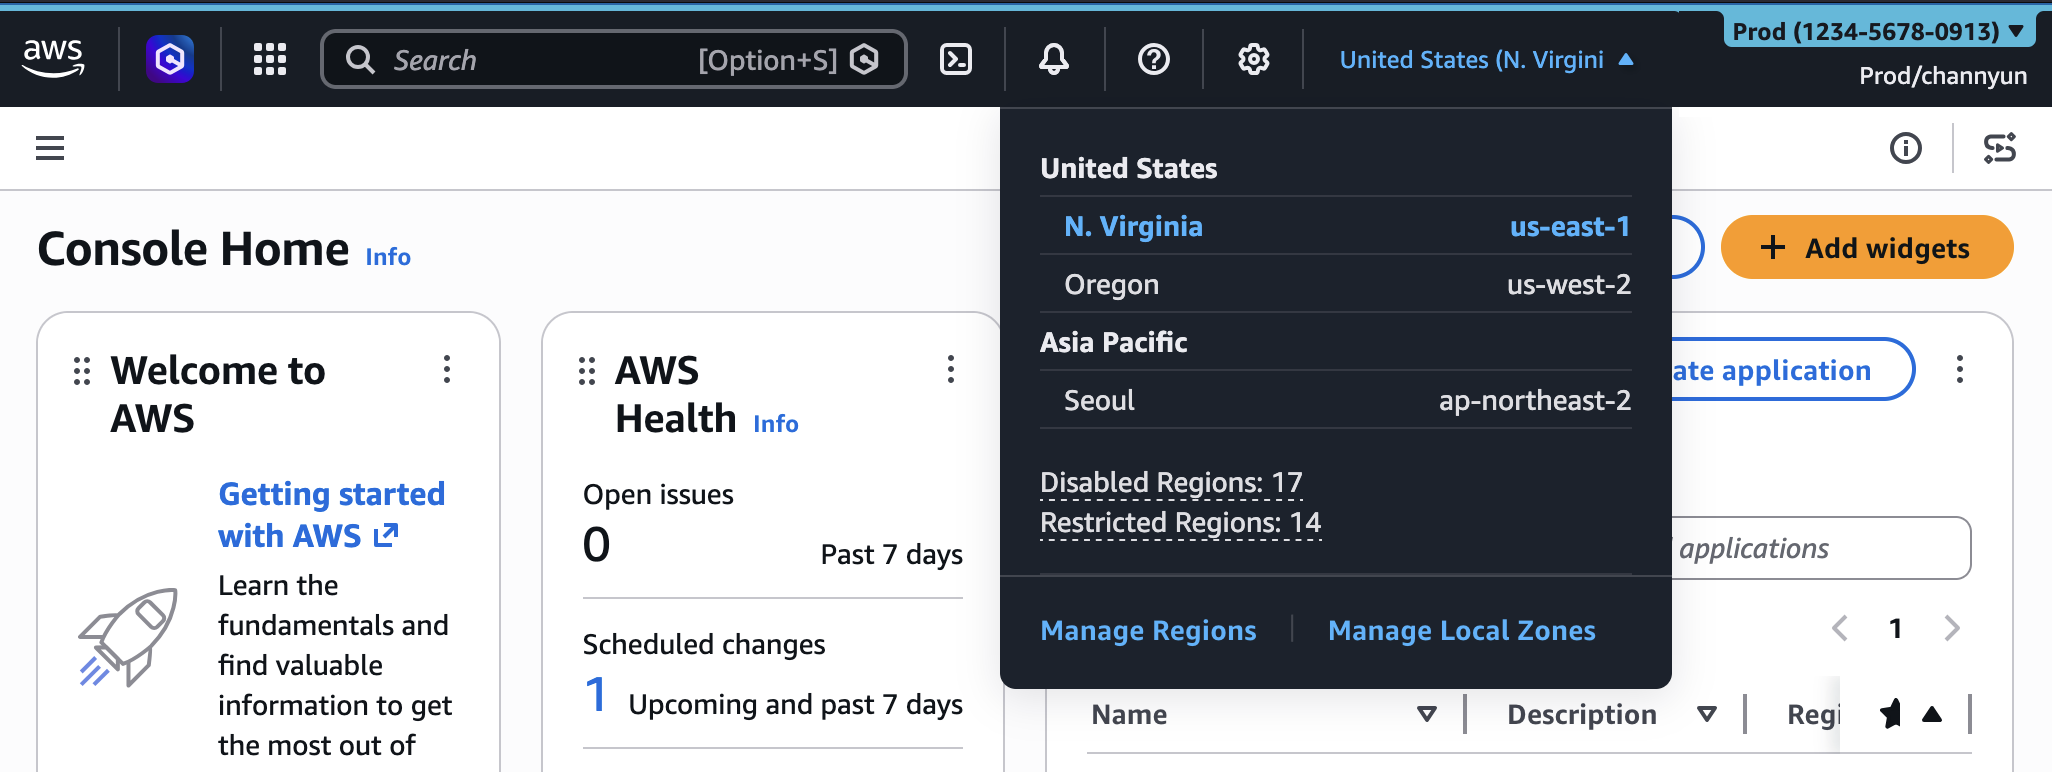
After configuring visible Region setting, you will find only selected Regions in the Regions selector on the navigation bar in the console.

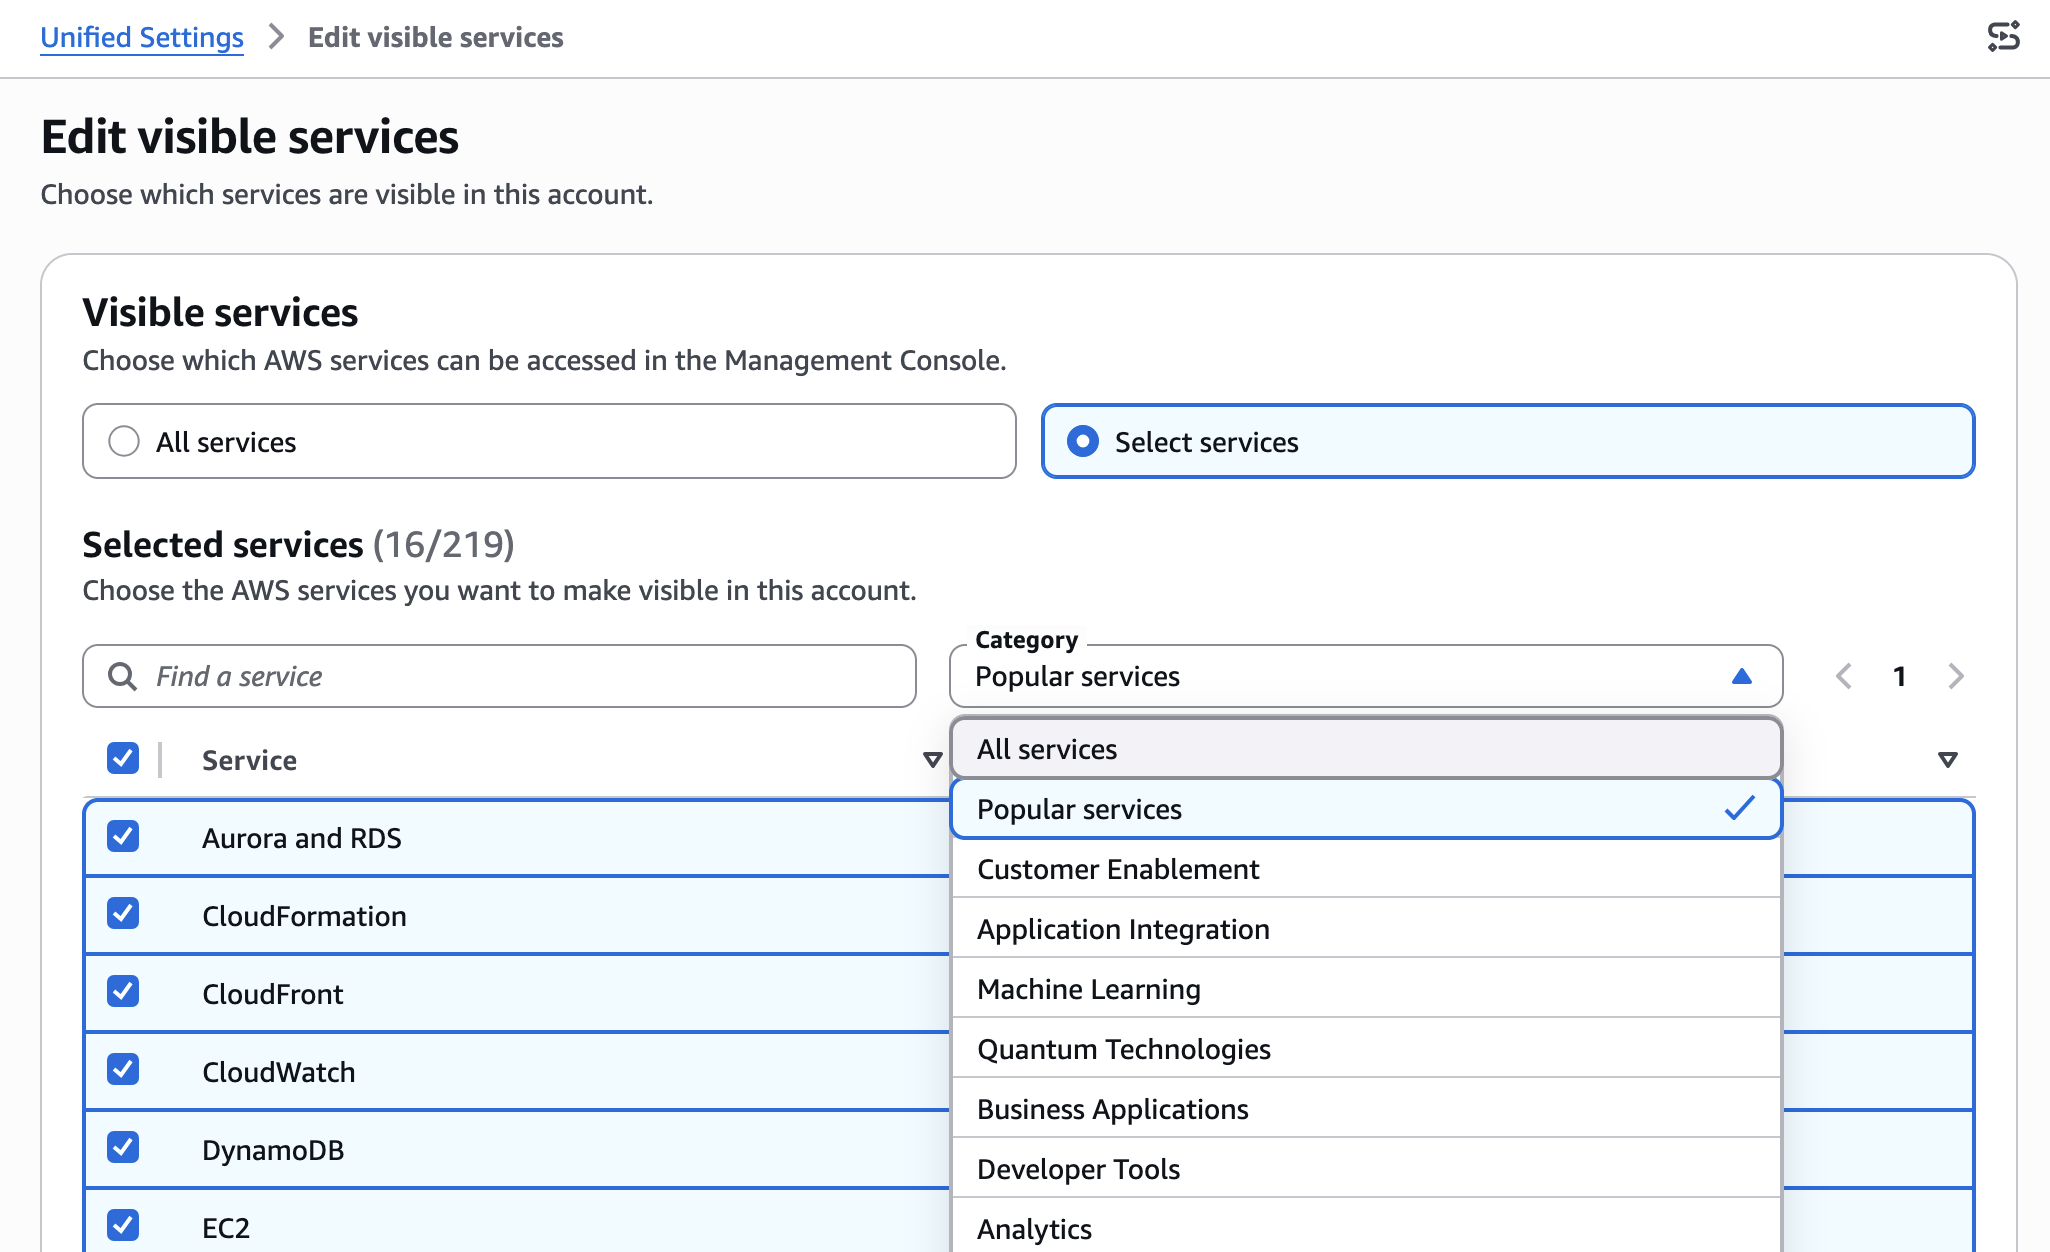
You can also set visible services in the same way. Search or select services from the category. I used the Popular services category to select my favorites. When you finish selection, choose Save changes.

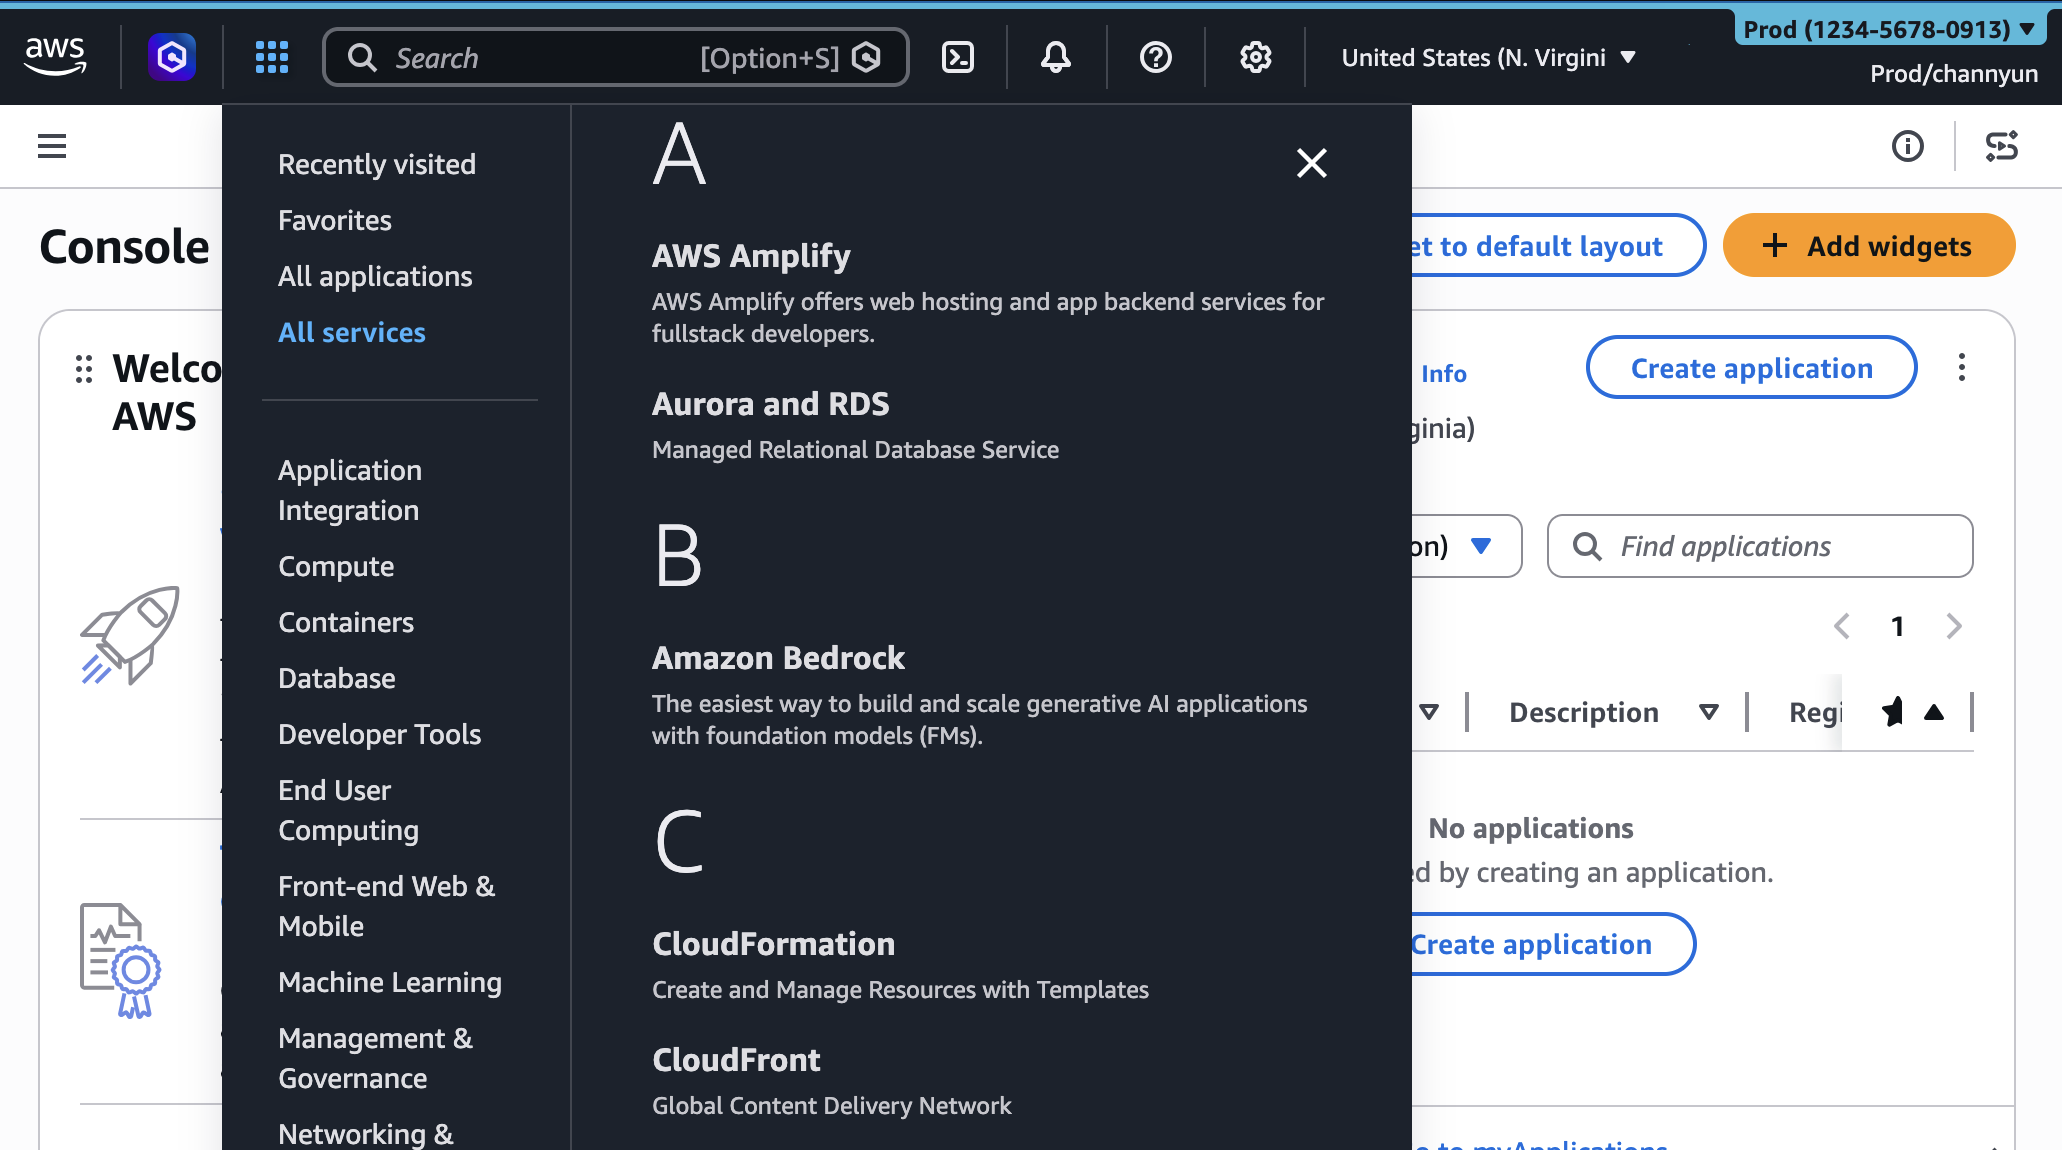
After configuring visible services setting, you will find only selected services in the All services menu on the navigation bar.

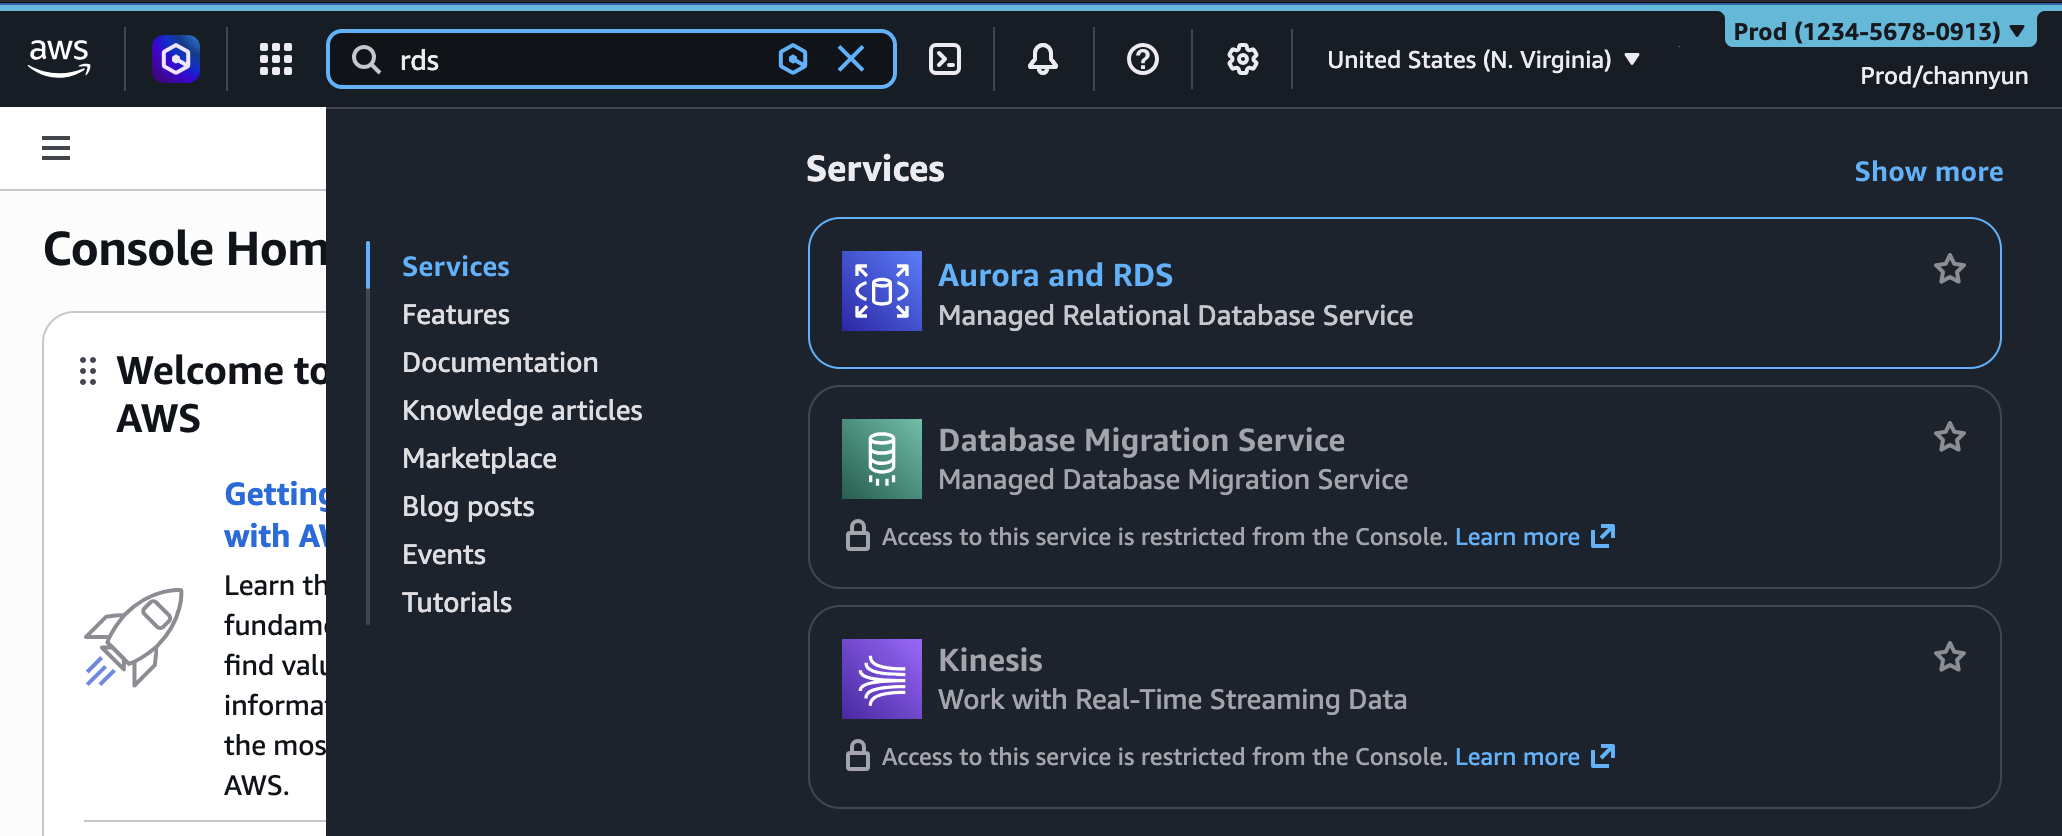
When you search the service name in the search bar, you can only choose selected services.

The Regions and services visibility settings control only the appearance of services and Regions in the console. They don’t restrict access through the AWS Command Line Interface (AWS CLI), AWS SDKs, AWS APIs, or Amazon Q Developer.

You can also manage these account customization settings programmatically with new visibleServices and visibleRegions parameters. For example, you can use AWS CloudFormation sample template:

AWSTemplateFormatVersion: "2010-09-09"
Description: Customize AWS Console appearance for this account

Resources:
  AccountCustomization:
    Type: AWS::UXC::AccountCustomization
    Properties:
      AccountColor: red
      VisibleServices:
        - s3
        - ec2
        - lambda
      VisibleRegions:
        - us-east-1
        - us-west-2

And you can deploy your Cloudformation template.

$ aws cloudformation deploy \
  --template-file account-customization.yaml \
  --stack-name my-account-customization

To learn more, visit the AWS User Experience Customization API Reference and AWS CloudFormation template reference.

Give it a try in the AWS Management Console today and provide feedback by selecting the Feedback link at the bottom of the console, posting to the AWS re:Post forum for the AWS Management Console, or reaching out to your AWS Support contacts.

— Channy

Изборите, които нямаме

Post Syndicated from Светла Енчева original https://www.toest.bg/izborite-koito-nyamame/

Изборите, които нямаме

Представете си, че трябва да избирате между две алтернативи.

Първата е либералната демокрация – зачитане на човешките права, съблюдаване на международното право, защита от дискриминация, свобода на изразяване и пр. Нямате гаранция обаче, че властта ще е имунизирана от корупция.

При втората алтернатива приоритет е борбата с корупцията, но без гаранции за демократично управление. Властта може и да е някаква форма на диктатура – от позициите на силата, с цензура, ограничаване на човешки и граждански права и т.н.

Трябва да изберете само една от тези алтернативи – не може и двете. Коя ще посочите?

Всъщност този въпрос беше само едно интелектуално упражнение, провокиращо към ценностно самоопределение и размисъл. Отговорът ви няма особено практическо значение. Поне не за предстоящите на 19 април парламентарни избори. Защото никоя от политическите сили, състезаващи се за вашия глас, не си поставя за основен приоритет защитата на либералната демокрация.

Борци с корупцията срещу… борци с корупцията

Ако предпочитате втората алтернатива, имате богат избор между политически сили, които поставят борбата с корупцията като свой приоритет и по всяка вероятност ще намерят място в следващия парламент.

„Прогресивна България“

Според всички социологически агенции, представили резултати от изследвания на електоралните нагласи на българските избиратели, новият политически проект на Румен Радев води убедително. Доскорошният президент влезе в политиката на гребена на антикорупционната протестна вълна от края на 2025 г. В публичните си послания той говори повече срещу олигархията, отколкото срещу корупцията, вероятно защото корупция е по-експлоатирано понятие. Но едното не изключва другото, напротив – разграждането на олигархията е важно условие за ограничаването на корупцията.

В предизборната програма на „Прогресивна България“ думата корупция и нейни производни се срещат 21 пъти, а олигархия и производните ѝ – 32 пъти.

ГЕРБ

Партията на Бойко Борисов, наред с личността на Делян Пеевски и оглавяваната от него партия ДПС – Ново начало, за много хора в България символизира корупцията, в която са се оплели всички власти – и законодателната, и изпълнителната, и съдебната. Към редакционното приключване на настоящата статия ГЕРБ няма актуална предизборна програма на сайта си, но вярвате или не, в платформата от 2024 г. за корупция става дума точно 32 пъти. Олигархията не се споменава.

„Продължаваме промяната – Демократична България“

И преди появата на „Продължаваме промяната“ партиите от „Демократична България“ бяха обичайните борци срещу корупцията. И все някой им измъква изпод краката килимчето на електоралната протестна енергия.

Два дни след като Христо Иванов и Иво Мирчев щурмуваха „сарая“ на Ахмед Доган в „Росенец“ и акцията им вдъхнови протести, Румен Радев излезе на площада, размаха юмрук и се провикна: „Мутри, вън!“, с което стана любимец на протестиращите и си подсигури втория мандат. На крилете на същата протестна енергия „Има такъв народ“ спечели изборите година по-късно. ПП–ДБ бяха формалните организатори на безпрецедентните в масовостта си протести от края на 2025 г., но електорално от тях печелят не те, а Радев. Протестите бяха против проектобюджета, но с антикорупционен акцент – чрез проекта за бюджет корупцията ставаше доста явна и дори официализирана.

Към приключването на статията коалицията не е публикувала актуална обща предизборна програма, но в тази от 2024 г. корупцията се среща 22 пъти, а борбата „с корупцията и несправедливостта“ е изведена като приоритет. Олигархията не се споменава.

„ДПС – Ново начало“

Колкото и да е трудно да се повярва, корупцията се споменава дори в предизборната програма на партията на Делян Пеевски, и то два пъти. Като един от приоритетите на Новото начало в областта „Сигурност и обществен ред“ се посочва „противодействие на организираната престъпност и корупцията“, а за управлението на държавната собственост се предлага „антикорупционен щит“. Самият Пеевски впрочем обича да обвинява политическите си противници в корумпираност, говорейки например за „пудели“ и „пачки“.

„Възраждане“

Освен че е проруска и евроскептична, партията на Костадин Костадинов се позиционира и като антикорупционна, а нейни представители и избиратели вземат участие в протести против корупцията. Досега „Възраждане“ няма участие във властта, поради което успява да запази антикорупционния си ореол за пред своите избиратели. И все пак според предизборните проучвания немалко от тях мигрират към Румен Радев, новия антикорупционен „спасител“. В програмата на „Възраждане“ корупцията се споменава 11 пъти, а олигархията – 4.

БСП

Според някои агенции Столетницата, оглавявана отскоро от Крум Зарков, има шанс да прескочи 4-процентовата бариера. Актуалната ѝ програма е по-кратка в сравнение с тези на партиите и коалициите, представени дотук. И все пак в нея корупцията е намерила място 8 пъти, а олигархията – 5.

Споменаване на корупцията и олигархията в предизборните програми
Партия/коалиция Корупция Олигархия
Прогресивна България 21 32
ГЕРБ (2024) 32 –
ПП–ДБ (2024) 22 –
ДПС – Ново начало 2 –
Възраждане 11 4
БСП 8 5


Ако приемаме предизборните програми за чиста монета, излиза, че сред досегашните парламентарно представени партии, които имат шанс да влязат и в следващото Народно събрание, най-големите борци срещу корупцията са в ГЕРБ. Но и в политиката важи поговорката „Не ме слушай какво говоря, а ме гледай какво върша“.

Липсващата либерална демокрация

Споменатата поговорка важи със същата сила и за либералната демокрация. По-скоро би важала, ако либералната демокрация изобщо беше приоритет на основните политически сили.

В програмите на пет от шестте партии и коалиции не се споменава нито веднъж дума, свързана с либералното, в политически контекст, тоест като характеристика на демокрацията. Сред тях е и ПП–ДБ, макар една от партиите в коалицията – „Продължаваме промяната“, да е част от „Обнови Европа“, групата на либералите в Европейския парламент.

Можете ли да предположите чия е програмата, в която се говори в прав текст за либерална демокрация, и то два пъти? 

На „Възраждане“. 

И двете споменавания са в негативен контекст и в съчетание с постмодерността, също схващана като нещо лошо: „опасна за националното здраве утопия – тази на либералната демокрация от постмодерен тип“ и „постмодерната либерална демокрация“, в която се оспорва, че България е на българите. Що се отнася до икономическия либерализъм, на едно място става дума за „либерализираната търговия с Украйна“ и още веднъж за „неолибералния еднополюсен модел“, все в негативен контекст.

В програмата на „Прогресивна България“ всичко на всичко на едно място се говори за икономическа либерализация – призовава се за „отговорна либерализация на пазара за бита“. Тоест либерализацията не е представена еднозначно като нещо лошо, но все пак като нещо, към което трябва да се подхожда с особено внимание.

В програмата на БСП цели 15 пъти става дума за икономическия неолиберализъм, все в негативен контекст – „неолиберална(та) държава“ (10 пъти), „неолибералния(т) модел“ (3 пъти), „неолибералния икономически ред“, „неолибералните реформи“ (има се предвид промяната след 10 ноември 1989 г.) – по веднъж.

Изобщо, в предизборните програми отношението към споменаването на либералното във всичките му смисли е обратно на това към покойниците. Тоест или лошо, или нищо.

(Не)либерални политически действия

И все пак, макар в предизборните програми либералната демокрация да не се споменава с добро, а с едно изключение да не се споменава и изобщо, в известен смисъл някои от тях изглеждат по-либерално от политическото поведение на субектите, на които принадлежат.

В програмата на „Прогресивна България“ например три пъти става дума за човешки права, а веднъж – за конституционни права. Говори се за бъдещето на България като „свободна и суверенна европейска демокрация“ и за „ясни демократични ценности“. Думи, производни от Европа, се споменават цели 64 пъти, а от Русия – нито веднъж.

Всичко това обаче не отменя пропутинската и евроскептична политика, която Румен Радев водеше, докато беше президент. Доскорошният президент беше категорично против ратификацията на Конвенцията на Съвета на Европа за превенция и борба с насилието над жени и домашното насилие, по-известна като Истанбулската конвенция. Той се включи в съмнителна инициатива в защита на семейството заедно с двама евроскептични президенти – на Унгария и Сърбия. Радев последователно е отстоявал проруски позиции, например отговора на въпроса „Чий е Крим?“ и твърдението му, че „Украйна настоява да продължи да води тази война“, а за изброяването на всичко има нужда от поне една отделна статия.

ГЕРБ се позиционира като консервативна партия, но по-скоро тип Орбан (макар и не толкова евроскептична и проруска) или Тръмп, отколкото като Европейската народна партия, към която формално принадлежи.

Показателни са думите на Бойко Борисов:

Ако трябваше да приемем да няма майка и татко […], тогава аз няма да съм евроатлантик.

В същото си изказване той разкритикува европейското си политическо семейство, което според него се оприличавало „на зелените, на либералите, на социалдемократите“. Докато ГЕРБ е „консервативна, народна, дясна партия […], партията на Мартен[с], на Кол, на Меркел. Трябва да сме тези, които бяхме.“ Фактът, че тъкмо по времето на Ангела Меркел Германия узакони еднополовите бракове, за Борисов явно е пренебрежим детайл.

От ПП–ДБ в най-голяма степен може да се очаква да защитават принципите на либералната демокрация. Платформата за парламентарна прозрачност „Стража“ публикува политически компас, а попълнилите го могат да видят кои партии се застъпват за едни или други политики. ПП–ДБ е посочена като единствената партия или коалиция, която застава зад либерални политики, като правното признаване на еднополовите двойки или намаляването на наказанията за притежание на малки количества марихуана.

Представители на коалицията обаче никога не са внасяли в парламента предложение за легализиране на еднополовите съжителства, да не говорим за еднополови бракове. От „Стража“ правят твърде свободно тълкуване, като асоциират тази тема с гласуването на коалицията против забраната на „пропагандата на ЛГБТ“ в училище (което впрочем показа сериозни ценностни различия в нея), както и с вота им относно дефиницията за интимна връзка в Закона за защита от домашното насилие. Тогава по предложение на БСП се прие тази дефиниция да включва само хетеросексуалните двойки, а ПП–ДБ бяха против. Неизключването им от дефиницията обаче не би било равносилно на правно признаване.

Ала ПП–ДБ вкупом гласува за популистки и антилиберални политики, като публичния „регистър на педофилите“, превръщането на сексуалните отношения на деца до 16-годишна възраст в престъпление и закона за лобизма, който може да се използва за репресия срещу неправителствени организации и активисти.

От останалите партии и коалиции, които имат шанс да влязат в парламента, няма особени очаквания, че ще защитават либерални ценности. По времето на Ахмед Доган ДПС беше либерална партия поне на хартия, но в ръцете на Пеевски премина в консервативния протръмпистки и какъвто-е-изгодно-в-момента-лагер. „Възраждане“ си е откровено антилиберална партия. Такава беше и БСП по времето на Корнелия Нинова и Атанас Зафиров. Макар новият ѝ председател Крум Зарков да се ползва със симпатиите на продемократичния „лагер“, засега той не е демонстрирал жестове в посока либерална демокрация.

Някой би репликирал: ами извънпарламентарните партии? От тях Зелено движение последователно се е застъпвало за правата на ЛГБТИ хората и за декриминализацията на марихуаната например. В настоящата предизборна кампания обаче то е в коалицията „Антикорупционен блок“, редом с „Единение“, „Ние идваме“ и „Средна европейска класа“. Тоест наред с либерали като Николай Хаджигенов, Зелено движение се явява на изборите в компанията и на политици като Константин Бачийски, чиито хомофобски позиции бяха предизвикали разкол между ПП и ДБ в Бургас, и Мая Манолова, непримирима срещу демонтажа на Паметника на Съветската армия.

Изборите, които имаме

Накратко, на 19 април няма да можем да гласуваме за и против либералната демокрация, защото никой не ни я предлага. Сред българските политически сили тя има само противници и в предизборните програми няма нито една добра дума за нея.

Изборът ни ще бъде между три основни варианта. Първият е борба с корупцията, съчетана с евроскептична ориентация – било привидно по-умерена (Радев) или откровено пропутинска („Възраждане“). Вторият е борба с корупцията, съчетана с проевропейска геополитическа (но не и ценностна) ориентация. А третият – запазване на корупционното статукво.

След изборите (или след следващите избори, ако предстоящите не произведат правителство) е доста вероятно да се стигне до коалиционно управление, при което все на някоя политическа сила ще ѝ се наложи да направи компромис. Било с геополитическата ориентация, било с корупцията. И избирателите ѝ ще се почувстват предадени. И така до следващите избори.

А всъщност, колкото и да е недолюбвана, либералната демокрация в най-голяма степен може да противодейства на корупцията. Не защото при нея корупция няма, а защото тя прави съпротивата възможна. Но човек често не оценява това, което има, докато не го загуби. 

Architecting for agentic AI development on AWS

Post Syndicated from Alan Oberto Jimenez original https://aws.amazon.com/blogs/architecture/architecting-for-agentic-ai-development-on-aws/

If you’re architecting cloud systems for AI development on AWS, you’ve likely discovered that traditional architectures create friction for AI agents. Many cloud teams are experimenting with AI coding assistants but quickly discover a gap between what these tools promise and what their architectures allow. When an AI agent generates code, it often takes minutes—or hours—before you can validate whether that change actually works. Slow deployment cycles, tightly coupled services, and opaque code bases turn every iteration into a high-friction exercise. As a result, AI agents struggle to operate autonomously, and developers are forced back into manual validation loops.

This article is written for cloud architects who want to remove that friction. It focuses on agentic development, a model where an AI agent does more than suggest snippets—it writes, tests, deploys, and refines code through rapid feedback cycles. To make that possible, both your system architecture and your code base architecture must be designed to support fast validation, safe iteration, and clear intent.

In this post, we demonstrate how to architect AWS systems that enable AI agents to iterate rapidly through design patterns for both system architecture and code base structure. We first examine the architectural problems that limit agentic development today. We then walk through system architecture patterns that support rapid experimentation, followed by codebase patterns that help AI agents understand, modify, and validate your applications with confidence.

Why traditional architectures hinder agentic AI

Most cloud architectures were designed for human-driven development. They assume long-lived environments, manual testing, and infrequent deployments. In an agentic workflow, those assumptions break down.

AI agents must validate changes continuously. When every test requires provisioning cloud resources, waiting for pipelines, or debugging deployment-only failures, feedback loops become too slow. Tight coupling between business logic and cloud services further complicates local testing, while inconsistent project structures make it difficult for an agent to understand where changes belong.

Without architectural support, agentic AI produces more risk than value. The solution is not better prompts, it’s an architecture that treats fast feedback and clear boundaries as first-class concerns. This architectural friction isn’t only inconvenient, it fundamentally limits AI agent effectiveness. Here’s how to redesign your architecture to help unlock the potential of agentic AI.

System architecture for fast agentic feedback loops

Agentic development depends on feedback speed. The faster an agent can observe the impact of a change, the more effectively it can refine its output. System architecture plays a decisive role here.

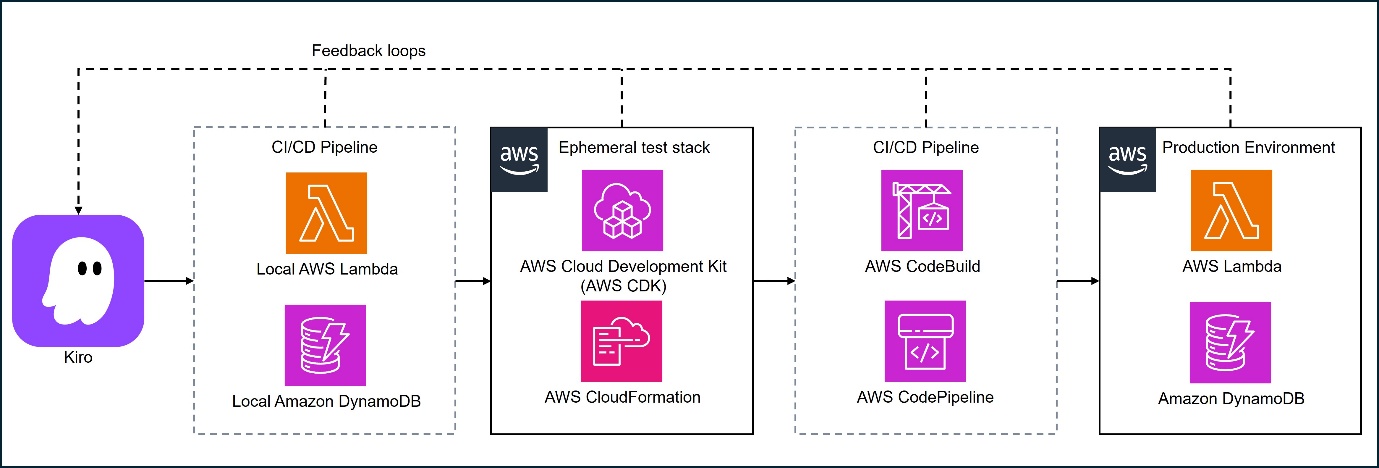
This diagram illustrates a comprehensive continuous integration and continuous deployment (CI/CD) pipeline architecture using AWS services, featuring feedback loops that connect development, testing, and production environments.

Figure 1: High-level architecture enabling agentic development: local test loops, ephemeral test stack, and continuous integration and continuous delivery (CI/CD) pipeline triggered by AI

Local emulation as the default feedback path

Whenever possible, your architecture should allow AI agents to test changes locally before touching cloud resources. AWS provides several tools that make this practical.

For example, serverless applications built with AWS Lambda and Amazon API Gateway can be emulated locally using the AWS Serverless Application Model (AWS SAM). With the sam local start-api command, an AI agent can invoke Lambda functions through a locally emulated API Gateway, observe responses immediately, and iterate in seconds rather than minutes.

Containers offer similar benefits for services that run on Amazon Elastic Container Service (Amazon ECS) or AWS Fargate. By building and running the same container images locally, an agent can validate application behavior before deploying to the cloud. For data persistence, Amazon DynamoDB Local allows the agent to test create, read, update, and delete (CRUD) operations against a local database that mirrors the DynamoDB API.

Note: Local emulation reduces iteration time, allowing AI-generated code to be validated in seconds and potentially reducing the cost and risk of experimentation.

Offline development for data and analytics workloads

Many workloads fit neatly into request-response testing, but data processing pipelines often involve large datasets and distributed execution. Even here, agentic workflows benefit from local feedback.

AWS Glue provides Docker images that allow AWS Glue jobs to run locally with the AWS Glue ETL libraries. An AI agent can validate transformations against sample datasets, inspect intermediate results, and only move to the cloud for scale testing. The same pattern applies to other data and machine learning (ML) workloads: isolate logic, test locally with reduced data, and promote validated code to managed services later.

Note: Offline development shortens feedback loops for data workloads and reduces unnecessary cloud runs during early iteration.

Hybrid testing with lightweight cloud resources

Some AWS services cannot be fully emulated locally. In these cases, the goal is not to avoid the cloud, but to keep cloud feedback lightweight.

For event-driven systems using Amazon Simple Notification Service (Amazon SNS) or Amazon Simple Queue Service (Amazon SQS), you can define minimal development stacks using infrastructure as code (IaC) tools such as AWS CloudFormation or the AWS Cloud Development Kit (AWS CDK). An AI agent can deploy small, isolated resources, invoke them through the AWS SDK, and validate behavior without provisioning full environments.

This hybrid approach treats the cloud as another test dependency—used sparingly and predictably.

Note: Hybrid testing confirms real service behavior early while keeping cloud usage focused and controlled.

Preview environments and contract-first design

Fast feedback does not stop at local testing. End-to-end validation still matters, especially when multiple services interact.

Preview environments are short-lived stacks deployed on demand for validation. Defined through IaC, they allow an AI agent to deploy a complete application, run smoke tests, and tear everything down when finished. When combined with contract-first design—where APIs are defined upfront using OpenAPI specifications—agents can validate integrations even before all services are implemented.

Note: Preview environments can reduce integration risk and allow AI-generated changes to be validated safely before reaching production.

Code base architecture for AI-friendly development

System architecture accelerates feedback, but code base architecture determines whether an AI agent can make sense of what it is changing.

Domain-driven structure with explicit boundaries

We recommend agentic development when your repository reflects clear architectural intent. A domain-driven structure inspired by Domain-Driven Design (DDD) separates core business logic from application orchestration and infrastructure concerns.

In practice, this often means organizing code into predictable layers such as /domain, /application, and /infrastructure. The domain layer contains business rules with no Amazon dependencies. Infrastructure code handles integrations with services such as Amazon DynamoDB or Amazon SNS. This separation allows AI agents to modify business logic and validate it locally without touching cloud-specific code.

Patterns like hexagonal architecture reinforce this separation by treating external systems as adapters rather than dependencies.

Note: Clear boundaries can reduce unintended side effects and make AI-generated changes more straightforward to reason about and test.

Encoding architectural intent with project rules

Even well-structured repositories benefit from explicit guidance. Kiro supports steering files—Markdown files stored under .kiro/steering/—that describe architectural constraints and coding conventions.

For example, a rule might state that database access must go through repository classes in the infrastructure layer. The agent consults these rules automatically, reducing the need to restate constraints in every prompt and helping to keep generated code aligned with your architecture.

Note: Project rules reduce architectural drift and help maintain consistency as AI agents operate more autonomously.

Tests as executable specifications

In agentic workflows, tests do more than catch regressions, they define acceptable behavior. A layered testing strategy works particularly well:

  • Unit tests validate domain logic in isolation and run quickly, making them ideal for frequent AI-driven iterations.
  • Contract tests verify that services honor agreed interfaces, catching breaking changes early.
  • Smoke tests run against deployed environments to surface configuration or permission issues that only appear at runtime, such as missing AWS Identity and Access Management (IAM) permissions.

Well-written tests also act as documentation. When a test fails, the agent can infer what behavior is expected and refine its changes accordingly.

Note: Tests provide fast, objective validation of AI-generated code and reduce the risk of subtle integration failures.

Monorepos and machine-readable documentation

AI agents work more effectively when they have broad context. A monorepo allows the agent to navigate across services, understand shared patterns, and evaluate the impact of changes system-wide. Within that repository, concise and structured documentation is essential. Files such as AGENT.md can explain architectural principles and constraints, while RUNBOOK.md and CONTRIBUTING.md describe operational and development workflows. Machine-readable formats, such as YAML or configuration files, are more straightforward for agents to interpret than lengthy prose.

Kiro can use foundational steering documents—summaries of structure, technology, and product guidelines—to help the agent maintain situational awareness as the project evolves.

Note: Shared context improves the quality of AI-generated changes and reduces the need for manual correction.

Integrating agents safely into delivery pipelines

As AI agents become more capable, governance remains essential. Continuous integration and continuous deliver (CI/CD) pipelines should include guardrails such as required test execution, automated reviews, and branch protections. Over time, as confidence grows, you can expand the agent’s autonomy while keeping humans in the loop for high-impact decisions. This balance allows AI to accelerate routine work without increasing operational risk.

Conclusion

Agentic AI development does not succeed by accident. It requires architectures that prioritize fast feedback, clear boundaries, and explicit intent. Combining local emulation, lightweight cloud testing, and preview environments with domain-driven structure, layered testing, and machine-readable documentation creates an environment where AI agents can operate effectively and safely. Tools like Kiro help bridge the gap between human design decisions and autonomous AI execution. When architecture aligns with agentic workflows, AI agents become true force multipliers, handling iterative development at speed while your team focuses on higher-level design and innovation.

To learn more about how AWS can help your organization implement agentic solutions, visit AWS Agentic AI.


About the authors

Managing Backblaze B2 with Claude: Introducing the B2 Cloud Storage Skill for Claude

Post Syndicated from Jeronimo De Leon original https://www.backblaze.com/blog/managing-backblaze-b2-with-claude-introducing-the-b2-cloud-storage-skill-for-claude/

A decorative image showing gears on a cloud.

Modern infrastructure teams increasingly interact with their systems through automation and AI-assisted tooling. Terminal-native agents like Claude Code are beginning to act less like chatbots and more like operational collaborators, able to inspect environments, run commands, and help maintain infrastructure.

Today we’re releasing a new open-source tool designed for that workflow: the Backblaze B2 Cloud Storage Skill for Claude.

This GitHub repository provides a structured skill that allows Claude-based agents to safely interact with Backblaze B2 Cloud Storage through the B2 CLI. Instead of manually running storage audits, searching buckets, or reviewing lifecycle rules, you can ask an AI assistant to help perform those tasks directly in your development environment.

The result is simple and powerful: An open source natural language interface for inspecting and managing B2 Cloud Storage, built with guardrails.

What is the B2 Cloud Storage Skill for Claude?

The B2 Cloud Storage Skill for Claude is an open-source repository that enables AI-assisted management of B2 buckets using the official Backblaze B2 CLI.

The project includes three primary components:

1. A Claude Skill Definition

The skill file provides structured instructions that teach Claude how to safely interact with B2 Cloud Storage. It defines the commands the assistant can use, outlines safe operational practices, and establishes restrictions around sensitive data and destructive actions.

This allows Claude to perform storage operations while respecting operational safeguards.

2. A Storage Audit Script

The repository includes a Python script that analyzes the contents of a bucket and produces a structured report. The audit can:
  • Summarize storage usage by directory prefix
  • Analyze file types and extensions
  • Identify files older than 90 days
  • Flag objects larger than 100MB
  • Detect potential duplicates based on filename

The result is a quick operational snapshot of a bucket’s structure and usage patterns—useful for cost awareness, lifecycle planning, and housekeeping.

The skill supports per-project configuration through a .claude/b2-config.json file. This allows developers to specify a default bucket, a working prefix, or a project-specific credential file.

In practice, that means different repositories or services can point to different storage buckets without changing global CLI configuration.

How to use it

The skill is designed to work in environments where Claude Code or similar agent-based developer tools can execute terminal commands.

A typical workflow looks like this:

  1. Install and configure the B2 CLI.
  2. Authorize the CLI with a B2 application key.
  3. Add the skill repository to your Claude environment.
  4. Optionally configure a project-specific bucket.

Once configured, you can ask Claude to perform storage tasks directly from your terminal.

Examples include:

  • Audit the contents of this bucket.
  • List files older than 90 days.
  • Show the largest objects in this prefix.
  • Check the bucket’s lifecycle rules.
  • Find duplicate filenames across directories.

Under the hood, the assistant is running standard B2 CLI commands and the included audit script. The skill simply provides the structure that allows an AI agent to use those tools correctly.

This approach keeps the operational layer transparent: Everything ultimately resolves to normal CLI commands you can run (and double check) yourself.

Why it matters

Cloud storage environments grow quietly.

Buckets accumulate logs, backups, generated assets, and intermediate files over time. Without periodic inspection, those collections can become difficult to understand or maintain.

Historically, storage audits have been manual exercises: writing scripts, exporting listings, or running ad-hoc commands.

AI-assisted tooling changes that interaction model.

Instead of constructing queries, operators can ask for insights:

  • Where is the storage concentrated?
  • Which files are stale?
  • Are lifecycle policies doing their job?
  • Are there large objects that should be archived or removed?

The B2 Cloud Storage Skill bridges the gap between AI-assisted workflows and real storage infrastructure.

Just as importantly, the repository is designed with safety in mind. The skill restricts commands that could expose credentials, requires dry-runs before deletion operations, and warns when actions could change bucket visibility.

In other words, it treats AI as an operational assistant—not an autonomous administrator.

Open source and extensible

The repository is intentionally lightweight and open.

It’s meant to serve as both a practical tool and a starting point for developers exploring how AI agents can interact with storage infrastructure.

Possible extensions include:

  • Automated lifecycle policy recommendations
  • Deeper storage analytics
  • Integration with monitoring pipelines
  • Custom audit rules for specific workloads

If you’re experimenting with AI-assisted operations—or simply want a faster way to inspect your B2 Cloud Storage—this skill provides a practical place to start.

You can explore the repository and try it yourself here:

https://github.com/backblaze-b2-samples/claude-skill-b2-cloud-storage

The post Managing Backblaze B2 with Claude: Introducing the B2 Cloud Storage Skill for Claude appeared first on Backblaze Blog | Cloud Storage & Cloud Backup

Bringing AI education to 1.25 million students across Latin America

Post Syndicated from Anna Burton original https://www.raspberrypi.org/blog/bringing-ai-education-to-1-25-million-students-across-latin-america/

We’re excited to share that we are expanding our Experience AI programme across Latin America with the aim of training 24,000 educators and reaching 1.25 million students by 2028, thanks to generous funding of $4.6 million from Google.org.

Working with education partners across Argentina, Brazil, Chile, Colombia, Dominican Republic, El Salvador, Mexico, Peru, and Uruguay, we will help young people develop a foundational understanding of AI technologies, their social and ethical implications, and the role that AI can play in their lives.

AI literacy across the globe

AI systems are part of everyday life in how we find information, work, and solve problems. We think that young people need more than access to AI tools: they need the knowledge, skills, and confidence to understand and create their own AI tools.

Experience AI, developed in partnership with Google DeepMind, is a free educational programme that helps teachers and students learn about artificial intelligence (AI). It introduces young people to how AI systems work and how they are used in everyday contexts through lessons, classroom resources, and hands-on activities. The resources give young people opportunities to think critically about the role of AI in society.

The winners of the 2025 UNESCO King Hamad Bin Isa Al-Khalifa Prize.
The winners of the 2025 UNESCO King Hamad Bin Isa Al-Khalifa Prize. © Government of the Kingdom of Bahrain

Through a global network of Experience AI partners, we have so far reached an estimated 2.9m young people and trained 30,000 educators. The programme’s resources are used in more than 180 countries and are available in 19 languages. In recognition of its impact, Experience AI was named a laureate of the 2025 UNESCO King Hamad Bin Isa Al-Khalifa Prize for the Use of ICT in Education.

Impact through partnerships

In Latin America, as in other parts of the Experience AI network, our focus will be on sustainable, locally led delivery through partner organisations. Using our established ‘train-the-trainer’ model, we will equip 24,000 educators with the skills and knowledge to use the Experience AI resources to confidently deliver AI literacy lessons. 

Educators at a workshop

Our aim is to create a lasting impact for teachers and classrooms across the region and ensure that high-quality AI education is accessible to young people in a wide range of settings.

Supporting critical thinking

Experience AI is designed not only to build technical understanding, but also to help young people think critically about AI and its impacts.

Three teenage girls at a laptop.

Through the programme, students across Latin America will develop a foundational understanding of how AI works, while exploring key topics including how data is used in AI systems, how to identify AI-generated misinformation, and how to use generative AI tools responsibly. This will help them to understand the opportunities and challenges of AI, and to make informed decisions about how they use these technologies.

Looking ahead

As AI systems are being built into many aspects of today’s world, it’s essential that young people have the opportunity to understand, question, and build with these technologies.

With support from Google.org, we will expand access to high-quality AI education across Latin America through Experience AI, helping over a million young people develop the skills, knowledge, and confidence to navigate and shape a world where AI technologies are widely used.

You can find out more about Experience AI at experience-ai.org.

The post Bringing AI education to 1.25 million students across Latin America appeared first on Raspberry Pi Foundation.

Introducing enhancements to Amazon EMR Managed Scaling

Post Syndicated from Amit Maindola original https://aws.amazon.com/blogs/big-data/introducing-enhancements-to-amazon-emr-managed-scaling/

Amazon EMR Managed Scaling has been helping customers automatically resize their clusters to optimize performance and reduce costs. We are excited to introduce a significant enhancement to this feature: Advanced Scaling for Amazon EMR. This new capability provides additional flexibility to configure the desired resource utilization or performance levels for your cluster using a utilization-performance slider. After the slider is set, EMR Managed Scaling intelligently scales the cluster and optimizes cluster resources based on your configured performance or resource utilization levels.

Customers appreciate the simplicity of EMR Managed Scaling, where they specify the minimum and maximum compute limits for their clusters and EMR Managed Scaling automatically resizes the cluster. EMR Managed Scaling continuously samples key metrics associated with the workloads running on clusters and scales up or down accordingly. However, customers’ workloads are increasingly getting more complex, with variability across dimensions such as data volumes and cost vs. SLA requirements. Consequently, customers prefer to have additional levers to tune the scaling behavior most suitable for their workload. In this post, we discuss the benefits of Advanced Scaling for Amazon EMR and demonstrate how it works through some example scenarios.

Advanced Scaling for Amazon EMR

Previously, customers who wanted to adjust the default EMR Managed Scaling behavior had no other option but to disable EMR Managed Scaling and create custom automatic scaling rules. Custom autoscaling rules created several problems:

  • Custom autoscaling rules are not shuffle-aware and shuffle data is lost.
  • Custom autoscaling is not aware of the application driver and can terminate it, failing the entire job.
  • Custom autoscaling can be slower to respond to real time needs.

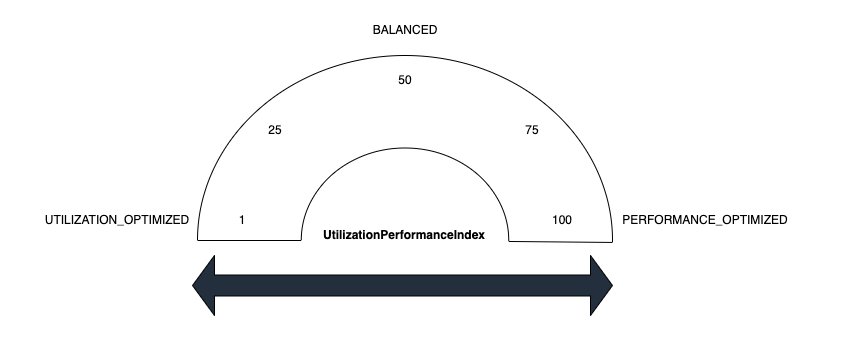
These are some of the reasons why custom autoscaling is not the right fit. Customers wanted out-of-the-box support for Managed Scaling to handle the scaling that optimizes for the customers end goal to optimize cost or performance. The new Advanced Scaling capability enhances the existing benefits of EMR Managed Scaling by introducing additional controls and helping you configure the desired resource utilization or performance level for your cluster using a utilization-performance slider. EMR Advanced Scaling then internally translates intent into tailored algorithm strategy (UtilizationPerformanceIndex), such as how quickly to scale, how much to scale, and so on, to make scaling decisions for the cluster. This helps optimize cluster resources while making sure we meet the performance or resource utilization intent set by the customer.

For example, for a cluster running multiple tasks of relatively short duration (order of seconds), EMR Managed Scaling previously used to scale up the cluster aggressively and conservatively scale it down to avoid negative impact to job runtimes. Although this is the right approach for SLA-sensitive workloads, it might not be optimal for customers who are fine with little delay but prefers saving cost. Now, you can configure EMR Managed Scaling behavior suitable for your workload types, and we will apply tailored optimization to intelligently add or remove nodes from the clusters. This helps you achieve the optimal price-performance for your clusters along with increased flexibility of additional user-controls.

The value you set for Advanced Scaling optimizes your cluster to your requirements. Values range from 1-100. Supported values are 1, 25, 50, 75 and 100. If you set the index to values other than these, it results in a validation error. Scaling values map to resource-utilization strategies. The following list defines several of these:

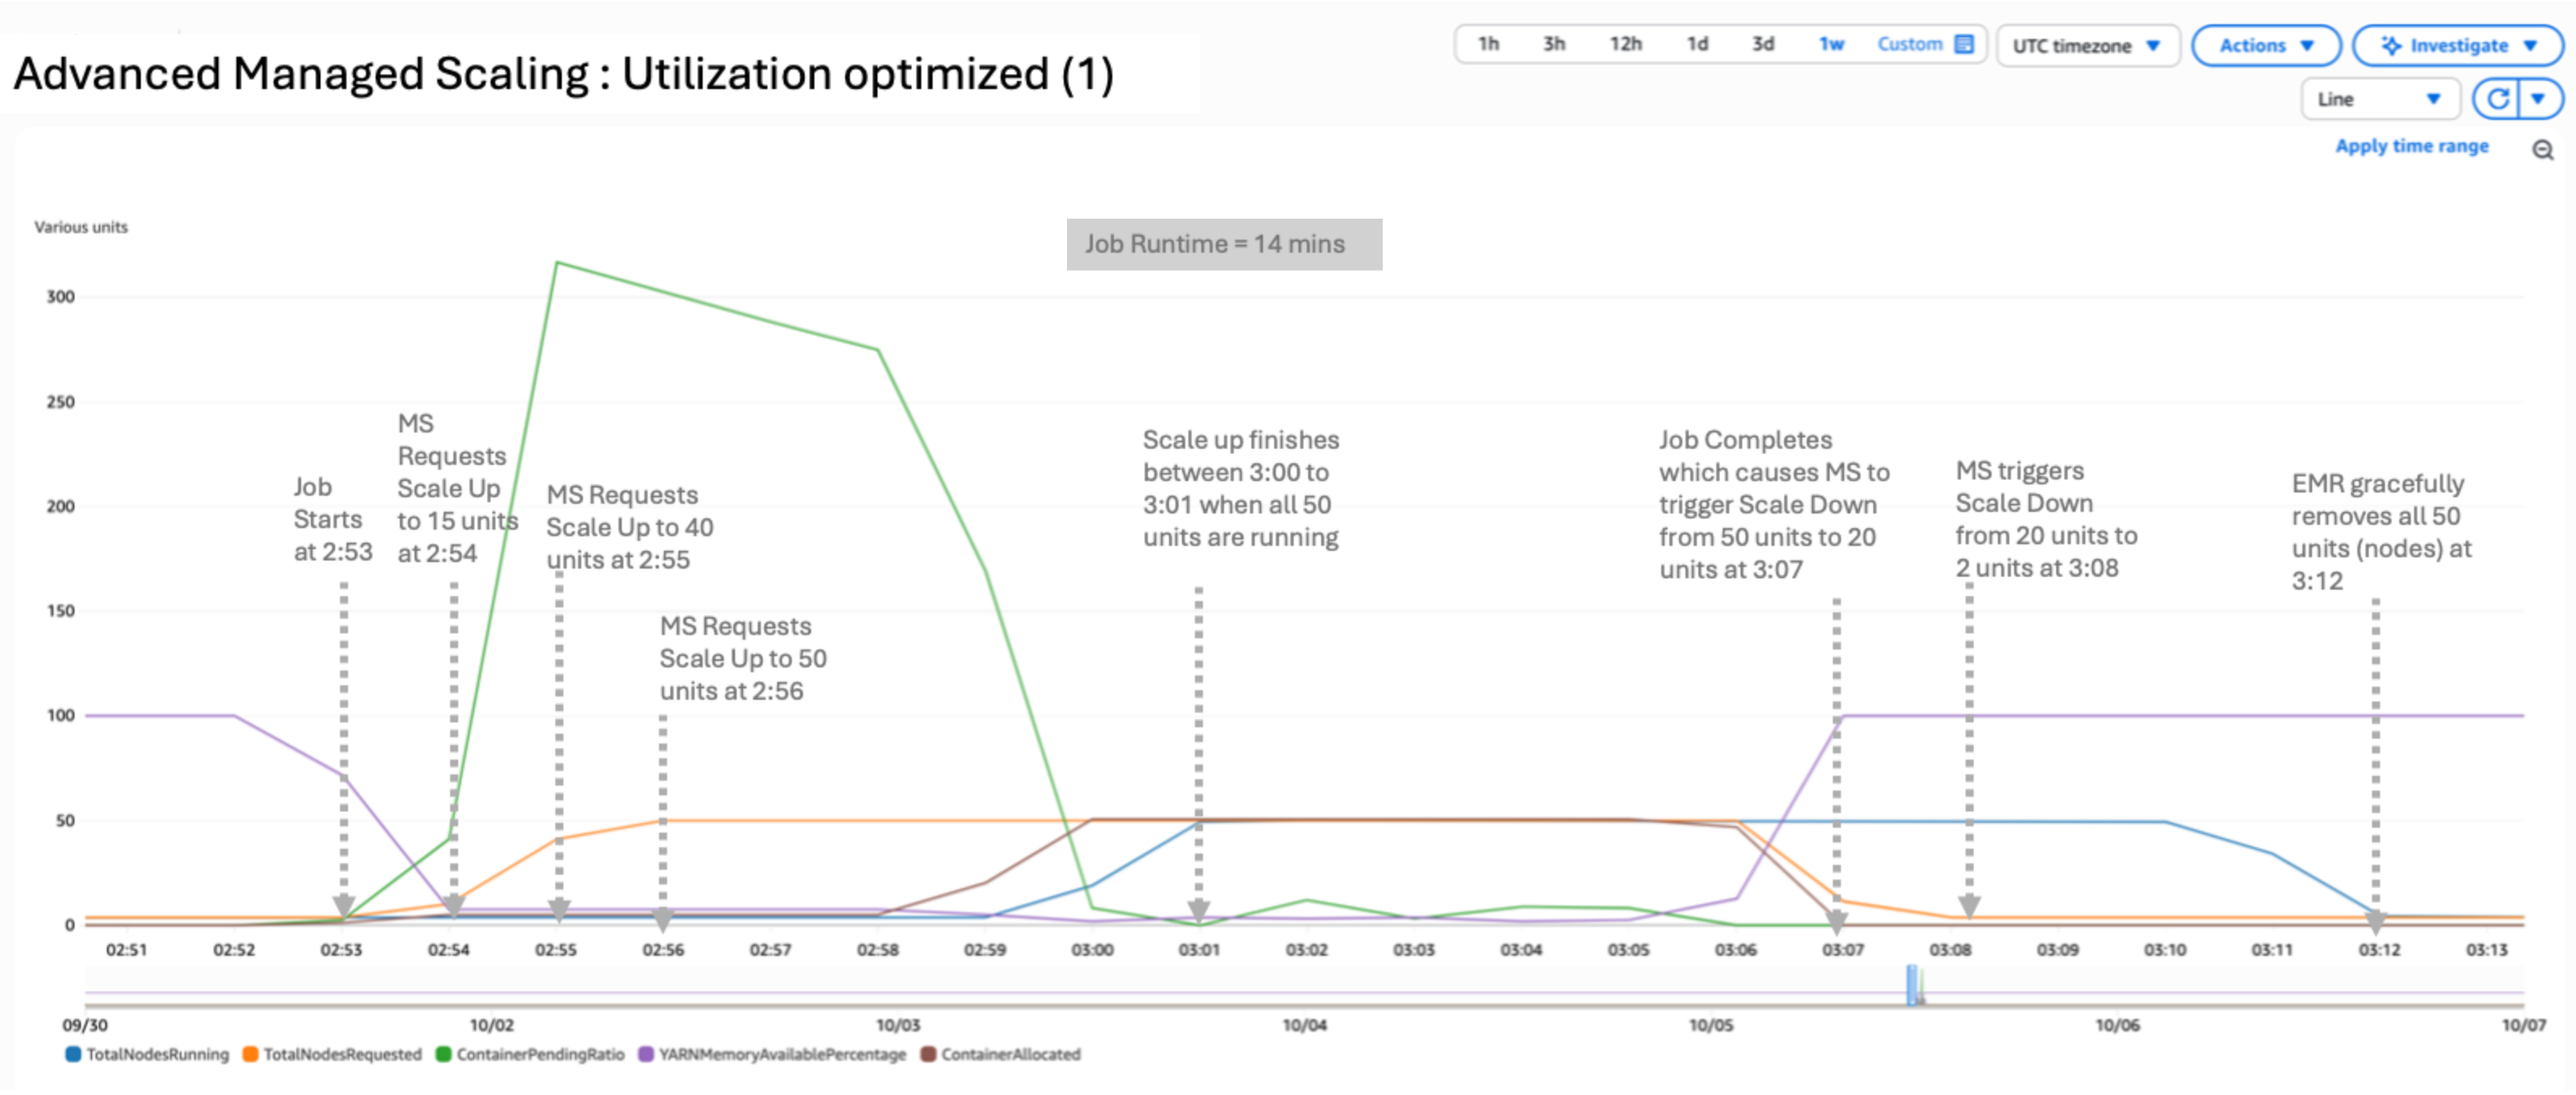
  • Utilization optimized (1) – This setting prevents resource over provisioning. Use a low value when you want to keep costs low and to prioritize efficient resource utilization. It causes the cluster to scale up less aggressively. This works well for the use case when there are regularly occurring workload spikes and you don’t want resources to ramp up too quickly.
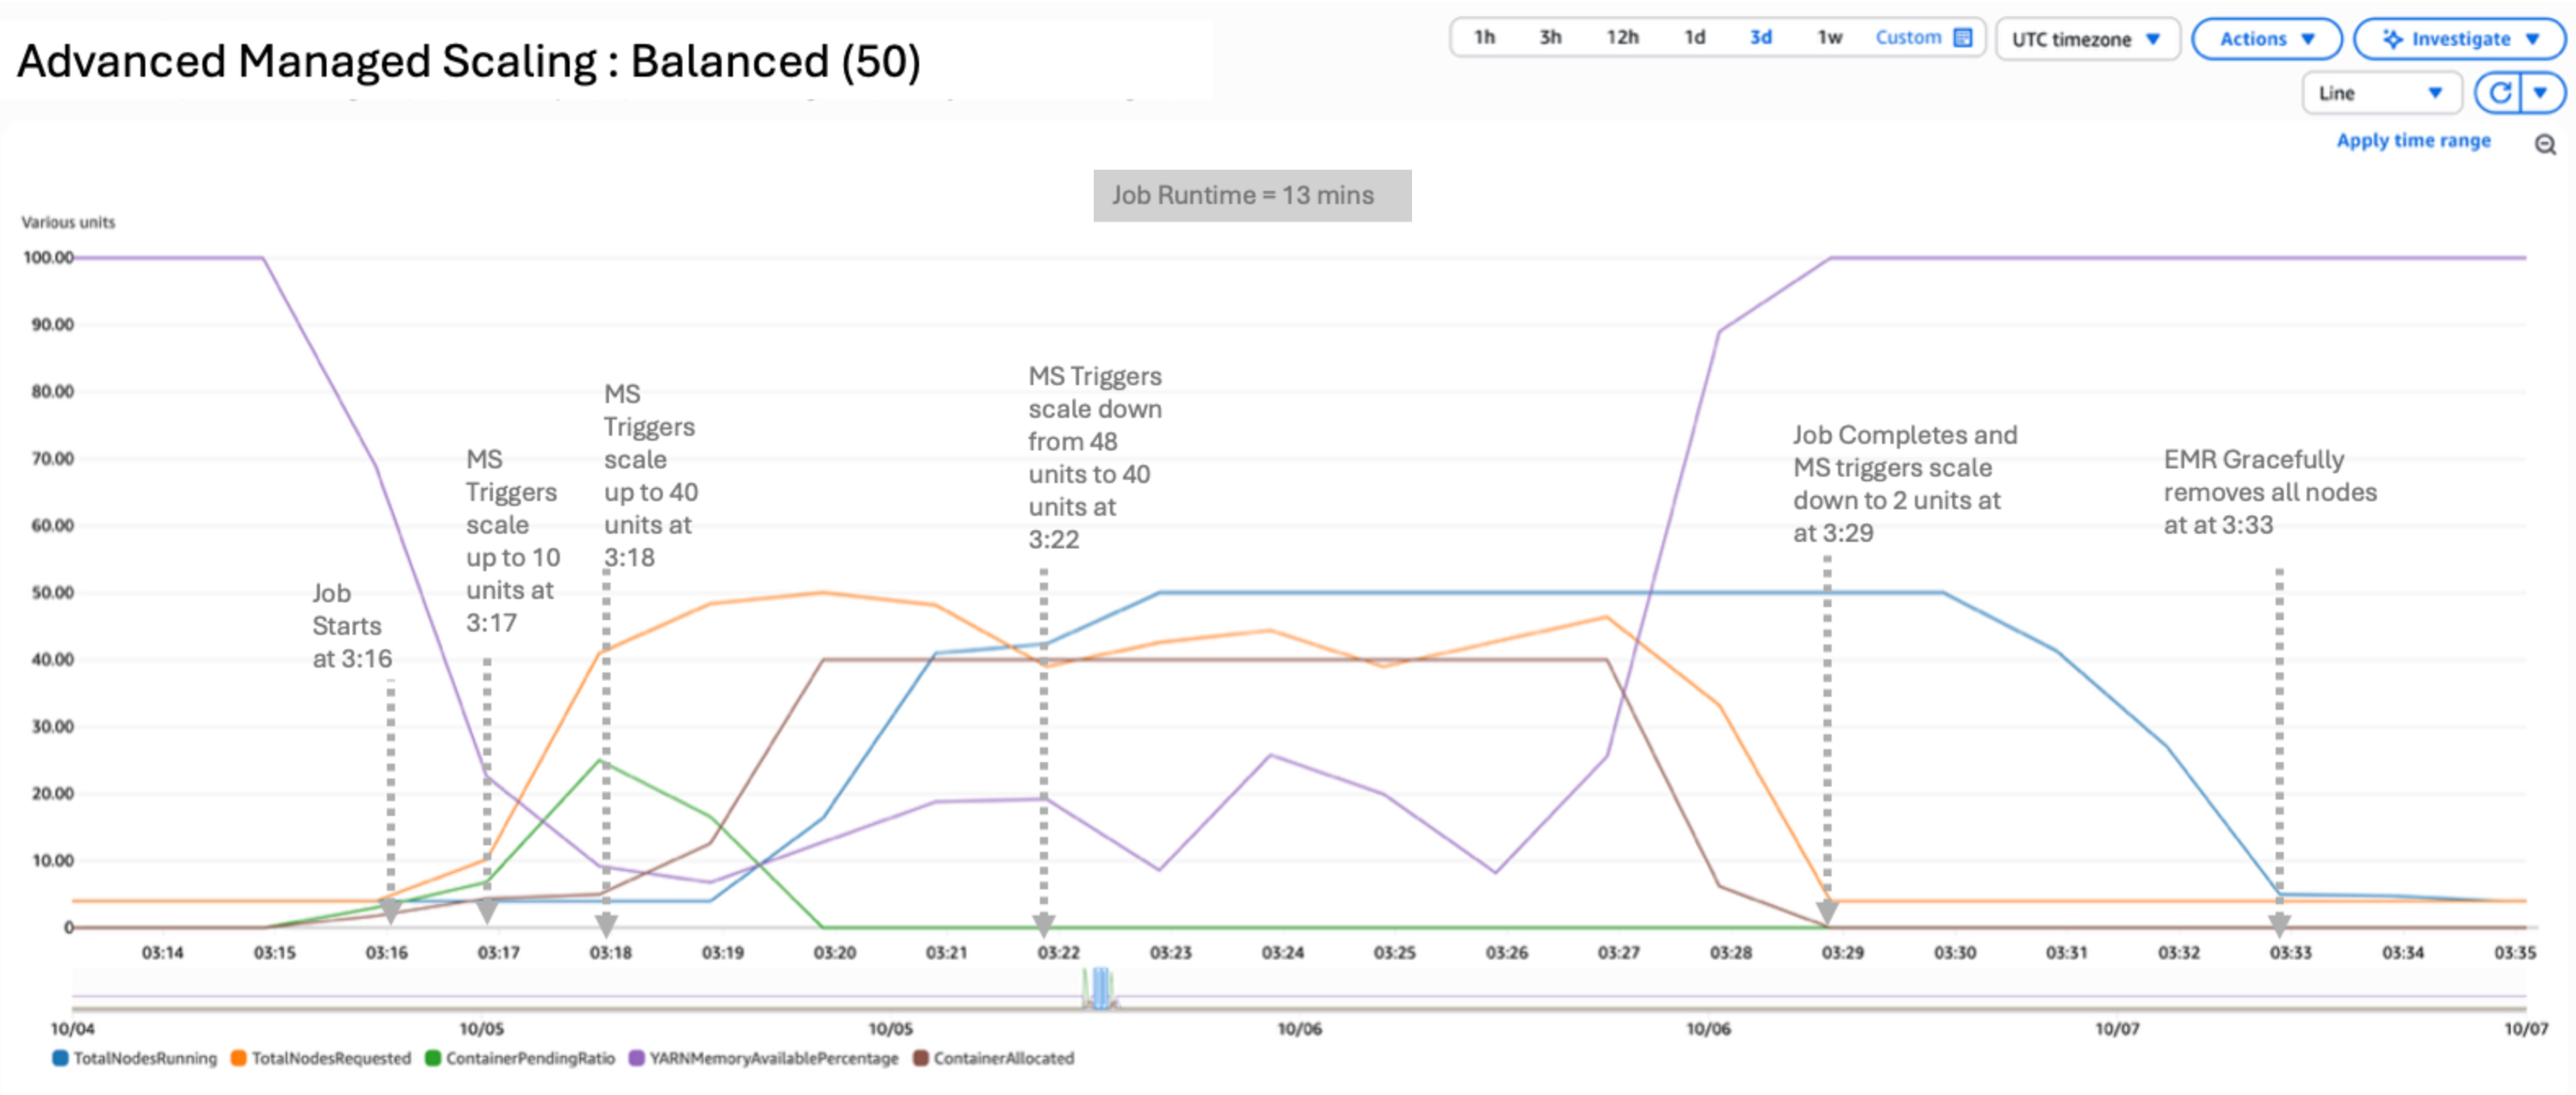
  • Balanced (50) – This balances resource utilization and job performance. This setting is suitable for steady workloads where most stages have a stable runtime. It’s also suitable for workloads with a mix of short and long-running stages. We recommend starting with this setting if you aren’t sure which to choose.
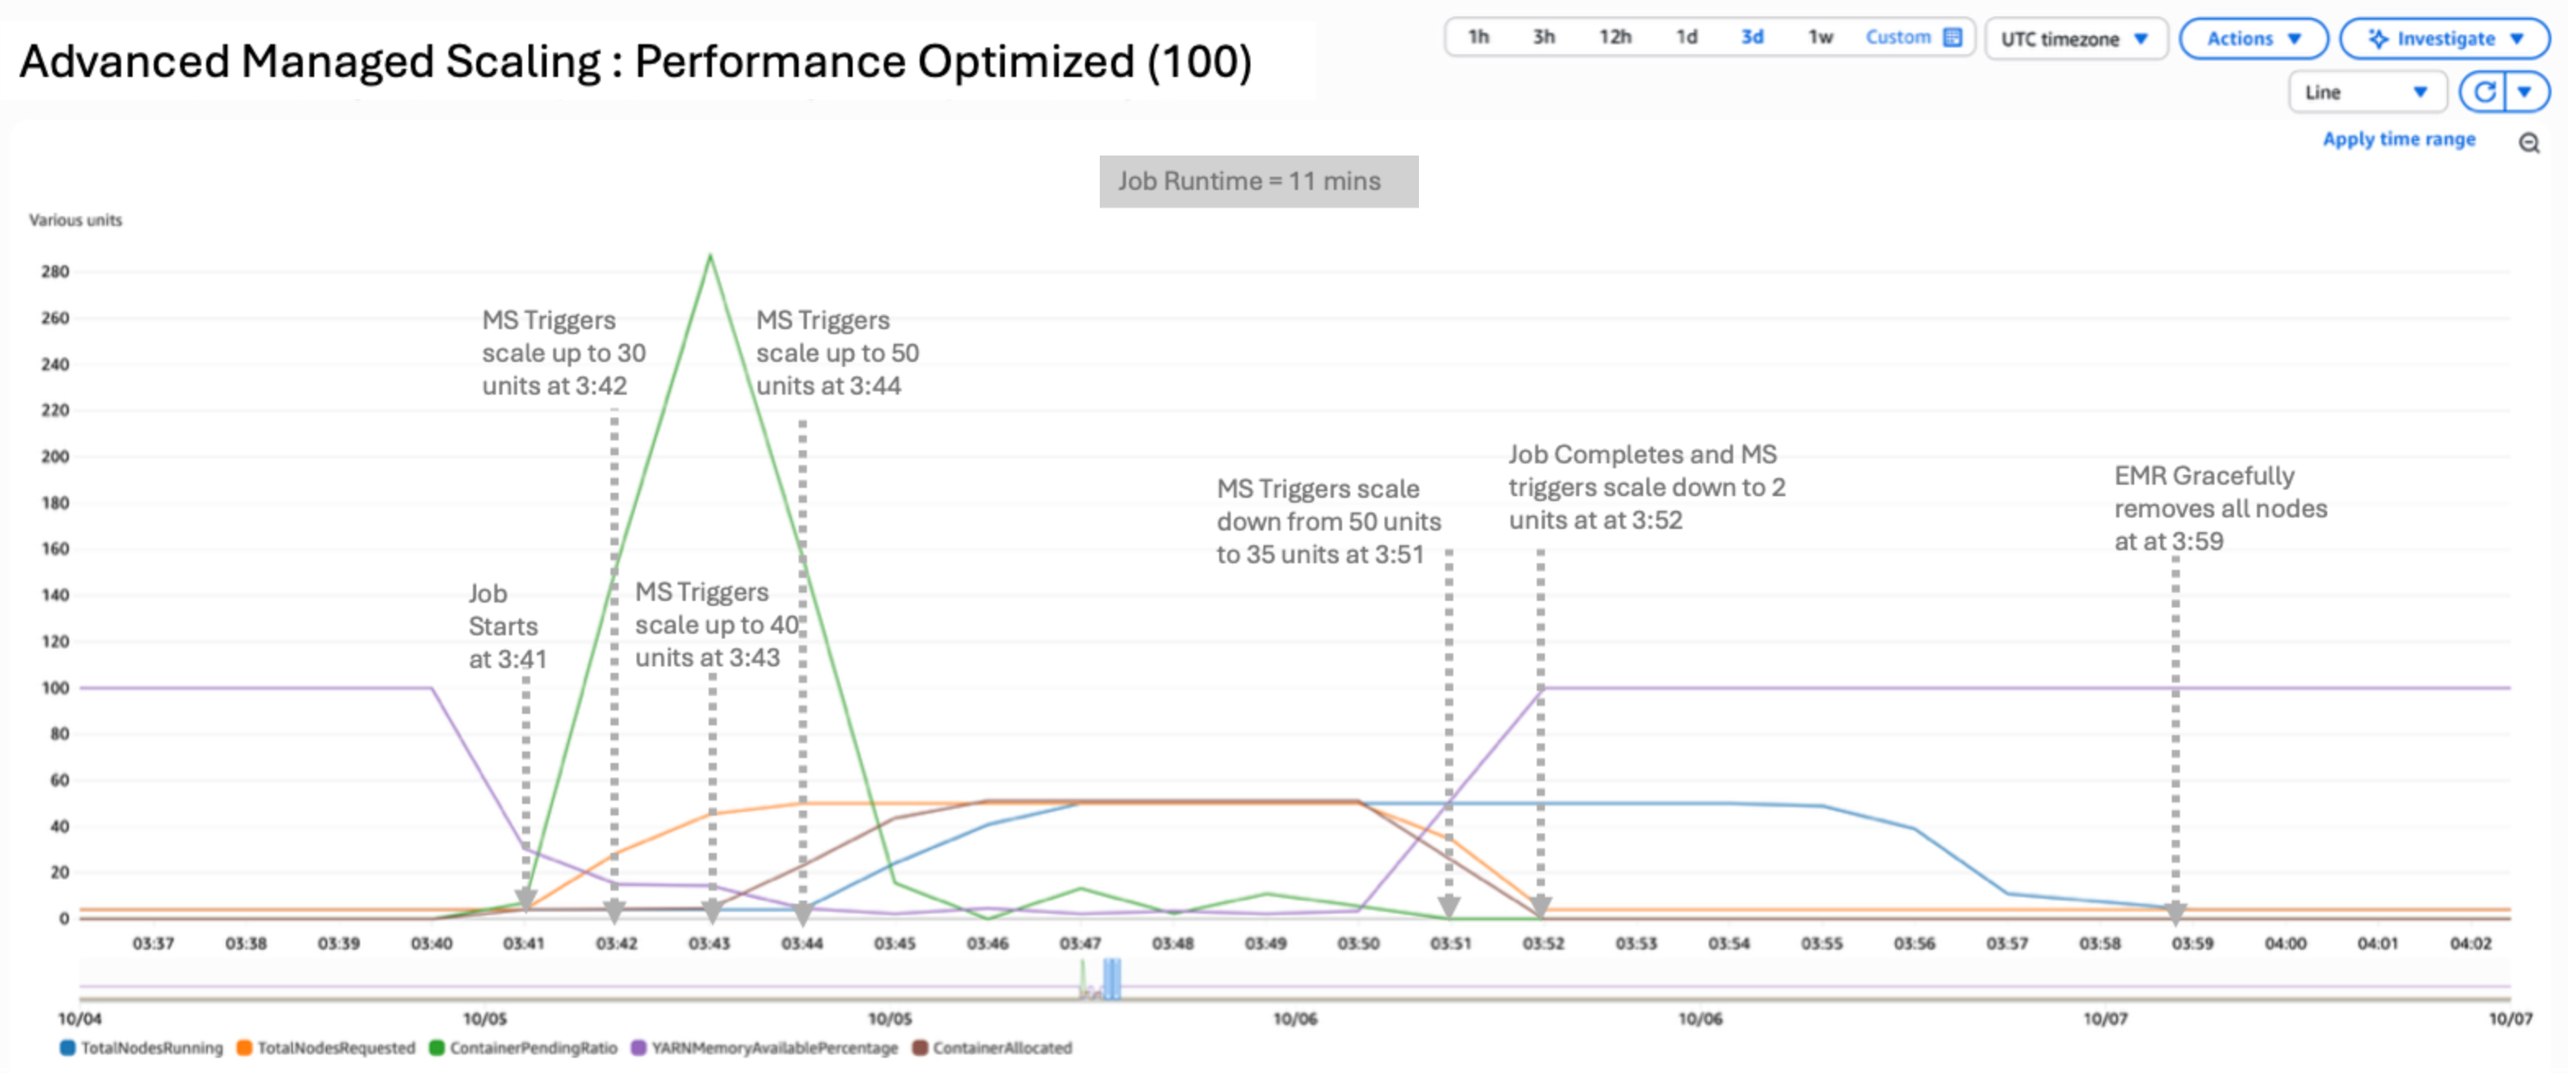
  • Performance optimized (100) – This strategy prioritizes performance. The cluster scales up aggressively to ensure that jobs complete quickly and meet performance targets. Performance optimized is suitable for service-level-agreement (SLA) sensitive workloads where fast run time is critical.

Customers can also choose intermediate values (25 and 75) for more nuanced control. The intermediate values available provide a middle ground between strategies to fine tune your cluster’s Advanced Scaling behavior.

Use cases and benefits

Amazon EMR’s Advanced Scaling feature improves cluster management by offering dynamic adaptation to diverse business requirements across industries. The feature enables strategic timing of scaling policies throughout the day, with early morning hours dedicated to workload preparation, peak business hours focusing on maximum performance, evening periods maintaining moderate scaling for post-business processing, and overnight hours optimized for cost-effective batch operations. This comprehensive approach allows organizations to fine-tune their resource allocation based on specific operational patterns, ultimately delivering an optimal balance between performance and cost-efficiency while ensuring business needs are met across different time zones and usage patterns.

Scaling configuration

In the following sections, we walk through a range of scenarios testing against a 3 TB TPC-DS dataset, then walk you through the results of testing a sample job. We wanted to evaluate how Amazon EMR would respond with advanced scaling policies in scenarios optimizing cluster utilization, balancing performance with utilization, and aggressive performance requirements.

With Advanced Scaling currently available through API and console support coming soon, we updated existing cluster configurations. We modified UtilizationPerformanceIndex with 1, 50, and 100, to correspond to the different scaling strategies using the put-managed-scaling-policy API with an advanced scaling strategy, as seen in the following examples:

Scenario 1: Utilization optimized

In this scenario, we used a utilization optimized configuration by setting UtilizationPerformanceIndex to 1:

aws emr put-managed-scaling-policy --cluster-id <'cluster-id'> \ 
  --managed-scaling-policy '{ 
  "ComputeLimits": { 
    "UnitType": "Instances", 
    "MinimumCapacityUnits": 2, 
    "MaximumCapacityUnits": 50, 
    "MaximumOnDemandCapacityUnits": 50, 
    "MaximumCoreCapacityUnits": 2 
  	}, 
  }' 

The result of the test yielded a peak of 16 nodes running and 16 requested. The scale-up and scale-down process is conservative. It takes 15 minutes to completely release the nodes after the requested metric subsides, as shown in the following figure. The job completed in 12 minutes, 39 seconds. UtilizationPerformanceIndex of 1 or 25 can be useful when the cluster is running a sequence of jobs with little to zero idle time. It can prevent frequent node churn because nodes will be available for the next set of jobs.

Scenario 2: Balanced

In this scenario, we used a balanced configuration by setting UtilizationPerformanceIndex to 50:

aws emr put-managed-scaling-policy --cluster-id <'cluster-id'> \ 
  --managed-scaling-policy '{ 
  "ComputeLimits": { 
    "UnitType": "Instances", 
    "MinimumCapacityUnits": 2, 
    "MaximumCapacityUnits": 50, 
    "MaximumOnDemandCapacityUnits": 50, 
    "MaximumCoreCapacityUnits": 2 
  	}, 
  }' 
  

The result of the test yielded a peak of 43 nodes running and 32 requested. UtilizationPerformanceIndex of 50 uses a balanced approach for scaling the resources. Nodes requested and running are higher such that you can get a better price-performance ratio. The job completed in 7 minutes, 1 second.

Scenario 3: Performance optimized

In this scenario, we used a performance optimized configuration by setting UtilizationPerformanceIndex to 100:

aws emr put-managed-scaling-policy --cluster-id <'cluster-id'> \ 
  --managed-scaling-policy '{ 
  "ComputeLimits": { 
    "UnitType": "Instances", 
    "MinimumCapacityUnits": 2, 
    "MaximumCapacityUnits": 50, 
    "MaximumOnDemandCapacityUnits": 50, 
    "MaximumCoreCapacityUnits": 2 
	  }, 
  }' 

The result of the test yielded a peak of 50 nodes running and 46 requested. UtilizationPerformanceIndex of 100 delivers the highest performance by aggressively scaling resources up and down. You can expect the highest nodes requested and running in this configuration. Scale-down will closely follow the node requested metric and therefore can lead to frequent churn of nodes if there are short idle periods between job submissions. This setting is ideal for latency-sensitive workloads that need to finish under SLA. The example job completed in 6 minutes, 16 seconds.

Comparison

The following table summarizes the differences between these scaling methods and time taken for each.

Scaling Method Utilization Index Peak Total Nodes Requested Peak Total Nodes Running Job Run Time (Seconds) Cost to Run job Use Case
Scenario1 – Utilization optimized 1 16 16 759 Low Workloads with regular spikes; prioritizes cost efficiency with conservative scaling
Scenario 2 – Balanced 50 32 43 421 Medium Steady workloads with mixed stage durations; recommended starting point
Scenario 3 – Performance Optimized 100 46 50 376 High SLA-sensitive workloads requiring fast completion times

Advanced Managed Scaling in Amazon EMR introduces a more nuanced approach to cluster management through the customized scaling strategies to meet your business requirements. This spectrum offers fine-grained control over how clusters respond to workload demands. At one end, with a utilization optimized configuration of 1, the system prioritizes efficient resource usage, scaling up conservatively to maintain cost-effectiveness and taking advantage of existing cluster resources. In the balanced configuration at 50, the strategy aims to strike an equilibrium between resource utilization and job performance. To meet performance SLAs, the performance optimized value of 100 showed aggressive scaling responding to increased demand for resources quickly, regardless of resource consumption. This granular control helps you fine-tune your cluster’s behavior based on your specific needs, balancing cost, efficiency, and performance.

Conclusion

To Summarize, Advanced Scaling for Amazon EMR represents an advancement in cluster management, offering greater control and efficiency. By fine-tuning your clusters’ behavior, you can achieve more cost-effective and performant big data processing. We encourage you to try this new feature and discover how it can optimize your EMR workloads. Start by experimenting with different UtilizationPerformanceIndex values and closely monitor your cluster’s performance and cost metrics. Over time, you will be able to find the perfect balance that meets your specific needs.

To learn more about Amazon EMR Managed Scaling and Advanced Scaling, refer to our documentation. We’re excited to see how you use this new capability to enhance your big data processing on AWS, and we look forward to your feedback as we continue to evolve and improve our services.


About the authors

Amit Maindola

Amit is a Senior Data Architect with AWS ProServe team focused on data engineering, analytics, and AI/ML at AWS. He helps customers in their digital transformation journey and enables them to build highly scalable, robust, and secure cloud-based analytical solutions on AWS to gain timely insights and make critical business decisions.

Bret Pontillo

Bret is a Sr. Solutions Architect at AWS. He works closely with enterprise customers building data lakes and analytical applications on the AWS platform. In his free time, Bret enjoys traveling, watching sports, and trying new restaurants.

Vishal Vyas

Vishal is a Principal Software Development Engineer at Amazon Web Services.

Mukesh Punhani

Mukesh is a Senior Software Manager at Amazon Web Services.

Build AWS Glue Data Quality pipeline using Terraform

Post Syndicated from Viquar Khan original https://aws.amazon.com/blogs/big-data/build-aws-glue-data-quality-pipeline-using-terraform/

AWS Glue Data Quality is a feature of AWS Glue that helps maintain trust in your data and support better decision-making and analytics across your organization. It allows users to define, monitor, and enforce data quality rules across their data lakes and data pipelines. With AWS Glue Data Quality, you can automatically detect anomalies, validate data against predefined rules, and generate quality scores for your datasets. This feature provides flexibility in how you validate your data – you can incorporate quality checks into your ETL processes for transformation-time validation, or validate data directly against cataloged tables for ongoing data lake monitoring. By leveraging machine learning, it can also suggest data quality rules based on your data patterns.

You can use Terraform, an open source Infrastructure as Code (IaC) tool developed by HashiCorp, to deploy AWS Glue Data Quality pipelines.

It allows developers and operations teams to define, provision, and manage cloud infrastructure using a declarative language. With Terraform, you can version, share, and reuse your infrastructure code across multiple cloud providers and services. Its powerful state management and planning capabilities enable teams to collaborate efficiently and maintain consistent infrastructure across different environments.

Using Terraform to deploy AWS Glue Data Quality pipeline enables IaC best practices to ensure consistent, version controlled and repeatable deployments across multiple environments, while fostering collaboration and reducing errors due to manual configuration.

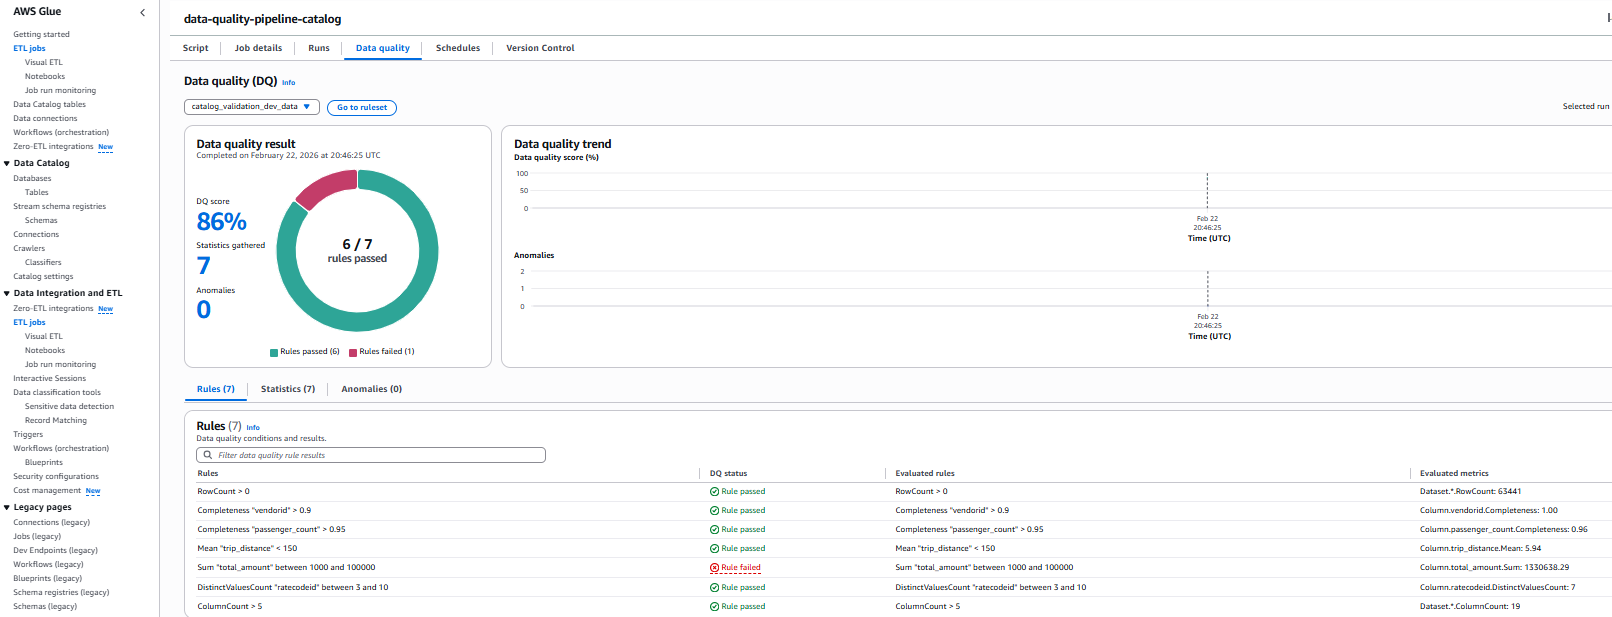
In this post, we explore two complementary methods for implementing AWS Glue Data Quality using Terraform:

  1. ETL-based Data Quality – Validates data during ETL (Extract, Transform, Load) job execution, generating detailed quality metrics and row-level validation outputs
  2. Catalog-based Data Quality – Validates data directly against Glue Data Catalog tables without requiring ETL execution, ideal for monitoring data at rest

Solution overview

This post demonstrates how to implement AWS Glue Data Quality pipelines using Terraform using two complementary approaches mentioned above to ensure comprehensive data quality across your data lake.

We’ll use the NYC yellow taxi trip data, a real-world public dataset, to illustrate data quality validation and monitoring capabilities. The pipeline ingests parquet-formatted taxi trip data from Amazon Simple Storage Service (Amazon S3) and applies comprehensive data quality rules that validate data completeness, accuracy, and consistency across various trip attributes.

Method 1: ETL-based Data Quality

ETL-based Data Quality validates data during Extract, Transform, Load (ETL) job execution. This approach is ideal for:

  • Validating data as it moves through transformation pipelines
  • Applying quality checks during data processing workflows
  • Generating row-level validation outputs alongside transformed data

The pipeline generates two key outputs:

  • Data Quality Results – Detailed quality metrics and rule evaluation outcomes stored in the dqresults/ folder, providing insights into data quality trends and anomalies
  • Row-Level Validation – Individual records with their corresponding quality check results written to the processed/ folder, enabling granular analysis of data quality issues

Method 2: Catalog-based Data Quality

Catalog-based Data Quality validates data quality rules directly against AWS Glue Data Catalog tables without requiring ETL job execution. This approach is ideal for:

  • Validating data at rest in the data lake
  • Running scheduled data quality checks independent of ETL pipelines
  • Monitoring data quality across multiple tables in a database

Architecture overview

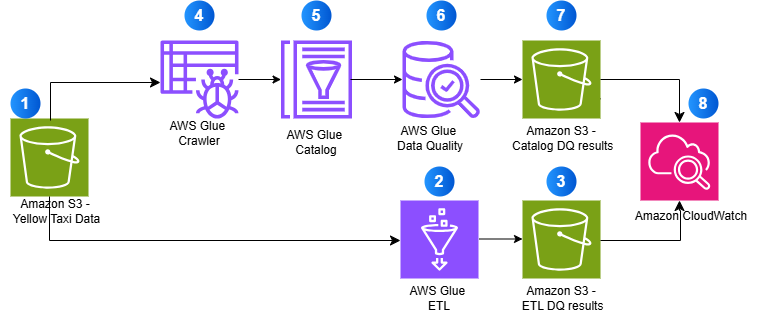
The following diagram illustrates how both approaches work together to provide comprehensive data quality validation:

  1. Source data stored in Amazon S3 (Yellow Taxi Data)
  2. AWS Glue ETL processes data with quality checks
  3. ETL validation results are stored in S3
  4. AWS Glue Crawler discovers schema
  5. Metadata is stored in AWS Glue Catalog
  6. AWS Glue Data Quality validates catalog tables
  7. Catalog validation results are stored in S3
  8. Amazon CloudWatch monitors all operations

By using AWS Glue’s serverless ETL capabilities and Terraform’s infrastructure-as-code approach, this solution provides a scalable, maintainable, and automated framework for ensuring data quality in your analytics pipeline.

Prerequisites:

Solution Implementation

Complete the following steps to build AWS Glue Data Quality pipeline using Terraform:

Clone the Repository

This post includes a GitHub repository that generates the following resources when deployed. To clone the repository, run the following command in your terminal:

git clone https://github.com/aws-samples/sample-build-aws-glue-data-quality-pipeline-using-terraform.git
cd sample-build-aws-glue-data-quality-pipeline-using-terraform

Core Infrastructure:

  • Amazon S3 bucket: glue-data-quality-{AWS AccountID}-{env} with AES256 encryption
  • Sample NYC taxi dataset (sample-data.parquet) automatically uploaded to the data/ folder
  • AWS Identity and Access Management (IAM) role: aws-glue-data-quality-role-{env} with Glue execution permissions and S3 read/write access
  • CloudWatch dashboard: glue-data-quality-{env} for monitoring job execution and data quality metrics
  • CloudWatch Log Groups for job logging with configurable retention

ETL-Based Data Quality Resources:

  • AWS Glue ETL job: data-quality-pipeline with 8 comprehensive validation rules
  • Python script: GlueDataQualityDynamicRules.py stored in glue-scripts/ folder
  • Results storage in dqresults/ folder with detailed rule outcomes
  • Row-level validation outputs in processed/ folder
  • Optional scheduled triggers for automated execution
  • CloudWatch alarm: etl-glue-data-quality-failure-{env} for monitoring job failures

Catalog-Based Data Quality Resources (Optional – when catalog_dq_enabled = true):

  • Glue Database: {catalog_database_name} for catalog table management
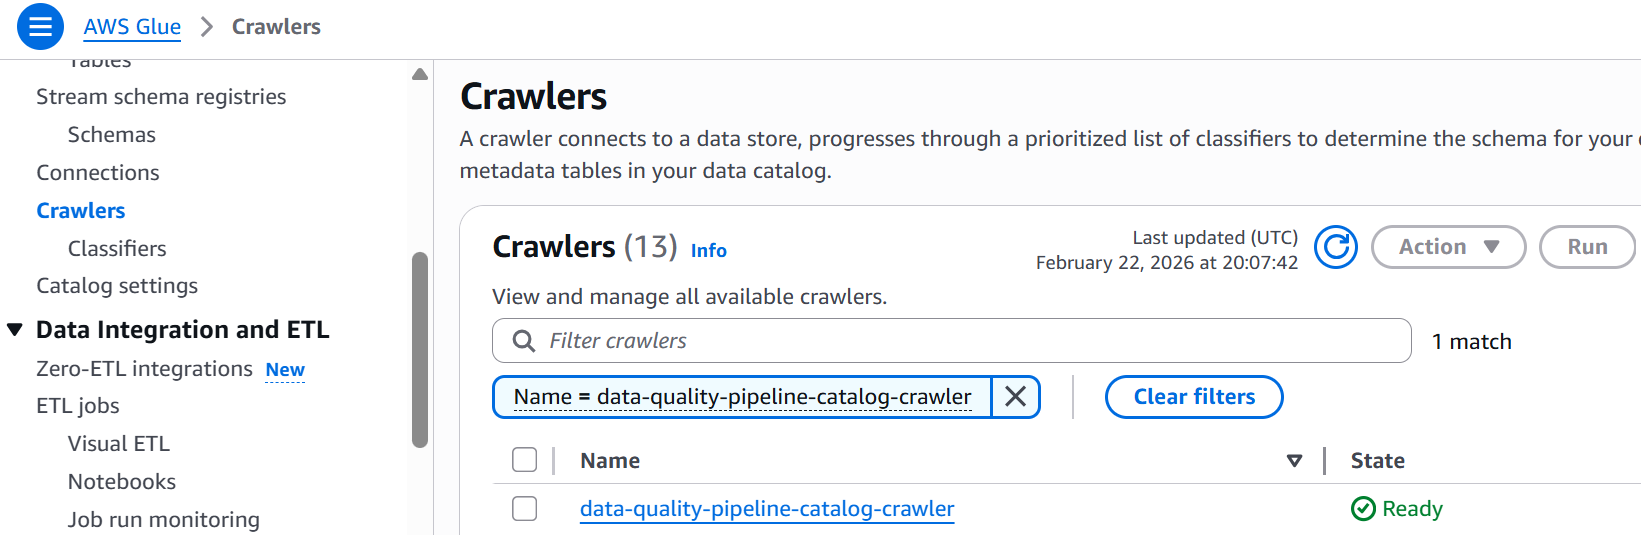
  • Glue Crawler: {job_name}-catalog-crawler for automatic schema discovery from S3 data
  • Crawler schedule trigger for automated execution (default: daily at 4 AM)
  • Glue Catalog Tables automatically discovered and created by the crawler
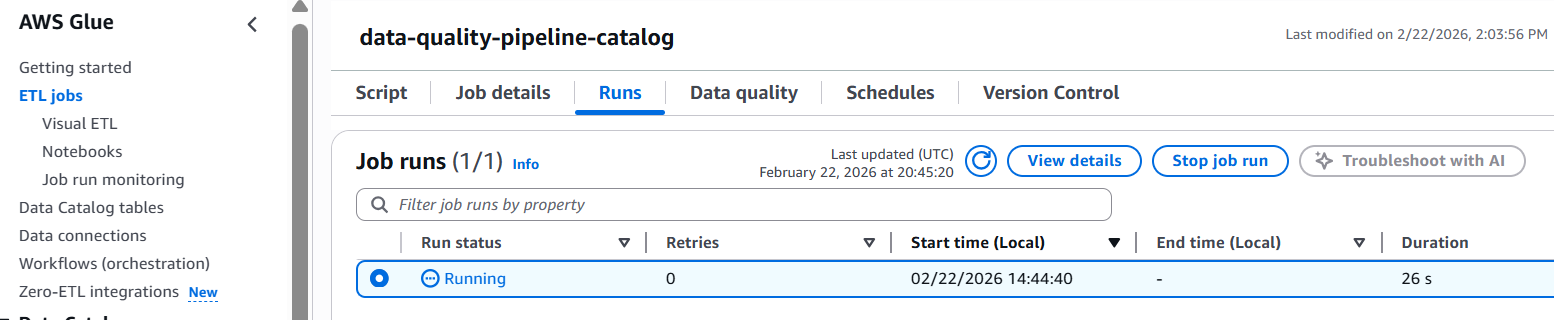
  • Catalog Data Quality job: {job_name}-catalog with 7 catalog-specific validation rules
  • Python script: CatalogDataQuality.py for catalog validation
  • Results storage in catalog-dq-results/ folder partitioned by table name
  • Catalog DQ schedule trigger for automated validation (default: daily at 6 AM)
  • CloudWatch alarm: catalog-glue-data-quality-failure-{env} for monitoring catalog job failures
  • Enhanced CloudWatch dashboard widgets for crawler status and catalog metrics

Review the Glue Data Quality Job Script

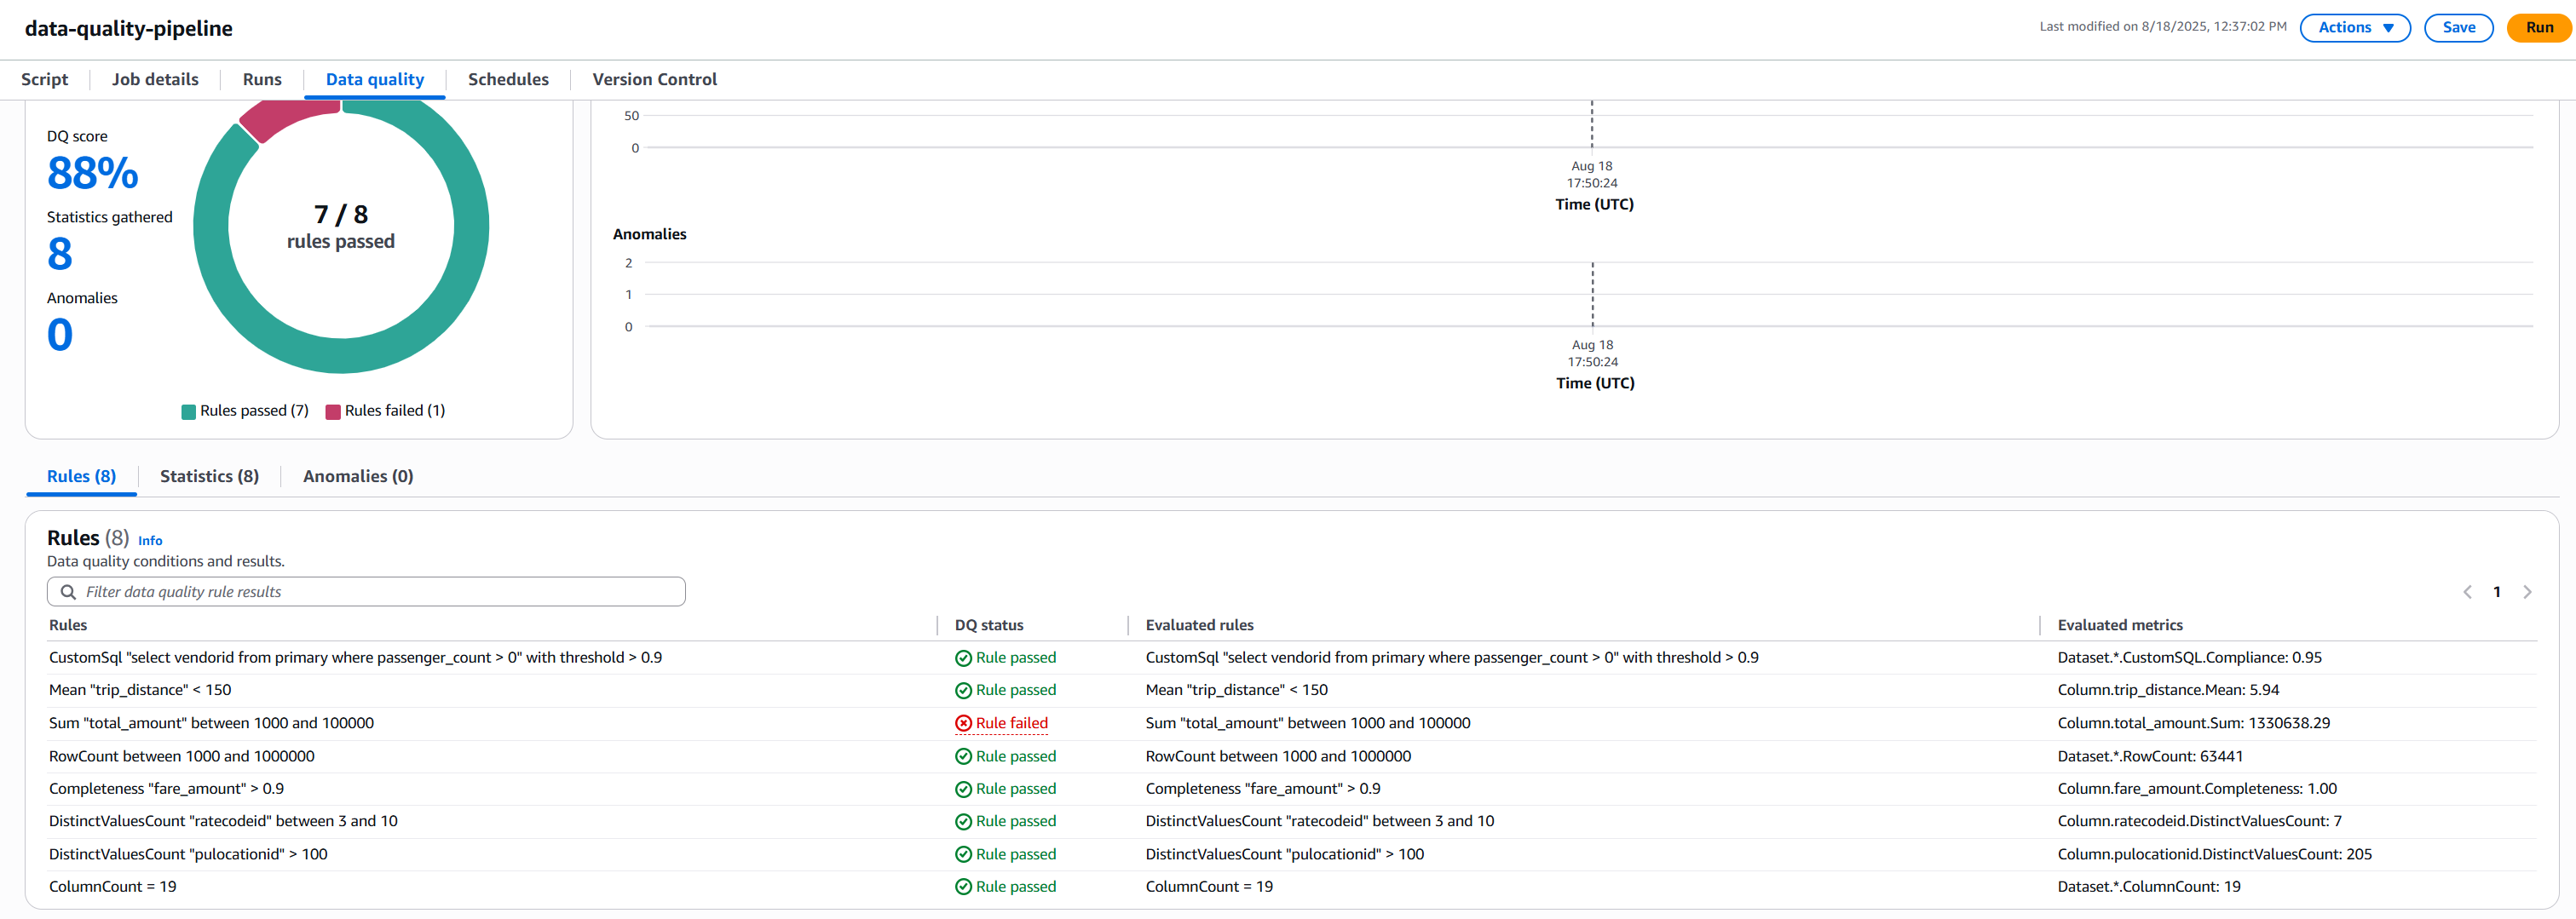
Review the Glue Data Quality job script GlueDataQualityDynamicRules.py located in the folder scripts, which has the following rules:

Rules = [
    CustomSql "select vendorid from primary where passenger_count > 0" with threshold > 0.9,
    Mean "trip_distance" < 150,
    Sum "total_amount" between 1000 and 100000,
    RowCount between 1000 and 1000000,
    Completeness "fare_amount" > 0.9,
    DistinctValuesCount "ratecodeid" between 3 and 10,
    DistinctValuesCount "pulocationid" > 100,
    ColumnCount = 19
]

Brief explanation of rules for NY Taxi data is as follows:

Rule Type Condition Description
CustomSql “select vendorid from primary where passenger_count > 0” with threshold > 0.9 Checks if at least 90% of rides have at least one passenger
Mean “trip_distance” < 150 Ensures the average trip distance is less than 150 miles
Sum “total_amount” between 1000 and 100000 Verifies that total revenue from all trips falls within this range
RowCount between 1000 and 1000000 Checks if the dataset has between 1,000 and 1 million records
Completeness “fare_amount” > 0.9 Ensures over 90% of records have a fare amount
DistinctValuesCount “ratecodeid” between 3 and 10 Verifies rate codes fall between 3-10 unique values
DistinctValuesCount “pulocationid” > 100 Checks if there are over 100 unique pickup locations
ColumnCount 19 Validates that dataset has exactly 19 columns

These rules together ensure data quality by validating volume, completeness, reasonable values and proper structure of the taxi trip data.

Configure Terraform Variables

Before deploying the infrastructure, configure your Terraform variables in the terraform.tfvars file located in the examples directory. This configuration determines which features will be deployed – ETL-based Data Quality only, or both ETL-based and Catalog-based Data Quality.

Basic Configuration

The solution uses default values for most settings, but you can customize the following in your terraform.tfvars file:

  • AWS Region – The AWS region where resources will be deployed
  • Environment – Environment identifier (such as, “dev”, “prod”) used in resource naming
  • Job Name – Name for the Glue job (default: data-quality-pipeline)

Enable Catalog-Based Data Quality

By default, the solution deploys only ETL-based Data Quality. To enable Catalog-based Data Quality validation, add the following configuration to your terraform.tfvars file:

# Enable Catalog-based Data Quality
catalog_dq_enabled = true

# Glue Database name for catalog tables
catalog_database_name = "taxi_data_catalog"

# S3 paths containing parquet data for catalog table creation
s3_data_paths = ["data/"]

# Optional: Specific table names to validate (empty = all tables in database)
catalog_table_names = []

# Data quality rules for catalog validation
catalog_dq_rules = <<EOF
Rules = [
  RowCount > 0,
  Completeness "vendorid" > 0.9,
  Completeness "passenger_count" > 0.95,
  Mean "trip_distance" < 150,
  ColumnCount > 5
]
EOF

# Enable scheduled execution for catalog data quality
catalog_enable_schedule = false
catalog_schedule_expression = "cron(0 6 * * ? *)"

# Crawler schedule for automatic table discovery
catalog_crawler_schedule = "cron(0 4 * * ? *)"

Configuration Notes:

  • catalog_dq_enabled – Set to true to enable Catalog-based validation alongside ETL-based validation,which will deploy both ETL and Catalog validation
  • catalog_database_name – Name of the Glue database that will be created for catalog tables
  • s3_data_paths – S3 folders containing parquet data that the Glue Crawler will discover
  • catalog_table_names – Leave empty to validate all tables, or specify specific table names
  • catalog_dq_rules – Define validation rules specific to catalog tables (can differ from ETL rules)
  • catalog_enable_schedule – Set to true to enable automatic scheduled execution
  • Schedule expressions – Use cron format for automated execution (crawler runs before DQ job)

Once you’ve configured your variables, save the terraform.tfvars file and proceed to the next step.

Set Up AWS CLI Authentication

Before you can interact with AWS services using the command line, you need to set up and authenticate the AWS CLI. This section guides you through the process of configuring your AWS CLI and verifying your authentication. Follow these steps to ensure you have the necessary permissions to access AWS resources.

  1. Open your terminal or command prompt.
  2. Set up authentication in the AWS CLI. You need administrator permissions to set up this environment.
    aws configure

  3. To test if your AWS CLI is working and you’re authenticated, run the following command:
    aws sts get-caller-identity --output json

    The output should look similar to the following:

    {
       "UserId": "UUID123123:your_user",
      "Account": "111122223333",
    "Arn": "arn:aws:sts::111122223333:assumed-role/some-role/your_user"
     }

Deploy with Terraform

Follow these steps to deploy your infrastructure using Terraform. This process will initialize your working directory, review planned changes, and apply your infrastructure configuration to AWS.

To deploy with Terraform, navigate to the examples folder by running the following command in your CLI from inside the repository

cd .\examples

Run the following bash commands:

terraform init
 

Initializes a Terraform working directory, downloads required provider plugins, and sets up the backend for storing state.

On success you will receive output Terraform has been successfully initialized!

terraform plan
 

Creates an execution plan, shows what changes Terraform will make to your infrastructure. This command doesn’t make any changes.

terraform apply
 

Deploys infrastructure and code to the AWS Account. By default, it asks for confirmation before making any changes. Use ‘terraform apply -auto-approve’ to skip the confirmation step.

When prompted with ‘Do you want to perform these actions?’, type ‘yes’ and press Enter to confirm and allow Terraform to execute the described actions.

Upon successful execution, the system will display ‘Apply complete!’ message.

Run the AWS Glue Data Quality Pipeline

After deploying the infrastructure with Terraform, you can validate data quality using two methods – ETL-based and Catalog-based. Each method serves different use cases and can be run independently or together.

Method 1: Run the ETL-Based Data Quality Job

ETL-based data quality validates data during the transformation process, making it ideal for catching issues early in your data pipeline.

Steps to execute:

  1. Navigate to the AWS Glue Console and select ETL Jobs from the left navigation panel
  2. Locate and select the job named data-quality-pipeline
  3. Choose Run to start the job execution
  4. Monitor the job status – it typically completes in 2-3 minutes
  5. Review the results:
    • Once completed, click on the Data Quality tab to review the validation results.

      The following screenshot shows the results.

    • Understanding AWS Glue Data Quality Results: NYC Taxi Data Example.

      Rule Results Summary

      • We had 8 total rules
      • 7 rules passed
      • 1 rule failed
      Rule Rule Condition Status Pass/Fail Reason
      Passenger Count Check At least 90% of rides should have at least one passenger Passed 95% of rides had passengers, exceeding 90% threshold
      Trip Distance Average trip < 150 miles Passed Average was 5.94 miles, well below 150-mile limit
      Row Count Between 1,000 and 1,000,000 records Passed 63,441 records fell within required range
      Fare Amount Completeness 90% of records should have fare amounts Passed 100% completeness exceeded 90% requirement
      Rate Code Variety Between 3-10 different rate codes Passed 7 unique codes fell within acceptable range
      Pickup Locations More than 100 different pickup locations Passed 205 locations exceeded minimum requirement
      Column Count Exactly 19 columns Passed Exact match at 19 columns
      Total Amount Range Sum of all fares between $1,000 and $100,000 Failed Total of $130,638.29 exceeded maximum limit
    • Check the S3 bucket for detailed outputs:
      • Data Quality metrics: s3://glue-data-quality-{AccountID}-{env}/dqresults/
      • Row-level validation: s3://glue-data-quality-{AccountID}-{env}/processed/

The job processes the NYC taxi data and applies all 8 validation rules during the ETL execution. You’ll see a quality score along with detailed metrics for each rule.

Method 2: Run the Catalog-Based Data Quality Pipeline

Catalog-based data quality validates data at rest in your data lake, independent of ETL processing. This method requires the Glue Crawler to first discover and catalog your data.

  1. Run the Glue Crawler (first-time setup or when schema changes):
    • Navigate to AWS Glue Console and select Crawlers
    • Locate data-quality-pipeline-catalog-crawler
    • Select data-quality-pipeline-catalog-crawler checkbox and click Run and wait for completion (1-2 minutes)
    • Verify the table was created in your Glue database
  2. Run the Catalog Data Quality Job:
    • Navigate to the AWS Glue Console and select ETL Jobs from the left navigation panel
    • Select the job named data-quality-pipeline-catalog
    • Click Run job to execute the validation
    • Monitor the job status until completion

  3. Review the results:
    • Once completed, click on the Data Quality tab to review the validation results.

      The following screenshot shows the results.

      Rule Results Summary

      • We had 7 total rules
      • 6 rules passed
      • 1 rule failed
      Rule Rule Condition Status Pass/Fail Reason
      Row Count Row count should be greater than zero Passed 63441 rows present in the source data file
      Completeness “vendorid” 90% of records should have vendorid Passed 100% completeness exceeded 90% requirement
      Completeness “passenger_count” 95% of records should have vendorid Passed 96% completeness exceeded 95% requirement
      Mean “trip_distance” Mean “trip_distance” < 150 Passed trip_distance.Mean: 5.94 which is less than threshold 150
      Sum “total_amount” Sum “total_amount” between 1000 and 100000 Failed total_amount.Sum: 1330638.29 which does not satisfy condition
      Distinct vale count “ratecodeid” DistinctValuesCount “ratecodeid” between 3 and 10 Passed ratecodeid.DistinctValuesCount: 7, satisfies condition
      Column Count Greater than 5 columns Passed ColumnCount: 19, satisfies condition
    • Check the S3 bucket for detailed outputs s3://glue-data-quality-{AccountID}-{env}/catalog-dq-results/

Catalog vs ETL Data Quality Comparison

Feature ETL Data Quality Catalog Data Quality
Execution Context Validates data during ETL job processing Validates data against catalog tables at rest
Data Source Reads directly from S3 files (parquet format) Queries Glue Data Catalog tables
Results Location s3://…/dqresults/ s3://…/catalog-dq-results/
Primary Use Case Validate data quality during transformation pipelines Monitor data lake quality independent of ETL workflows
Execution Trigger Runs as part of Glue ETL job execution Runs independently as scheduled Data Quality job
Scheduling Configured via Glue job schedule or on-demand Configured via Data Quality job schedule or on-demand
Table Discovery Manual – requires explicit S3 path configuration Automatic – Glue Crawler discovers schema and creates tables
Schema Management Defined in ETL job script Managed by Glue Data Catalog
Output Format Data Quality metrics + row-level validation outputs Data Quality metrics only
Best For Catching issues early in data pipelines Ongoing monitoring of data at rest in data lakes
Dependencies Requires ETL job execution Requires Glue Crawler to run first
CloudWatch Integration Job-level metrics and logs Data Quality-specific metrics and logs

Monitoring and Troubleshooting

Both data quality methods automatically send metrics and logs to Amazon CloudWatch. You can set up alarms to notify you when quality scores drop below acceptable thresholds.

Clean up

To avoid incurring unnecessary AWS charges, make sure to delete all resources created during this tutorial. Ensure you have backed up any important data before running these commands, as this will permanently delete the resources and their associated data. To destroy all resources created as part of this blog, run following command in your terminal:

terraform destroy

Conclusion

In this blog post, we demonstrated how to build and deploy a scalable data quality pipeline using AWS Glue Data Quality and Terraform. The solution implements two validation methods:

  1. ETL-based Data Quality – Integrated validation during ETL job execution for transformation pipeline quality assurance
  2. Catalog-based Data Quality – Independent validation against Glue Data Catalog tables for data lake quality monitoring

By implementing data quality checks on NYC taxi trip data, we showed how organizations can automate their data validation processes and maintain data integrity at scale. The combination of AWS Glue’s serverless architecture and Terraform’s infrastructure-as-code capabilities provides a powerful framework for implementing reproducible, version-controlled data quality solutions. This approach not only helps teams catch data issues early but also enables them to maintain consistent data quality standards across different environments. Whether you’re dealing with small datasets or processing massive amounts of data, this solution can be adapted to meet your organization’s specific data quality requirements. As data quality continues to be a crucial aspect of successful data initiatives, implementing automated quality checks using AWS Glue Data Quality and Terraform sets a strong foundation for reliable data analytics and decision-making.

To learn more about AWS Glue Data Quality, refer to the following:


About the authors

Viquar Khan

Viquar Khan

Viquar is a Senior Data Architect at AWS who transforms complex data challenges into scalable, production-ready solutions. With 22+ years of expertise spanning data engineering, AI/ML, and Generative AI, he is a published author, open-source contributor, and passionate about pushing the boundaries of what’s possible with data.

Mahammadali Saheb

Mahammadali Saheb

Mahammadali is a Sr. Data Architect at AWS Professional Services, specializing in Data Analytics. He is passionate about helping customers drive business outcome via data analytics solutions on AWS Cloud.

The forge is our new home (Fedora Community Blog)

Post Syndicated from jzb original https://lwn.net/Articles/1064809/

Tomáš Hrčka has announced
that the Forgejo-based Fedora Forge is now a
fully operational collaborative-development platform; it is ready for
use by the larger Fedora community, which means the homegrown Pagure platform’s days are numbered:

While pagure.io has been a vital part of our community for many
years, the time has come to retire our homegrown forge and transition
to this powerful new tool.

The final cutover is planned for Flock to Fedora 2026. We strongly
encourage teams to migrate their projects well before the conference
to ensure a smooth transition. The pagure.io migration is only the
first step in a broader infrastructure modernization effort. By the
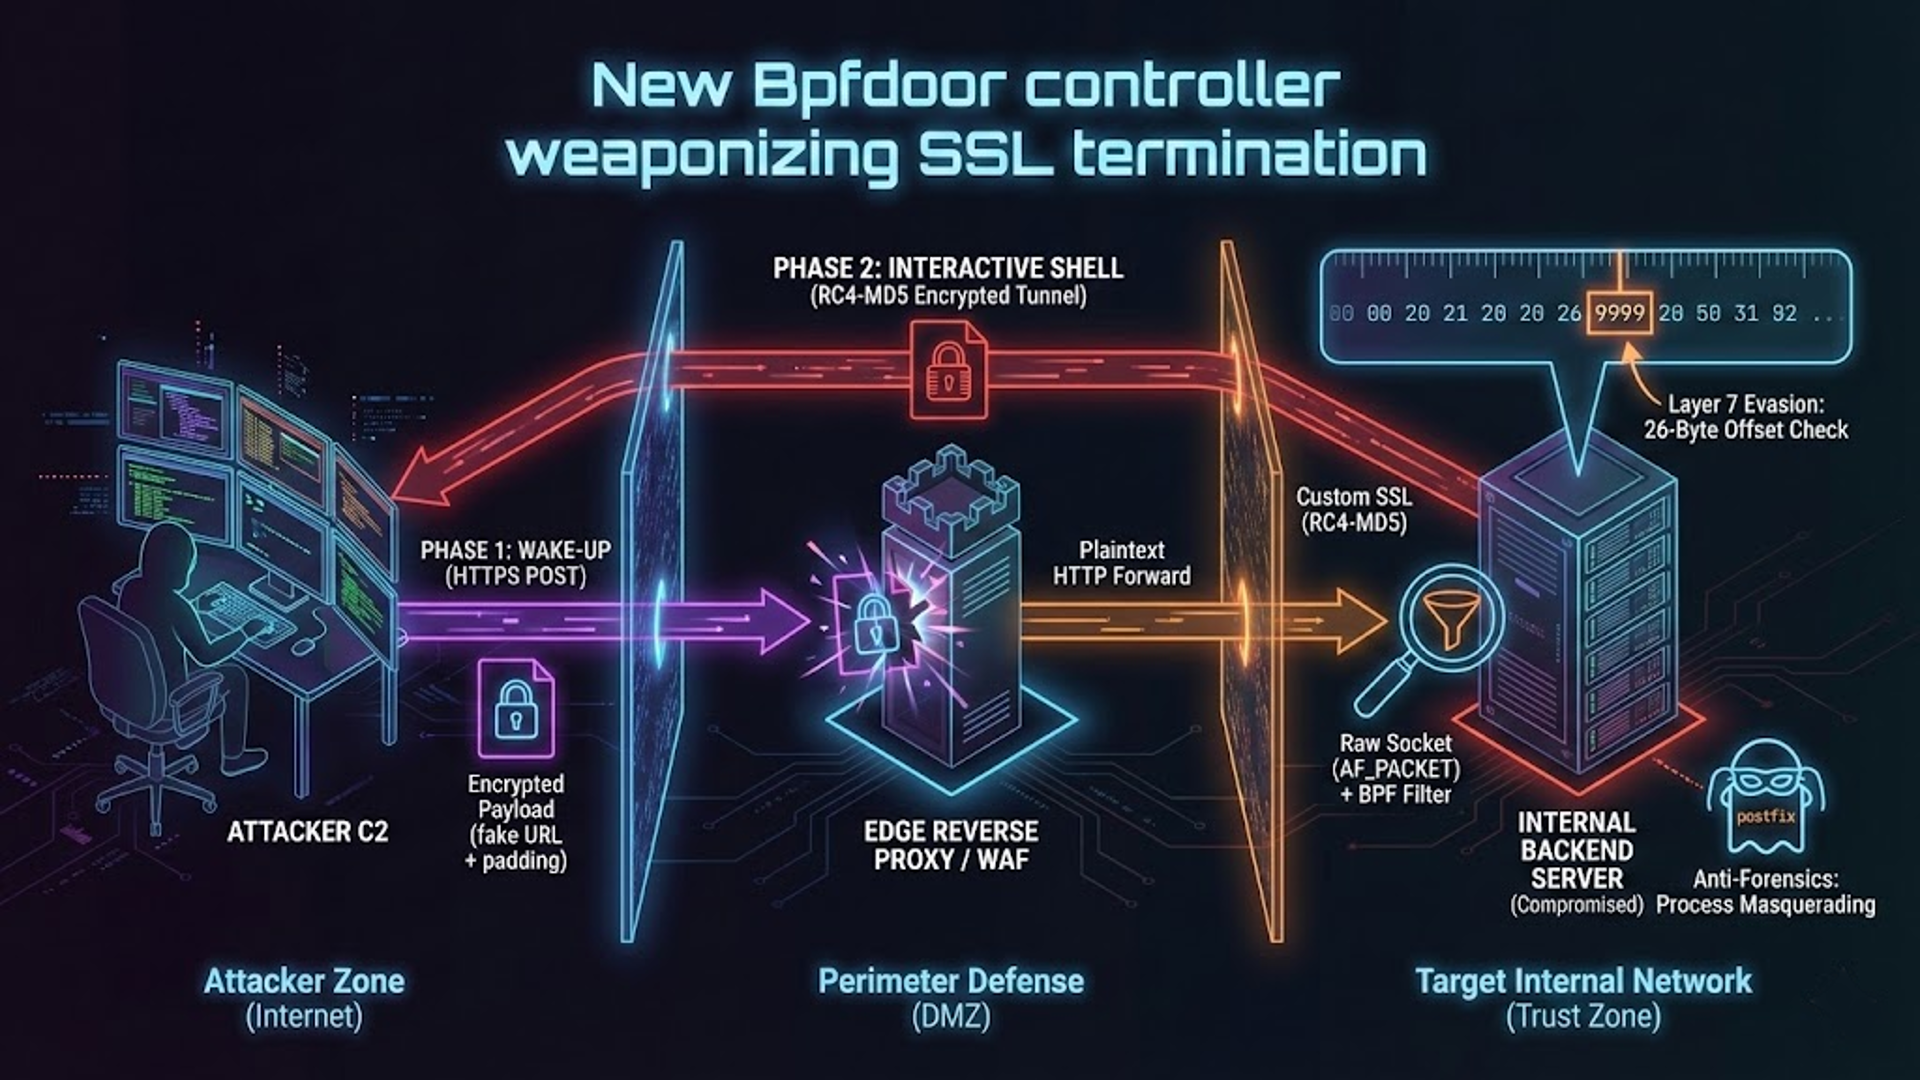
2027 Fedora 46 release, we plan to retire all remaining Pagure
instances across the project, including the package source
repositories on src.fedoraproject.org. Getting familiar with Fedora
Forge now will help ensure your team is ready as the rest of the
Fedora ecosystem transitions.

There is a migration
guide
for Fedora community members that own projects hosted on
Pagure and need to move to the new forge.

[$] Vibe-coded ext4 for OpenBSD

Post Syndicated from corbet original https://lwn.net/Articles/1064541/

A number of projects have been struggling with the question of which
submissions created by large language models (LLMs), if any, should be
accepted into their code base. This discussion has been further muddied by
efforts to use LLM-driven reimplemention as a way to remove copyleft
restrictions from a body of existing code, as recently happened with the Python chardet module. In
this context, an attempt to introduce an LLM-generated implementation of
the Linux ext4 filesystem into OpenBSD was always going to create some
fireworks, but that project has its own, clearly defined reasons for
looking askance at such submissions.

Security updates for Thursday

Post Syndicated from jzb original https://lwn.net/Articles/1064761/

Security updates have been issued by Debian (awstats, firefox-esr, and nss), Fedora (chromium, dotnet10.0, dotnet8.0, dotnet9.0, freerdp, and wireshark), Mageia (graphicsmagick and xen), Oracle (mysql:8.4 and nginx), Red Hat (podman), Slackware (bind and tigervnc), SUSE (azure-storage-azcopy, firefox-esr, giflib, glances-common, govulncheck-vulndb, grafana, kernel, libpng16, libsoup, mumble, net-snmp, perl-Crypt-URandom, pgvector-devel, pnpm, postgresql17, Prometheus, protobuf, python-cbor2, python-Jinja2, python-simpleeval, python311-dynaconf, python311-pydicom, python313-PyMuPDF, salt, snpguest, systemd, and vim), and Ubuntu (bind9, linux-azure, linux-azure, linux-azure-6.17, linux-azure-6.8, and mbedtls).

A one-line Kubernetes fix that saved 600 hours a year

Post Syndicated from Braxton Schafer original https://blog.cloudflare.com/one-line-kubernetes-fix-saved-600-hours-a-year/

Every time we restarted Atlantis, the tool we use to plan and apply Terraform changes, we’d be stuck for 30 minutes waiting for it to come back up. No plans, no applies, no infrastructure changes for any repository managed by Atlantis. With roughly 100 restarts a month for credential rotations and unboarding, that added up to over 50 hours of blocked engineering time every month, and paged the on-call engineer every time.

This was ultimately caused by a safe default in Kubernetes that had silently become a bottleneck as the persistent volume used by Atlantis grew to millions of files. Here’s how we tracked it down and fixed it with a one-line change.

Mysteriously slow restarts

We manage dozens of Terraform projects with GitLab merge requests (MRs) using Atlantis, which handles planning and applying. It enforces locking to ensure that only one MR can modify a project at a time. 

It runs on Kubernetes as a singleton StatefulSet and relies on a Kubernetes PersistentVolume (PV) to keep track of repository state on disk. Whenever a Terraform project needs to be onboarded or offboarded, or credentials used by Terraform are updated, we have to restart Atlantis to pick up those changes — a process that can take 30 minutes.

The slow restart was apparent when we recently ran out of inodes on the persistent storage used by Atlantis, forcing us to restart it to resize the volume. Inodes are consumed by each file and directory entry on disk, and the number available to a filesystem is determined by parameters passed when creating it. The Ceph persistent storage implementation provided by our Kubernetes platform does not expose a way to pass flags to mkfs, so we’re at the mercy of default values: growing the filesystem is the only way to grow available inodes, and restarting a PV requires a pod restart. 
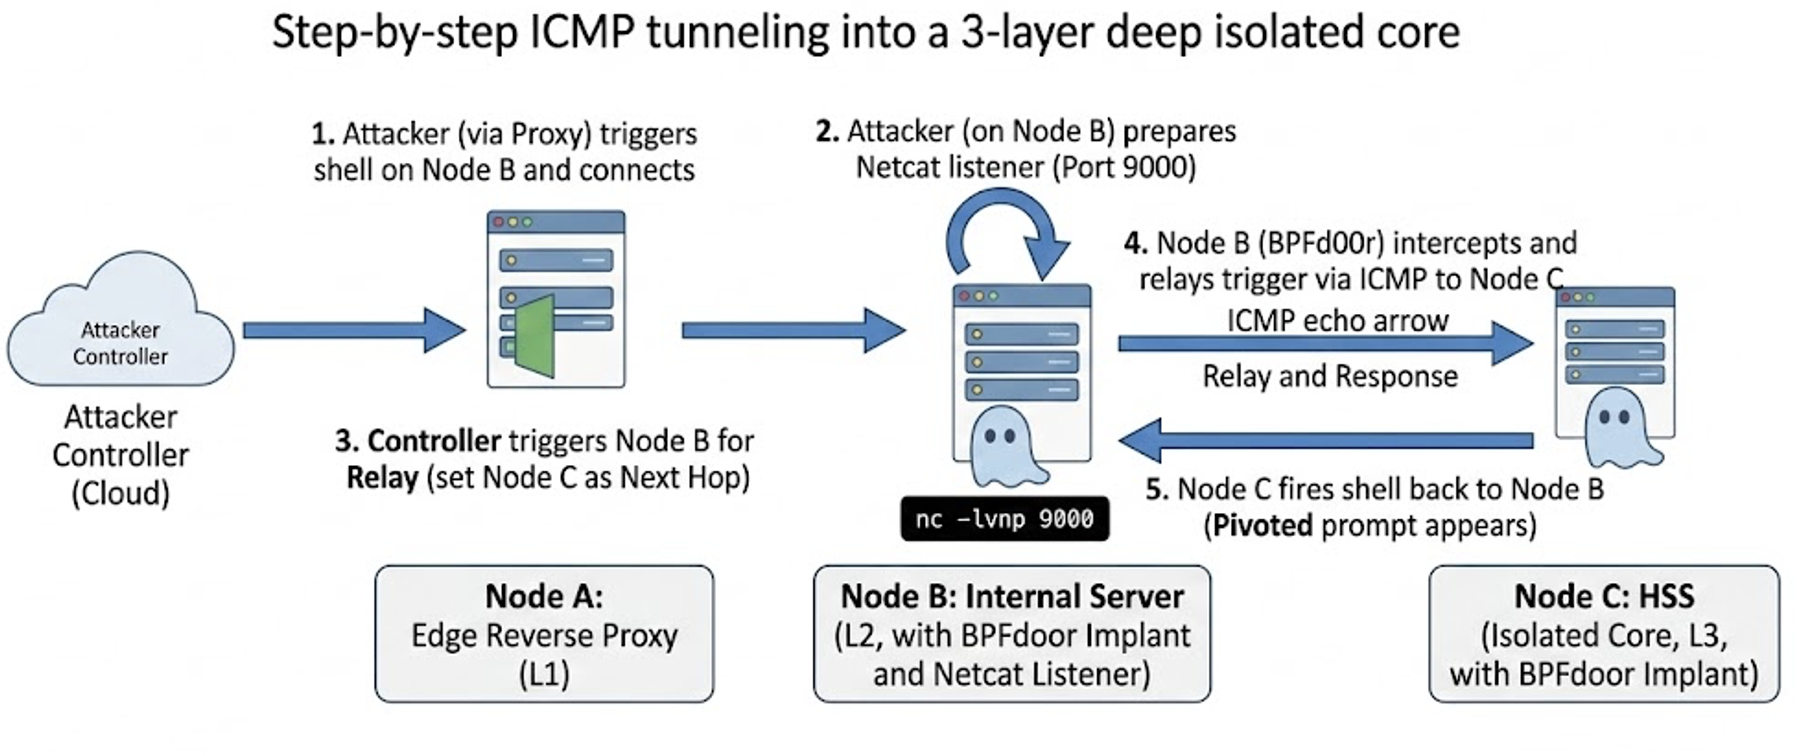
We talked about extending the alert window, but that would just mask the problem and delay our response to actual issues. Instead, we decided to investigate exactly why it was taking so long.

Bad behavior

When we were asked to do a rolling restart of Atlantis to pick up a change to the secrets it uses, we would run kubectl rollout restart statefulset atlantis, which would gracefully terminate the existing Atlantis pod before spinning up a new one. The new pod would appear almost immediately, but looking at it would show:

$ kubectl get pod atlantis-0
atlantis-0                                                        0/1     
Init:0/1     0             30m

…so what gives? Naturally, the first thing to check would be events for that pod. It’s waiting around for an init container to run, so maybe the pod events would illuminate why?

$ kubectl events --for=pod/atlantis-0
LAST SEEN   TYPE      REASON                   OBJECT                   MESSAGE
30m         Normal    Killing                  Pod/atlantis-0   Stopping container atlantis-server
30m        Normal    Scheduled                Pod/atlantis-0   Successfully assigned atlantis/atlantis-0 to 36com1167.cfops.net
22s         Normal    Pulling                  Pod/atlantis-0   Pulling image "oci.example.com/git-sync/master:v4.1.0"
22s         Normal    Pulled                   Pod/atlantis-0   Successfully pulled image "oci.example.com/git-sync/master:v4.1.0" in 632ms (632ms including waiting). Image size: 58518579 bytes.

That looks almost normal… but what’s taking so long between scheduling the pod and actually starting to pull the image for the init container? Unfortunately that was all the data we had to go on from Kubernetes itself. But surely there had to be something more that can tell us why it’s taking so long to actually start running the pod.

Going deeper

In Kubernetes, a component called kubelet that runs on each node is responsible for coordinating pod creation, mounting persistent volumes, and many other things. From my time on our Kubernetes team, I know that kubelet runs as a systemd service and so its logs should be available to us in Kibana. Since the pod has been scheduled, we know the host name we’re interested in, and the log messages from kubelet include the associated object, so we could filter for atlantis to narrow down the log messages to anything we found interesting.

We were able to observe the Atlantis PV being mounted shortly after the pod was scheduled. We also observed all the secret volumes mount without issue. However, there was still a big unexplained gap in the logs. We saw:

[operation_generator.go:664] "MountVolume.MountDevice succeeded for volume \"pvc-94b75052-8d70-4c67-993a-9238613f3b99\" (UniqueName: \"kubernetes.io/csi/rook-ceph-nvme.rbd.csi.ceph.com^0001-000e-rook-ceph-nvme-0000000000000002-a6163184-670f-422b-a135-a1246dba4695\") pod \"atlantis-0\" (UID: \"83089f13-2d9b-46ed-a4d3-cba885f9f48a\") device mount path \"/state/var/lib/kubelet/plugins/kubernetes.io/csi/rook-ceph-nvme.rbd.csi.ceph.com/d42dcb508f87fa241a49c4f589c03d80de2f720a87e36932aedc4c07840e2dfc/globalmount\"" pod="atlantis/atlantis-0"
[pod_workers.go:1298] "Error syncing pod, skipping" err="unmounted volumes=[atlantis-storage], unattached volumes=[], failed to process volumes=[]: context deadline exceeded" pod="atlantis/atlantis-0" podUID="83089f13-2d9b-46ed-a4d3-cba885f9f48a"
[util.go:30] "No sandbox for pod can be found. Need to start a new one" pod="atlantis/atlantis-0"

The last two messages looped several times until eventually we observed the pod actually start up properly.

So kubelet thinks that the pod is otherwise ready to go, but it’s not starting it and something’s timing out.

The missing piece

The lowest-level logs we had on the pod didn’t show us what’s going on. What else do we have to look at? Well, the last message before it hangs is the PV being mounted onto the node. Ordinarily, if the PV has issues mounting (e.g. due to still being stuck mounted on another node), that will bubble up as an event. But something’s still going on here, and the only thing we have left to drill down on is the PV itself. So I plug that into Kibana, since the PV name is unique enough to make a good search term… and immediately something jumps out:

[volume_linux.go:49] Setting volume ownership for /state/var/lib/kubelet/pods/83089f13-2d9b-46ed-a4d3-cba885f9f48a/volumes/kubernetes.io~csi/pvc-94b75052-8d70-4c67-993a-9238613f3b99/mount and fsGroup set. If the volume has a lot of files then setting volume ownership could be slow, see https://github.com/kubernetes/kubernetes/issues/69699

Remember how I said at the beginning we’d just run out of inodes? In other words, we have a lot of files on this PV. When the PV is mounted, kubelet is running chgrp -R to recursively change the group on every file and folder across this filesystem. No wonder it was taking so long — that’s a ton of entries to traverse even on fast flash storage!

The pod’s spec.securityContext included fsGroup: 1, which ensures that processes running under GID 1 can access files on the volume. Atlantis runs as a non-root user, so without this setting it wouldn’t have permission to read or write to the PV. The way Kubernetes enforces this is by recursively updating ownership on the entire PV every time it’s mounted.

The fix

Fixing this was heroically…boring. Since version 1.20, Kubernetes has supported an additional field on pod.spec.securityContext called fsGroupChangePolicy. This field defaults to Always, which leads to the exact behavior we see here. It has another option, OnRootMismatch, to only change permissions if the root directory of the PV doesn’t have the right permissions. If you don’t know exactly how files are created on your PV, do not set fsGroupChangePolicy: OnRootMismatch. We checked to make sure that nothing should be changing the group on anything in the PV, and then set that field:

spec:
  template:
    spec:
      securityContext:
        fsGroupChangePolicy: OnRootMismatch

Now, it takes about 30 seconds to restart Atlantis, down from the 30 minutes it was when we started.

Default Kubernetes settings are sensible for small volumes, but they can become bottlenecks as data grows. For us, this one-line change to fsGroupChangePolicy reclaimed nearly 50 hours of blocked engineering time per month. This was time our teams had been spending waiting for infrastructure changes to go through, and time that our on-call engineers had been spending responding to false alarms. That’s roughly 600 hours a year returned to productive work, from a fix that took longer to diagnose than deploy.

Safe defaults in Kubernetes are designed for small, simple workloads. But as you scale, they can slowly become bottlenecks. If you’re running workloads with large persistent volumes, it’s worth checking whether recursive permission changes like this are silently eating your restart time. Audit your securityContext settings, especially fsGroup and fsGroupChangePolicy. OnRootMismatch has been available since v1.20.

Not every fix is heroic or complex, and it’s usually worth asking “why does the system behave this way?”

If debugging infrastructure problems at scale sounds interesting, we’re hiring. Come join us on the Cloudflare Community or our Discord to talk shop.

BPFdoor in Telecom Networks: Sleeper Cells in the Backbone

Post Syndicated from Rapid7 Labs original https://www.rapid7.com/blog/post/tr-bpfdoor-telecom-networks-sleeper-cells-threat-research-report

Executive overview

The strategic positioning of covert access within the world’s telecommunication networks

A months-long investigation by Rapid7 Labs has uncovered evidence of an advanced China-nexus threat actor, Red Menshen, placing some of the stealthiest digital sleeper cells the team has ever seen in telecommunications networks. The goal of these campaigns is to carry out high-level espionage, including against government networks.

Telecommunications networks are the central nervous system of the digital world. They carry government communications, coordinate critical industries, and underpin the digital identities of billions of people. When these networks are compromised, the consequences extend far beyond a single provider or region. That level of access is, and should be, a national concern as it compromises not just one company or organization, but the communications of entire populations.

Over the past decade, telecom intrusions have been reported across multiple countries. In several cases, state-backed actors accessed call detail records, monitored sensitive communications, and exploited trusted interconnections between operators. While these incidents often appear isolated, a broader pattern is emerging.

Why telecom networks are strategic espionage targets

Telecommunications infrastructure provides a uniquely valuable strategic positioning.

Modern telecom networks are layered ecosystems composed of routing systems, subscriber management platforms, authentication services, billing systems, roaming databases, and lawful intercept capabilities. These systems rely on specialized signaling protocols such as SS7, Diameter, and SCTP to coordinate identity, mobility, and connectivity across national and international boundaries.

Persistent access within these environments enables far more than a conventional data breach. An adversary positioned inside the telecom core may gain visibility into subscriber identifiers, signaling flows, authentication exchanges, mobility events, and communications metadata. In the most concerning scenarios, this level of access could support long-term intelligence collection, large-scale subscriber tracking, and monitoring of sensitive communications involving high-value geopolitical targets.

Telecommunications networks sit at the intersection of identity, mobility, and global connectivity. Compromise at this layer carries national and international implications.

A structured campaign, not isolated incidents

What looks like discrete breaches increasingly resembles a repeatable campaign model designed to establish persistent access inside telecommunications infrastructure.

Our investigation uncovered a long-term and ongoing operation attributed to a China-nexus threat actor. Rather than conducting short-term intrusion activity, the operators appear focused on long-term positioning by embedding stealthy access mechanisms deep inside telecom and critical environments and maintaining them for extended periods.

In effect, attackers are placing sleeper cells inside the telecom backbone: dormant footholds positioned well in advance of operational use.

Across investigations and public reporting, we observe recurring elements: kernel-level implants, passive backdoors, credential-harvesting utilities, and cross-platform command frameworks. Together, these components form a persistent access layer designed not simply to breach networks, but to inhabit them.

Actors-tools-regions-graph-threat-groups-telecom-sector.png
Figure 1: Actors, tools and regions in which specific threat groups target the telecom sector

How BPFdoor enables covert, deep-seated persistence

At the center of this activity is BPFdoor, a stealth Linux backdoor engineered to operate within the operating system kernel.

Unlike conventional malware, BPFdoor does not expose listening ports or maintain visible command-and-control channels. Instead, it abuses Berkeley Packet Filter (BPF) functionality to inspect network traffic directly inside the kernel, activating only when it receives a specifically- crafted trigger packet. There is no persistent listener or obvious beaconing. The result is a hidden trapdoor embedded within the operating system itself.

This approach represents a shift in stealth tradecraft. By positioning below many traditional visibility layers, the implant significantly complicates detection, even when defenders know what to look for.

Our research indicates BPFdoor is not an isolated tool, but part of a broader intrusion model targeting telecom environments at scale.

How attackers gain initial access to telecom environments

These findings reflect a broader evolution in adversary tradecraft. Attackers are embedding implants deeper into the computing stack — targeting operating system kernels and infrastructure platforms rather than relying solely on user-space malware.

Telecom environments — combining bare-metal systems, virtualization layers, high-performance appliances, and containerized 4G/5G core components — provide ideal terrain for low-noise, long-term persistence. By blending into legitimate hardware services and container runtimes, implants can evade traditional endpoint monitoring and remain undetected for extended periods.

For defenders, the implications are significant. Many organizations lack visibility into kernel-level operations, raw packet-filtering behavior, and anomalous high-port network activity on Linux systems. Addressing this threat requires expanding defensive visibility beyond the traditional perimeter to include deeper inspection of operating system behavior and infrastructure layers.

Sharing intelligence responsibly

Our investigation to identify potential victims is ongoing and, where potential compromise has been discovered, we have notified affected parties through relevant authorities or direct communication with our customers.

As part of our responsible research process, we have collaborated with government partners and national CERTs to share findings and indicators associated with this activity. When our analysis identified infrastructure that may have been impacted, we proactively notified the relevant organizations and provided detection guidance to assist with investigation and response while the research was still underway.

Rapid7 Intelligence Hub customers have access to the full technical details and indicators of compromise within the platform, including Surricata rules. Those rules are also available through AWS Marketplace, where we offer our curated AWS firewall rule sets. 

Technical analysis

The sections that follow examine how modern telecommunications networks are structured, how initial access is established, and how BPFdoor and related tooling enable infrastructure-level persistence inside the telecom backbone.

Modern telecom network structure

To understand why telecom environments are such attractive strategic targets, it helps to visualize their layered architecture (Figure 2). At the outer edge sit customer-facing services and access infrastructure: mobile base stations (RAN), fiber aggregation routers, broadband gateways, DNS services, SMS-controllers, roaming gateways, security appliances like firewalls, proxies, VPNs, and internet peering points. These edge systems connect into the operator’s IP core and transport backbone, where high-capacity routers and switches move massive volumes of voice, data, and signaling traffic across regions and international borders.

Telecom-provider-network-rapid7-chart.png
Figure 2: Simplified version of a telecom provider’s network

⠀

Deeper inside lies the control plane, the heart of the telecom network, built around subscriber management systems such as HLR/HSS or UDM, authentication platforms (AuC), policy control functions, billing systems, lawful intercept platforms, and roaming databases. These systems communicate using specialized telecom signaling protocols such as SS7, Diameter, and increasingly SCTP-based signaling for LTE and 5G core components. At the foundation, much of this infrastructure ultimately runs on hardened, but often standard, Linux or BSD-based bare-metal servers, virtualization stacks, and high-performance network appliances. When an adversary implants a persistent backdoor at the kernel level within these environments, they are not simply compromising a server, they are positioning themselves adjacent to subscriber data, signaling flows, and the mechanisms that authenticate and route national and international communications.

Initial access

Telecom intrusions rarely begin deep inside the core. Instead, attackers focus on exposed edge services and internet-facing infrastructure. Techniques such as exploitation of public-facing applications (T1190) and abuse of valid accounts (T1078) are repeatedly observed. Devices commonly targeted include: Ivanti Connect Secure VPN appliances, Cisco IOS and JunOS network devices, Fortinet firewalls, VMware ESXi hosts, Palo Alto appliances, and even web-facing platforms like Apache Struts. These systems sit at the boundary between external traffic and internal telecom environments, making them high-value entry points. Once compromised, they provide authenticated pathways into the provider’s network, often without triggering traditional endpoint detection mechanisms.

Let’s highlight some of the tools we observed during initial access and attempt to get more credentials for lateral movement.

CrossC2

Once initial access is secured, the operators frequently deploy Linux-compatible beacon frameworks such as CrossC2. This Cobalt Strike-derived loader enables beacon functionality on Linux hosts and has been repeatedly observed in PRC-aligned intrusion campaigns. It provides the same post-exploitation capabilities traditionally seen in Windows environments, command execution, pivoting, staging, but tailored for Linux-heavy telecom infrastructure. CrossC2 allows operators to blend into server environments that form the backbone of telecom operations, particularly edge devices and core routing systems. Just as with the Cross C2 configuration, investing reveals the C2 server. For example:

Cross-C2-configuration-rapid7-telecom-research.png
Figure 3: CrossC2 configuration

⠀

TinyShell

For long-term persistence, actors often rely on TinyShell, an open-source passive backdoor framework repurposed and customized by multiple APT groups. TinyShell is frequently observed on boundary devices such as firewalls, VPN appliances, and virtualization hosts. Compiled for Linux and FreeBSD, it is designed with stealth in mind: minimal network footprint, passive communication model, and reliable remote command execution capabilities. 

Keyloggers and bruteforcers

After foothold establishment, attackers focus on persistence and lateral movement. Tooling such as Sliver, CrossC2, and TinyShell are complemented by SSH brute forcers and custom ELF-based keyloggers. In some cases, operators deploy brute-force utilities containing pre-populated credential lists tailored for telecom environments, even including specific usernames like “imsi,” referencing subscriber identity systems. This level of contextual awareness indicates reconnaissance and targeting aligned with telecom operational terminology. The goal is clear: move laterally, harvest credentials, and reach control-plane systems where subscriber data and signaling infrastructure reside.

BPFdoor

BPFdoor first came to broader public attention around 2021, when researchers uncovered a stealthy Linux backdoor used in long-running espionage campaigns targeting telecommunications and government networks. The BPFDoor source code reportedly leaked online in 2022, making the previously specialized Linux backdoor more accessible to other threat actors. Normally, BPF is used by tools like tcpdump or libpcap to capture specific network traffic, such as filtering for TCP port 443. It operates partly in kernel space, meaning it processes packets before they reach user-space applications.

BPFdoor abuses this capability. Rather than binding to a visible listening port, the implant installs a custom BPF filter inside the kernel that inspects incoming packets for a specific pattern, a predefined sequence of bytes often referred to as a “magic packet” or “magic byte.” If the pattern does not match, nothing happens. The traffic continues as normal. No open port or obvious process-accepting connections. But when the correct sequence is delivered to the correct destination port, the behavior changes instantly.

BPF-overview-variants-bpfdoor-rapid7-research-chart.png
Figure 4: Overview of BPF and how early BPFdoor variants are operating

⠀

Imagine retrieving a parcel from a secure pickup locker. The locker sits quietly in public view, no alarms, no obvious signs of activity. It only opens when the correct code is entered.

BPFdoor behaves the same way.

The implant remains dormant inside the Linux kernel, passively inspecting network traffic. It does not advertise itself. It does not respond to scans. But when an operator sends the correct “code”, the specific magic byte sequence embedded in a crafted packet, the BPF filter recognizes the pattern and triggers the next stage.

Instead of opening a physical door, it spawns a bind shell or reverse shell. Importantly, this activation can occur without a traditional listening service ever being visible in netstat or ss. To a defender, the system appears clean; there is no persistent open port to detect.

Before we showcase this, something important to note is that BPFdoor operations consist of two distinct components: the implant and the controller. 

The implant is the passive backdoor deployed on the compromised Linux system, where it installs a malicious BPF filter and silently inspects incoming traffic for a predefined “magic” packet. It does not continuously beacon or expose a listening port, making it extremely stealthy. 

The controller, on the other hand, is operated by the attacker and is responsible for crafting and sending the specially formatted packets that activate the backdoor and establish a remote shell. While it can be run from attacker-controlled infrastructure such as compromised routers or external systems, the controller is also designed to operate within the victim’s environment itself. In this mode it can masquerade as legitimate system processes and trigger additional implants across internal hosts by sending activation packets or by opening a local listener to receive shell connections, effectively enabling controlled lateral movement between compromised systems. In essence, the implant acts as the hidden lock embedded within the system, while the controller functions as the key that can activate it. A deeper technical analysis of the controller architecture and its role in lateral movement will be covered in a forthcoming technical blog.

To demonstrate how these first backdoors work, we created the video below, in which we are running a BPFdoor made visible. Next, we send the magic packet and instructions to the IP address and port we are listening on. Then the BPFdoor opens up the “safe” and creates the tunnel. In the final part of the demo, we see that on our Netcat listener, we have a remote shell and can query the system.

⠀

Next, we will highlight how we started to hunt for BPFdoor.

Hunting for BPFdoor variants

Since we were aware of several BPFdoor attacks and samples circulating, we started hunting for more samples and developed internal tools to extract, compare, and detect early indicators of new features. One threat hunting angle Rapid7 Labs really loves to focus on is code similarity of samples. Code similarity of malware samples can result in clusters of samples with similar activity, but most importantly, also demonstrate outliers that are potential candidates for research since they do not share commodity with the other samples.

The BPFdoor samples we collected and hunted for are all Executable and Linkable Format (ELF) files, but we are aware of samples compiled for running on Solaris. ELF is the standard binary file format for executables, object code, shared libraries, and core dumps on Linux and Unix-like operating systems. For the ELF files, we wrote a custom tool for clustering ELF/BPFdoor. By extracting .text section byte code blocks, generating MinHash signatures, and completing a few other steps, it will then compute exact Jaccard similarity and export the resulting similarity graph for visual cluster analysis.

Code-Similarity-clustering-BPFdoor-samples.png
Figure 5: Code Similarity clustering of BPFdoor samples

⠀

In our visualization, we clearly observe certain clusters of BPFdoor, but also outliers and smaller clusters that were up for investigation. The thicker the line, the more similar the code is to the samples it is attached to. By creating a feature comparison/extraction tool, we started to discover interesting features in the samples, which led us to a new controller discovery and security bypass feature. For example, we discovered a variant we dubbed “F” that uses a 26 BPF instruction filter with new magic packets.

Although it was previously reported that some samples support the Stream Control Transmission Protocol (SCTP), there is a tendency to read over it and not put it into the right context of what the consequences are. SCTP is not typical enterprise traffic; it underpins Public Switch Telephone Network (PSTN) signaling and real-time communication between core 4G and 5G network elements. By configuring BPF filters to inspect SCTP traffic directly, operators are no longer just maintaining server access, they are embedding themselves into the signaling plane of the telecom network. This is a fundamentally different level of positioning. Instead of sitting at the IT perimeter, the implant resides adjacent to the mechanisms that route calls, authenticate devices, and manage subscriber mobility.

Example-SCTP-route-extracted-BPF-code.png
Figure 6: Example of SCTP route extracted from the BPF code

⠀

Access to SCTP traffic opens powerful intelligence collection opportunities. In legacy and transitional environments, improperly secured signaling can expose SMS message contents, IMSI identifiers, and source/destination metadata. By observing or manipulating traffic over SCTP commands such as ProvideSubscriberLocation or UpdateLocation, an adversary can track a device’s real-world movement. In 5G environments, traffic over SCTP carries registration requests and Subscription Concealed Identifiers (SUCI), allowing identity probing at scale. At this point, the compromise is no longer about server persistence; it becomes population-level visibility into subscriber behavior and location. Translated, you could track individuals of interest. 

Interesting observations

The bare-metal to telecom equipment link

During the code investigations, we discovered that some BPFdoor samples are using code to mimic the bare-metal infrastructure, particularly enterprise-grade hardware platforms commonly deployed in telecom environments. By masquerading as legitimate system services that run only on bare metal, the implant blends into operational noise. This is especially relevant in environments leveraging HPE ProLiant and similar high-performance compute systems used for 5G core and edge deployments. 

Example-code-mimicking-HP-Proliant-servers.png
Figure 7: Example of code mimicking HP Proliant servers

⠀

In the above screenshot of one of the BPFdoor samples, we observed the processname “hpaslimited”.

By mimicking legitimate service names and process behavior of HPE ProLiant servers, attackers ensure the implant appears native to the hardware environment, a tactic that significantly complicates detection. Several of these service names have been observed in BPFdoor samples, but this name stood out. The hpasmlited.pid creates process threads, and mimics daemon-style behavior consistent with hardware monitoring services. The real hpasmlited process belongs to HPE’s Agentless Management Service, which runs on bare-metal ProLiant servers to expose hardware telemetry and system health data.

By adopting this name and writing a corresponding PID file, the malware blends into expected operational noise on telecom-grade ProLiant infrastructure. Of course this is not accidental naming, it demonstrates environment awareness and targeting intent. The operators appear to know they are running on physical HPE hardware commonly deployed in 4G/5G core and edge systems. By impersonating a trusted hardware management daemon that administrators expect to see, the implant reduces suspicion during forensic review while embedding itself directly into the physical backbone layer of telecom infrastructure. This tactic reflects a broader strategy: hide not just in Linux, but in the hardware identity of the telecom environment itself.

Mimicking containers

A second strategy involves spoofing core containerization components. Critical 5G core components such as the Access and Mobility Management Function (AMF), Session Management Function (SMF), and User Data Management (UDM) run as cloud native network functions inside Kubernetes pods. The following code excerpt demonstrates that the implant is aware of it.

Code-mimicking-container-docker-service.png
Figure 8: Code showing the mimicking of container/docker service

⠀

Docker Daemon (/usr/bin/dockerd) and containerd: The malware is executed with root privileges and adopts the exact command-line arguments of a legitimate Docker daemon (e.g., -H fd:// –containerd=/run/containerd/containerd.sock).

Recap for a moment

Up to this point, what we’ve described in our technical analysis has, more or less, been publicly available information; however, these pieces have not been assembled in a way that provides the context Rapid7 Labs has discovered through its in-depth investigation. Therefore, before we deep dive into some of the new technical findings that completes the picture of what is truly happening here, let’s pause for a moment to sync up on what we’ve just described. 

So far, our findings illustrate that BPFdoor is far more than a stealthy Linux backdoor. The kernel-level packet filtering, passive activation through magic packets, masquerading as legitimate hardware management services, awareness of container runtimes, and the ability to monitor telecom-native protocols such as SCTP, point to a tool designed for deep infrastructure positioning. Rather than targeting individual servers, the operators appear to focus on the underlying platforms that power modern telecommunications networks: bare-metal systems running telecom workloads, cloud-native Kubernetes environments hosting Containerized Network Functions, and the signaling protocols that coordinate subscriber identity, mobility, and communication flows. In this context, BPFdoor functions as an access layer embedded within the telecom backbone, providing long-term, low-noise visibility into critical network operations.

What Rapid7 found in newer BPFdoor variants

The following sections provide a high-level overview of several newly observed capabilities and behavioral patterns in recent BPFdoor samples. While these findings highlight important technical developments, this blog intentionally focuses on the architectural implications and operational context rather than a full reverse-engineering deep dive. Detailed technical analyses, including code-level breakdowns, will be published in upcoming research posts.

During our investigation, we identified a previously undocumented variant of BPFdoor that introduces several architectural changes designed to improve stealth and survivability in modern enterprise and telecom environments. We will highlight these features and illustrate how the malware continues to evolve beyond the earlier “magic packet” activation model.

Network-level invisibility: The BPF trapdoor

As we described before, the early BPFdoor installed a Berkeley Packet Filter inside the Linux kernel that inspected incoming network traffic. When a specially crafted “magic packet” containing a predefined byte sequence arrived at the correct port, the backdoor would activate and spawn a shell. Because the system never actually opened a port, tools such as netstat, ss, or nmap saw nothing unusual.

The newly observed variant evolves this concept. Instead of relying on a simple magic packet that could potentially be detected by intrusion detection signatures, the trigger is now embedded within seemingly legitimate HTTPS traffic. The attacker sends a carefully crafted request that travels through standard network infrastructure such as reverse proxies, load balancers, or web application firewalls. Once the traffic reaches the compromised host and is decrypted as part of normal SSL termination, the hidden command sequence can be extracted and used to activate the backdoor. In essence, in our previously mentioned analogy explaining the magic packet mechanism, the safe still requires a code, but now the code is concealed inside normal, encrypted web traffic, allowing it to pass through modern security controls before unlocking the trapdoor.

bpfdoor-controller-weaponizes-ssl-termination-chart.png
Figure 9: Overview of how the new sample communicates

Layer 7 camouflage and the “magic ruler”

To remain reliable across proxy layers, the attackers introduced a clever parsing mechanism. HTTP proxies often modify headers by inserting additional fields such as client IP addresses, timestamps, or routing metadata. These changes can shift the position of data within the request and break traditional signature-based triggers. To solve this problem, the attackers designed a mathematical padding scheme that ensures a specific marker, in the observed samples the string “9999”, always appears at a fixed byte offset within the request.

This is where the 26-byte or 40-byte “magic ruler” comes into play. Rather than parsing the entire HTTP header, which can vary depending on proxy behavior, the malware treats the request body as a predictable coordinate space. By carefully padding the HTTP request with filler bytes, the attacker ensures that the marker always lands exactly at the 26th byte offset of the inspected data structure. The implant simply checks this fixed position; if the marker appears at that byte location, it interprets the surrounding data as the activation command.

Because the header itself can fluctuate while the padded payload remains predictable, the malware does not need to understand or parse the full HTTP structure. Instead, it relies on this fixed “measurement point”, effectively using the 26-byte offset as a ruler inside the packet. This technique allows the trigger to survive proxy rewriting and header injection while still remaining hidden inside otherwise normal HTTPS traffic. The 26-byte rule is used in case of a socket creation with the “SOCK_DGRAM” flags, but in case of a “SOCK_RAW” flag, it will use a 40-byte ruler.

In practice, this turns the messy, variable HTTP protocol into something the malware can treat like a fixed coordinate system, enabling what could be described as dynamic Layer-7 camouflage, a surprisingly simple but effective technique for hiding command triggers inside legitimate encrypted web traffic.

The RC4-MD5 paradox

Another interesting feature of the new controller is its continued use of the legacy RC4-MD5 encryption routine. While this combination is considered deprecated in modern cryptographic standards, it still appears in several malware samples. In this case, the RC4-MD5 implementation is not part of TLS, but rather a lightweight encryption layer applied to the interactive command-and-control channel after the backdoor is activated. RC4 provides extremely fast stream encryption suitable for interactive shells, introducing minimal latency during command execution. In addition, the use of older or non-standard encryption routines can sometimes confuse inspection systems, particularly when traffic does not follow typical protocol expectations. Finally, reuse of older cryptographic modules often reflects code lineage and operational efficiency, adversaries frequently recycle proven components across campaigns. In this case, code comparison revealed similarities with routines that have circulated in Chinese-nexus malware families such as RedXOR and PWNIX for several years.

ICMP control channel: “phone home”

While earlier BPFdoor variants focused primarily on covert activation, the new sample also introduces a lightweight communication mechanism built around Internet Control Message Protocol (ICMP). The code excerpt shows the malware preparing an ICMP payload and inserting a specific value  “0xFFFFFFFF”  into a field before transmitting the packet using a dedicated routine (send_ICMP_data). At first glance this appears trivial, but the logic reveals something more interesting: The ICMP packet is not just a signal back to the operator, it is also used as a control mechanism between compromised systems.

ICMP-tunneling-rapid7-labs-research-chart.png
Figure 10: ICMP Tunneling

⠀

In this model, ICMP functions as a minimal command channel between infected hosts. One compromised server can forward specially crafted ICMP packets to another, effectively passing along execution instructions without requiring traditional command-and-control traffic. The key marker in this mechanism is the value 0xFFFFFFFF (signed as -1), which acts as a destination signal embedded inside the packet structure. When a receiving host detects this value, it interprets the packet as a terminal instruction rather than something to be forwarded further.

In practical terms, Server A is telling Server B: “You are the final destination.” Instead of relaying the signal onward, the receiving system executes the next stage, typically triggering the reverse shell or command handler. This simple signaling mechanism allows the operators to control how far a command propagates through compromised infrastructure without introducing additional protocol complexity.

What makes this mechanism notable is its simplicity. Rather than expanding the structure of the activation packet or introducing additional fields, the attackers reuse an existing value within the packet structure to signal the end of the chain. By setting this field to 0xFFFFFFFF, they effectively create a “do not forward” flag inside their communication channel. This allows them to manage hop behavior across compromised nodes while keeping the packet format compact and consistent. 

Key takeaways

Taken together, the newly observed capabilities demonstrate how BPFdoor has evolved beyond a stealth backdoor into a layered access framework. The updated variant combines encrypted HTTPS triggers, proxy-aware command delivery, application-layer camouflage techniques, ICMP-based control signals, and kernel-level packet filtering to bypass multiple layers of modern network defenses. Each technique targets a different security boundary, from TLS inspection at the edge, to IDS detection in transit, and endpoint monitoring on the host, illustrating a deliberate effort to operate across the full defensive stack.

Kernel-level backdoors are redefining stealth.
Tools like BPFdoor operate below traditional visibility layers, abusing Berkeley Packet Filter mechanisms to create network listeners that do not expose ports, processes, or conventional command-and-control indicators.

Telecommunications infrastructure is a prime espionage target.
Modern 4G and 5G networks rely on complex stacks of signaling systems, Containerized Network Functions, and high-performance infrastructure. Access to these environments can enable long-term intelligence collection, subscriber monitoring, and deep visibility into national communications infrastructure.

Security controls can be turned into delivery mechanisms.
In the latest BPFdoor variant, attackers weaponize normal security workflows. Traffic that passes through TLS termination and deep packet inspection can deliver malicious commands once it reaches the decrypted internal zone.

BPF-based implants are likely the beginning of a larger trend.
BPFdoor and new eBPF malware families like Symbiote demonstrate how kernel packet filtering can be abused for stealth persistence. As defenders improve visibility at higher layers, adversaries are increasingly shifting implants deeper into the operating system.

How defenders can detect BPFdoor activity

Detecting these threats requires shifting visibility deeper into the operating system and network stack, focusing on indicators such as unusual raw socket usage, anomalous packet filtering behavior, and unexpected service masquerading on critical infrastructure hosts. 

To support defenders in identifying potential BPFdoor activity, we developed a scanning script designed to detect both previously documented variants and the newer samples discussed in this research. The script focuses on identifying indicators associated with the stealth activation mechanism, kernel-level packet filtering behavior, and process masquerading techniques used by BPFdoor implants. By combining checks for known artifacts and behavioral patterns, the scanner helps security teams quickly assess whether systems may be impacted.

We are making this tool available to the community to assist organizations in proactively identifying potential compromises. The scanner can be used across Linux environments to search for artifacts linked to BPFdoor activity, including indicators observed in both historical samples and the latest variant analyzed during this research. Our goal is to help defenders rapidly validate exposure and begin incident response investigations where necessary.

Access the tool via Rapid7’s GitHub repo here.

In the video below, Rapid7 Labs demonstrates how our detection script would be run within the system of an infected victim organization. The video starts with the right window, showing that the BPFdoor backdoor is running and the particular services that relate are highlighted. Then, in the bottom left screen, the BPFdoor is activated by sending the right packet sequence and password, whereby a remote control shell is established. The attacker is running some commands on the victim machine and shows it can execute remote commands. Finally, in the top window, we run our developed detection script that will show the detected processes, and the alerts are showcased.  

⠀

⠀

Indicators of compromise (IOCs)

The IOCs we discovered during our investigation surrounding the new controller, as well as samples and other relevant data, can be found on our Rapid7 Labs Github page.

Interested in learning more?

Catch Sleeper Cells in the Telecom Backbone, Rapid7’s webinar via BrightTalk, led by Raj Samani, Chief Scientist, and Christiaan Beek, VP of Threat Analytics.

As the US Midterms Approach, AI Is Going to Emerge as a Key Issue Concerning Voters

Post Syndicated from Bruce Schneier original https://www.schneier.com/blog/archives/2026/03/as-the-us-midterms-approach-ai-is-going-to-emerge-as-a-key-issue-concerning-voters.html

In December, the Trump administration signed an executive order that neutered states’ ability to regulate AI by ordering his administration to both sue and withhold funds from states that try to do so. This action pointedly supported industry lobbyists keen to avoid any constraints and consequences on their deployment of AI, while undermining the efforts of consumers, advocates, and industry associations concerned about AI’s harms who have spent years pushing for state regulation.

Trump’s actions have clarified the ideological alignments around AI within America’s electoral factions. They set down lines on a new playing field for the midterm elections, prompting members of his party, the opposition, and all of us to consider where we stand in the debate over how and where to let AI transform our lives.

In a May 2025 survey of likely voters nationwide, more than 70% favored state and federal regulators having a hand in AI policy. A December 2025 poll by Navigator Research found similar results, with a massive net +48% favorability for more AI regulation. Yet despite the overwhelming preference of both voters and his party’s elected leaders—Congress was essentially unanimous in defeating a previous state AI regulation moratorium—Trump has delivered on a key priority of the industry. The order explicitly challenges the will of voters across blue and red states, from California to South Dakota, scrambling political positions around the technology and setting up a new ideological battleground in the upcoming race for Congress.

There are a number of ways that candidates and parties may try to capitalize on this emerging wedge issue before the midterms.

In 2025, much of the popular debate around AI was cast in terms of humans versus machines. Advances in AI and the companies it is associated with, it is said, come at the expense of humans. A new model release with greater capabilities for writing, teaching, or coding means more people in those disciplines losing their jobs.

This is a humanist debate. Making us talk to an AI customer-support agent is an affront to our dignity. Using AI to help generate media sacrifices authenticity. AI chatbots that persuade and manipulate assault our liberty. There is philosophical merit to these arguments, and yet they seem to have limited political salience.

Populism versus institutionalism is a better way to frame this debate in the context of US politics. The MAGA movement is widely understood to be a realignment of American party politics to ally the Republican party with populism, and the Democratic party with defenders of traditional institutions of American government and their democratic norms.

This frame is shattered by Trump’s AI order, which unabashedly serves economic elites at the expense of populist consumer protections. It is part of an ongoing courting process between MAGA and big tech, where the Trump political project sacrifices the interests of consumers and its populist credentials as it cozies up to tech moguls.

We are starting to see populist resistance to this government/big tech alignment emerge on the local scale. People in Maryland, Arizona, North Carolina, Michigan and many other states are vigorously opposing AI datacenters in their communities, based on environmental and energy-affordability impacts. These centers of opposition are politically diverse; both progressives and Trump-supporting voters are turning out in force, influencing their local elected officials to resist datacenter development.

This opposition to the physical infrastructure of corporate AI is so far staying local, but it may yet translate into a national and politically aligned movement that could divide the MAGA coalition.

Any policy discussions about AI should include the individual harms associated with job loss, as employers seek to replace laborers with machines. It should also include the systemic economic risks associated with concentrated and supercharged AI investment, the democratic risks associated with the increased power in monopolistic and politically influential tech companies, and the degradation of civic functions like journalism and education by AI. In order for our free market to function in the public interest, the companies amassing wealth and profiting from AI must be forced to take ownership of, and internalize, these costs.

The political salience of AI will grow to meet the staggering scale of financial investment and societal impact it is already commanding. There is an opportunity for enterprising candidates, of either political party, to take the mantle of opposing AI-linked harms in the midterm elections.

Political solutions start with organizing, and broadening the base of political engagement around these issues beyond the locally salient topic of datacenters. Movement leaders and elected officials in states that have taken action on AI regulation should mobilize around the blatant industry capture, wealth extraction, and corporate favoritism reflected in the Trump executive order. AI is no longer just a policy issue for governments to discuss: it is a political issue that voters must decide on and demand accountability on.

[$] LWN.net Weekly Edition for March 26, 2026

Post Syndicated from jzb original https://lwn.net/Articles/1063660/

Inside this week’s LWN.net Weekly Edition:

  • Front: Security collaboration; Manjaro governance; kernel development tools; PHP licensing; kernel direct map patches; sleepable BPF.
  • Briefs: LiteLLM compromise; Tor in Taiwan; b4 v0.15.0; 24-hour sideloading; Agama 19; Firefox 149.0; GNOME 50; Krita 5.3.0 and 6.0.0; Quotes; …
  • Announcements: Newsletters, conferences, security updates, patches, and more.

Intel Announces Arc Pro B70 and B65 Video Cards: Big Battlemage Brings Big Memory for AI Workstations

Post Syndicated from Ryan Smith original https://www.servethehome.com/intel-announces-arc-pro-b70-and-b65-video-cards-big-battlemage-brings-big-memory-for-ai-workstations/

Today Intel is expanding their Arc B-series video card lineup in a big way, with the launch of a pair of new Arc Pro graphics cards: the Arc Pro B70 and the Arc Pro B65. Joining Intel’s existing Arc Pro B-series video cards, the latest cards out of Intel are also the company’s most powerful […]

The post Intel Announces Arc Pro B70 and B65 Video Cards: Big Battlemage Brings Big Memory for AI Workstations appeared first on ServeTheHome.

The collective thoughts of the interwebz