Announcing Amazon Aurora PostgreSQL serverless database creation in seconds

Post Syndicated from Channy Yun (윤석찬) original https://aws.amazon.com/blogs/aws/announcing-amazon-aurora-postgresql-serverless-database-creation-in-seconds/

At re:Invent 2025, Colin Lazier, vice president of databases at AWS, emphasized the importance of building at the speed of an idea—enabling rapid progress from concept to running application. Customers can already create production-ready Amazon DynamoDB tables and Amazon Aurora DSQL databases in seconds. He previewed creating an Amazon Aurora serverless database with the same speed, and customers have since requested quick access and speed to this capability.

Today, we’re announcing the general availability of a new express configuration for Amazon Aurora PostgreSQL, a streamlined database creation experience with preconfigured defaults designed to help you get started in seconds.

With only two clicks, you can have an Aurora PostgreSQL serverless database ready to use in seconds. You have the flexibility to modify certain settings during and after database creation in the new configuration. For example, you can change the capacity range for the serverless instance at the time of create or add read replicas, modify parameter groups after the database is created. Aurora clusters with express configuration are created without an Amazon Virtual Private Cloud (Amazon VPC) network and include an internet access gateway for secure connections from your favorite development tools – no VPN, or AWS Direct Connect required. Express configuration also sets up AWS Identity and Access Management (IAM) authentication for your administrator user by default, enabling passwordless database authentication from the beginning without additional configuration.

After it’s created, you have access to features available for Aurora PostgreSQL serverless, such as deploying additional read replicas for high availability and automated failover capabilities. This launch also introduces a new internet access gateway routing layer for Aurora. Your new serverless instance comes enabled by default with this feature, which allows your applications to connect securely from anywhere in the world through the internet using the PostgreSQL wire protocol from a wide range of developer tools. This gateway is distributed across multiple Availability Zones, offering the same level of high availability as your Aurora cluster.

Creating and connecting to Aurora in seconds means fundamentally rethinking how you get started. We launched multiple capabilities that work together to help you onboard and run your application with Aurora. Aurora is now available on AWS Free Tier, which you gain hands-on experience with Aurora at no upfront cost. After it’s created, you can directly query an Aurora database in AWS CloudShell or using programming languages and developer tools through a new internet accessible routing component for Aurora. With integrations such as v0 by Vercel, you can use natural language to start building your application with the features and benefits of Aurora.

Create an Aurora PostgreSQL serverless database in seconds
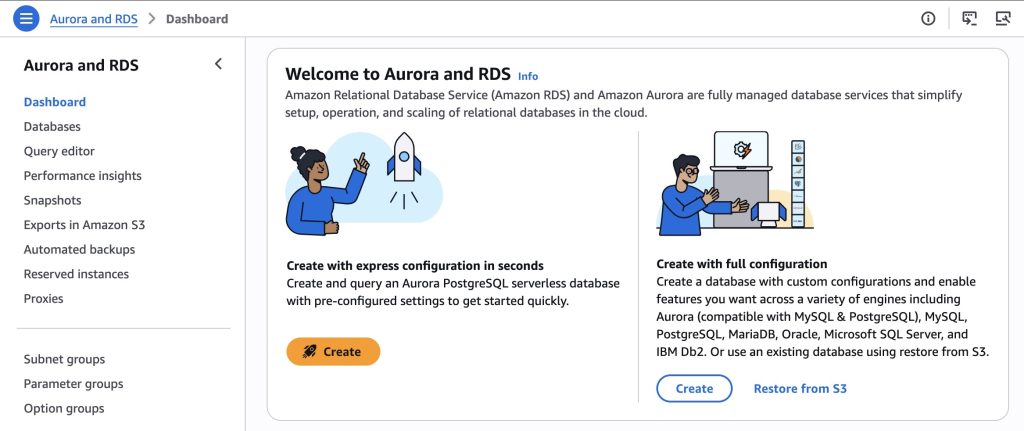
To get started, go to the Aurora and RDS console and in the navigation pane, choose Dashboard. Then, choose Create with a rocket icon.
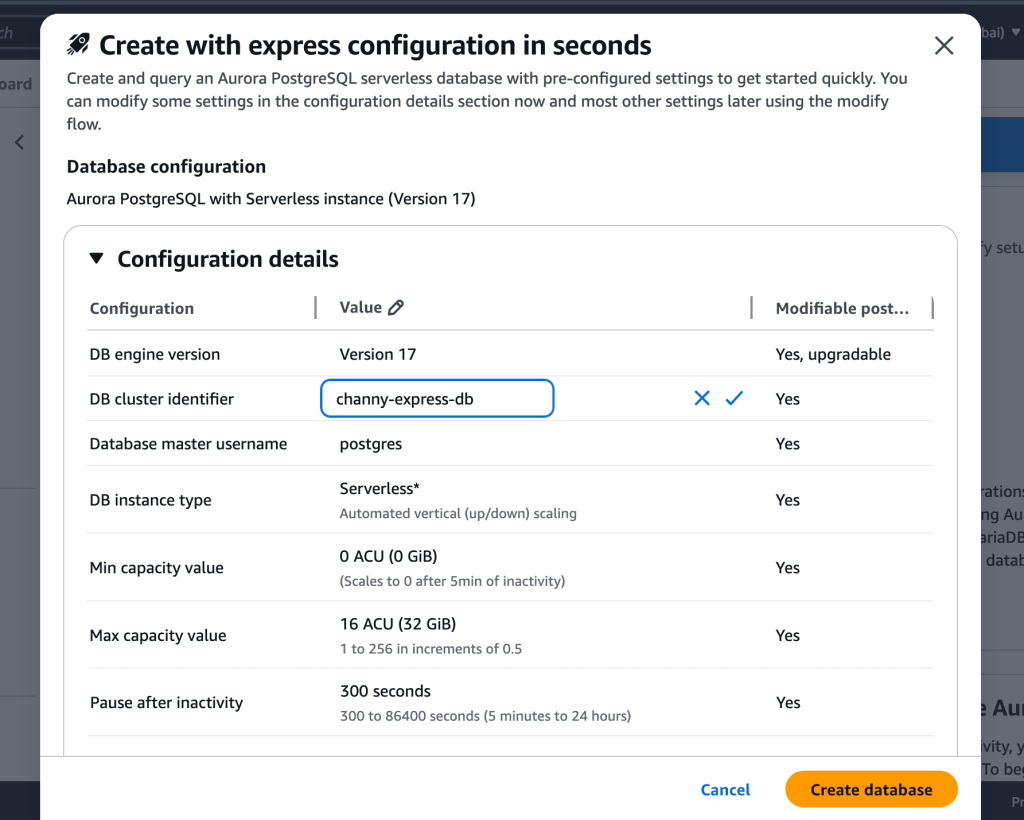
Review pre-configured settings in the Create with express configuration dialog box. You can modify the DB cluster identifier or the capacity range as needed. Choose Create database.
You can also use the AWS Command Line Interface (AWS CLI) or AWS SDKs with the parameter --express-configuration to create both a cluster and an instance within the cluster with a single API call which makes it ready for running queries in seconds.To learn more, visit Creating an Aurora PostgreSQL DB cluster with express configuration.

Here is a CLI command to create the cluster:

$ aws rds create-db-cluster --db-cluster-identifier channy-express-db \
    --engine aurora-postgresql \
    –with-express-configuration

Your Aurora PostgreSQL serverless database should be ready in seconds. A success banner confirms the creation, and the database status changes to Available.
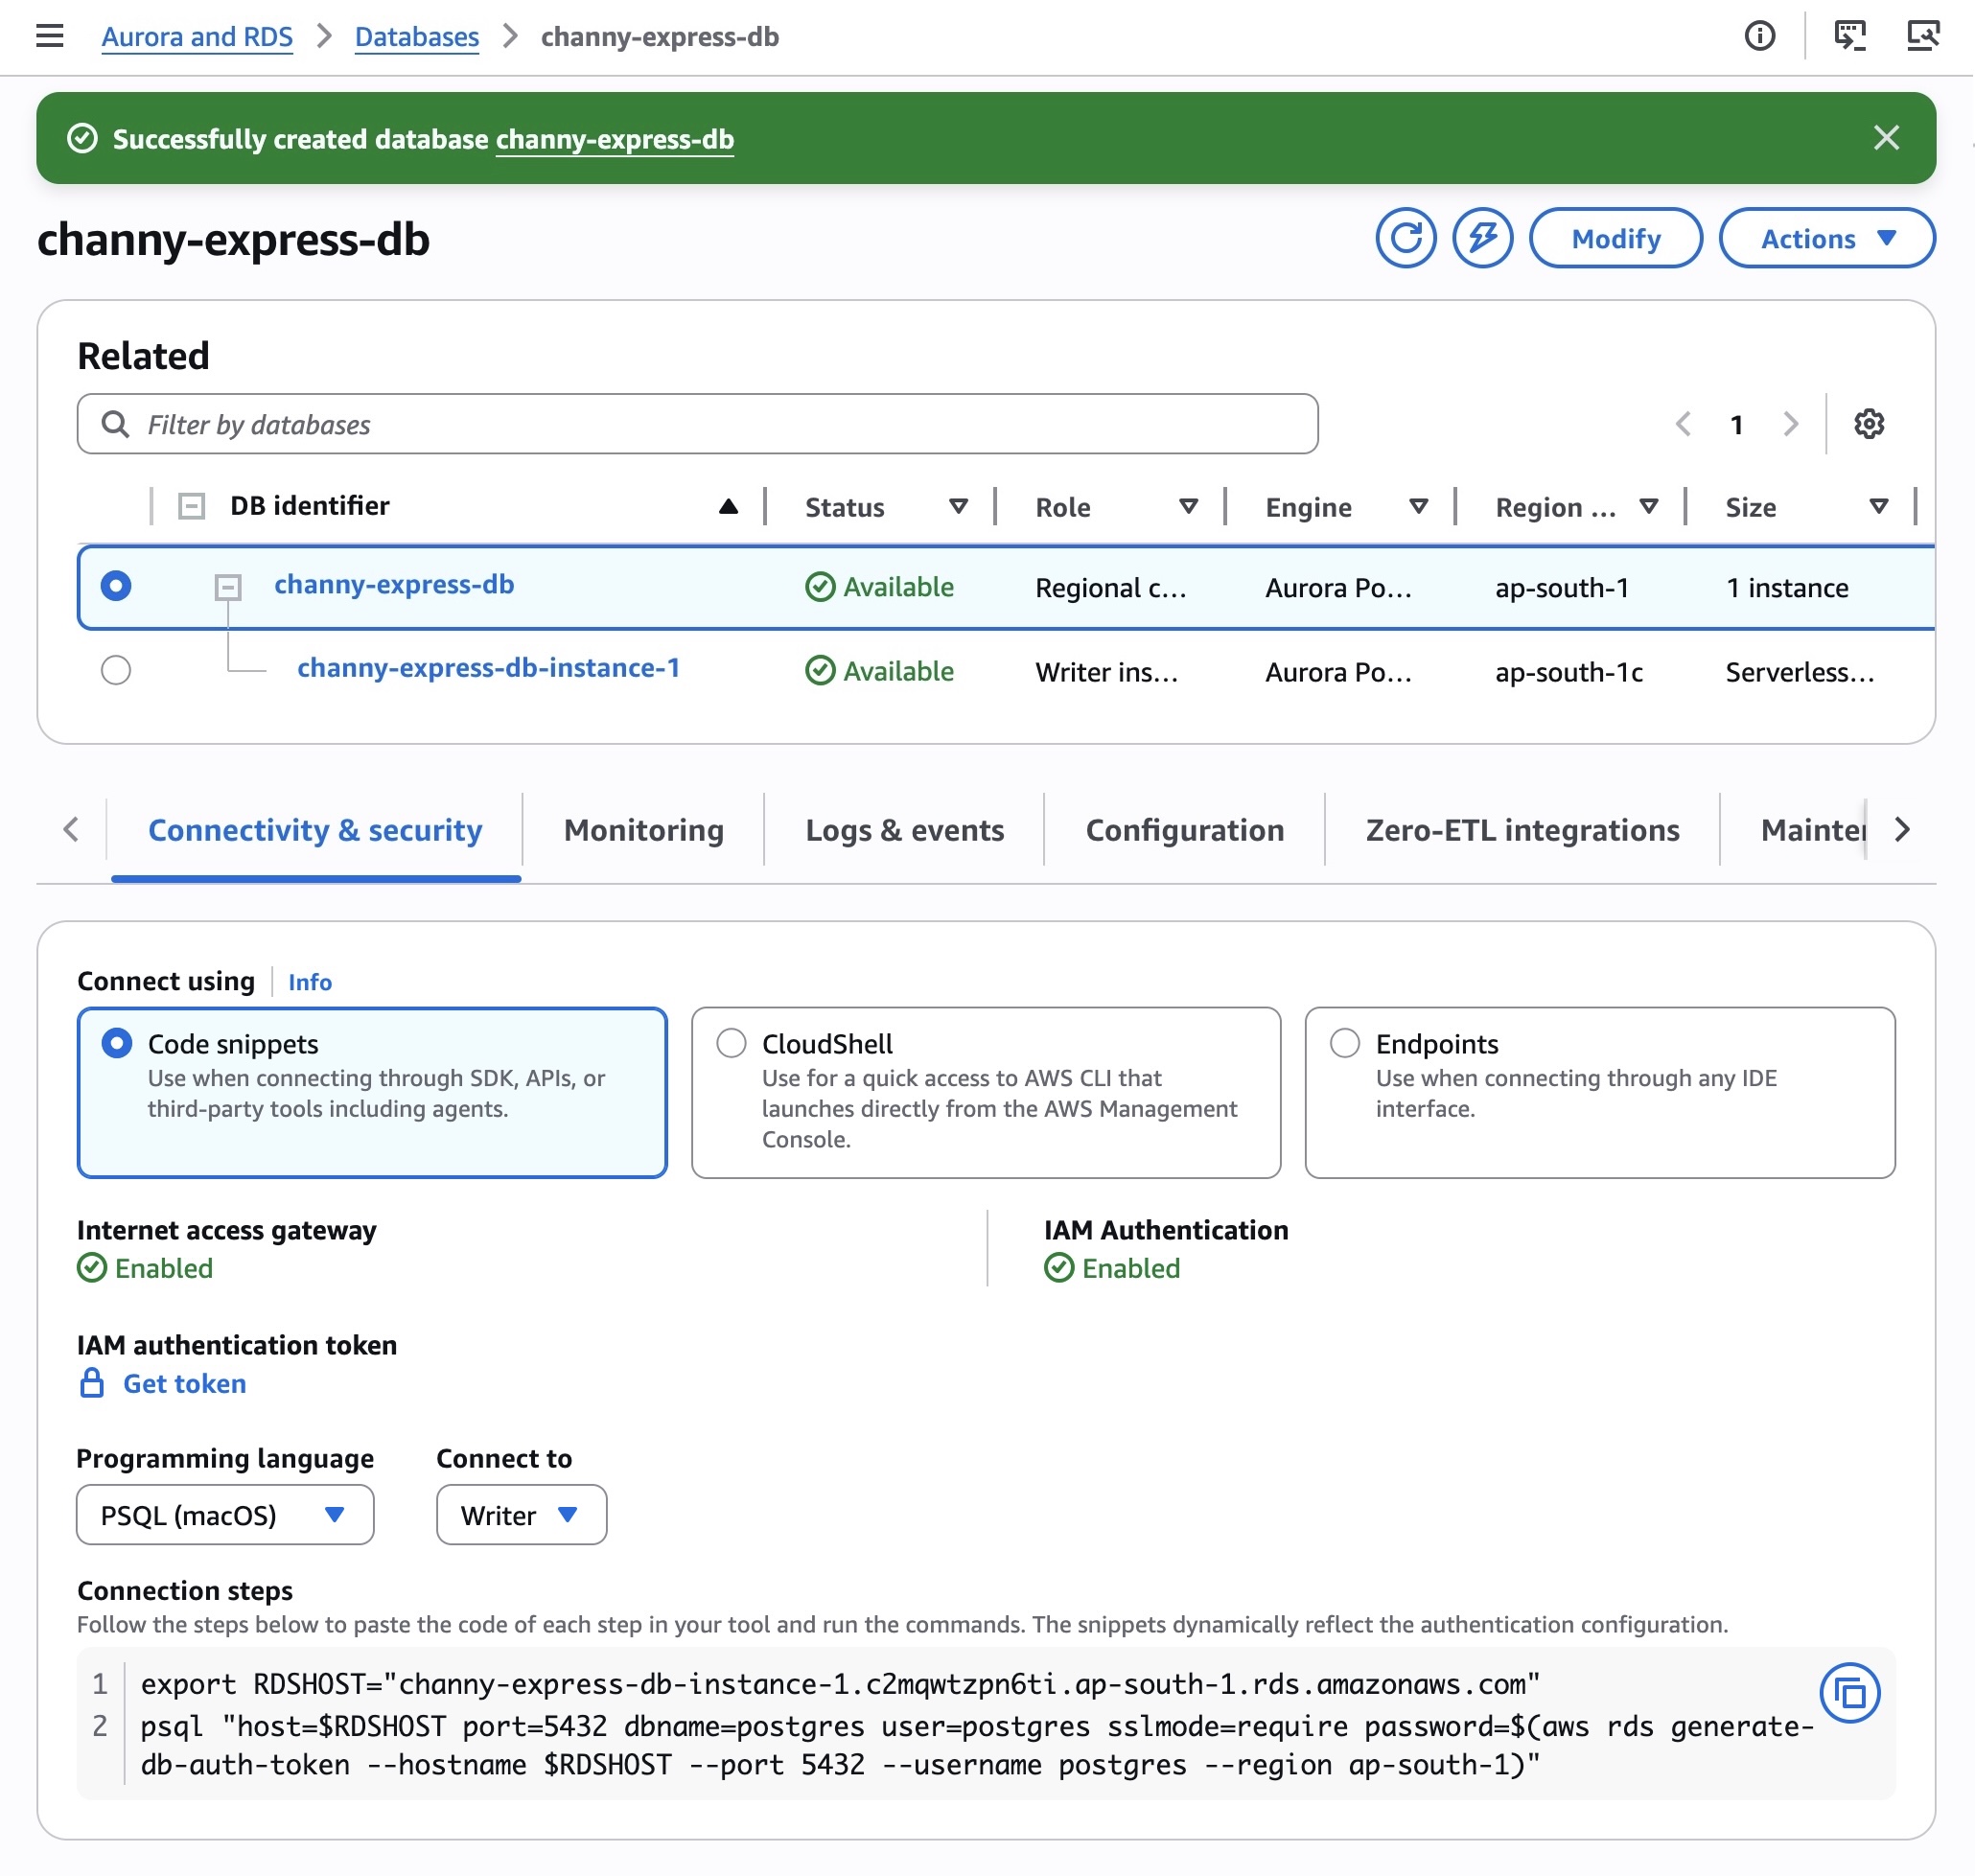
After your database is ready, go to the Connectivity & security tab to access three connection options. When connecting through SDKs, APIs, or third-party tools including agents, choose Code snippets. You can choose various programming languages such as .NET, Golang, JDBC, Node.js, PHP, PSQL, Python, and TypeScript. You can paste the code from each step into your tool and run the commands.

For example, the following Python code is dynamically generated to reflect the authentication configuration:

import psycopg2
import boto3

auth_token = boto3.client('rds', region_name='ap-south-1').generate_db_auth_token(DBHostname='channy-express-db-instance-1.abcdef.ap-south-1.rds.amazonaws.com', Port=5432, DBUsername='postgres', Region='ap-south-1')

conn = None
try:
    conn = psycopg2.connect(
        host='channy-express-db-instance-1.abcdef.ap-south-1.rds.amazonaws.com',
        port=5432,
        database='postgres',
        user='postgres',
        password=auth_token,
        sslmode='require'
    )
    cur = conn.cursor()
    cur.execute('SELECT version();')
    print(cur.fetchone()[0])
    cur.close()
except Exception as e:
    print(f"Database error: {e}")
    raise
finally:
    if conn:
        conn.close()

const { Client } = require('pg');
const AWS = require('aws-sdk');
AWS.config.update({ region: 'ap-south-1' });

async function main() {
  let password = '';
  const signer = new AWS.RDS.Signer({ region: 'ap-south-1', hostname: 'channy-express-db-instance-1.abcdef.ap-south-1.rds.amazonaws.com', port: 5432, username: 'postgres' });
  password = signer.getAuthToken({});

  const client = new Client({
    host: 'channy-express-db-instance-1.abcdef.ap-south-1.rds.amazonaws.com',
    port: 5432,
    database: 'postgres',
    user: 'postgres',
    password,
    ssl: { rejectUnauthorized: false }
  });

  try {
    await client.connect();
    const res = await client.query('SELECT version()');
    console.log(res.rows[0].version);
  } catch (error) {
    console.error('Database error:', error);
    throw error;
  } finally {
    await client.end();
  }
}
main().catch(console.error);

Choose CloudShell for quick access to the AWS CLI which launches directly from the console. When you choose Launch CloudShell, you can see the command is pre-populated with relevant information to connect to your specific cluster. After connecting to the shell, you should see the psql login and the postgres => prompt to run SQL commands.
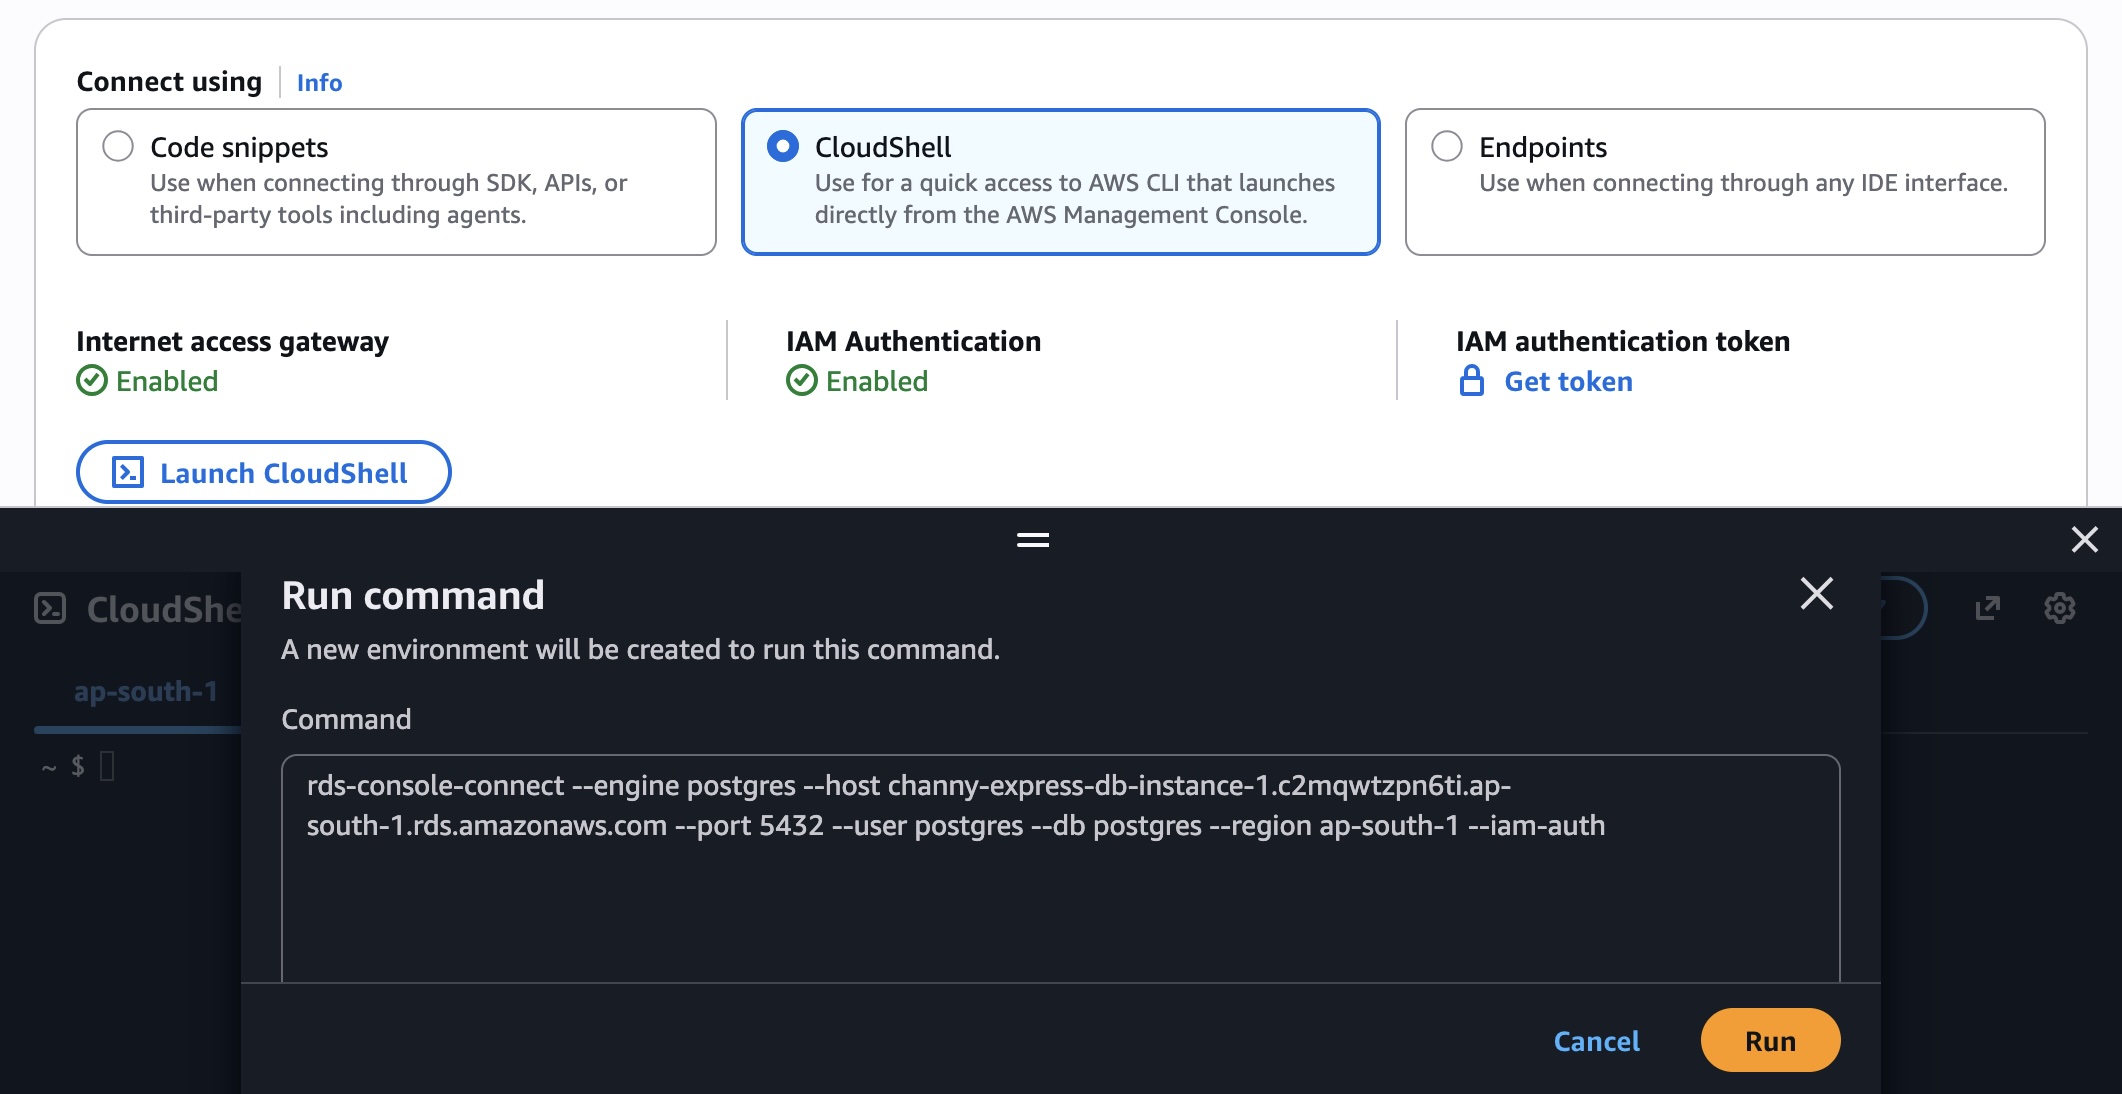
You can also choose Endpoints to use tools that only support username and password credentials, such as pgAdmin. When you choose Get token, you use an AWS Identity and Access Management (IAM) authentication token generated by the utility in the password field. The token is generated for the master username that you set up at the time of creating the database. The token is valid for 15 minutes at a time. If the tool you’re using terminates the connection, you will need to generate the token again.

Building your application faster with Aurora databases
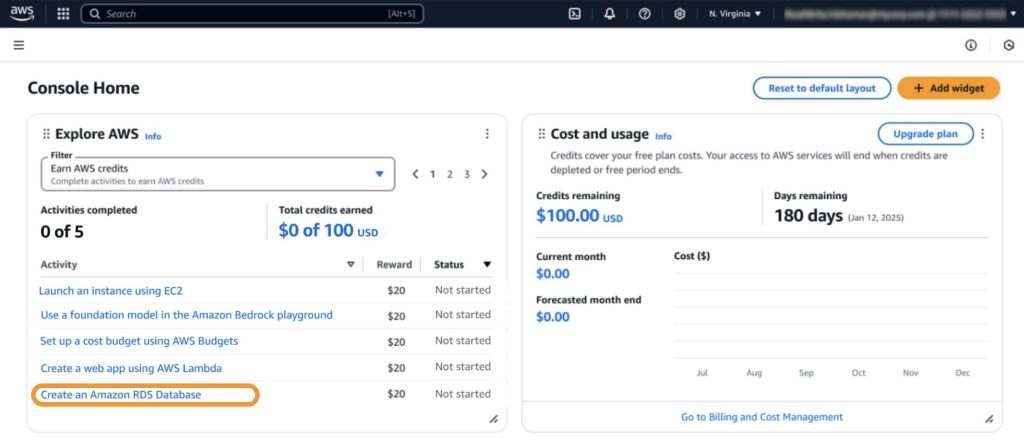
At re:Invent 2025, we announced enhancements to the AWS Free Tier program, offering up to $200 in AWS credits that can be used across AWS services. You’ll receive $100 in AWS credits upon sign-up and can earn an additional $100 in credits by using services such as Amazon Relational Database Service (Amazon RDS), AWS Lambda, and Amazon Bedrock. In addition, Amazon Aurora is now available across a broad set of eligible Free Tier database services.
Developers are embracing platforms such as Vercel, where natural language is all it takes to build production-ready applications. We announced integrations with Vercel Marketplace to create and connect to an AWS database directly from Vercel in seconds and v0 by Vercel, an AI-powered tool that transforms your ideas into production-ready, full-stack web applications in minutes. It includes Aurora PostgreSQL, Aurora DSQL, and DynamoDB databases. You can also connect your existing databases created through express configuration with Vercel. To learn more, visit AWS for Vercel.
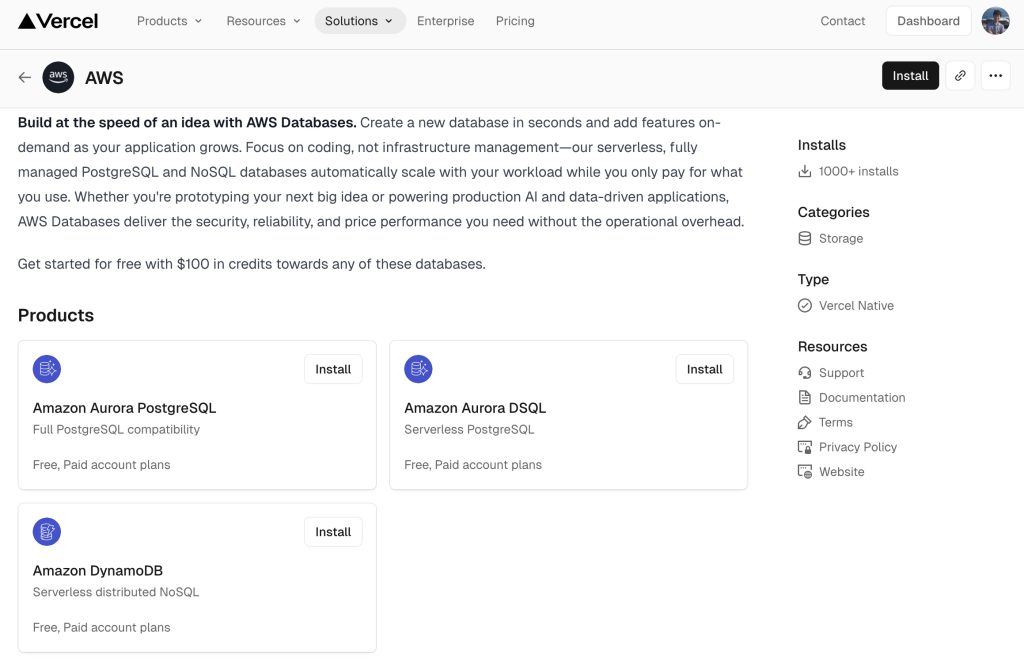
Like Vercel, we’re bringing our databases seamlessly into their experiences and are integrating directly with widely adopted frameworks, AI assistant coding tools, environments, and developer tools, all to unlock your ability to build at the speed of an idea.

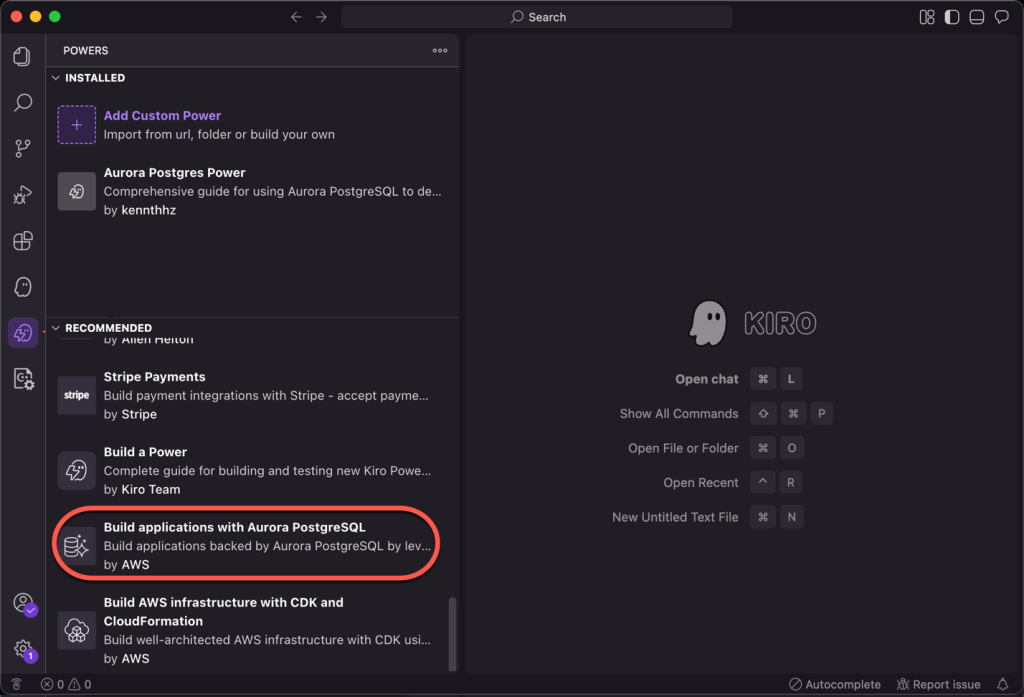
We introduced Aurora PostgreSQL integration with Kiro powers, which developers can use to build Aurora PostgreSQL backed applications faster with AI agent-assisted development through Kiro. You can use Kiro power for Aurora PostgreSQL within Kiro IDE and from the Kiro powers webpage for one-click installation. To learn more about this Kiro Power, read Introducing Amazon Aurora powers for Kiro and Amazon Aurora Postgres MCP Server.
Now available
You can create an Aurora PostgreSQL serverless database in seconds today in all AWS commercial Regions. For Regional availability and a future roadmap, visit the AWS Capabilities by Region.

You pay only for capacity consumed based on Aurora Capacity Units (ACUs) billed per second from zero capacity, which automatically starts up, shuts down, and scales capacity up or down based on your application’s needs. To learn more, visit the Amazon Aurora Pricing page.

Give it a try in the Aurora and RDS console and send feedback to AWS re:Post for Aurora PostgreSQL or through your usual AWS Support contacts.

— Channy

[$] Collaboration for battling security incidents

Post Syndicated from jake original https://lwn.net/Articles/1063459/

The keynote for Sun Security Con
2026
(SunSecCon) was given by Farzan Karimi on how incident handling
can go awry because of a lack of collaboration between the “good
guys”—which stands in contrast to how attackers collaboratively operate.
He provided some “war stories” where security incident handling had
benefited from collaboration and others where it was hampered by its lack.
SunSecCon was held in conjunction with SCALE 23x in Pasadena
in early March.

Setting up a Tor Relay at National Taiwan Normal University (Tor Blog)

Post Syndicated from jzb original https://lwn.net/Articles/1064671/

The Tor Blog has an interesting article
about the non-technical side of setting up a Tor Relay. It documents how a
computer science student at National Taiwan Normal University worked with the
university system to set up a relay and provides a template for future
attempts:

In Taiwan, anonymous networks do not lack technical documentation or
ideological support. The real scarcity is experience from actually working
through the real institutional system once. Especially in an environment where
academic networks are highly centralized and outbound connectivity is tightly
controlled, distributed anonymous infrastructure like Tor Relays is inherently
difficult to sustain.

This implementation at National Taiwan Normal University was not meant to
provide a final answer for anonymous networks. It was a concrete attempt made
within real-world institutions. It may not immediately improve the performance
or security of anonymous networks, and it was not intended to become a directly
reproducible standard process. What it did achieve was leaving behind a clearly
visible path of practice—one that can be understood, referenced, and built
upon.

Избори 2026 – висока активност при заявленията, странни сигнали от Турция

Post Syndicated from Боян Юруков original https://yurukov.net/blog/2026/iz2026-zayavleniya/

Снощи изтече срокът за подаване на заявления за гласуване в чужбина за вота на 19-ти април. Поради редица промени в Изборния кодекс в последния момент, правата и възможността на десетки хиляди българи зад граница бяха ограничени. Това и променените правила за отваряне на секции накара много хора да подадат заявление. Описах процеса и защо е важно в началото на кампанията.

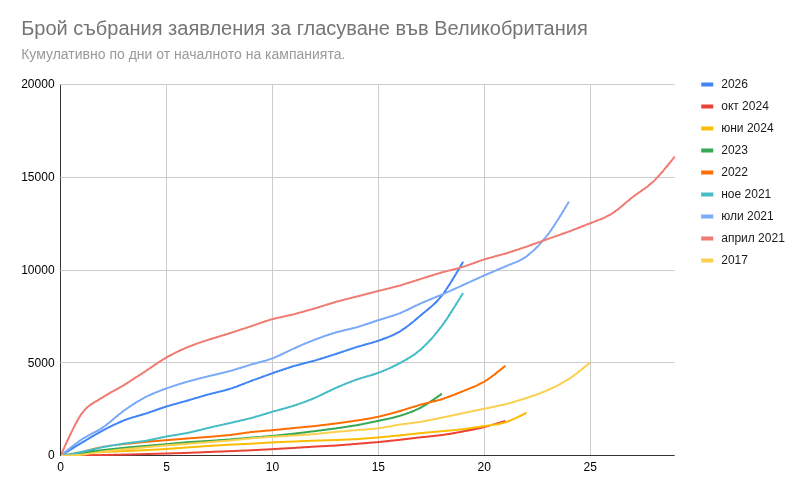
В крайна сметка 60897 българи са подали заявления електронно. Това са почти двойно спрямо изборите през октомври 2024-та и на трето място от 9-те вота в последните 10 години. От графиките ще видим, че рекордът от април 2021 се дължи на изключително силно начало на кампанията заради много добрата организация на доброволци и сдружения тогава. В последствия с облекчаването на режима на отваряне на секции и автоматичното им одобряване на база предишна активност в деня на изборите, нуждата от такава организация намаля. Този път, въпреки, че нямаше такава координирана кампания, видяхме огромен наплив на заявления. Това може да е индикация за сериозен интерес на вота напук на опитите за саботаж на изборния процес.

На тази графика виждаме процесът на събиране на заявления според деня от началото на кампанията, а на втората – по дни до края ѝ. Виждаме рязкото увеличение в последните два дни, за което ще стане дума после. Виждаме и че макар да е една от най-кратките кампании – едва 19 дни при предвидени 25 – успя да надхвърли като брой заявленията през ноември 2021-ва, когато имахме също толкова време за събиране.

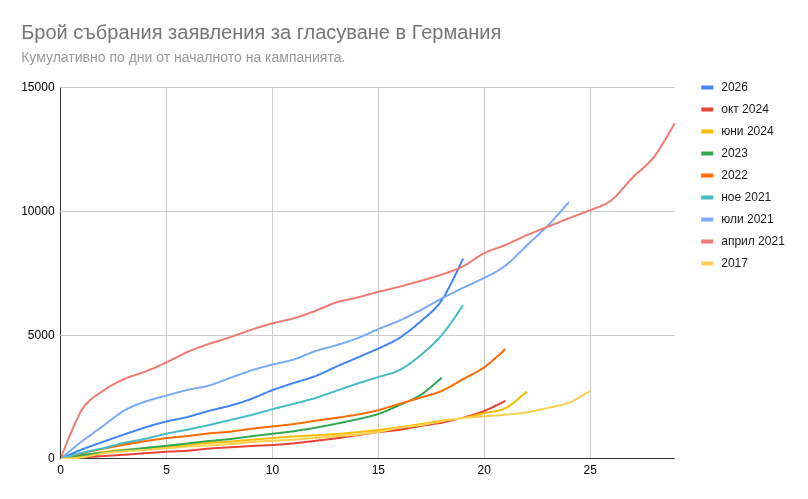
Във Великобритания и Германия виждаме аналогична крива както в предходните години. Типичното е да започва слабо и да се засилва постепенно в последните три-четири дни. Изключение прави април 2021-ва, когато имаше безпрецедентна кампания за подготовка още в ден едно.

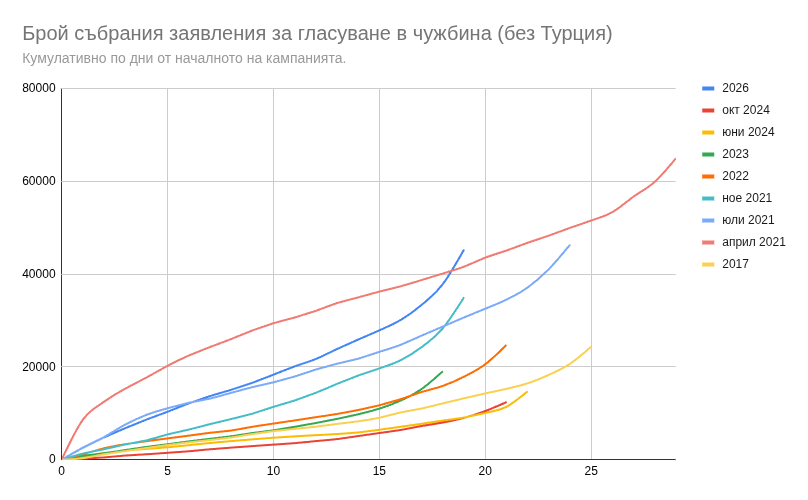
Виждаме същото и за всички страни в чужбина включвайки Турция. Развитието на кампанията следи плътно тази от юли 2021-ва и я задминава предвид, че срокът беше с 4 дни по-кратък. Въпреки последното, бяха събрани почти толкова заявления. Кривите на всички държави в чужбина се аналогични и следват плавно покачване с леко засилване в последните няколко дни.

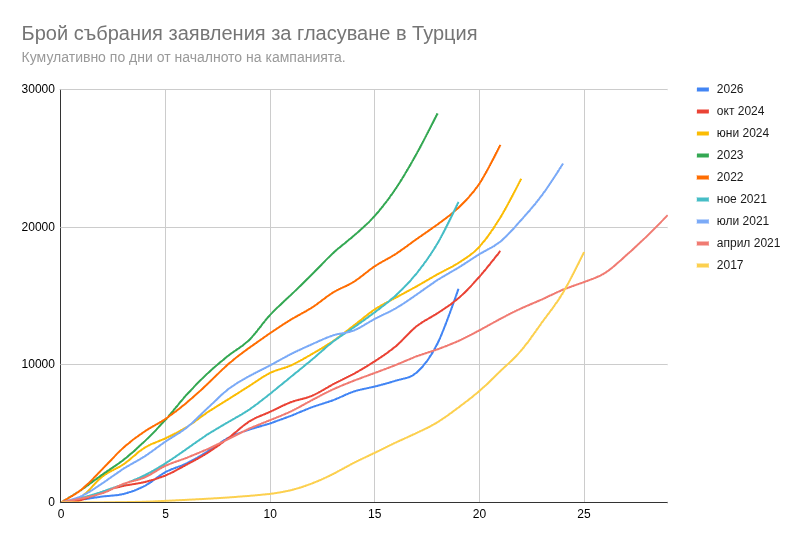
Сравнявайки с Турция виждаме нещо много различно. Не се вижда силното начало през април 2021-ва, каквото виждаме където и да е другаде. Тогава дори имаше малко заявления. През всички години виждаме монотонно събиране на заявления с почти никакво увеличение в последните дни. Кривите са много различни от другите държави и показват значително по-равномерен темп на подаване на заявления. Изключение прави кампанията през 2017-та, когато в първите 10 дни практически нямаше никакви подадени заявления, след което ударно бяха подавани с аналогична крива като другите години.

Тази година също е изключение в известен смисъл. Макар да започва аналогично на изборите през октомври 2024-та и април 2021-ва, подадените заявления оставаха доста под очакваното. В последните два ни обаче имаше рязък скок нагоре. Нетипичен за която и да е година преди това или друга държава. Докато за първите 17 дни от кампанията са били събрани 9434 заявления, само в последните два са подадени още 6100.

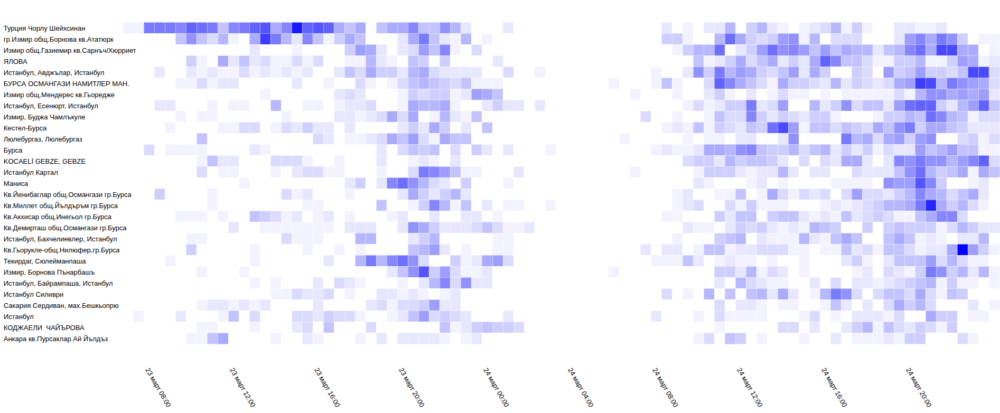
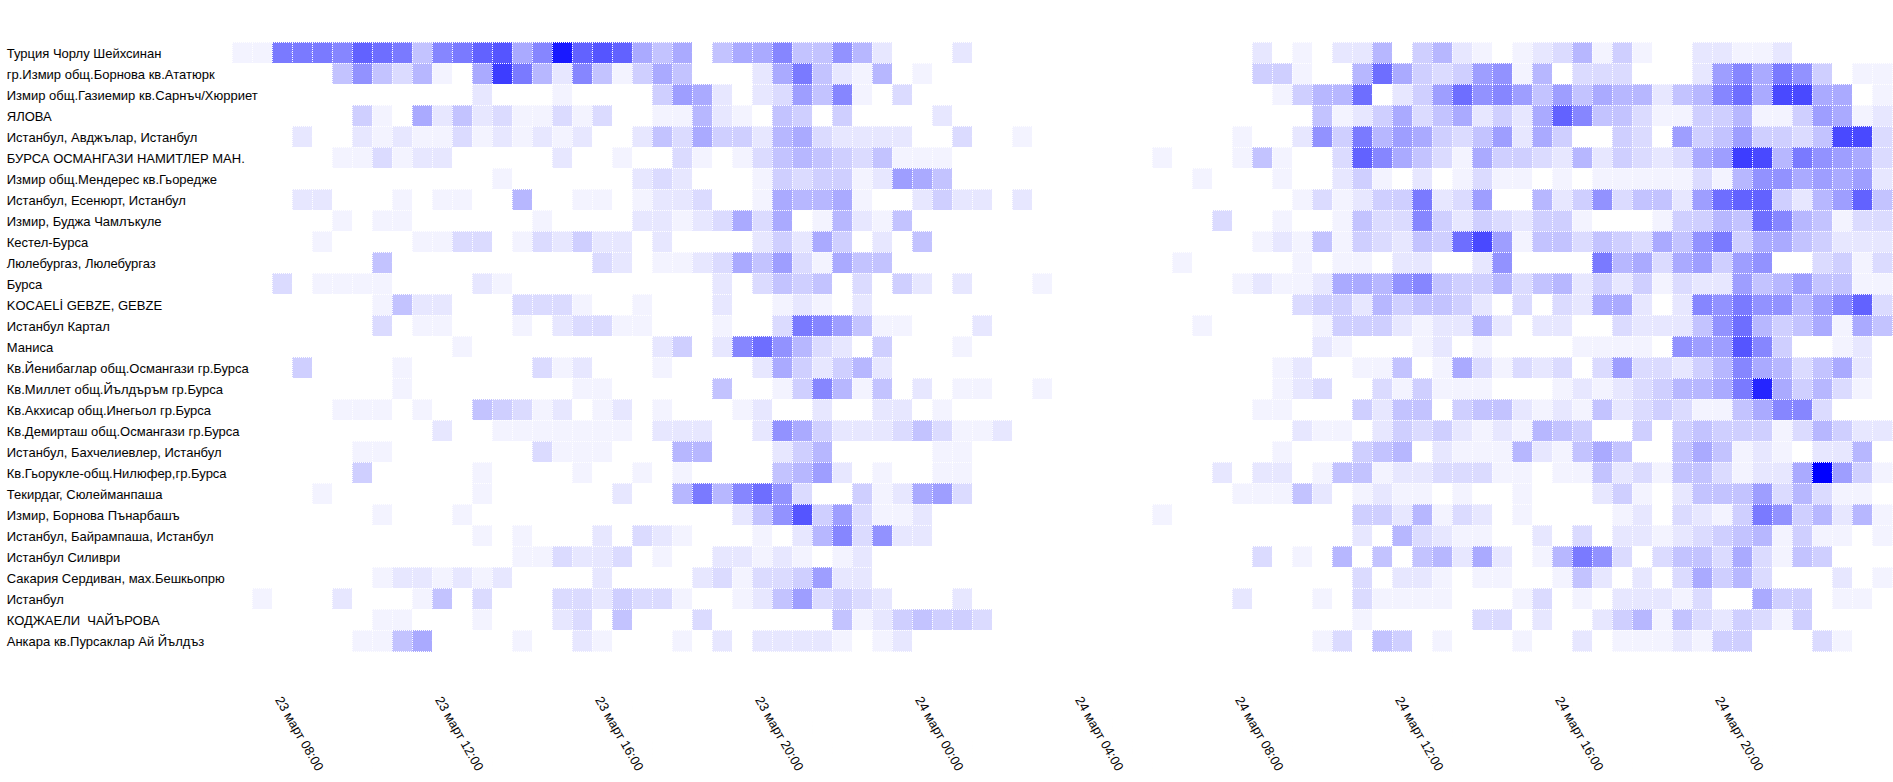
Всичко това създава впечатление за организирано и централизирано подаване на заявления в последния момент. Друг поглед над подаването на заявления в Турция може да видим тук. Разглеждам 30-те места с най-много заявления и броят подадени на всеки 30 мин. в последните два дни от кампанията. Виждат се клъстъри от линии, където равномерно са били подавани заявления за някои секции в конкретни части от деня и почти никакви заявления в други. Има доста, които следват закономертноста от други градове по света, където има много заявления вечерно време. Особено на 24-ти обаче виждаме доста такива групи от нетипично мотоно подаване в рамките на работния ден. По-голяма версия на графиката ще откриете тук, а тук има версия от последните пет дни за същите места.

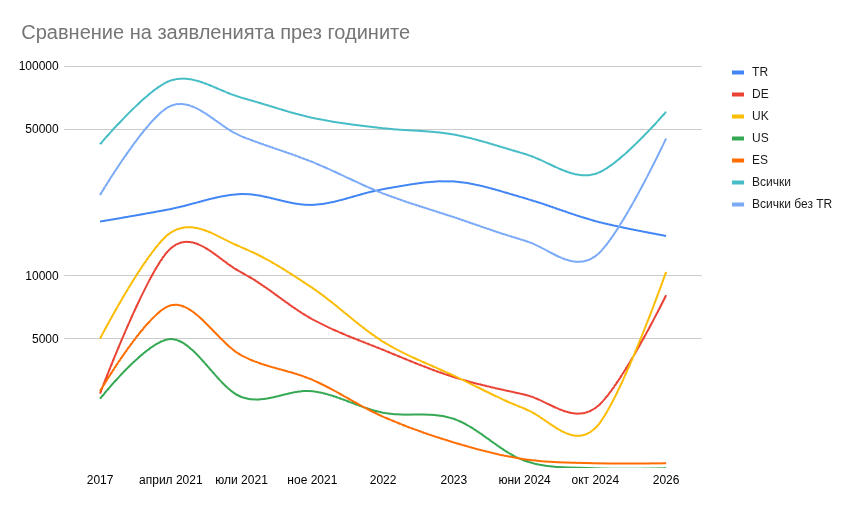
Дори с подобна активност, броят на заявленията от Турция е рекордно нисък като брой за последните 10 години – едва 15500. Един от най-ниските е и като дял от общите заявления – 25.5%. Виждаме ясно, че активността на българските граждани в Турция по време на самия вот също намалява закономерно през годините. Това е нормално предвид емиграцията на младото поколение в Германия, междуособиците в Турция, както и загубата на доверие и контрол от страна на Пеевски сред хора, които не контролира финансово или чрез прокуратурата.

Разглеждайки броят заявления през времето. Виждаме сериозен интерес от Великобритания и Германия. Аналогично се вижда и в други държави в Европа. В Испания няма такъв интерес и почти няма заявления. Там ще бъдат отворени автоматично доста секции подобно на Германия, където има сериозен пик на заявленията. Това може да се обясни с липса на информационна кампания и активност на местните организации. В САЩ също не виждаме активност, въпреки, че подобно на Турция и Великобритания бяха ощетени от промените в изборния кодекс. Тук може да влияят сериозните социални и икономически проблеми там.

Всичко описано до тук дава информация за заявленията и активността през годините. Подробна информация ще намерите на картата и детайлната таблица, където се следеше в реално време с история по часове.

Колко и къде точно ще бъдат самите секции ще разберем тепърва. Според хронограмата трябва да са ясни в рамките на следващата седмица. Решението за това се взима от ЦИК на база препоръка от МВнР. Адресите ще бъдат обявени от МВнР след това. Ще се опитам да създам навреме карта с всички секции най-късно седмица преди вота. Тогава ще изпратя личен email на всичките над 3000 абонирани за бюлетина на Glasuvam.org, посочили в близост до кой град биха предпочели да гласуват. Абонирайте се, ако искате да получите най-близките секции до вас и съвети за процеса на гласуване.

LibreQoS v2.0 released

Post Syndicated from jzb original https://lwn.net/Articles/1064669/

Version
2.0
of the LibreQoS traffic-management and network operations
platform has been released.

This release makes LibreQoS easier to operate, easier to understand,
and much more useful for day-to-day network work. Now users can see
more of what is happening across the network, troubleshoot subscriber
issues with better tools, and work from a much stronger local
WebUI.

This release includes many capabilities that reflect ideas and
direction long championed by our late colleague, Dave Täht.
Dave’s work helped shape the understanding of bufferbloat and the
importance of latency under load across the networking community. His
influence continues to guide both LibreQoS and the broader effort to
improve Internet quality.

The project has also announced
the release of the LibreQoS Bufferbloat Test
v2
, also dedicated to Täht. It runs in a user’s browser to look at
“latency under load, jitter, loss, and what those things mean for
the kinds of traffic people actually care about: browsing, streaming,
video calls, audio calls, backups, and gaming
“.

[$] More efficient removal of pages from the direct map

Post Syndicated from corbet original https://lwn.net/Articles/1064090/

The kernel’s direct map provides code running in kernel mode with direct
access to all physical memory installed in the system — on 64-bit systems,
at least. It obviously makes life easier for kernel developers, but the
direct map also brings some problems of its own, most of which are
security-related. Interest in removing at least some pages from the direct
map has been simmering for years; a couple of patch sets under
discussion show some use cases for memory that has been removed from the
direct map, and how such memory might be efficiently managed.

Security updates for Wednesday

Post Syndicated from jzb original https://lwn.net/Articles/1064634/

Security updates have been issued by Debian (chromium), Fedora (chromium, containernetworking-plugins, musescore, and python-multipart), Mageia (perl-XML-Parser, roundcubemail, trilead-ssh2, vim, and webkit2), Oracle (389-ds:1.4, gimp:2.8, glibc, gnutls, kernel, libarchive, nginx:1.24, opencryptoki, python3, uek-kernel, vim, yggdrasil, and yggdrasil-worker-package-manager), Red Hat (delve, osbuild-composer, and skopeo), Slackware (mozilla), SUSE (dpkg, go1.26-openssl, gstreamer-plugins-ugly, kernel, libssh, ovmf, python-pyasn1, python-tornado6, python311, salt, sqlite3, and systemd), and Ubuntu (linux-aws-fips, linux-azure, linux-azure-fips, linux-fips, linux-gcp-fips, linux-iot, linux-kvm, pjproject, and redis).

From Vectors to Verdicts: Web App Testing with Vector Command

Post Syndicated from Ed Montgomery original https://www.rapid7.com/blog/post/pt-vectors-verdicts-web-app-testing-vector-command

If it’s online, it’s a target

Web applications are no longer just business enablers, they’re often the front door to an organization. They can often generate revenue, enforce identity, connect systems and hold customer and business data.

“75% of successful Vector Command breaches were conducted through web apps.” –Principal Security Consultant, Vector Command Team at Rapid7

From SaaS platforms and identity providers to customer portals and internal tools, attackers increasingly rely on web applications as their initial access point. In fact, application-driven attacks account for a significant percentage of real-world breaches. But testing web applications for real risk isn’t the same as scanning for bugs; that’s where Vector Command (Rapid7’s continuous managed red team service) comes in.

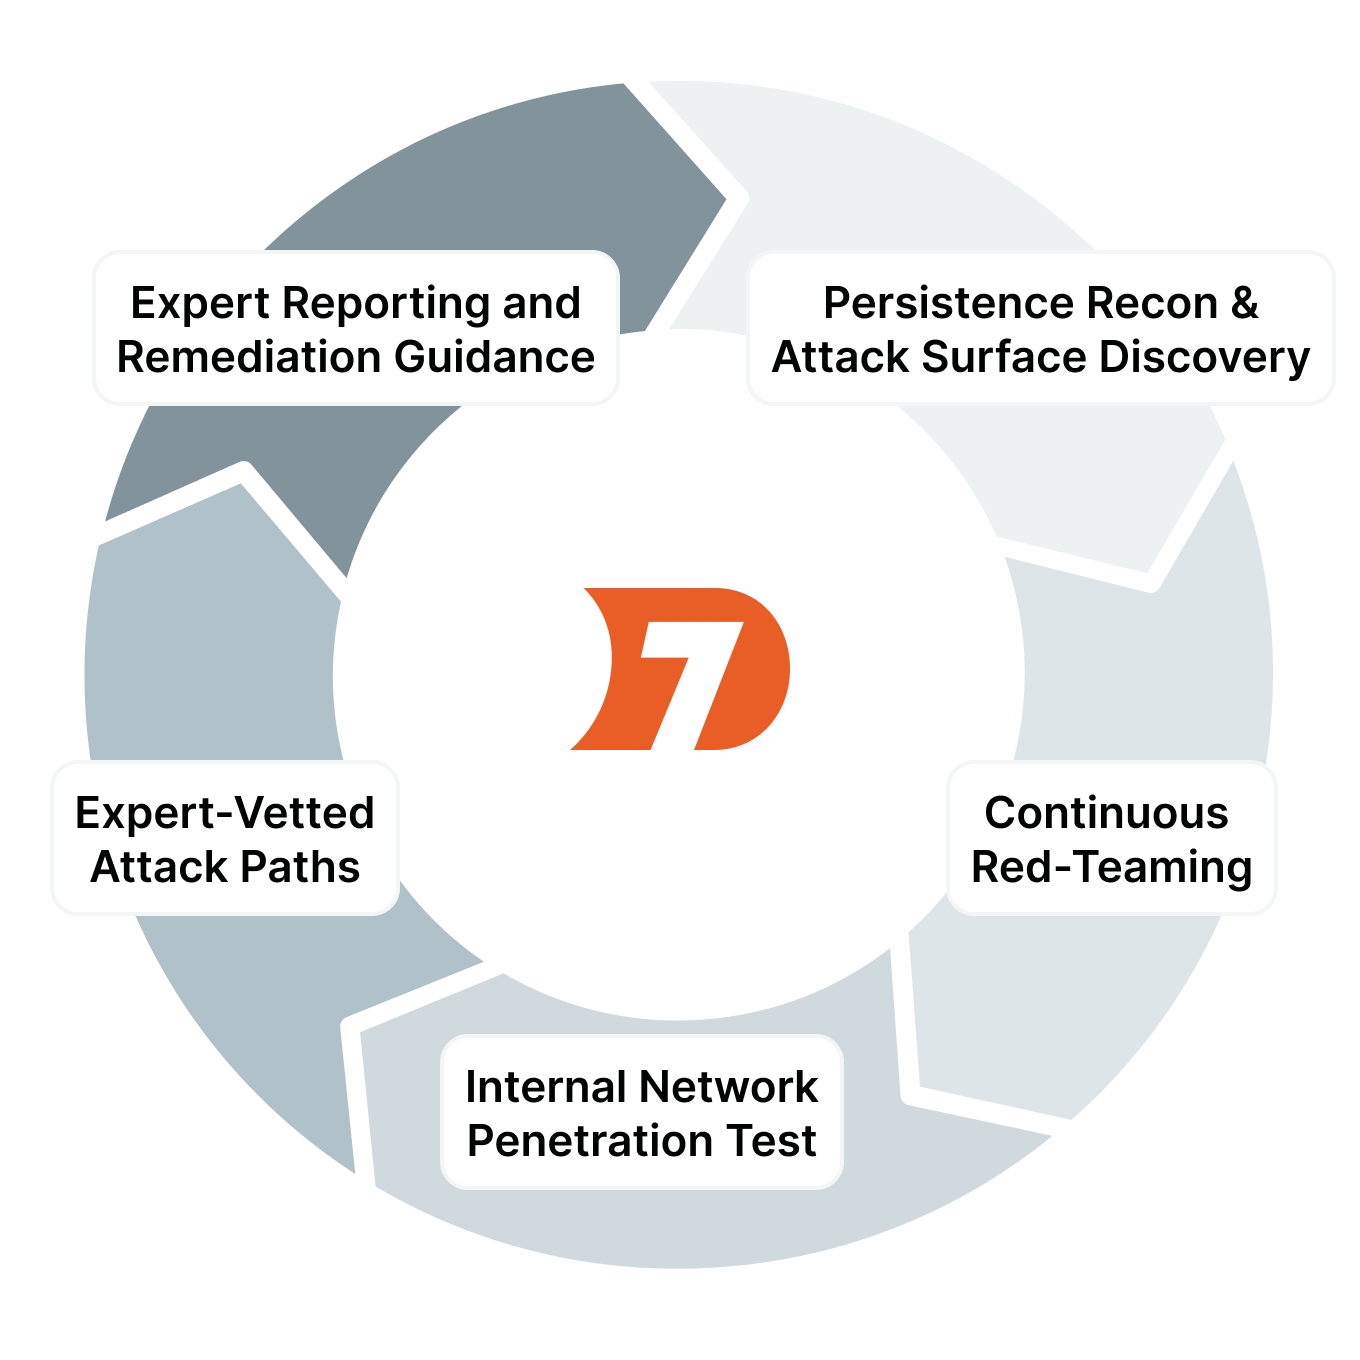
Rapid7-Vector-Command-Advanced.png
Figure 1: Vector Command Advanced

How Vector Command approaches web applications

Vector Command evaluates web applications the same way real attackers do, by asking a single question: Can this application be used to meaningfully compromise the organization?

Rather than attempting to enumerate every possible vulnerability, Vector Command focuses on exploitation paths that lead to real outcomes, such as:

  • Account takeover

  • Session hijacking

  • Abuse of SaaS trust relationships

  • Access to internal systems through vulnerabilities, such as malicious file uploads, injection issues, or misconfigurations in common web frameworks

  • Lateral movement across applications

  • Exfiltration of source code, if found during a breach

Testing begins without authentication against externally facing applications, the external attack surface, or to put it another way, what a potential threat actor can see. If legitimate paths exist – self-registration, broken authentication and authorization controls, misconfigurations exposing unintended application functionality, or overall poor site hygiene leaking information that needs further research – those paths are pursued as part of a broader attack chain.

The result isn’t a long list of low-risk findings, but rather a clear picture of what actually works.

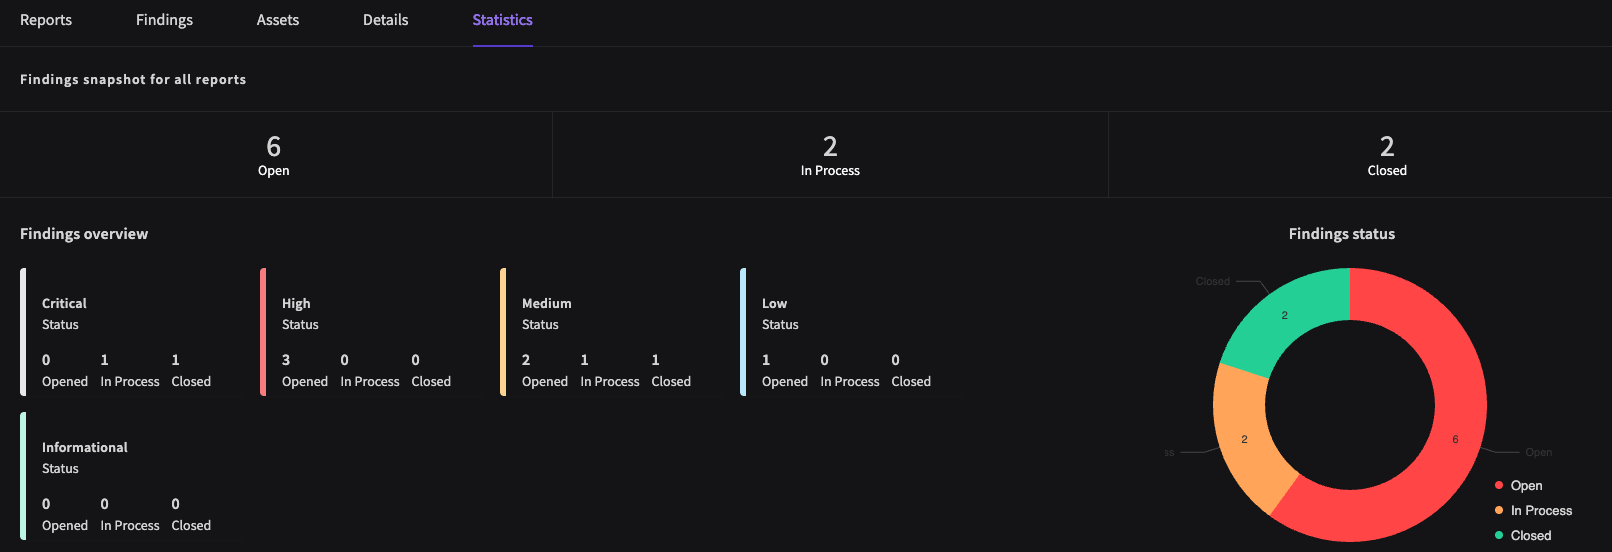
Rapid7-Sample-Vector-Command-findings.png
Figure 2: Sample Vector Command findings, by status

What Vector Command does not do

Vector Command is intentionally not a replacement for a full web application penetration test, although Rapid7 does offer this service.

It does not:

  • Guarantee full application coverage.

  • Perform DAST or SAST scanning.

  • Enumerate non-exploitable low-severity or theoretical vulnerabilities.

  • Review source code unless it’s obtained during an attack.

If your goal is to understand every potential flaw in an application, a dedicated web app penetration test is the right approach. However if your goal is to understand whether your sprawling stack of externally facing applications can be used to break into your organization, Vector Command is designed for that purpose.

A real-world example: when the ticketing system becomes the attack path

In one recent Vector Command engagement, attackers didn’t exploit a zero-day or complex vulnerability.

Instead, they targeted an externally accessible and very popular, SaaS ticketing portal used by IT. Through a well-placed social engineering attempt, they gained access to an internal support workflow. Any organization could register for the customer’s SaaS deployment, which was used to host IT documentation and their ticketing system.

The Vector Command team submitted a ticket to the customer’s IT team, seeking assistance to help fix an application installation issue. A SharePoint URL was provided to IT to view the software documentation, however… This SharePoint site was a proxy phishing portal, created by our Vector Command experts, designed to capture Office365 login sessions and the user’s MFA prompts. 

Hook, line and cookie: the result?

The unsuspecting IT help-desk employee had been phished and was convinced to run the Rapid7 payload, giving our Vector Command team access. The engagement demonstrated how easily trust relationships could be abused. From there, a malicious link led to session capture within a trusted collaboration platform.

  • Account takeover

  • Session theft

  • Lateral movement using legitimate tools

  • Access granted without triggering traditional defenses

No single “critical bug” caused the breach. It was the interaction between applications, identity, and trust that made it possible. That’s exactly the kind of risk Vector Command is designed to uncover and each one of our red team members has a particular speciality, when used together, they are formidable. 

Vector Command and web app pentesting: better together

Vector Command and web application penetration testing serve different, but complementary purposes. Web app pentests help teams build more secure applications, while Vector Command helps teams understand how those applications affect real-world security exposure.

One improves code; the other tests assumptions.

A final thought

Vector Command doesn’t try to answer “What could be wrong?”, answering instead, “What would actually succeed?”

Modern breaches rarely hinge on a single critical bug. They succeed because trusted systems interact in ways no one has validated.Vector Command tests those assumptions, continuously.

Sen. Wyden Warns of Another Section 702 Abuse

Post Syndicated from Bruce Schneier original https://www.schneier.com/blog/archives/2026/03/sen-wyden-warns-of-another-section-702-abuse.html

Sen. Ron Wyden is warning us of an abuse of Section 702:

Wyden took to the Senate floor to deliver a lengthy speech, ostensibly about the since approved (with support of many Democrats) nomination of Joshua Rudd to lead the NSA. Wyden was protesting that nomination, but in the context of Rudd being unwilling to agree to basic constitutional limitations on NSA surveillance. But that’s just a jumping off point ahead of Section 702’s upcoming reauthorization deadline. Buried in the speech is a passage that should set off every alarm bell:

There’s another example of secret law related to Section 702, one that directly affects the privacy rights of Americans. For years, I have asked various administrations to declassify this matter. Thus far they have all refused, although I am still waiting for a response from DNI Gabbard. I strongly believe that this matter can and should be declassified and that Congress needs to debate it openly before Section 702 is reauthorized. In fact, when it is eventually declassified, the American people will be stunned that it took so long and that Congress has been debating this authority with insufficient information.

Over the decades, we have learned to take Wyden’s warnings seriously.

Detect Issues in Your Zabbix Instance Before It’s Too Late

Post Syndicated from Janis Eidaks original https://blog.zabbix.com/detect-issues-in-your-zabbix-instance-before-its-too-late/32741/

In this blog post, I will show you how to detect performance issues in your Zabbix instance – in advance!

You might be using Zabbix to monitor your infrastructure, devices, and applications, but are you also monitoring your own instance? It might seem unnecessary – after all, what’s there to monitor, right? Your instance just works, so everything is good. What else is needed?

Remember though, if your Zabbix database system runs out of disk space, data collection will come to a halt. If the data collectors are insufficient, the collected data will be inconsistent, and this will also affect the problem detection.

If you run out of cache space on your Zabbix server, depending on which cache is affected, your Zabbix server might crash immediately or experience degraded performance. A lot of things can go wrong, and you need to stay ahead of them! Here’s how.

Tune your database

If you are using the default settings for your database, you are missing out on significant performance improvements that are just unused! Your actual instance performance is tied to the database performance. If the database performance is low, you will have a degraded Zabbix monitoring experience as well.

Do at least minimal fine-tuning, only change the settings you understand: read the documentation, check the official Zabbix blogposts, Zabbix community forum, and perform testing. Of course, you can use every tool at your disposal to make it work, such as AI, but always test the settings in the test environment.

The database tuning is a complex task. Initial parameters that you could tune for the MySQL DB are these:

innodb_flush_log_at_trx_commit = 0
innodb_flush_method = O_DIRECT
optimizer_switch=index_condition_pushdown=off
innodb_buffer_pool_size= ~75% of RAM if only DB engine running or less if shared with other applications

For a PostgreSQL database, you can use online tuner PGTUNE for initial configuration:

https://pgtune.leopard.in.ua/

Monitor the Zabbix database

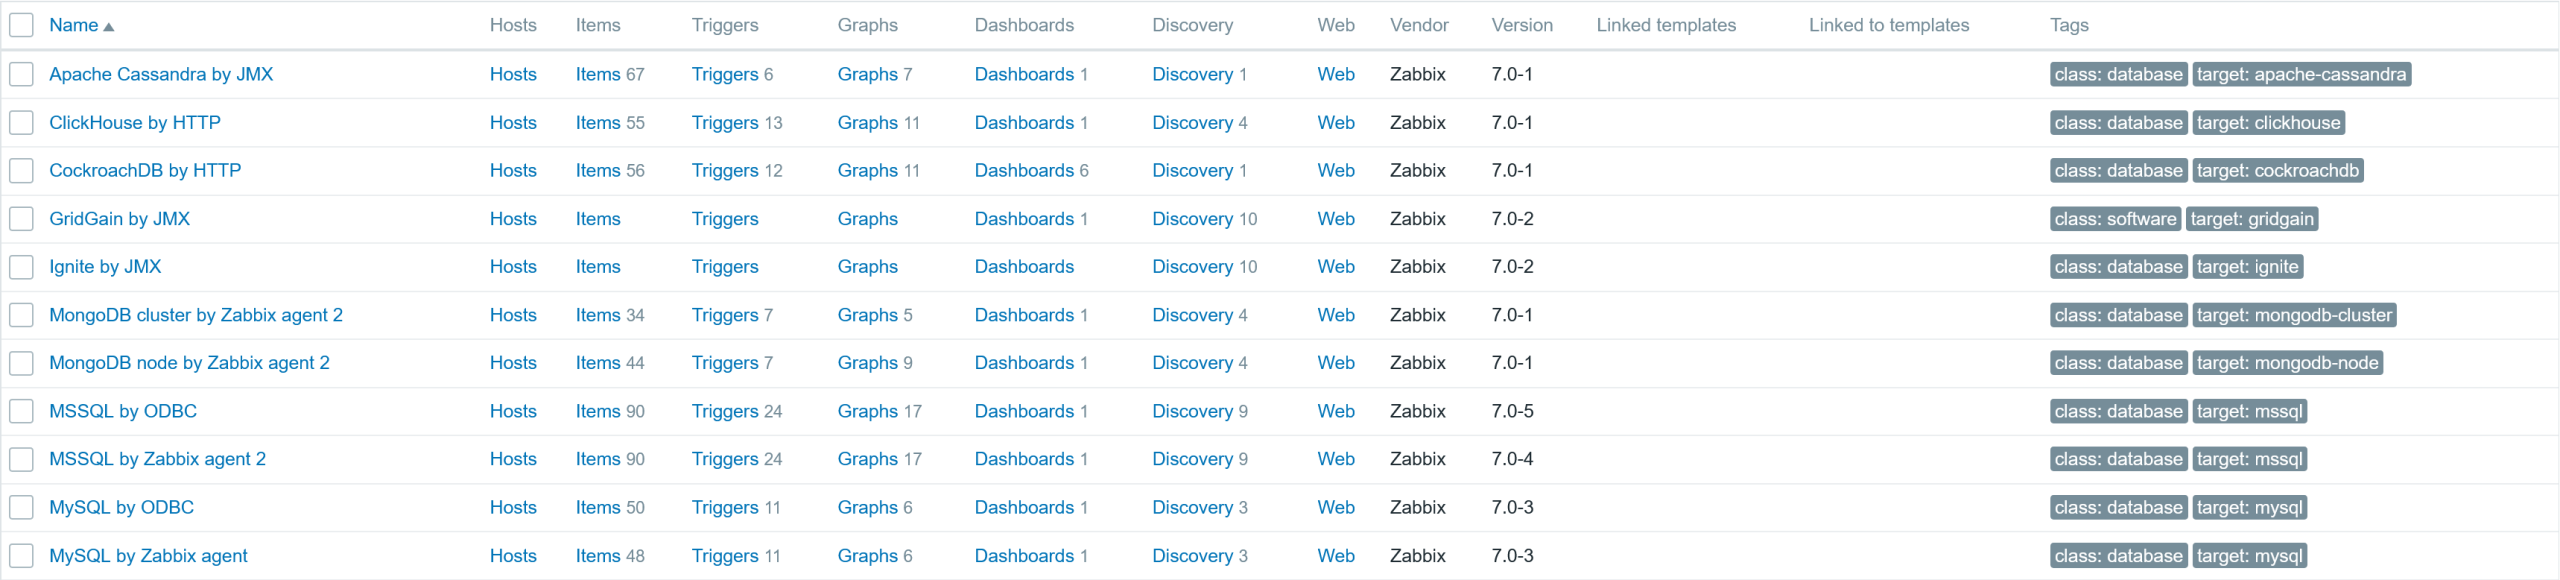
It is important to monitor your database. Zabbix offers several out-of-the-box options to monitor the most popular databases through different methods: either by Zabbix agent or Zabbix agent2, by ODBC checks, using Zabbix Java gateway or by HTTP checks. If an issue is detected, you will get a corresponding problem event. Don’t forget to manually update the old Zabbix templates to the current version after the Zabbix server upgrades.

Fig 1. Some of the available out-of-the-box templates for database monitoring

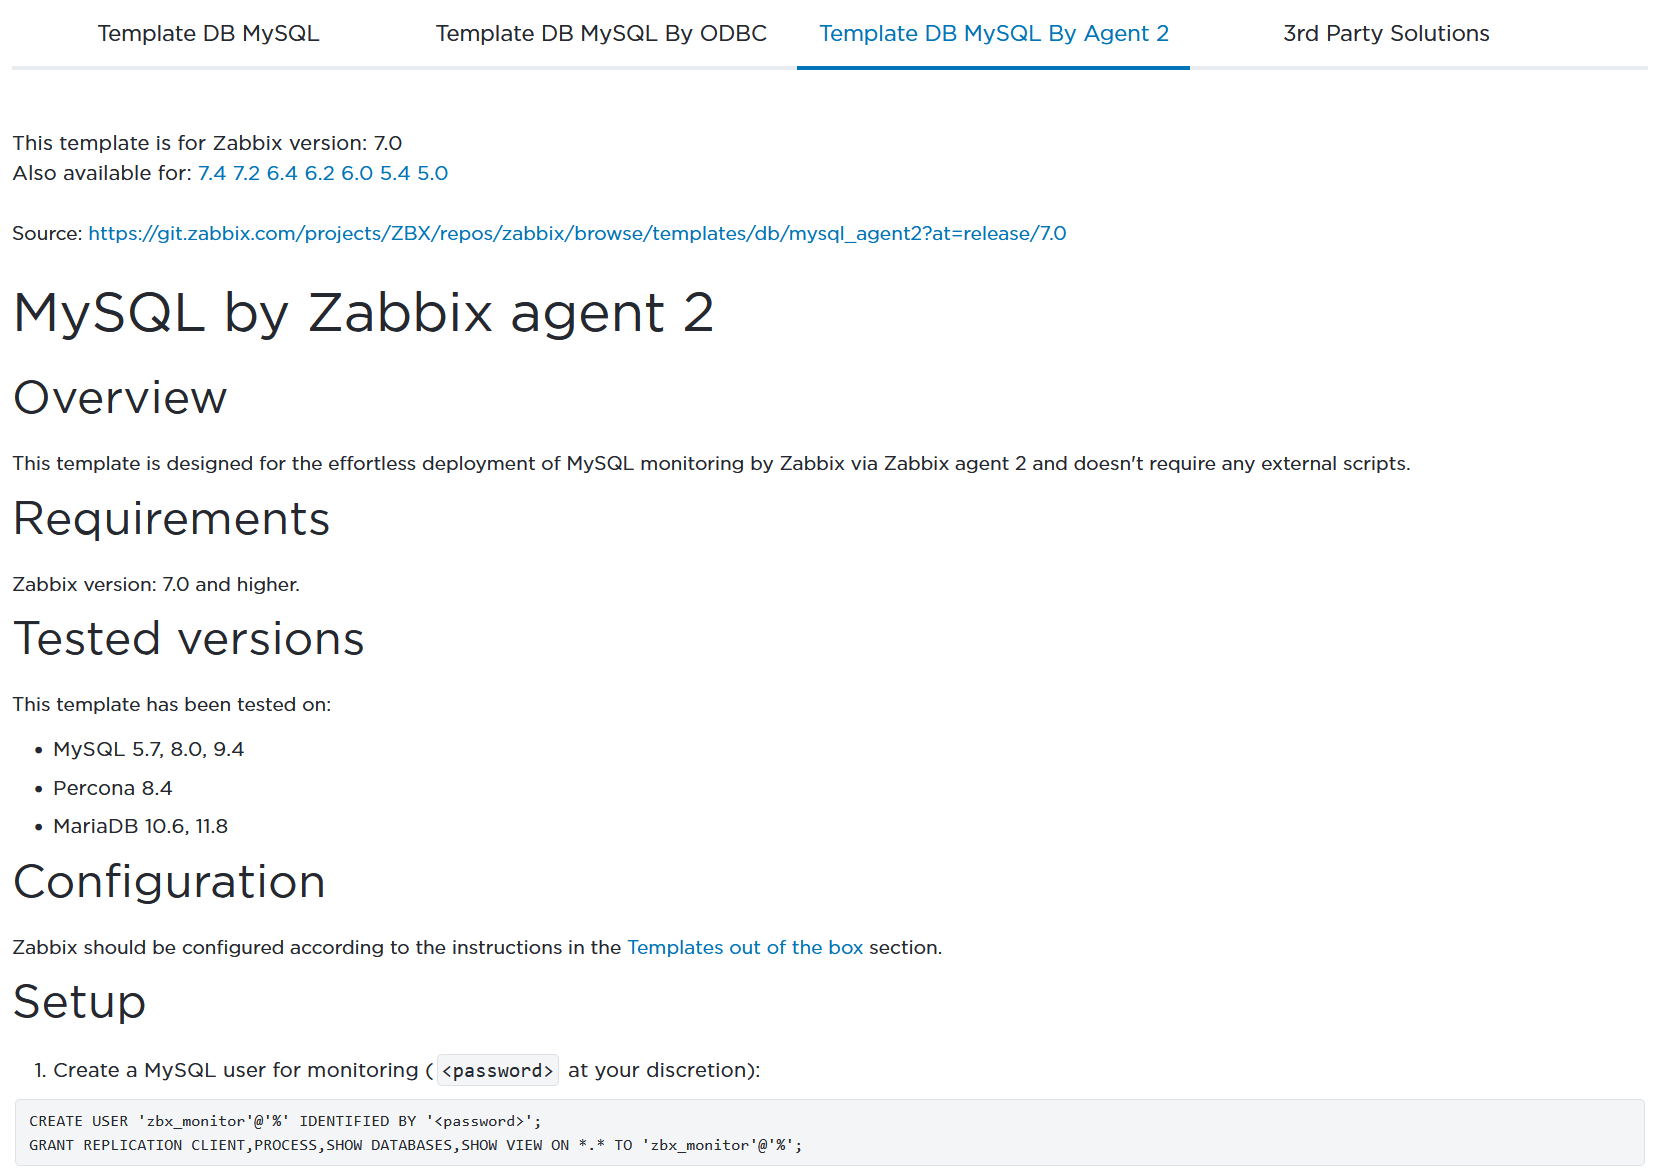
Of course, depending on the approach you have selected to monitor the database, you will need to do some additional steps for that to work. More information on how to configure it is available on the Zabbix integration page.

Fig 2. Example of the configuration required to monitor the MySQL database with Zabbix agent2

Monitor the Zabbix server

The next thing you should check is the Zabbix server host dashboards. In new instances, the Zabbix server host has already been included out of the box with two templates: Zabbix server health and Linux by Zabbix agent. If such a host has not been retained for some reason, now it’s time to create it and start monitoring your Zabbix server.

The Zabbix server health template uses Zabbix internal items that do not require any interface. The Linux by Zabbix agent template does require a running Zabbix agent on the Zabbix server system in order to gather the OS related metrics.

Fig 3. Zabbix server host with linked templates

Check the current state of your Zabbix server

Once you have such a host, go to the menu Monitoring > Hosts and use the main filter to find the Zabbix server host and select its Host Dashboards.

Fig 4. Host dashboards

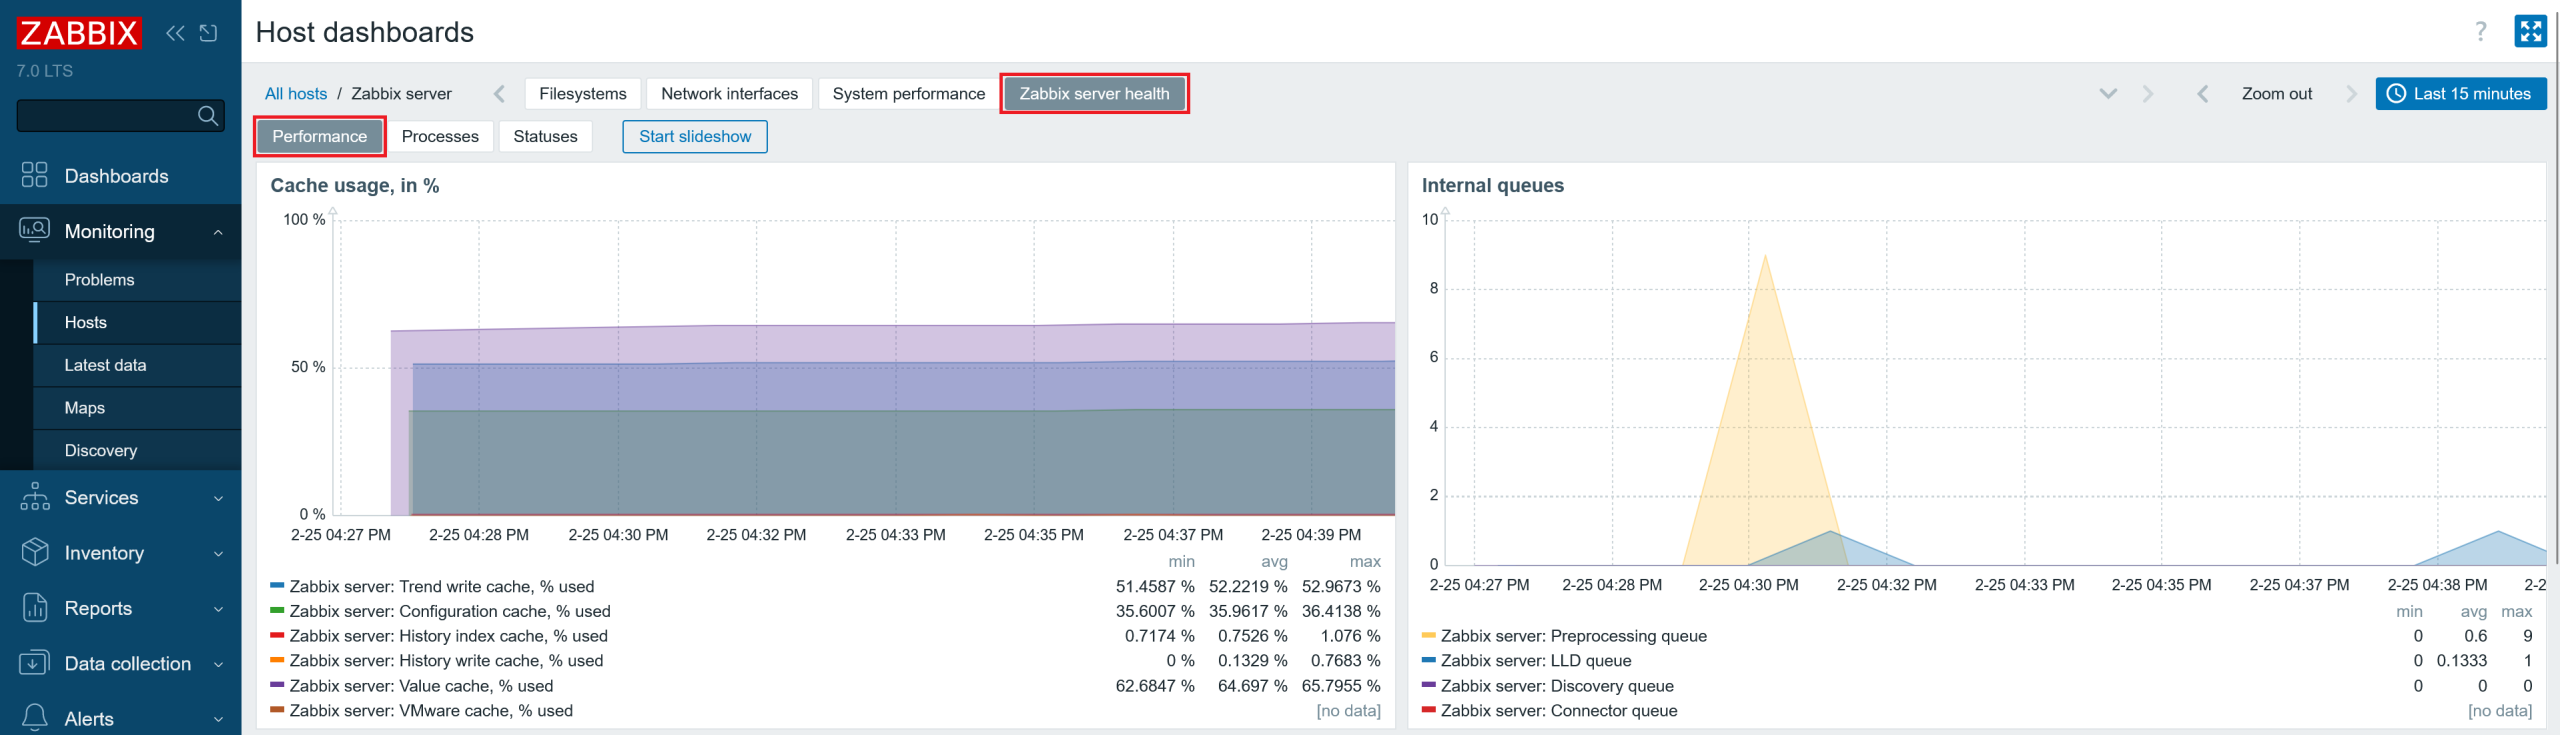
Select the Zabbix server health dashboard. Below, you will see the following pages under it – Performance, Processes, and Statuses.

Fig 5. Zabbix server health dashboard page: Performance

Check the cache utilization

In the Performance page, you can see the usage of Zabbix server caches. You should make sure that all caches except the history cache are at least ~ 50 % free. Technically, you can make the caches as large as possible; at worst, they will just be under-utilised. So, adjust the cache sizes accordingly.

Consequences of running out of configuration cache

If you add a lot of hosts in an automated way and have a relatively small or default configuration cache size [configcache], you could fill this cache quickly. The consequences of it are:

  • The Zabbix server will crash
  • The Zabbix server will be unable to start
  • The Zabbix server will not collect any data

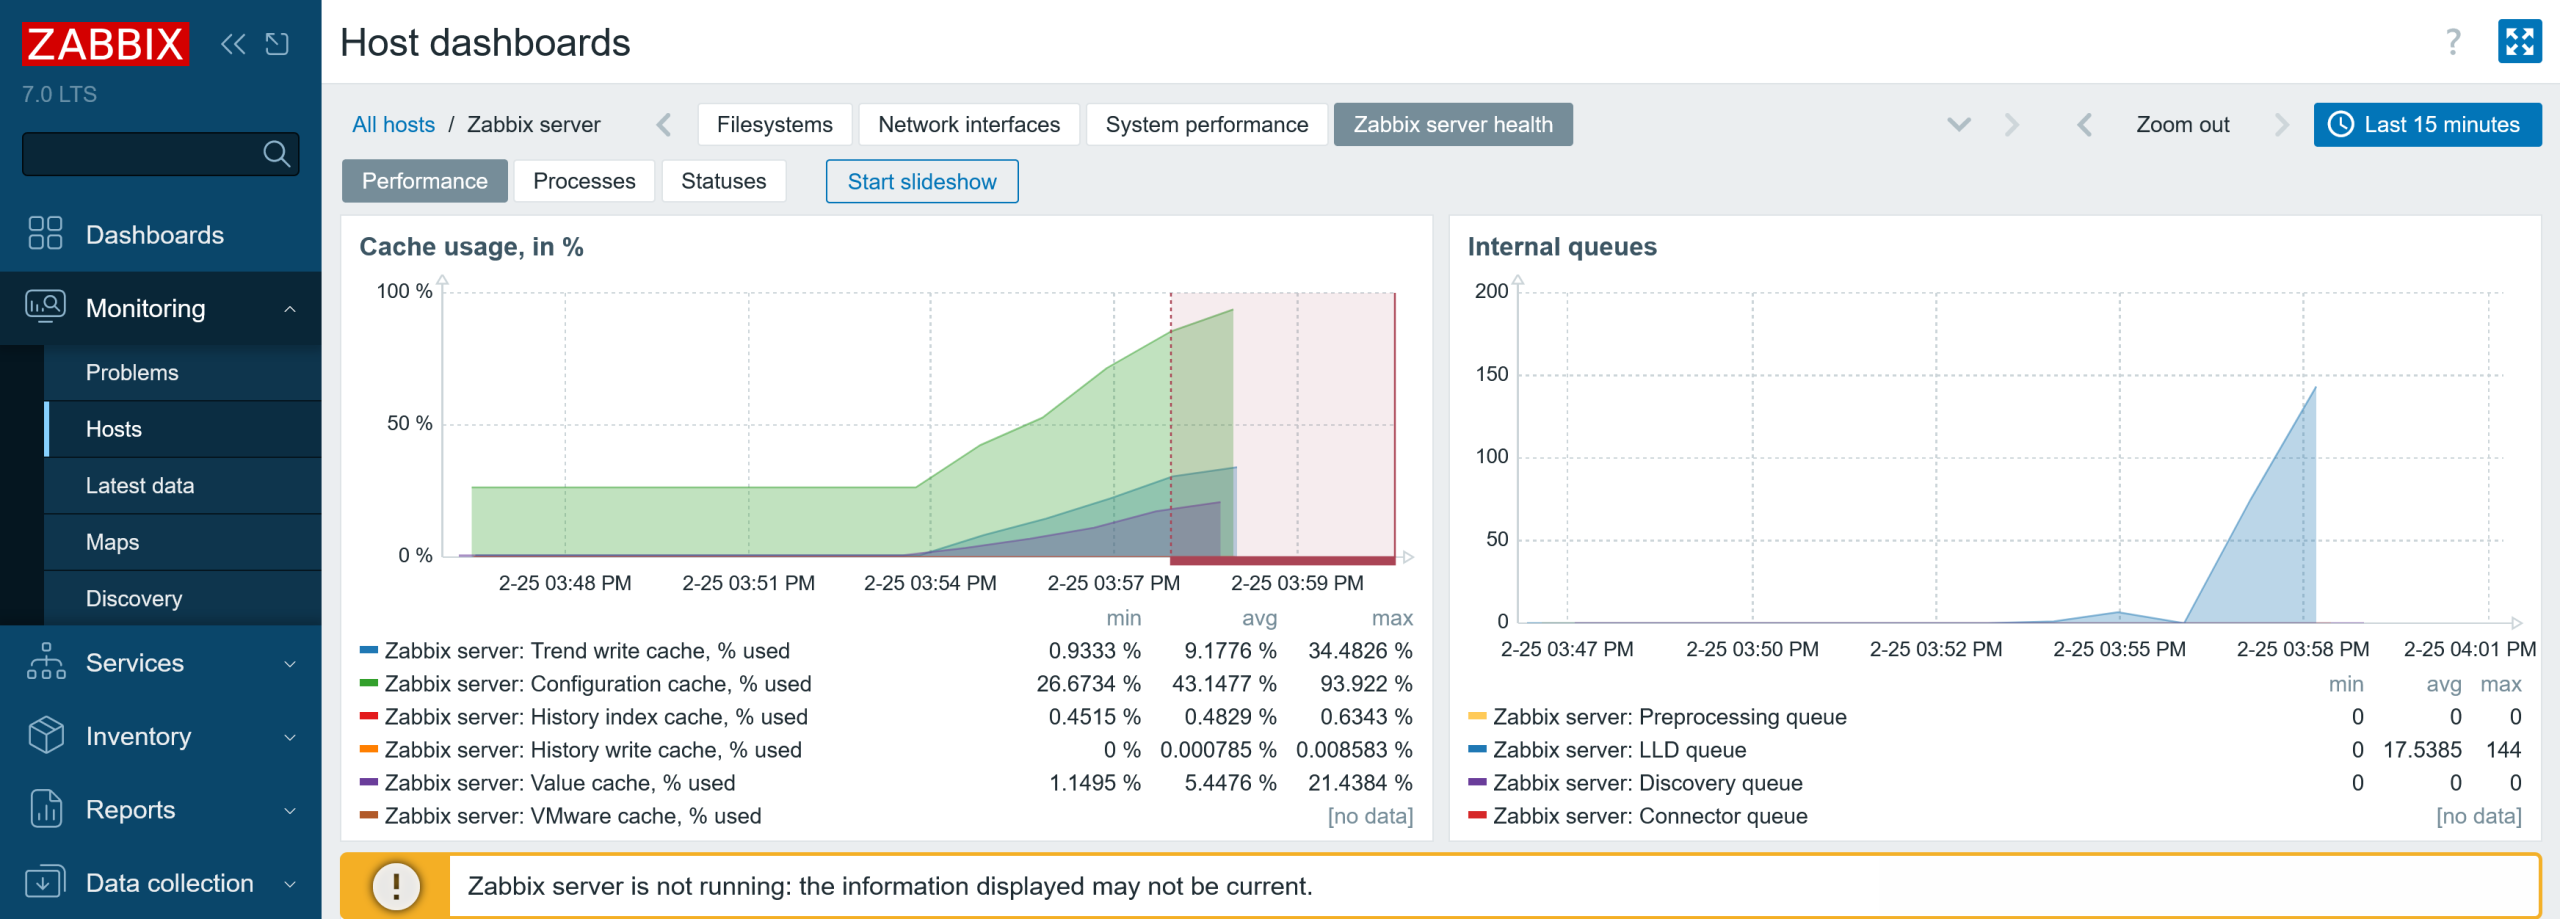
You will also see a warning message in the Zabbix frontend:

Fig 6. Zabbix server health dashboard page when running out of config cache

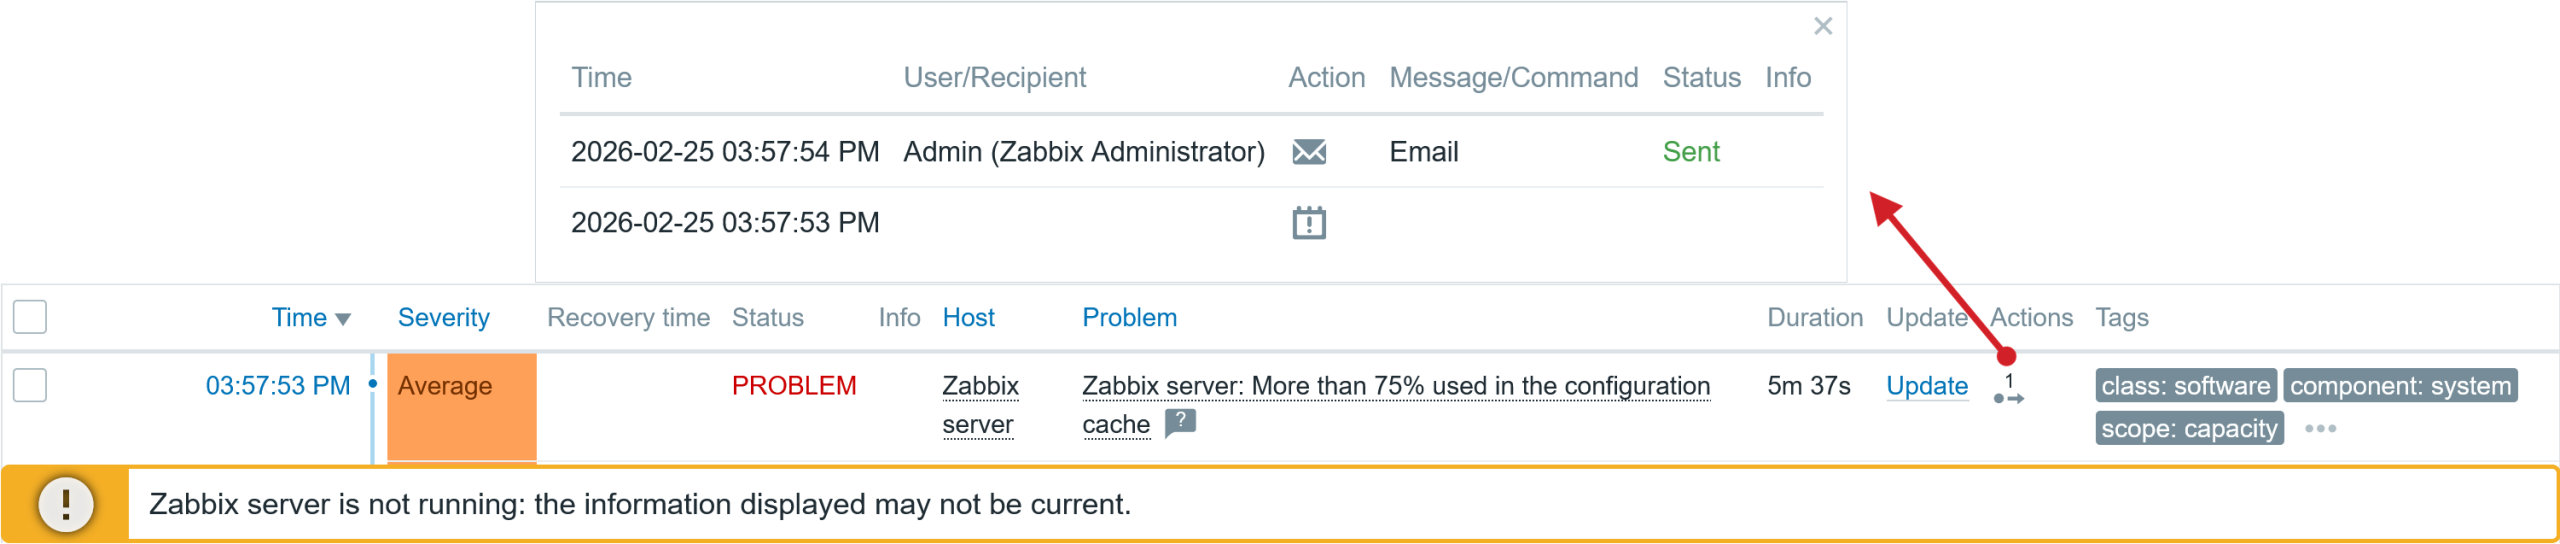
If the config cache does not fill up instantly, the problem event will be generated shortly after, and matching action operations will be executed while the Zabbix server is still running, for example, notifying admins about the issue. In the screenshot below, you can see that one action operation step was executed before the server crashed.

Fig 7. Generated problem event

When a Zabbix component is not working as expected, your best source of information is the log file, as it informs you about the issues. Here is the error message in the Zabbix Server log file below.

Fig 8. Zabbix server log file error: out of memory for config cache

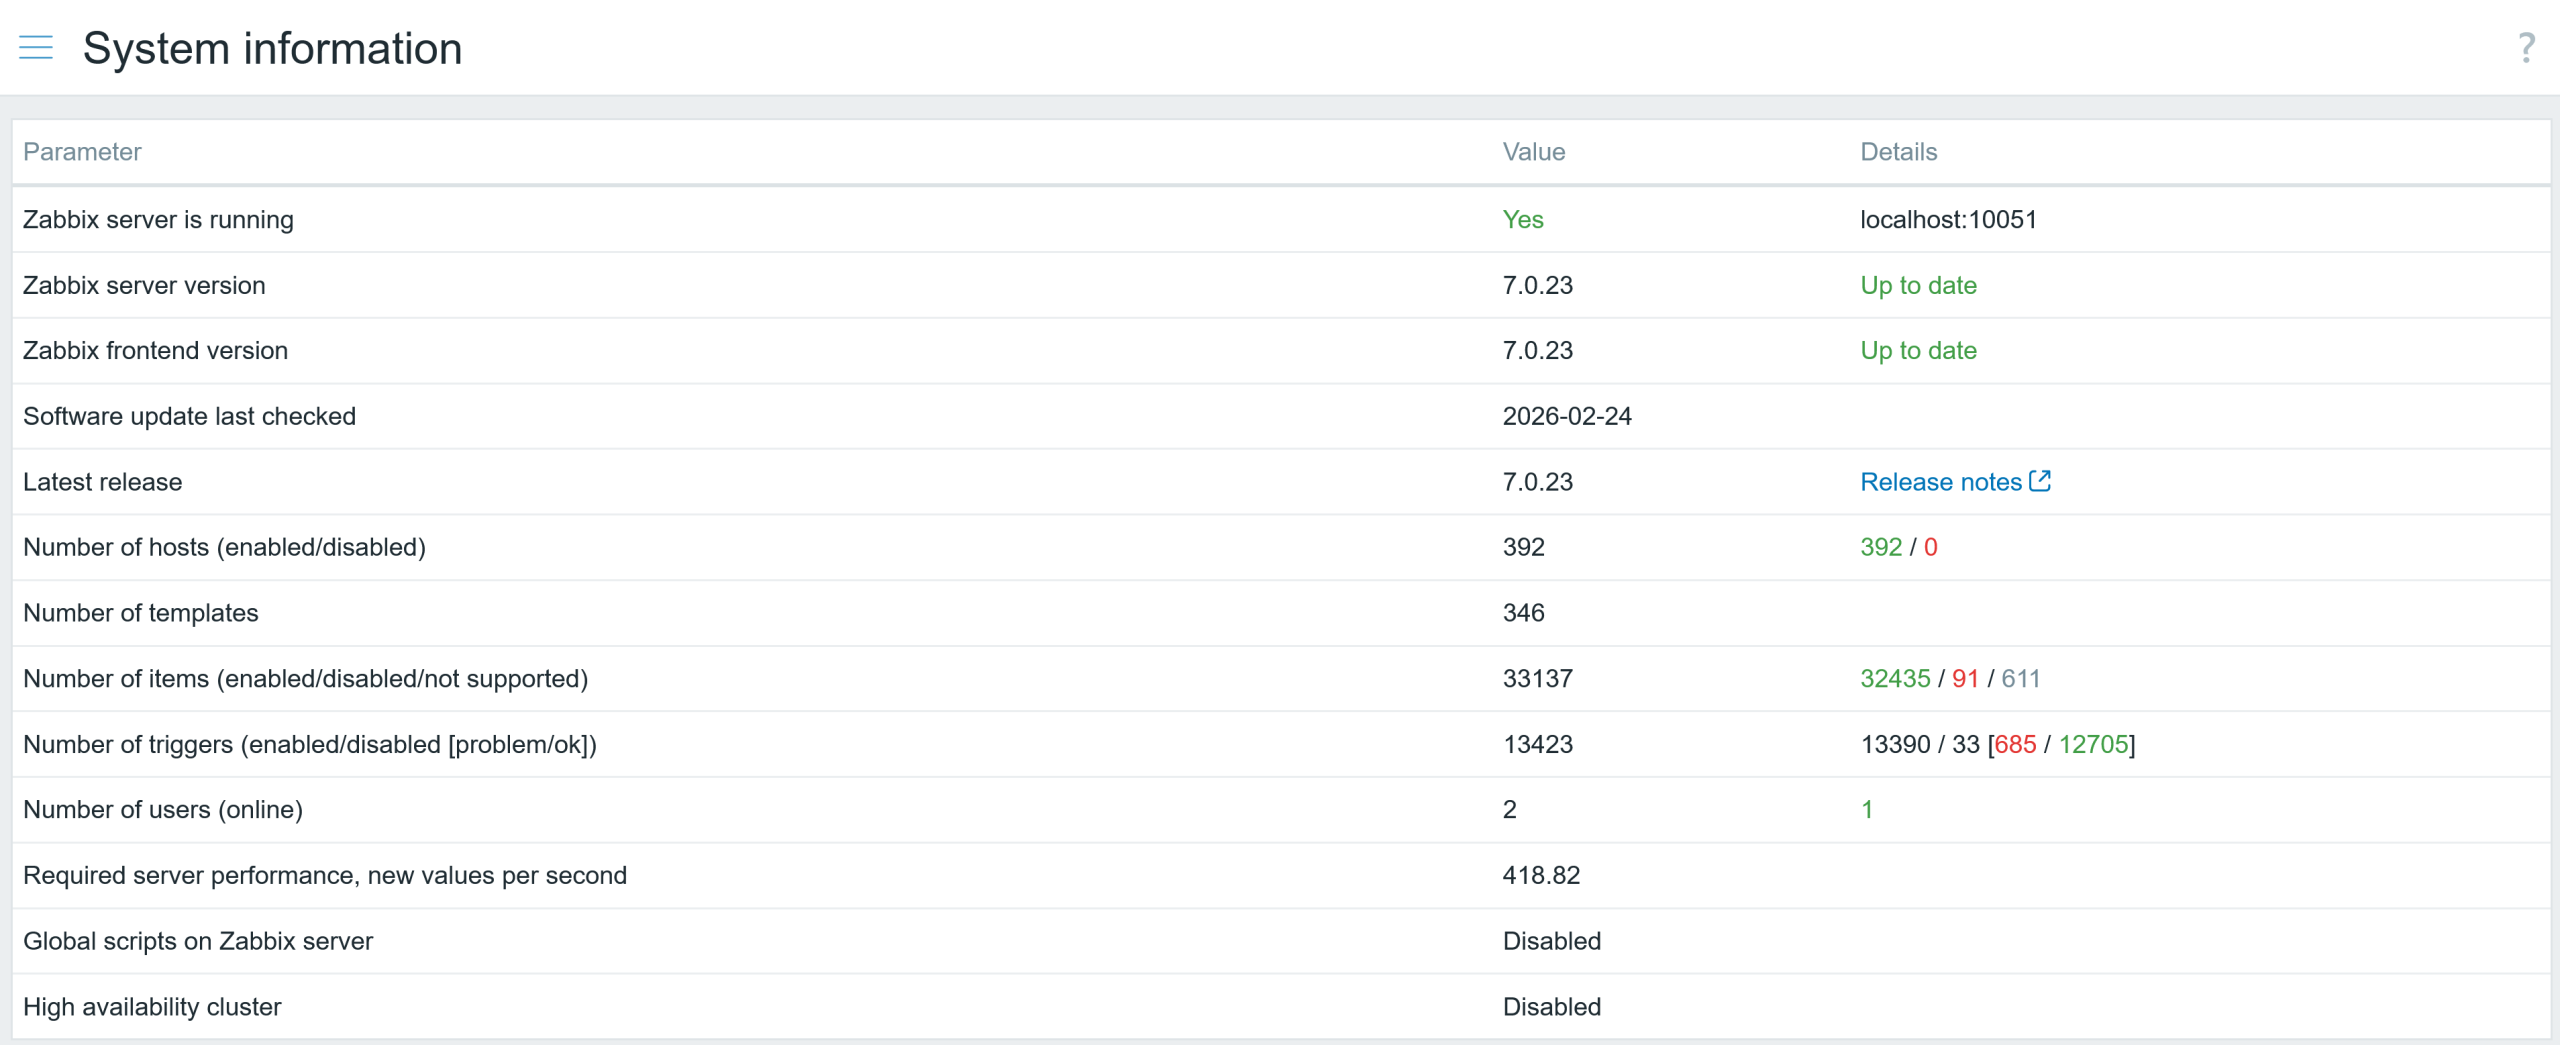
The solution is very simple: just increase the configuration cache size (two times or more) and restart the Zabbix server. If you expect a significant increase in hosts in the near future, you can be more generous and allocate more memory. My current Zabbix server is monitoring approximately 400 hosts.

Fig 9. The system information of my Zabbix server

Consequences of running out of value and history cache

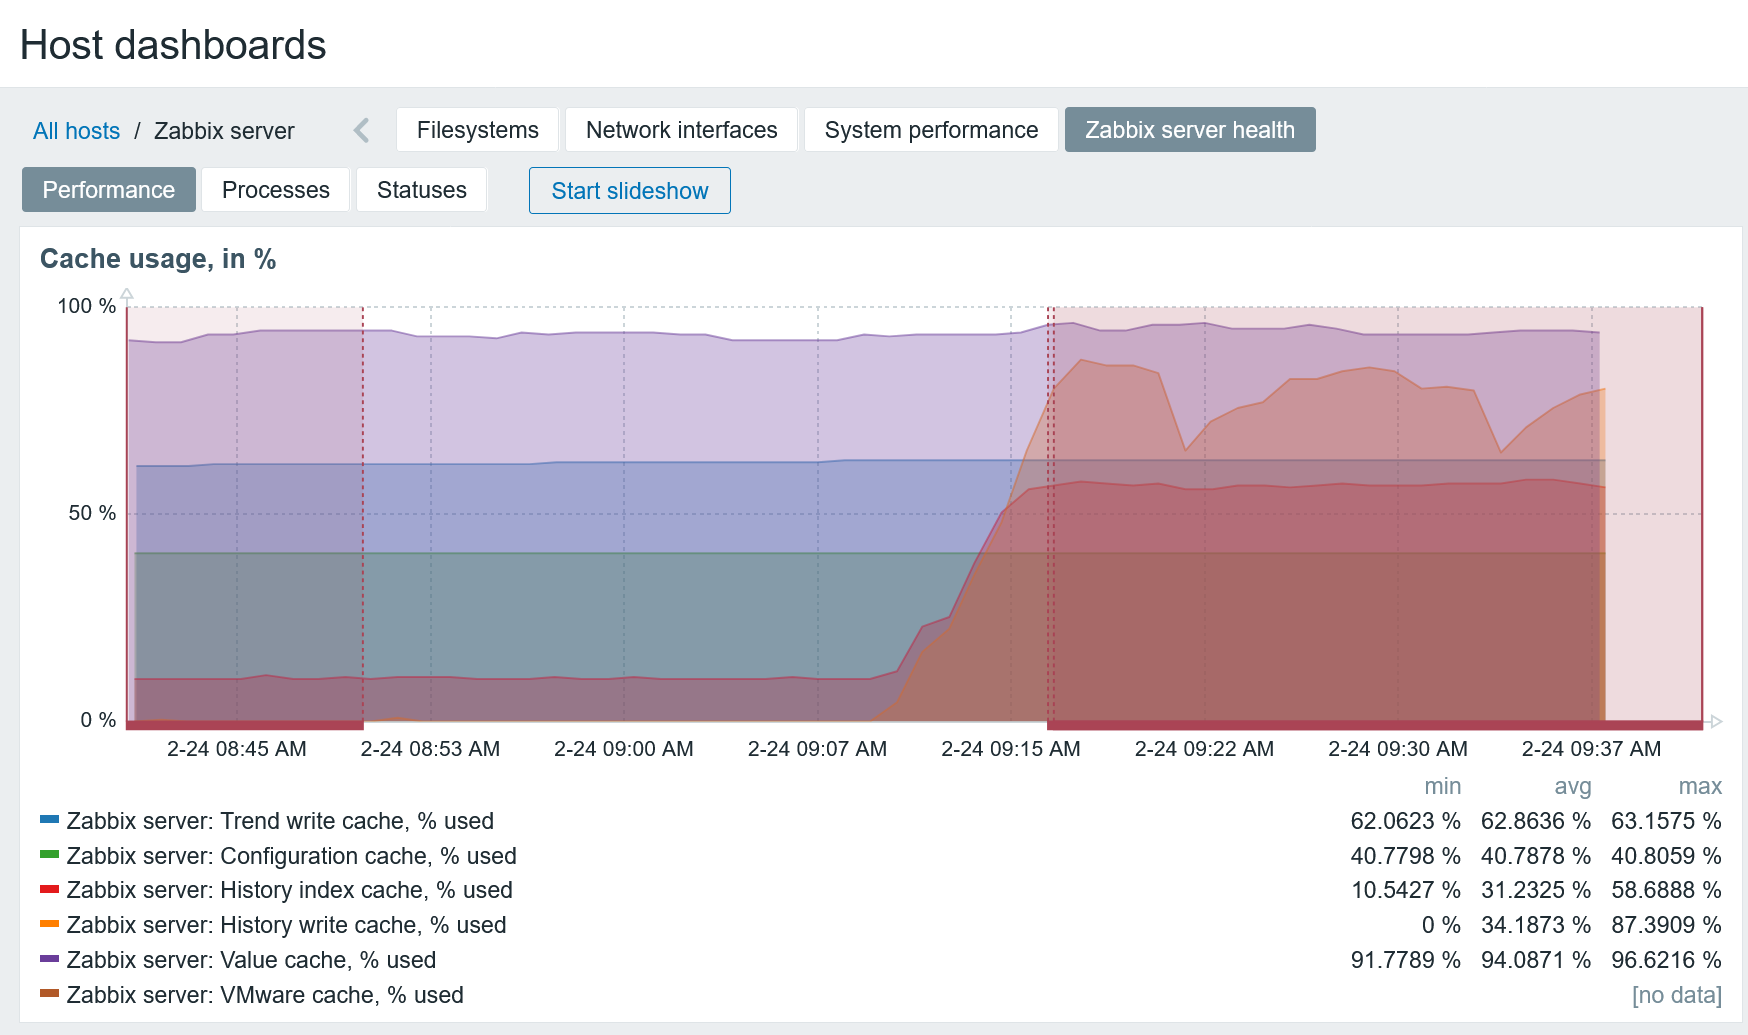
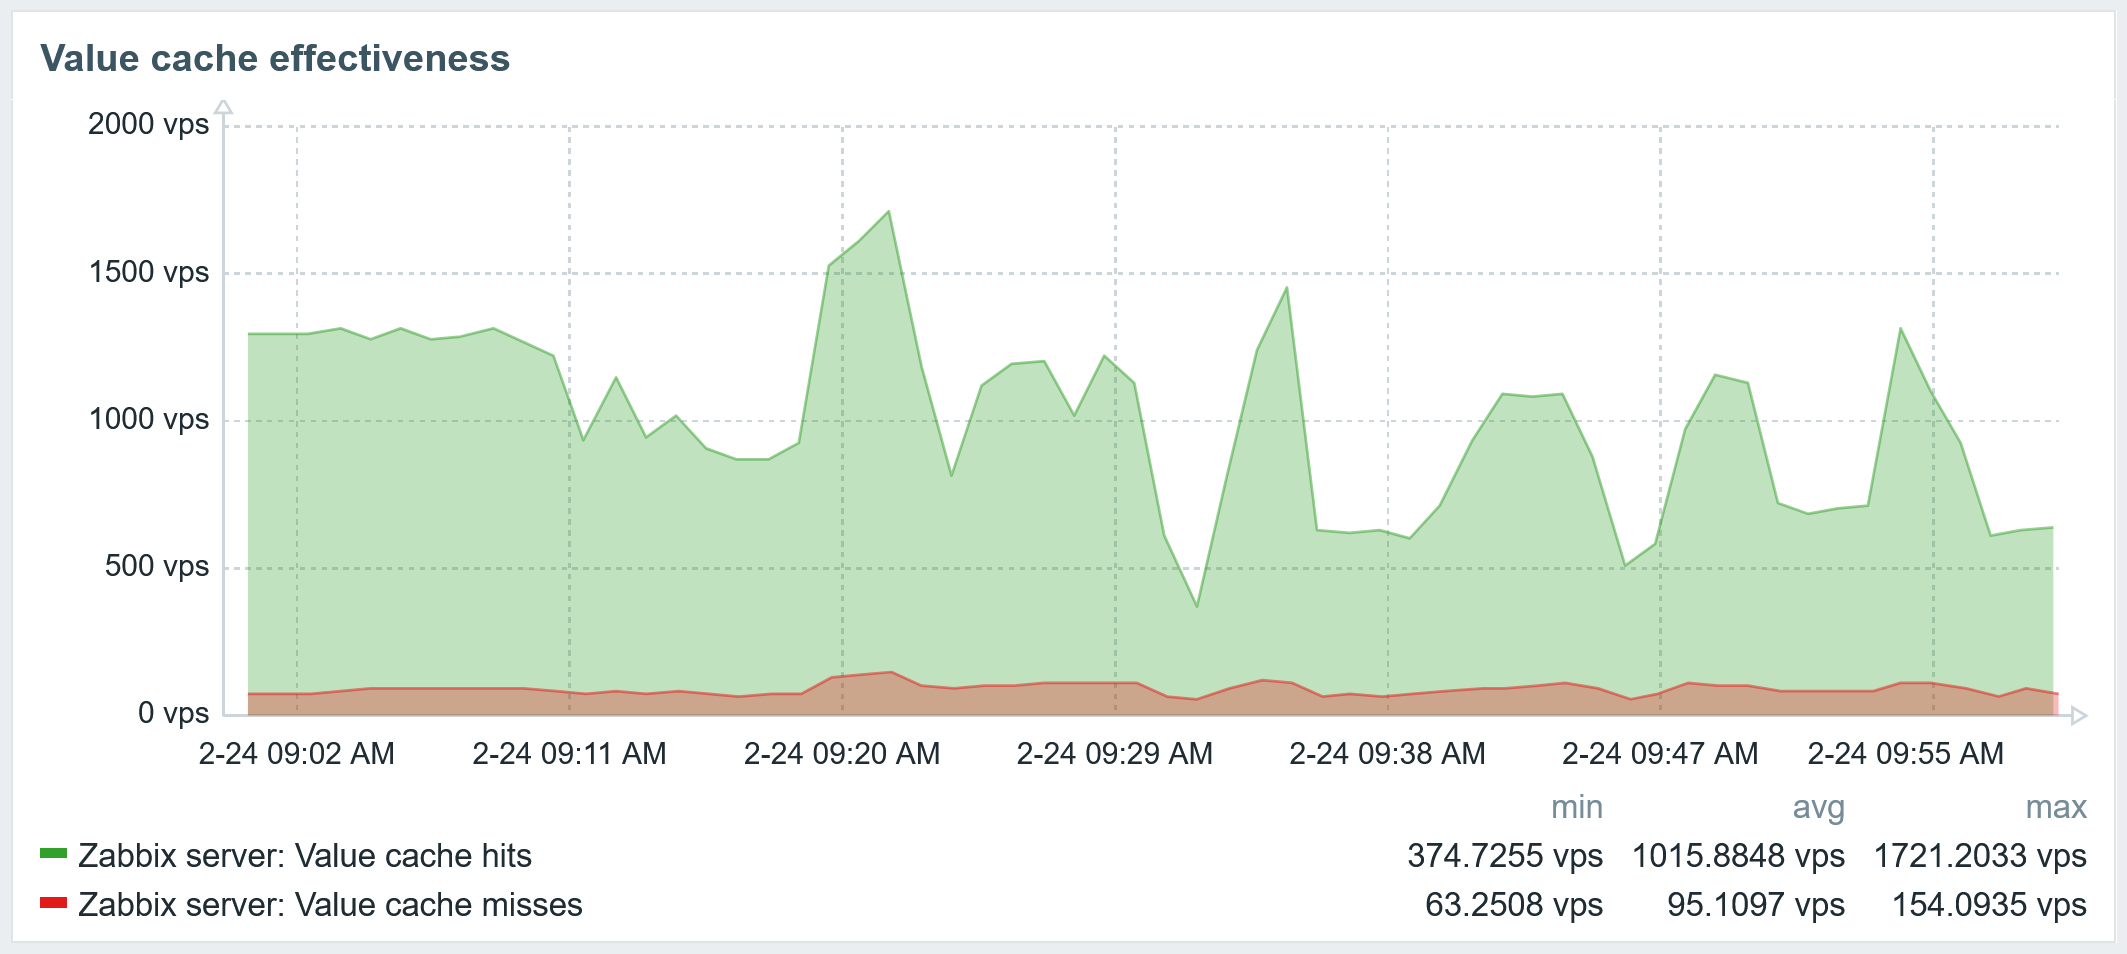
So, what happens if you run out of value cache? Zabbix server performance will degrade, and the frontend will become noticeably less responsive. Why is that? Value cache stores item values used for calculated items and evaluating triggers. Now, for each trigger calculation that does not contain an item metric in the history cache will be retrieved directly from the database.

Fig 10. Zabbix server health dashboard performance page for cache usage

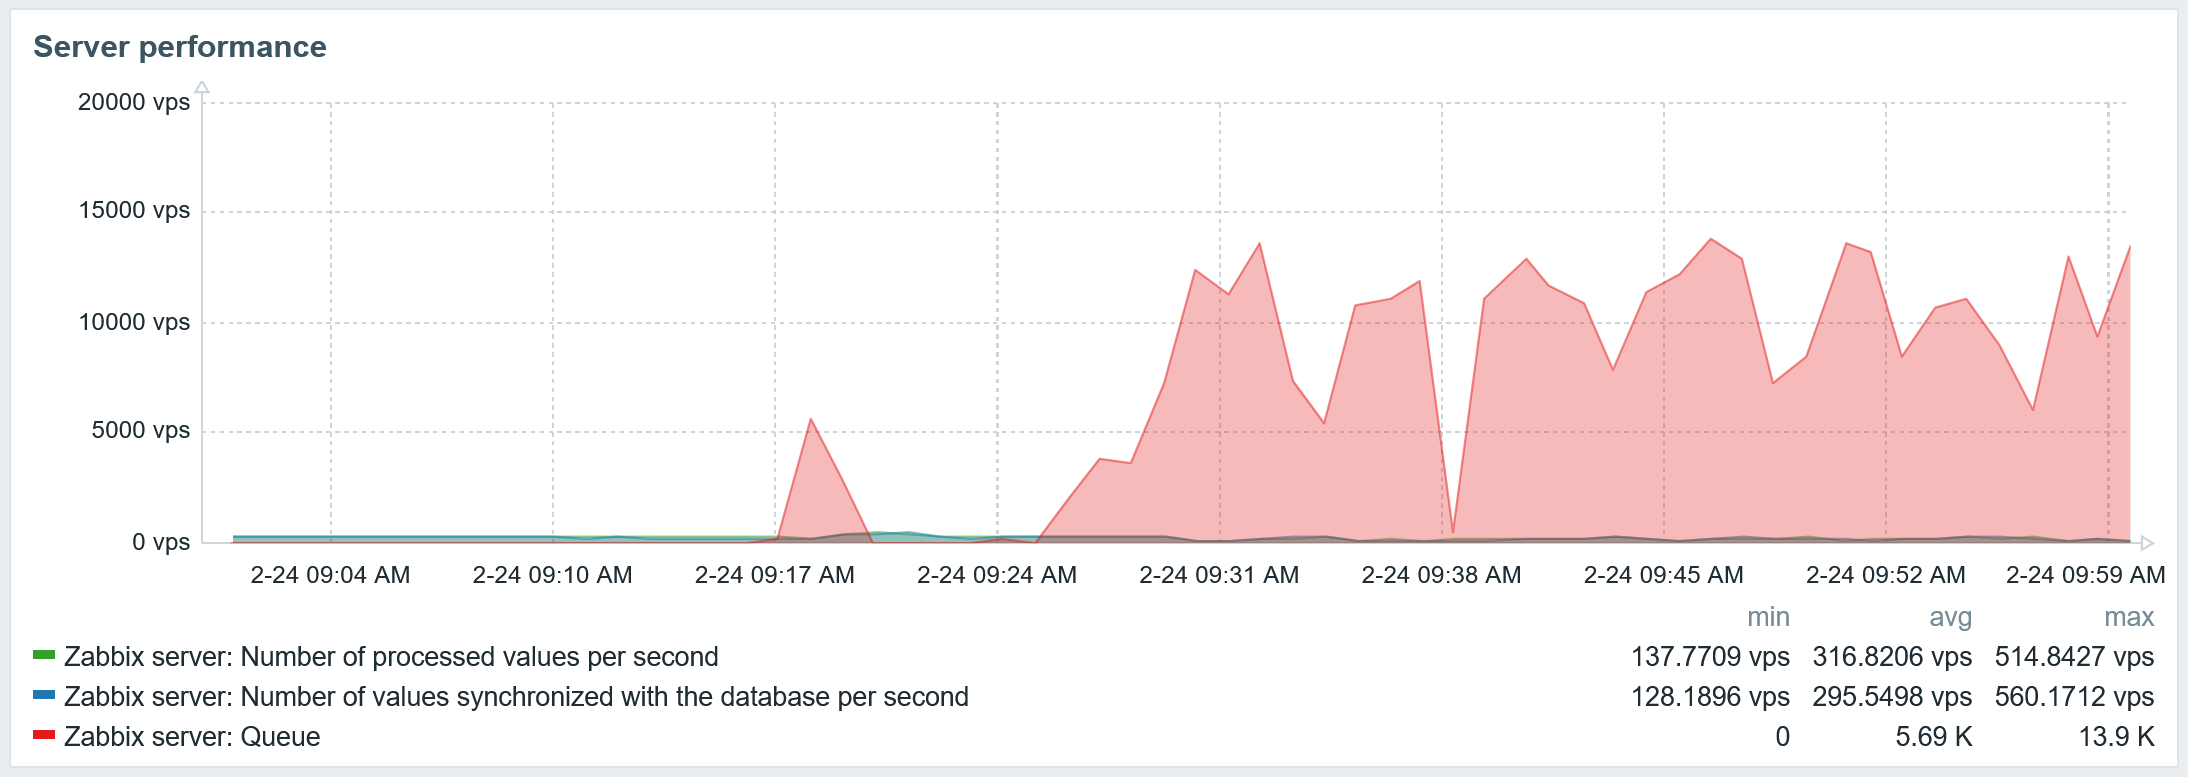
The history cache stores historical data that will be written to the database. If it’s mostly full, it means you might have issues with your database performance – the Zabbix server is unable to write data fast enough to the database. This can trigger a cascading performance degradation with a negative feedback loop. In my case:

  • A full value cache leads to additional DB read queries
  • DB performance drops, which leads to slow historical data writes to the database
  • The history cache also starts to fill up
  • The data collection is delayed due to the full history cache
  • As more data is collected, database read queries retrieve more data, progressively worsening the cycle

Technically, it does not require your value cache to be 100% full to have this issue – if a lot of triggers use a long-time interval for evaluation, you could have a situation where your value cache is only 85% or 90% full, but the Zabbix server is unable to fit the required item history records in available memory.

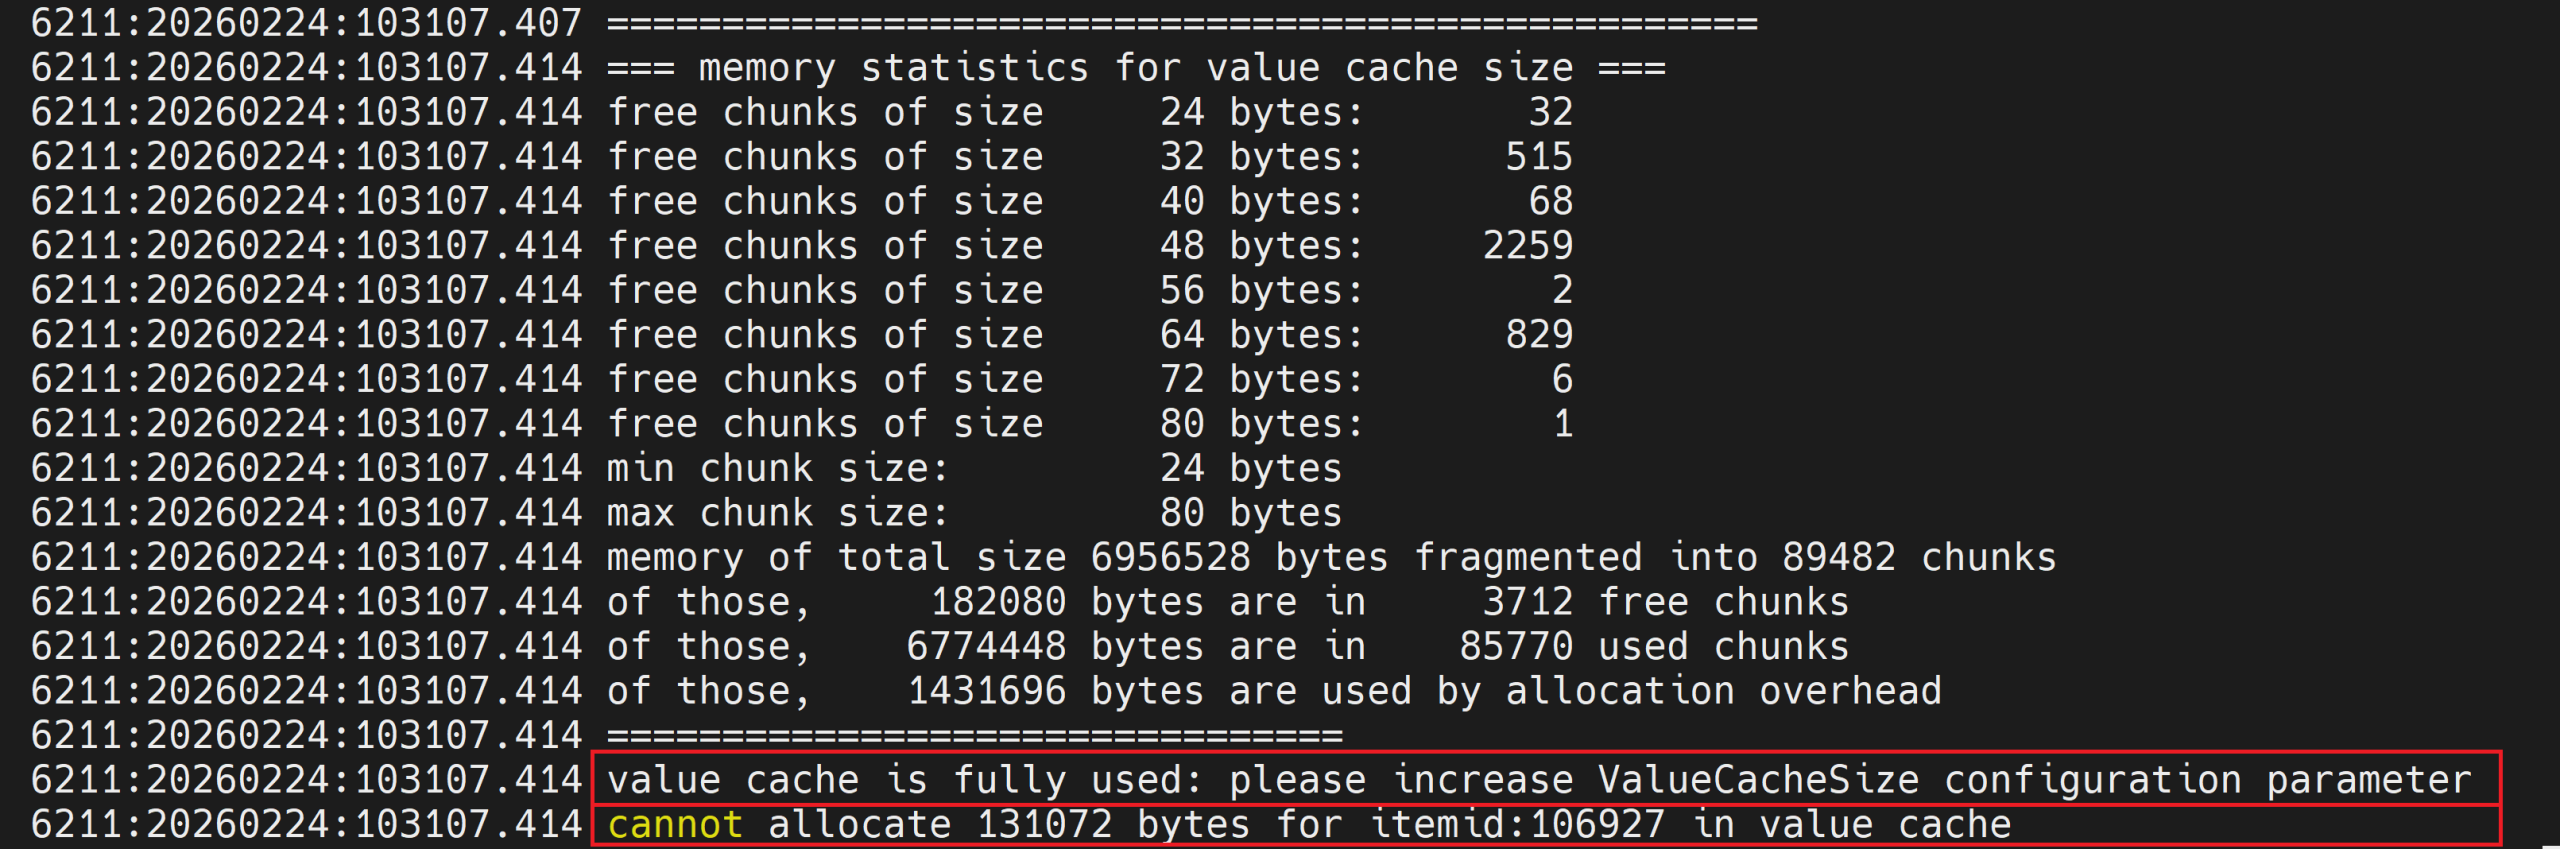
The issue with running out of value cache will also be logged in the Zabbix server’s log file.

Fig 11. The Zabbix server log file with value cache error

The solution to this issue is simple: increase the value cache size and restart the Zabbix server.
If you monitor your Zabbix server with the health template, problem events will be automatically generated when:

  • Value cache works in a low memory mode
  • History cache utilization exceeds 75 %
Fig 12. The generated problem events about the value cache issue

The issue with the Value cache working in low memory mode can also be seen in the graph below. Here you can see how many historical item values were present in cache, and how many had to be retrieved from the database directly.

Fig 13. Value cache effectiveness graph

Due to the terrible performance of the untuned database, when my history write cache fills up the data collectors are throttled, causing a pileup of delayed item collection.

Fig 14. Zabbix server performance graph

Slow database queries will appear in the Zabbix server log file.

Fig 15. The Zabbix server log file with slow query errors

The result of cache tuning and database tuning

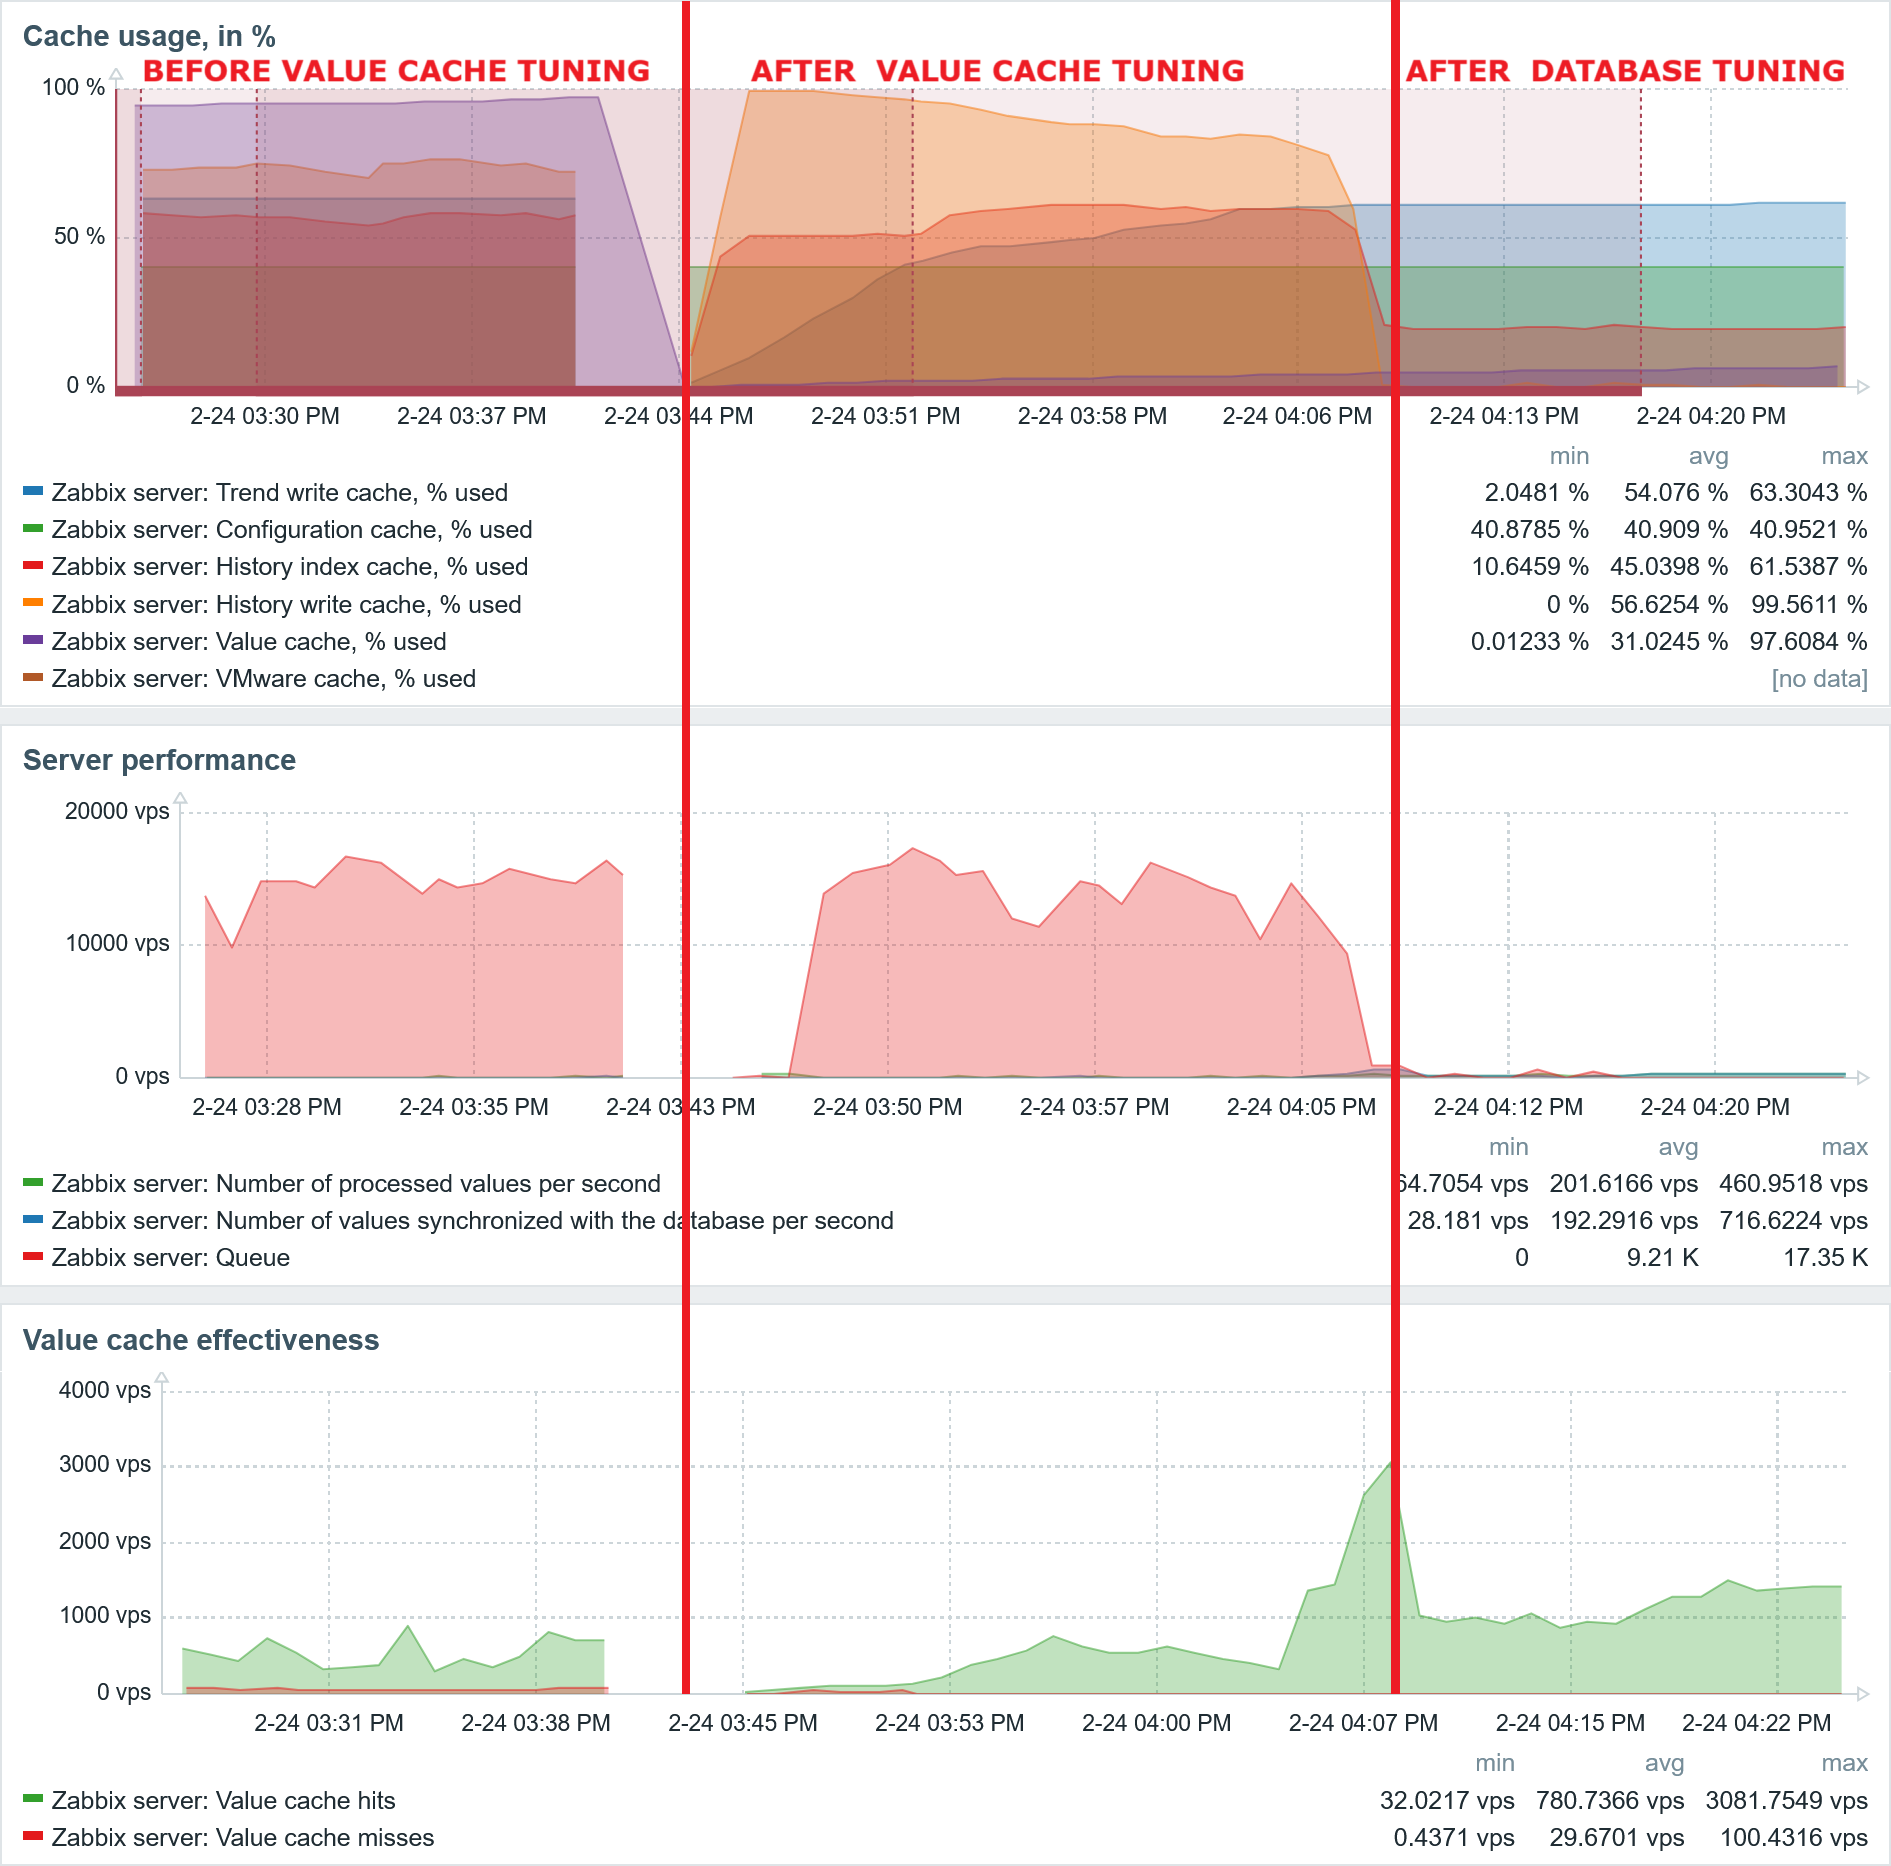
Increasing the value cache only partly solved one issue. After database tuning, database performance has improved significantly:

  • The history cache is now empty
  • No more value cache misses
  • No more delayed items
Fig 16. The Cache usage, server performance, and value cache effectiveness graphs

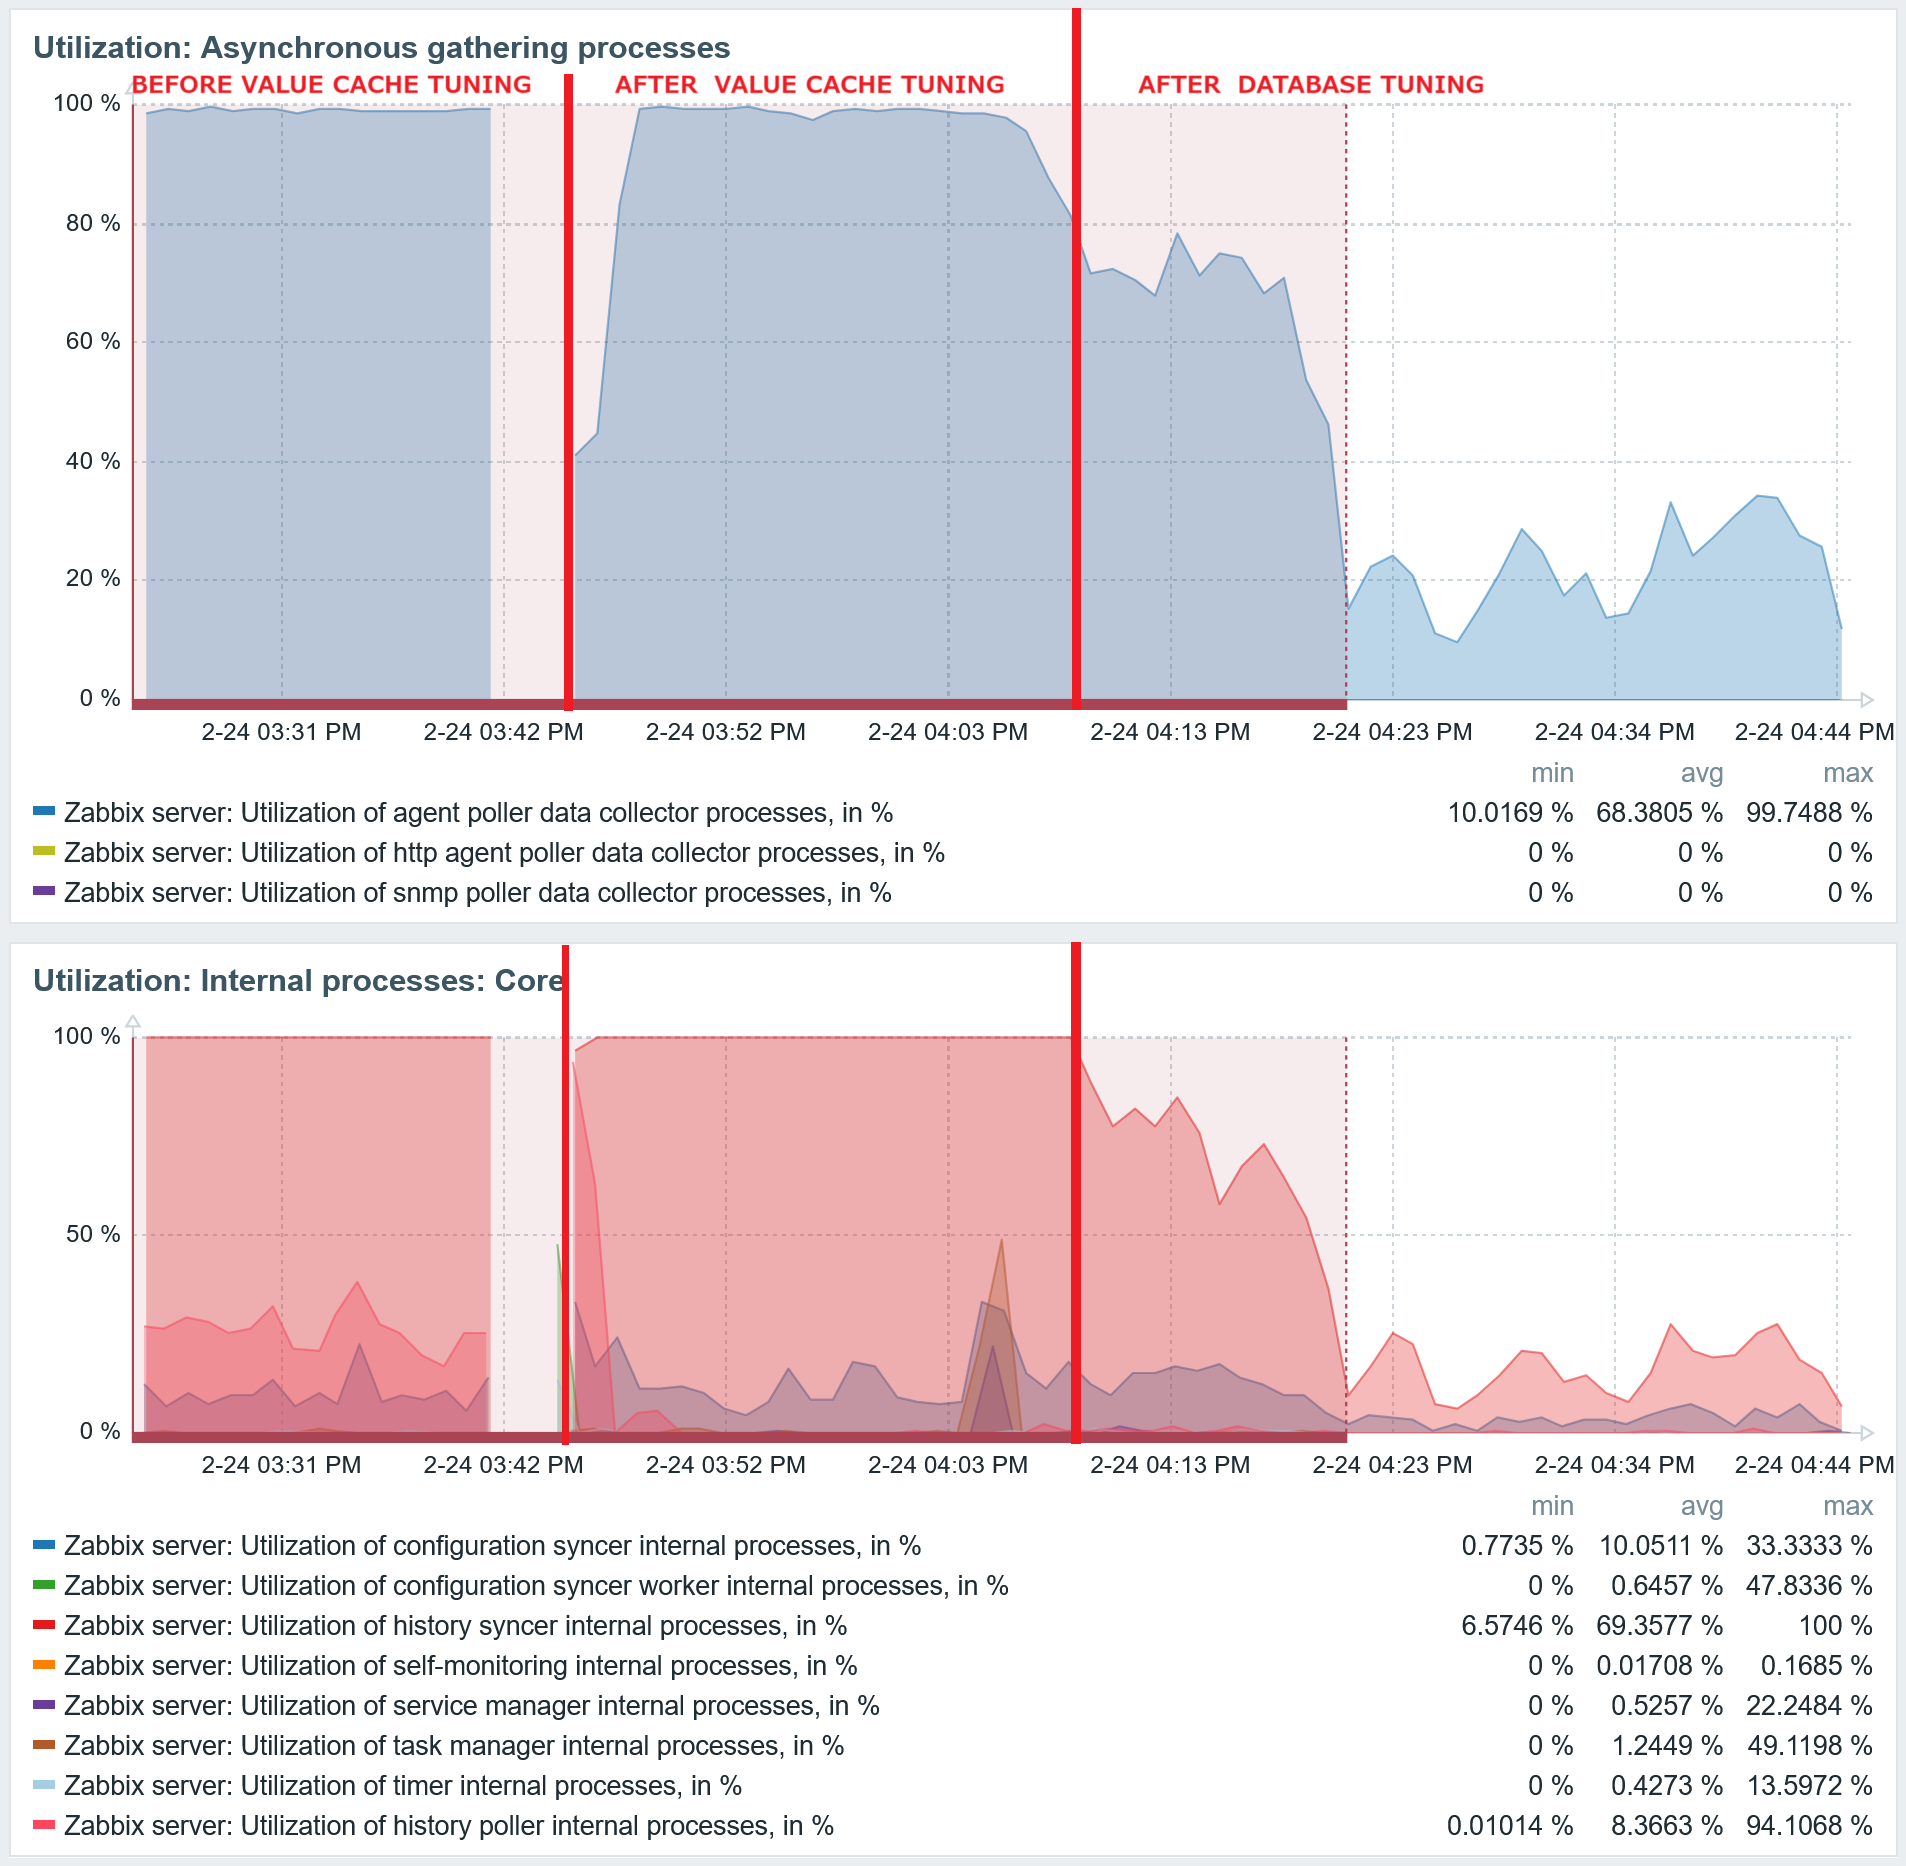
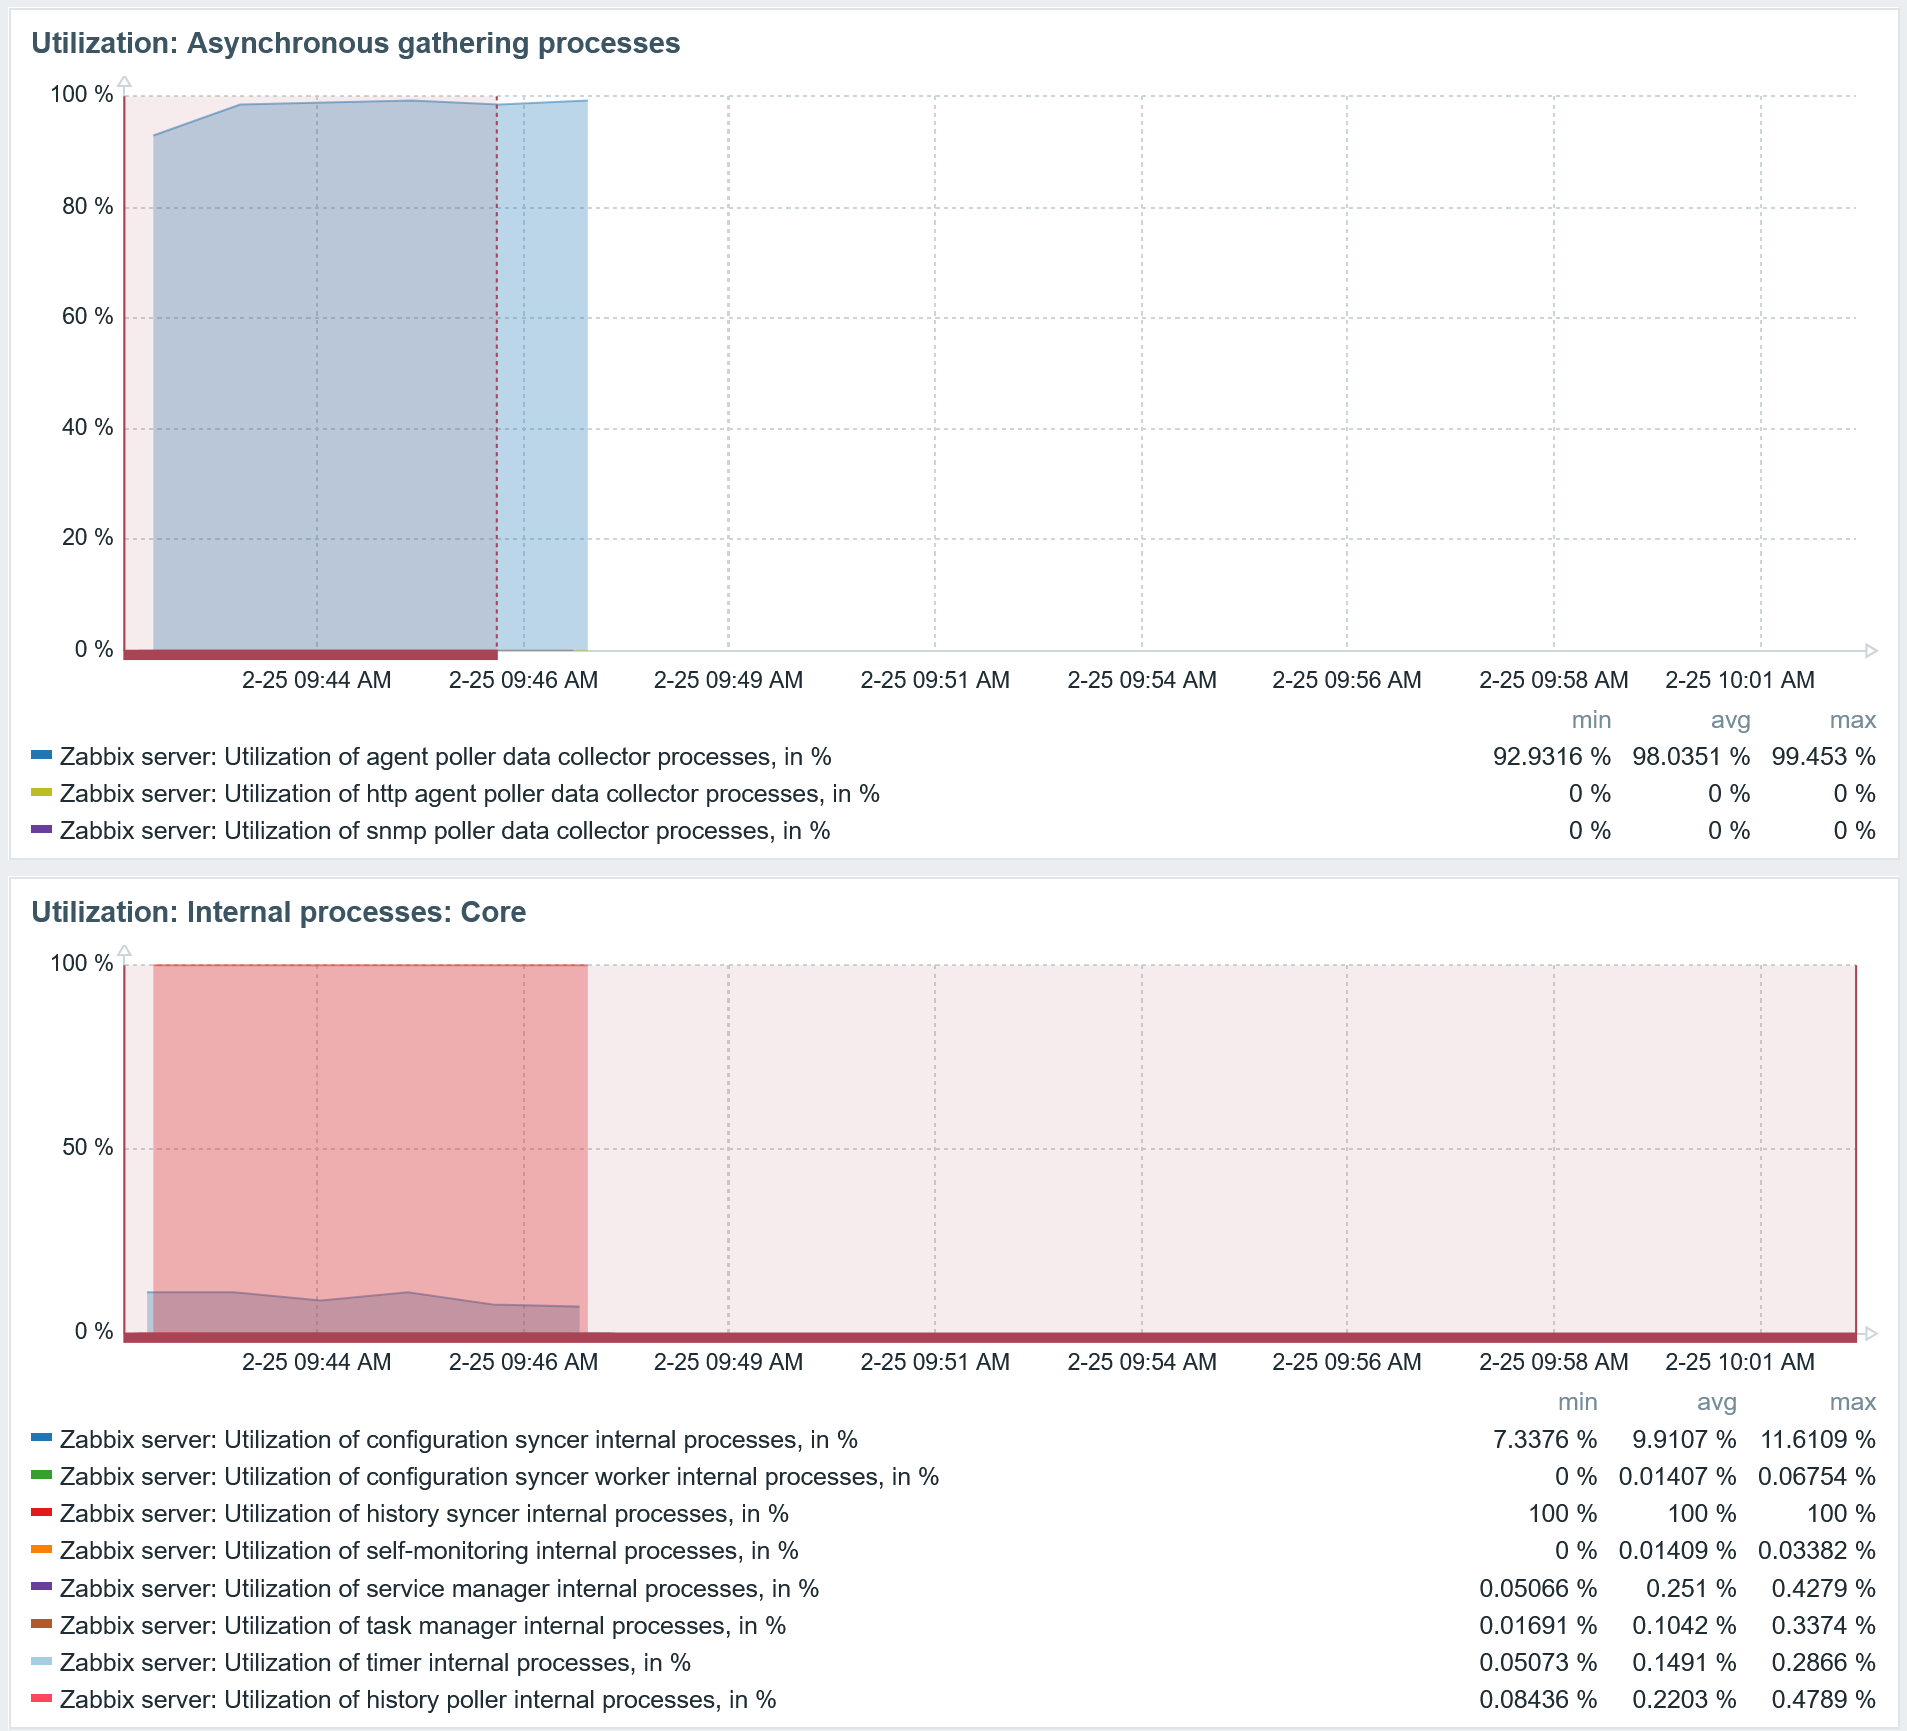
After the Database tuning, the agent poller process and history syncer utilization also decreased to a low level.

Fig 17. Data collector and internal process utilization graphs

Tune the Zabbix server configuration parameters

Check the Processes page in the Zabbix Health dashboard and adjust the parameters accordingly. Only adjust the parameters that you understand. Changing the parameters arbitrarily can lead to the following:

  • Wasted resources without effective performance improvement
  • Reduced Zabbix server performance
  • Zabbix server crashes

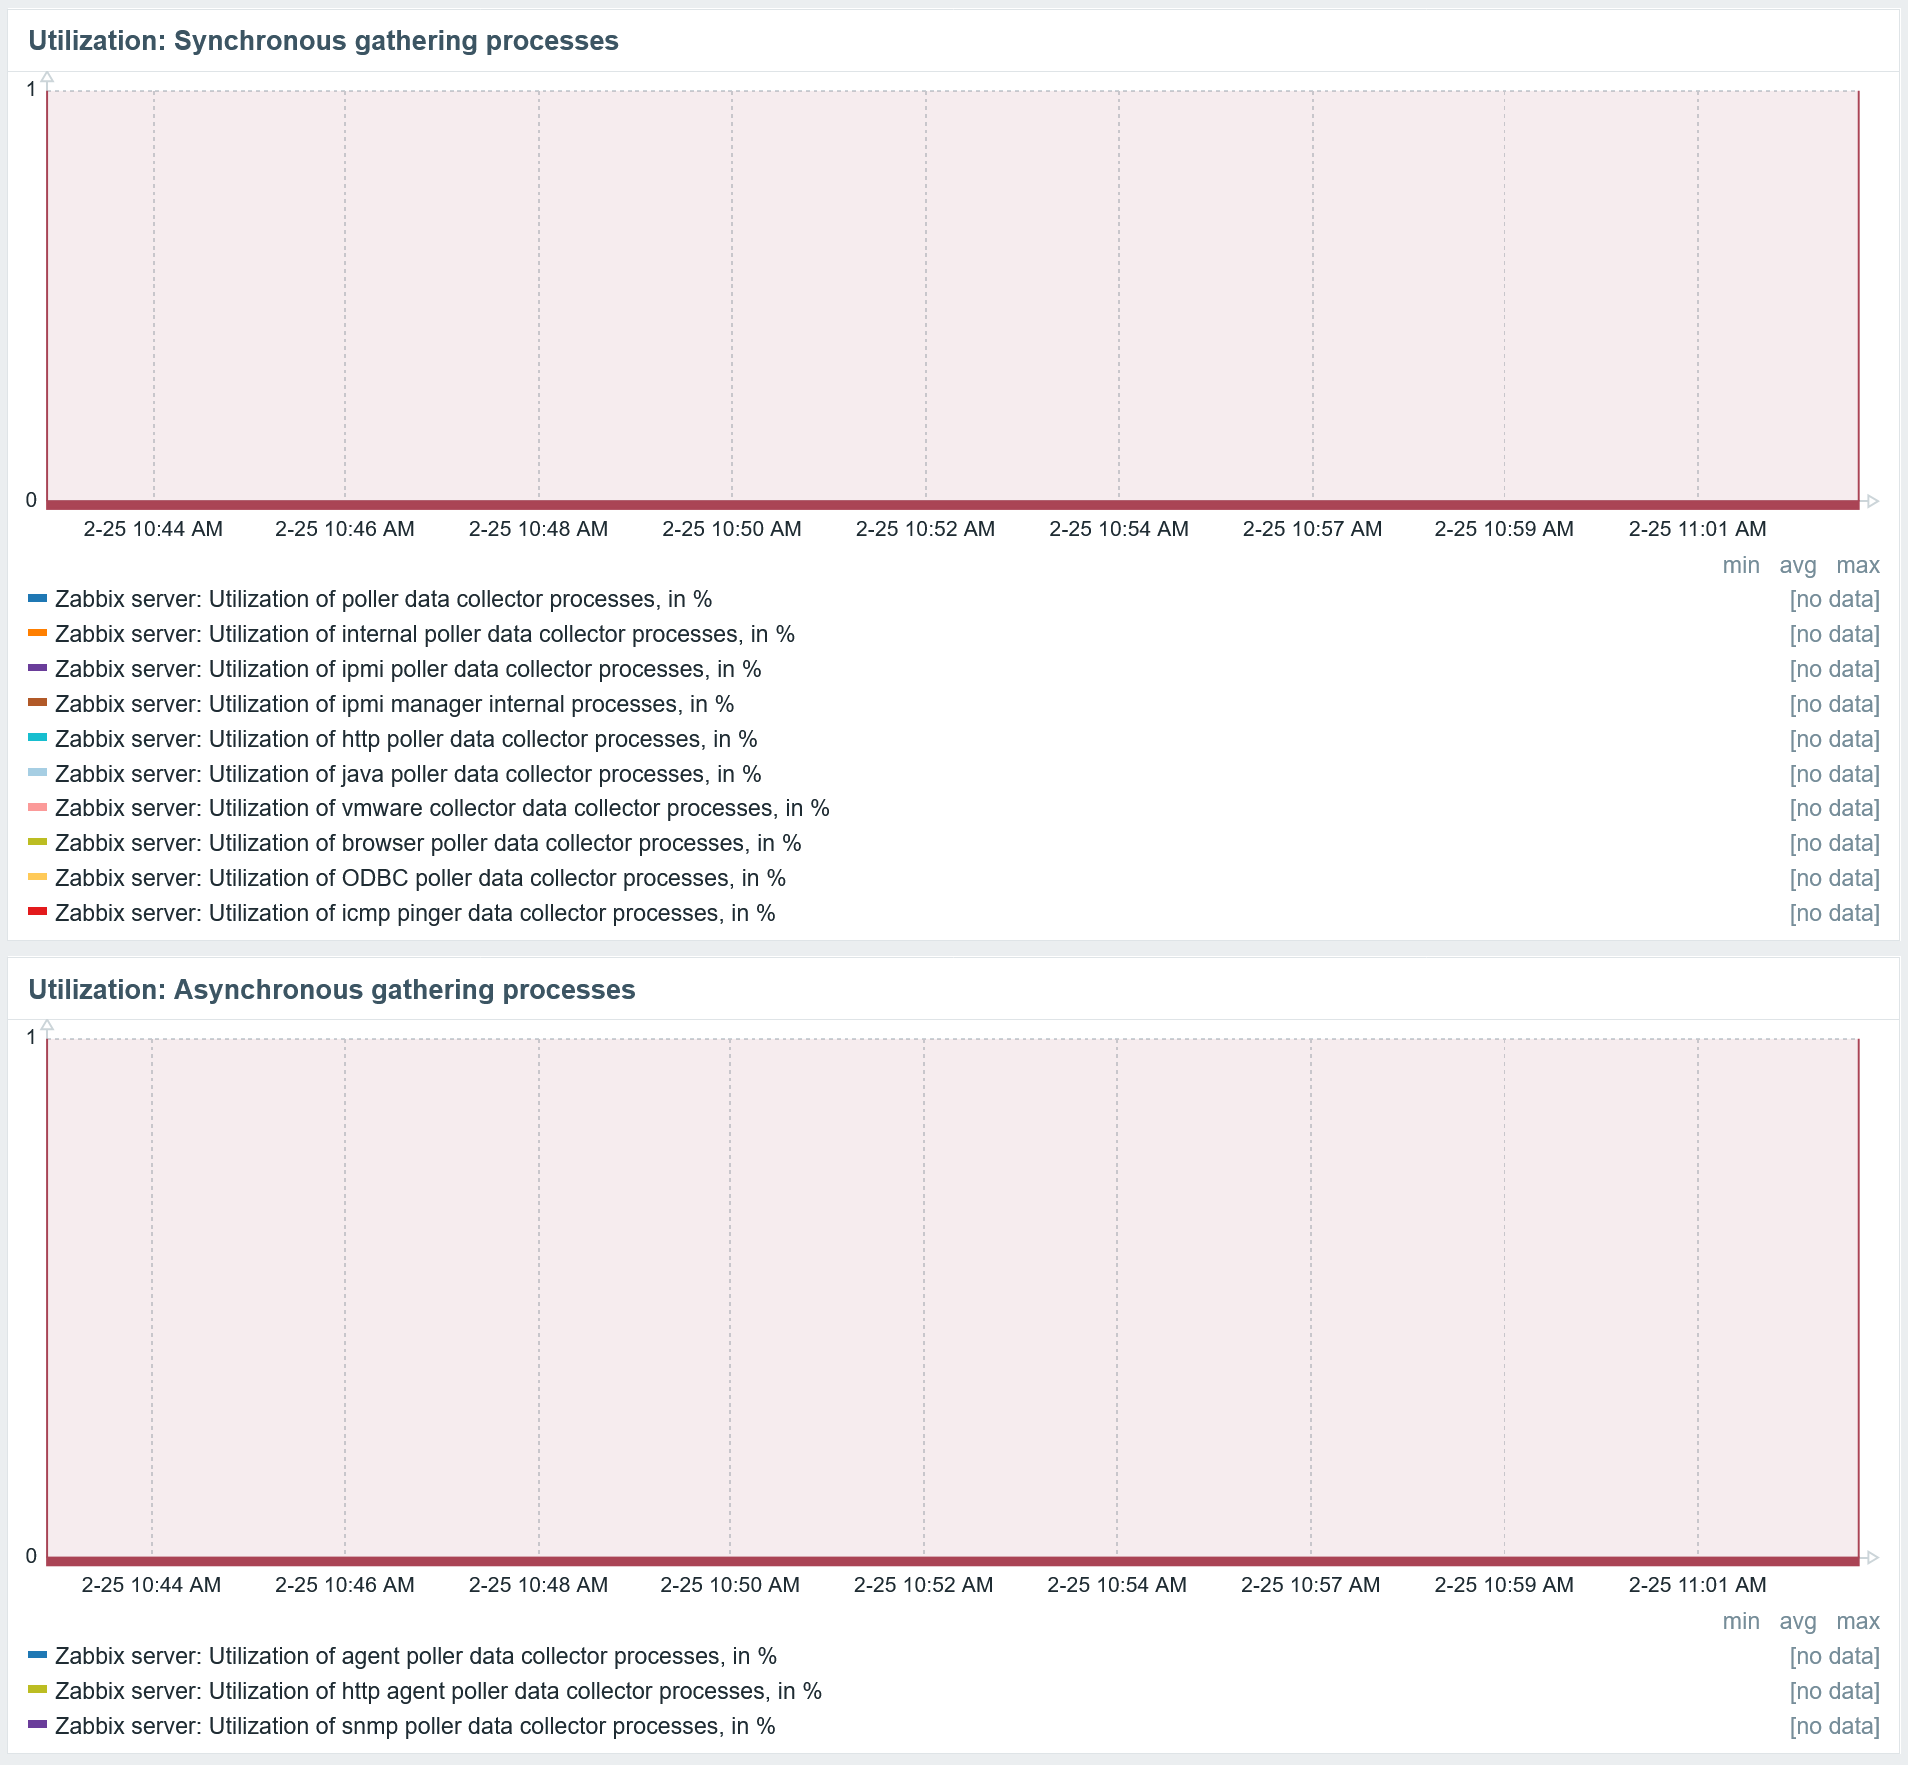
For the data collectors, generally you require only a relatively small number of asynchronous data collectors, as they are very efficient, relatively larger number of synchronous data collectors. The graphs showing the utilisation of the gathering processes are extremely useful for determining which ones need to be increased – if they are close to 100% utilized, it’s now time for you to take action and add more.

Pitfalls of misconfiguration

Now, regarding the pitfalls of misconfiguration or lack of tuning. Here is a scenario: installed the Zabbix components, MySQL database without any configuration tuning, except the configuration cache to avoid the Zabbix server crashing immediately. The Zabbix server is monitoring around ~400 hosts. The Zabbix agent poller process and history syncers are utilized close to 100%, like in the Fig.17 before the tuning.

You might think that increasing both of these processes would improve the situation, for example, by doubling the count of them: more parallel agent processes should collect more data, and the more history syncers should write more data to the database.

After restarting the Zabbix server and checking the graph, both processes are close to 100% busy and the metric collection is significantly delayed. This is much worse.

Fig 18. Async data collector and internal process utilization graphs

By quadrupling both processes, the result is even worse, with significantly delayed item value collection.

Fig 19. Async data collector and internal process utilization graphs

So, what is happening behind the frontend? Just increasing the number of agent poller collectors and history syncers results in even worse performance. Seems counterintuitive, right: more data collectors should mean more data will be collected, and more history syncers – should allow more data to be written in parallel to the database.

However, increasing the data collector count in this specific situation will just make things much worse: you can collect more data at the same time, but will still face the same bottleneck: the database. Increasing the history syncers in this case makes the situation much worse, as more simultaneous queries to the database force it to slow down even further. So once again, tune your database engine and get more performance out of it.

Summary

You should monitor all of your Zabbix components and react when issues occur. Also make sure that you receive the notifications in your preferred media type, so you can act immediately. The complete list of what to monitor is more extensive, but this blog post should provide you with some examples and inspiration. It is always a good idea to react proactively rather than deal with the issues after they occur.


The post Detect Issues in Your Zabbix Instance Before It’s Too Late appeared first on Zabbix Blog.

Automating data classification in Amazon SageMaker Catalog using an AI agent

Post Syndicated from Ramesh H Singh original https://aws.amazon.com/blogs/big-data/automating-data-classification-in-amazon-sagemaker-catalog-using-an-ai-agent/

If you’re struggling with manual data classification in your organization, the new Amazon SageMaker Catalog AI agent can automate this process for you. Most large organizations face challenges with the manual tagging of data assets, which doesn’t scale and is unreliable. In some cases, business terms aren’t applied consistently across teams. Different groups name and tag data assets based on local conventions. This creates a fragmented catalog where discovery becomes unreliable and governance teams spend more time normalizing metadata than governing.

In this post, we show you how to implement this automated classification to help reduce the manual tagging effort and improve metadata consistency across your organization.

Amazon SageMaker Catalog provides automated data classification that suggests business glossary terms during data publishing. This helps to reduce the manual tagging effort and improve metadata consistency across organizations. This capability analyzes table metadata and schema information using Amazon Bedrock language models to recommend relevant terms from organizational business glossaries. Data producers receive AI-generated suggestions for business terms defined within their glossaries. These suggestions include both functional terms and sensitive data classifications such as PII and PHI, making it straightforward to tag their datasets with standardized vocabulary. Producers can accept or modify these suggestions before publishing, facilitating consistent terminology across data assets and improving data discoverability for business users.

The problem with manual classification

Manual tagging doesn’t scale effectively. Data producers interpret business terms differently, especially across domains. Critical labels like PII and PHI get missed because the publishing workflow is already complex. After assets enter the catalog with inconsistent terminology, search functionality and access controls quickly degrade.The solution isn’t only better training—it’s making the classification process predictable and consistent.

How automated classification works

The capability runs directly inside the publish workflow:

  1. The catalog looks at the table’s structure—column names, types, whatever metadata exists.
  2. That structure is sent to an Amazon Bedrock model that matches patterns against the organization’s glossary.
  3. Producers receive a set of suggestions from the defined business glossary terms for classification that might include both functional and sensitive-data glossary terms.
  4. They accept or adjust the suggestions before publishing.
  5. The final list is written into the asset’s metadata using the controlled vocabulary.

The model evaluates column names, data types, schema patterns, and existing metadata. It maps those signals to the terms defined in the organization’s glossary. The suggestions are generated inline during publishing, with no separate Extract, Transform and Load (ETL) or batch processes to maintain. The accepted terms become part of the asset’s metadata and flow into downstream catalog operations immediately.

Under the hood: intelligent agent-based classification

Automated business glossary assignment goes beyond simple metadata lookups using a reasoning-driven approach. The AI agent functions like a virtual data steward, following human-like reasoning patterns such as:

  • Reviews asset details and context
  • Searches the catalog for relevant terms
  • Evaluates whether results make sense
  • Refines strategy if initial searches don’t surface appropriate terms
  • Learns from each step to improve recommendations

Key approaches:

Reasoning over static queries – The agent interprets asset attributes and context rather than treating metadata as a fixed index, generating dynamic search intents instead of relying on predefined queries.
Iterative adaptive search – When initial results are weak, the agent automatically adjusts queries—broadening, narrowing, or shifting terms through a feedback loop that helps improve discovery quality.
Structured semantic search – The agent performs semantic querying across entity types, applies filtering and relevance scoring, and conducts multi-directional exploration until strong matches are found.

This allows the agent to explore multiple directions until strong matches are found, improving recall and precision over static methods like direct vector search when asset metadata is incomplete or ambiguous.

Things to keep in mind

This feature is only as strong as the glossary it sits on top of. If the glossary is incomplete or inconsistent, the suggestions reflect that. Producers should still review each recommendation, especially for regulatory labels. Governance teams should monitor how often suggestions are accepted or overridden to understand model accuracy and glossary gaps.

Prerequisites

To follow along, you must have an Amazon SageMaker Unified Studio domain set up with a domain owner or domain unit owner permissions. You must have a project that you can use to publish assets. For instructions on setting up a new domain, refer to the SageMaker Unified Studio Getting started guide. We will also use Amazon Redshift to catalog data. If you are not familiar, read Learn Amazon Redshift concepts to learn more.

Step 1: Define business glossary and terms

AI recommendations suggest terms only from glossaries and definitions already present in the system. As a first step we create high-quality, well-described glossary entries so the AI can return accurate and meaningful suggestions.

We create the following business glossaries in our domain. For information about how to create a business glossary, see Create a business glossary in Amazon SageMaker Unified Studio.

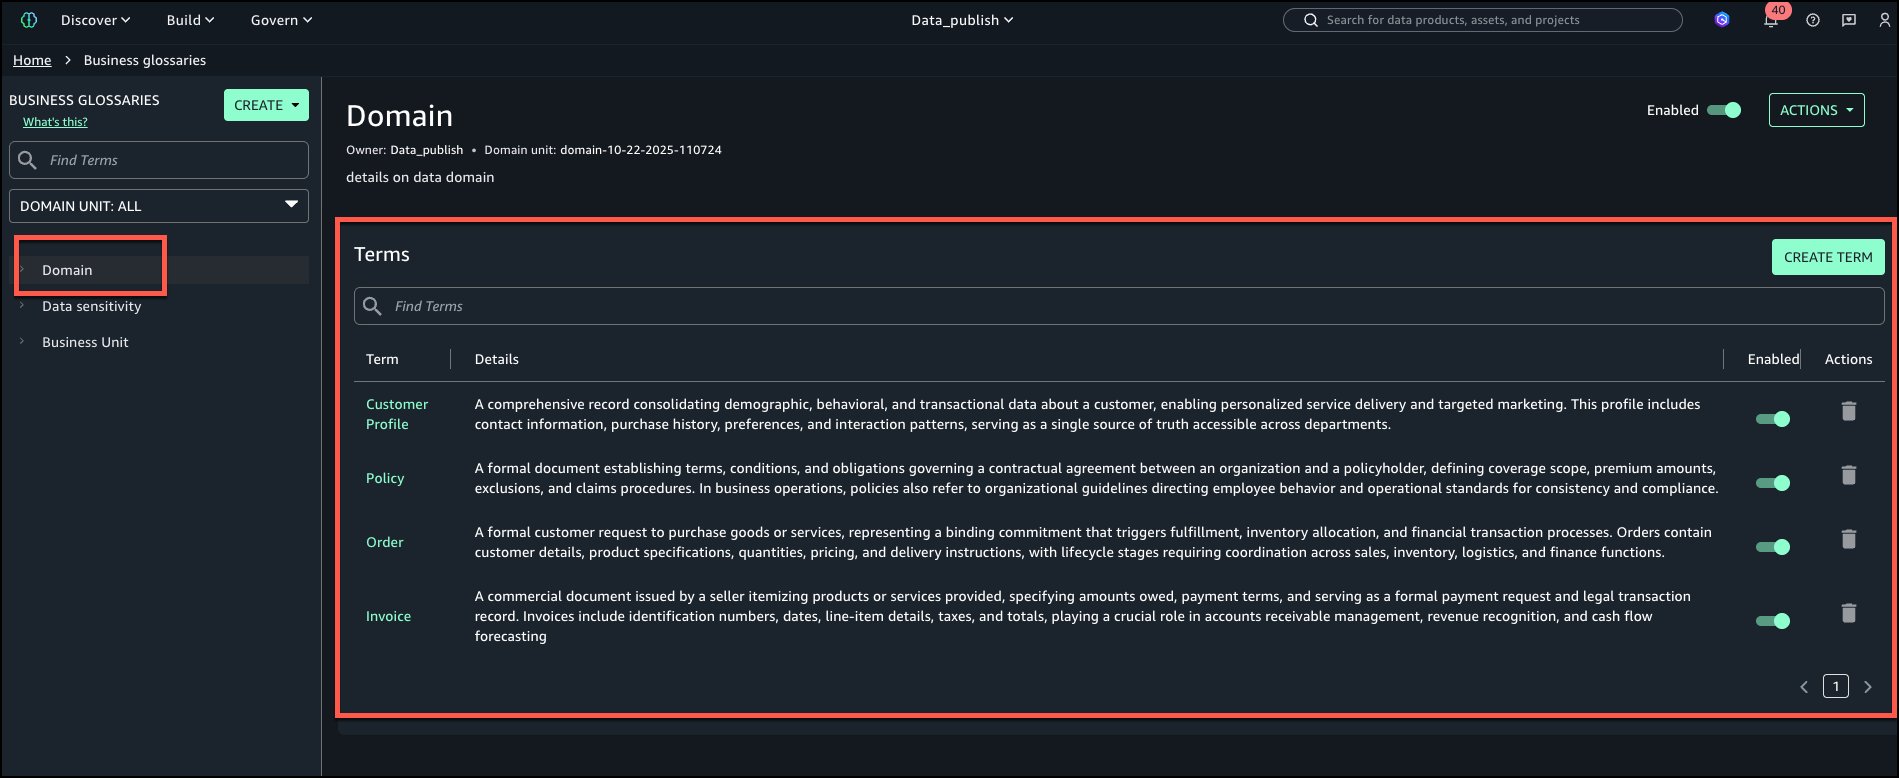
Domain: Terms – Customer Profile, Policy, Order, Invoice.

The following is the view of ‘Domain’ business glossary with all terms added.

Data sensitivity: Terms – PII, PHI, Confidential, Internal.

The following is the view of ‘Data sensitivity’ business glossary with all terms added.

Business Unit: Terms – KYC, Credit Risk, Marketing Analytics

The following is the view of ‘Business Unit’ business glossary with all terms added.

We recommend that you use glossary descriptions to make terms unambiguous. Ambiguous or overlapping definitions confuse AI models and humans equally.

Step 2: Create data assets

Create the following table in Amazon Redshift. For information about how to bring Amazon Redshift data to Amazon SageMaker Catalog, see Amazon Redshift compute connections in Amazon SageMaker Unified Studio.

CREATE TABLE  dev.public.customer_analytics_data (
    customer_id VARCHAR(50) NOT NULL,
    customer_full_name VARCHAR(200),
    customer_email VARCHAR(255),
    customer_phone VARCHAR(20),
    customer_dob DATE,
    customer_tax_id VARCHAR(256),
    policy_id VARCHAR(50),
    policy_type VARCHAR(100),
    policy_start_date DATE,
    policy_end_date DATE,
    policy_coverage_amount DECIMAL(18,2),
    order_id VARCHAR(50),
    order_date TIMESTAMP,
    order_status VARCHAR(50),
    order_total DECIMAL(18,2),
    invoice_id VARCHAR(50),
    invoice_date DATE,
    invoice_amount DECIMAL(18,2),
    invoice_payment_status VARCHAR(50),
    customer_profile_created_timestamp TIMESTAMP DEFAULT GETDATE(),
    customer_profile_updated_timestamp TIMESTAMP DEFAULT GETDATE(),

    PRIMARY KEY (customer_id, order_id)
)
DISTSTYLE KEY
DISTKEY (customer_id)
SORTKEY (customer_id, order_date);

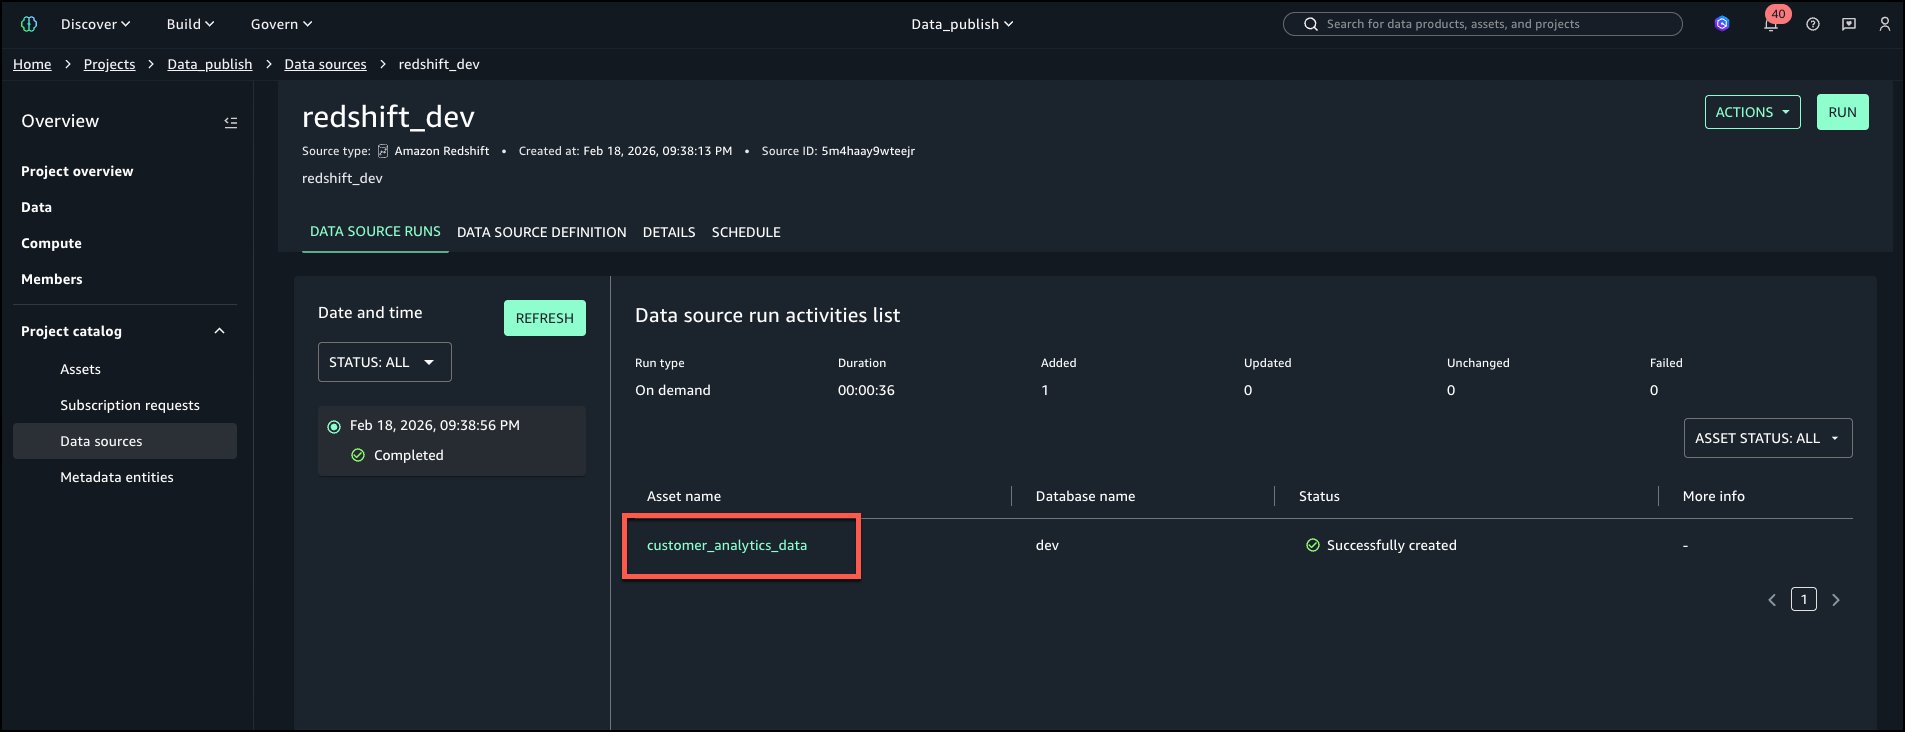
Once the Redshift is onboarded with above steps, navigate to Project catalog from left navigation menu and choose Data sources. Run the Data Source to add the table to Project inventory assets.

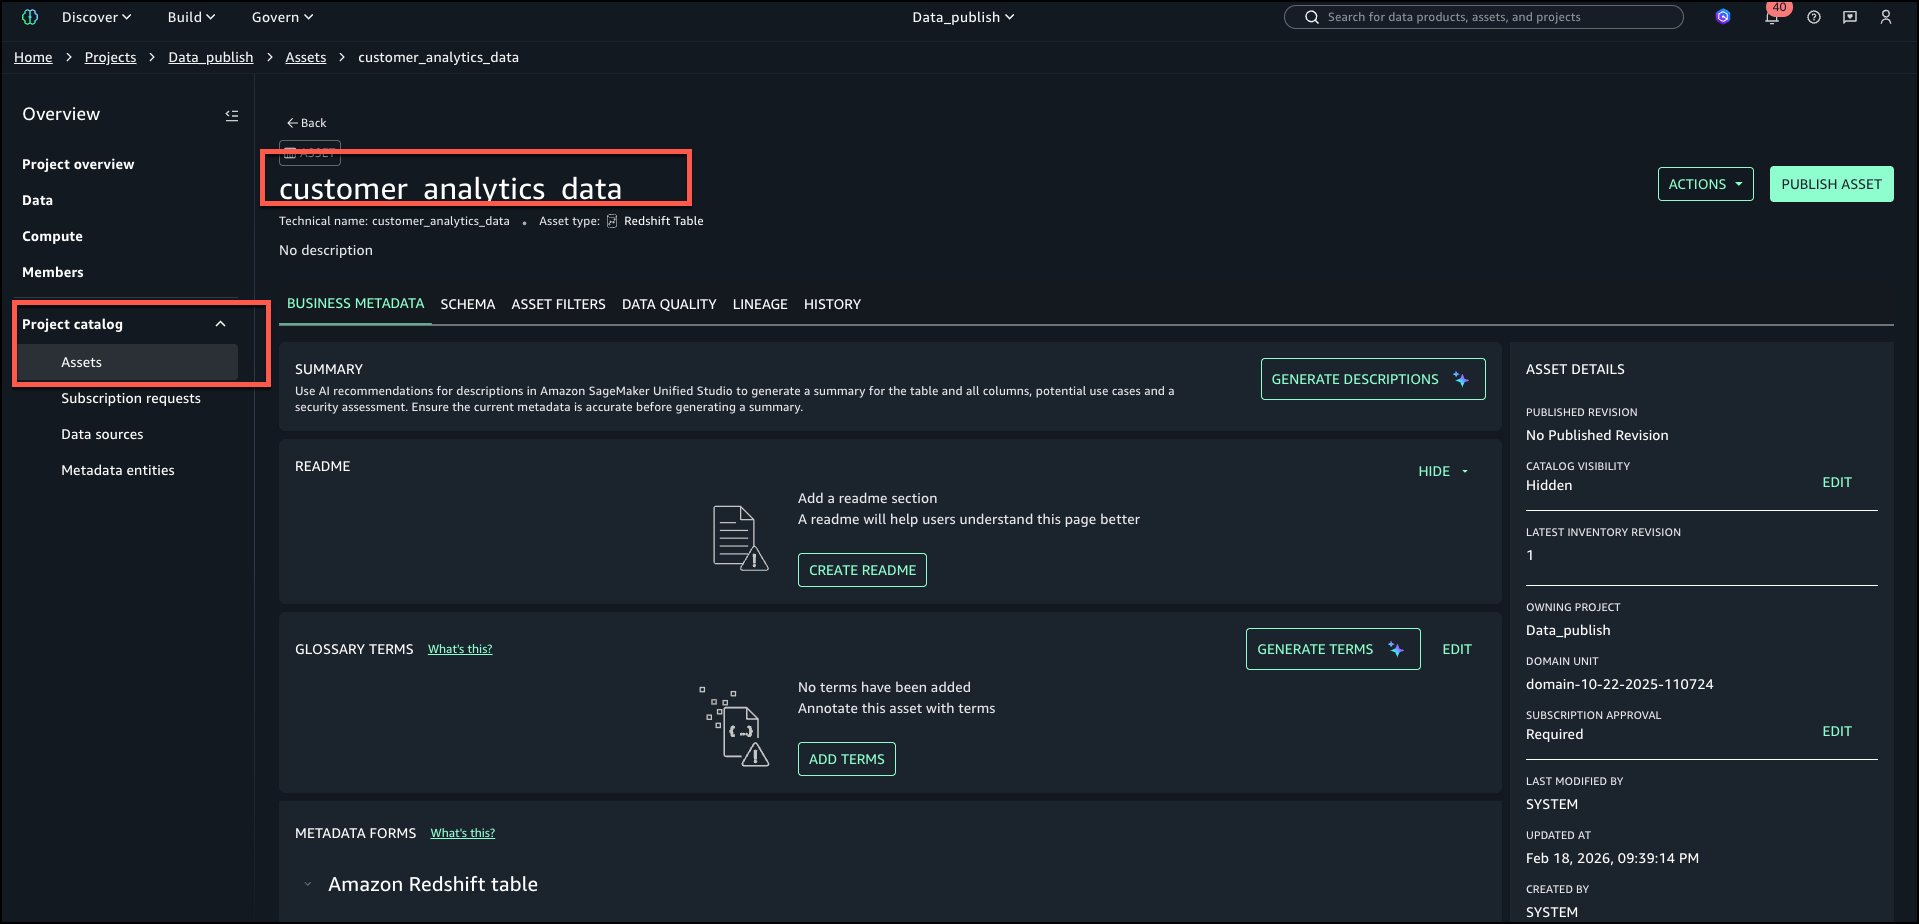
‘customer_analytics_data’ should be Project Assets inventory.

Verify navigating to ‘Project catalog’ menu on the left and choose ‘Assets’.

Step 3: Generate classification recommendations

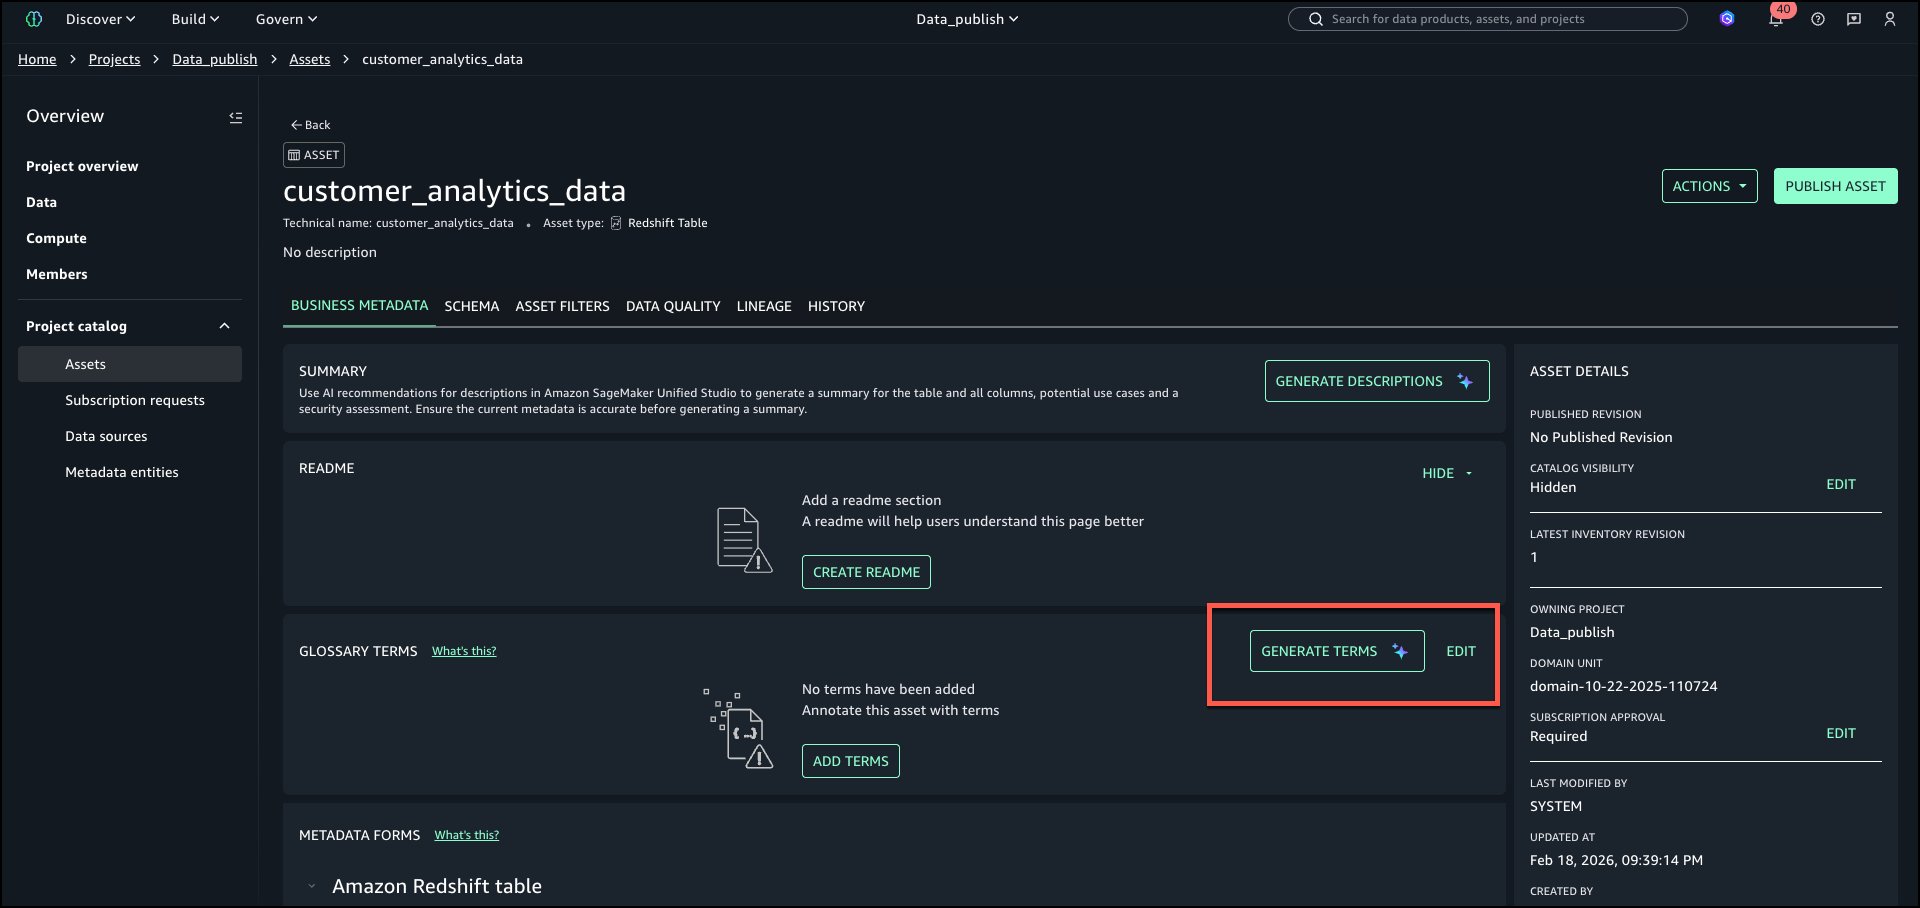
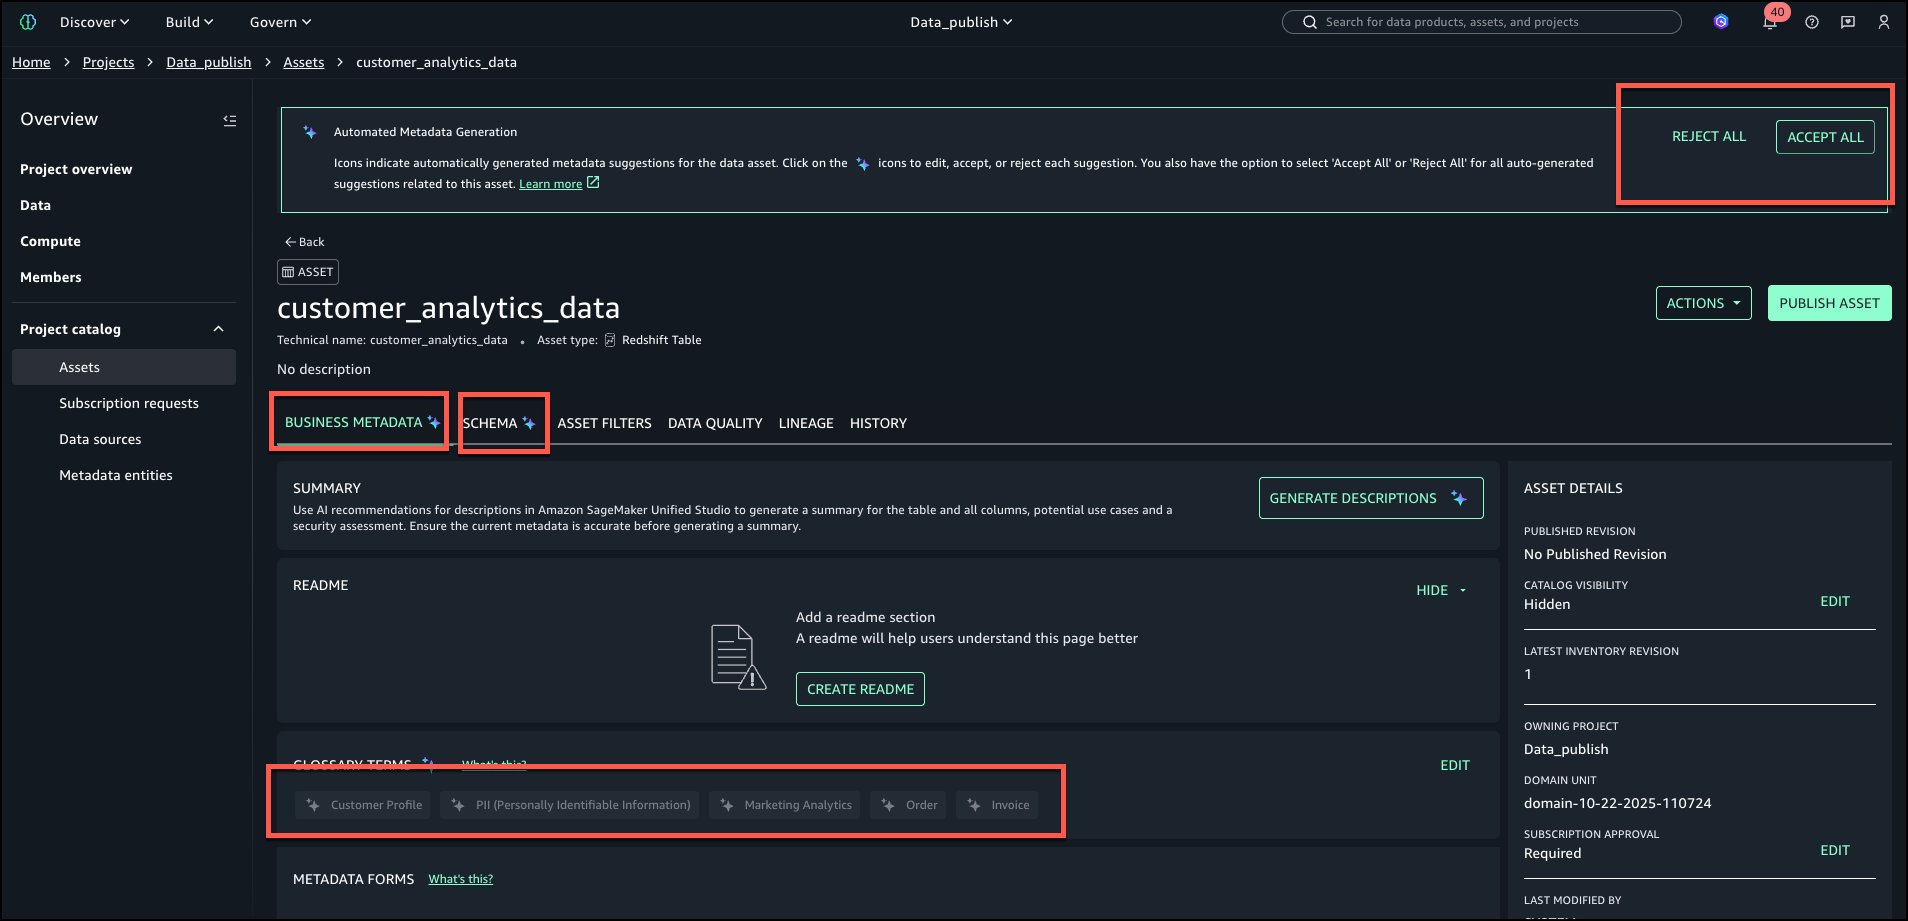
To automatically generate terms, select GENERATE TERMS in ‘GLOSSARY TERMS’ section of the asset.

AI recommendations for glossary terms automatically analyze asset metadata and context to determine the most relevant business glossary terms for each asset and its columns. Instead of relying on manual tagging or static rules, it reasons about the data and performs iterative searches across what already exists in the environment to identify the most relevant glossary term concepts.

After recommendations are generated, review the terms both at table and column level. Table level suggested terms can be viewed as shown in the following image:

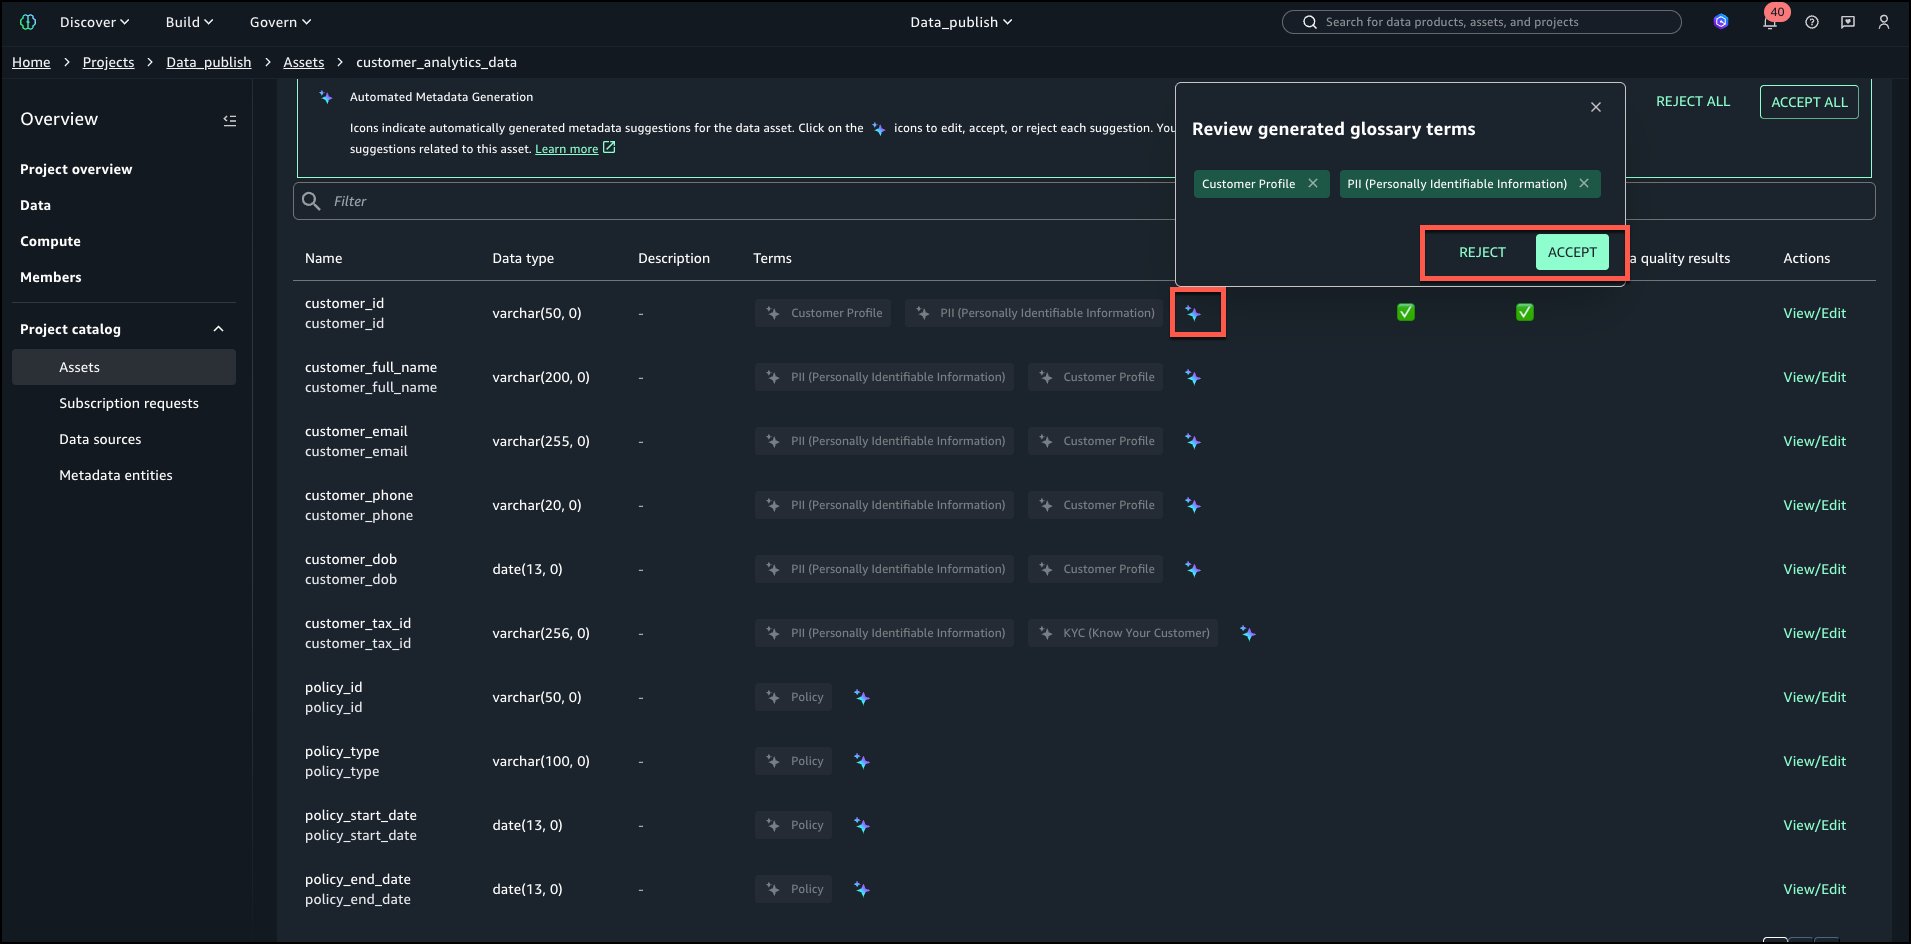
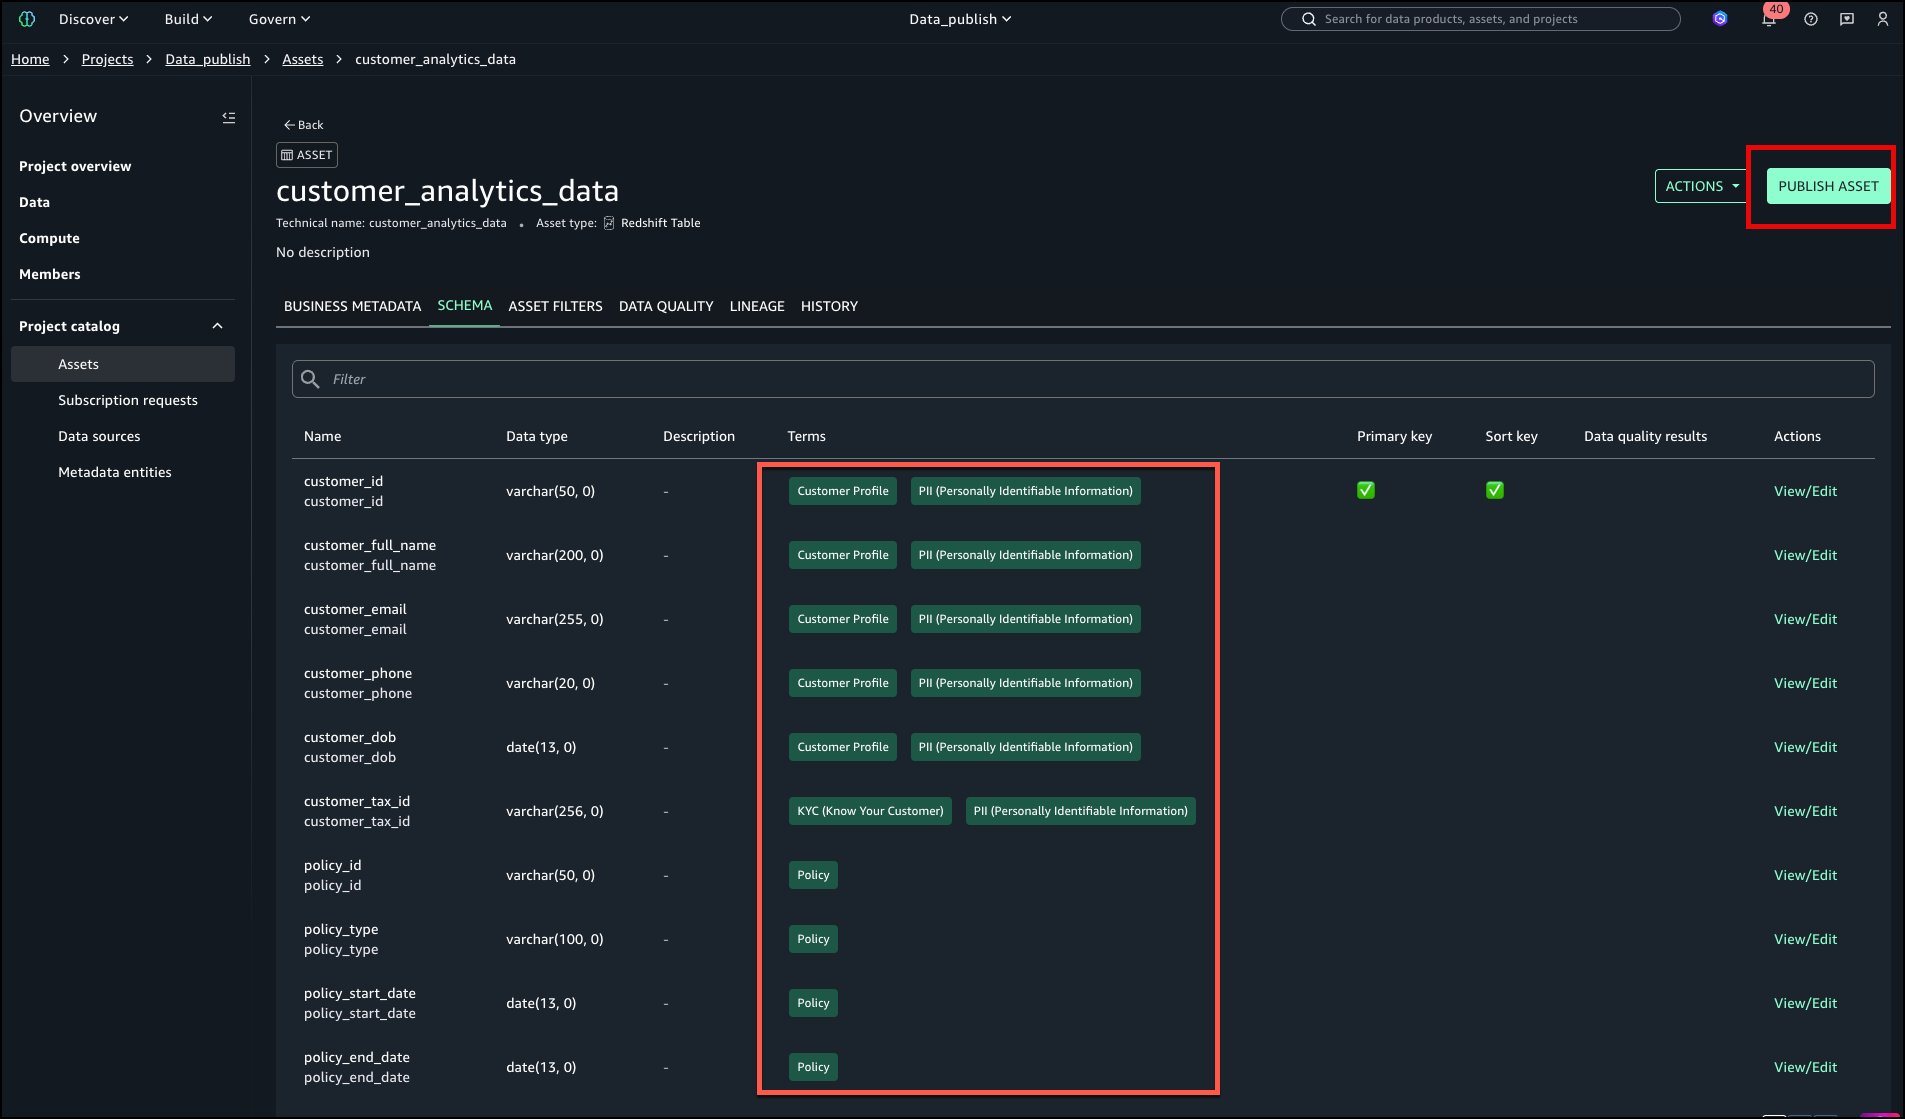
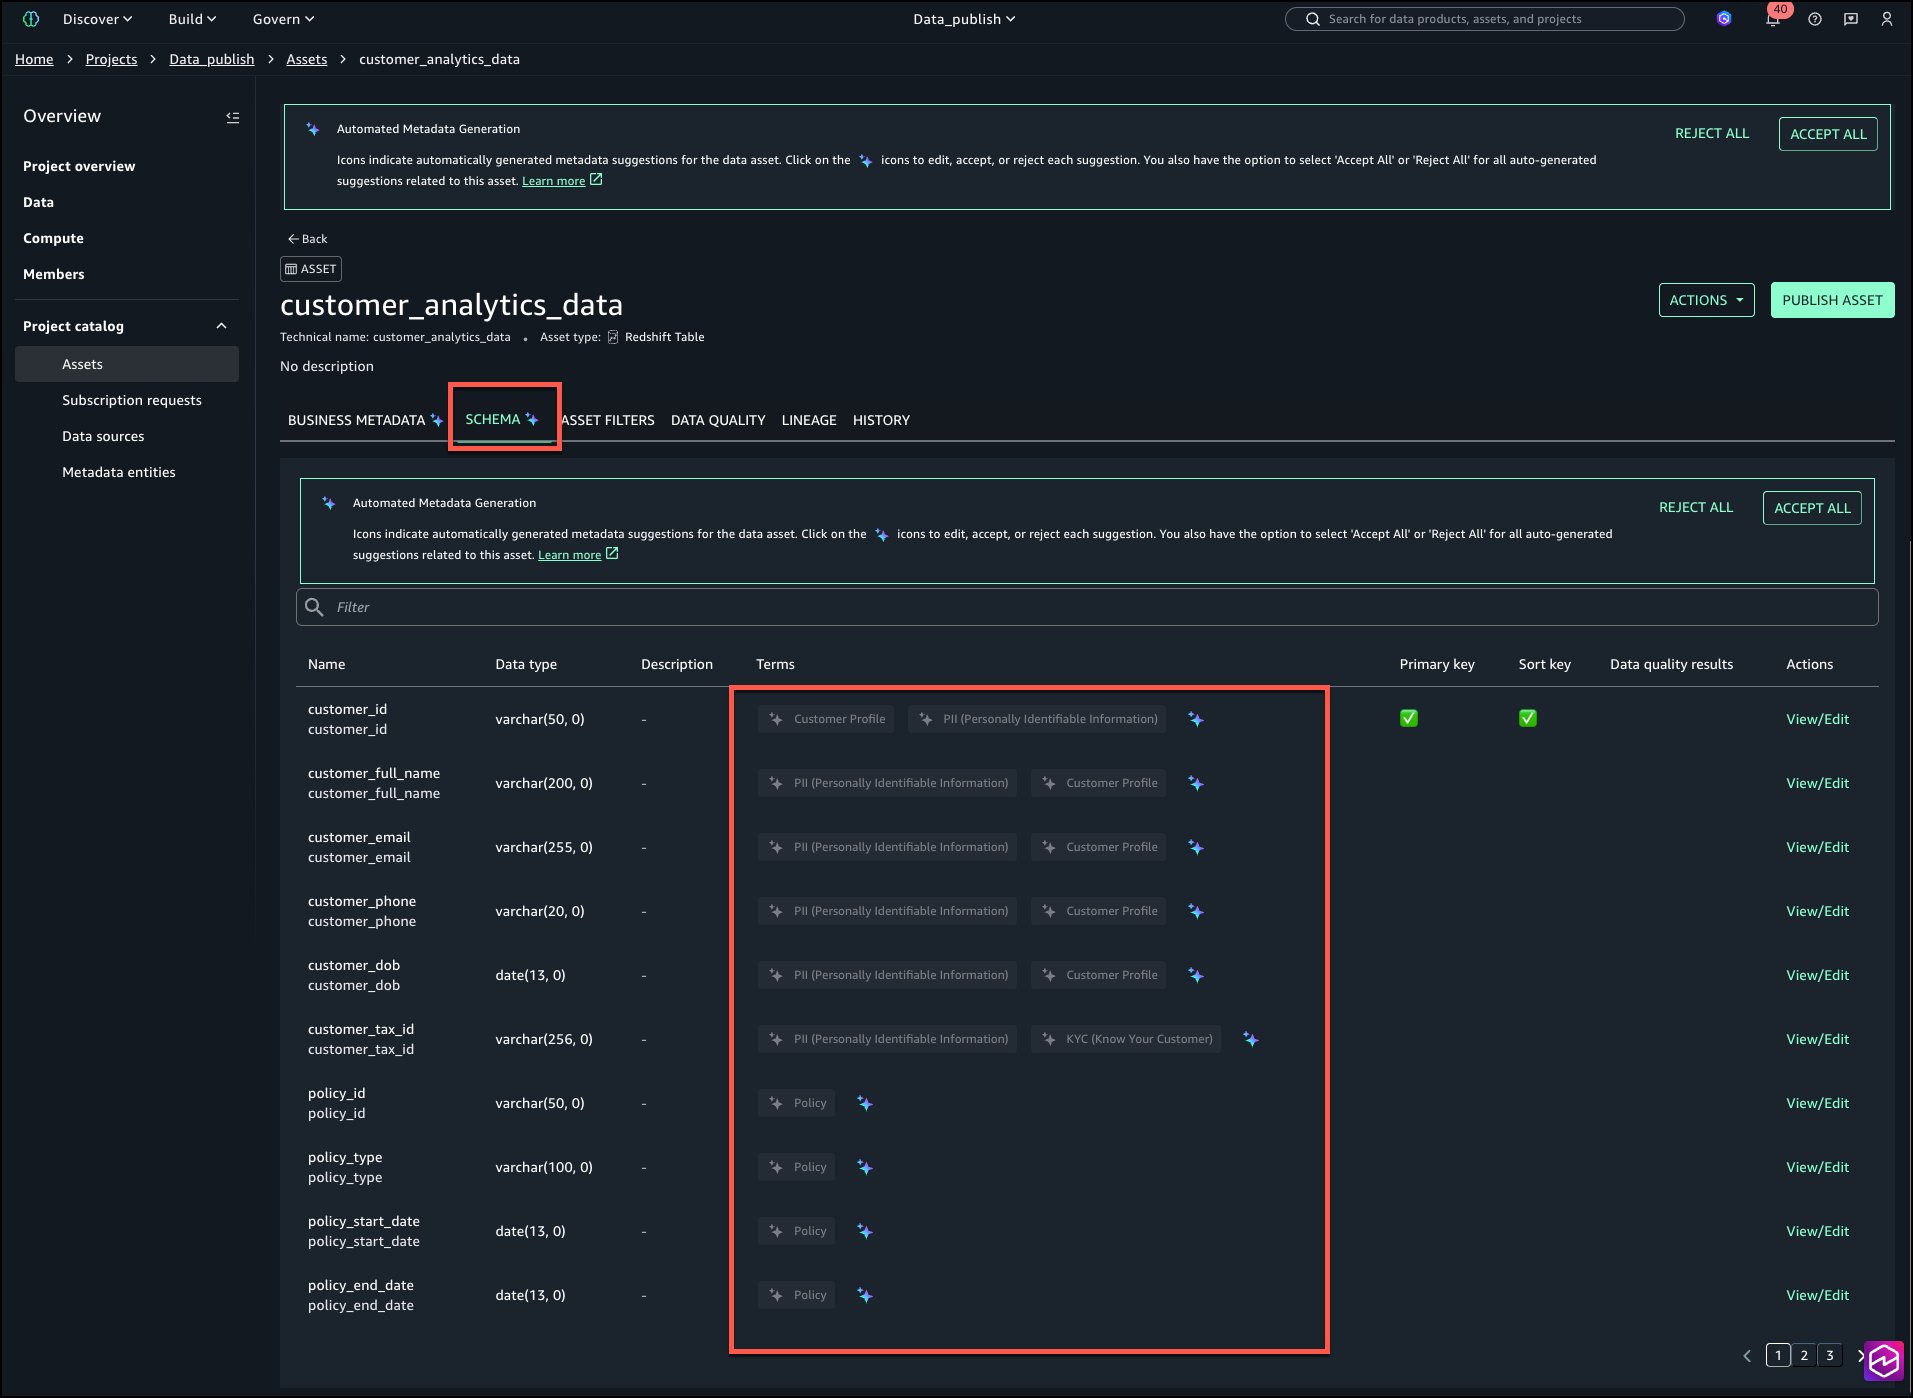
Select the SCHEMA tab to review column level tags as shown in the following image:

Review and accept individually by selecting the AI icon shown in below image.

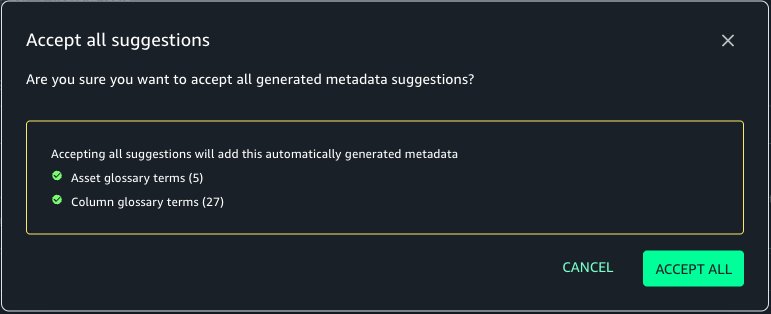
In this case, we select ACCEPT ALL and then select PUBLISH ASSET as shown below.

The tags are now added to the asset and columns without manual search and addition. Select PUBLISH ASSET.

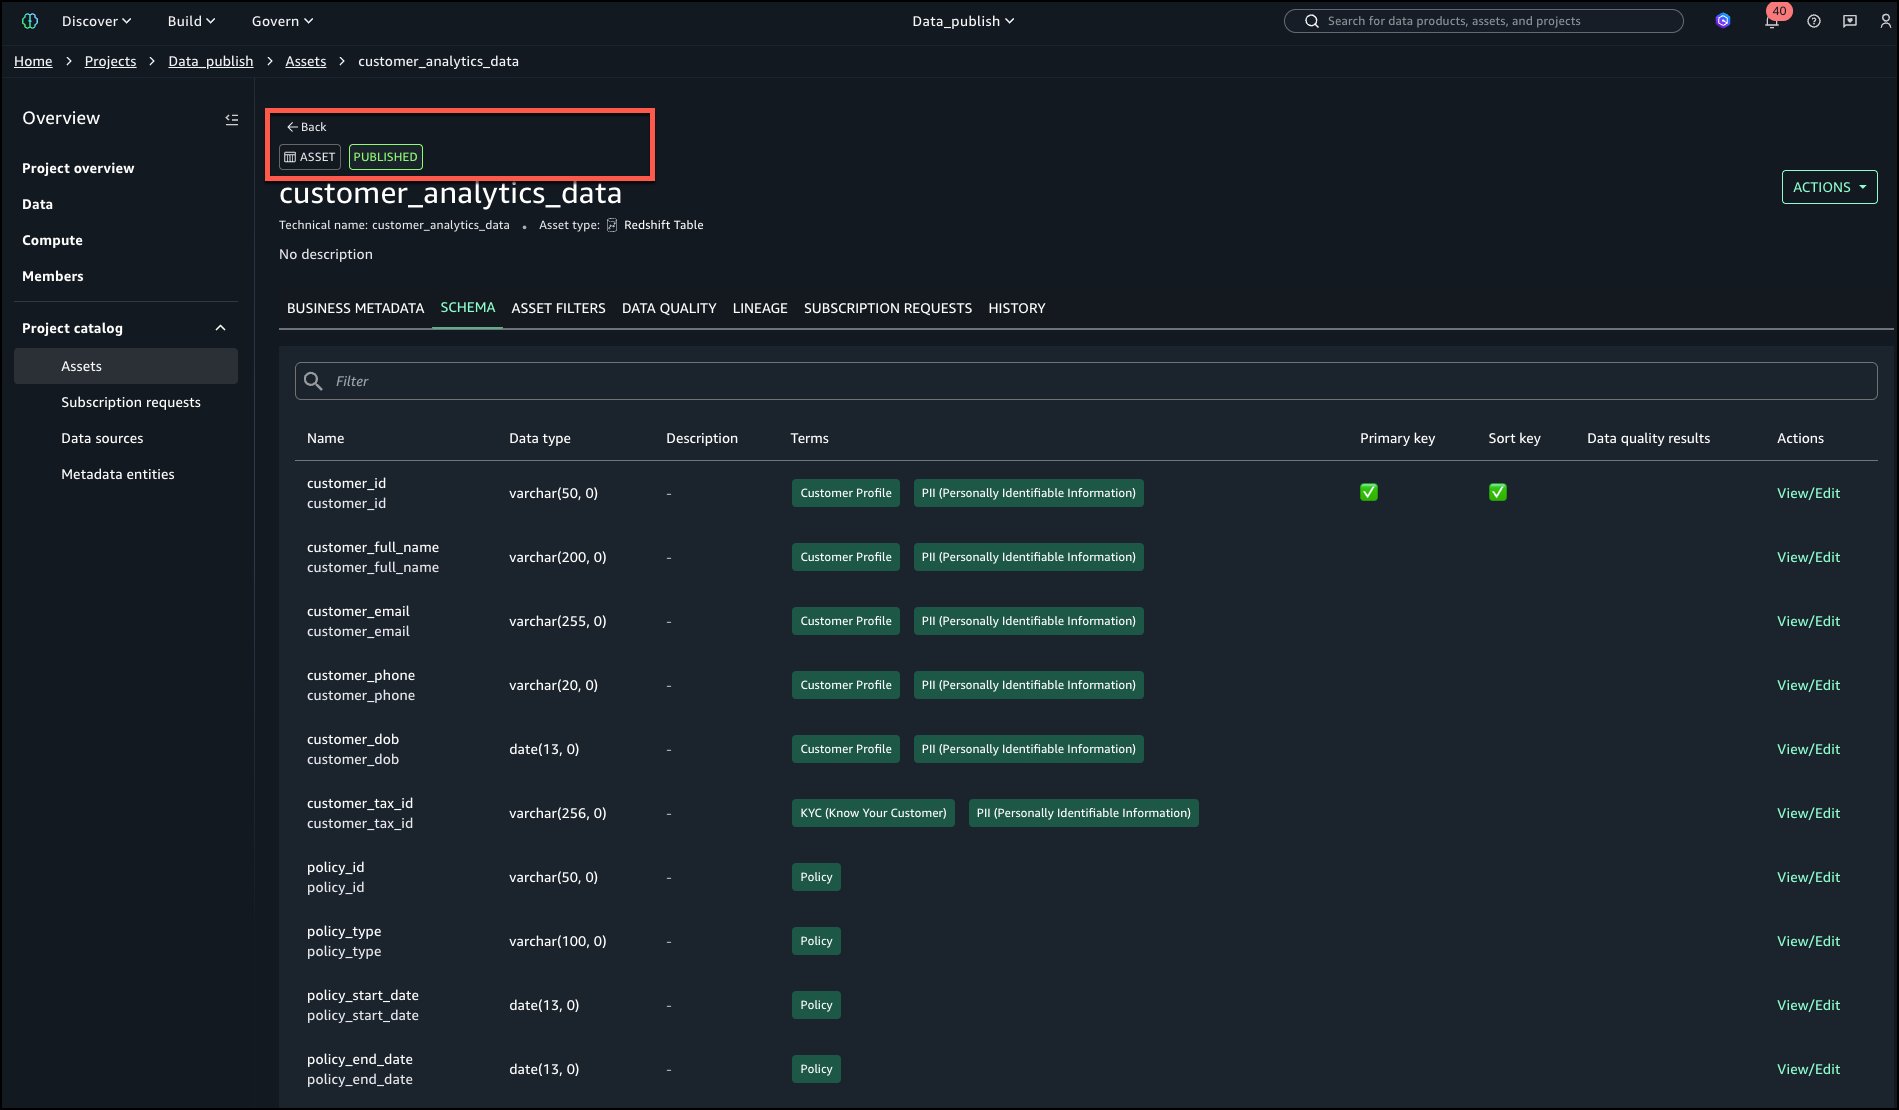
The asset is now published to the catalog as shown in the following image in the upper left corner.

Step 4: Improve data discovery

Users can now experience enhanced search results and find assets in the catalog based on the associated terms.

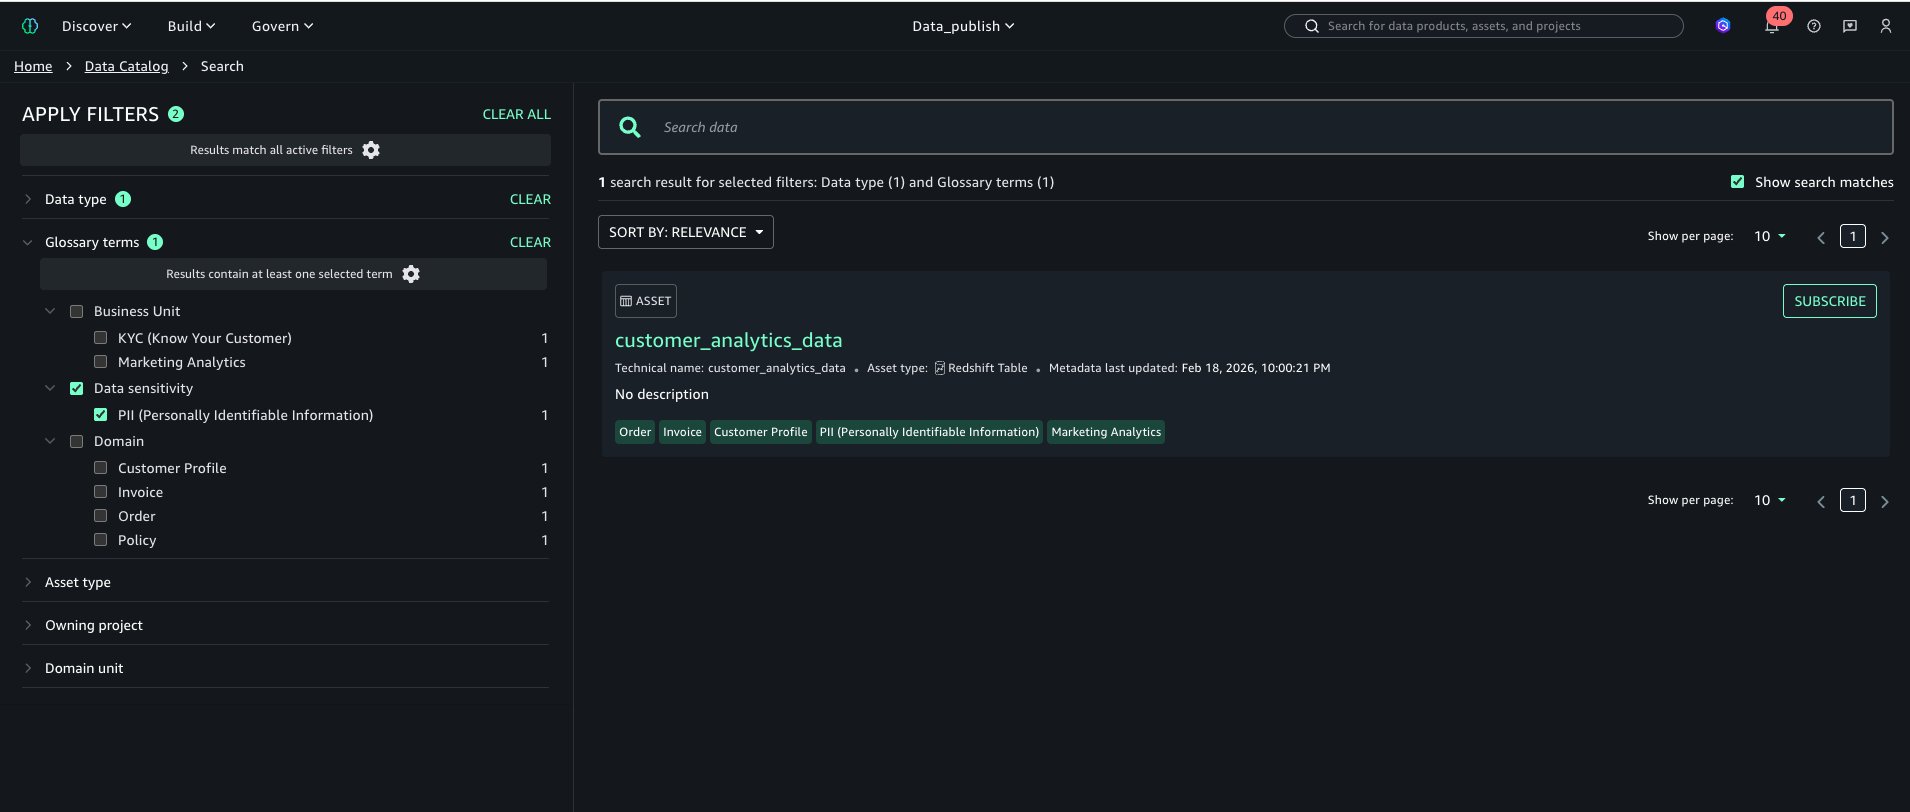
Browse by TermsUsers can now explore the catalog and filter by terms as shown in left navigation “APPLY FILTER” section

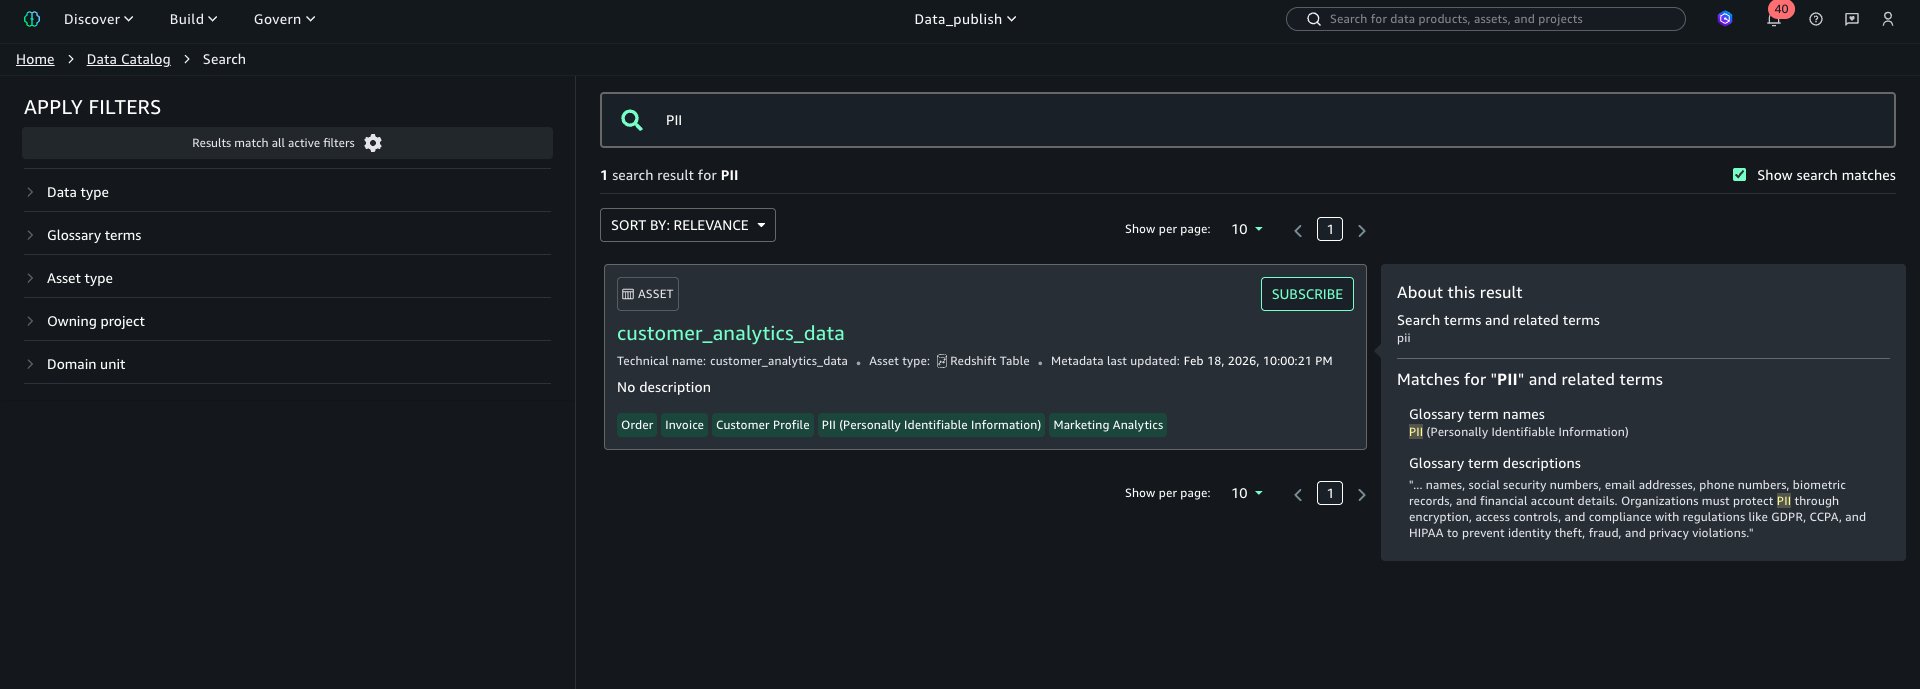
Search and FilterUsers can also search assets by glossary terms as shown below:

Cleanup

Conclusion

By standardizing terminology at publication, organizations can reduce metadata drift and improve discovery reliability. The feature integrates with existing workflows, requiring minimal process changes while helping deliver immediate catalog consistency improvements.

By tagging data at publication rather than correcting it later, data teams can spend less time fixing metadata and more time using it. For more information on SageMaker capabilities, see the Amazon SageMaker Catalog User Guide.


About the authors

Ramesh Singh

Ramesh Singh

Ramesh is a Senior Product Manager Technical (External Services) at AWS in Seattle, Washington, currently with the Amazon SageMaker team. He is passionate about building high-performance ML/AI and analytics products that help enterprise customers achieve their critical goals using cutting-edge technology.

Pradeep Misra

Pradeep Misra

Pradeep is a Principal Analytics and Applied AI leader at AWS. He is passionate about solving customer challenges using data, analytics, and AI/ML. Outside of work, he likes exploring new places, trying new cuisines, and playing badminton with his family. He also likes doing science experiments, building LEGOs, and watching movies with his daughters.

Mohit Dawar

Mohit Dawar

Mohit is a Senior Software Engineer at Amazon Web Services (AWS) working on Amazon DataZone. Over the past 3 years, he has led efforts around the core metadata catalog, generative AI–powered metadata curation, and lineage visualization. He enjoys working on large-scale distributed systems, experimenting with AI to improve user experience, and building tools that make data governance feel effortless.

The collective thoughts of the interwebz