Post Syndicated from Talks at Google original https://www.youtube.com/watch?v=lSvDVeqw7Wk
Iza Calzado | Recognizing the Hero in All of Us | Talks at Google
Post Syndicated from Talks at Google original https://www.youtube.com/watch?v=GNmnSbwIU8o
Nikon Z 50mm f/2.8 MACRO lens – TESTED
Post Syndicated from Matt Granger original https://www.youtube.com/watch?v=my2E_wCw5WA
The History Guy Podcast: Pilotless Planes: Self-landing Planes, the L-8 Blimp, and Taffy Holden
Post Syndicated from The History Guy: History Deserves to Be Remembered original https://www.youtube.com/watch?v=OminGqJHpyY
From AMP to Signed Exchanges, Or How Innovation Happens at Cloudflare
Post Syndicated from Matthew Prince original https://blog.cloudflare.com/from-amp-to-signed-exchanges-or-how-innovation-happens-at-cloudflare/


This is the story of how we decided to work with Google to build Signed Exchanges support at Cloudflare. But, more generally, it’s also a story of how Cloudflare thinks about building disruptive new products and how we’ve built an organization designed around continuous innovation and long-term thinking.
A Threat to the Open Web?
The story starts with me pretty freaked out. In May 2015, Facebook had announced a new format for the web called Instant Articles. The format allowed publishers to package up their pages and serve them directly from Facebook’s infrastructure. This was a threat to Google, so the company responded in October with Accelerated Mobile Pages (AMP). The idea was generally the same as Facebook’s but using Google’s infrastructure.
As a general Internet user, if these initiatives were successful they were pretty scary. The end game was that the entirety of the web would effectively be slurped into Facebook and Google’s infrastructure.
But as the cofounder and CEO of Cloudflare, this presented an even more immediate risk. If everyone moved their infrastructure to Facebook and Google, there wasn’t much left for us to do. Our mission is to help build a better Internet, but we’ve always assumed there would be an Internet. If Facebook and Google were successful, there was real risk there would just be Facebook and Google.
That said, the rationale behind these initiatives was compelling. While they ended with giving Facebook and Google much more control, they started by trying to solve a real problem. The web was designed with the assumption that the devices connecting to it would be on a fixed, wired connection. As more of the web moved to being accessed over wireless, battery-powered, relatively low-power devices, many of the assumptions of the web were holding back its performance.
This is particularly true in the developing world. While a failed connection can happen anywhere, the further you get from where content is hosted, the more likely it is to happen. Facebook and Google both reasoned that if they could package up the web and serve complete copies of pages from their infrastructure, which spanned the developing world, they could significantly increase the usability of the web in areas where there was still an opportunity for Internet usage to grow. Again, this is a laudable goal. But, if successful, the results would have been dreadful for the Internet as we know it.
Seeds of Disruption
So that’s why I was freaked out. In our management meetings at Cloudflare I’d walk through how this was a risk to the Internet and our business, and we needed to come up with a strategy to address it. Everyone on our team listened and agreed but ultimately and reasonably said: that’s in the future, and we have immediate priorities of things our customers need, so we’ll need to wait until next quarter to prioritize it.
That’s all correct, and probably the right decision if you are forced to make one, but it’s also how companies end up getting disrupted. So, in 2016, we decided to fund a small team led by Dane Knecht, Cloudflare’s founding product manager, to set up a sort of skunkworks team in Austin, TX. The idea was to give the team space away from headquarters, so it could work on strategic projects with a long payoff time horizon.
Today, Dane’s team is known as the Emerging Technologies & Incubation (ETI) team. It was where products like Cloudflare for Teams, 1.1.1.1, and Workers were first dreamed up and prototyped. And it remains critical to how Cloudflare continues to be so innovative. Austin, since 2016, has also grown from a small skunkworks outpost to what will, before the end of this year, be our largest office. That office now houses members from every Cloudflare team, not just ETI. But, in some ways, it all started with trying to figure out how we should respond to Instant Articles and AMP.
We met with both Facebook and Google. Facebook’s view of the world was entirely centered around their app, and didn’t leave much room for partners. Google, on the other hand, was born out of the open web and still ultimately wanted to foster it. While there has been a lot of criticism of AMP, much of which we discussed with them directly, it’s important to acknowledge that it started from a noble goal: to make the web faster and easier to use for those with limited Internet resources.
We built a number of products to extend the AMP ecosystem and make it more open. Viewed on their own, those products have not been successes. But they catalyzed a number of other innovations. For instance, building a third party AMP cache on Cloudflare required a more programmable network. That directly resulted in us prototyping a number of different serverless computing strategies and finally settling on Workers. In fact, many of the AMP products we built were the first products built using Workers.
Part of the magic of our ETI team is that they are constantly trying new things. They’re set up differently, in order to take lots of “shots on goal.” Some won’t work, in which case we want them to fail fast. And, even for those that don’t, we are always learning, collaborating, and innovating. That’s how you create a culture of innovation that produces products at the rate we do at Cloudflare.
Signed Exchanges: Helping Build a Better Internet
Importantly also, working with the AMP team at Google helped us better collaborate on ideas around Internet performance. Cloudflare’s mission is to “help build a better Internet.” It’s not to “build a better Internet.” The word “help” is essential and something I’ll always correct if I hear someone leave it out. The Internet is inherently a collection of networks, and also a collection of work from a number of people and organizations. Innovation doesn’t happen in a vacuum but is catalyzed by collaboration and open standards. Working with other great companies who are aligned with democratizing performance optimization technology and speeding up the Internet is how we believe we can make significant and meaningful leaps in terms of performance.

And that’s what Signed Exchanges have the opportunity to be. They take the best parts of AMP — in terms of allowing pages to be preloaded to render almost instantly — but give back control over the content to the individual publishers. They don’t require you to exclusively use Google’s infrastructure and are extensible well beyond just traffic originating from search results. And they make the web incredibly fast and more accessible even in those areas where Internet access is slow or expensive.
We’re proud of the part we played in bringing this new technology to the Internet. We’re excited to see how people use it to build faster services available more broadly. And the ETI team is back at work looking over the innovation horizon and continuously asking the question: what’s next?

Improving Origin Performance for Everyone with Orpheus and Tiered Cache
Post Syndicated from David Tuber original https://blog.cloudflare.com/orpheus/


Cloudflare’s mission is to help build a better Internet for everyone. Building a better Internet means helping build more reliable and efficient services that everyone can use. To help realize this vision, we’re announcing the free distribution of two products, one old and one new:
- Tiered Caching is now available to all customers for free. Tiered Caching reduces origin data transfer and improves performance, making web properties cheaper and faster to operate. Tiered Cache was previously a paid addition to Free, Pro, and Business plans as part of Argo.
- Orpheus is now available to all customers for free. Orpheus routes around problems on the Internet to ensure that customer origin servers are reachable from everywhere, reducing the number of errors your visitors see.
Tiered Caching: improving website performance and economics for everyone
Tiered Cache uses the size of our network to reduce requests to customer origins by dramatically increasing cache hit ratios. With data centers around the world, Cloudflare caches content very close to end users, but if a piece of content is not in cache, the Cloudflare edge data centers must contact the origin server to receive the cacheable content. This can be slow and places load on an origin server compared to serving directly from cache.
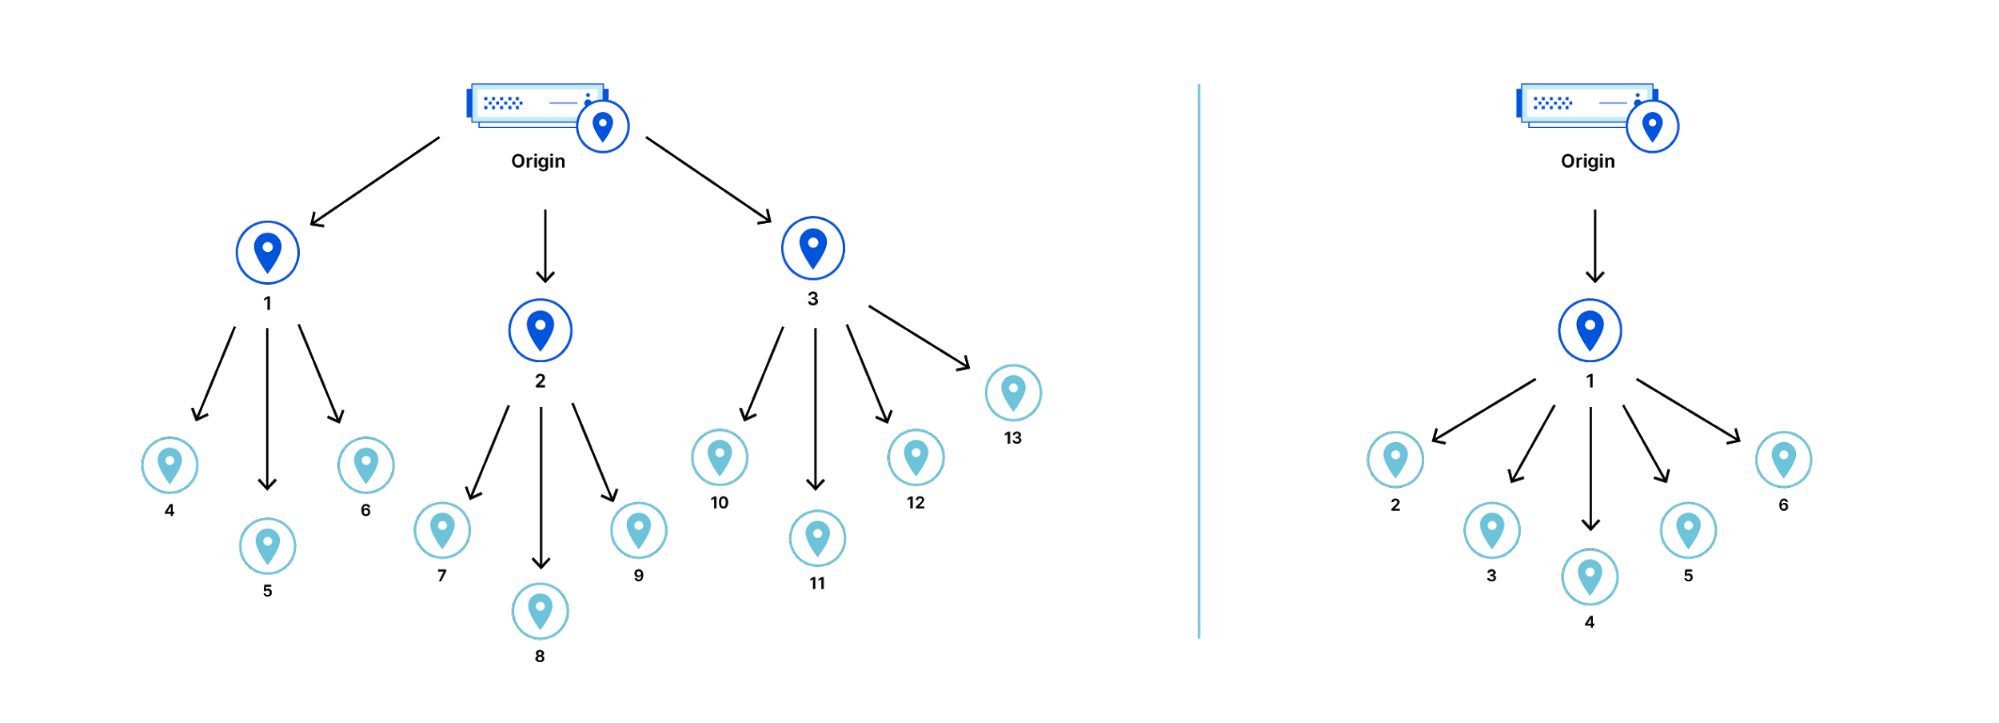
Tiered Cache works by dividing Cloudflare’s data centers into a hierarchy of lower-tiers and upper-tiers. If content is not cached in lower-tier data centers (generally the ones closest to a visitor), the lower-tier must ask an upper-tier to see if it has the content. If the upper-tier does not have it, only the upper-tier can ask the origin for content. This practice improves bandwidth efficiency by limiting the number of data centers that can ask the origin for content, reduces origin load, and makes websites more cost-effective to operate.
Dividing data centers like this results in improved performance for visitors because distances and links traversed between Cloudflare data centers are generally shorter and faster than the links between data centers and origins. It also reduces load on origins, making web properties more economical to operate. Customers enabling Tiered Cache can achieve a 60% or greater reduction in their cache miss rate as compared to Cloudflare’s traditional CDN service.
Additionally, Tiered Cache concentrates connections to origin servers so they come from a small number of data centers rather than the full set of network locations. This results in fewer open connections using server resources.
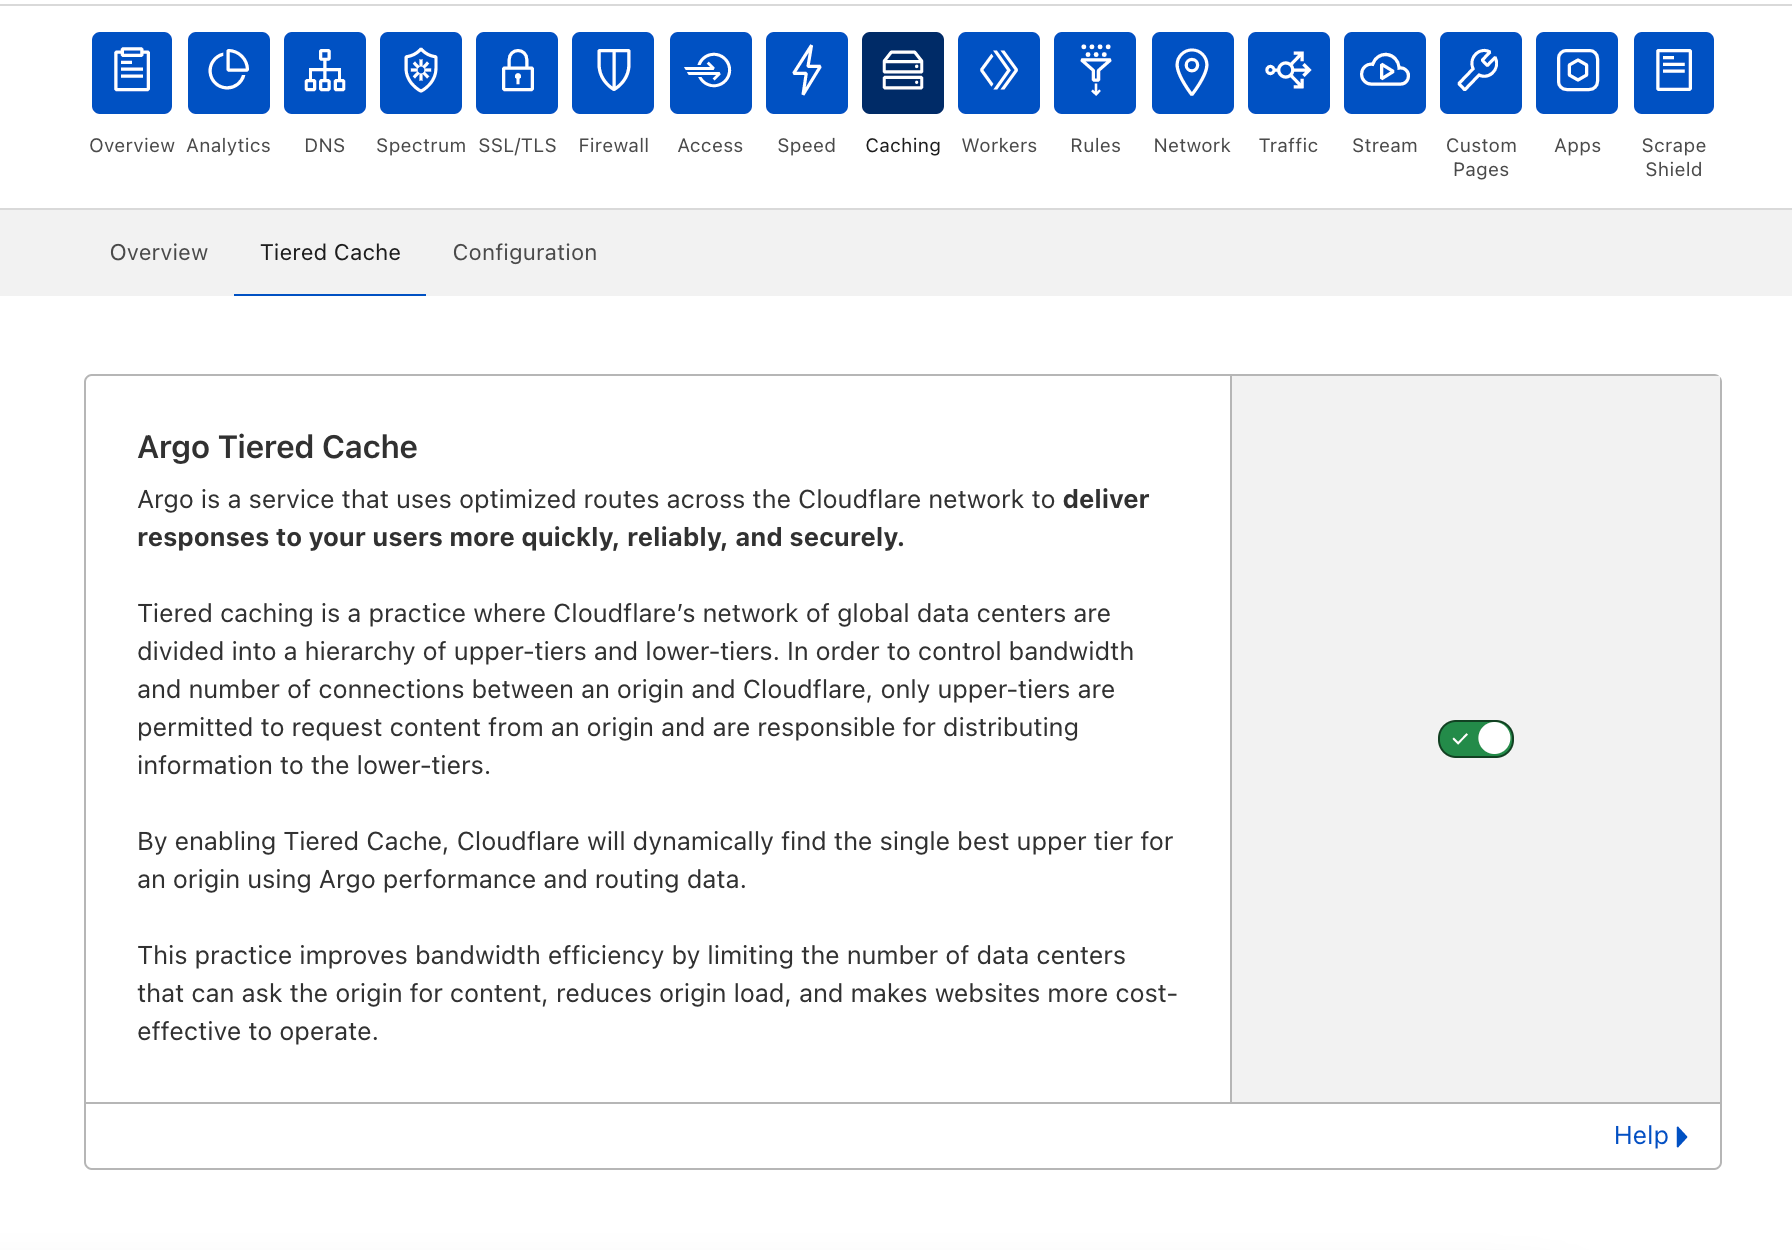
Tiered Cache is simple to enable:
- Log into your Cloudflare account.
- Navigate to the Caching in the dashboard.
- Under Caching, select Tiered Cache.
- Enable Tiered Cache.
From there, customers will automatically be enrolled in Smart Tiered Cache Topology without needing to make any additional changes. Enterprise Customers can select from different prefab topologies or have a custom topology created for their unique needs.
Smart Tiered Cache dynamically selects the single best upper tier for each of your website’s origins with no configuration required. We will dynamically find the single best upper tier for an origin by using Cloudflare’s performance and routing data. Cloudflare collects latency data for each request to an origin. Using this latency data, we can determine how well any upper-tier data center is connected with an origin and can empirically select the best data center with the lowest latency to be the upper-tier for an origin.
Today, Smart Tiered Cache is being offered to ALL Cloudflare customers for free, in contrast to other CDNs who may charge exorbitant fees for similar or worse functionality. Current Argo customers will get additional benefits described here. We think that this is a foundational improvement to the performance and economics of running a website.
But what happens if an upper-tier can’t reach an origin?
Orpheus: solving origin reachability problems for everyone
Cloudflare is a reverse proxy that receives traffic from end users and proxies requests back to customer servers or origins. To be successful, Cloudflare needs to be reachable by end users while simultaneously being able to reach origins. With end users around the world, Cloudflare needs to be able to reach origins from multiple points around the world at the same time. This is easier said than done! The Internet is not homogenous, and diverse Cloudflare network locations do not necessarily take the same paths to a given customer origin at any given time. A customer origin may be reachable from some networks but not from others.
Cloudflare developed Argo to be the Waze of the Internet, allowing our network to react to changes in Internet traffic conditions and route around congestion and breakages in real-time, ensuring end users always have a good experience. Argo Smart Routing provides amazing performance and reliability improvements to our customers.
Enter Orpheus. Orpheus provides reachability benefits for customers by finding unreachable paths on the Internet in real time, and guiding traffic away from those paths, ensuring that Cloudflare will always be able to reach an origin no matter what is happening on the Internet.
Today, we’re excited to announce that Orpheus is available to and being used by all our customers.
Fewer 522s
You may have seen this error before at one time or another.
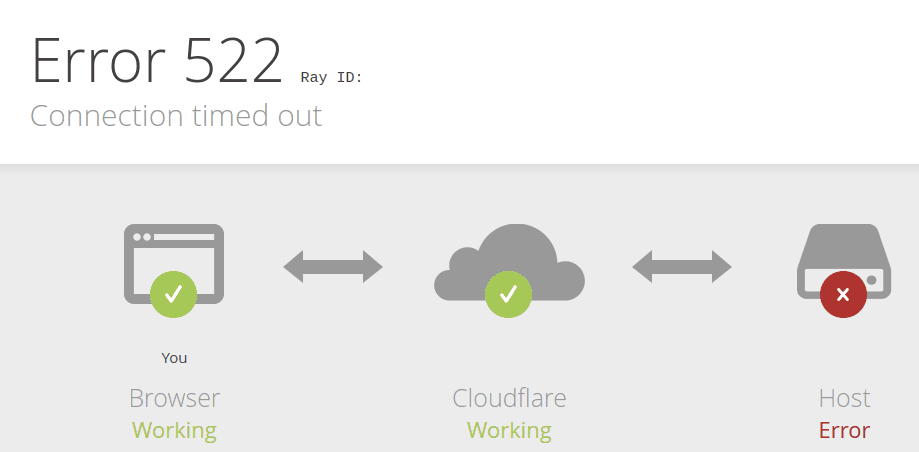
This error indicates that a user was unable to reach content because Cloudflare couldn’t reach the origin. Because of the unpredictability of the Internet described above, users may see this error even when an origin is up and able to receive traffic.
So why do you see this error? The 522 error occurs when network instability causes traffic sent by Cloudflare to fail either before it reaches the origin, or on the way back from the origin to Cloudflare. This is the equivalent of either Cloudflare or your origin sending a request and never getting a response. Both sides think that they’re fine, but the network path between them is not reachable at all. This causes customer pain.
Orpheus solves that pain, ensuring that no matter where users are or where the origin is, an Internet application will always be reachable from Cloudflare.
How it works
Orpheus builds and provisions routes from Cloudflare to origins by analyzing data from users on every path from Cloudflare and ordering them on a per-data center level with the goal of eliminating connection errors and minimizing packet loss. If Orpheus detects errors on the current path from Cloudflare back to a customer origin, Orpheus will steer subsequent traffic from the impacted network path to the healthiest path available.
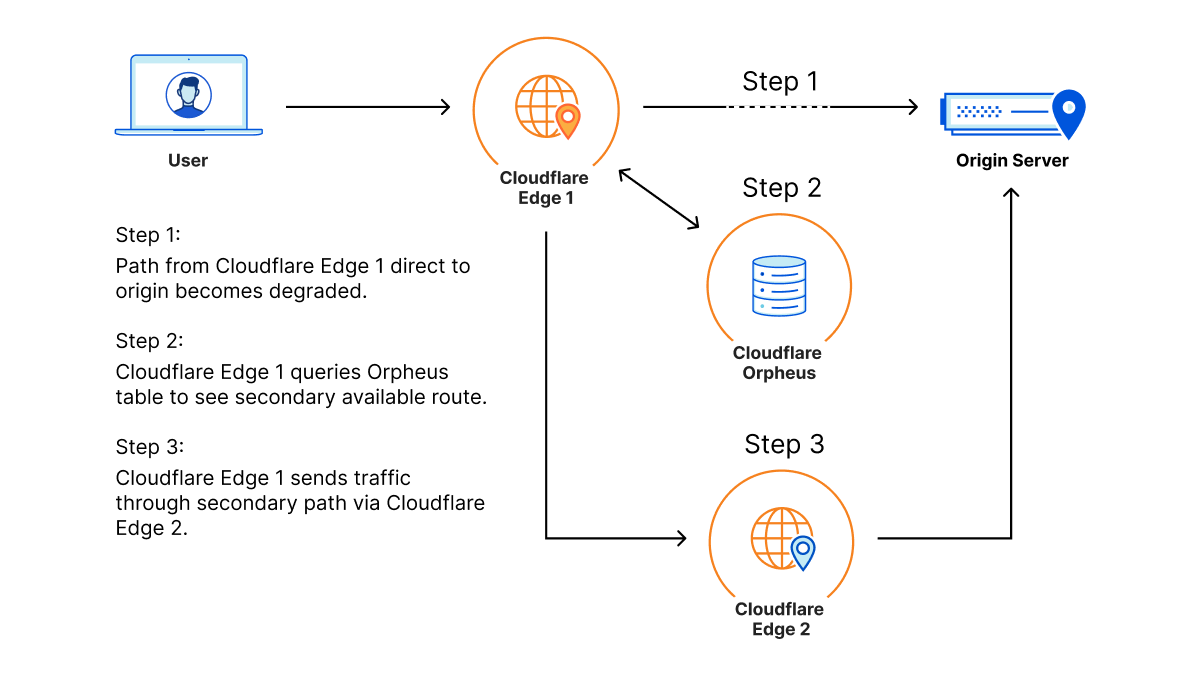
This is similar to how Argo works but with some key differences: Argo is always steering traffic down the fastest path, whereas Orpheus is reactionary and steers traffic down healthy (and not necessarily the fastest) paths when needed.
Improving origin reachability for customers
Let’s look at an example.
Barry has an origin hosted in WordPress in Chicago for his daughter’s band. This zone primarily sees traffic from three locations: the location closest to his daughter in Seattle, the location closest to him in Boston, and the location closest to his parents in Tampa, who check in on their granddaughter’s site daily for updates.
One day, a link between Tampa and the Chicago origin gets cut by a wandering backhoe. This means that Tampa loses some connectivity back to the Chicago origin. As a result, Barry’s parents start to see failures when connecting back to origin when connecting to the site. This reflects in origin reachability decreasing. Orpheus helps here by finding alternate paths for Barry’s parents, whether it’s through Boston, Seattle, or any location in between that isn’t impacted by the fiber cut seen in Tampa.
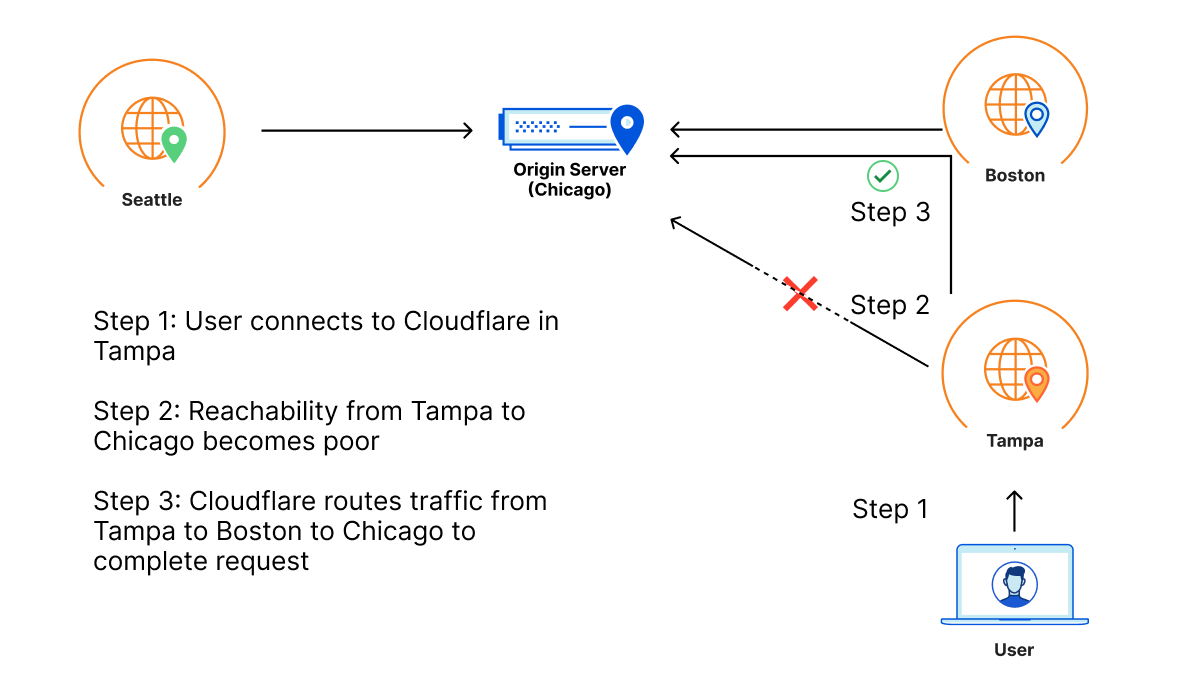
So even though there is packet loss between one of Cloudflare’s data centers and Barry’s origin, because there is a path through a different Cloudflare data center that doesn’t have loss, the traffic will still succeed because the traffic will go down the non-lossy path.
How much does Orpheus help my origin reachability?
In our rollout of Orpheus for customers, we observed that Orpheus improved Origin reachability by 23%, from 99.87% to 99.90%. Here is a chart showing the improvement Orpheus provides (lower is better):
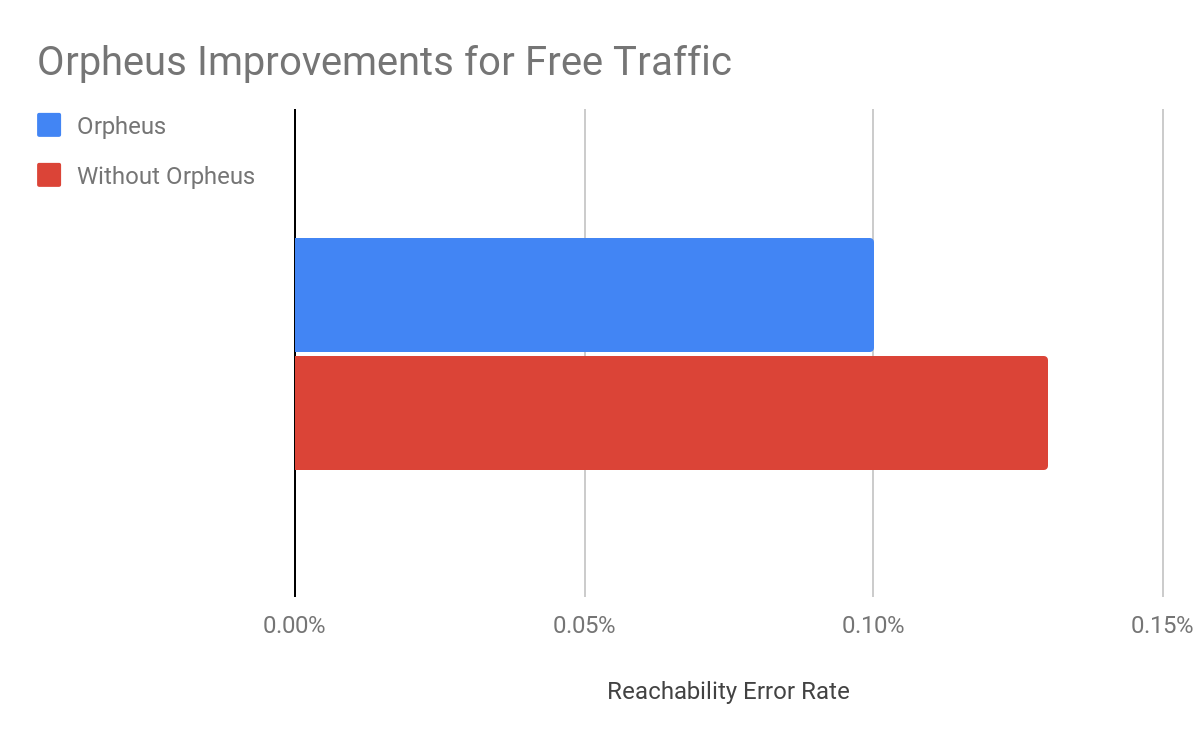
We measure this reachability improvement by measuring 522 rates for every data center-origin pair and then comparing traffic that traversed Orpheus routes with traffic that went directly back to origin. Orpheus was especially helpful at improving reachability for slightly lossy paths that could present small amounts of failure over a long period of time, whereas direct to origin would see those failures.
Note that we’ll never get this number to 0% because, with or without Orpheus, some origins really are unreachable because they are down!
Orpheus makes Cloudflare products better
Orpheus pairs well with some of our products that are already designed to provide highly available services on an uncertain Internet. Let’s go over the interactions between Orpheus and three of our products: Load Balancing, Cloudflare Network Interconnect, and Tiered Cache.
Load Balancing
Orpheus and Load Balancing go together to provide high reachability for every origin endpoint. Load balancing allows for automatic selection of endpoints based on health probes, ensuring that if an origin isn’t working, customers will still be available and operational. Orpheus finds reachable paths from Cloudflare to every origin. These two products in tandem provide a highly available and reachable experience for customers.
Cloudflare Network Interconnect
Orpheus and Cloudflare Network Interconnect (CNI) combine to always provide a highly reachable path, no matter where in the world you are. Consider Acme, a company who is connected to the Internet by only one provider that has a lot of outages. Orpheus will do its best to steer traffic around the lossy paths, but if there’s only one path back to the customer, Orpheus won’t be able to find a less-lossy path. Cloudflare Network Interconnect solves this problem by providing a path that is separate from the transit provider that any Cloudflare data center can access. CNI provides a viable path back to Acme’s origin that will allow Orpheus to engage from any data center in the world if loss occurs.
Shields for All
Orpheus and Tiered Cache can combine to build an adaptive shield around an origin that caches as much as possible while improving traffic back to origin. Tiered Cache topologies allow for customers to deflect much of their static traffic away from their origin to reduce load, and Orpheus helps ensure that any traffic that has to go back to the origin traverses over highly available links.
Improving origin performance for everyone
The Internet is a growing, ever-changing ecosystem. With the release of Orpheus and Tiered Cache for everyone, we’ve given you the ability to navigate whatever the Internet has in store to provide the best possible experience to your customers.
Argo 2.0: Smart Routing Learns New Tricks
Post Syndicated from David Tuber original https://blog.cloudflare.com/argo-v2/


We launched Argo in 2017 to improve performance on the Internet. Argo uses real-time global network information to route around brownouts, cable cuts, packet loss, and other problems on the Internet. Argo makes the network that Cloudflare relies on—the Internet—faster, more reliable, and more secure on every hop around the world.
Without any complicated configuration, Argo is able to use real-time traffic data to pick the fastest path across the Internet, improving performance and delivering more satisfying experiences to your customers and users.
Today, Cloudflare is announcing several upgrades to Argo’s intelligent routing:
- When it launched, Argo was entirely focused on the “middle mile,” speeding up connections from Cloudflare to our customers’ servers. Argo now delivers optimal routes from clients and users to Cloudflare, further reducing end-to-end latency while still providing the impressive edge to origin performance that Argo is known for. These last-mile improvements reduce end user round trip times by up to 40%.
- We’re also adding support for accelerating pure IP workloads, allowing Magic Transit and Magic WAN customers to build IP networks to enjoy the performance benefits of Argo.
Starting today, all Free, Pro, and Business plan Argo customers will see improved performance with no additional configuration or charge. Enterprise customers have already enjoyed the last mile performance improvements described here for some time. Magic Transit and WAN customers can contact their account team to request Early Access to Argo Smart Routing for Packets.
What’s Argo?
Argo finds the best and fastest possible path for your traffic on the Internet. Every day, Cloudflare carries hundreds of billions of requests across our network and the Internet. Because our network, our customers, and their end users are well distributed globally, all of these requests flowing across our infrastructure paint a great picture of how different parts of the Internet are performing at any given time.
Just like Waze examines real data from real drivers to give you accurate, uncongested — and sometimes unorthodox — routes across town, Argo Smart Routing uses the timing data Cloudflare collects from each request to pick faster, more efficient routes across the Internet.
In practical terms, Cloudflare’s network is expansive in its reach. Some Internet links in a given region may be congested and cause poor performance (a literal traffic jam). By understanding this is happening and using alternative network locations and providers, Argo can put traffic on a less direct, but faster, route from its origin to its destination.
These benefits are not theoretical: enabling Argo Smart Routing shaves an average of 33% off HTTP time to first byte (TTFB).
One other thing we’re proud of: we’ve stayed super focused on making it easy to use. One click in the dashboard enables better, smarter routing, bringing the full weight of Cloudflare’s network, data, and engineering expertise to bear on making your traffic faster. Advanced analytics allow you to understand exactly how Argo is performing for you around the world.
You can read a lot more about how Argo works in our original launch blog post.
Even More Blazing Fast
We’ve continuously improved Argo since the day it was launched, making it faster, quicker to respond to changes on the Internet, and allowing more types of traffic to flow over smart routes.
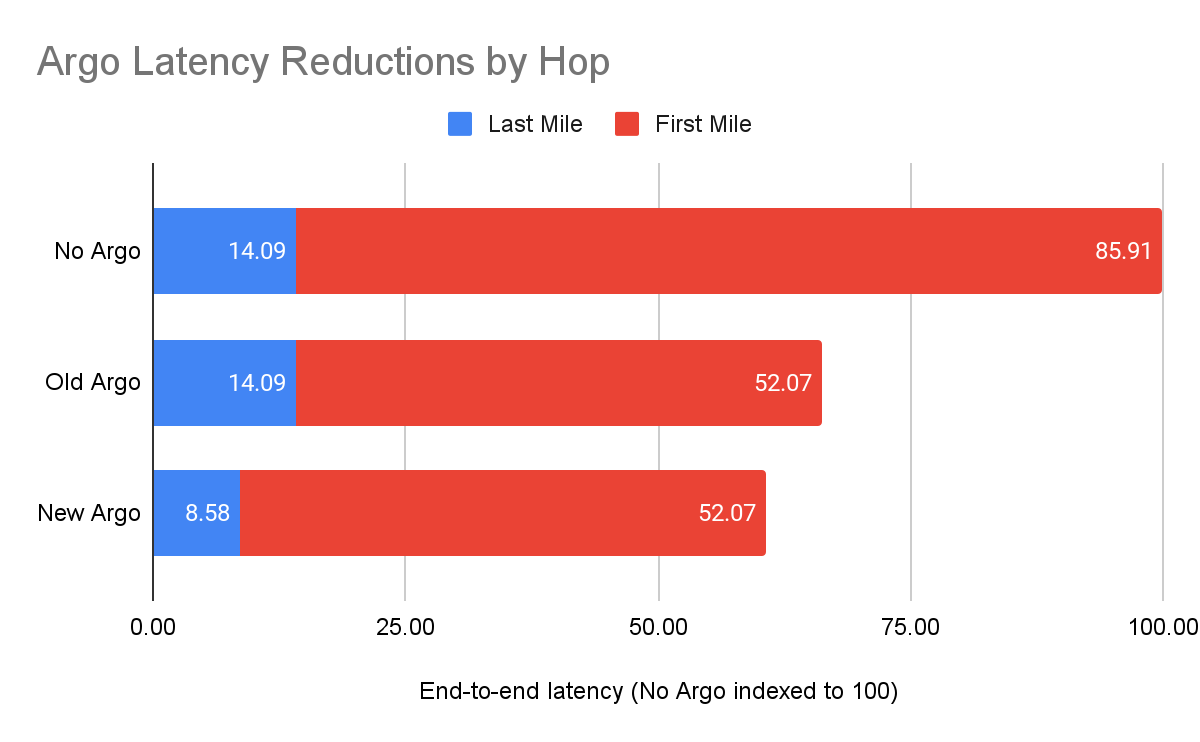
Argo’s new performance optimizations improve last mile latencies and reduce time to first byte even further. Argo’s last mile optimizations can save up to 40% on last mile round trip time (RTT) with commensurate improvements to end-to-end latency.
Running benchmarks against an origin server in the central United States, with visitors coming from around the world, Argo delivered the following results:
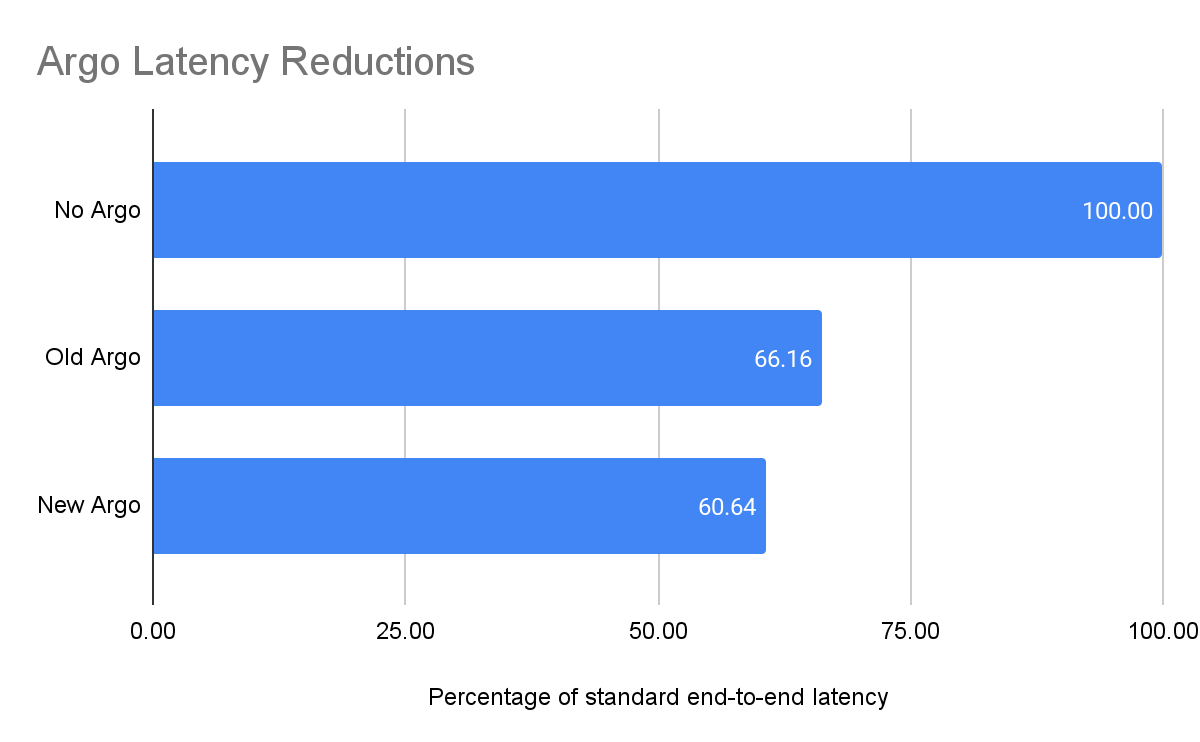
The Argo improvements on the last mile reduced overall time to first byte by 39%, and reduced end-to-end latencies by 5% overall:
Faster, better caching
Argo customers don’t just see benefits to their dynamic traffic. Argo’s new found skills provide benefits for static traffic as well. Because Argo now finds the best path to Cloudflare, client TTFB for cache hits sees the same last mile benefit as dynamic traffic.
Getting access to faster Argo
The best part about all these improvements? They’re already deployed and enabled for all Argo customers! These optimizations have been live for Enterprise customers for some time and were enabled for Free, Pro, and Business plans this week.
Moving Down the Stack: Argo Smart Routing for Packets
Customers use Magic Transit and Magic WAN to create their own IP networks on top of Cloudflare’s network, with access to a full suite of network functions (firewalls, DDoS mitigation, and more) delivered as a service. This allows customers to build secure, private, global networks without the need to purchase specialized hardware. Now, Argo Smart Routing for Packets allows these customers to create these IP networks with the performance benefits of Argo.
Consider a fictional gaming company, Golden Fleece Games. Golden Fleece deployed Magic Transit to mitigate attacks by malicious actors on the Internet. They want to be able to provide a quality game to their users while staying up. However, they also need their service to be as fast as possible. If their game sees additional latency, then users won’t play it, and even if their service is technically up, the increased latency will show a decrease in users. For Golden Fleece, being slow is just as bad as being down.
Finance customers also have similar requirements for low latency, high security scenarios. Consider Jason Financial, a fictional Magic Transit customer using Packet Smart Routing. Jason Financial employees connect to Cloudflare in New York, and their requests are routed to their data center which is connected to Cloudflare through a Cloudflare Network Interconnect attached to Cloudflare in Singapore. For Jason Financial, reducing latency is extraordinarily important: if their network is slow, then the latency penalties they incur can literally cost them millions of dollars due to how fast the stock market moves. Jason wants Magic Transit and other Cloudflare One products to secure their network and prevent attacks, but improving performance is important for them as well.
Argo’s Smart Routing for Packets provides these customers with the security they need at speeds faster than before. Now, customers can get the best of both worlds: security and performance. Now, let’s talk a bit about how it works.
A bird’s eye view of the Internet
Argo Smart Routing for Packets picks the fastest possible path between two points. But how does Argo know that the chosen route is the fastest? As with all Argo products, the answer comes by analyzing a wealth of network data already available on the Cloudflare edge. In Argo for HTTP or Argo for TCP, Cloudflare is able to use existing timing data from traffic that’s already being sent over our edge to optimize routes. This allows us to improve which paths are taken as traffic changes and congestion on the Internet happens. However, to build Smart Routing for Packets, the game changed, and we needed to develop a new approach to collect latency data at the IP layer.
Let’s go back to the Jason Financial case. Before, Argo would understand that the number of paths that are available from Cloudflare’s data centers back to Jason’s data center is proportional to the number of data centers Cloudflare has multiplied by the number of distinct interconnections between each data center. By looking at the traffic to Singapore, Cloudflare can use existing Layer 4 traffic and network analytics to determine the best path. But Layer 4 is not Layer 3, and when you move down the stack, you lose some insight into things like round trip time (RTT), and other metrics that compose time to first byte because that data is only produced at higher levels of the application stack. It can become harder to figure out what the best path actually is.
Optimizing performance at the IP layer can be more difficult than at higher layers. This is because protocol and application layers have additional headers and stateful protocols that allow for further optimization. For example, connection reuse is a performance improvement that can only be realized at higher layers of the stack because HTTP requests can reuse existing TCP connections. IP layers don’t have the concept of connections or requests at all: it’s just packets flowing over the wire.
To help bridge the gap, Cloudflare makes use of an existing data source that already exists for every Magic Transit customer today: health check probes. Every Magic Transit customer leverages existing health check probes from every single Cloudflare data center back to the customer origin. These probes are used to determine tunnel health for Magic Transit, so that Cloudflare knows which paths back to origin are healthy. These probes contain a variety of information that can also be used to improve performance as well. By examining health check probes and adding them to existing Layer 4 data, Cloudflare can get a better understanding of one-way latencies and can construct a map that allows us to see all the interconnected data centers and how fast they are to each other. Once this customer gets a Cloudflare Network Interconnect, Argo can use the data center-to-data center probes to create an alternate path for the customer that’s different from the public Internet.
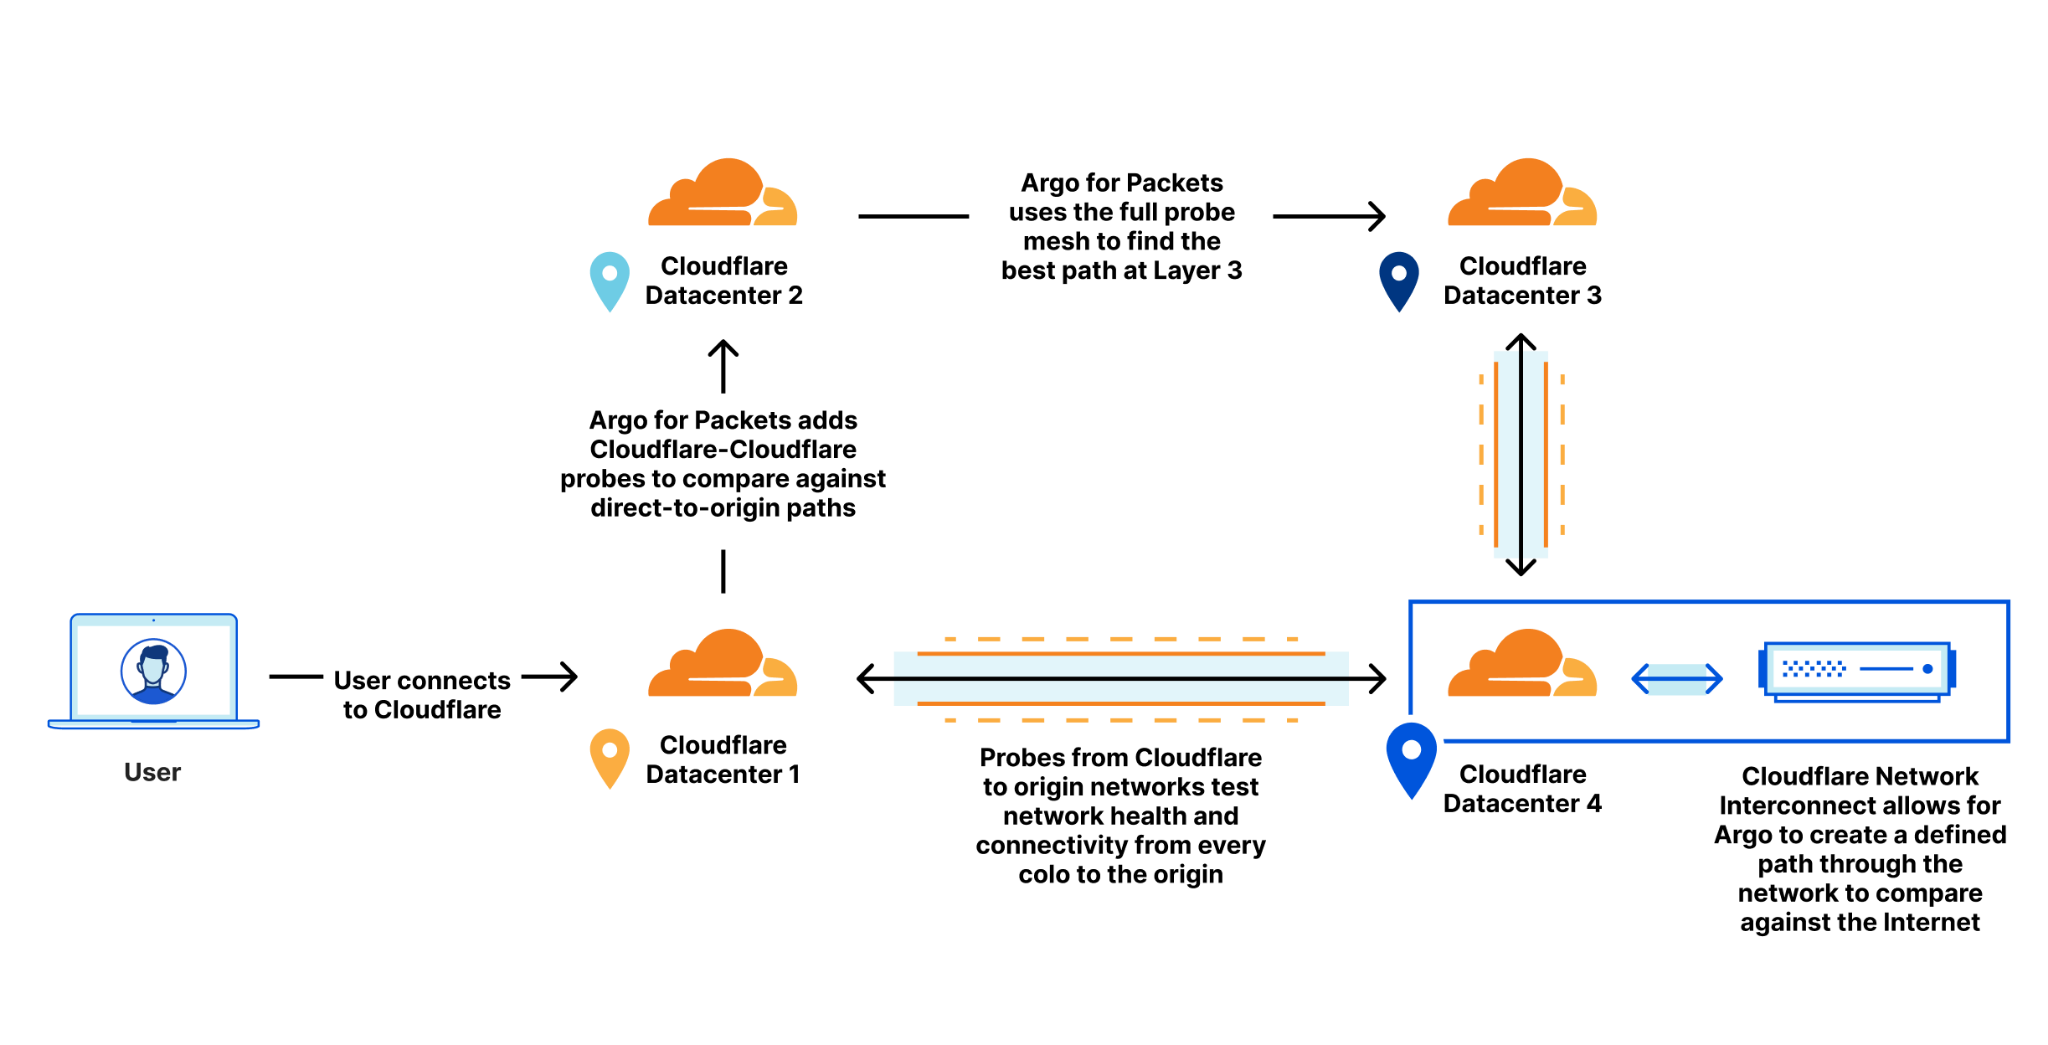
Using this map, Cloudflare can construct dynamic routes for each customer based on where their traffic enters Cloudflare’s network and where they need to go. This allows us to find the optimal route for Jason Financial and allows us to always pick the fastest path.
Packet-Level Latency Reductions
We’ve kind of buried the lede here! We’ve talked about how hard it is to optimize performance for IP traffic. The important bit: despite all these difficulties, Argo Smart Routing for Packets is able to provide a 10% average latency improvement worldwide in our internal testing!
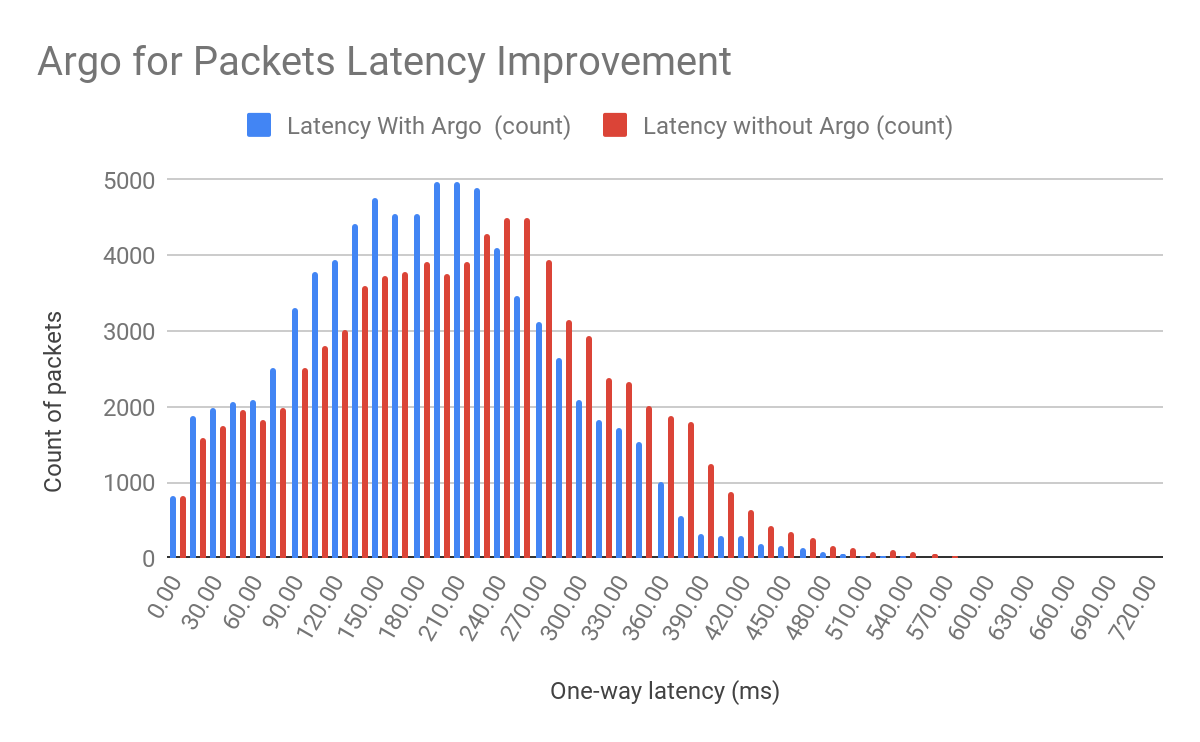
Depending on your network topology, you may see latency reductions that are even higher!
How do I get Argo Smart Routing for Packets?
Argo Smart Routing for Packets is in closed beta and is available only for Magic Transit customers who have a Cloudflare Network Interconnect provisioned. If you are a Magic Transit customer interested in seeing the improved performance of Argo Smart Routing for Packets for yourself, reach out to your account team today! If you don’t have Magic Transit but want to take advantage of bigger performance gains while acquiring uncompromised levels of network security, begin your Magic Transit onboarding process today!
What’s next for Argo
Argo’s roadmap is simple: get ever faster, for any type of traffic.
Argo’s recent optimizations will help customers move data across the Internet at as close to the speed of light as possible. Internally, “how fast are we compared to the speed of light” is one of our engineering team’s key success metrics. We’re not done until we’re even.
Improve site load times and SEO with one-click support for Signed Exchanges on Google Search
Post Syndicated from Marc Lamik original https://blog.cloudflare.com/automatic-signed-exchanges/
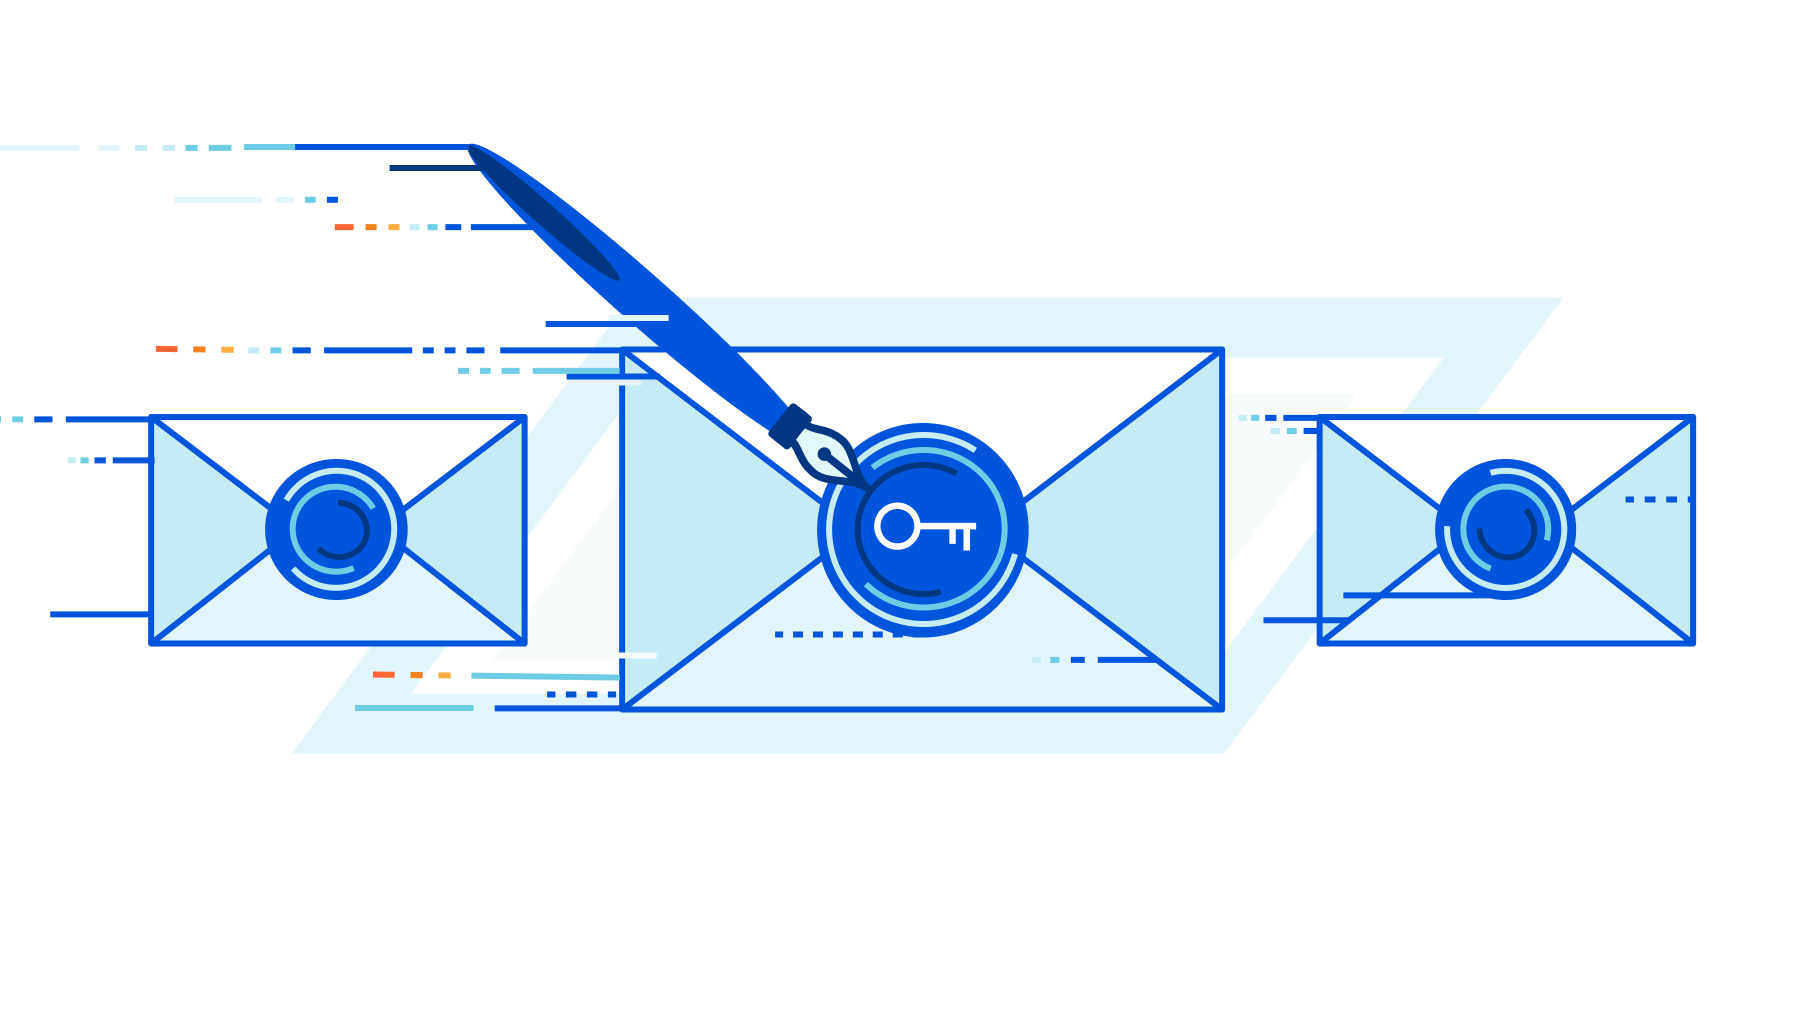

We’re excited to announce that, starting today, Cloudflare customers will be able to generate Signed Exchanges (SXG) for Google Search with just one click. Signed Exchanges is an open web platform specification Google developed as a way of verifying a cached version of a website — enabling massively faster delivery of a website from a third party, such as Google itself from its search results page, or from a news aggregator that is linking out to other sites.
The advantage to you as a website owner? Not only will your site load faster when linked to from a site supporting SXG, but because many search engines use page load times in order to determine search results, you should see a very nice boost in SEO.
What are signed exchanges, and how do they work?
Introduced by Google, a Signed Exchange (SXG) is an open standard delivery mechanism that makes it possible to authenticate the origin of a resource, independent of how it was delivered. This decoupling advances a variety of use cases, such as prefetching, offline Internet experiences, and serving from third-party caches. It does so in a secure and privacy-preserving manner.
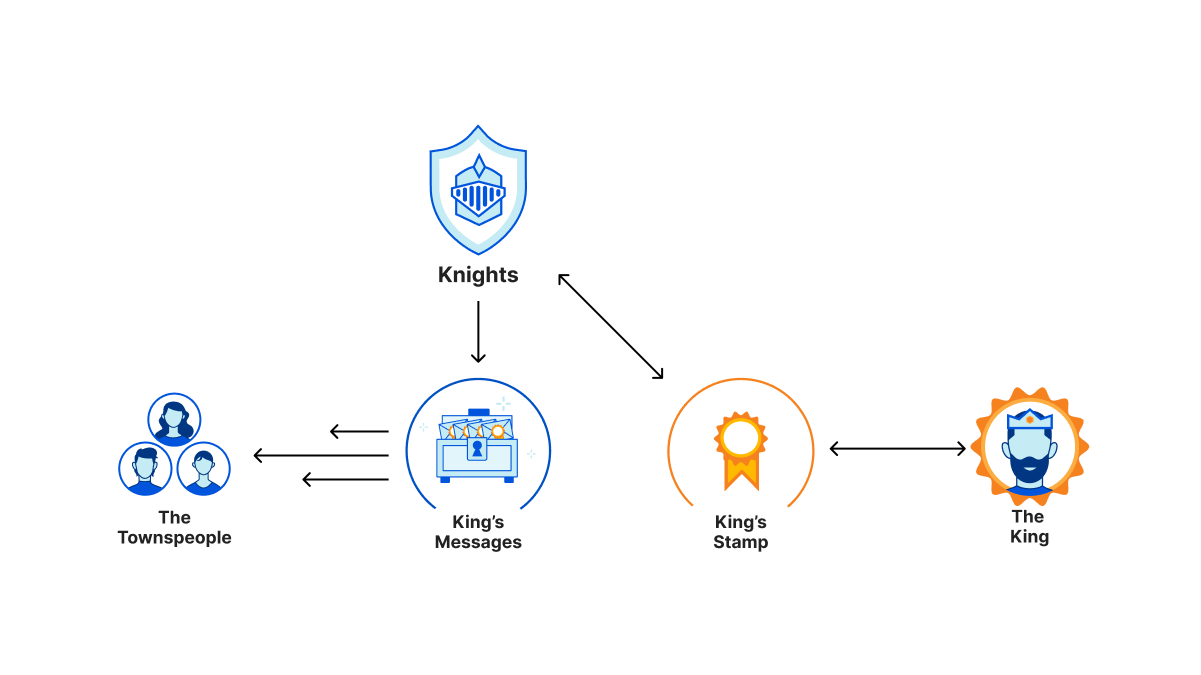
Now, imagine yourself as the ruler of your kingdom with an important message to deliver to all your subjects. You have too many people to reach, so you can’t do it alone. You decide to enlist your trusty knights to ride out with large chests filled with copies of your message. There are villains everywhere that would love to take these messages and modify them for their own nefarious machinations for their own profit.
You, being the wise ruler you are, have a crafty plan: you have a very special stamp made that can imprint a seal that everyone can recognize, yet no one can recreate. With this wondrous seal, no one can tamper with the messages without breaking the seal and proving the forgery for all to see. Now, your knights can bring these chests to all corners of the kingdom and hand out the messages to the masses, and your subjects can trust that the message came from you. There is a side benefit for your people, too. They can come whenever they want to pick up the message without your watchful eye, so they’re more inclined to read it at their leisure.
Maybe this is stretching the analogy a bit, but in the case of Signed Exchanges, a cryptographic signature on a digest of the response and headers acts as the tamper proof seal for the message. Fast forwarding our example to the present day: you want to get your newest web experience out to global distribution with the understanding that just about everyone will come through a search engine or aggregator site. Ahead of time, when you publish your content, the search engine crawls your site for content, but instead of delivering the raw content, you negotiate the delivery of the signed exchange. (This is accomplished simply through additional “Accept: application/signed-exchange;v=<version>” request headers from the crawler that announces the preference for signed exchanges).
Then Cloudflare generates the Signed Exchange, using the following process:
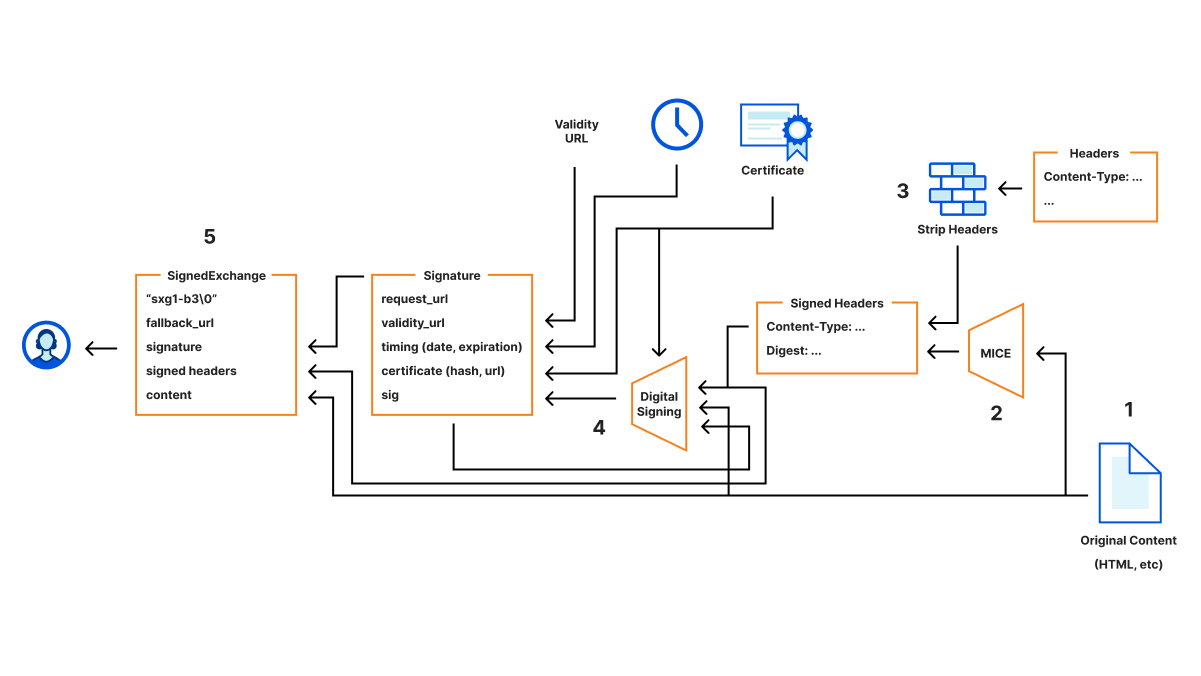
- Cloudflare fetches the original content that you want to sign, including the response headers.
- An additional Digest header is added that uses Merkle Integrity Content Encoding to support the progressive detection of data modification/corruption.
- We also strip out headers that don’t make sense within the context of Signed Exchanges (like Connection, Keep-Alive, etc.) as well as security sensitive headers (Set-Cookie, Authentication-Info, etc.).
- Then these headers, including the digest, along with additional metadata, like request URL, URL of the certificate, hash of the certificate, expiration time, etc., are all chained together into a stream that is used to calculate the final signature.
- The original content, along with the headers, signature, and a fallback URL are then packed into a final binary for delivery.
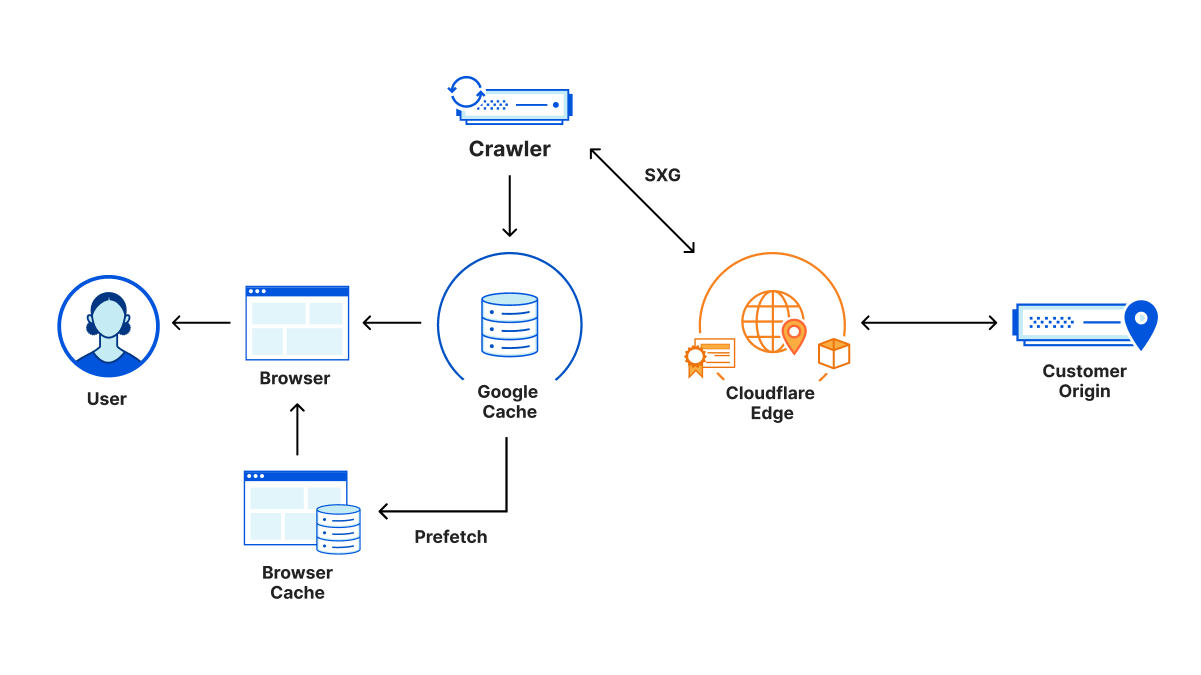
This Signed Exchange is then cached and sent to the crawler, which also stores the Signed Exchange. After indexing the content, it can now show up in searches. The user then discovers the link to your content in the search results. The search engine also preloads the signed exchange for your content in the background in the meantime, effectively pre-filling the cache in the client’s browser. This exchange was delivered from the search engine, so no signal has gone to the origin yet. Thus, the search intent of the user isn’t leaked to the origin. Since the exchange is signed and validated against your certificate, the browser trusts the contents and can display the content with attribution to the original URL. Now, when the user clicks on the link to view the contents, it magically loads instantaneously from the local cache.
There are many resources on the web available that go into detail about the specific format of Signed Exchanges, so we won’t rehash them here in detail. But one important aspect that isn’t obvious at first glance is the complexity of managing the signing process itself. The many details involve:
- The inclusion of the atypical CanSignHttpExchanges extension to your certificate.
- The requirement to deliver your certificates in a specific CBOR (like binary JSON) format.
- OCSP stapling to ensure the validity of the certificates is required.
- Renewals of these certificates on a more frequent basis (i.e. requires automation).
- Caching of the generated signed exchanges, since they can be expensive to generate.
Luckily, all of these are in Cloudflare’s wheelhouse, since we already have deep expertise in Certificate Management and TLS delivery infrastructure. By partnering with Google on the Signed Exchange implementation, we can ensure the consistency of implementation, but improve the simplicity of integrating the technology with the single push of a button.
“Signed Exchanges make the web faster and a better user experience for users, by enabling cross-site prefetching. Site owners have seen clear improvement to Largest Contentful Paint, one of the Core Web Vitals, as well as increased user stickiness. Cloudflare now makes it simple for sites to implement Signed Exchanges and derive these benefits.” — Jeff Jose, Product Manager, Google
Bigger than search alone
The broader implication of SXGs is that they make content portable: content delivered via an SXG can be easily distributed by third parties while maintaining full assurance and attribution of its origin. Historically, the only way for a site to use a third party to distribute its content while maintaining attribution has been for the site to share its SSL certificates with the distributor. This has security drawbacks. Moreover, it is a far stretch from making content truly portable.
In the long-term, truly portable content can be used to achieve use cases like fully offline experiences. In the immediate term, the primary use case of SXGs is the delivery of faster user experiences by providing content in an easily cacheable format. Specifically, Google Search will cache and sometimes prefetch SXGs. For sites that receive a large portion of their traffic from Google Search, SXGs can be an important tool for delivering faster page loads to users.
It’s also possible that all sites could eventually support this standard. Every time a site is loaded, all the linked articles could be pre-loaded. Web speeds across the board would be dramatically increased. Matthew’s blog post talks more about this possibility.
Sign up today
Automatic Signed Exchanges will be free for all Cloudflare Pro, Business and Enterprise customers as well as for customers using our Advanced Platform Optimization product.
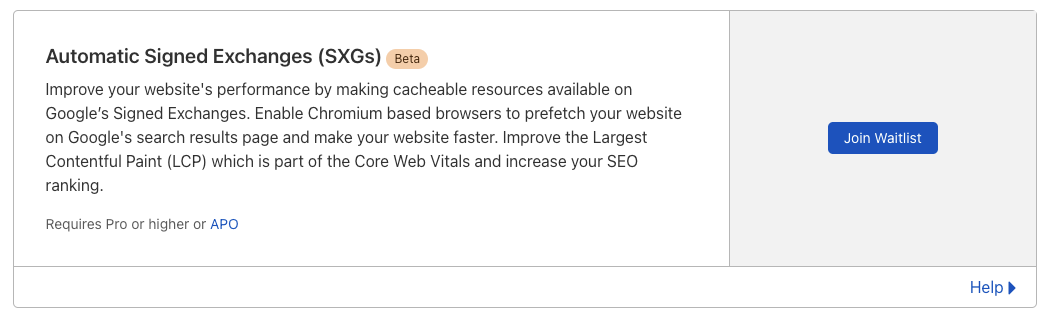
Sign up for the Automatic Signed Exchange beta waitlist today and after being approved, activating is only one flip of a switch.
To sign up for the waitlist go to the Speed page on the Cloudflare dashboard and click on “Join Waitlist” on the Automatic Signed Exchanges (SXGs) card.
We’ll take care of the rest.
How we built Instant Logs
Post Syndicated from Ben Yule original https://blog.cloudflare.com/how-we-built-instant-logs/


As a developer, you may be all too familiar with the stress of responding to a major service outage, becoming aware of an ongoing security breach, or simply dealing with the frustration of setting up a new service for the first time. When confronted with these situations, you want a real-time view into the events flowing through your network, so you can receive, process, and act on information as quickly as possible.
If you have a UNIX mindset, you’ll be familiar with tailing web service logs and searching for patterns using grep. With distributed systems like Cloudflare’s edge network, this task becomes much more complex because you’ll either need to log in to thousands of servers, or ship all the logs to a single place.
This is why we built Instant Logs. Instant Logs removes all barriers to accessing your Cloudflare logs, giving you a complete platform to view your HTTP logs in real time, with just a single click, right from within Cloudflare’s dashboard. Powerful filters then let you drill into specific events or search for patterns, and act on them instantly.
The Challenge
Today, Cloudflare’s Logpush product already gives customers the ability to ship their logs to a third-party analytics or storage provider of their choosing. While this system is already exceptionally fast, delivering logs in about 15s on average, it is optimized for completeness and the utmost certainty that your data is reliably making it to its destination. It is the ideal solution for after things have settled down, and you want to perform a forensic deep dive or retrospective.
We originally aimed to extend this system to provide our real-time logging capabilities, but we soon realized the objectives were inherently at odds with each other. In order to get all of your data, to a single place, all the time, the laws of the universe require that latencies be introduced into the system. We needed a complementary solution, with its own unique set of objectives.
This ultimately boiled down to the following
- It has to be extremely fast, in human terms. This means average latencies between an event occurring at the edge and being received by the client should be under three seconds.
- We wanted the system design to be simple, and communication to be as direct to the client as possible. This meant operating the dataplane entirely at the edge, eliminating unnecessary round trips to a core data center.
- The pipeline needs to provide sensible results on properties of all sizes, ranging from a few requests per day to hundreds of thousands of requests per second.
- The pipeline must support a broad set of user-definable filters that are applied before any sampling occurs, such that a user can target and receive exactly what they want.
Workers and Durable Objects
Our existing Logpush pipeline relies heavily on Kafka to provide sharding, buffering, and aggregation at a single, central location. While we’ve had excellent results using Kafka for these pipelines, the clusters are optimized to run only within our core data centers. Using Kafka would require extra hops to far away data centers, adding a latency penalty we were not willing to incur.
In order to keep the data plane running on the edge, we needed primitives that would allow us to perform some of the same key functions we needed out of Kafka. This is where Workers and the recently released Durable Objects come in. Workers provide an incredibly simple to use, highly elastic, edge-native, compute platform we can use to receive events, and perform transformations. Durable Objects, through their global uniqueness, allow us to coordinate messages streaming from thousands of servers and route them to a singular object. This is where aggregation and buffering are performed, before finally pushing to a client over a thin WebSocket. We get all of this, without ever having to leave the edge!
Let’s walk through what this looks like in practice.
A Simple Start
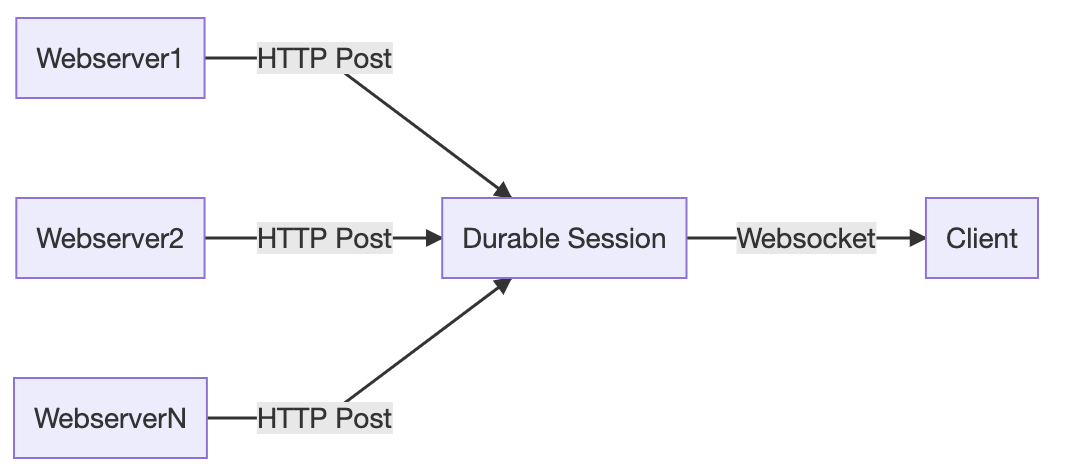
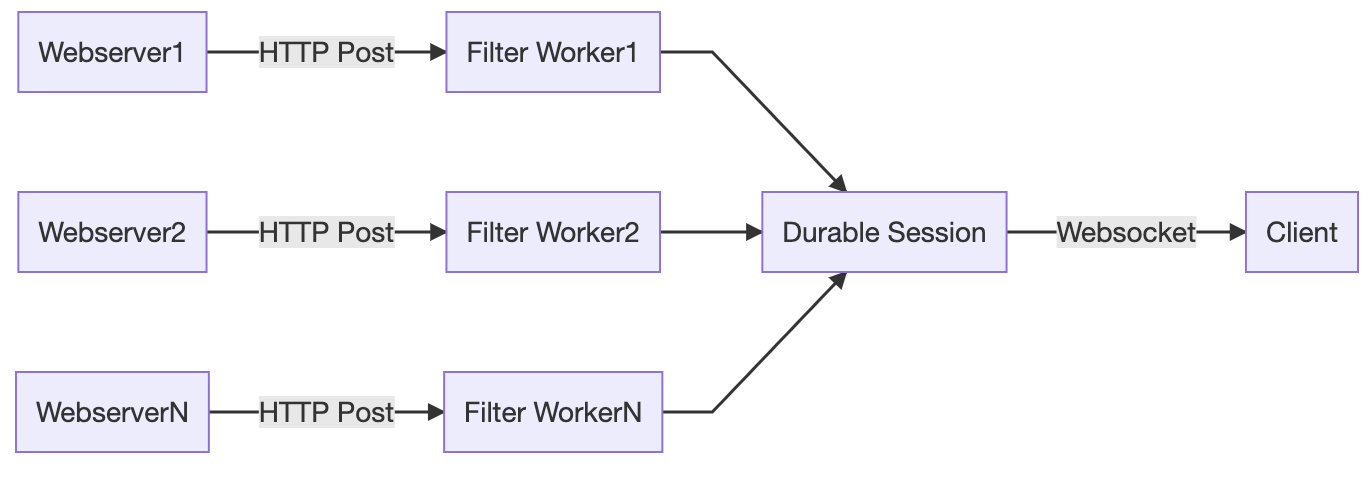
Imagine a simple scenario in which we have a single web server which produces log messages, and a single client which wants to consume them. This can be implemented by creating a Durable Object, which we will refer to as a Durable Session, that serves as the point of coordination between the server and client. In this case, the client initiates a WebSocket connection with the Durable Object, and the server sends messages to the Durable Object over HTTP, which are then forwarded directly to the client.

This model is quite quick and introduces very little additional latency other than what would be required to send a payload directly from the web server to the client. This is thanks to the fact that Durable Objects are generally located at or near the data center where they are first requested. At least in human terms, it’s instant. Adding more servers to our model is also trivial. As the additional servers produce events, they will all be routed to the same Durable Object, which merges them into a single stream, and sends them to the client over the same WebSocket.
Durable Objects are inherently single threaded. As the number of servers in our simple example increases, the Durable Object will eventually saturate its CPU time and will eventually start to reject incoming requests. And even if it didn’t, as data volumes increase, we risk overwhelming a client’s ability to download and render log lines. We’ll handle this in a few different ways.
Honing in on specific events
Filtering is the most simple and obvious way to reduce data volume before it reaches the client. If we can filter out the noise, and stream only the events of interest, we can substantially reduce volume. Performing this transformation in the Durable Object itself will provide no relief from CPU saturation concerns. Instead, we can push this filtering out to an invoking Worker, which will run many filter operations in parallel, as it elastically scales to process all the incoming requests to the Durable Object. At this point, our architecture starts to look a lot like the MapReduce pattern!
Scaling up with shards
Ok, so filtering may be great in some situations, but it’s not going to save us under all scenarios. We still need a solution to help us coordinate between potentially thousands of servers that are sending events every single second. Durable Objects will come to the rescue, yet again. We can implement a sharding layer consisting of Durable Objects, we will call them Durable Shards, that effectively allow us to reduce the number of requests being sent to our primary object.
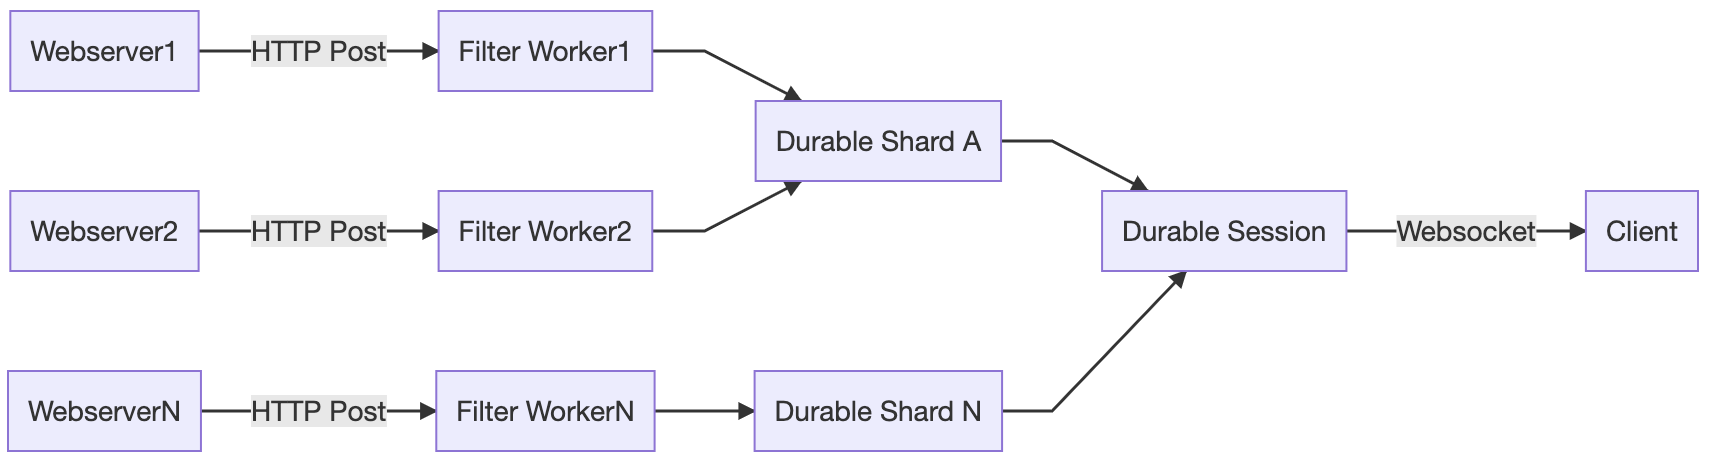
But how do we implement this layer if Durable Objects are globally unique? We first need to decide on a shard key, which is used to determine which Durable Object a given message should first be routed to. When the Worker processes a message, the key will be added to the name of the downstream Durable Object. Assuming our keys are well-balanced, this should effectively reduce the load on the primary Durable Object by approximately 1/N.
Reaching the moon by sampling
But wait, there’s more to do. Going back to our original product requirements, “The pipeline needs to provide sensible results on properties of all sizes, ranging from a few requests per day to hundreds of thousands of requests per second.” With the system as designed so far, we have the technical headroom to process an almost arbitrary number of logs. However, we’ve done nothing to reduce the absolute volume of messages that need to be processed and sent to the client, and at high log volumes, clients would quickly be overwhelmed. To deliver the interactive, instant user experience customers expect, we need to roll up our sleeves one more time.
This is where our final trick, sampling, comes into play.
Up to this point, when our pipeline saturates, it still makes forward progress by dropping excess data as the Durable Object starts to refuse connections. However, this form of ‘uncontrolled shedding’ is dangerous because it causes us to lose information. When we drop data in this way, we can’t keep a record of the data we dropped, and we cannot infer things about the original shape of the traffic from the messages that we do receive. Instead, we implement a form of ‘controlled’ sampling, which still preserves the statistics, and information about the original traffic.
For Instant Logs, we implement a sampling technique called Reservoir Sampling. Reservoir sampling is a form of dynamic sampling that has this amazing property of letting us pick a specific k number of items from a stream of unknown length n, with a single pass through the data. By buffering data in the reservoir, and flushing it on a short (sub second) time interval, we can output random samples to the client at the maximum data rate of our choosing. Sampling is implemented in both layers of Durable Objects.
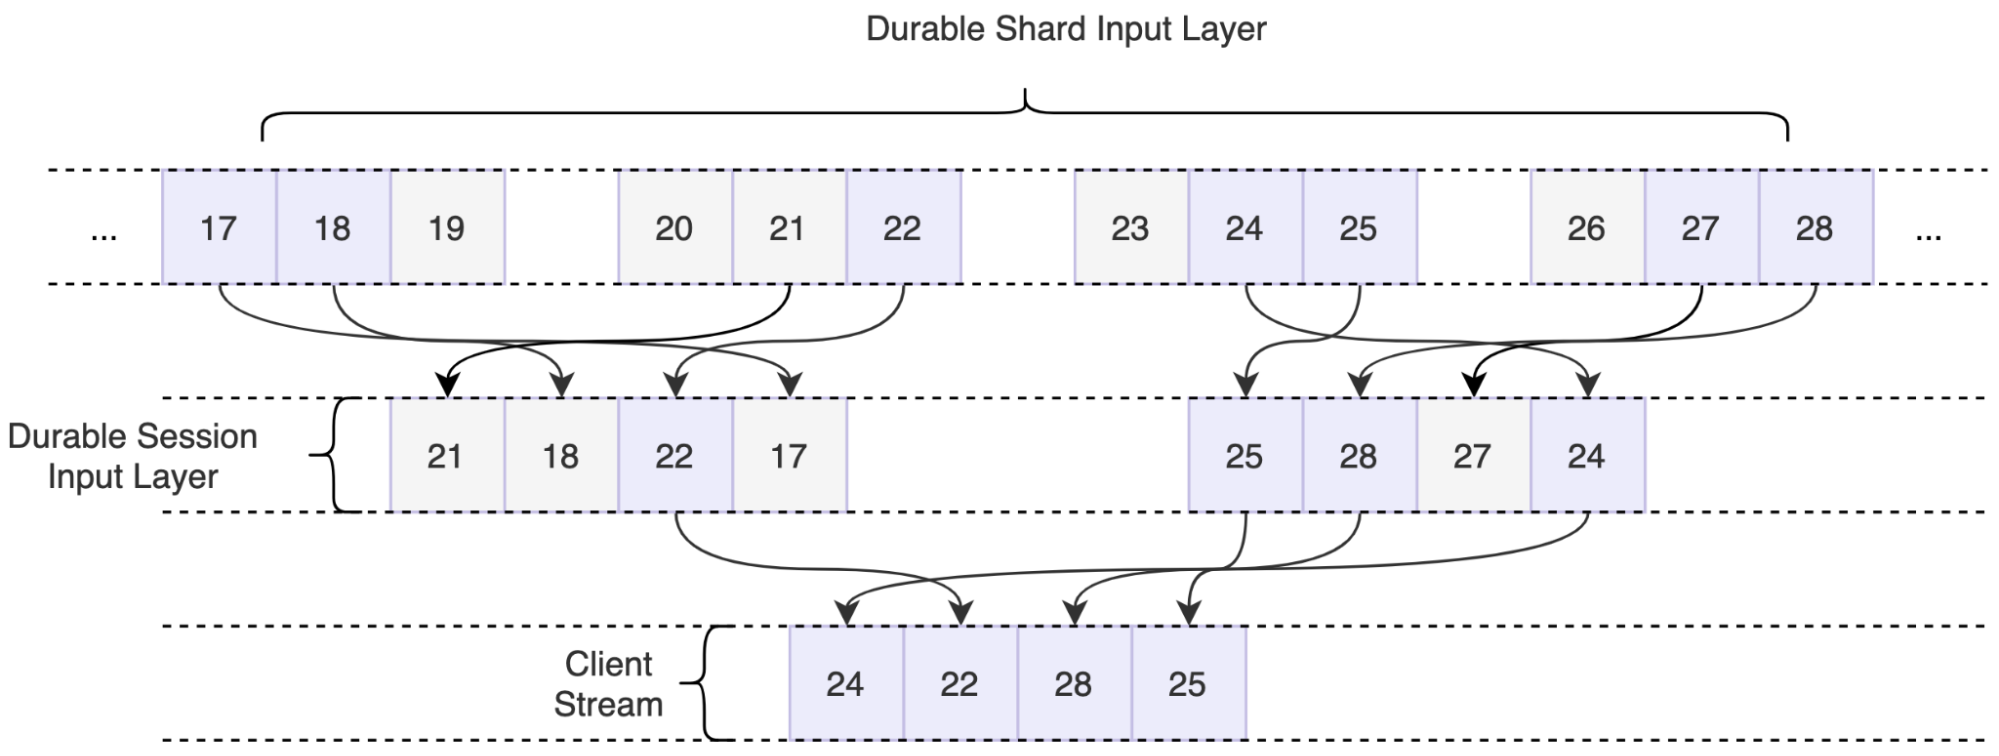
Information about the original traffic shape is preserved by assigning a sample interval to each line, which is equivalent to the number of samples that were dropped for this given sample to make it through, or 1/probability. The actual number of requests can then be calculated by taking the sum of all sample intervals within a time window. This technique adds a slight amount of latency to the pipeline to account for buffering, but enables us to point an event source of nearly any size at the pipeline, and we can expect it will be handled in a sensible, controlled way.
Putting it all together
What we are left with is a pipeline that sensibly handles wildly different volumes of traffic, from single digits to hundreds of thousands of requests a second. It allows the user to pinpoint an exact event in a sea of millions, or calculate summaries over every single one. It delivers insight within seconds, all without ever having to do more than click a button.
Best of all? Workers and Durable Objects handle this workload with aplomb and no tuning, and the available developer tooling allowed me to be productive from my first day writing code targeting the Workers ecosystem.
How to get involved?
We’ll be starting our Beta for Instant Logs in a couple of weeks. Join the waitlist to get notified about when you can get access!
If you want to be part of building the future of data at Cloudflare, we’re hiring engineers for our data team in Lisbon, London, Austin, and San Francisco!
Data at Cloudflare just got a lot faster: Announcing Live-updating Analytics and Instant Logs
Post Syndicated from Jon Levine original https://blog.cloudflare.com/instant-logs/
Today, we’re excited to introduce Live-updating Analytics and Instant Logs. For Pro, Business, and Enterprise customers, our analytics dashboards now update live to show you data as it arrives. In addition to this, Enterprise customers can now view their HTTP request logs instantly in the Cloudflare dashboard.
Cloudflare’s data products are essential for our customers’ visibility into their network and applications. Having this data in real time makes it even more powerful — could you imagine trying to navigate using a GPS that showed your location a minute ago? That’s the power of real time data!
Real time data unlocks entirely new use cases for our customers. They can respond to threats and resolve errors as soon as possible, keeping their applications secure and minimising disruption to their end users.
Lightning fast, in-depth analytics
Cloudflare products generate petabytes of log data daily and are designed for scale. To make sense of all this data, we summarize it using analytics — the ability to see time series data, tops Ns, and slices and dices of the data generated by Cloudflare products. This allows customers to identify trends and anomalies and drill deep into problems.
We take it a step further from just showing you high-level metrics. With Cloudflare Analytics you have the ability to quickly drill down into the most important data — narrow in on a specific time period and add a chain of filters to slice your data further and see all the reflecting analytics.
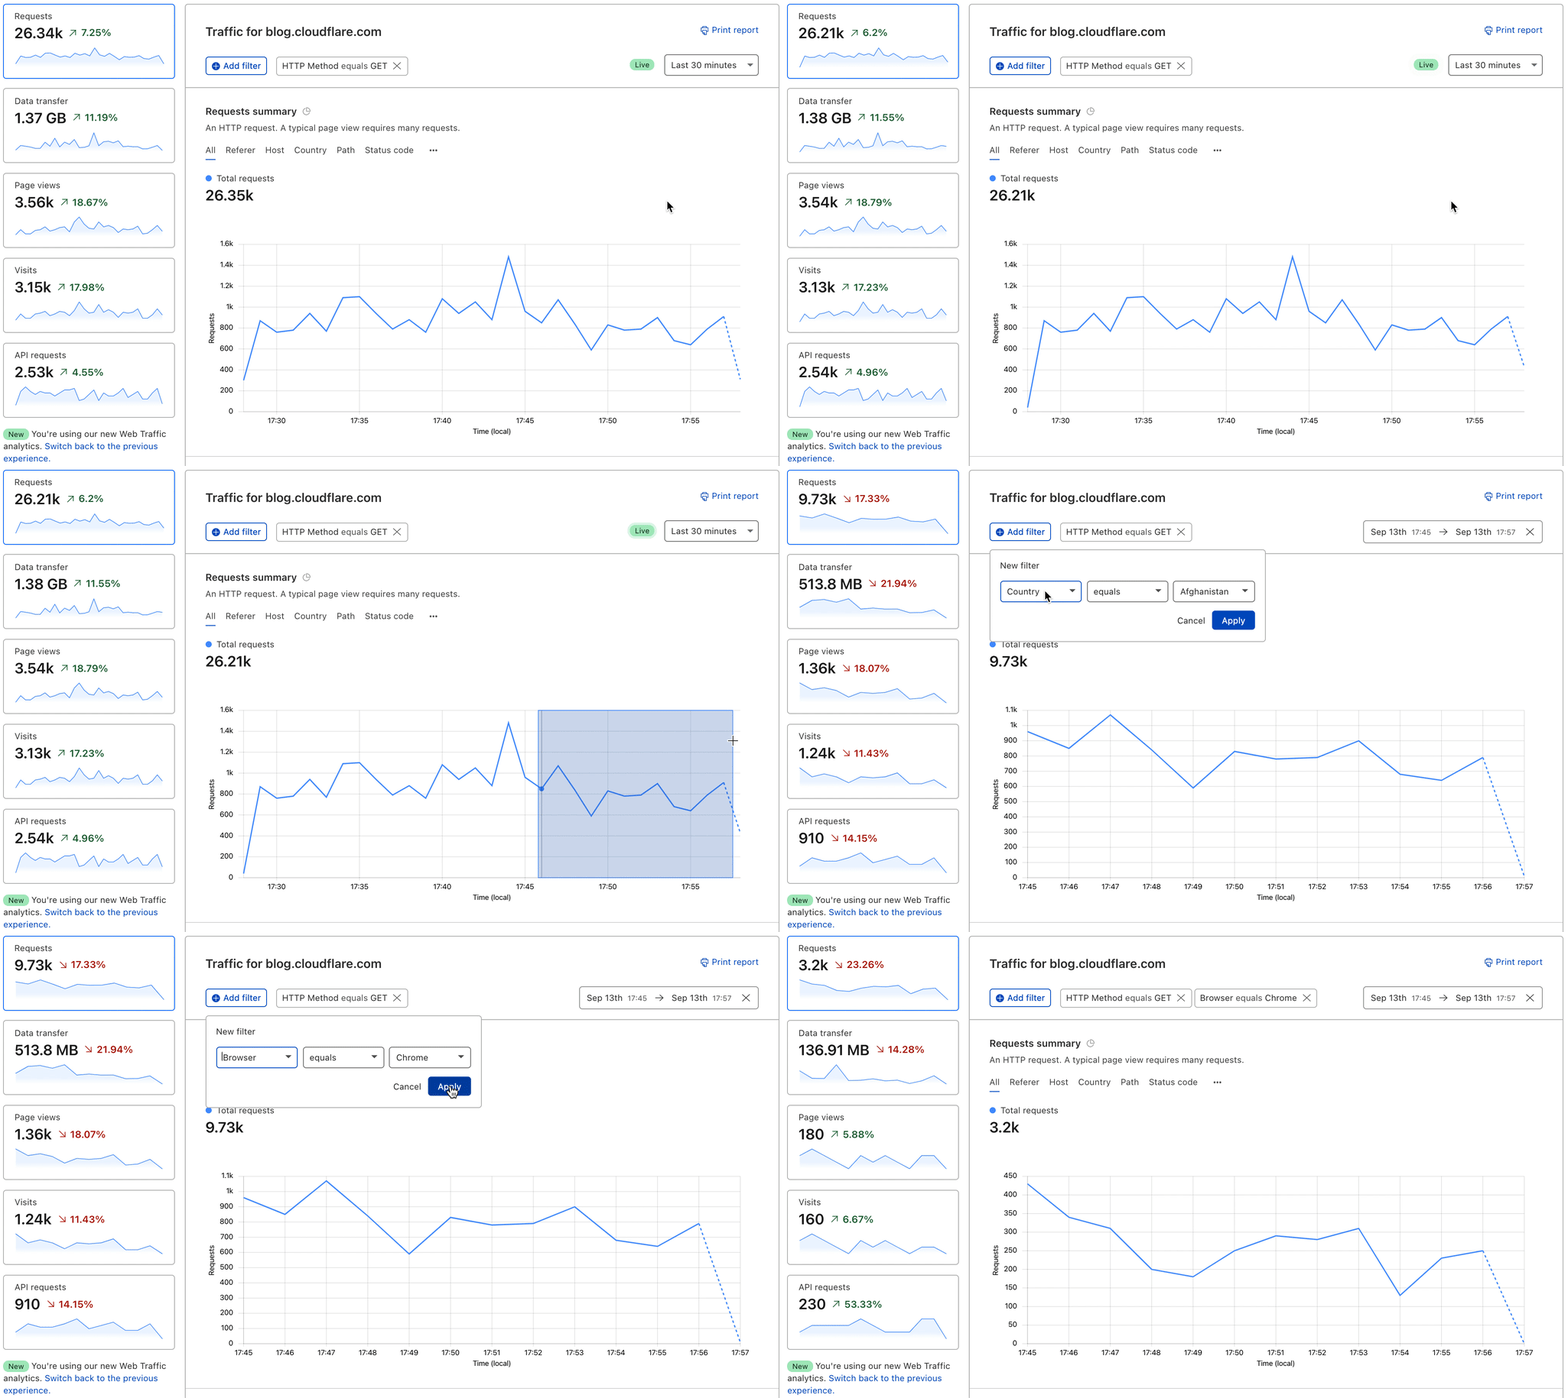
Let’s say you’re a developer who’s made some recent changes to your website, you’ve deleted some old content and created new web pages. You want to know as soon as possible if these changes have led to any broken links, so you can quickly identify them and make fixes. With live-updating analytics, you can monitor your traffic by status code. If you notice an uptick in 404 errors add a filter to get details on all 404s and view the top referrers causing the errors. From there, take steps to resolve the problem whether by creating a redirect page rule or fixing broken links on your own site.
Instant Logs at your fingertips
While Analytics are a great way to see data at an aggregate level, sometimes you need event level information, too. Logs are powerful because they record every single event that flows through a network, so you can figure out what occurred on a granular level.
Our Logpush system is already able to get logs from our global edge network to a customer’s storage destination or analytics provider within seconds. However, setting this up has a lot of overhead and often customers incur long processing times at their destination. We wanted logs to be instant — instant to set up, deliver and take action on.
It’s that easy.
With Instant Logs, customers can actively monitor the traffic that’s flowing through their network and make key decisions that affect their applications now. Real time data unlocks totally new use cases:
- For Security Engineers: Stop an attack as it’s developing. For example, apply a Firewall rule and see it’s impact — get answers within seconds. If it’s not what you were intending, try another rule and check again.
- For Developers: Roll out a config change — to Cloudflare, or to your origin — and have piece of mind to watch as your error rates stay flat (we hope!).
(By the way, if you’re a fan of Workers and want to see real time Workers logging, check out the recently released dashboard for Workers logs.)
Logs at the speed of sight
“Real time” or “instant” can mean different things to different people in different contexts. At Cloudflare, we’re striving to make it as close to the speed of sight as possible. For us, this means we wanted the “glass-to-glass” time — from when you hit “enter” in your browser until when the logs appear — to be under one second.
How did we do?
Today, Cloudflare’s Instant Logs have an average delay of two seconds, and we’re continuing to make improvements to drive that down.
“Real-time” is a very fuzzy term. Looking at other services we see Akamai talking about real-time data as “within minutes” or “latency of 10 minutes”, Amazon talks about “near real-time” for CloudWatch, Google Cloud Logging provides log tailing with a configurable buffer “up to 60 seconds” to deal with potential out-of-order log delivery, and we benchmarked Fastly logs at 25 seconds.
Our goal is to drive down the delay as much as possible (within the laws of physics). We’re happy to have shipped Instant Logs that arrive in two seconds, but we’re not satisfied and will continue to bring that number down.
In time sensitive scenarios such as an attack or an outage, a few minutes or even 30 seconds of delay can have a big impact on customers. At Cloudflare, our goal is to get our customer’s data into their hands as fast as possible — and we’re just getting started.
How to get access?
Live-updating Analytics is available now on all Pro, Business, and Enterprise plans. Select the “Last 30 minutes” view of your traffic in the Analytics tab to start monitoring your analytics live.
We’ll be starting our Beta for Instant Logs in a couple of weeks. Join the waitlist to get notified about when you can get access!
If you’re eager for details on the inner workings of Instant Logs, check out our blog post about how we built Instant Logs.
What’s next
We’re hard at work to make Instant Logs available for all Enterprise customers — stay tuned after joining our waitlist. We’re also planning to bring all of our datasets to Instant Logs, including Firewall Events. In addition, we’re working on the next set of features like the ability to download logs from your session and compute running aggregates from logs.
For a peek into what we have our sights on next, we know how important it is to perform analysis on not only up-to-date data, but also historical data. We want to give customers the ability to analyze logs, draw insights and perform forensics straight from the Cloudflare platform.
If this sounds cool, we’re hiring engineers for our data team in Lisbon, London and San Francisco — would love to have you help us build the future of data at Cloudflare.
Free computer science courseware and hardware for American educators
Post Syndicated from original https://www.raspberrypi.org/blog/free-computer-science-courseware-hardware-for-american-educators/
Today we’re announcing two brand-new, fantastic, free online courses for educators in the USA. And to kickstart their learning journey, we are giving qualified US-based educators the chance to get a free Raspberry Pi Pico microcontroller hardware kit. This is all thanks to our partners at Infosys Foundation USA, who are committed to expanding access to computer science and maker education in public schools across the United States.

You can find both new courses on the Pathfinders Online Institute platform, which supports US classroom educators to bring high-quality computer science and maker education content to their kindergarten through 12th grade students. And best of all, the platform is completely free!
Learn how to teach the essentials of programming
The first course we’ve created for you is called Programming essentials in Scratch. It supports teachers to introduce the essentials of programming to fourth to eighth grade students. The course covers the key concepts of programming, such as variables, selection, and iteration. In addition to learning how to teach programming effectively, teachers will also discover how to inspire their students and help them create music, interactive quizzes, dance animations, and more.

Discover how to teach physical computing
Our second new course for you is called Design, build, and code a rover with Raspberry Pi Pico. It gives teachers of fourth to eighth grade students everything they need to start teaching physical computing in their classroom. Teachers will develop their students’ knowledge of the subject by using basic circuits, coding a Raspberry Pi Pico microcontroller to work with motors and LEDs, and designing algorithms to navigate a rover through a maze. By the end of the course, teachers will have all the resources they need to inspire students and help them explore practical programming, system design, and prototyping.

Get one of 1,000 free hardware kits
And thanks to the generous support of Infosys Foundation USA, we’re able to provide qualified educators with a FREE kit of materials to participate in the Design, build, and code a rover with Raspberry Pi Pico course. We’re especially excited about this because the kit includes our first-ever microcontroller, Raspberry Pi Pico. This offer is available to 1,000 US-based K–12 public or charter school teachers on a first-come, first-served basis.
To claim your kit, just create a free account on Pathfinders Online Institute and start the course. On the first page of the course, you’ll receive instructions on how to apply for a free kit.

If you’re not a qualified educator, or if you’ve missed out on the opportunity to get the free hardware, we still welcome you to join the course! You can find the materials yourself, or purchase the kit from our partners at PiShop.us.
Thank you to Infosys Foundation USA
All of us at the Raspberry Pi Foundation want to thank the Infosys Foundation USA team for collaborating with us on this new resource and learning opportunity for educators. We appreciate and share their commitment to support computer science and maker education.
The post Free computer science courseware and hardware for American educators appeared first on Raspberry Pi.
Разследване на Валя Ахчиева: “Правителството” на Темида – разобличено, но законът – игнориран
Post Syndicated from Николай Марченко original https://bivol.bg/%D0%BF%D1%80%D0%B0%D0%B2%D0%B8%D1%82%D0%B5%D0%BB%D1%81%D1%82%D0%B2%D0%BE%D1%82%D0%BE-%D0%BD%D0%B0-%D1%82%D0%B5%D0%BC%D0%B8%D0%B4%D0%B0-%D1%80%D0%B0%D0%B7%D0%BE%D0%B1%D0%BB%D0%B8%D1%87%D0%B5.html
вторник 14 септември 2021

Тези дни гръмна новината, която дойде от наше журналистическо разследване*. Но този път – доказана от проверка на компетентния орган Министерството на правосъдието. Председателят на най-големия съд в България –…
Maintaining Zabbix API token via JavaScript
Post Syndicated from Aigars Kadiķis original https://blog.zabbix.com/maintaining-zabbix-api-token-via-javascript/15561/
In this blog post, we will talk about maintaining and storing the Zabbix API session key in an automated fashion. The blog post builds upon the Close problem automatically via Zabbix API subject and can be used as extra configuration for this particular use-case. The blog post also shares a great example of synthetic monitoring by way of JavaScript preprocessing – how to emulate a scenario in an automated fashion and get alerted in case of any problems.
Prerequisites
First, let us create the Zabbix API user and user macros where we will store our username, password, Zabbix URL and the API session key.
1) Open “Administration” => “Users”. Create a new user ‘api’ with password ‘zabbix’. At the permissions tab set User Type “Zabbix Super Admin”.
2) Go to “Administration” => “General” => “Macros”. Configure base characteristics:
      {$Z_API_PHP} = http://demo.zabbix.demo/api_jsonrpc.php
     {$Z_API_USER} = api
 {$Z_API_PASSWORD} = zabbix
{$Z_API_SESSIONID} =

It’s OK to leave {$Z_API_SESSIONID} empty for now.
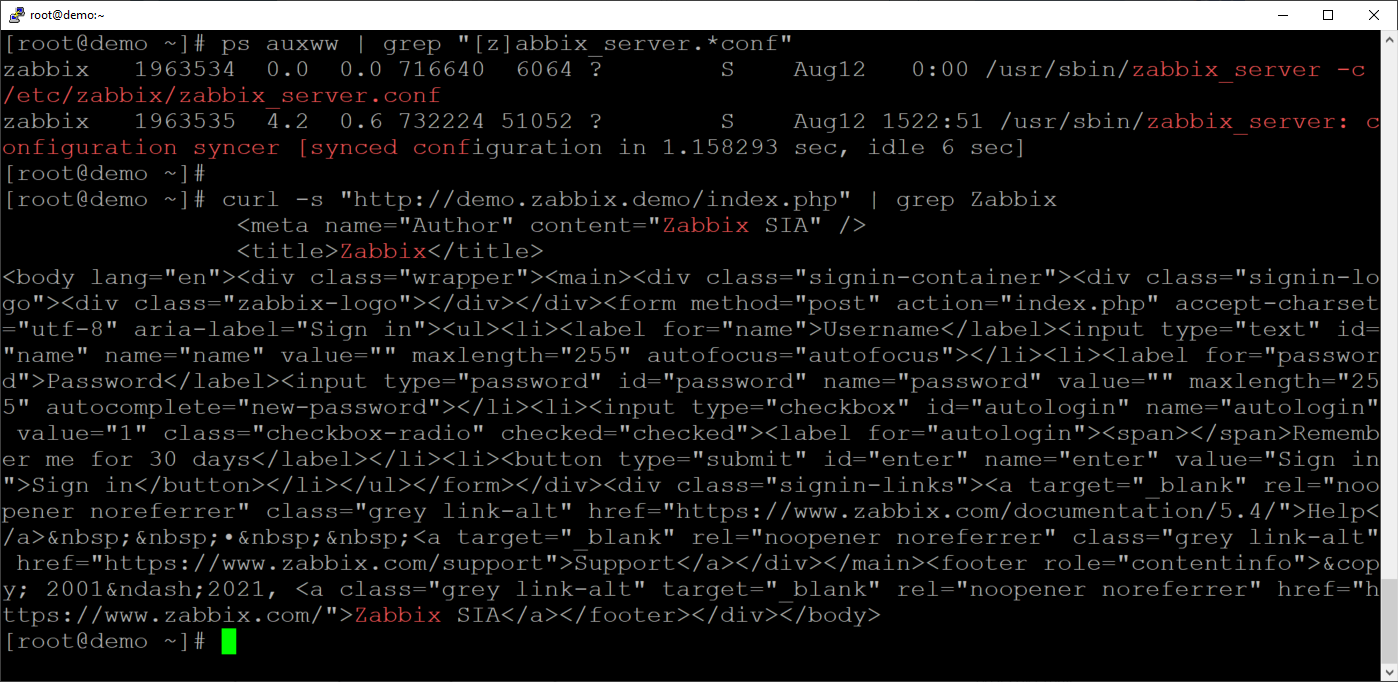
3) Let’s check if the Zabbix backend server can reach the Zabbix frontend server. Make sure that you are logged into the Zabbix backend server by looking up the zabbix_server process:
ps auxww | grep "[z]abbix_server.*conf"
Ensure that we can reach the Zabbix frontend by curling the Zabbix frontend server from the Zabbix backend server:
curl -s "http://demo.zabbix.demo/index.php" | grep Zabbix
4) Download template “Check and repair Zabbix API token” and import it in your instance.
5) Create a new host with an Agent interface and link the template. The IP address of the host does not matter. The template will use an agentless check to do the monitoring, it will use an “HTTP agent” item.
How it works
Our goal for today is to figure out a way to keep the Zabbix API authentication token up to date in a user macro. This way we can reuse the macro repeatedly for items, action operations and scripts that require for us to use the Zabbix API. We need to ensure that even if the token changes, the macro gets automatically updated with the new token value! Let’s try and understand each step of the underlying workflow required for us to achieve this goal.
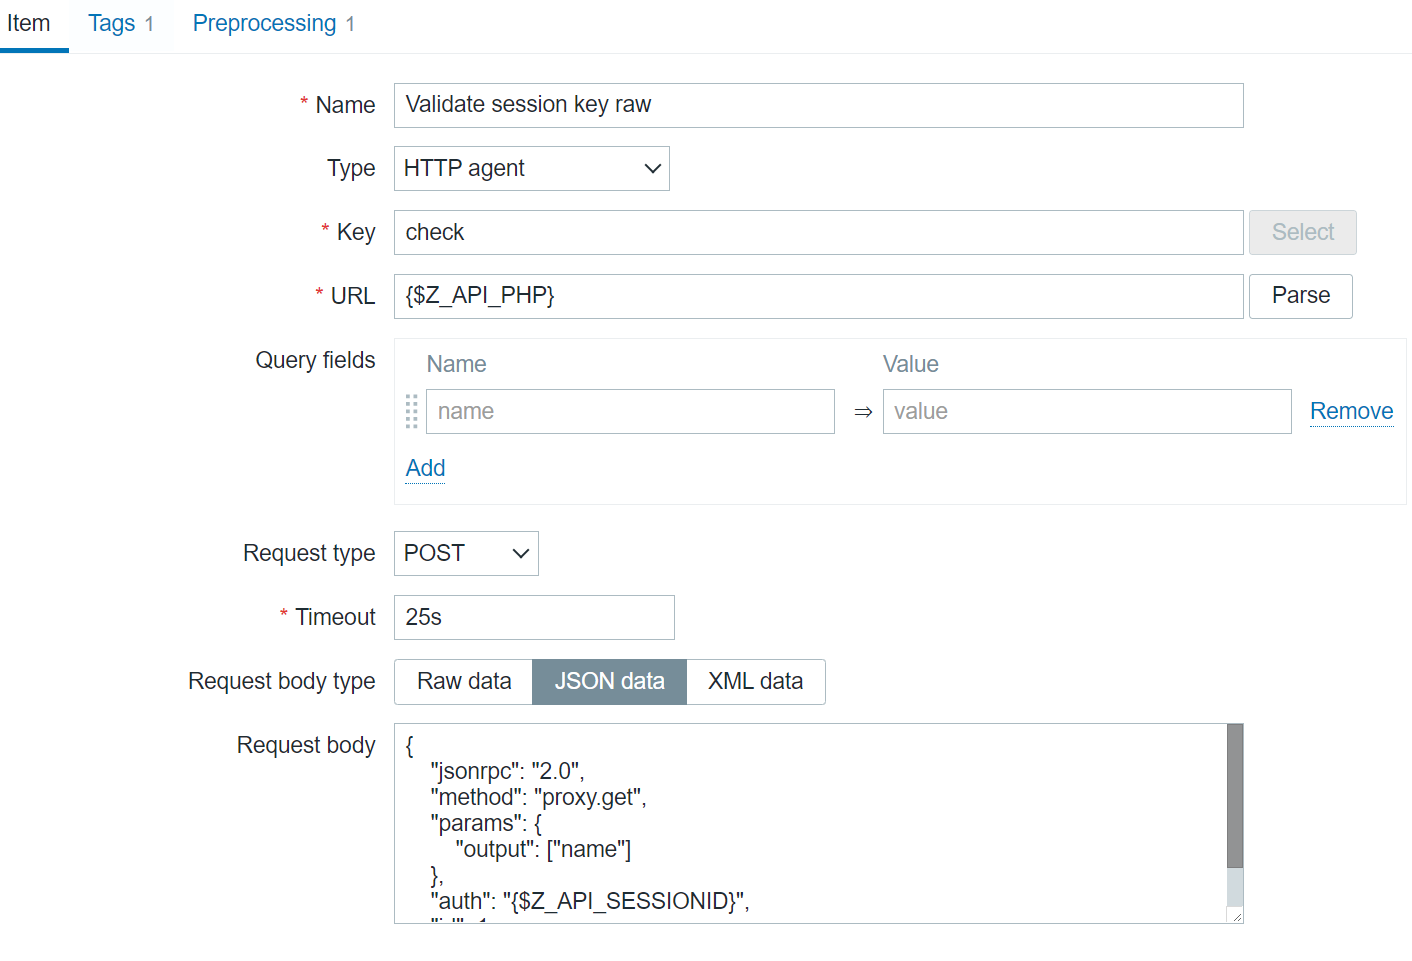
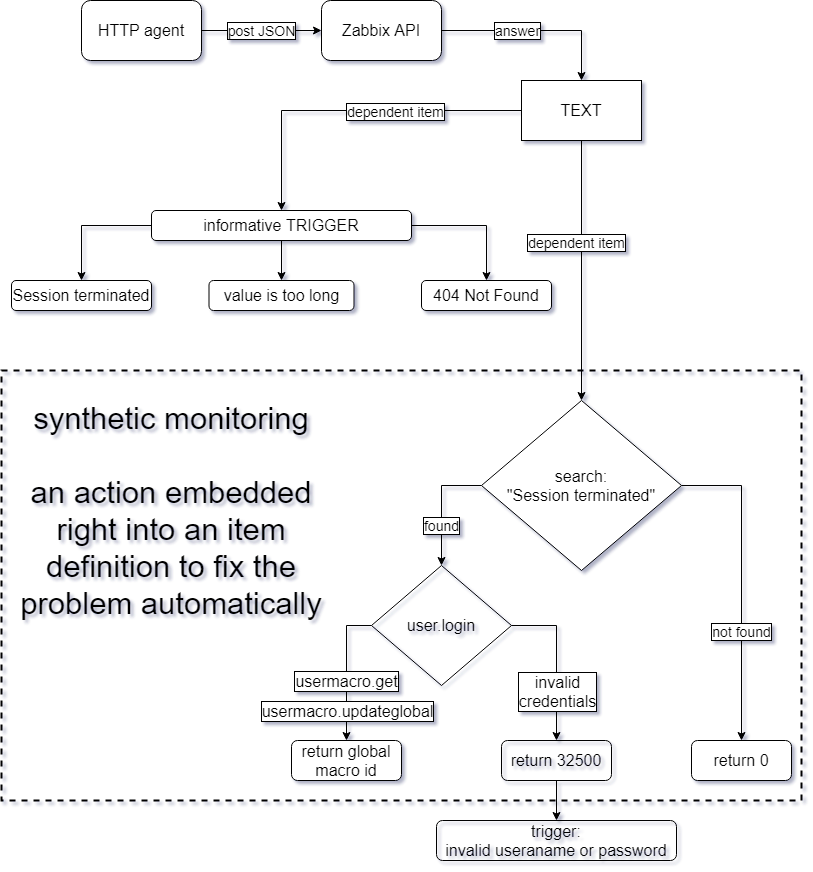
The first component of our workflow is the “Validate session key raw” item. This is an HTTP agent item that performs a POST request with an arbitrary method – proxy.get in this case, but we could have used ANY other method. We simply want to check if an arbitrary Zabbix API call can be executed with the current {$Z_API_SESSIONID} macro value.
The second part of the workflow is the “Repair session key” dependent item. This item utilizes the JavaScript preprocessing step with custom JavaScript code to check the values obtained by the previous item and generate a new authentication token if that is necessary.
The third item – “Status”, is another dependent item that uses regular expression preprocessing steps to check for different error messages or status codes in the value of the “Validate session key raw” item. Most of the triggers defined in this template will react to the values obtained by this item.

Below you can see the full underlying workflow:
Code-wise, the magic is implemented with the following JavaScript code snippet:
if (value.match(/Session terminated/)) {

var req = new CurlHttpRequest();

// Zabbix API
var json_rpc='{$Z_API_PHP}'

// lib curl header
req.AddHeader('Content-Type: application/json');

// First request to get authentication token
var token =  JSON.parse(req.Post(json_rpc,
'{"jsonrpc":"2.0","method":"user.login","params":{"user":"{$Z_API_USER}","password":"{$Z_API_PASSWORD}"},"id":1,"auth":null}'
));

// If authentication was unsuccessful
if ( token.error )
{
// Login name or password is incorrect
return 32500;
}

else {
// Update the macro

// Get the global macro ID
// We cannot plot here a very native Zabbix macro because it will be automatically expanded
// Must use a workaround to distinguish a dollar sign from the actual macro name and merge with '+'
var id = JSON.parse(req.Post(json_rpc,
'{"jsonrpc":"2.0","method":"usermacro.get","params":{"output":["globalmacroid"],"globalmacro":true,"filter":{"macro":"{$'+'Z_API_SESSIONID'+'}"}},"auth":"'+token.result+'","id":1}'
)).result[0].globalmacroid;

// This line contains a keyword '+value+' which will grab exactly the previous value outside this JavaScript snippet
var overwrite = JSON.parse(req.Post(json_rpc,
'{"jsonrpc":"2.0","method":"usermacro.updateglobal","params":{"globalmacroid":"'+id+'","value":"'+token.result+'"},"auth":"'+token.result+'","id":1}'
));

// Return the id (an integer) of the macro, which was updated
return overwrite.result.globalmacroids[0];
}

} else {
return 0;
}
Throughout the JavaScript code, we are extracting a value from one step and using that as an input for the next step.
After the data has been collected, the values are analyzed by 4 triggers. 3 out of these 4 triggers prints a misconfiguration problem that requires a human investigation. We also have a “repairing Zabbix API session key in background” title, which is the main trigger that indicates a token has been expired and repair automatically.
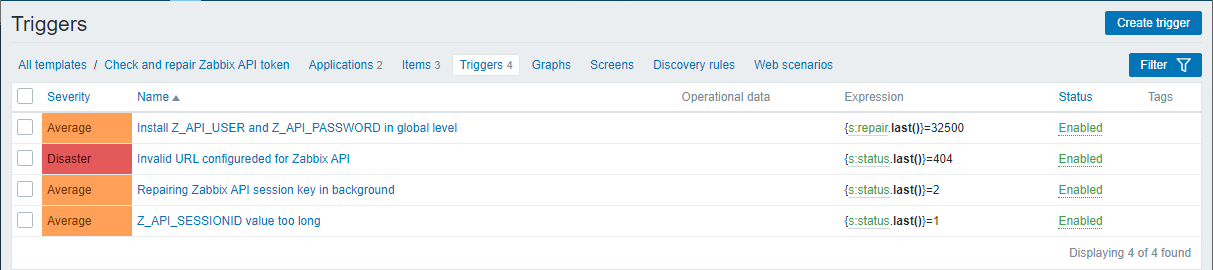
And that’s it – now any integration that requires a Zabbix API authentication token can receive the current token value by referencing the user macro that we created in the article. We’ve ensured that the token is always going to stay up to date and in case of any issues, we will receive an alert from Zabbix!
Comic for 2021.09.14
Post Syndicated from Explosm.net original http://explosm.net/comics/5976/
New Cyanide and Happiness Comic
Analyze daily trading activity using transaction data from Amazon Redshift in Amazon FinSpace
Post Syndicated from Mariia Berezina original https://aws.amazon.com/blogs/big-data/analyze-daily-trading-activity-using-transaction-data-from-amazon-redshift-in-amazon-finspace/
Financial services organizations use data from various sources to discover new insights and improve trading decisions. Finding the right dataset and getting access to the data can frequently be a time-consuming process. For example, to analyze daily trading activity, analysts need to find a list of available databases and tables, identify its owner’s contact information, get access, understand the table schema, and load the data. They repeat this process for every additional dataset needed for the analysis.
Amazon FinSpace makes it easy for analysts and quants to discover, analyze, and share data, reducing the time it takes to find and access financial data from months to minutes. To get started, FinSpace admins create a category and an attribute set to capture relevant external reference information such as database type and table name. After connecting to data source or uploading it directly through the FinSpace user interface (UI), you can create datasets in FinSpace that include schema and other relevant information. Analysts can then search the catalog for necessary datasets and connect to them using the FinSpace web interface or through the FinSpace JupyterLab notebook.
Amazon Redshift is a popular choice for storing and querying exabytes of structured and semi-structured data such as trade transactions. In this post, we explore how to connect to an Amazon Redshift data warehouse from FinSpace through a Spark SQL JDBC connection and populate the FinSpace catalog with metadata such as schema details, dataset owner, and description. We then show how simple it is to use the FinSpace catalog to discover available data and to connect to an Amazon Redshift cluster from a Jupyter notebook in FinSpace to read daily trades for Amazon (AMZN) stock. Finally, we will evaluate how well-executed were our stock purchases. We will do it by comparing our transactions stored in Amazon Redshift to trading history for the stock stored in FinSpace.
Solution overview
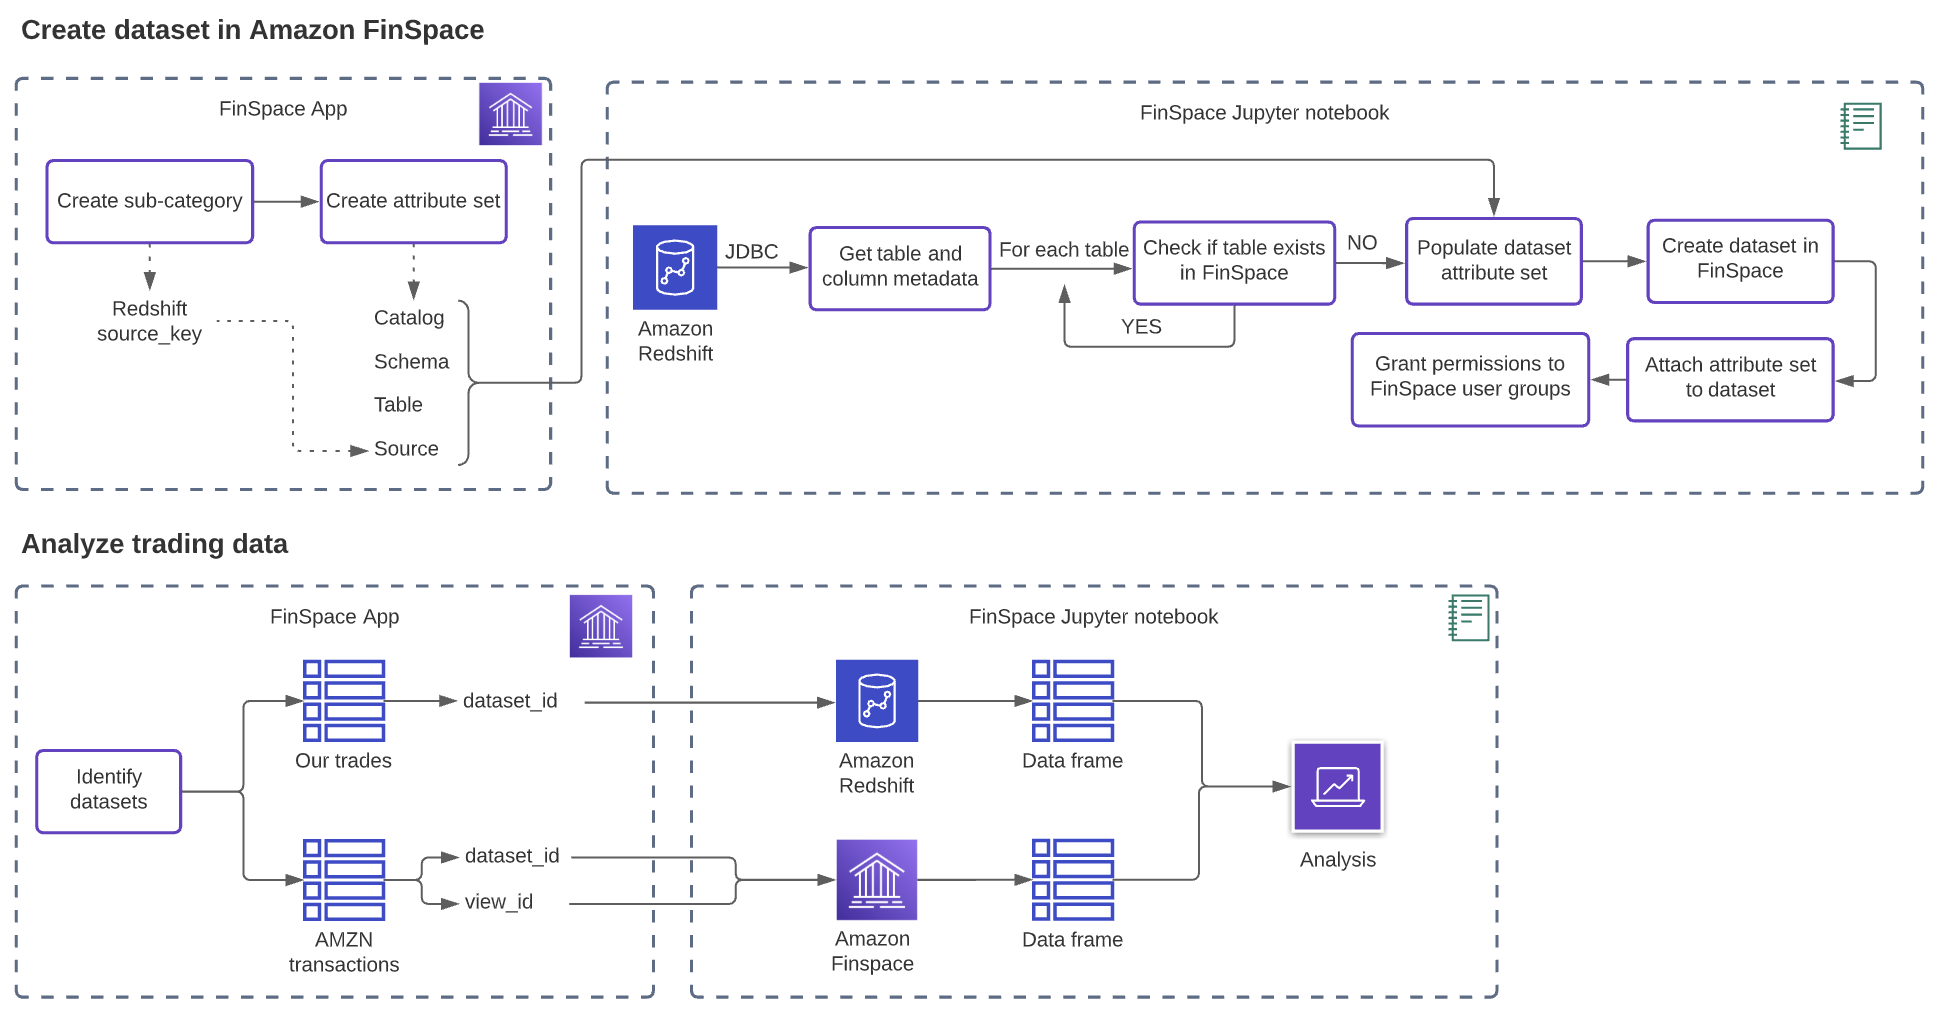
The blog post covers the following steps:
- Configure your FinSpace catalog to describe your Amazon Redshift tables.
- Use FinSpace notebooks to connect to Amazon Redshift.
- Populate the FinSpace catalog with tables from Amazon Redshift. Add description, owner, and attributes to each dataset to help with data discovery and access control.
- Search the FinSpace catalog for data.
- Use FinSpace notebooks to analyze data from both FinSpace and Amazon Redshift to evaluate trade performance based on the daily price for AMZN stock.
The diagram below provides the complete solution overview.
Prerequisites
Before you get started, make sure you have the following prerequisites:
- Download Jupyter notebooks covering Amazon Redshift dataset import and analysis. Import them into FinSpace by cloning the GitHub repo or by dropping them into FinSpace. The code provided in this blog post should be run from the FinSpace notebooks.
- Setup a FinSpace environment. For instructions on creating a new environment, see Create an Amazon FinSpace Environment.
- Install Capital Markets sample data bundle, as explained in the “Sample Data Bundle” guide.
- Ensure you have permissions to manage categories and controlled vocabularies and manage attribute sets in FinSpace.
- Create an Amazon Redshift cluster in the same AWS account as the FinSpace environment. For instructions, see Create a cluster. Additionally, create a superuser and ensure that the cluster is publicly accessible.
- Create a table in Amazon Redshift and insert trading transaction data using these SQL queries.
Configure your FinSpace catalog to describe your Amazon Redshift tables
FinSpace users can discover relevant datasets by using search or by navigating across categories under the Browse Data menu. Categories allow for cataloging of datasets by commonly used business terms (such as source, data class, type, industry, and so on). An attribute set holds additional metadata for each dataset, including categories and table details to enable you to connect to the data source directly from a FinSpace notebook. Analysts can browse and search attributes to find datasets based on the values assigned to them.
Complete the following steps to create a new subcategory called Redshift under the Source category, and create an attribute set called Redshift Table Attributes. In the following section, we use the subcategory and attribute set to tag datasets from Amazon Redshift. FinSpace users can then browse for the data from the Amazon Redshift source from the Browse Data menu and filter datasets in FinSpace for the tables that are located in the company’s Amazon Redshift data warehouse.
- On the FinSpace console, choose Settings (gear icon).
- Choose Categories.
- Hover over the Source category and choose Edit this Category.

- On the Edit Category page, hover over the Source category again and choose Add Sub-Category.
- Add
Redshiftas a source subcategory andFinancial data from company's Amazon Redshift data warehouseas the description.


Next, create an attribute set called Redshift Table Attributes to capture additional business context for each dataset.
- On the FinSpace console, choose Settings (gear icon).
- Choose Attribute Sets.
- Choose CREATE ATTRIBUTE SET.
- Create a new attribute set called
Redshift Table Attributes.

- Add the following fields:
- Catalog – Data String type
- Schema – Data String type
- Table – Data String type
- Source – Categorization Source type


Use FinSpace notebooks to connect to Amazon Redshift
| The notebooks downloaded as part of the prerequisite provide the integration between FinSpace and Amazon Redshift. The steps below explain the code so you can run and extend as needed. |
- Connect to the Spark cluster by running the following code:
After the connection is established, you see a connected to cluster message. It may take 5–8 minutes for the cluster connection to establish.
- Add the JDBC driver to Spark jars by running the following code:
In this example, we use the latest driver version available (2.0). To download the latest JDBC driver, see Download the Amazon Redshift JDBC driver, version 2.0.
- Run cells 1.3–1.4 in the notebook (collapsed to improved readability) to add FinSpace helper classes found in public GitHub examples and to add utility functions.
Python helper classes help with schema and table creation, cluster management, and more. The utility functions help translate Amazon Redshift data to a FinSpace schema.

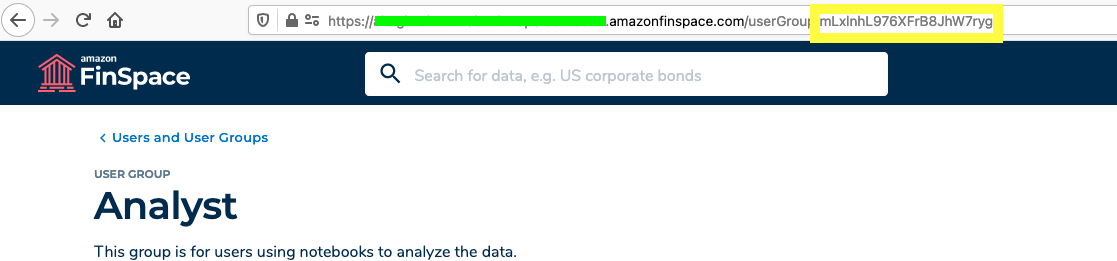
Next, you update the user group ID that should get access to the datasets, and update the Amazon Redshift connection parameters.
- On the FinSpace console, choose Settings (gear icon).
- Chose Users and User Groups.
- Select a group and copy the group ID from the URL.

- On the Amazon Redshift console, open your cluster.
- Note the cluster endpoint information from the General information section.
- Note your database name, port, and admin user name in the Database configurations section.
If you don’t know your user name or password, contact your Amazon Redshift administrator.

Populate the FinSpace catalog with tables from Amazon Redshift
Now we’re ready to import table metadata from Amazon Redshift into FinSpace. For each table, we create a FinSpace dataset, populate the attribute set we created with the metadata about the table (catalog, schema, table names, and Redshift subcategory for the Source category), and associate the populated attribute set to the created dataset.
- Use
spark.readto retrieve a list of tables and columns as a Spark DataFrame:
As a result, you get two DataFrames, tablesDF and schemaDF, containing a list of tables and associated metadata (database, schema, table names, and comments) as shown in the following screenshot.

- Get the attribute set
Redshift Table Attributesthat we created earlier by runningfinspace.attribute_set(att_name). We use its identifiers for populating the metadata for each dataset we create in FinSpace.
- Get an ID for the
Redshiftsubcategory to populate the attribute set and identify the datasets with the Amazon Redshift source:
As an output, you get the source_key ID for the Redshift subcategory.

- Use
list_dataset_metadata_by_taxonomy_node(taxonomyId, source_key)to get the list of existing datasets in FinSpace to avoid duplicating the data if an Amazon Redshift table already exists in FinSpace:
If you already have tables tagged with Redshift as a source, your output looks similar to the following screenshot.

- Set permissions and owner details by updating the following code with your desired values:
- Create a DataFrame with a list of tables in Amazon Redshift to iterate over:
- Run the following code to:
- Check if a table already exists in FinSpace;
- If it doesn’t exist, get table’s schema and create an attribute set;
- Add the description and the attribute set to the dataset (Catalog, Schema, Table names, and Source).
Search the FinSpace catalog for data
Analysts can search for datasets available to them in FinSpace and refine the results using category filters. To analyze our trading activity in the next section, we need to find two datasets: all trades of AMZN stock, and the buy and sell orders from the Amazon Redshift database.
- Search for “AMZN” or “US Equity TAQ Sample” to find the “US Equity TAQ Sample – 14 Symbols 6 Months – Sample” dataset provided as part of the Capital Markets Sample Data Bundle.
You can explore the dataset schema and review the attribute set.

- Copy the dataset ID and data view ID on the Data View Details page.
We use these IDs in the next section to connect to the data view in FinSpace and analyze our trading activity.
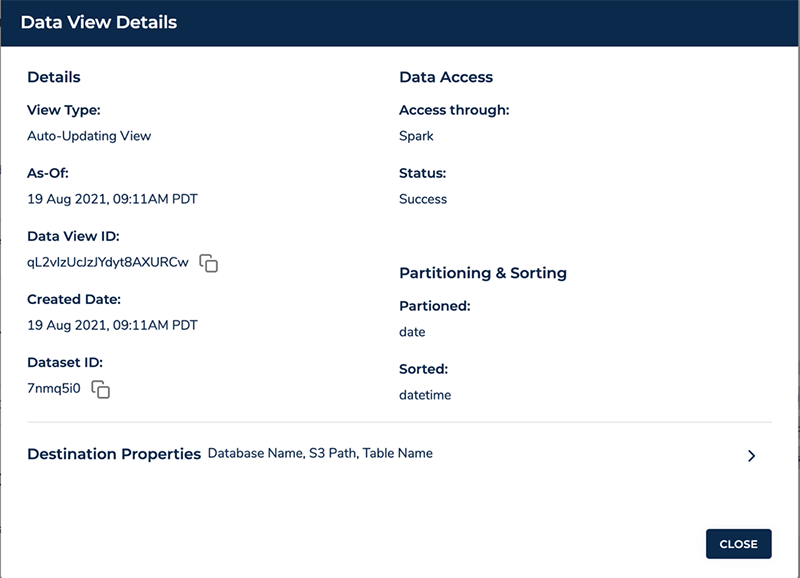
Next, we find the trade_history dataset that we created from the Amazon Redshift table and copy its dataset ID.
- On the FinSpace console, choose Source under BROWSE DATA and choose Redshift.
- Open the
trade_historytable. - Copy the dataset ID located in the URL.

Users with permissions to create datasets can also update the dataset with additional information, including a description and owner contact information if those details have changed since the dataset was created in FinSpace.
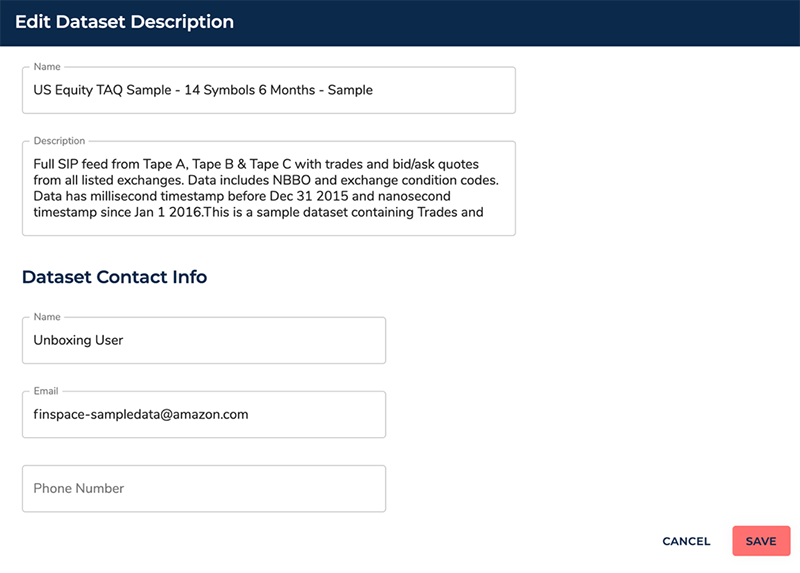
Use FinSpace notebooks to analyze data from both FinSpace and Amazon Redshift
We’re now ready to analyze the data.
- Import the analysis notebook to JupyterLab in FinSpace.
- Follow the steps covered in the previous section, Connect to Amazon Redshift from a FinSpace Jupyter notebook using JDBC, to connect to the FinSpace cluster and add a JDBC driver to Spark jars. Add helper and utility functions.
- Set up your database connection and date parameters. In this scenario, we analyze trading activity for January 2, 2021.
- Connect to Amazon Redshift and query the table directly. Import the data as a Spark DataFrame.
As a result, you get the data stored in the Amazon Redshift database as a Spark DataFrame.
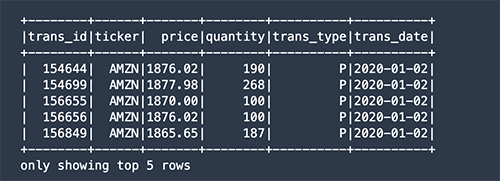
- Filter for stock purchase transactions (labeled as P) and calculate an average price paid:
- Get trading data from the FinSpace Capital Markets dataset:
- Apply date, ticker, and trade type filters:
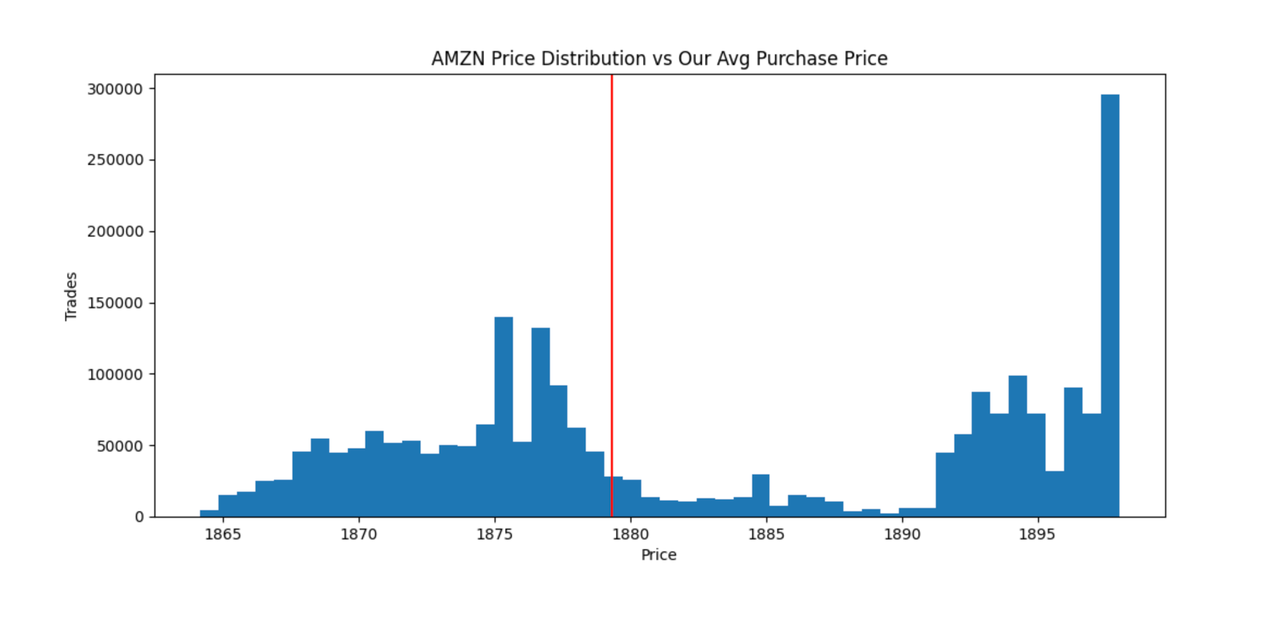
- Compare the average purchase price to the daily trading price and plot them to compare how close we got to the lowest price.
As a result, you get a distribution of AMZN stock prices traded on January 2, 2021, which we got from a dataset in FinSpace. The red line in the following graph is the average price we paid for the stock calculated from the transaction data stored in Amazon Redshift. Although we didn’t pay the highest price traded that day, we performed average, paying $1,877 per share versus the lowest price of $1,865.
Clean up
If your work with FinSpace or Amazon Redshift is complete, delete the Amazon Redshift cluster or the FinSpace environment to avoid incurring additional fees.
Conclusion
In this post, we reviewed how to connect the Amazon Redshift database and FinSpace in order to create new datasets in FinSpace using the table metadata from Amazon Redshift. We then explored how to look for available data in the FinSpace web app to find two datasets that can help us evaluate how close we got to the best daily price. Finally, we used FinSpace dataset details to import the data into two DataFrames and plot price distribution versus the average price we paid. As a result, we reduced the time it takes to discover and connect to datasets needed for analyzing trading transactions.
Download the import and analysis Jupyter notebooks discussed in this blog post on GitHub.
Visit the FinSpace user guide to learn more about the service, or contact us to discuss FinSpace or Amazon Redshift in more detail.
About the Authors
 Mariia Berezina is a Sr. Launch Manager at AWS. She is passionate about building new products to help customers get the most out of data. When not working, she enjoys mentoring women in technology, diving, and traveling the world.
 Vincent Saulys is a Principal Solutions Architect at AWS working on FinSpace. Vincent has over 25 years of experience solving some of the world’s most difficult technical problems in the financial services industry. He is a launcher and leader of many mission-critical breakthroughs in data science and technology on behalf of Goldman Sachs, FINRA, and AWS.
Speed at scale: Let’s Encrypt serving Shopify’s 4.5 million domains
Post Syndicated from Let's Encrypt original https://letsencrypt.org/2021/09/14/speed-at-scale-shopify.html
What does it take to manage TLS certificates at a leading e-commerce company? Before Let’s Encrypt, it took the security team at Shopify weeks to manually obtain certificates for their websites. Doing this once is unpleasant enough, but if an incident were to happen that necessitated renewing all of their certificates, Shopify estimated it would take them 100+ days without automated issuance and management.
Today, Let’s Encrypt provides TLS for 4.5 million Shopify domains. We sat down with Charles Barbier, Development Manager at Shopify, to hear why Let’s Encrypt is their choice for reliable, free, and automated TLS at scale.
“In 2016, the TLS team started transitioning all of our merchants’ stores to HTTPS through Let’s Encrypt,” Charles said. “And when we started exploring the concept a few years earlier, it was a daunting task.” Implementing TLS for 680,000+ domains wasn’t just daunting, Charles and the team needed automated management, something that simply didn’t exist. “We didn’t want to have TLS be the merchant’s responsibility,” Charles said.
Back in 2016, although Let’s Encrypt had been making noise, it wasn’t Shopify’s first choice for a CA. “We ended up going with a different option that turned out to be problematic because the API was so slow,” Charles said. “We did some napkin math and realized it was going to take us around 100 days to provision all of our certs for our merchants. If this solution had been just for regular issuance, it would have been fine, but an emergency would be very problematic.”
That realization led Charles and the team to give Let’s Encrypt a try, making them one of the first single Let’s Encrypt subscribers to request and provision certs at a X00,000 scale. “We were able to roll out all of our domains in a couple of hours,” Charles said. “And to be frank, I think it was our ordering process that caused issuance to take even that long. It was very encouraging.”
The speed of Let’s Encrypt helped Shopify realize their goal of provisioning certs for all of their domains and automating management. Since Let’s Encrypt uses the IETF-standardized ACME protocol, Shopify felt confident that if they needed to, they could roll over to a different ACME CA. “We knew in the future, if things went well with the ACME standard, we’d be able to add a different ACME provider with the exact same implementation,” Charles said.
Of course, “things going well” doesn’t just mean technically. It means ensuring the nonprofit behind Let’s Encrypt is sound as well—which is why Shopify has financially supported Let’s Encrypt since they began using it in 2016. This year, they increased their support. “For us, using Let’s Encrypt has been a great experience,” Charles said.
Today, Let’s Encrypt certificates cover 4.5 million domains for Shopify. That means a more secure and privacy-respecting Web for all of Shopify’s merchants who, in 2020, created $307 billion in economic impact around the world. And it means a more secure Web for everyone visiting and engaging with a Shopify merchant.
We’re proud to serve Shopify with a reliable, speedy, and free service, and grateful for their longtime support of our work by being a sponsor. Together, we’re helping bolster a Web that’s free, open and more secure for everyone, everywhere.
We depend on contributions from our community of users and supporters in order to provide our services. If your company or organization would like to sponsor Let’s Encrypt please email us at [email protected]. We ask that you make an individual contribution if it is within your means.
New – Amazon EC2 VT1 Instances for Live Multi-stream Video Transcoding
Post Syndicated from Channy Yun original https://aws.amazon.com/blogs/aws/new-amazon-ec2-vt1-instances-for-live-multi-stream-video-transcoding/
Global demand for video content has been rapidly increasing and now has the major audiences of Internet and mobile network traffic. Over-the-top streaming services such as Twitch continue to see an explosion of content creators who are seeking live delivery with great image quality, while live event broadcasters are increasingly looking to embrace agile cloud infrastructure to reduce costs without sacrificing reliability, and efficiently scale with demand.
Today, I am happy to announce the general availability of Amazon EC2 VT1 instances that are designed to provide the best price performance for multi-stream video transcoding with resolutions up to 4K UHD. These VT1 instances feature Xilinx® Alveo U30 media accelerator transcoding cards with accelerated H.264/AVC and H.265/HEVC codecs and provide up to 30% better price per stream compared to the latest GPU-based EC2 instances and up to 60% better price per stream compared to the latest CPU-based EC2 instances.
Customers with their own live broadcast and streaming video pipelines can use VT1 instances to transcode video streams with resolutions up to 4K UHD. VT1 instances feature networking interfaces of up to 25 Gbps that can ingest multiple video streams over IP with low latency and low jitter. This capability makes it possible for these customers to fully embrace scalable, cost-effective, and resilient infrastructure.
Amazon EC2 VT1 Instance Type
EC2 VT1 instances are available in three sizes. The accelerated H.264/AVC and H.265/HEVC codecs are integrated into Xilinx Zynq ZU7EV SoCs. Each Xilinx® Alveo U30 media transcoding accelerator card contains two Zynq SoCs.
| Instance size | vCPUs | Xilinx U30 card | Memory | Network bandwidth | EBS-optimized bandwidth | 1080p60 Streams per instance |
| vt1.3xlarge | 12 | 1 | 24GB | Up to 25 Gbps | Up to 4.75 Gbps | 8 |
| vt1.6xlarge | 24 | 2 | 48GB | 25 Gbps | 4.75 Gbps | 16 |
| vt1.24xlarge | 96 | 8 | 192GB | 25 Gbps | 19 Gbps | 64 |
The VT1 instances are suitable for transcoding multiple streams per instance. The streams can be processed independently in parallel or mixed (picture-in-picture, side-by-side, transitions). The vCPU cores help with implementing image processing, audio processing, and multiplexing. The Xilinx® Alveo U30 card can simultaneously output multiple streams at different resolutions (1080p, 720p, 480p, and 360p) and in both H.264 and H.265.
Each VT1 instance can be configured to produce parallel encoding with different settings, resolutions and transmission bit rate (“ABR ladders“). For example, a 4K UHD stream can be encoded at 60 frames per second with H.265 for high resolution display. Multiple lower resolutions can be encoded with H.264 for delivery to standard displays.
Get Started with EC2 VT1 Instances
You can now launch VT1 instances in the Amazon EC2 console, AWS Command Line Interface (AWS CLI), or using an SDK with the Amazon EC2 API.
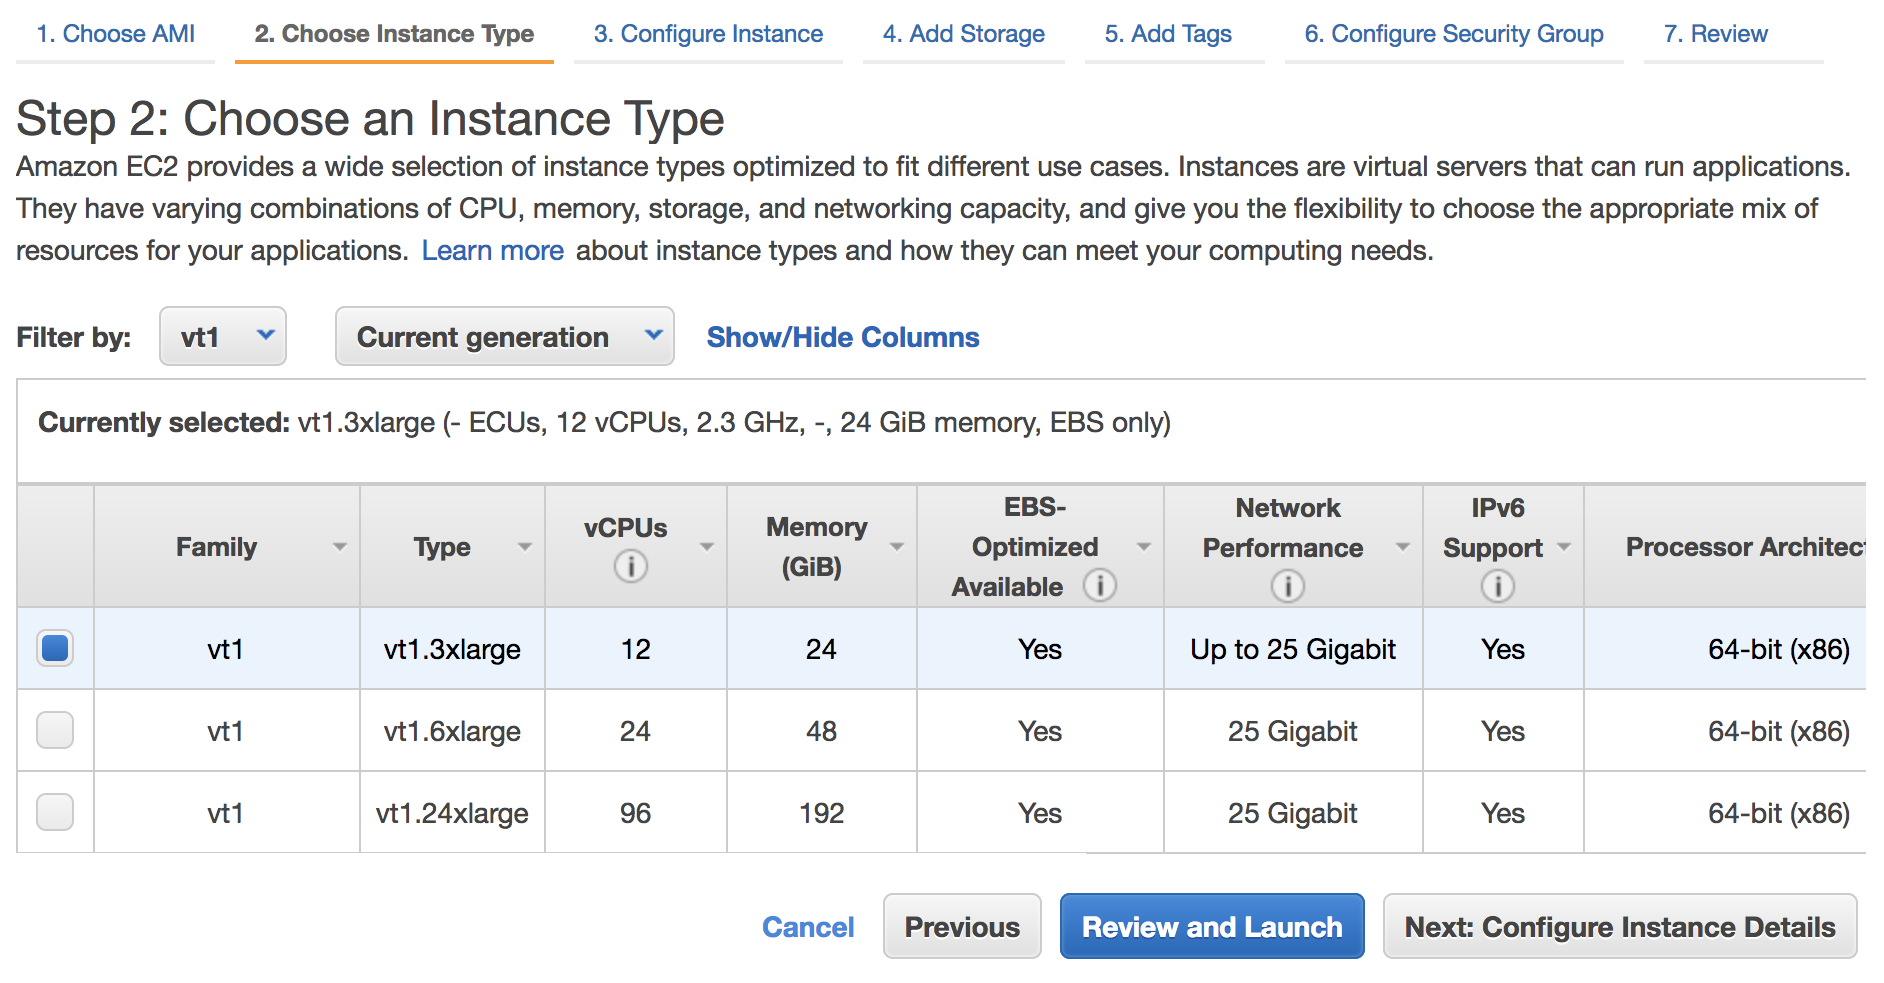
We provide a number of sample video processing pipelines for the VT1 instances. There are tutorials and code examples in the GitHub repository that cover how to tune the codecs for image quality and transcoding latency, call the runtime for the U30 cards directly from your own applications, incorporate video filters such as titling and watermarking, and deploy with container orchestration frameworks.
Xilinx provides the “Xilinx Video Transcoding SDK” which includes:
- Integration with media framework FFMpeg (GStreamer coming later this year)
- Xilinx Media Acceleration API (xma) to interface directly with the encoder, decoder and scaler on Xilinx® Alveo
 U30 card
- Xilinx Runtime API (xrt) to facilitate management and usage of Xilinx Zynq SoC devices
VT1 instances can be coupled with Amazon Elastic Container Service (Amazon ECS) and Amazon Elastic Kubernetes Service (Amazon EKS) to efficiently scale transcoding workloads and with Amazon CloudFront to deliver content globally. VT1 instances can also be launched with Amazon Machine Images (AMIs) and containers developed by AWS Marketplace partners, such as Nginx for supplemental video processing functionality.
You can complement VT1 instances with AWS Media Services for reliable packaging and origination of transcoded content. To learn more, you can use a solution library of Live Streaming on AWS to build a live video workflow using these AWS services.
Available Now
Amazon EC2 VT1 instances are now available in the US East (N. Virginia), US West (Oregon), Europe (Ireland), Asia Pacific (Tokyo) Regions. To learn more, visit the EC2 VT1 instance page. Please send feedback to the AWS forum for Amazon EC2 or through your usual AWS support contacts.
– Channy
Герой от #ДжиПиГейт в инхаус схемата с “Автомагистрали” АД
Post Syndicated from Атанас Чобанов original https://bivol.bg/inhouse-gpgate-kotov.html
понеделник 13 септември 2021

Познатият от разследването #ДжиПиГейт Райчо Котов е собственик на “Автомагистрали Хемус” АД. Това е фирмата, която строи незаконно част от магистралата, получила e 95 милиона аванс, но не е платила…
Protect your remote workforce by using a managed DNS firewall and network firewall
Post Syndicated from Patrick Duffy original https://aws.amazon.com/blogs/security/protect-your-remote-workforce-by-using-a-managed-dns-firewall-and-network-firewall/
More of our customers are adopting flexible work-from-home and remote work strategies that use virtual desktop solutions, such as Amazon WorkSpaces and Amazon AppStream 2.0, to deliver their user applications. Securing these workloads benefits from a layered approach, and this post focuses on protecting your users at the network level. Customers can now apply these security measures by using Route 53 Resolver DNS Firewall and AWS Network Firewall, two managed services that provide layered protection for the customer’s virtual private cloud (VPC). This blog post provides recommendations for how you can build network protection for your remote workforce by using DNS Firewall and Network Firewall.
Overview
DNS Firewall helps you block DNS queries that are made for known malicious domains, while allowing DNS queries to trusted domains. DNS Firewall has a simple deployment model that makes it straightforward for you to start protecting your VPCs by using managed domain lists, as well as custom domain lists. With DNS Firewall, you can filter and regulate outbound DNS requests. The service inspects DNS requests that are handled by Route 53 Resolver and applies actions that you define to allow or block requests.
DNS Firewall consists of domain lists and rule groups. Domain lists include custom domain lists that you create and AWS managed domain lists. Rule groups are associated with VPCs and control the response for domain lists that you choose. You can configure rule groups at scale by using AWS Firewall Manager. Rule groups process in priority order and stop processing after a rule is matched.
Network Firewall helps customers protect their VPCs by protecting the workload at the network layer. Network Firewall is an automatically scaling, highly available service that simplifies deployment and management for network administrators. With Network Firewall, you can perform inspection for inbound traffic, outbound traffic, traffic between VPCs, and traffic between VPCs and AWS Direct Connect or AWS VPN traffic. You can deploy stateless rules to allow or deny traffic based on the protocol, source and destination ports, and source and destination IP addresses. Additionally, you can deploy stateful rules that allow or block traffic based on domain lists, standard rule groups, or Suricata compatible intrusion prevention system (IPS) rules.
To configure Network Firewall, you need to create Network Firewall rule groups, a Network Firewall policy, and finally, a network firewall. Rule groups consist of stateless and stateful rule groups. For both types of rule groups, you need to estimate the capacity when you create the rule group. See the Network Firewall Developer Guide to learn how to estimate the capacity that is needed for the stateless and stateful rule engines.
This post shows you how to configure DNS Firewall and Network Firewall to protect your workload. You will learn how to create rules that prevent DNS queries to unapproved DNS servers, and that block resources by protocol, domain, and IP address. For the purposes of this post, we’ll show you how to protect a workload consisting of two Microsoft Active Directory domain controllers, an application server running QuickBooks, and Amazon WorkSpaces to deliver the QuickBooks application to end users, as shown in Figure 1.
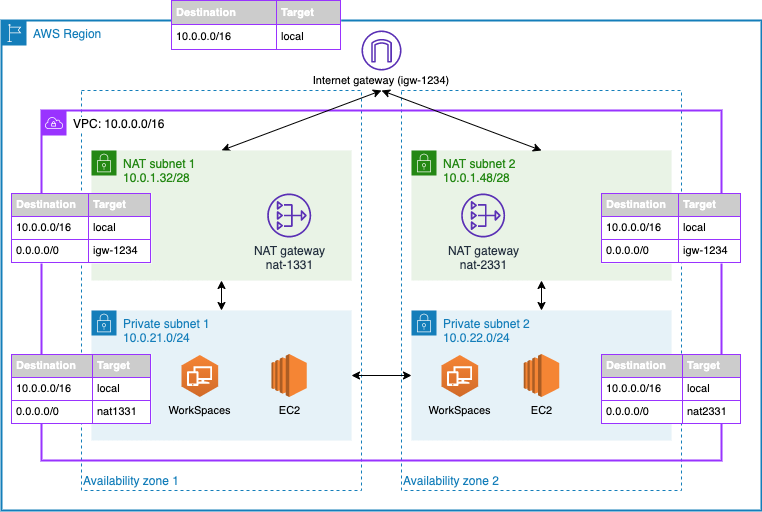
Figure 1: An example architecture that includes domain controllers and QuickBooks hosted on EC2 and Amazon WorkSpaces for user virtual desktops
Configure DNS Firewall
DNS Firewall domain lists currently include two managed lists to block malware and botnet command-and-control networks, and you can also bring your own list. Your list can include any domain names that you have found to be malicious and any domains that you don’t want your workloads connecting to.
To configure DNS Firewall domain lists (console)
- Open the Amazon VPC console.
- In the navigation pane, under DNS Firewall, choose Domain lists.
- Choose Add domain list to configure a customer-owned domain list.
- In the domain list builder dialog box, do the following.
- Under Domain list name, enter a name.
- In the second dialog box, enter the list of domains you want to allow or block.
- Choose Add domain list.
When you create a domain list, you can enter a list of domains you want to block or allow. You also have the option to upload your domains by using a bulk upload. You can use wildcards when you add domains for DNS Firewall. Figure 2 shows an example of a custom domain list that matches the root domain and any subdomain of box.com, dropbox.com, and sharefile.com, to prevent users from using these file sharing platforms.
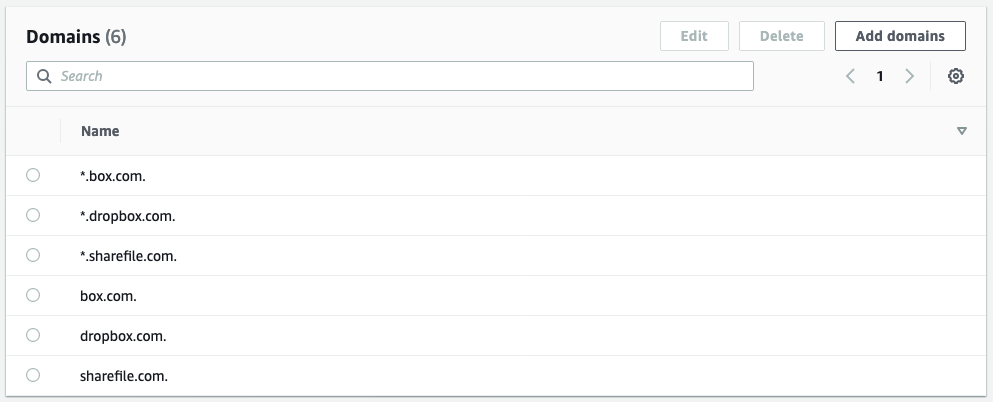
Figure 2: Domains added to a customer-owned domain list
To configure DNS Firewall rule groups (console)
- Open the Amazon VPC console.
- In the navigation pane, under DNS Firewall, choose Rule group.
- Choose Create rule group to apply actions to domain lists.
- Enter a rule group name and optional description.
- Choose Add rule to add a managed or customer-owned domain list, and do the following.
- Enter a rule name and optional description.
- Choose Add my own domain list or Add AWS managed domain list.
- Select the desired domain list.
- Choose an action, and then choose Next.
- (Optional) Change the rule priority.
- (Optional) Add tags.
- Choose Create rule group.
When you create your rule group, you attach rules and set an action and priority for the rule. You can set rule actions to Allow, Block, or Alert. When you set the action to Block, you can return the following responses:
- NODATA – Returns no response.
- NXDOMAIN – Returns an unknown domain response.
- OVERRIDE – Returns a custom CNAME response.
Figure 3 shows rules attached to the DNS firewall.
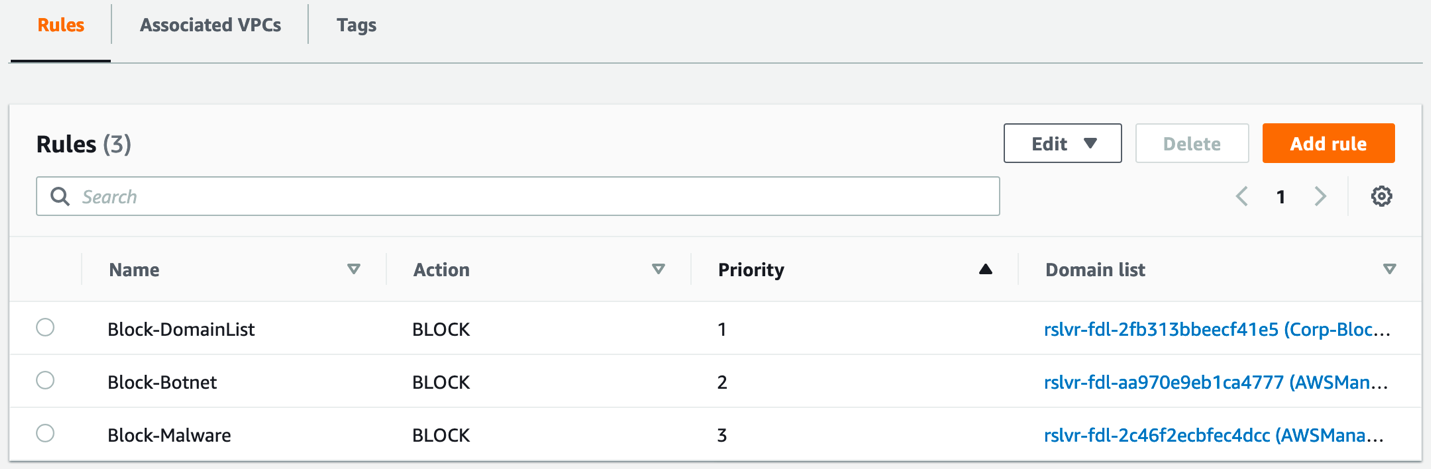
Figure 3: DNS Firewall rules
To associate your rule group to a VPC (console)
- Open the Amazon VPC console.
- In the navigation pane, under DNS Firewall, choose Rule group.
- Select the desired rule group.
- Choose Associated VPCs, and then choose Associate VPC.
- Select one or more VPCs, and then choose Associate.
The rule group will filter your DNS requests to Route 53 Resolver. Set your DNS servers forwarders to use your Route 53 Resolver.
To configure logging for your firewall’s activity, navigate to the Route 53 console and select your VPC under the Resolver section. You can configure multiple logging options, if required. You can choose to log to Amazon CloudWatch, Amazon Simple Storage Service (Amazon S3), or Amazon Kinesis Data Firehose. Select the VPC that you want to log queries for and add any tags that you require.
Configure Network Firewall
In this section, you’ll learn how to create Network Firewall rule groups, a firewall policy, and a network firewall.
Configure rule groups
Stateless rule groups are straightforward evaluations of a source and destination IP address, protocol, and port. It’s important to note that stateless rules don’t perform any deep inspection of network traffic.
Stateless rules have three options:
- Pass – Pass the packet without further inspection.
- Drop – Drop the packet.
- Forward – Forward the packet to stateful rule groups.
Stateless rules inspect each packet in isolation in the order of priority and stop processing when a rule has been matched. This example doesn’t use a stateless rule, and simply uses the default firewall action to forward all traffic to stateful rule groups.
Stateful rule groups support deep packet inspection, traffic logging, and more complex rules. Stateful rule groups evaluate traffic based on standard rules, domain rules or Suricata rules. Depending on the type of rule that you use, you can pass, drop, or create alerts on the traffic that is inspected.
To create a rule group (console)
- Open the Amazon VPC console.
- In the navigation pane, under AWS Network Firewall, choose Network Firewall rule groups.
- Choose Create Network Firewall rule group.
- Choose Stateful rule group or Stateless rule group.
- Enter the desired settings.
- Choose Create stateful rule group.
The example in Figure 4 uses standard rules to block outbound and inbound Server Message Block (SMB), Secure Shell (SSH), Network Time Protocol (NTP), DNS, and Kerberos traffic, which are common protocols used in our example workload. Network Firewall doesn’t inspect traffic between subnets within the same VPC or over VPC peering, so these rules won’t block local traffic. You can add rules with the Pass action to allow traffic to and from trusted networks.
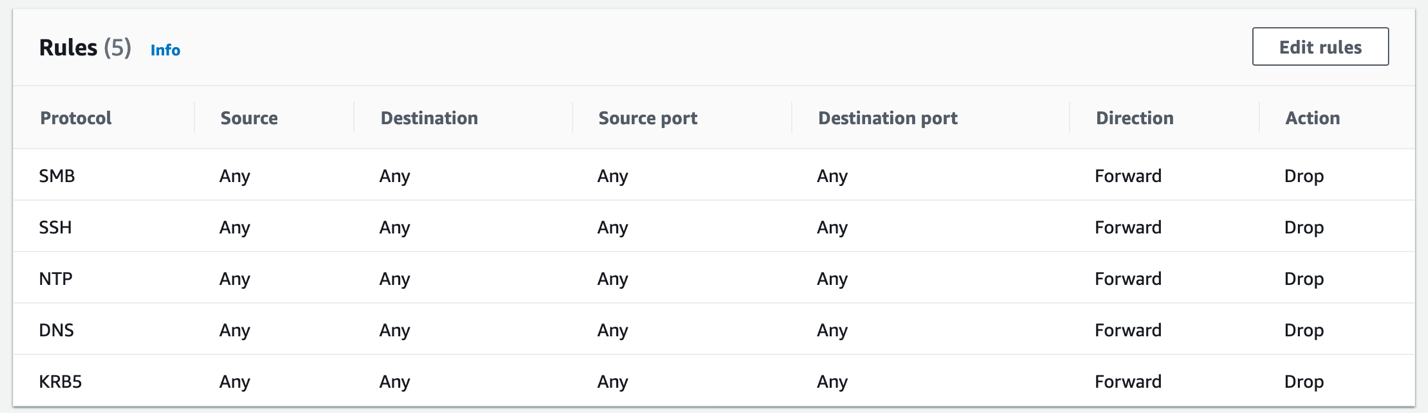
Figure 4: Standard rules created to block unauthorized SMB, SSH, NTP, DNS, and Kerberos traffic
Blocking outbound DNS requests is a common strategy to verify that DNS traffic resolves only from local resolvers, such as your DNS server or the Route 53 Resolver. You can also use these rules to prevent inbound traffic to your VPC-hosted resources, as an additional layer of security beyond security groups. If a security group erroneously allows SMB access to a file server from external sources, Network Firewall will drop this traffic based on these rules.
Even though the DNS Firewall policy described in this blog post will block DNS queries for unauthorized sharing platforms, some users might attempt to bypass this block by modifying the HOSTS file on their Amazon WorkSpace. To counter this risk, you can add a domain rule to your firewall policy to block the box.com, dropbox.com, and sharefile.com domains, as shown in Figure 5.
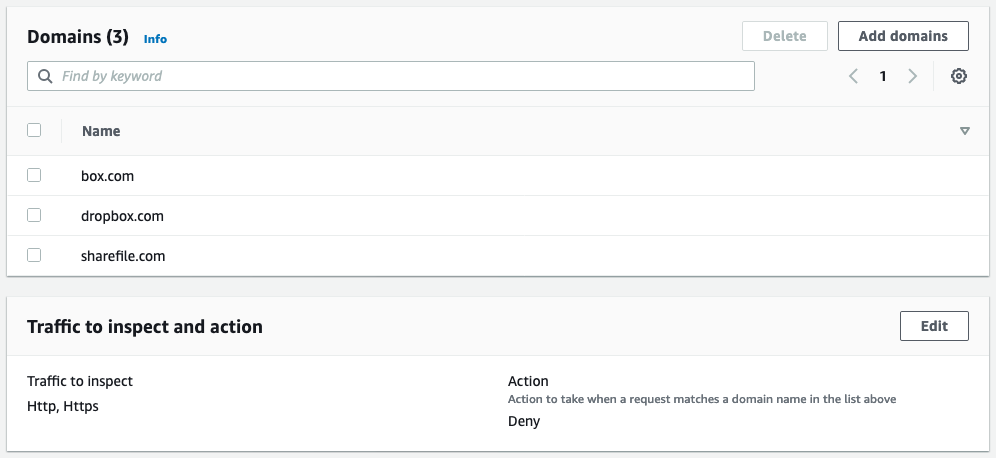
Figure 5: A domain list rule to block box.com, dropbox.com, and sharefile.com
Configure firewall policy
You can use firewall policies to attach stateless and stateful rule groups to a single policy that is used by one or more network firewalls. Attach your rule groups to this policy and set your preferred default stateless actions. The default stateless actions will apply to any packets that don’t match a stateless rule group within the policy. You can choose separate actions for full packets and fragmented packets, depending on your needs, as shown in Figure 6.
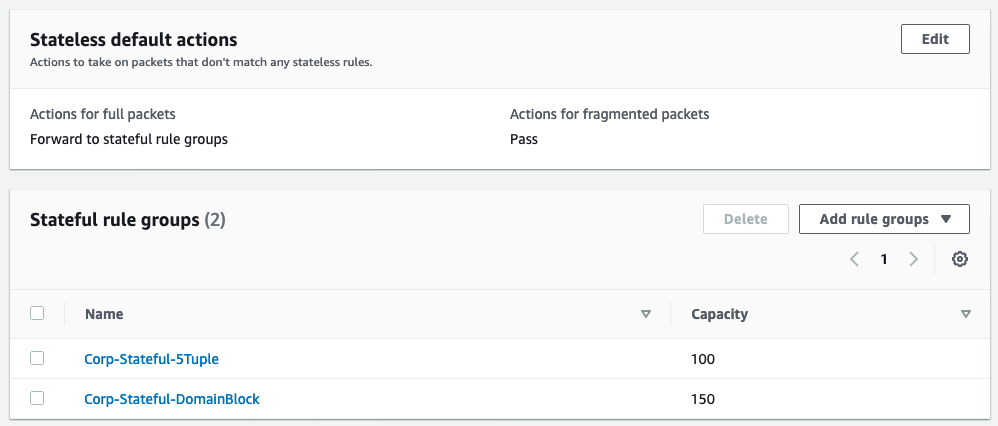
Figure 6: Stateful rule groups attached to a firewall policy
You can choose to forward the traffic to be processed by any stateful rule groups that you have attached to your firewall policy. To bypass any stateful rule groups, you can select the Pass option.
To create a firewall policy (console)
- Open the Amazon VPC console.
- In the navigation pane, under AWS Network Firewall, choose Firewall policies.
- Choose Create firewall policy.
- Enter a name and description for the policy.
- Choose Add rule groups.
- Select the stateless default actions you want to use.
- For any stateless or stateful rule groups, choose Add rule groups to add any rule groups that you want to use.
- (Optional) Add tags.
- Choose Create firewall policy.
Configure a network firewall
Configuring the network firewall requires you to attach the firewall to a VPC and select at least one subnet.
To create a network firewall (console)
- Open the Amazon VPC console.
- In the navigation pane, under AWS Network Firewall, choose Firewalls.
- Choose Create firewall.
- Under Firewall details, do the following:
- Enter a name for the firewall.
- Select the VPC.
- Select one or more Availability Zones and subnets, as needed.
- Under Associated firewall policy, do the following:
- Choose Associate an existing firewall policy.
- Select the firewall policy.
- (Optional) Add tags.
- Choose Create firewall.
Two subnets in separate Availability Zones are used for the network firewall example shown in Figure 7, to provide high availability.
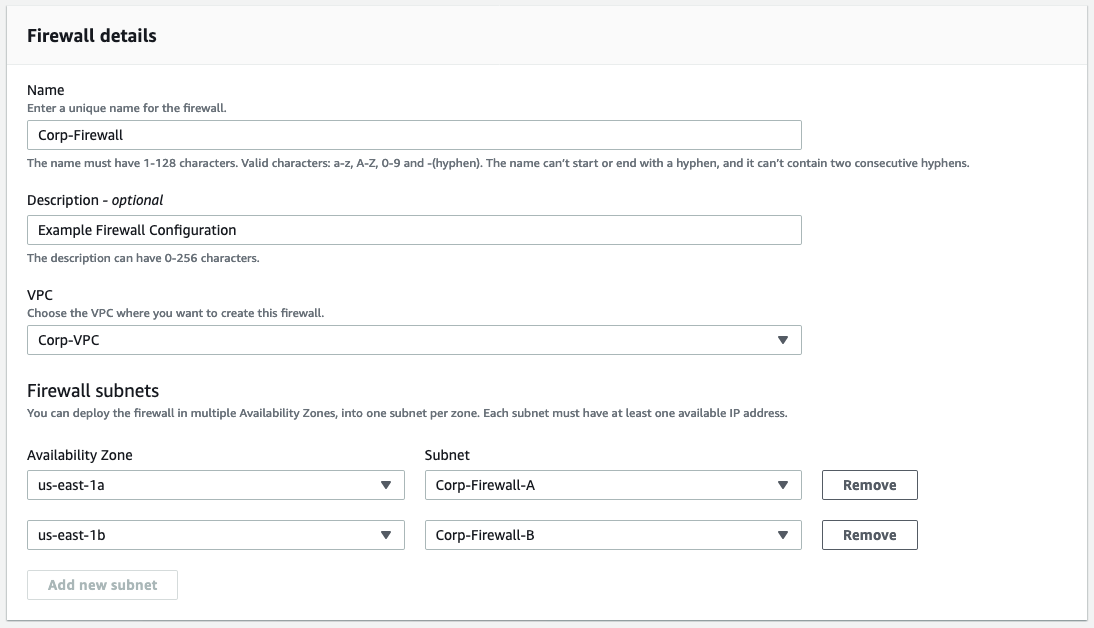
Figure 7: A network firewall configuration that includes multiple subnets
After the firewall is in the ready state, you’ll be able to see the endpoint IDs of the firewall endpoints, as shown in Figure 8. The endpoint IDs are needed when you update VPC route tables.
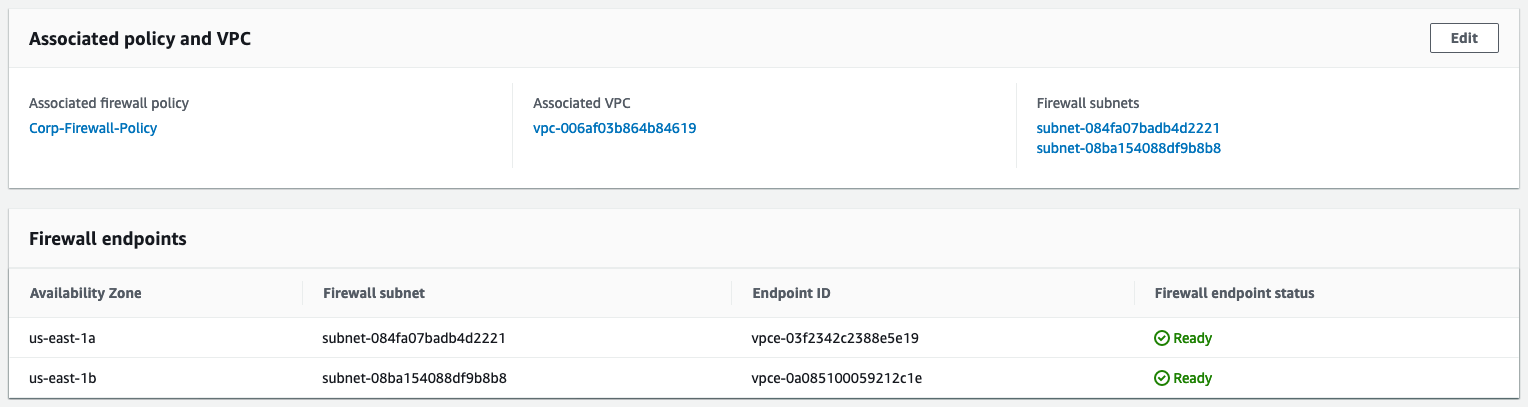
Figure 8: Firewall endpoint IDs
You can configure alert logs, flow logs, or both to be sent to Amazon S3, CloudWatch log groups, or Kinesis Data Firehose. Administrators configure alert logging to build proactive alerting and flow logging to use in troubleshooting and analysis.
Finalize the setup
After the firewall is created and ready, the last step to complete setup is to update the VPC route tables. Update your routing in the VPC to route traffic through the new network firewall endpoints. Update the public subnets route table to direct traffic to the firewall endpoint in the same Availability Zone. Update the internet gateway route to direct traffic to the firewall endpoints in the matching Availability Zone for public subnets. These routes are shown in Figure 9.
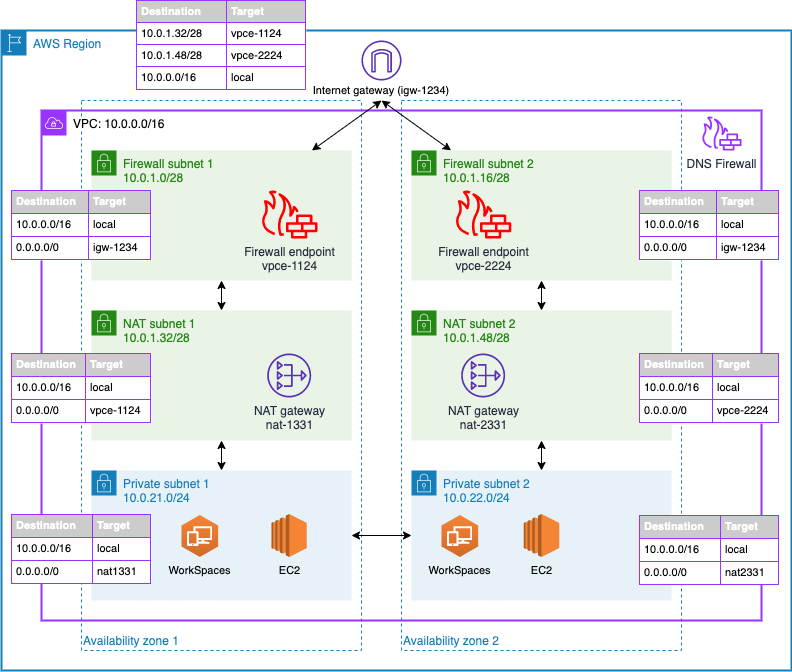
Figure 9: Network diagram of the firewall solution
In this example architecture, Amazon WorkSpaces users are able to connect directly between private subnet 1 and private subnet 2 to access local resources. Security groups and Windows authentication control access from WorkSpaces to EC2-hosted workloads such as Active Directory, file servers, and SQL applications. For example, Microsoft Active Directory domain controllers are added to a security group that allows inbound ports 53, 389, and 445, as shown in Figure 10.
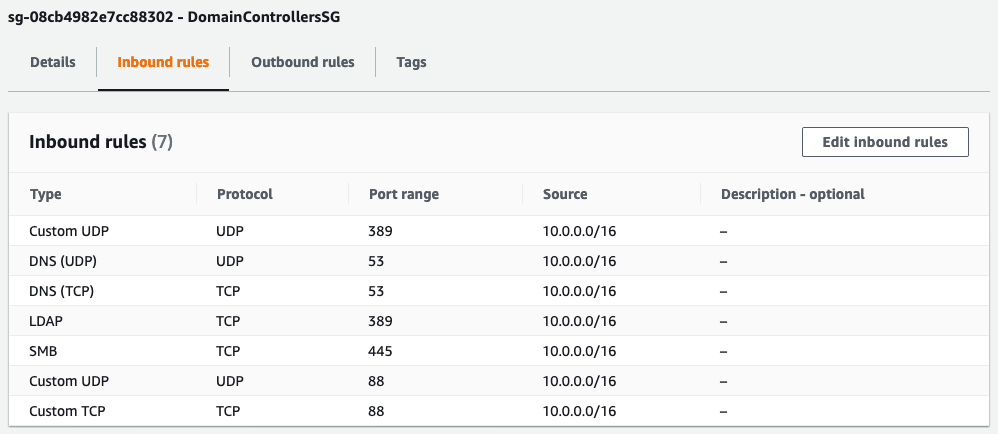
Figure 10: Domain controller security group inbound rules
Traffic from WorkSpaces will first resolve DNS requests by using the Active Directory domain controller. The domain controller uses the local Route 53 Resolver as a DNS forwarder, which DNS Firewall protects. Network traffic then flows from the private subnet to the NAT gateway, through the network firewall to the internet gateway. Response traffic flows back from the internet gateway to the network firewall, then to the NAT gateway, and finally to the user WorkSpace. This workflow is shown in Figure 11.
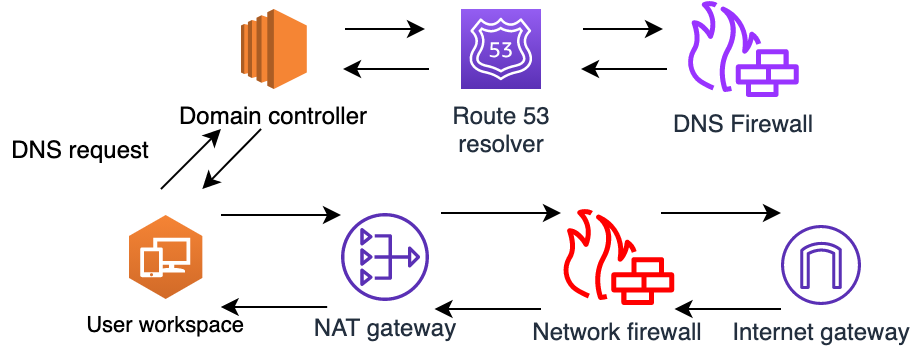
Figure 11: Traffic flow for allowed traffic
If a user attempts to connect to blocked internet resources, such as box.com, a botnet, or a malware domain, this will result in a NXDOMAIN response from DNS Firewall, and the connection will not proceed any further. This blocked traffic flow is shown in Figure 12.

Figure 12: Traffic flow when blocked by DNS Firewall
If a user attempts to initiate a DNS request to a public DNS server or attempts to access a public file server, this will result in a dropped connection by Network Firewall. The traffic will flow as expected from the user WorkSpace to the NAT gateway and from the NAT gateway to the network firewall, which inspects the traffic. The network firewall then drops the traffic when it matches a rule with the drop or block action, as shown in Figure 13. This configuration helps to ensure that your private resources only use approved DNS servers and internet resources. Network Firewall will block unapproved domains and restricted protocols that use standard rules.

Figure 13: Traffic flow when blocked by Network Firewall
Take extra care to associate a route table with your internet gateway to route private subnet traffic to your firewall endpoints; otherwise, response traffic won’t make it back to your private subnets. Traffic will route from the private subnet up through the NAT gateway in its Availability Zone. The NAT gateway will pass the traffic to the network firewall endpoint in the same Availability Zone, which will process the rules and send allowed traffic to the internet gateway for the VPC. By using this method, you can block outbound network traffic with criteria that are more advanced than what is allowed by network ACLs.
Conclusion
Amazon Route 53 Resolver DNS Firewall and AWS Network Firewall help you protect your VPC workloads by inspecting network traffic and applying deep packet inspection rules to block unwanted traffic. This post focused on implementing Network Firewall in a virtual desktop workload that spans multiple Availability Zones. You’ve seen how to deploy a network firewall and update your VPC route tables. This solution can help increase the security of your workloads in AWS. If you have multiple VPCs to protect, consider enforcing your policies at scale by using AWS Firewall Manager, as outlined in this blog post.
If you have feedback about this post, submit comments in the Comments section below. If you have questions about this post, start a new thread on the AWS Network Firewall forum or contact AWS Support.
Want more AWS Security how-to content, news, and feature announcements? Follow us on Twitter.
A disagreement over the PostgreSQL trademark
Post Syndicated from original https://lwn.net/Articles/869108/rss
This
release on PostgreSQL.org describes an ongoing disagreement over the
PostgreSQL trademark:
In 2020, the PostgreSQL Core Team was made aware that an
organization had filed applications to register the ‘PostgreSQL’
and ‘PostgreSQL Community’ trademarks in the European Union and the
United States, and had already registered trademarks in Spain. The
organization, a 3rd party not-for-profit corporation in Spain
called ‘Fundación PostgreSQL,’ did not give any indication to the
PostgreSQL Core Team or PGCAC that they would file these
applications.