Build a trusted foundation for data and AI using Alation and Amazon SageMaker Unified Studio

Post Syndicated from Anthony Lempelius, James Mesney original https://aws.amazon.com/blogs/big-data/build-a-trusted-foundation-for-data-and-ai-using-alation-and-amazon-sagemaker-unified-studio/

This post was co-written with Anthony Lempelius and James Mesney from Alation.

When a team wants to reuse a dataset, whether it is to build a new pipeline, launch a dashboard, run an analysis, or power an AI application, the first challenge is rarely the code. Data engineers need to understand lineage, transformations, and operational expectations. Data analysts and BI engineers need consistent definitions, metrics, and trusted sources. Data scientists and AI engineers need to know provenance, quality, access constraints, and how data or features were derived. In many organizations, that context is captured in different places by different teams, often across solutions like Alation and SageMaker Unified Studio, both of which can serve as a system of record for business context depending on who is doing the work and where they operate day to day. When those perspectives are not connected, people revalidate the same information, debate definitions, and duplicate documentation across tools. A unified metadata foundation brings these role specific views together so business context, technical metadata, and governance stay aligned across platforms, making data easier to trust, easier to find, and easier to use across analytics and AI.

The new Alation integration with Amazon SageMaker Unified Studio addresses these challenges by synchronizing catalog metadata between both systems. This synchronization creates a unified metadata experience where technical teams working in SageMaker Unified Studio and business teams working in Alation collaborate on top of the same metadata. You can verify how ML and analytics assets are created, understand dependencies, and maintain traceability across your data lifecycle regardless of which system your teams prefer to use.

In this post, we demonstrate who benefits from this integration, how it works, the specific metadata it synchronizes, and provide a complete deployment guide for your environment.

The value of unified metadata governance

Organizations managing large-scale analytics and ML workloads face critical challenges when metadata is fragmented across multiple systems. When metadata exists in silos, data scientists spend valuable time searching for the right datasets. Teams duplicate metadata management efforts, creating inconsistent definitions and conflicting metrics across the organization.

Regulatory requirements demand clear provenance. Without unified metadata governance, organizations struggle to demonstrate compliance, trace data origins, and maintain audit trails across their ML and analytics pipelines. Data discovery becomes a bottleneck when teams can’t quickly find, understand, and trust the data they need, delaying model development and reducing the overall business value of data investments.

Applying consistent governance policies across disparate systems is nearly impossible without a unified metadata layer. This creates security vulnerabilities, data quality issues, and compliance blind spots. A unified metadata governance approach alleviates these challenges by providing a single source of truth for metadata across ML and analytics systems, enabling faster data discovery, consistent governance, and confident compliance while reducing the operational burden on data and ML teams.

Solution overview

The Alation and SageMaker Unified Studio integration unifies the user experience, synchronizing metadata from cataloged assets between both systems.

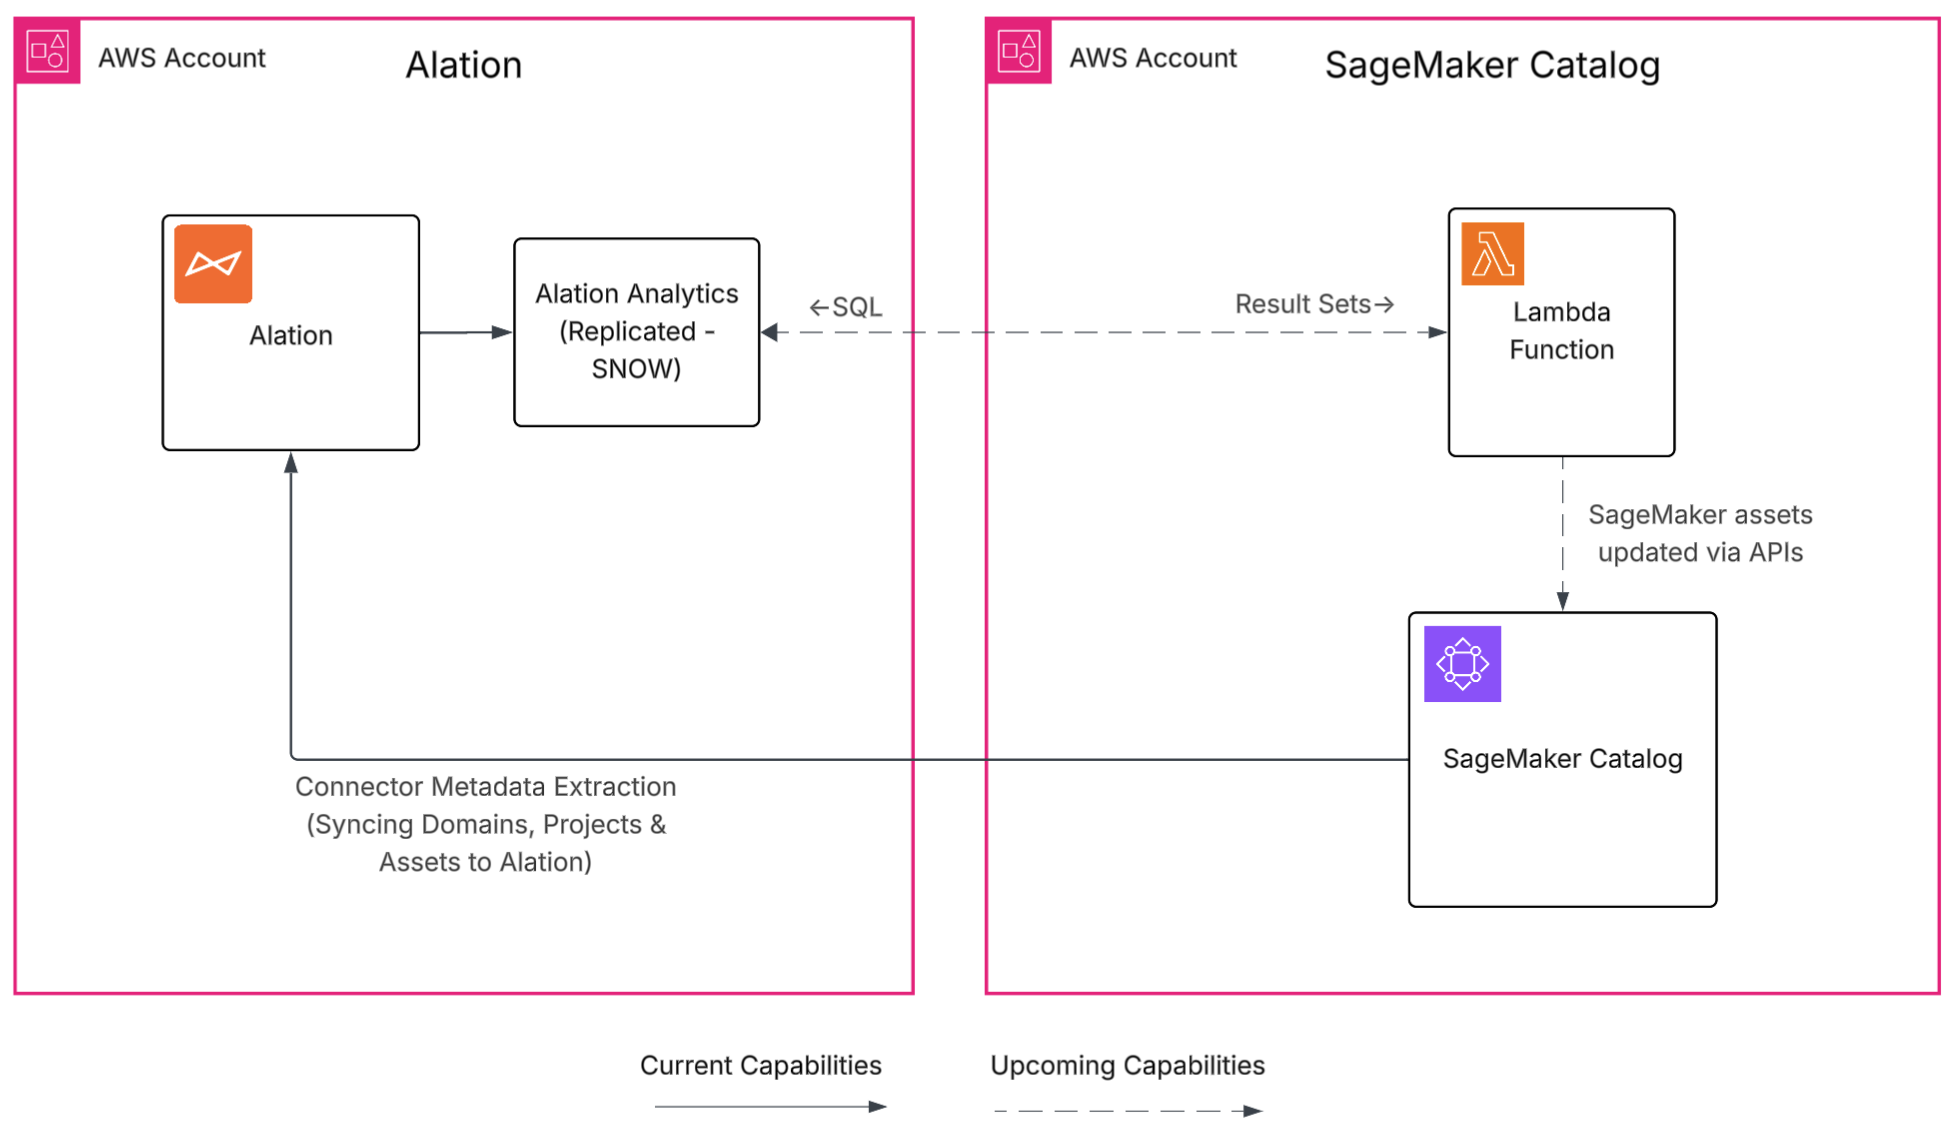
This Phase 1 integration extracts metadata from Amazon SageMaker Catalog into Alation, giving you one place to discover assets.

The integration connects through AWS Identity and Access Management (IAM) authentication and synchronizes key metadata elements, including domains, projects, asset names, descriptions, owners, glossary terms, and custom metadata fields. Every metadata update includes provenance information: the originating service, the person who made the change, and the timestamp, creating comprehensive audit trails for compliance.

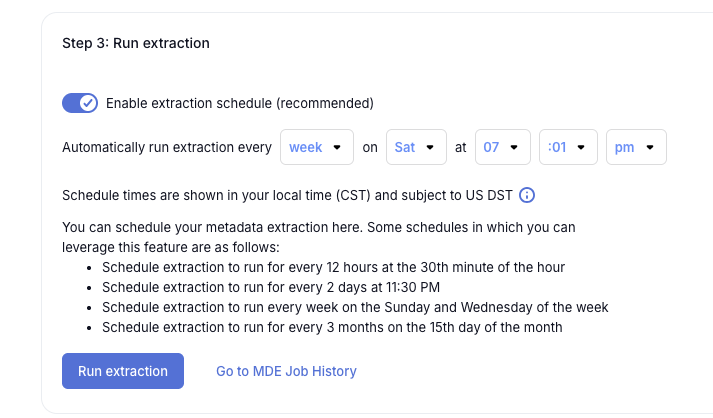
You can run metadata extractions on demand or schedule them to run automatically. The system performs an initial bulk extraction of your selected domains and projects, then keeps it up-to-date through incremental updates using either event-driven triggers or scheduled polling. Communication uses encrypted APIs with scoped IAM permissions following least-privilege principles.

This integration helps organizations in financial services, telecommunications, retail, manufacturing, and transportation that manage large numbers of analytics and ML workloads across many systems and teams. You can reduce metadata duplication, accelerate data discovery, and enable your data scientists, analysts, and engineers to find trusted data faster so they can focus on building insights rather than validating data quality.

The following diagram illustrates the solution architecture.

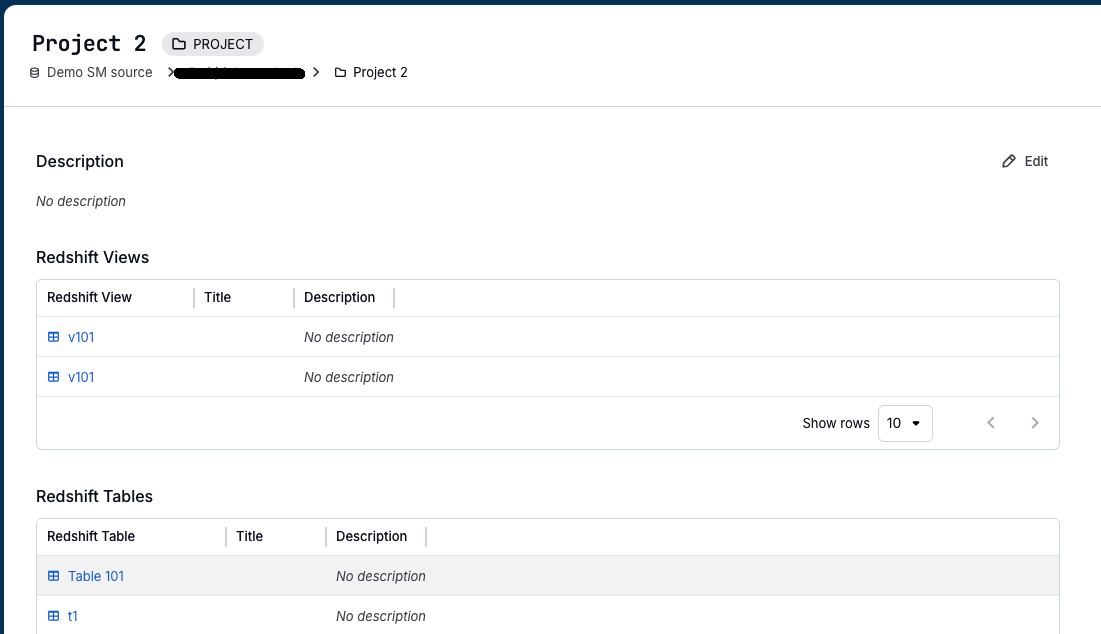
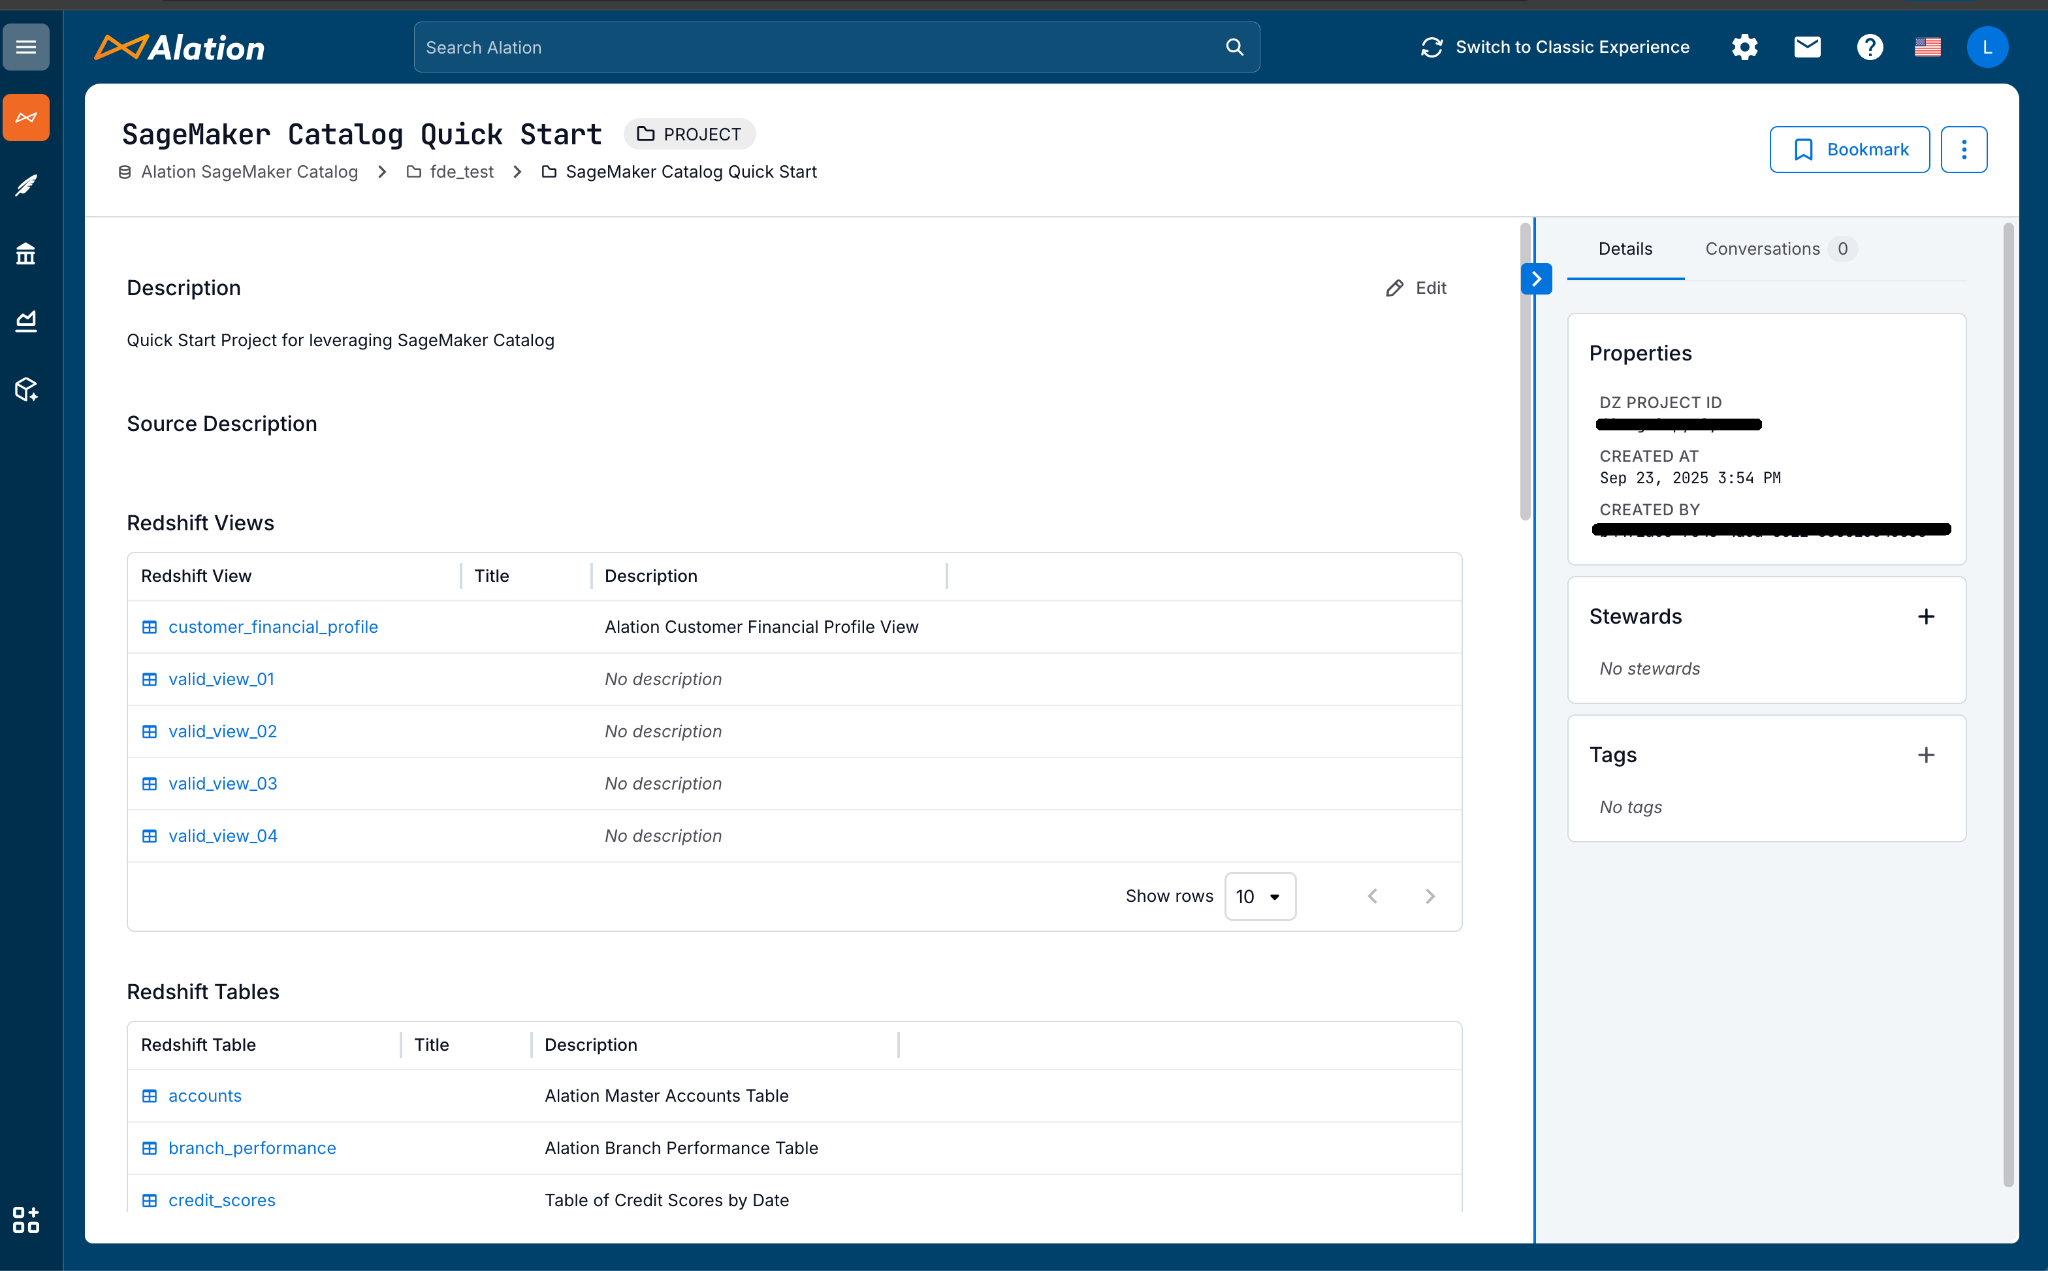
The following screenshot showcases the Alation catalog displaying the SageMaker Unified Studio project and its synchronized assets.

Metadata synchronization

This integration automatically synchronizes essential metadata between SageMaker Unified Studio and Alation, facilitating consistent information across both systems. The synchronization brings together the types of metadata you need for discovery, governance, and audit workflows, giving you clearer insight into how datasets, features, and models relate across your services.

The integration synchronizes catalog metadata, including domains, projects, asset names, descriptions, owners, glossary terms, and metadata forms. Additionally, the integration synchronizes provenance metadata, which includes information about the originating service, the actor who made the change, and the timestamp, to support traceability and audit workflows.

Integration mechanics

The integration connects SageMaker Unified Studio and Alation through a scoped IAM role that provides secure, encrypted communication. After you configure this connection within Alation, the system performs an initial extraction of your selected domains and projects, then keeps information current through incremental updates using either event-driven triggers or scheduled polling.

The integration synchronizes metadata forms from SageMaker Unified Studio into Alation through automated field mapping between both systems’ schemas. Metadata forms can capture various asset specific details like feature store references, training run identifiers, model versions, and evaluation metrics.

Every metadata update includes provenance information: the originating service, the person who made the change, and when it occurred. This supports audit and stewardship workflows. Access controls follow least-privilege principles through IAM while applying Alation’s role-based permissions, letting you limit synchronization by project, namespace, or tag as needed.

Security and compliance

Security and compliance are critical when synchronizing metadata across systems. This integration follows enterprise security practices to facilitate safe, controlled metadata synchronization. The connector uses least-privilege access, encrypted transport, and clear separation between metadata and data, so you can maintain governance without disrupting existing workflows.

You configure a scoped IAM role to define which accounts, projects, and namespaces the connector can access, making sure access follows your organization’s security policies. Metadata moves over TLS-protected APIs, and you control which domains and projects to include in Alation. By default, the integration synchronizes only metadata; your data files and artifacts remain in their original AWS locations unless you explicitly choose to export them.

Alation maintains a complete audit trail by recording extraction events, mapping changes, and stewardship activities. These security controls support compliant metadata governance while preserving your existing operational practices.

Prerequisites

Before setting up this integration, ensure you have the following:

  • An Alation Cloud Service (ACS) instance
  • Alation server admin access
  • An AWS account
  • A SageMaker Unified Studio domain and project with existing metadata

Configure authentication

Before configuring the Alation connector, you must set up the required AWS resources and permissions. The first step is to configure authentication. The Alation connector supports two authentication methods to access SageMaker Unified Studio. Choose the method that best fits your security requirements.

Option 1: IAM role (Recommended)

Create an IAM role that the Alation connector will assume to access SageMaker Unified Studio. For detailed instructions on creating IAM roles, see IAM role creation.

The following is an example IAM permission policy for SageMaker Catalog access:

{
   "Version": "2012-10-17",
    "Statement": [
        {
            "Sid": "AlationSageMakerAccess",
            "Effect": "Allow",
            "Action": [
                "datazone:ListDomains",
                "datazone:GetFormType",
                "datazone:Search",
                "datazone:ListProjects",
                "datazone:GetAsset"
            ],
            "Resource": "arn:aws:datazone:<region>:<account-id>:domain/*”
        }
    ]
}

The following is an example trust policy for the IAM role:

{
    "Version": "2012-10-17",
    "Statement": [
        {
            "Sid": "AlationSageMakerAccessAssumeRole",
            "Effect": "Allow",
            "Principal": {
                "AWS": "<alation_provided_role_arn>"
            },
            "Action": "sts:AssumeRole"
        }
    ]
}     

Option 2: IAM user with access keys

Create an IAM user with programmatic access and attach the necessary permissions. For detailed instructions on creating IAM users, see Create an IAM user in your AWS account.

Create an IAM user with programmatic access enabled, attach the following policy, and generate access keys for use in Alation configuration:

{
   "Version": "2012-10-17",
    "Statement": [
        {
            "Sid": "AlationSageMakerAccess",
            "Effect": "Allow",
            "Action": [
                "datazone:ListDomains",
                "datazone:GetFormType",
                "datazone:Search",
                "datazone:ListProjects",
                "datazone:GetAsset"
            ],
            "Resource": "arn:aws:datazone:<region>:<account-id>:domain/*"
        }
    ]
}

Add IAM role or user to SageMaker Unified Studio domain

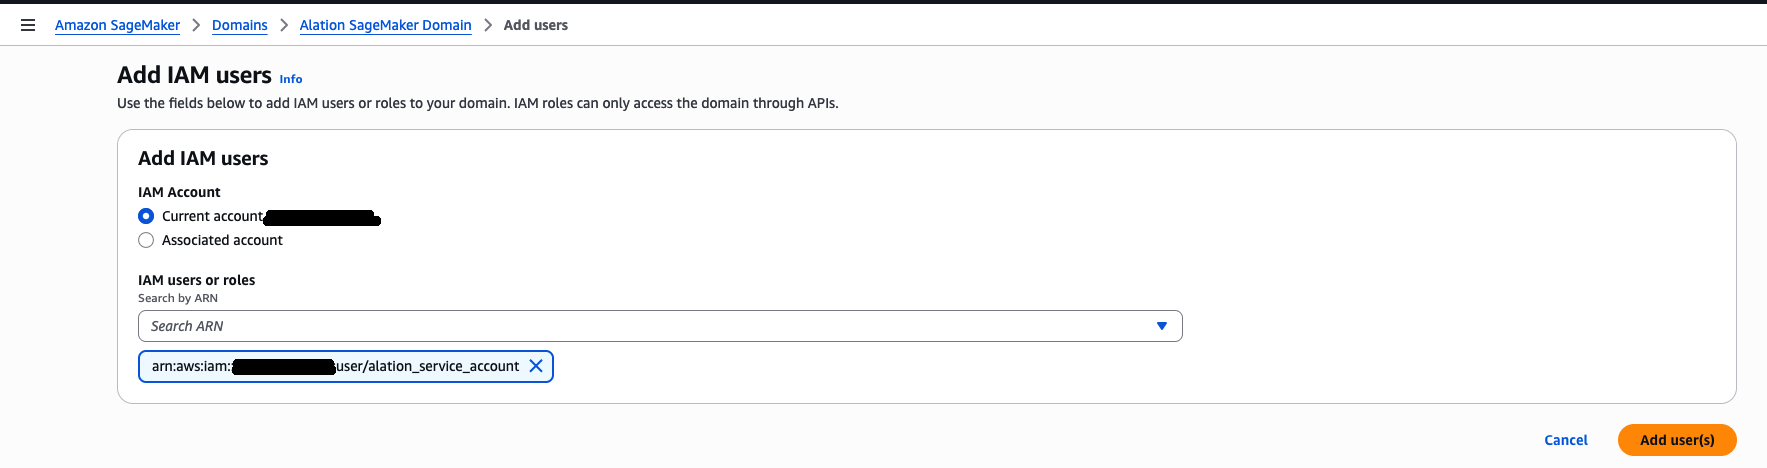
Add the IAM role or user you created to the SageMaker Unified Studio domain. For detailed instructions on adding users to a domain, see User management in Amazon SageMaker Unified Studio. The following screenshot shows an example of adding IAM users on the SageMaker dashboard.

Add IAM role or user to SageMaker Unified Studio projects

The IAM role or user must be added as a member to all SageMaker Unified Studio projects that contain metadata you want to synchronize with Alation. Projects without this member will not be included in the synchronization process.

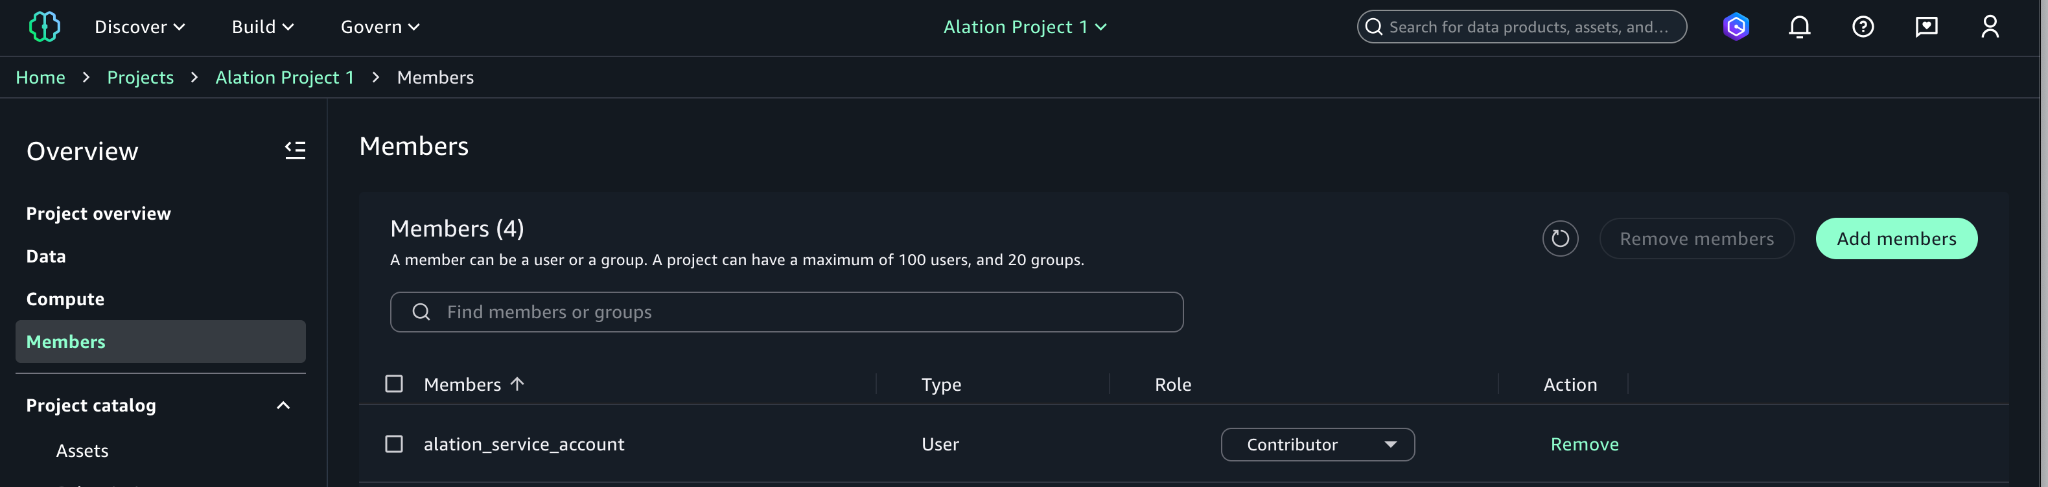
Add the IAM role or user as a project member with Contributor or Owner permissions for each project you want to include in the sync, as illustrated in the following screenshot. For detailed instructions on adding project members, see Add project members.

Install SageMaker enhanced connector

After completing the AWS setup, you can configure the Alation connector to establish the integration. The connector is distributed as a .zip package for upload and installation in the Alation application. To obtain the connector, contact the Forward Deployed Engineering team or your Alation Account Manager.

When you have the .zip package, follow the installation procedures to add the connector.

Create and configure Alation’s data source

Navigate to the Data Sources section in Alation, create a new data source, and select SageMaker Catalog as the source type. Configure the connection settings with the authentication method chosen in the AWS setup.

For IAM role authentication, use the following configuration:

  • Connection Type: IAM Role
  • Role ARN: ARN of the IAM role created in AWS setup
  • External ID: External ID configured in the trust policy
  • AWS Region: Region where your SageMaker Unified Studio domain is located

For IAM user authentication, use the following configuration:

  • Connection Type: Access Keys
  • Access Key ID: Access key from AWS setup
  • Secret Access Key: Secret key from AWS setup
  • AWS Region: Region where your SageMaker Unified Studio domain is located

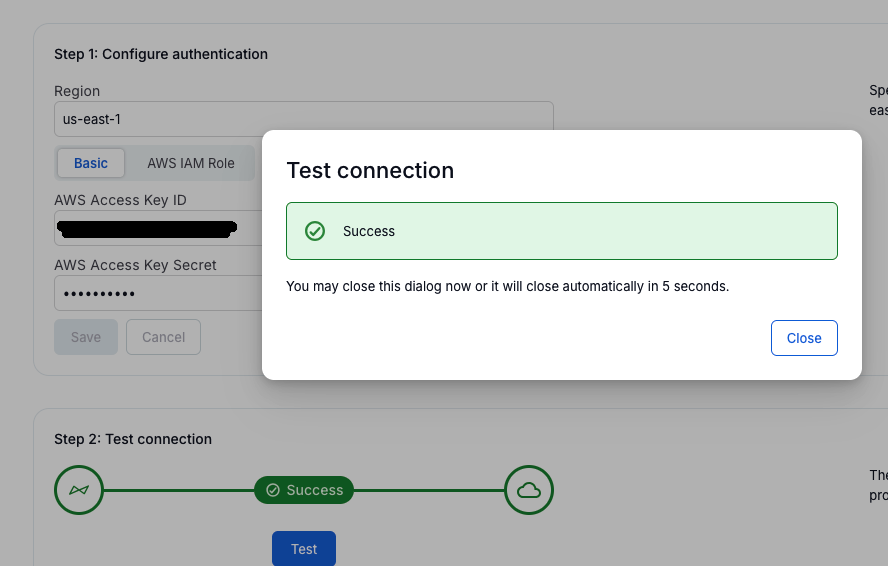
Test the connection to verify authentication and network connectivity, as shown in the following screenshot.

Configure metadata extraction settings

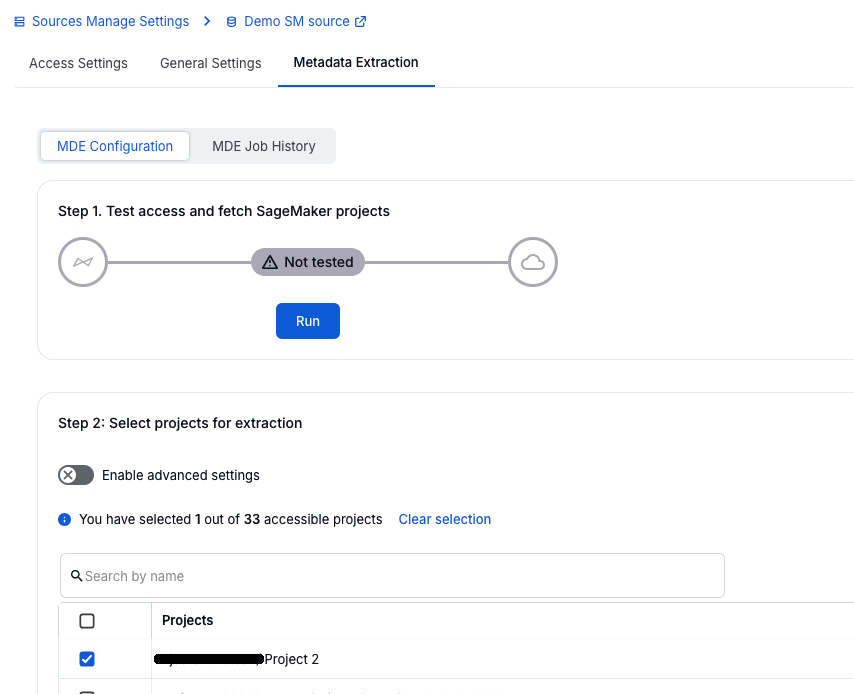
Configure the extraction scope by selecting the SageMaker domains and projects to synchronize, as shown in the following screenshot. Only projects where the IAM role or user is a member will be available for synchronization.

Run initial extraction

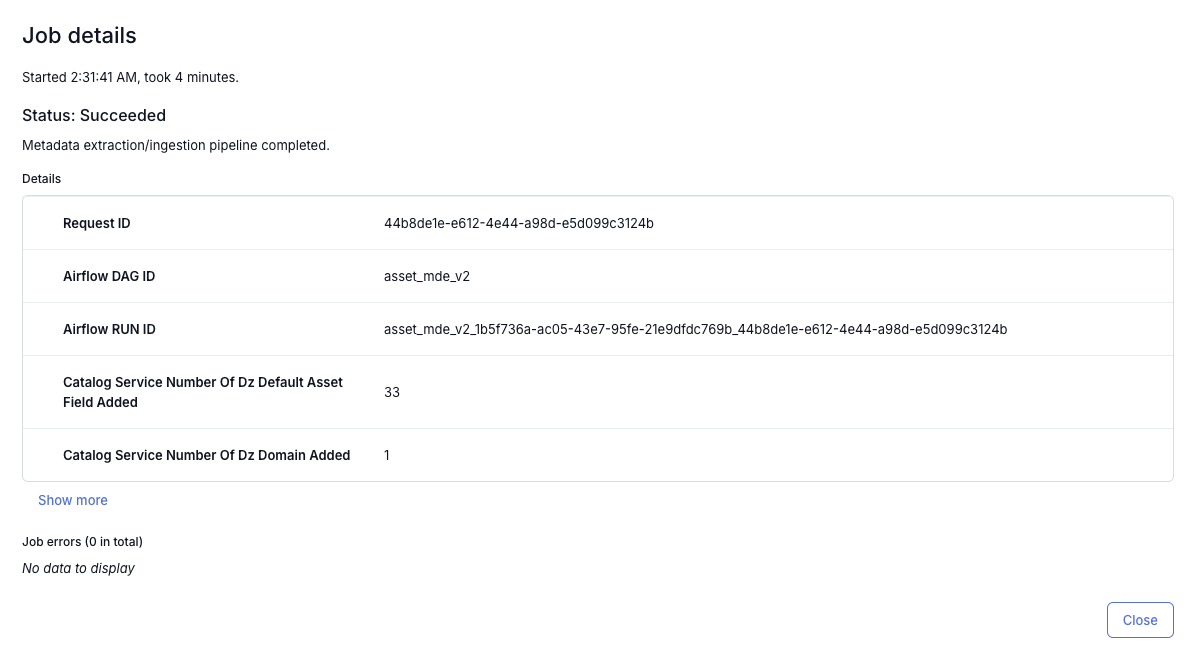
Execute the first metadata synchronization to import existing metadata from SageMaker Unified Studio into Alation. Monitor the extraction progress through Alation’s status indicators and validate that SageMaker assets appear correctly in the catalog.

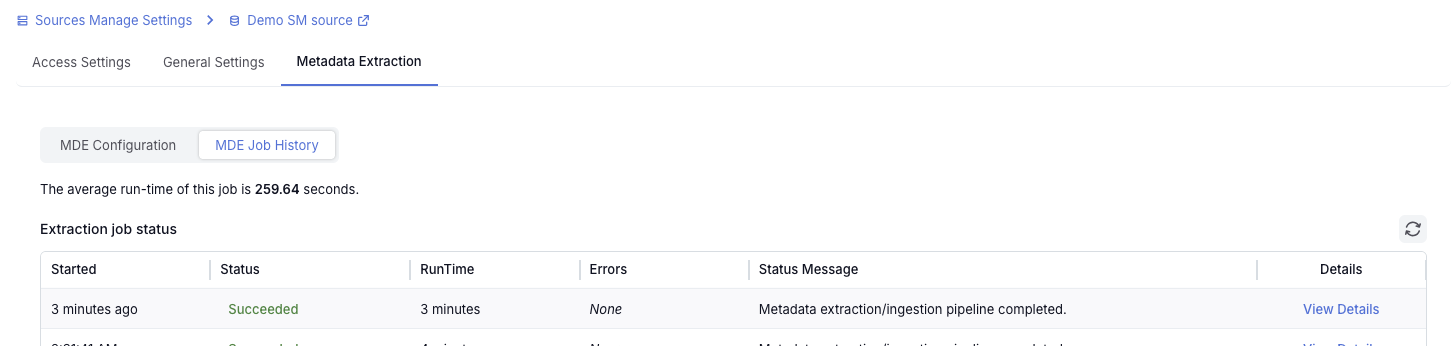
The following screenshot shows the job history page with job status Running.

The following screenshot shows the job history page with job status Succeeded.

The following screenshot shows the Alation catalog displaying the SageMaker Unified Studio project and its synchronized assets.

Operate and tune

Configure ongoing operations by setting extraction cadence, configuring reconciliation alerts, and monitoring logs regularly. Add data stewards to synchronized assets, and consider enabling AI-generated descriptions or working with Alation Professional Services for advanced governance design.

Enhanced capabilities

The next phase of the integration introduces three key capabilities: bi-directional metadata synchronization, lineage replication, and data quality metadata replication. The bi-directional capability gives you the flexibility to control where metadata updates originate, either in Alation or in SageMaker Unified Studio, so you can manage metadata changes in the service that best aligns with your organizational workflows and governance processes.

The feature set is rolling out in phases. Phase 1 is available at the time of writing this post and provides extraction from SageMaker Unified Studio into Alation, including initial and incremental updates and audit logging. Phase 2 is coming soon and will offer configurable principal catalogs, advanced scoped syncs, and reconciliation workflows for Alation Cloud Service customers.

These enhancements will support governed, scalable ML operations with increasing depth and automation.

Conclusion

The Alation and SageMaker Unified Studio integration helps organizations bridge the gap between fast analytics and ML development and the governance requirements most enterprises face. By cataloging metadata from SageMaker Unified Studio in Alation, you gain a governed, discoverable view of how assets are created and used. This supports leaders, stewards, compliance teams, and ML practitioners who depend on accurate, well-documented data to scale analytics and AI responsibly.

To learn more about this integration and explore additional resources, refer to the Amazon SageMaker Unified Studio User Guide and Alation Documentation.


About the authors

Anthony Lempelius

Anthony Lempelius

Anthony is the Director of Channel and Alliances at Alation, where he leads strategic partnerships with independent software vendor (ISV) and systems integrator (SI) partners. He focuses on bringing joint integrations and solutions to market that help customers unlock value from trusted, well-governed data. Anthony is passionate about building the AWS Partner Network that accelerates innovation across the data and AI landscape.

James Mesney

James Mesney

James is a Principal Product Manager at Alation, where he leads product strategy for advancing Alation’s Agentic capabilities. He focuses on helping organizations make their data more discoverable, governed, and actionable by shaping features that improve metadata quality, user experience, and AI-driven insights. James is passionate about building products that empower enterprises to fully unlock the value of trusted data.

Divij Bhatia

Divij Bhatia

Divij is a Software Development Engineer at AWS. He is passionate about building resilient and scalable cloud-based solutions that solve real-world problems for customers. His free time often takes him outdoors, traveling and shooting landscapes.

Leonardo Gomez

Leonardo Gomez

Leonardo is a Principal Analytics Specialist Solutions Architect at AWS. He has over a decade of experience in data management, helping customers around the globe address their business and technical needs.

More room to build: serverless services now support payloads up to 1 MB

Post Syndicated from Anton Aleksandrov original https://aws.amazon.com/blogs/compute/more-room-to-build-serverless-services-now-support-payloads-up-to-1-mb/

To support cloud applications that increasingly depend on rich contextual data, AWS has raised the maximum payload size from 256 KB to 1 MB for asynchronous AWS Lambda function invocations, Amazon Simple Queue Service (Amazon SQS), and Amazon EventBridge. Developers can use this enhancement to build and maintain context-rich event-driven systems and reduce the need for complex workarounds such as data chunking or external large object storage.

Overview

Modern cloud applications rely on context-rich, structured data to drive intelligent behavior. Large language model (LLM) prompts, telemetry signals, personalization data, machine learning (ML) outputs, and user interaction logs are no longer simple strings. Instead, they’re typically complex, nested JSON or YAML objects carrying meaningful context. Previously, developers working with serverless services such as Amazon SQS, Lambda (asynchronous invocations and Amazon SQS event-source mapping), or EventBridge had to carefully manage their data to fit within the 256 KB payload size limit. This commonly meant chunking larger payloads, externalizing payloads to object stores such as Amazon S3, or using data compression. These workarounds added complexity and latency, creating edge cases that were difficult to monitor and debug.

With the recent launches, you can now transmit payloads up to 1 MB, significantly reducing the need for complex data chunking and architectural workarounds. This increased capacity streamlines design patterns, reduces operational overhead, and makes event-driven systems more intuitive to build and maintain. Developers can now include richer data in single payloads—from detailed LLM prompts and full system states to comprehensive context and complete transaction histories.

The new 1 MB payload size limit applies to asynchronous Lambda function invocations, whether you trigger them using either SQS event-source mapping, AWS Command Line Interface (AWS CLI), AWS SDKs, Lambda Invoke API, or AWS services such as EventBridge. The increased limit also extends to all messages and events flowing through Amazon SQS queues and EventBridge Event Buses.

Getting started

There’s nothing you need to do to get started. This enhancement is automatically applied to all new and existing Lambda functions, SQS queues, and EventBridge Event Buses.

If you were previously chunking data at 256KB (or lower) threshold, then you might need to make changes to your service configurations or business logic code to start using the new limit. For example, if you’ve explicitly set Amazon SQS MaximumMessageSize attribute, then you might need to adjust it to a new desired value. Larger payloads might also result in higher costs, as described in the following section.

Real-world example: rich event context in agentic event-driven architectures

Event-driven architectures allow services to operate independently without centralized coordination. In these systems, comprehensive event context is essential. With the increased 1 MB payload limit, events can now carry more comprehensive data—from user profiles and order details to historical interactions. This enables services such as inventory, shipping, and notifications to act autonomously.

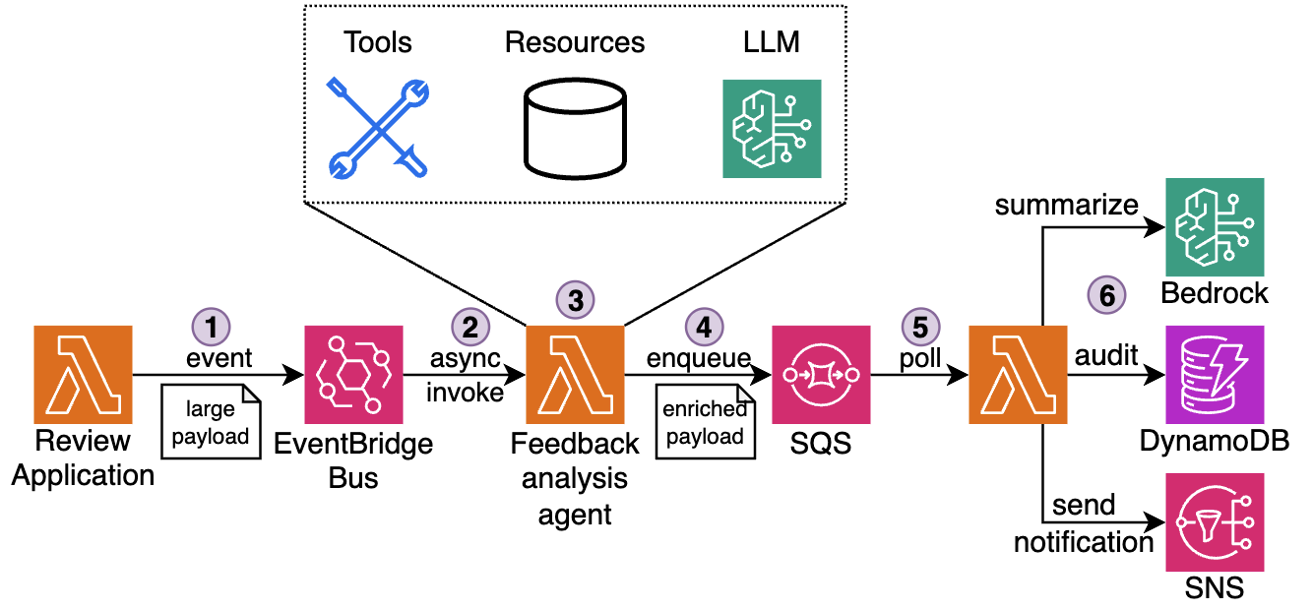
Consider the following example. In hospitality and quick-service industries, customer satisfaction depends on timely, thoughtful service recovery. When a guest submits negative feedback through a survey, review, or complaint form, service teams must gather context, interpret the issue, and craft a response. Traditionally, this meant manually piecing together visit logs, loyalty data, and prior complaints. Now, this can be fully automated using an AI agent powered by AWS serverless services and Amazon Bedrock, as shown in the following figure.

Figure 1: Customer feedback processing pipeline

The workflow:

  1. Receive: A new review is submitted through the Review application and emitted as an event to EventBridge Event Bus.
  2. Detect: Event Bus delivers the event to downstream Feedback analysis agent. The agent running in a Lambda function recognizes the review as low-rating or complaint.
  3. Enrich: The agent collects the guest’s visit metadata, booking details, loyalty activity, and complaint history using attached MCP tools into a single structured JSON payload (up to 1 MB).
  4. Queue: The payload is sent to an SQS queue for further asynchronous processing by downstream components.
  5. Generate: A separate Lambda function polls messages from Amazon SQS and invokes an Amazon Bedrock model to analyze the full complaint context, draft a personalized response, suggest a gesture (such as a refund or credit), and classify issue severity.
  6. Deliver: The message is logged and sent to the customer, and to the service team for further analysis.

This use case demonstrates the importance of having a rich context: current and previous visits details, loyalty tier, prior interactions, and feedback history. Previously, teams had to offload pieces of context to Amazon S3 and reference them externally, adding latency and architectural complexity. The new 1 MB payload size means that all this information can be transported together, improving the serverless agentic workflow efficiency and streamlining maintenance.

Best practices when using large payloads

The following sections outline best practices that you should apply when using larger payloads.

Performance considerations

Monitor Lambda function memory usage carefully when working with larger payloads, because parsing and processing complex JSON objects can increase memory usage and execution duration. Test your systems thoroughly under load, especially for high-throughput applications, by benchmarking with realistic payload sizes and traffic patterns. Although the payload limit has increased to 1 MB, the Lambda 15-minute timeout and memory limits remain unchanged. When applicable, you can use compression to process even larger datasets efficiently, but remember to account for the added CPU overhead of compression and decompression in your performance calculations. Read the Monitoring best practices for event delivery with Amazon EventBridge post for more best practices to tune your event-driven architectures performances.

Operational guidelines

Configure dead-letter-queues (DLQ) to make sure that failed messages are retained for inspection and troubleshooting. This becomes especially important with larger payloads, because debugging complex data structures necessitates access to the complete message context. Implement robust error handling and retries to manage transient failures, particularly when processing rich payload content that may contain nested structures or complex relationships.

To further optimize throughput, you can batch similar smaller events together into a single payload. However, avoid mixing unrelated events and maintain clear boundaries between different business domains and processes.

Always make sure that your downstream dependencies are capable of handling larger payloads.

When to use external storage

Even with the increased 1 MB payload limit, there are scenarios where patterns such as claim check remain a sound architectural choice. These patterns involve storing a full payload in an external system, such as Amazon S3, and passing a lightweight reference through your event stream. This approach continues to provide value when payloads exceed the new limit, when data needs to be reused by multiple consumers, or when strict governance, traceability, and security requirements are involved. For example, audit logs, image metadata, or large ML inference inputs may still surpass the 1 MB boundary, even when compressed. Instead of risking truncation or fragmentation, a claim check enables consistent, scalable access to the complete data set.

You can use open source libraries such as the Kafka sink connector for EventBridge and Amazon SQS Extended Client Library (available for Python and Java) that abstract complexities of storing large objects in external storage.

Cost management

Although larger payloads enable richer context in your applications, logging full payloads can increase storage and processing costs. Services such as CloudWatch Logs charge based on data volume, thus implementing selective logging, payload truncation, or sampling becomes crucial for high-volume events. Consider logging only essential fields or implementing smart sampling strategies based on business importance.

For full payload archival and retention, evaluate cost-effective storage solutions such as Amazon S3 with appropriate lifecycle policies. This can include moving older logs to cheaper storage tiers or implementing automated cleanup procedures for non-critical data. Balance your retention needs with cost optimization by defining clear policies for what data needs to be kept and for how long.

Review the pricing pages for AWS Lambda, Amazon EventBridge, and Amazon SQS to learn about the costs of delivering and processing events and messages.

Conclusion

The increase in maximum payload size from 256 KB to 1 MB enables developers to build more efficient distributed architectures. You can use this enhancement to transport richer context in event and message payloads, reducing the need for complex workarounds that previously added architectural complexity and operational overhead. This added room to transmit rich context means that you can streamline your workflows, improve observability, and reduce architectural complexity whether using choreography or orchestration patterns.

Go to the developer guides for AWS Lambda, Amazon EventBridge, and Amazon SQS, to learn more about how to take advantage of this update.

To learn more about serverless architectures, visit Serverless Land.

How to get started with security response automation on AWS

Post Syndicated from Cameron Worrell original https://aws.amazon.com/blogs/security/how-get-started-security-response-automation-aws/

At AWS, we encourage you to use automation. Not just to deploy your workloads and configure services, but to also help you quickly detect and respond to security events within your AWS environments. In addition to increasing the speed of detection and response, automation also helps you scale your security operations as your workloads in AWS increase and scale as well. For these reasons, security automation is a key principle outlined in the Well-Architected Framework, the AWS Cloud Adoption Framework, and the AWS Security Incident Response Guide.

Security response automation is a broad topic that spans many areas. The goal of this blog post is to introduce you to core concepts and help you get started. You will learn how to implement automated security response mechanisms within your AWS environments. This post will include common patterns that customers often use, implementation considerations, and an example solution. Additionally, we will share resources AWS has produced in the form of the Automated Security Response GitHub repo. The GitHub repo includes scripts that are ready-to-deploy for common scenarios.

What is security response automation?

Security response automation is a planned and programmed action taken to achieve a desired state for an application or resource based on a condition or event. When you implement security response automation, you should adopt an approach that draws from existing security frameworks. Frameworks are published materials which consist of standards, guidelines, and best practices in order help organizations manage cybersecurity-related risk. Using frameworks helps you achieve consistency and scalability and enables you to focus more on the strategic aspects of your security program. You should work with compliance professionals within your organization to understand any specific compliance or security frameworks that are also relevant for your AWS environment.

Our example solution is based on the NIST Cybersecurity Framework (CSF), which is designed to help organizations assess and improve their ability to help prevent, detect, and respond to security events. According to the CSF, “cybersecurity incident response” supports your ability to contain the impact of potential cybersecurity events.

Although automation is not a CSF requirement, automating responses to events enables you to create repeatable, predictable approaches to monitoring and responding to threats. When we build automation around events that we know should not occur, it gives us an advantage over a malicious actor because the automation is able to respond within minutes or even seconds compared to an on-call support engineer.

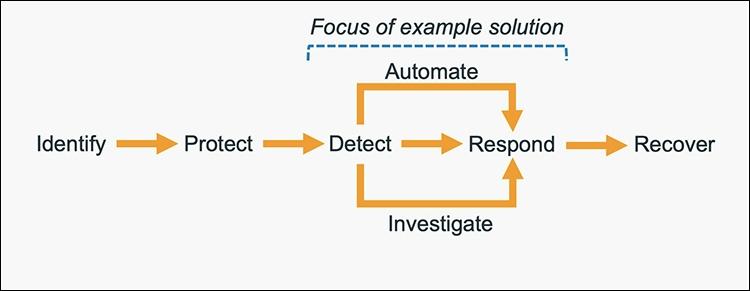
The five main steps in the CSF are identify, protect, detect, respond and recover. We’ve expanded the detect and respond steps to include automation and investigation activities.

Figure 1: The five steps in the CSF

Figure 1: The five steps in the CSF

The following definitions for each step in the diagram above are based on the CSF but have been adapted for our example in this blog post. Although we will focus on the detect, automate and respond steps, it’s important to understand the entire process flow.

  • Identify: Identify and understand the resources, applications, and data within your AWS environment.
  • Protect: Develop and implement appropriate controls and safeguards to facilitate the delivery of services.
  • Detect: Develop and implement appropriate activities to identify the occurrence of a cybersecurity event. This step includes the implementation of monitoring capabilities which will be discussed further in the next section.
  • Automate: Develop and implement planned, programmed actions that will achieve a desired state for an application or resource based on a condition or event.
  • Investigate: Perform a systematic examination of the security event to establish the root cause.
  • Respond: Develop and implement appropriate activities to take automated or manual actions regarding a detected security event.
  • Recover: Develop and implement appropriate activities to maintain plans for resilience and to restore capabilities or services that were impaired due to a security event

Security response automation on AWS

AWS CloudTrail and AWS Config continuously log details regarding users and other identity principals, the resources they interacted with, and configuration changes they might have made in your AWS account. We are able to combine these logs with Amazon EventBridge, which gives us a single service to trigger automations based on events. You can use this information to automatically detect resource changes and to react to deviations from your desired state.

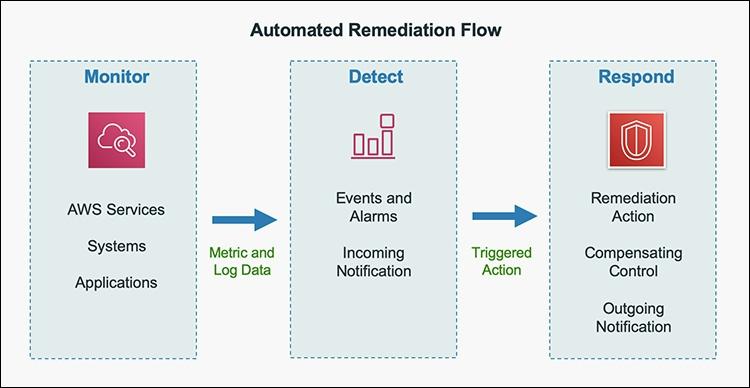
Figure 2: Automated remediation flow

Figure 2: Automated remediation flow

As shown in the diagram above, an automated remediation flow on AWS has three stages:

  1. Monitor: Your automated monitoring tools collect information about resources and applications running in your AWS environment. For example, they might collect AWS CloudTrail information about activities performed in your AWS account, usage metrics from your Amazon EC2 instances, or flow log information about the traffic going to and from network interfaces in your Amazon Virtual Private Cloud (VPC).
  2. Detect: When a monitoring tool detects a predefined condition—such as a breached threshold, anomalous activity, or configuration deviation—it raises a flag within the system. A triggering condition might be an anomalous activity detected by Amazon GuardDuty, a resource out of compliance with an AWS Config rule, or a high rate of blocked requests on an Amazon VPC security group or AWS Web Application Firewall (AWS WAF) web access control list (web-acl).
  3. Respond: When a condition is flagged, an automated response is triggered that performs an action you’ve predefined—something intended to remediate or mitigate the flagged condition.

Examples of automated response actions may include modifying a VPC security group, patching an Amazon EC2 instance, rotating various different types of credentials, or adding an additional entry into an IP set in AWS WAF that is part of a web-acl rule to block suspicious clients who triggered a threshold from a monitoring metric.

You can use the event-driven flow described above to achieve a variety of automated response patterns with varying degrees of complexity. Your response pattern could be as simple as invoking a single AWS Lambda function, or it could be a complex series of AWS Step Function tasks with advanced logic. In this blog post, we’ll use two simple Lambda functions in our example solution.

How to define your response automation

Now that we’ve introduced the concept of security response automation, start thinking about security requirements within your environment that you’d like to enforce through automation. These design requirements might come from general best practices you’d like to follow, or they might be specific controls from compliance frameworks relevant for your business.

Customers start with the run-books they already use as part of their Incident Response Lifecycle. Simple run-books, like responding to an exfiltrated credential, can be quickly mapped to automation especially if your run book calls for the disabling of the credential and the notification of on-call personnel. But it can be resource driven as well. Events such as a new AWS VPC being created might trigger your automation to immediately deploy your company’s standard configuration for VPC flowlog collection.

Your objectives should be quantitative, not qualitative. Here are some examples of quantitative objectives:

  • Remote administrative network access to servers should be limited.
  • Server storage volumes should be encrypted.
  • AWS console logins should be protected by multi-factor authentication.

As an optional step, you can expand these objectives into user stories that define the conditions and remediation actions when there is an event. User stories are informal descriptions that briefly document a feature within a software system. User stories may be global and span across multiple applications or they may be specific to a single application.

For example:

“Remote administrative network access to servers should have limited access from internal trusted networks only. Remote access ports include SSH TCP port 22 and RDP TCP port 3389. If remote access ports are detected within the environment and they are accessible to outside resources, they should be automatically closed and the owner will be notified.”

Once you’ve completed your user story, you can determine how to use automated remediation to help achieve these objectives in your AWS environment. User stories should be stored in a location that provides versioning support and can reference the associated automation code.

You should carefully consider the effect of your remediation mechanisms in order to help prevent unintended impact on your resources and applications. Remediation actions such as instance termination, credential revocation, and security group modification can adversely affect application availability. Depending on the level of risk that’s acceptable to your organization, your automated mechanism can only provide a notification which would then be manually investigated prior to remediation. Once you’ve identified an automated remediation mechanism, you can build out the required components and test them in a non-production environment.

Sample response automation walkthrough

In the following section, we’ll walk you through an automated remediation for a simulated event that indicates potential unauthorized activity—the unintended disabling of CloudTrail logging. Outside parties might want to disable logging to avoid detection and the recording of their unauthorized activity. Our response is to re-enable the CloudTrail logging and immediately notify the security contact. Here’s the user story for this scenario:

“CloudTrail logging should be enabled for all AWS accounts and regions. If CloudTrail logging is disabled, it will automatically be enabled and the security operations team will be notified.”

A note about the sample response automation below as it references Amazon EventBridge: EventBridge was formerly referred to as Amazon CloudWatch Events. If you see other documentation referring to Amazon CloudWatch, you can find that configuration now via the Amazon EventBridge console page.

Additionally, we will be looking at this scenario through the lens of an account that has a stand-alone CloudTrail configuration. While this is an acceptable configuration, AWS recommends using AWS Organizations, which allows you to configure an organizational CloudTrail. These organizational trails are immutable to the child accounts so that logging data cannot be removed or tampered with.

In order to use our sample remediation, you will need to enable Amazon GuardDuty and AWS Security Hub in the AWS Region you have selected. Both of these services include a 30-day trial at no additional cost. See the AWS Security Hub pricing page and the Amazon GuardDuty pricing page for additional details.

Important: You’ll use AWS CloudTrail to test the sample remediation. Running more than one CloudTrail trail in your AWS account will result in charges based on the number of events processed while the trail is running. Charges for additional copies of management events recorded in a Region are applied based on the published pricing plan. To minimize the charges, follow the clean-up steps that we provide later in this post to remove the sample automation and delete the trail.

Deploy the sample response automation

In this section, we’ll show you how to deploy and test the CloudTrail logging remediation sample. Amazon GuardDuty generates the finding

Stealth:IAMUser/CloudTrailLoggingDisabled when CloudTrail logging is disabled, and AWS Security Hub collects findings from GuardDuty using the standardized finding format mentioned earlier. We recommend that you deploy this sample into a non- production AWS account.

Select the Launch Stack button below to deploy a CloudFormation template with an automation sample in the us-east-1 Region. You can also download the template and implement it in another Region. The template consists of an Amazon EventBridge rule, an AWS Lambda function, and the IAM permissions necessary for both components to execute. It takes several minutes for the CloudFormation stack build to complete.

Select the Launch Stack button to launch the template

  1. In the CloudFormation console, choose the Select Template form, and then select Next.
  2. On the Specify Details page, provide the email address for a security contact. For the purpose of this walkthrough, it should be an email address that you have access to. Then select Next.
  3. On the Options page, accept the defaults, then select Next.
  4. On the Review page, confirm the details, then select Create.
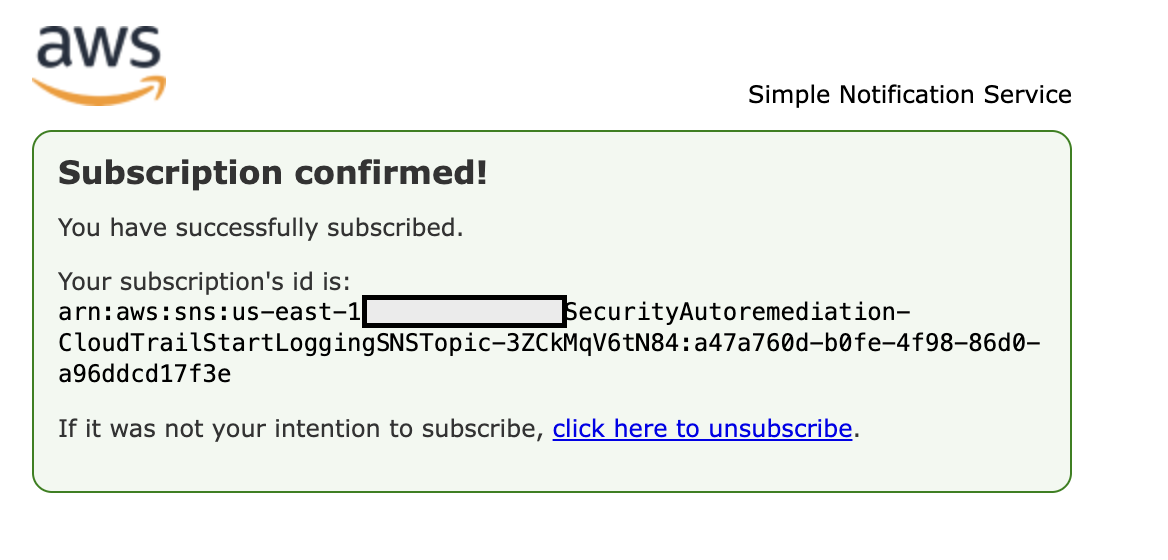
  5. While the stack is being created, check the inbox of the email address that you provided in step 2. Look for an email message with the subject AWS Notification – Subscription Confirmation. Select the link in the body of the email to confirm your subscription to the Amazon Simple Notification Service (Amazon SNS) topic. You should see a success message like the one shown in Figure 3:

    Figure 3: SNS subscription confirmation

    Figure 3: SNS subscription confirmation

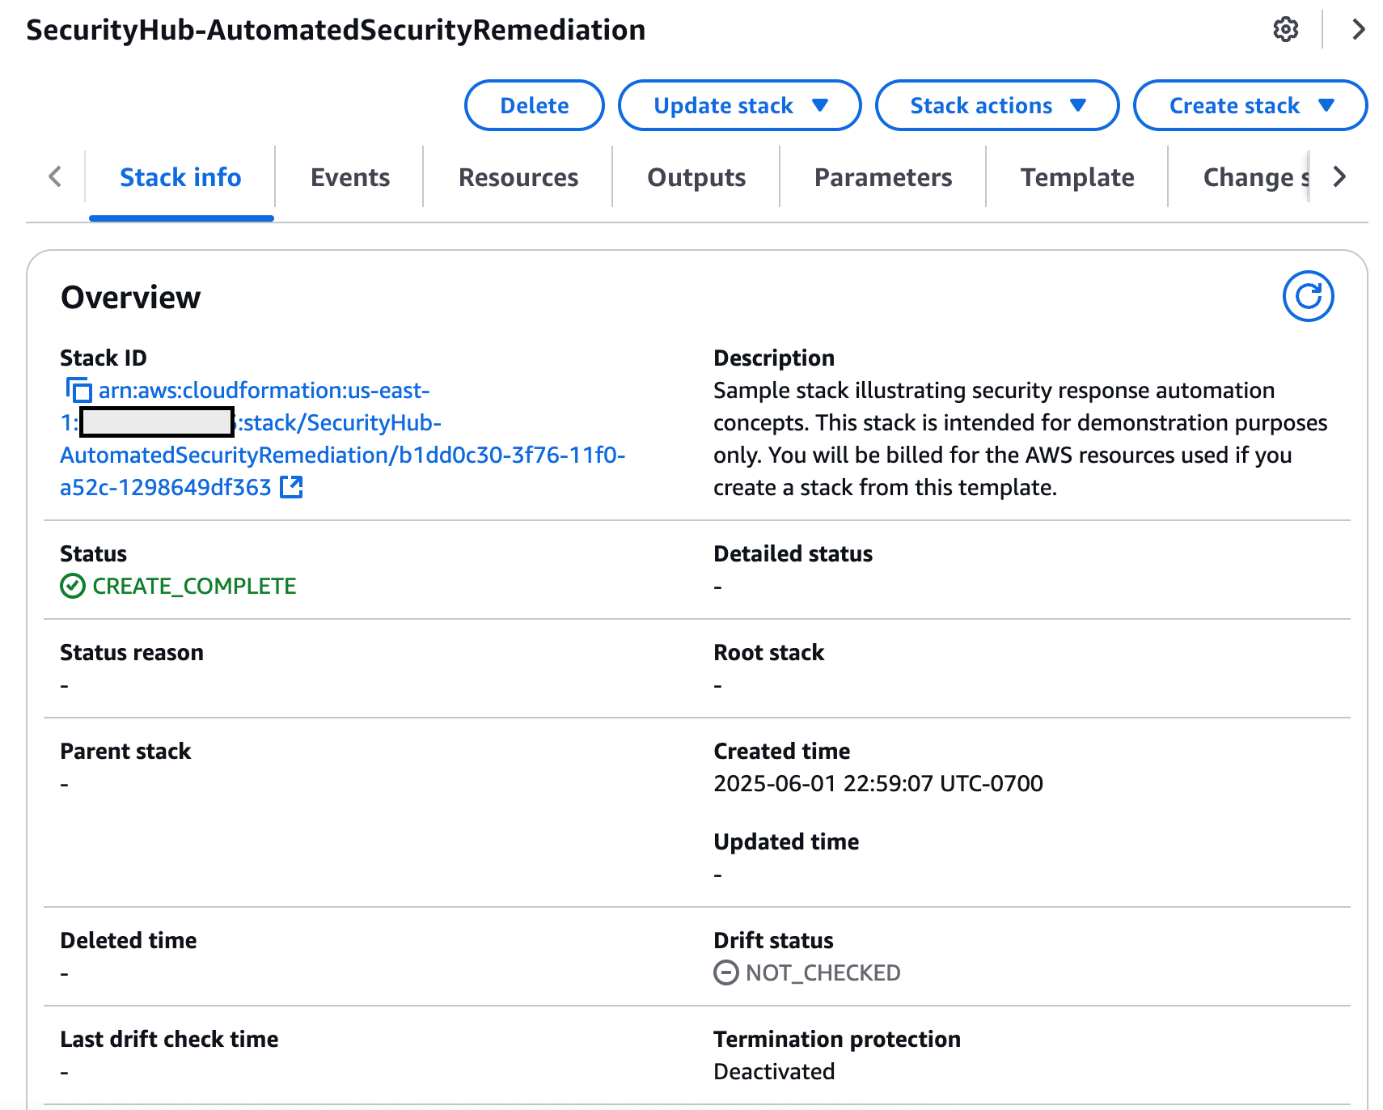
  6. Return to the CloudFormation console. After the Status field for the CloudFormation stack changes to CREATE COMPLETE (as shown in Figure 4), the solution is implemented and is ready for testing.

    Figure 4: CREATE_COMPLETE status

    Figure 4: CREATE_COMPLETE status

Test the sample automation

You’re now ready to test the automated response by creating a test trail in CloudTrail, then trying to stop it.

  1. From the AWS Management Console, choose Services > CloudTrail.
  2. Select Trails, then select Create Trail.
  3. On the Create Trail form:
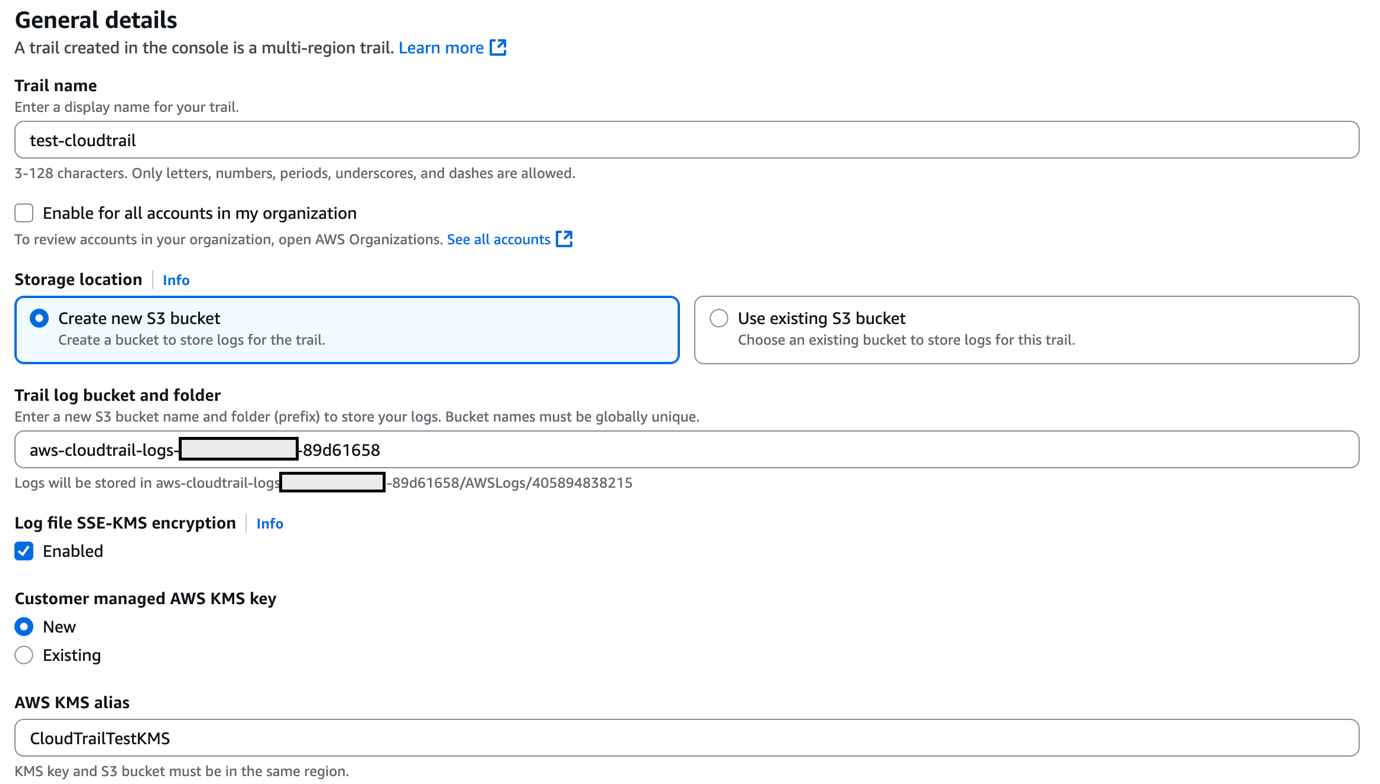
    1. Enter a value for Trail name and for AWS KMS alias, as shown in Figure 5.
    2. For Storage location, create a new S3 bucket or choose an existing one. For our testing, we create a new S3 bucket.

      Figure 5: Create a CloudTrail trail

      Figure 5: Create a CloudTrail trail

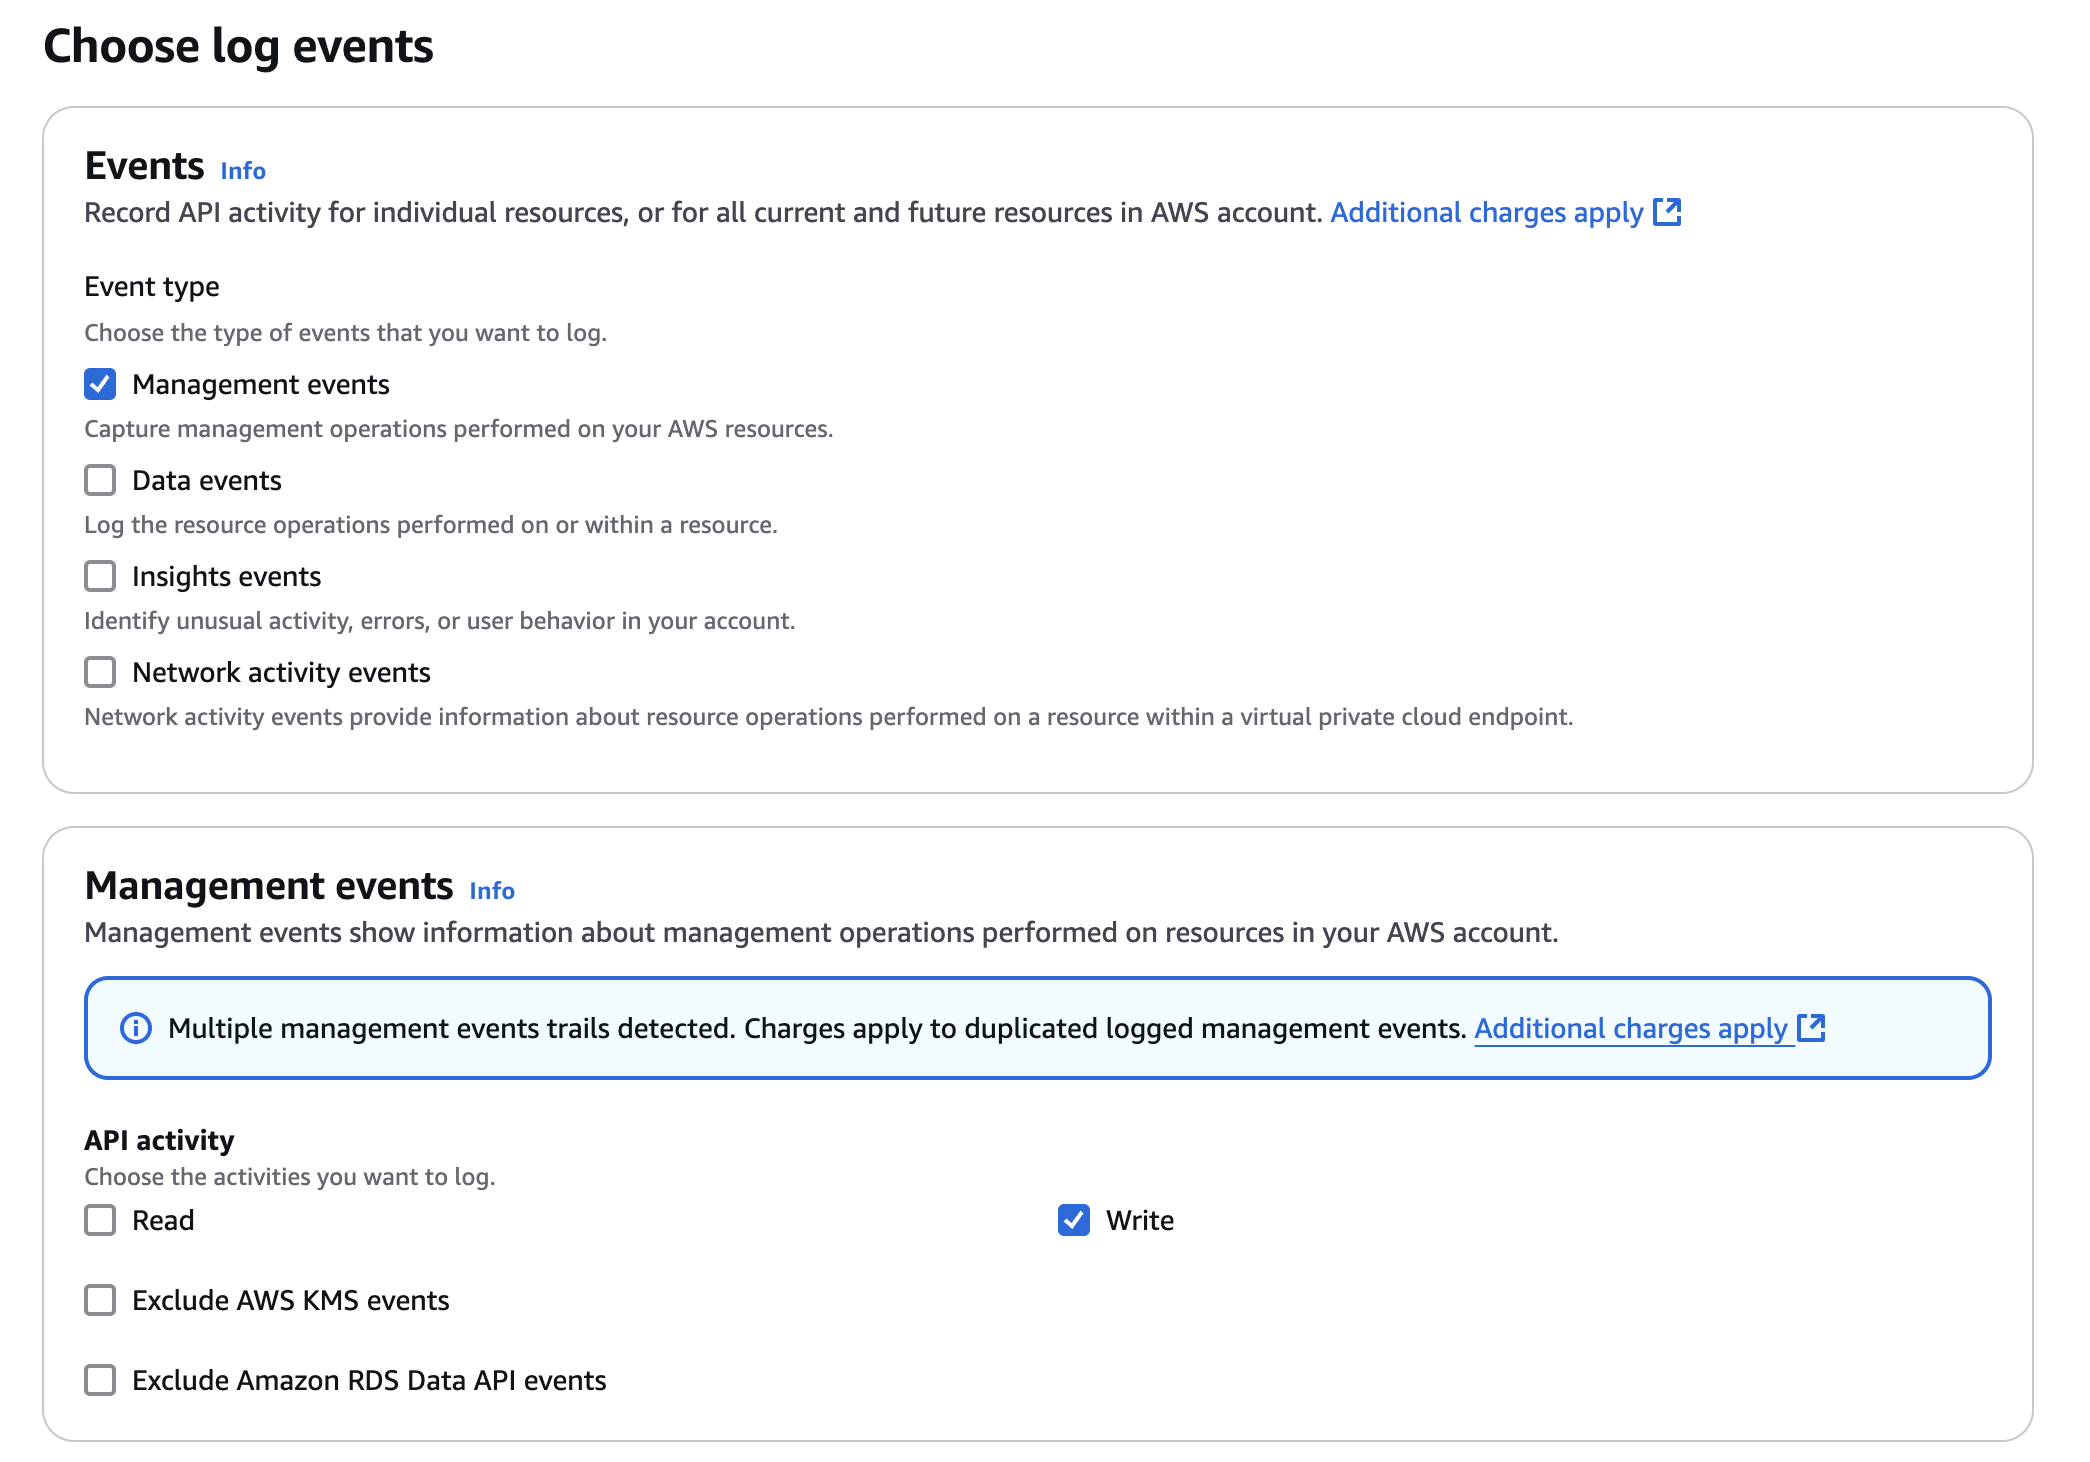
    3. On the next page, under Management events, select Write-only (to minimize event volume).

      Figure 6: Create a CloudTrail trail

      Figure 6: Create a CloudTrail trail

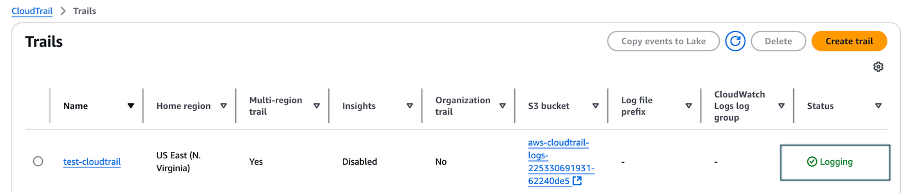
  4. On the Trails page of the CloudTrail console, verify that the new trail has started. You should see the status as logging, as shown in Figure 7.

    Figure 7: Verify new trail has started

    Figure 7: Verify new trail has started

  5. You’re now ready to act like an unauthorized user trying to cover their tracks. Stop the logging for the trail that you just created:
    1. Select the new trail name to display its configuration page.
    2. In the top-right corner, choose the Stop logging button.
    3. When prompted with a warning dialog box, select Stop logging.
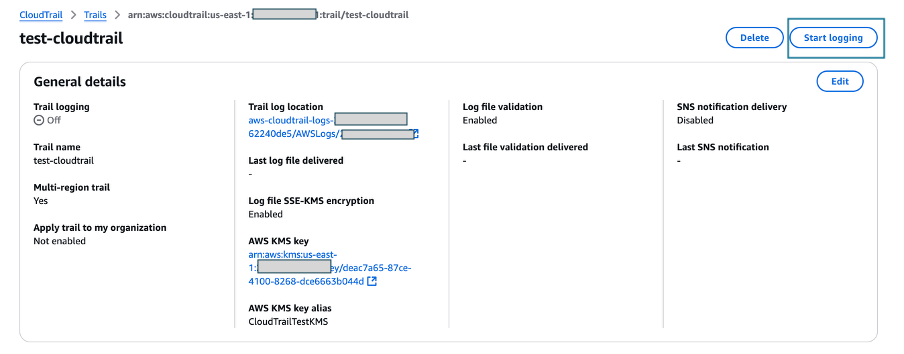
    4. Verify that the logging has stopped by confirming that the Start logging button now appears in the top right, as shown in Figure 8.

      Figure 8: Verify logging switch is off

      Figure 8: Verify logging switch is off

    You have now simulated a security event by disabling logging for one of the trails in the CloudTrail service. Within the next few seconds, the near real-time automated response will detect the stopped trail, restart it, and send an email notification. You can refresh the Trails page of the CloudTrail console to verify through the Stop logging button at the top right corner.

    Within the next several minutes, the investigatory automated response will also begin. GuardDuty will detect the action that stopped the trail and enrich the data about the source of unexpected behavior. Security Hub will then ingest that information and optionally correlate with other security events.

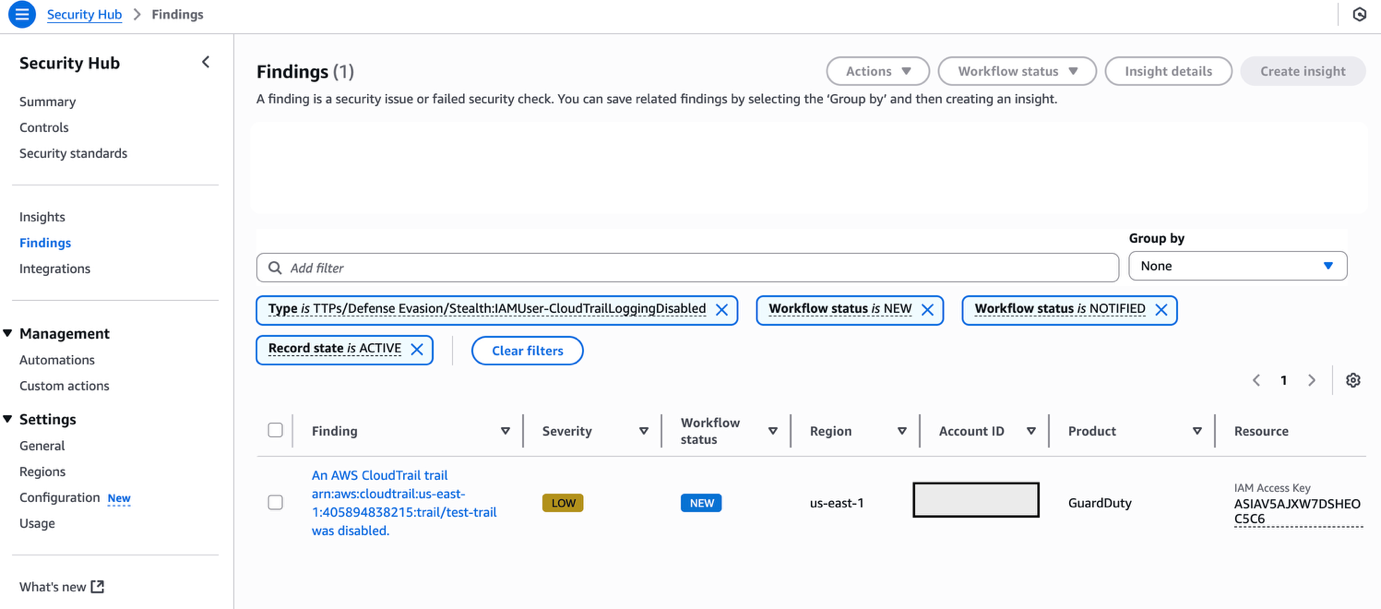
    Following the steps below, you can monitor findings within Security Hub for the finding type TTPs/Defense Evasion/Stealth:IAMUser-CloudTrailLoggingDisabled to be generated:

  6. In the AWS Management Console, choose Services > Security Hub.
    1. In the left pane, select Findings.
    2. Select the Add filters field, then select Type.
    3. Select EQUALS, paste TTPs/Defense Evasion/Stealth:IAMUser-CloudTrailLoggingDisabled into the field, then select Apply.
    4. Refresh your browser periodically until the finding is generated.
    Figure 9: Monitor Security Hub for your finding

    Figure 9: Monitor Security Hub for your finding

  7. Select the title of the finding to review details. When you’re ready, you can choose to archive the finding by selecting the Archive link. Alternately, you can select a custom action to continue with the response. Custom actions are one of the ways that you can integrate Security Hub with custom partner solutions.

Now that you’ve completed your review of the finding, let’s dig into the components of automation.

How the sample automation works

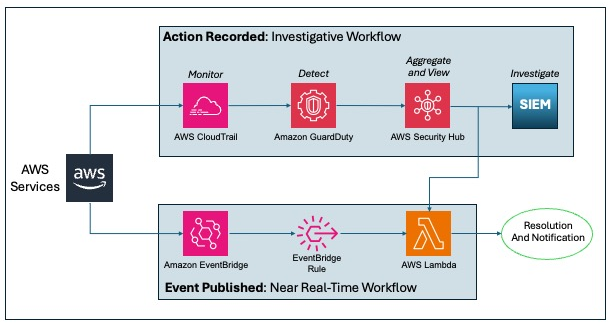
This example incorporates two automated responses: a near real-time workflow and an investigatory workflow. The near real-time workflow provides a rapid response to an individual event, in this case the stopping of a trail. The goal is to restore the trail to a functioning state and alert security responders as quickly as possible. The investigatory workflow still includes a response to provide defense in depth and uses services that support a more in-depth investigation of the incident.

Figure 10: Sample automation workflow

Figure 10: Sample automation workflow

In the near real-time workflow, Amazon EventBridge monitors for the undesired activity.

When a trail is stopped, AWS CloudTrail publishes an event on the EventBridge bus. An EventBridge rule detects the trail-stopping event and invokes a Lambda function to respond to the event by restarting the trail and notifying the security contact via an Amazon Simple Notification Service (SNS) topic.

In the investigative workflow, CloudTrail logs are monitored for undesired activities. For example, if a trail is stopped, there will be a corresponding log record. GuardDuty detects this activity and retrieves additional data points regarding the source IP that executed the API call. Two common examples of those additional data points in GuardDuty findings include whether the API call came from an IP address on a threat list, or whether it came from a network not commonly used in your AWS account. An AWS Lambda function responds by restarting the trail and notifying the security contact. The finding is imported into AWS Security Hub, where it’s aggregated with other findings for analyst viewing. Using EventBridge, you can configure Security Hub to export the finding to partner security orchestration tools, SIEM (security information and event management) systems, and ticketing systems for investigation.

AWS Security Hub imports findings from AWS security services such as GuardDuty, Amazon Macie and Amazon Inspector, plus from third-party product integrations you’ve enabled. Findings are provided to Security Hub in AWS Security Finding Format (ASFF), which minimizes the need for data conversion. Security Hub correlates these findings to help you identify related security events and determine a root cause. Security Hub also publishes its findings to Amazon EventBridge to enable further processing by other AWS services such as AWS Lambda. You can also create custom actions using Security Hub. Custom actions are useful for security analysts working with the Security Hub console who want to send a specific finding, or a small set of findings, to a response or a remediation workflow.

Deeper look into how the “Respond” phase works

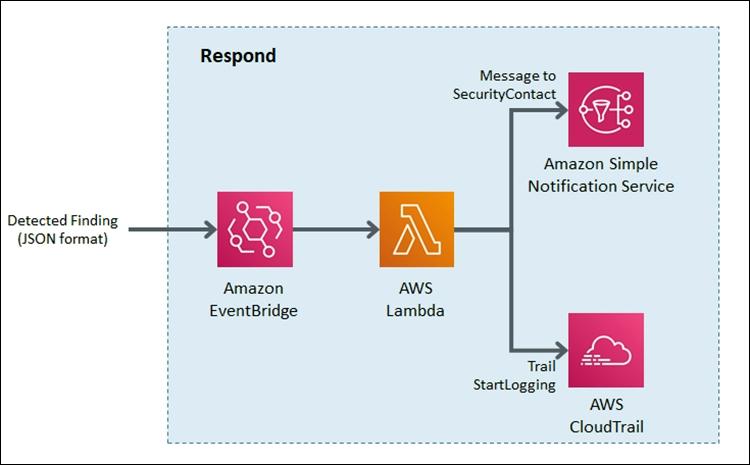
Amazon EventBridge and AWS Lambda work together to respond to a security finding.

Amazon EventBridge is a service that provides real-time access to changes in data in AWS services, your own applications, and Software-as-a-Service (SaaS) applications without writing code. In this example, EventBridge identifies a Security Hub finding that requires action and invokes a Lambda function that performs remediation. As shown in Figure 11, the Lambda function both notifies the security operator via SNS and restarts the stopped CloudTrail.

Figure 11: Sample “respond” workflow

Figure 11: Sample “respond” workflow

To set this response up, we looked for an event to indicate that a trail had stopped or was disabled. We knew that the GuardDuty finding Stealth:IAMUser/CloudTrailLoggingDisabled is raised when CloudTrail logging is disabled. Therefore, we configured the default event bus to look for this event.

You can learn more regarding the available GuardDuty findings in the user guide.

How the code works

When Security Hub publishes a finding to EventBridge, it includes full details of the finding as discovered by GuardDuty. The finding is published in JSON format. If you review the details of the sample finding, note that it has several fields helping you identify the specific events that you’re looking for. Here are some of the relevant details:

{
   …
   "source":"aws.securityhub",
   …
   "detail":{
      "findings": [{
		…
    	“Types”: [
			"TTPs/Defense Evasion/Stealth:IAMUser-CloudTrailLoggingDisabled"
			],
		…
      }]
}

You can build an event pattern using these fields, which an EventBridge filtering rule can then use to identify events and to invoke the remediation Lambda function. Below is a snippet from the CloudFormation template we provided earlier that defines that event pattern for the EventBridge filtering rule:

# pattern matches the nested JSON format of a specific Security Hub finding
      EventPattern:
        source:
        - aws.securityhub
        detail-type:
          - "Security Hub Findings - Imported"
        detail:
          findings:
            Types:
              - "TTPs/Defense Evasion/Stealth:IAMUser-CloudTrailLoggingDisabled"

Once the rule is in place, EventBridge continuously monitors the event bus for events with this pattern.

When EventBridge finds a match, it invokes the remediating Lambda function and passes the full details of the event to the function. The Lambda function then parses the JSON fields in the event so that it can act as shown in this Python code snippet:

# extract trail ARN by parsing the incoming Security Hub finding (in JSON format)
trailARN = event['detail']['findings'][0]['ProductFields']['action/awsApiCallAction/affectedResources/AWS::CloudTrail::Trail']   

# description contains useful details to be sent to security operations
description = event['detail']['findings'][0]['Description']

The code also issues a notification to security operators so they can review the findings and insights in Security Hub and other services to better understand the incident and to decide whether further manual actions are warranted. Here’s the code snippet that uses SNS to send out a note to security operators:

#Sending the notification that the AWS CloudTrail has been disabled.
snspublish = snsclient.publish(
	TargetArn = snsARN,
	Message="Automatically restarting CloudTrail logging.  Event description: \"%s\" " %description
	)

While notifications to human operators are important, the Lambda function will not wait to take action. It immediately remediates the condition by restarting the stopped trail in CloudTrail. Here’s a code snippet that restarts the trail to reenable logging:

try:
	client = boto3.client('cloudtrail')
	enablelogging = client.start_logging(Name=trailARN)
	logger.debug("Response on enable CloudTrail logging- %s" %enablelogging)
except ClientError as e:
	logger.error("An error occured: %s" %e)

After the trail has been restarted, API activity is once again logged and can be audited.

This can help provide relevant data for the remaining steps in the incident response process. The data is especially important for the post-incident phase, when your team analyzes lessons learned to help prevent future incidents. You can also use this phase to identify additional steps to automate in your incident response.

How to Enable Custom Action and build your own Automated Response

Unlike how you set up the notification earlier, you may not want fully automate responses to findings. To set up automation that you can manually trigger it for specific findings, you can use custom actions. A custom action is a Security Hub mechanism for sending selected findings to EventBridge that can be matched by an EventBridge rule. The rule defines a specific action to take when a finding is received that is associated with the custom action ID. Custom actions can be used, for example, to send a specific finding, or a small set of findings, to a response or remediation workflow. You can create up to 50 custom actions.

In this section, we will walk you through how to create a custom action in Security Hub which will trigger an EventBridge rule to execute a Lambda function for the same security finding related to CloudTrail Disabled.

Create a Custom Action in Security Hub

  1. Open Security Hub. In the left navigation pane, under Management, open the Custom actions page.
  2. Choose Create custom action.
  3. Enter an Action Name, Action Description, and Action ID that are representative of an action that you are implementing—for example Enable CloudTrail Logging.
  4. Choose Create custom action.
  5. Copy the custom action ARN that was generated. You will need it in the next steps.

Create Amazon EventBridge Rule to capture the Custom Action

In this section, you will define an EventBridge rule that will match events (findings) coming from Security Hub which were forwarded by the custom action you defined above.

  1. Navigate to the Amazon EventBridge console.
  2. On the right side, choose Create rule.
  3. On the Define rule detail page, give your rule a name and description that represents the rule’s purpose (for example, the same name and description that you used for the custom action). Then choose Next.
  4. Security Hub findings are sent as events to the AWS default event bus. In the Define pattern section, you can identify filters to take a specific action when matched events appear. For the Build event pattern step, leave the Event source set to AWS events or EventBridge partner events.
  5. Scroll down to Event pattern. Under Event source, leave it set to AWS Services, and under AWS Service, select Security Hub.
  6. For the Event Type, choose Security Hub Findings – Custom Action.
  7. Then select Specific custom action ARN(s) and enter the ARN for the custom action that you created earlier.
  8. Notice that as you selected these options, the event pattern on the right was updating. Choose Next.
  9. On the Select target(s) step, from the Select a target dropdown, select Lambda function. Then, from the Function dropdown, select SecurityAutoremediation-CloudTrailStartLoggingLamb-xxxx. This lambda function was created as part of the Cloudformation template.
  10. Choose Next.
  11. For the Configure tags step, choose Next.
  12. For the Review and create step, choose Create rule.

Trigger the automation

As GuardDuty and Security Hub have been enabled, after AWS Cloudtrail logging is enabled, you should see a security finding generated by Amazon GuardDuty and collected in AWS Security Hub.

  1. Navigate to the Security Hub Findings page.
  2. In the top corner, from the Actions dropdown menu, select the Enable CloudTrail Logging custom action.
  3. Verify the CloudTrail configuration by accessing the AWS CloudTrail dashboard.
  4. Confirm that the trail status displays as Logging, which indicates the successful execution of the remediation Lambda function triggered by the EventBridge rule through the custom action.

How AWS helps customers get started

Many customers look at the task of building automation remediation as daunting. Many operations teams might not have the skills or human scale to take on developing automation scripts. Because many Incident Response scenarios can be mapped to findings in AWS security services, we can begin building tools that respond and are quickly adaptable to your environment.

Automated Security Response (ASR) on AWS is a solution that enables AWS Security Hub customers to remediate findings with a single click using sets of predefined response and remediation actions called Playbooks. The remediations are implemented as AWS Systems Manager automation documents. The solution includes remediations for issues such as unused access keys, open security groups, weak account password policies, VPC flow logging configurations, and public S3 buckets. Remediations can also be configured to trigger automatically when findings appear in AWS Security Hub.

The solution includes the playbook remediations for some of the security controls defined as part of the following standards:

  • AWS Foundational Security Best Practices (FSBP) v1.0.0
  • Center for Internet Security (CIS) AWS Foundations Benchmark v1.2.0
  • Center for Internet Security (CIS) AWS Foundations Benchmark v1.4.0
  • Center for Internet Security (CIS) AWS Foundations Benchmark v3.0.0
  • Payment Card Industry (PCI) Data Security Standard (DSS) v3.2.1
  • National Institute of Standards and Technology (NIST) Special Publication 800-53 Revision 5

A Playbook called Security Control is included that allows operation with AWS Security Hub’s Consolidated Control Findings feature.

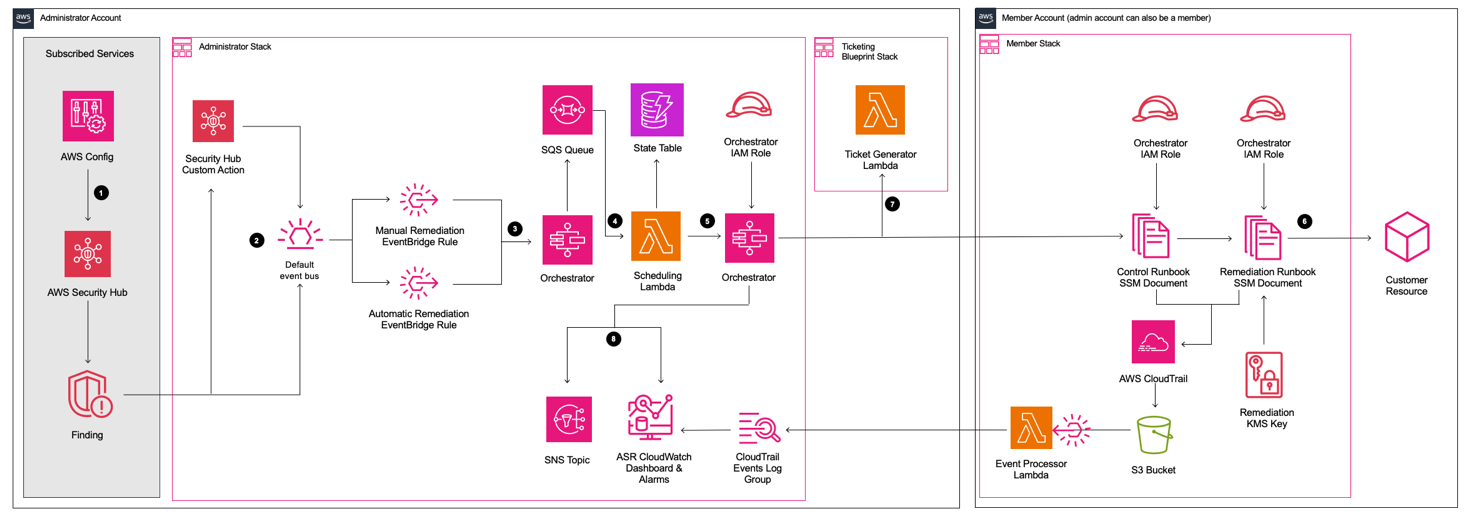
Figure 12: Architecture of the Automated Security Solution

Figure 12: Architecture of the Automated Security Solution

Additionally, the library includes instructions in the Implementation Guide on how to create new automations in an existing Playbook.

You can use and deploy this library into your accounts at no additional cost, however there are costs associated with the services that it consumes.

Clean up

After you’ve completed the sample security response automation, we recommend that you remove the resources created in this walkthrough example from your account in order to minimize the charges associated with the trail in CloudTrail and data stored in S3.

Important: Deleting resources in your account can negatively impact the applications running in your AWS account. Verify that applications and AWS account security do not depend on the resources you’re about to delete.

Here are the clean-up steps:

Summary

You’ve learned the basic concepts and considerations behind security response automation on AWS and how to use Amazon EventBridge, Amazon GuardDuty and AWS Security Hub to automatically re-enable AWS CloudTrail when it becomes disabled unexpectedly. Additionally you got a chance to learn about the AWS Automated Security Response library and how it can help you rapidly get started with automations through Security Hub. As a next step, you may want to start building your own custom response automations and dive deeper into the AWS Security Incident Response Guide, NIST Cybersecurity Framework (CSF) or the AWS Cloud Adoption Framework (CAF) Security Perspective. You can explore additional automatic remediation solutions on the AWS Solution Library. You can find the code used in this example on GitHub.

If you have feedback about this blog post, submit them in the Comments section below. If you have questions about using this solution, start a thread in the
EventBridge, GuardDuty or Security Hub forums, or contact AWS Support.
Reduce EMR HBase upgrade downtime with the EMR read-replica prewarm feature

Post Syndicated from Suthan Phillips original https://aws.amazon.com/blogs/big-data/reduce-emr-hbase-upgrade-downtime-with-the-emr-read-replica-prewarm-feature/

HBase clusters on Amazon Simple Storage Service (Amazon S3) need regular upgrades for new features, security patches, and performance improvements. In this post, we introduce the EMR read-replica prewarm feature in Amazon EMR and show you how to use it to minimize HBase upgrade downtime from hours to minutes using blue-green deployments. This approach works well for single-cluster deployments where minimizing service interruption during infrastructure changes is important.

Understanding HBase operational challenges

HBase cluster upgrades have required complete cluster shutdowns, resulting in extended downtime while regions initialize and RegionServers come online. Version upgrades require a complete cluster switchover, with time-consuming steps that include loading and verifying region metadata, performing HFile checks, and confirming proper region assignment across RegionServers. During this critical period—which can extend to hours depending on cluster size and data volume—your applications are completely unavailable.

The challenge doesn’t stop at version upgrades. You must regularly apply security patches and kernel updates to maintain compliance. For Amazon EMR 7.0 and later clusters running on Amazon Linux 2023, instances don’t automatically install security updates after launch; they remain at the patch level from cluster creation time. AWS recommends periodically recreating clusters with newer AMIs, requiring the same hard cutover and downtime risks as a full version upgrade. Similarly, when you need to use different instance types, traditional approaches mean taking your cluster offline.

Solution overview

Amazon EMR 7.12 introduces read-replica prewarm, a new feature that tackles these challenges. This feature lets you make infrastructure changes to Apache HBase on Amazon S3 at scale while reducing downtime risk and maintaining data consistency.

With read-replica prewarm, you can prepare and validate your changes in a read-replica cluster before promoting it to active status, cutting service interruption from hours to minutes. You will learn how to prepare your read-replica cluster with the target version, execute cutover procedures that minimize downtime, and verify successful migration before completing the switchover.

Read-replica prewarm architecture

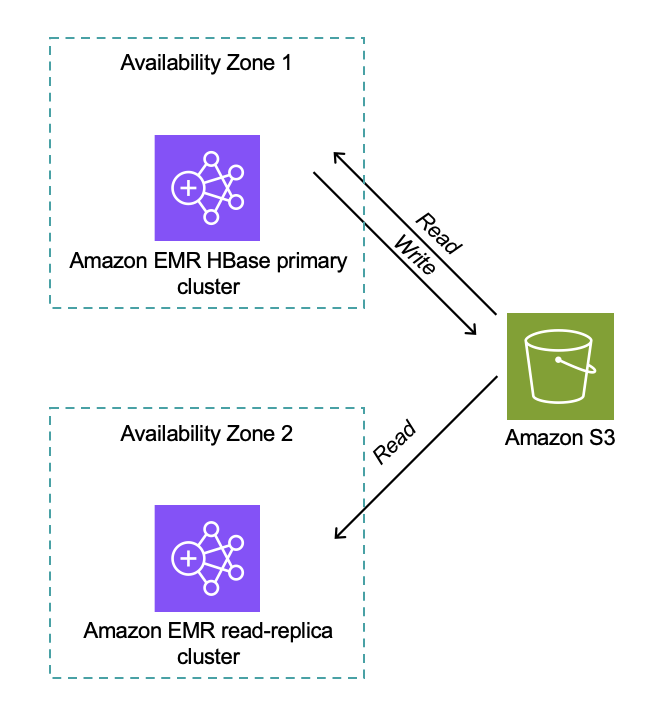
The following diagram shows the architecture and workflow. Both primary and read-replica clusters interact with the same Amazon S3 storage, accessing the same S3 bucket and root directory.

Amazon EMR HBase architecture diagram showing primary cluster in Availability Zone 1 with read/write access to Amazon S3, and read-replica cluster in Availability Zone 2 with read access to S3.

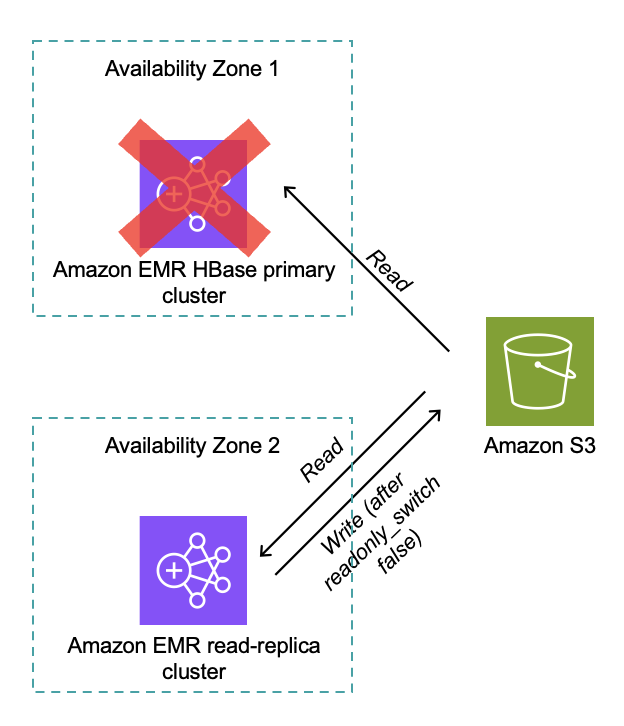
Distributed locking confirms only one HBase cluster can write at a time (for clusters version 7.12.0 and later). The read-replica cluster performs full HBase region initialization without time pressure, and after promotion, the read replica becomes the active writer as shown in the following diagram.

Amazon EMR HBase failover scenario showing primary cluster unavailable in Availability Zone 1, with read-replica cluster in Availability Zone 2 promoted to handle read and write operations after failover.

Implementation steps HBase cluster upgrade

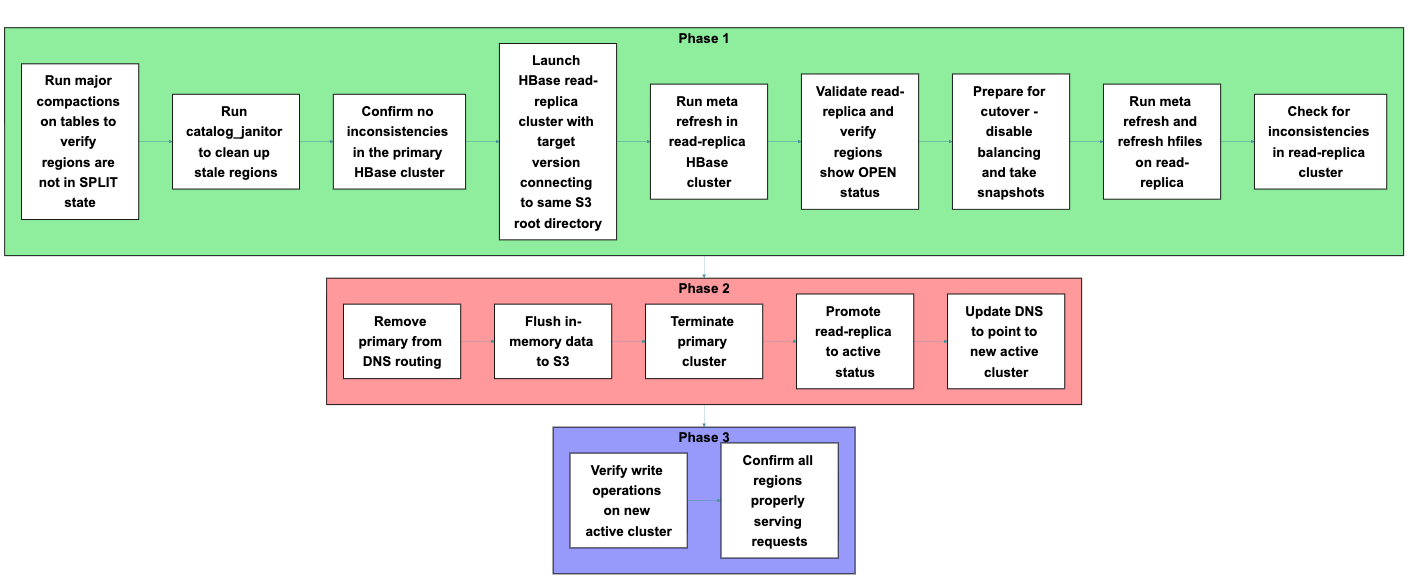
Now that you understand how read-replica prewarm works and the architecture behind it, let’s put this knowledge into practice. You will follow a process that consists of three main phases: preparation, cutover, and verification. Each phase includes specific steps, shown in the following figure, that you will execute in sequence to complete the migration.

Process flow diagram showing three-phase HBase cluster migration: Phase 1 preparation and validation, Phase 2 cutover and DNS update, Phase 3 post-migration verification.

Phase 1: Preparation

Before starting the migration, prepare both your primary cluster and launch a new read-replica cluster. Each step in this phase builds toward confirming that your new cluster can properly access and serve your existing data.

  1. Run major compactions on tables to verify regions are not in SPLIT state
    Run major compactions to consolidate data files and verify regions are not in SPLIT state. Split regions can cause assignment conflicts during migration, so resolving them at the start helps maintain cluster stability throughout the transition.

    echo “major_compact 'tablename'” | hbase shell

  2. Run catalog_janitor to clean up stale regions
    Execute the catalog_janitor process (HBase’s built-in maintenance tool) to remove stale region references from the metadata. Cleaning up these references prevents confusion during region assignment in the read-replica cluster.

    echo “catalogjanitor_run” | hbase shell

  3. Confirm no inconsistencies in the primary HBase cluster
    Verify cluster integrity before migration:

    sudo -u hbase hbase hbck > hbck_report.txt

    Running the HBase Consistency Check tool version 2 (HBCK2) performs a diagnostic scan that identifies and reports problems in metadata, regions, and table states, confirming your cluster is ready for migration.

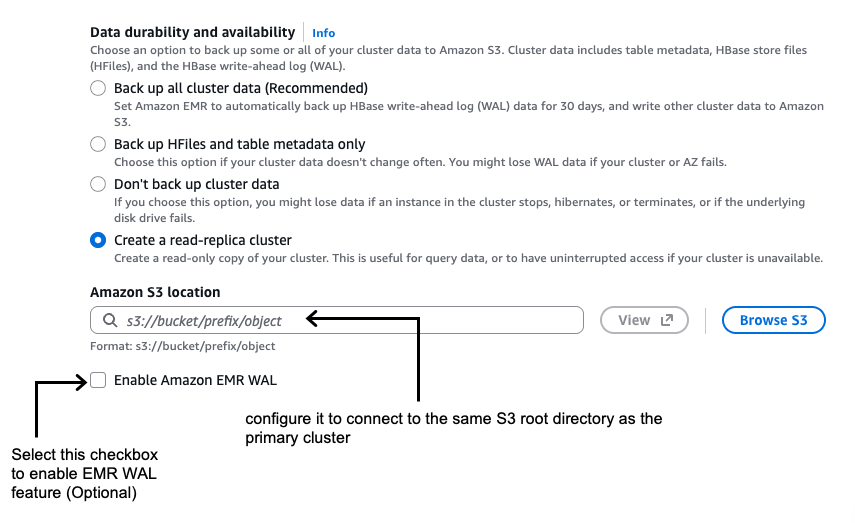
  4. Launch HBase read-replica cluster with the target version connecting to the same HBase root directory in Amazon S3 as the primary cluster
    Launch a new HBase cluster with the target version and configure it to connect to the same S3 root directory as the primary cluster. Confirm that read-only mode is enabled by default as shown in the following screenshot.

    AWS console screenshot showing Amazon EMR data durability and availability configuration options, with "Create a read-replica cluster" option selected and S3 location settings.

    If you are using AWS Command Line Interface (AWS CLI), you can enable the read replica while launching the Amazon EMR HBase on the Amazon S3 cluster by setting the hbase.emr.readreplica.enabled.v2 parameter to true in the HBase classification as shown in the following example:

    {
        "Classification": "hbase",
        "Properties": {
          "hbase.emr.readreplica.enabled.v2": "true",
          "hbase.emr.storageMode": "s3"
        }
    }

  5. Run meta refresh in this read-replica HBase cluster
    echo "refresh_meta" | hbase shell

    You’re creating a parallel environment with the new version that can access existing data without modification risk, allowing validation before committing to the upgrade.

  6. Validate the read-replica and verify that regions show OPEN status and are properly assigned:
    Execute sample read operations against your key tables to confirm the read replica can access your data correctly. In the HBase Master UI, verify that regions show OPEN status and are properly assigned to RegionServers. You should also confirm that the total data size matches your previous cluster to verify complete data visibility.
  7. Prepare for cutover on primary cluster
    Disable balancing and compactions on the primary cluster:

    echo "balance_switch false" | hbase shell
    echo "compaction_switch false" | hbase shell

    Preventing background operations from changing data layout or triggering region movements maintains a consistent state during the migration window.

    Take snapshots of your tables for rollback capability:

    # For each table
    echo "snapshot 'table_name', 'table_name_pre_migration_$(date +%Y%m%d)'" | hbase shell
    # For system tables
    echo "snapshot 'hbase:meta', 'meta_pre_migration_$(date +%Y%m%d)'" | hbase shell
    echo "snapshot 'hbase:namespace', 'namespace_pre_migration_$(date +%Y%m%d)'" | hbase shell

    These snapshots enable point-in-time recovery if you discover issues after migration.

  8. Run meta refresh and refresh hfiles on the read replica:
    echo "refresh_meta" | hbase shell
    hbase org.apache.hadoop.hbase.client.example.RefreshHFilesClient "table_name'"

    Refreshing confirms the read replica has the most current region assignments, table structure, and HFile references before taking over production traffic.

  9. Check for inconsistencies in the read-replica cluster
    Run the HBCK2 tool on the read-replica cluster to identify potential issues:

    sudo -u hbase hbase hbck > hbck_report.txt

    When a read replica is created, both the primary and replica clusters show metadata inconsistencies referencing each other’s meta folders: “There is a hole in the region chain”. The primary cluster complains about meta_<read-replica-cluster-id>, while the read replica complains about the primary’s meta folder. This inconsistency doesn’t impact cluster operations but shows up in hbck reports. For a clean hbck report after switching to the read replica and terminating the primary cluster, manually delete the old primary’s meta folder from Amazon S3 after taking a backup of it.

    Additionally, check the HBase Master UI to visually confirm cluster health. Verifying the read-replica cluster has a clean, consistent state before promotion prevents potential data access issues after cutover.

Phase 2: Cutover

Perform the actual migration by shutting down the primary cluster and promoting the read replica. The steps in this phase minimize the window when your cluster is unavailable to applications.

  1. Remove the primary cluster from DNS routing
    Update DNS entries to direct traffic away from the primary cluster, preventing new requests from reaching it during shutdown.
  2. Flush in-memory data to Amazon S3
    Flush in-memory data to confirm durability in Amazon S3:

    # Flush application data  
    echo "flush 'usertable'" | hbase shell
    # Flush system tables
    echo "flush 'hbase:meta'" | hbase shell
    echo "flush 'hbase:namespace'" | hbase shell

    Flushing forces data still in memory (in MemStores, HBase’s write cache) to be written to persistent storage (Amazon S3), preventing data loss during the transition between clusters.

  3. Terminate the primary cluster
    Terminate the primary cluster after confirming the data is persisted to Amazon S3. This step releases resources and eliminates the possibility of split-brain scenarios where both clusters might accept writes to the same dataset.
  4. Promote the read replica to active status
    Convert the read replica to read-write mode:

    echo "readonly_switch false" | hbase shell  
    echo "readonly_state" | hbase shell  # Verify the switch was successful

    The promotion process automatically refreshes meta and HFiles, capturing final changes from the flush operations and confirming complete data visibility.

    When you promote the cluster, it transitions from read-only to read-write mode, allowing it to accept application write operations and fully replace the old cluster’s functionality.

  5. Update DNS to point to the new active cluster
    Update DNS entries to direct traffic to the new active cluster. Routing client traffic to the new cluster restores service availability and completes the migration from the application perspective.

Phase 3: Validation

With your new cluster now active, you’re ready to verify that everything is working correctly before declaring the migration complete.

Execute test write operations to confirm the cluster accepts writes properly. Check the HBase Master UI to verify regions are serving both read and write requests without errors. At this point, your migration to the new Amazon EMR release is complete, and your applications can connect to the new cluster and resume normal read-write operations.

Key benefits

The read-replica prewarm approach delivers several important advantages over traditional HBase upgrade methods. Most notably, you can reduce service interruption from hours to minutes by preparing your new cluster in parallel with your running production environment.

Before committing to the upgrade, you can thoroughly test that data is readable and accessible in the new version. The system loads and assigns regions before activation, eliminating the lengthy startup time that traditionally causes extended downtime. This pre-warming process means your new cluster is ready to serve traffic immediately upon promotion.

You also gain the ability to validate multiple aspects of your deployment before cutover, including data integrity, read performance, cluster stability, and configuration correctness. This validation happens while your production cluster continues serving traffic, reducing the risk of discovering issues during your maintenance window.

For testing and validation workflows, you can run parallel testing environment by creating multiple HBase read replicas. However, you should verify that only one HBase cluster remains in read-write mode to the Amazon S3 data store to prevent data corruption and consistency issues.

Rollback procedures

Always thoroughly test your HBase rollback procedures before implementing upgrades in production environments.

When rolling back HBase clusters in Amazon EMR, you have two primary options.

  • Option 1 involves launching a new cluster with the previous HBase version that points to the same Amazon S3 data location as the upgraded cluster. This approach is straightforward to implement, preserves data written before and after the upgrade attempt, and offers faster recovery with no additional storage requirements. However, it risks encountering data compatibility issues if the upgrade modified data formats or metadata structures, potentially leading to unexpected behavior.
  • Option 2 takes a more cautious approach by launching a new cluster with the previous HBase version and restoring from snapshots taken before the upgrade. This method guarantees a return to a known, consistent state, eliminates version compatibility risks, and provides complete isolation from corruption introduced during the upgrade process. The tradeoff is that data written after the snapshot was taken will be lost, and the restoration process requires more time and planning.

For production environments where data integrity is paramount, the snapshot-based approach (option 2) is generally preferred despite the potential for some data loss.

Considerations

  • Store file tracking migration: Migrating from Amazon EMR 7.3 (or earlier) requires disabling and dropping the hbase:storefile table on the primary cluster, then flushing metadata. When launching the new read-replica cluster, configure the DefaultStoreFileTracker implementation using the hbase.store.file-tracker.impl property. When operational, run change_sft commands to switch tables to FILE tracking method, providing seamless data file access during migration.
  • Multi-AZ deployments: Consider network latency and Amazon S3 access patterns when deploying read replicas across Availability Zones. Cross-AZ data transfer might impact read latency for the read-replica cluster.
  • Cost impact: Running parallel clusters during migration incurs additional infrastructure costs until the primary cluster is terminated.
  • Disabled tables: The disabled state of tables in the primary cluster is a cluster-specific administrative property that isn’t propagated to the read-replica cluster. If you want them disabled in the read replica, you must explicitly disable them.
  • Amazon EMR 5.x cluster upgrade: Direct upgrade from Amazon EMR 5.x to Amazon EMR 7.x using this feature isn’t supported because of the major HBase version change from 1.x to 2.x. For upgrading from Amazon EMR 5.x to Amazon EMR 7.x, follow the steps in our best practices: AWS EMR Best Practices – HBase Migration

Conclusion

In this post, we showed you how the read-replica prewarm feature of Amazon EMR 7.12 improves HBase cluster operations by minimizing the hard cutover constraints that make infrastructure changes challenging. This feature gives you a consistent blue-green deployment pattern that reduces risk and downtime for version upgrades and security patches.

When you can thoroughly validate changes before committing to them and reduce service interruption from hours to minutes, you can maintain HBase infrastructure more confidently and efficiently. You can now take a more proactive approach to cluster maintenance, security compliance, and performance optimization with greater confidence in your operational processes.

To learn more about Amazon EMR and HBase on Amazon S3, visit the Amazon EMR documentation. To get started with read replicas, see the HBase on Amazon S3 guide .


About the authors

Suthan Phillips

Suthan Phillips

Suthan is a Senior Analytics Architect at AWS, where he helps customers design and optimize scalable, high-performance data solutions that drive business insights. He combines architectural guidance on system design and scalability with best practices to provide efficient, secure implementation across data processing and experience layers. Outside of work, Suthan enjoys swimming, hiking, and exploring the Pacific Northwest.

Ramesh Kandasamy

Ramesh Kandasamy

Ramesh is an Engineering Manager at Amazon EMR. He is a long tenured Amazonian dedicated to solve distributed systems problems.

Mehul Gulati

Mehul Gulati

Mehul is a Software Development Engineer for Amazon EMR at Amazon Web Services. His expertise spans big data systems including HBase, Hive, Tez, and distributed storage solutions. His customer obsession and focus on reliability helps Amazon EMR deliver reliable and efficient big data processing capabilities to customers.

How Artera enhances prostate cancer diagnostics using AWS

Post Syndicated from Hariharan Ananthakrishnan original https://aws.amazon.com/blogs/architecture/how-artera-enhances-prostate-cancer-diagnostics-using-aws/

This post was co-written with Hariharan Ananthakrishnan from Artera.

Artificial intelligence (AI) and machine learning (ML) are transforming cancer diagnosis and treatment, enabling faster and more accurate decisions for patients. One company at the forefront of this transformation is Artera, a precision medicine company developing an AI-powered platform for cancer treatment planning. The U.S. Food and Drug Administration (FDA) has granted De Novo authorization for the ArteraAI Prostate, establishing it as the first and only AI-powered software authorized to prognosticate long-term outcomes for patients with nonmetastatic prostate cancer. The ArteraAI Prostate is now recognized as an FDA-regulated software as a medical device (SaMD). In this post, we explore how Artera used Amazon Web Services (AWS) to develop and scale their AI-powered prostate cancer test, accelerating time to results and enabling personalized treatment recommendations for patients.

Customer overview

Artera offers AI-enabled predictive and prognostic cancer tests, including the ArteraAI Prostate Test. This innovative test analyzes images of a patient’s biopsy to accurately predict the risk of localized cancer spreading as well as the likelihood a patient will benefit from specific therapies. This is the first test that can predict therapeutic benefit for patients with localized prostate cancer, and physicians can use it to make treatment decisions with more confidence, ultimately improving patient outcomes.

Artera is making significant strides in the field of precision medicine, operating in multiple regions. Recently, the FDA granted De Novo authorization for the ArteraAI Prostate platform, highlighting its potential to address unmet needs in cancer care. Since 2024, the ArteraAI Prostate Test has been considered the standard of care for localized prostate cancer, being included in the National Comprehensive Cancer Network Clinical Practice Guidelines in Oncology. The technology’s De Novo authorization establishes a new product code category for future AI-powered digital pathology risk-stratification tools, and it enables its implementation at the point of diagnosis at qualified pathology labs across multiple countries. This capability addresses a critical gap in prostate cancer care by reducing delays in delivering actionable insights at diagnosis, helping clinicians and patients make informed treatment decisions with greater confidence.

The challenge of matching treatment to patient

When patients are diagnosed with cancer, their next step is to determine the course of therapy that will yield the best outcome. Typically, more aggressive cancers require more aggressive therapy. However, it’s not always clear how aggressively the cancer may progress. Furthermore, patients respond differently to the same therapy based on their unique biological makeup. As a consequence, some patients with less aggressive disease are inadvertently overtreated, receiving unnecessary therapies involving a host of side effects, while others with more aggressive cancers are undertreated, leading to potentially worse outcomes.

Before Artera’s solution, there were no AI-based tools to help physicians and cancer patients make personalized, timely treatment decisions. Instead, physicians submitted a patient’s biopsy tissue sample to a lab, where a chemical assay measured the expression levels of a small set of genes. The RNA expression of these genes was then used to assess a patient’s risk level. These tests have several limitations:

  • The entire process can take 6 weeks—a long time to wait when making a high-stress decision about cancer therapy.
  • These tests typically only identify a small number of key genes (as science continues to advance faster than the diagnostic tests can keep up) linked to cancer risk.
  • These tests consume the original tissue samples, limiting the physician’s ability to order additional tests, as well as the patient’s ability to enroll in future clinical trials or participate in long-term monitoring

Developing an AI-powered diagnostic tool for cancer treatment presents unique technical challenges. Artera had to manage and process a large volume of high-resolution biopsy image files to power their AI-driven cancer diagnostics. These images are enormous, sometimes reaching 8 GB, and they need to be broken down into tens of thousands of smaller patches for the model to handle. Training Artera’s foundation models (FMs) requires serving millions of image patches at high volume to AWS servers.

Additionally, as a healthcare company handling sensitive patient data, Artera needed to ensure compliance and data residency and regulatory requirements across multiple countries, including the Health Insurance Portability and Accountability Act (HIPAA) in the United States. They needed a robust, scalable storage solution that would enable their ML engineers to focus on the core cancer research rather than infrastructure management.

Modern, scalable design delivers fast results

Artera implemented a comprehensive AWS based solution to address their challenges. The architecture follows a modern, scalable design that enables secure processing of sensitive medical data while delivering fast results to healthcare providers. Their solution starts with training AI models, advanced workflow orchestration, and data locality principles that are critical for global deployment of clinical AI models.

“Artera was founded with the belief that there were a lot of signals in the histopathology image data that were not being used, but if an AI algorithm could be specifically developed with this in mind, you could radically change cancer patient care,”

– Nathan Silberman, Chief Technology Officer of Artera.

The following architecture diagram illustrates how Artera has built a secure, scalable solution on AWS. At its core, Artera’s AI products are composed of many individual steps in a complex workflow, often involving multiple AI models that perform different specialized tasks. This sophisticated workflow orchestration helps them move faster and abstract away complexity as they build their compound AI system.

AWS architecture diagram showing medical professionals accessing ArteraAI portal through AWS Global Accelerator, WAF, load balancer, with ECS web portal and EKS AI inference cluster in a VPC, connected to data storage services and comprehensive security monitoring.

Comprehensive AWS architecture diagram showing the integration of cloud services for a medical professionals’ portal with AI inference capabilities, including data flow from end users through global acceleration services to compute, storage, and security infrastructure in a VPC within Region A.

Medical professionals access the Artera Portal, which serves as the interface for uploading biopsy images and receiving diagnostic results. AWS Global Accelerator sits in front of the Application Load Balancer, providing improved availability and performance by directing traffic through the AWS global network. Amazon CloudFront provides a fast, secure content delivery network for the portal’s static assets, providing low-latency access globally

Within a virtual private cloud (VPC), Elastic Load Balancing distributes incoming traffic across the application servers. Amazon Elastic Container Service (Amazon ECS) hosts the web portal containers, providing the user interface for healthcare professionals. An Amazon Elastic Kubernetes Service (Amazon EKS) cluster runs the AI/ML inference workloads that analyze biopsy images using computer vision models.

Amazon Elastic File System (Amazon EFS) provides shared file storage, accessible by both Amazon ECS and Amazon EKS for storing and processing biopsy images. Amazon Relational Database Service (Amazon RDS) delivers a managed relational database for patient records, diagnostic results, and application data with high availability. Amazon ElastiCache provides in-memory caching to improve application performance and reduce latency for frequently accessed data.

AWS Identity and Access Management (IAM) provides proper access controls and permissions. AWS Key Management Service (AWS KMS) manages encryption keys for sensitive patient data. Amazon CloudWatch monitors the entire infrastructure for performance and health. Amazon Simple Storage Service (Amazon S3) provides durable, secure storage for biopsy images and analysis results.

This architecture enables a complete workflow:

  1. Data ingestion – Biopsy images are securely uploaded through the portal and stored in Amazon S3.
  2. Processing pipeline – The EKS cluster orchestrates containerized preprocessing applications that prepare images for analysis.
  3. ML model training and execution – The AI models are trained and deployed on Amazon EKS and access the preprocessed images from Amazon EFS, then run Artera’s proprietary ML algorithms, with metadata and results stored in Amazon RDS. The company’s ML teams use EKS to train their massive pan-tumor FM, which is capable of assessing patient risk and therapy benefit across any cancer sample.
  4. Results storage and delivery – Analysis results are stored in Amazon S3 and made available to healthcare providers through the secure web portal.

Data locality and global scalability

One of the key challenges Artera faced was maintaining data locality while serving AI globally. The company uses multiple AWS services to create a comprehensive solution that addresses both performance and compliance requirements.

AWS global infrastructure enables Artera to deploy Region-specific resources that keep sensitive patient data within appropriate jurisdictional boundaries. Amazon S3 provides secure, Region-specific storage buckets, and Amazon EKS allows for containerized workloads to run locally in each Region.

“One of the nice things about Amazon EFS is that it’s very simple to achieve data locality,” says Silberman. “We can mount file systems in the same AWS Region as our applications, ensuring data stays close to where it’s processed.”The combination of Amazon S3, Amazon EKS, Amazon EFS, and other AWS networking services creates a robust foundation for Artera’s global operations. This integrated approach helps Artera accelerate time to market in new regions while maintaining the highest standards of data security and compliance with regional regulations.

To learn more about how Artera uses Amazon EFS, visit the case study, Artera Shapes the Future of Cancer Treatment Using Machine Learning on AWS.

Results and patient impact

By using AWS Cloud services, Artera has transformed cancer diagnostics with tangible benefits for patients:

  • Accelerated results – Patients receive personalized treatment recommendations in only 1–2 days, compared to 6 weeks for traditional genomic tests—dramatically reducing the waiting period for critical treatment decisions.
  • Improved clinical decisions – The speed and accuracy of Artera’s AI-powered diagnostics help physicians make more informed treatment decisions, potentially improving outcomes for prostate cancer patients.
  • Tissue preservation – Unlike traditional tests that destroy tissue samples through chemical assays, the ArteraAI Prostate Test uses only digital imagery, preserving the original tissue for additional tests or clinical trials.

In 2024, almost 300,000 Americans were diagnosed with prostate cancer. For these patients, timely and accurate diagnostics are essential.

“Imagine a patient getting the worst news they’ve ever had and having to sit on that for 6 weeks to determine what the treatment plan is,” says Silberman. “Instead, Artera provides custom-tailored, personalized results within days.”

There are over 3.5 million prostate cancer survivors in the United States. By recommending personalized treatment plans, Artera is helping patients determine the best therapeutic options to achieve progression-free survival while minimizing unnecessary side effects.

“We’ve heard from patients who have said that because of our test, they were able to avoid unnecessary treatments with a lot of side effects,” says Silberman. “That’s why all of us at Artera are here, giving clinicians as many data-backed insights as possible to inform the patient and make the best possible choice for their care.”

Operational benefits

Using AWS services has meant that Artera has achieved significant operational advantages:

  • Enhanced focus on innovation – With AWS managing the infrastructure, Artera’s engineers can dedicate more time to refining their ML algorithms and expanding diagnostic capabilities.

“Using AWS, we can focus on the histopathology problems, rather than on maintenance and monitoring,” says Silberman.

  • Global scalability – Artera has successfully expanded operations while maintaining compliance with regional data regulations across multiple countries.
  • Efficient processing – The test processes tens of thousands of image files through ML workflows per biopsy slide, completing in hours instead of weeks. This efficiency comes from Artera’s sophisticated workflow orchestration that breaks up large input images (sometimes reaching 8 GB) into many small patches processed in parallel across EKS clusters.

The FDA’s De Novo authorization for the ArteraAI Prostate Test underscores the potential impact of this technology on cancer care. With AWS powering their infrastructure, Artera is well-positioned to continue revolutionizing how cancer is diagnosed and treated.

Future innovations

As Artera continues to innovate in the field of AI-powered cancer diagnostics, their AWS based infrastructure provides the foundation for future growth. The company’s ultimate goal is a massive pan-tumor FM capable of assessing patient risk and therapy benefit across any cancer sample. Using elastic, scalable solutions on AWS, Artera has a solid foundation for developing ML models for additional cancer tests. The company has announced plans for a breast cancer product, with several more products close behind.

“What we have coming up is a rapid acceleration across different areas of cancer,” says Silberman. “As proud as we are of the work that we’ve done in the prostate cancer space, we’re just getting started.”

Artera plans to expand their AI capabilities in several ways:

  • Analyze additional biomarkers
  • Integrate genomic data with imaging analysis
  • Create more comprehensive diagnostic tools
  • Partner with major healthcare systems to integrate diagnostic tools directly into clinical workflows

With the scalability of AWS services, Artera is positioned to handle the increasing data demands as they expand to new cancer types and regions globally.

Conclusion

Artera’s journey demonstrates how AWS Cloud services can empower healthcare innovators to develop and scale life-changing technologies. By using Amazon EKS, Amazon ECS, Amazon EFS, Amazon RDS, Amazon S3, AWS Global Accelerator, and Amazon ElastiCache, Artera built a robust, scalable infrastructure they use to keep their focus on their core mission: improving cancer treatment through AI-powered diagnostics. To learn more about how AWS can help your healthcare organization implement AI and ML solutions, visit AWS for Healthcare.

To learn more about Artera and their innovative cancer diagnostics, visit Artera.ai.


About the authors

A proposed governance structure for openSUSE

Post Syndicated from corbet original https://lwn.net/Articles/1056593/

Jeff Mahoney, who
holds a vice-president position at SUSE, has posted a detailed
proposal
for improving the governance of the openSUSE project.

It’s meant to be a way to move from governance by volume or
persistence toward governance by legitimacy, transparency, and
process – so that disagreements can be resolved fairly and the
project can keep moving forward. Introducing structure and
predictability means it easier for newcomers to the project to
participate without needing to understand decades of accumulated
history. It potentially could provide a clearer roadmap for
developers to find a place to contribute.

The stated purpose is to start a discussion; this is openSUSE, so he is
likely to succeed.

A new qualification in data science and AI for students in England?

Post Syndicated from Diane Dowling original https://www.raspberrypi.org/blog/a-new-qualification-in-data-science-and-ai-for-students-in-england/

At the end of last year, Professor Becky Francis published her long-awaited Curriculum and Assessment Review for England, accompanied by the UK government’s official response. Buried within that response — and not actually proposed in the Review itself — was a notable commitment: to “explore introducing a new Level 3 qualification* in data science and AI, to ensure that more young people can secure high-value skills for the future and that we cement the UK’s position as a global leader in AI and technology.”

Photo of a class of students at computers, in a computer science classroom.

This announcement reflects a growing global recognition that young people need more than basic digital literacy — they need a deeper understanding of data, automation, and the rapidly evolving capabilities of AI. Countries around the world, from Singapore to the United States, are already wrestling with how to embed AI education into secondary schooling. England now joins that international conversation.

Why AI education matters

AI is an everyday technology now. Young people interact with AI systems constantly, often without realising it. Whether they pursue careers in medicine, engineering, the creative industries, or public policy, they will need a foundational understanding of how AI systems work, what their limitations are, and the ethical implications around them.

A teenager learning computer science.

Yet in England — and in many education systems globally — very few students receive formal teaching about AI. The English national curriculum makes no explicit reference to AI, and specifications for exams taken at the end of high school include only scattered mentions. This gap leaves young people navigating one of the most transformative technologies of their generation with limited guidance.

Exploring a qualification: Opportunities and challenges

In 2025, we joined forces with Professor Lord Lionel Tarassenko, one of the UK’s foremost researchers in AI and machine learning, and Simon Peyton Jones, a world-renowned computer scientist and long-time champion of computing education. Together with teachers, school leaders, universities, industry specialists, and exam boards, we have been exploring how we might begin to close the emerging gap in AI and data science education for 16- to 18-year-olds.

A group of young people in a lecture hall.

Over the past eight months, this collaboration has allowed us to refine our shared thinking and gather insights from a wide network of experts and practitioners. We are delighted that England’s Department for Education has recognised the potential of this work by appointing us to draft the subject content for a possible new A level in Data Science and AI.

We are delighted that England’s Department for Education has recognised the potential of [the work we have done] by appointing us to draft the subject content for a possible new A level in Data Science and AI.

Designing a qualification of this kind raises important questions — not just for the UK, but for any country considering a similar path.

What knowledge and skills should young people gain from the qualification?

A meaningful qualification must go beyond the use of tools. It should help students understand data literacy, model behaviour, bias, ethics, and the societal implications of AI. Balancing technical understanding with critical thinking is challenging but essential.

How do we ensure the qualification is accessible and inclusive?

AI should not become the preserve of already-advantaged students. Any qualification must be designed with equity in mind, recognising differences in school capacity, teacher expertise, and students’ prior experience.

How do we support teachers to deliver the qualification?

Teacher professional development is a major challenge worldwide. Delivering a qualification in AI will require confidence with concepts that are not yet common in teacher training. Sustainable delivery models — supported by high-quality resources and professional development — will be crucial.

What form should the qualification take?

There is an active debate about whether the best route for students in England is a high-stakes qualification or a supplementary course that broadens a core programme of study:

  • An A level provides structure, national recognition, and clear progression into higher education or employment.
  • An Extended Project Qualification (EPQ) may offer more flexibility, allowing students to explore AI through research or practical investigation without requiring schools to timetable a full qualification.

Different countries will make different choices based on their systems, but the underlying questions are the same: how do we create something rigorous, scalable, and future-proof?

What we’ve learned so far

In October, the Foundation hosted a workshop with representatives from schools, industry, universities, exam boards, and the Department for Education. Together, we explored key questions including:

  1. How do we make a qualification compelling – both for students who choose it and for schools that offer it?
  2. What delivery models will genuinely support teachers to succeed?
An undergraduate student is raising his hand up during a lecture at a university.

The feedback we received has been invaluable and will continue to shape the next stage of development. We believe the UK has a significant opportunity to contribute meaningfully to the global conversation about AI education. You can read the latest version of our discussion paper here.

A global call for insights

Although the current proposal focuses on England, the underlying challenge is international: how do we prepare young people everywhere to engage thoughtfully and confidently with AI?

We would love to hear from educators, researchers, and policymakers across the world:

  • Do you know of any successful qualifications or programmes for 16- to 18-year-olds that centre AI or data science?
  • What lessons should countries learn from each other?

To share your ideas or feedback, please get in touch. We’d be delighted to learn from your experience as this important work progresses.


* Level 3 in England is the stage of learning for 16- to 19-year-olds, typically ending in qualifications that pave the way for higher study or advanced apprenticeships.

The post A new qualification in data science and AI for students in England? appeared first on Raspberry Pi Foundation.

[$] Sub-schedulers for sched_ext

Post Syndicated from corbet original https://lwn.net/Articles/1056014/

The extensible scheduler class (sched_ext)
allows the installation of a custom CPU scheduler built as a set of BPF
programs. Its merging for the 6.12 kernel release moved the kernel away
from the “one scheduler fits all” approach that had been taken until then;
now any system can have its own scheduler optimized for its workloads.
Within any given machine, though, it’s still “one scheduler fits all”; only
one scheduler can be loaded for the system as a whole. The sched_ext
sub-scheduler patch series
from Tejun Heo aims to change that situation
by allowing multiple CPU schedulers to run on a single system.

Security updates for Thursday

Post Syndicated from corbet original https://lwn.net/Articles/1056544/

Security updates have been issued by AlmaLinux (java-25-openjdk, openssl, and python3.9), Debian (gimp, libmatio, pyasn1, and python-django), Fedora (perl-HarfBuzz-Shaper, python-tinycss2, and weasyprint), Mageia (glib2.0), Oracle (curl, fence-agents, gcc-toolset-15-binutils, glibc, grafana, java-1.8.0-openjdk, kernel, mariadb, osbuild-composer, perl, php:8.2, python-urllib3, python3.11, python3.11-urllib3, python3.12, and python3.12-urllib3), SUSE (alloy, avahi, bind, buildah, busybox, container-suseconnect, coredns, gdk-pixbuf, gimp, go1.24, go1.24-openssl, go1.25, helm, kernel, kubernetes, libheif, libpcap, libpng16, openjpeg2, openssl-1_0_0, openssl-1_1, openssl-3, php8, python-jaraco.context, python-marshmallow, python-pyasn1, python-urllib3, python-virtualenv, python311, python313, rabbitmq-server, xen, zli, and zot-registry), and Ubuntu (containerd, containerd-app and wlc).

Network Stats for Q4 2025: Neocloud Traffic Trends

Post Syndicated from Brent Nowak original https://www.backblaze.com/blog/network-stats-for-q4-2025-neocloud-traffic-trends/

A decorative image with the text Q4 2025 Network Stats.

Welcome to our second quarterly Network Stats report covering Q4 of 2025. Along with Drive Stats and Performance Stats, Network Stats pulls back the curtain on real-world infrastructure data, particularly how network-level analytics reflect emerging AI industry trends and usage patterns.

Get more Network Stats (and the details of the dataset)

If you are curious about what metrics we’re recording and how we classify data in this series, check out the details outlined in our Q3 2025 Network Stats  report.

One of the roles of the Network Engineering (NetEng) team at Backblaze is to monitor how traffic moves into, out of, and across our platform—not just day-to-day, but over time as customer behavior and industry dynamics evolve. Right now, few forces are reshaping networks faster than AI. 

With the launch of B2 Overdrive in April 2025, we built a direct, high-performance path between our storage layers and neoclouds where processing, inference, and modeling take place. It has given us a front-row seat to the impact of AI and how network behavior is changing with it. This quarter, in addition to our regular data analysis, I’ll walk through where AI-driven traffic is concentrated, how ingress and egress patterns showed up, and what the findings say about where AI infrastructure might be headed next. 

Continue the conversation

Join us live for the Q4 2025 Network Stats webinar Wednesday, February 4, 2025 at 10:00 a.m. PT / 1:00 p.m. ET. We’ll explore where AI traffic concentrates, how high-magnitude data flows behave, and what early indicators suggest about the future of AI-native infrastructure design.

Can’t make it live, or reading this article after-the-fact? Sign up anyway and catch the recording on demand.

Get Inside Real AI Network Flows

Brave new market

AI workflows don’t just need a place to store data, they need to be able to move it quickly, easily, and nearly constantly for short bursts. Large, multi-petabyte datasets are ingested, transformed, exported for training, pulled back for evaluation, and periodically refreshed as models evolve.  

Backblaze plays a key role at both ends of that lifecycle. We serve as a durable storage layer for the initial data ingestion, and as the high-throughput source feeding model training, evaluation, and validation to whatever best neocloud is suitable at the moment. Once that model has been trained, it needs to be stored, served, and periodically retrained, where we serve as the storage medium.

This quarter, we saw a large amount of traffic between Backblaze, neoclouds, and traditional hyperscalers for processing concentrated across the months of June to November. This reflects large-scale ingestion events followed by intensive data manipulation and model-related egress. 

From a network perspective, this represents a meaningful shift from diffuse, internet-style traffic patterns to large, high-bandwidth flows between a smaller set of endpoints typical of AI-centric infrastructure.

The neocloud slice

The defining theme of the quarter is “new:” new AI-oriented workflows, new traffic patterns, and leading indicators of new infrastructure trends. 

The stacked area graph below shows total traffic by network type over time. While content delivery network (CDN), hosting, and internet service provider (ISP) traffic stayed largely within historical norms reflecting steady-state usage patterns like content delivery, web hosting, and traditional backup workflows, two slices stand out:

  • Migration traffic: We saw a notable increase in migration traffic from August through October.  This classification reflects an influx of data into our network over fiber connections we have in the data centers to cost effectively migrate large amounts of data over private links, not using the public Internet.
  • Neocloud traffic: We saw a sharp increase in July through November, peaking in October.

What do we think is happening? Taken together, these patterns suggest a familiar AI lifecycle:  large datasets consisting of assets like images, videos, and metadata are ingested and consolidated then exported for training and experimentation. Now, those assets can be periodically updated as new assets are added and generated models and stored. We see that heading into the new year, the overall baseline has increased indicating a new normal.

Quick terminology refresher

  • Regions
    • US-West: Our largest and longest-running region
    • US-East: Region with the most observed proximity to neocloud infrastructure
    • CA-East: Our newest region in Canada. 
  • Network Types
    • CDN: Networks that use Backblaze as an origin store for content delivery 
    • Hosting: Traditional hosting providers that runs workloads like physical or virtual servers for web, database, or application tasks
    • Hyperscaler: Large, traditional cloud providers
    • ISP Regional: Local or regional ISPs, think of these as the “last mile” paths as these networks are very close to customer equipment and efficient 
    • ISP Tier1: National or international ISPs that carry our traffic long distances
    • Neocloud: AI -focused compute networks
    • Migration: Network links that we use for large-scale data onboarding

Heatmaps: Where AI traffic concentrates

To better understand where AI activity is happening, we thought it would be interesting to isolate the different Backblaze regions and to view concentrations of metrics visualized through heatmaps. We’re going to look at the following three dimensions: 

  1. Total traffic volume: Where did we send and receive the most traffic? 
  2. Magnitude: Where were the data transfers with the most bits per unique IP address?
  3. Uniqueness: What does the number of distinct IP addresses look like? 

Heatmap #1: Where did we send and receive the most traffic?

Unsurprisingly, US-West ↔ ISP-Regional traffic dominates in total traffic volume. This region has the largest data center footprint behind it, with connectivity to internet exchanges (IX) such as Equinix-IX that were brought online in 2023. Internet exchanges bring us closer to consumer networks, where we can deliver traffic with lower latency.

More interesting, however, is the US-East ↔ neocloud concentration. Our flow data shows neocloud activity clustering in regions including Chicago, Dallas-Houston, Denver, New York, Northern Virginia (Reston/Ashburn corridor), and Atlanta—skewed more towards the East Coast where there’s dense AI compute availability. 

From a performance standpoint, this makes sense. It’s important to keep latency (the time between the source and destination) lower to achieve consistent high bandwidth rates for AI data transfers. For now, that gravity is pulling activity towards the East coast. 

Will neocloud traffic concentrations shift over time? Since this is our first quarter with a full dataset, it’s a bit early to draw long-term conclusions. But this is exactly the kind of trend we’ll be tracking. Stay tuned for future Network Stats reports.

Heatmap #2: Where were the data transfers with the most magnitude (bits per IP address)?

Another metric we record is bits per IP or what we termed in our last report “magnitude.” This combination of the amount of traffic transferred with how many actors are involved per network is a good proxy to measure how heavy or impactful individual data flows are. In short:

  • High volume, many IPs: Easier to distribute and load-balance across infrastructure. And many source and destination pairs means that we can traffic engineer at the WAN layer, sending some traffic over one provider and some over another.
  • High volume, few IPs: More difficult, but more interesting, from a NetEng perspective. 

With B2 Overdrive, we routinely support client transfers starting at 100Gbps up to 1Tbps of throughput.These high-magnitude flows show up clearly in the data, especially in regions serving AI-heavy neocloud endpoints. Seeing these patterns emerge in the data validates that customers are actively using the platform the way it was designed.

Heatmap #3: How many unique addresses do we interact with?

Uniqueness—measured by the number of distinct IP addresses per network type—adds another dimension to the story. 

  • US-West shows the highest overall uniqueness, driven by its larger number of data centers and mix of workloads.
  • Neocloud traffic, by contrast, tends to involve fewer, more persistent endpoints, consistent with AI pipelines that rely on stable, long-standing connections between storage and compute. 

This contrast reveals a broader trend: AI networking is less about many-to-many communication and more about sustained high-throughput relationships between specialized systems.

A chart showing the number of unique IP addresses that sent or received data to the Backblaze networks by region.
Communication uniqueness across our regions to each network type

Summary: Early indicators of an AI-native network era

This quarter represents an early but important snapshot of how AI is reshaping network behavior:

  • AI-driven traffic is concentrated and heavy (not groundbreaking news by any means, but interesting to see it played out on a network).
  • Neocloud connectivity is a defining feature of data movement today.
  • Data gravity is pulling storage, compute, and network design into tighter alignment.

This is our first look at these patterns specifically. As we gather more quarters of data, we’ll be watching closely to see how cyclical neocloud activity becomes, how regional concentrations shift, and how the growing ecosystem of AI-focused ISVs continues to change the shape of the network.

Quarter over quarter data

Last quarter we started capturing data and metrics that we were interested in tracking over time. This represents our first full quarter of data as we only started tracking in August of 2025, so it’s still early to start to see trends, but we’re including the visualizations for fidelity. 

First let’s take a look at where all our traffic goes from a global perspective with an updated view of last quarter.

A Sankey diagram that tracks total data traffic flow between Backblaze and different types providers for Q4 2025.
Sankey diagram of all August ingress and egress traffic grouped by type of network

Traffic to other clouds has increased (36.2% to 49.6%) since we last reported in August of 2025, with a slight decrease (19.8% to 18.4%) in Neocloud destinations, but a large increase (3.5% to 18%) to hyperscalers. It’s too early to call these things statistically significant trends or patterns that impact the cloud storage industry broadly, because they’re reflective of what types of customers Backblaze specifically has and our sampling range is only a quarter. That said, we do see an overall increase in cloud to cloud traffic, but the higher percentage to the type of clouds rotated from last quarter.

Next, let’s look at the magnitude of our network traffic based on the category of the traffic destination. As a reminder, magnitude represents the amount of traffic transferred with how many actors are involved per network. 

Next, to be consistent with our previous report, we’ll look at magnitude on a linear scale. 

With more datapoints, we can clearly see the magnitude of the neocloud and hyperscaler transfers when compared to other network types. As above, it’s a bit early to claim concrete quarter over quarter patterns, but we’ll keep monitoring and updating the dataset. 

What’s next?

Next quarter will be the first where we have true quarter over quarter data to analyze, and we’ll be back with more on how AI-driven flows change quarter over quarter. And as we get more data, we’re interested in looking at other trends like IPv4 vs. IPv6 traffic, cross-cloud connectivity trends, and revisiting the concentration analysis we did this quarter. 

Anything specific you want to see? Let us know in the comments or reach out to our Evangelism team. Or, keep up-to-date with the latest technical content with our Developer Newsletter. 

The post Network Stats for Q4 2025: Neocloud Traffic Trends appeared first on Backblaze Blog | Cloud Storage & Cloud Backup

Introducing Moltworker: a self-hosted personal AI agent, minus the minis

Post Syndicated from Celso Martinho original https://blog.cloudflare.com/moltworker-self-hosted-ai-agent/

The Internet woke up this week to a flood of people buying Mac minis to run Moltbot (formerly Clawdbot), an open-source, self-hosted AI agent designed to act as a personal assistant. Moltbot runs in the background on a user’s own hardware, has a sizable and growing list of integrations for chat applications, AI models, and other popular tools, and can be controlled remotely. Moltbot can help you with your finances, social media, organize your day — all through your favorite messaging app.

But what if you don’t want to buy new dedicated hardware? And what if you could still run your Moltbot efficiently and securely online? Meet Moltworker, a middleware Worker and adapted scripts that allows running Moltbot on Cloudflare’s Sandbox SDK and our Developer Platform APIs.

A personal assistant on Cloudflare — how does that work? 

Firstly, Cloudflare Workers has never been so compatible with Node.js. Where in the past we had to mock APIs to get some packages running, now those APIs are supported natively by the Workers Runtime.

This has changed how we can build tools on Cloudflare Workers. When we first implemented Playwright, a popular framework for web testing and automation that runs on Browser Rendering, we had to rely on memfs. This was bad because not only is memfs a hack and an external dependency, but it also forced us to drift away from the official Playwright codebase. Thankfully, with more Node.js compatibility, we were able to start using node:fs natively, reducing complexity and maintainability, which makes upgrades to the latest versions of Playwright easy to do.

The list of Node.js APIs we support natively keeps growing. The blog post “A year of improving Node.js compatibility in Cloudflare Workers” provides an overview of where we are and what we’re doing.

We measure this progress, too. We recently ran an experiment where we took the 1,000 most popular NPM packages, installed and let AI loose, to try to run them in Cloudflare Workers, Ralph Wiggum as a “software engineer” style, and the results were surprisingly good. Excluding the packages that are build tools, CLI tools or browser-only and don’t apply, only 15 packages genuinely didn’t work. That’s 1.5%.

Here’s a graphic of our Node.js API support over time:


We put together a page with the results of our internal experiment on npm packages support here, so you can check for yourself.

Moltbot doesn’t necessarily require a lot of Workers Node.js compatibility because most of the code runs in a container anyway, but we thought it would be important to highlight how far we got supporting so many packages using native APIs. This is because when starting a new AI agent application from scratch, we can actually run a lot of the logic in Workers, closer to the user.

The other important part of the story is that the list of products and APIs on our Developer Platform has grown to the point where anyone can build and run any kind of application — even the most complex and demanding ones — on Cloudflare. And once launched, every application running on our Developer Platform immediately benefits from our secure and scalable global network.

Those products and services gave us the ingredients we needed to get started. First, we now have Sandboxes, where you can run untrusted code securely in isolated environments, providing a place to run the service. Next, we now have Browser Rendering, where you can programmatically control and interact with headless browser instances. And finally, R2, where you can store objects persistently. With those building blocks available, we could begin work on adapting Moltbot.

How we adapted Moltbot to run on us

Moltbot on Workers, or Moltworker, is a combination of an entrypoint Worker that acts as an API router and a proxy between our APIs and the isolated environment, both protected by Cloudflare Access. It also provides an administration UI and connects to the Sandbox container where the standard Moltbot Gateway runtime and its integrations are running, using R2 for persistent storage.


High-level architecture diagram of Moltworker.

Let’s dive in more.

AI Gateway

Cloudflare AI Gateway acts as a proxy between your AI applications and any popular AI provider, and gives our customers centralized visibility and control over the requests going through.

Recently we announced support for Bring Your Own Key (BYOK), where instead of passing your provider secrets in plain text with every request, we centrally manage the secrets for you and can use them with your gateway configuration.

An even better option where you don’t have to manage AI providers’ secrets at all end-to-end is to use Unified Billing. In this case you top up your account with credits and use AI Gateway with any of the supported providers directly, Cloudflare gets charged, and we will deduct credits from your account.

To make Moltbot use AI Gateway, first we create a new gateway instance, then we enable the Anthropic provider for it, then we either add our Claude key or purchase credits to use Unified Billing, and then all we need to do is set the ANTHROPIC_BASE_URL environment variable so Moltbot uses the AI Gateway endpoint. That’s it, no code changes necessary.


Once Moltbot starts using AI Gateway, you’ll have full visibility on costs and have access to logs and analytics that will help you understand how your AI agent is using the AI providers.


Note that Anthropic is one option; Moltbot supports other AI providers and so does AI Gateway. The advantage of using AI Gateway is that if a better model comes along from any provider, you don’t have to swap keys in your AI Agent configuration and redeploy — you can simply switch the model in your gateway configuration. And more, you specify model or provider fallbacks to handle request failures and ensure reliability.

Sandboxes

Last year we anticipated the growing need for AI agents to run untrusted code securely in isolated environments, and we announced the Sandbox SDK. This SDK is built on top of Cloudflare Containers, but it provides a simple API for executing commands, managing files, running background processes, and exposing services — all from your Workers applications.

In short, instead of having to deal with the lower-level Container APIs, the Sandbox SDK gives you developer-friendly APIs for secure code execution and handles the complexity of container lifecycle, networking, file systems, and process management — letting you focus on building your application logic with just a few lines of TypeScript. Here’s an example:

import { getSandbox } from '@cloudflare/sandbox';
export { Sandbox } from '@cloudflare/sandbox';

export default {
  async fetch(request: Request, env: Env): Promise<Response> {
    const sandbox = getSandbox(env.Sandbox, 'user-123');

    // Create a project structure
    await sandbox.mkdir('/workspace/project/src', { recursive: true });

    // Check node version
    const version = await sandbox.exec('node -v');

    // Run some python code
    const ctx = await sandbox.createCodeContext({ language: 'python' });
    await sandbox.runCode('import math; radius = 5', { context: ctx });
    const result = await sandbox.runCode('math.pi * radius ** 2', { context: ctx });

    return Response.json({ version, result });
  }
};

This fits like a glove for Moltbot. Instead of running Docker in your local Mac mini, we run Docker on Containers, use the Sandbox SDK to issue commands into the isolated environment and use callbacks to our entrypoint Worker, effectively establishing a two-way communication channel between the two systems.

R2 for persistent storage

The good thing about running things in your local computer or VPS is you get persistent storage for free. Containers, however, are inherently ephemeral, meaning data generated within them is lost upon deletion. Fear not, though — the Sandbox SDK provides the sandbox.mountBucket() that you can use to automatically, well, mount your R2 bucket as a filesystem partition when the container starts.

Once we have a local directory that is guaranteed to survive the container lifecycle, we can use that for Moltbot to store session memory files, conversations and other assets that are required to persist.

Browser Rendering for browser automation

AI agents rely heavily on browsing the sometimes not-so-structured web. Moltbot utilizes dedicated Chromium instances to perform actions, navigate the web, fill out forms, take snapshots, and handle tasks that require a web browser. Sure, we can run Chromium on Sandboxes too, but what if we could simplify and use an API instead?

With Cloudflare’s Browser Rendering, you can programmatically control and interact with headless browser instances running at scale in our edge network. We support Puppeteer, Stagehand, Playwright and other popular packages so that developers can onboard with minimal code changes. We even support MCP for AI.

In order to get Browser Rendering to work with Moltbot we do two things:

  • First we create a thin CDP proxy (CDP is the protocol that allows instrumenting Chromium-based browsers) from the Sandbox container to the Moltbot Worker, back to Browser Rendering using the Puppeteer APIs.

  • Then we inject a Browser Rendering skill into the runtime when the Sandbox starts.


From the Moltbot runtime perspective, it has a local CDP port it can connect to and perform browser tasks.

Zero Trust Access for authentication policies

Next up we want to protect our APIs and Admin UI from unauthorized access. Doing authentication from scratch is hard, and is typically the kind of wheel you don’t want to reinvent or have to deal with. Zero Trust Access makes it incredibly easy to protect your application by defining specific policies and login methods for the endpoints. 


Zero Trust Access Login methods configuration for the Moltworker application.

Once the endpoints are protected, Cloudflare will handle authentication for you and automatically include a JWT token with every request to your origin endpoints. You can then validate that JWT for extra protection, to ensure that the request came from Access and not a malicious third party.

Like with AI Gateway, once all your APIs are behind Access you get great observability on who the users are and what they are doing with your Moltbot instance.


Moltworker in action

Demo time. We’ve put up a Slack instance where we could play with our own instance of Moltbot on Workers. Here are some of the fun things we’ve done with it.

We hate bad news.


Here’s a chat session where we ask Moltbot to find the shortest route between Cloudflare in London and Cloudflare in Lisbon using Google Maps and take a screenshot in a Slack channel. It goes through a sequence of steps using Browser Rendering to navigate Google Maps and does a pretty good job at it. Also look at Moltbot’s memory in action when we ask him the second time.


We’re in the mood for some Asian food today, let’s get Moltbot to work for help.


We eat with our eyes too.


Let’s get more creative and ask Moltbot to create a video where it browses our developer documentation. As you can see, it downloads and runs ffmpeg to generate the video out of the frames it captured in the browser.

Run your own Moltworker

We open-sourced our implementation and made it available at https://github.com/cloudflare/moltworker so you can deploy and run your own Moltbot on top of Workers today.

The README guides you through the necessary steps to set up everything. You will need a Cloudflare account and a minimum $5 USD Workers paid plan subscription to use Sandbox Containers, but all the other products are either free to use, like AI Gateway, or have generous free tiers you can use to get you started and run for as long as you want under reasonable limits.

Note that Moltworker is a proof of concept, not a Cloudflare product. Our goal is to showcase some of the most exciting features of our Developer Platform that can be used to run AI agents and unsupervised code efficiently and securely, and get great observability while taking advantage of our global network.

Feel free to contribute to or fork our GitHub repository; we will keep an eye on it for a while for support. We are also considering contributing upstream to the official project with Cloudflare skills in parallel.

Conclusion

We hope you enjoyed this experiment, and we were able to convince you that Cloudflare is the perfect place to run your AI applications and agents. We’ve been working relentlessly trying to anticipate the future and release features like the Agents SDK that you can use to build your first agent in minutes, Sandboxes where you can run arbitrary code in an isolated environment without the complications of the lifecycle of a container, and AI Search, Cloudflare’s managed vector-based search service, to name a few.

Cloudflare now offers a complete toolkit for AI development: inference, storage APIs, databases, durable execution for stateful workflows, and built-in AI capabilities. Together, these building blocks make it possible to build and run even the most demanding AI applications on our global edge network.

If you’re excited about AI and want to help us build the next generation of products and APIs, we’re hiring.

The concepts of forking

Post Syndicated from Michael "Monty" Widenius original http://monty-says.blogspot.com/2026/01/the-concepts-of-forking.html

Lately there has been a lot of discussion about “hard” or “soft” forks related to MySQL. As someone who has done a successful fork of MySQL, I think this is both confusing and trivialising the concept of forking.
In my previous blog,  I did touch a bit on this topic, but it looks like some more clarifications are needed.
When we did the initial fork of MariaDB from MySQL, we tried our best to keep things 100% user compatible while still adding new features and fixing issues in MySQL. For MariaDB 5.1 -> MariaDB 5.5, we merged all relevant changes from MySQL into MariaDB.
This did not mean that MariaDB was 100% compatible with MySQL, as any change in a fork makes things incompatible in some manner. For example, the enhanced optimiser in MariaDB 5.5 did work slightly differently (better) than MySQL, and if one used any of the new features in MariaDB, one could not trivially go back to MySQL anymore. However, for most users these changes were not notable and allowed most Linux distributions to automatically move MySQL users to MariaDB without any disturbance.
Over time, the merging of MySQL code became harder and gave us less benefit compared to the effort of doing the merges. The new MySQL developers had started to move source code around (which made merges harder), and we, the MariaDB developers, were not happy with the quality of the code related to bug fixes or some of the new features. It was easier to write the new feature from scratch than to use the MySQL code. However, for each feature we did our best to ensure that the syntax and behaviour were identical to MySQL.
Another big problem was that MySQL started to copy features (not code) from MariaDB, but used a different SQL syntax than what MariaDB was using. One example is the usage of CHANNEL in multi-source replication. It did not make any sense for MariaDB to copy the multi-source code from MySQL, as we already had a working, stable implementation we were happy with.
With MariaDB 10.0, we decided to stop merges from MySQL and instead monitor new features and implement those that we thought made sense for MariaDB.
Moving to MariaDB 10.0 allowed us more flexibility in adding more features to MariaDB without being constrained by the MySQL code, like Galera, Oracle compatibility, and a lot of other things listed here.
Nowadays, most of the MariaDB development work is adding features customers and MariaDB users are missing (link to MariaDB 13.0 roadmap will shortly be added here). A lot of this work is related to new Oracle compatibility required by new customers, like FULL OUTER JOIN. There are still a few notable features in MySQL that we have not had time to re-implement, like multi-value indexing (for indexing JSON), JSON operators, and LATERAL tables. All of the mentioned ones are on the MariaDB 13.0 roadmap.
We, the MariaDB developers, are still working on keeping MariaDB compatible with MySQL (and Percona Server). In MariaDB 10.11, we added support for the popular extensions from Percona Server. In the latest MariaDB versions we have ensured that one can replicate from MySQL to MariaDB and back.   We have also added support for the caching_sha2_password plugin, to allow MySQL users to switch to MariaDB without changing their passwords, support of the default MySQL character collation set, utf8mb4_0900_* and multiple JSON functions.
We also listen to MySQL users moving to MariaDB and do our best to implement the features they need to be able to move to MariaDB. The MariaDB Foundation is there for those who want to be part of this effort!
The above hopefully gives the needed background to discuss different kinds of forks (just kidding) in more detail.
Internal fork
  • Fork where the company/original development team forks the product for political, redesign, or development reasons. The fork may be more or less, or not at all, compatible with the predecessor.
Examples:
  • MySQL 8.0 (someone could call this a “hard” fork as it was hard to move to it and very hard to go backwards )
  • OpenOffice → Apache OpenOffice (after Oracle acquisition; internal governance shift)
  • Sun Solaris → Oracle Solaris (post-acquisition direction change)
  • KDE 3 → KDE 4 (often cited as an internal “hard” break due to massive architectural changes)
  • Python 2 → Python 3 (not a fork in licence terms, but functionally an internal compatibility break)
  • Drizzle (https://en.wikipedia.org/wiki/Drizzle_(database_server)
External fork
  • When an external group or company forks a project for various reasons. The most common reasons are creational differences in how to take the project forward or distrust in the original project owners.
The external fork has a lot of subcategories:
Downstream “no-changes” fork
  • The fork is based on the original project with a small, limited subset of changes to get the project to work within an ecosystem or with an external/internal project that requires some minor changes.
  • The code is basically a rebase plus patches on top of the original code.
  • No user-visible changes from the original project.
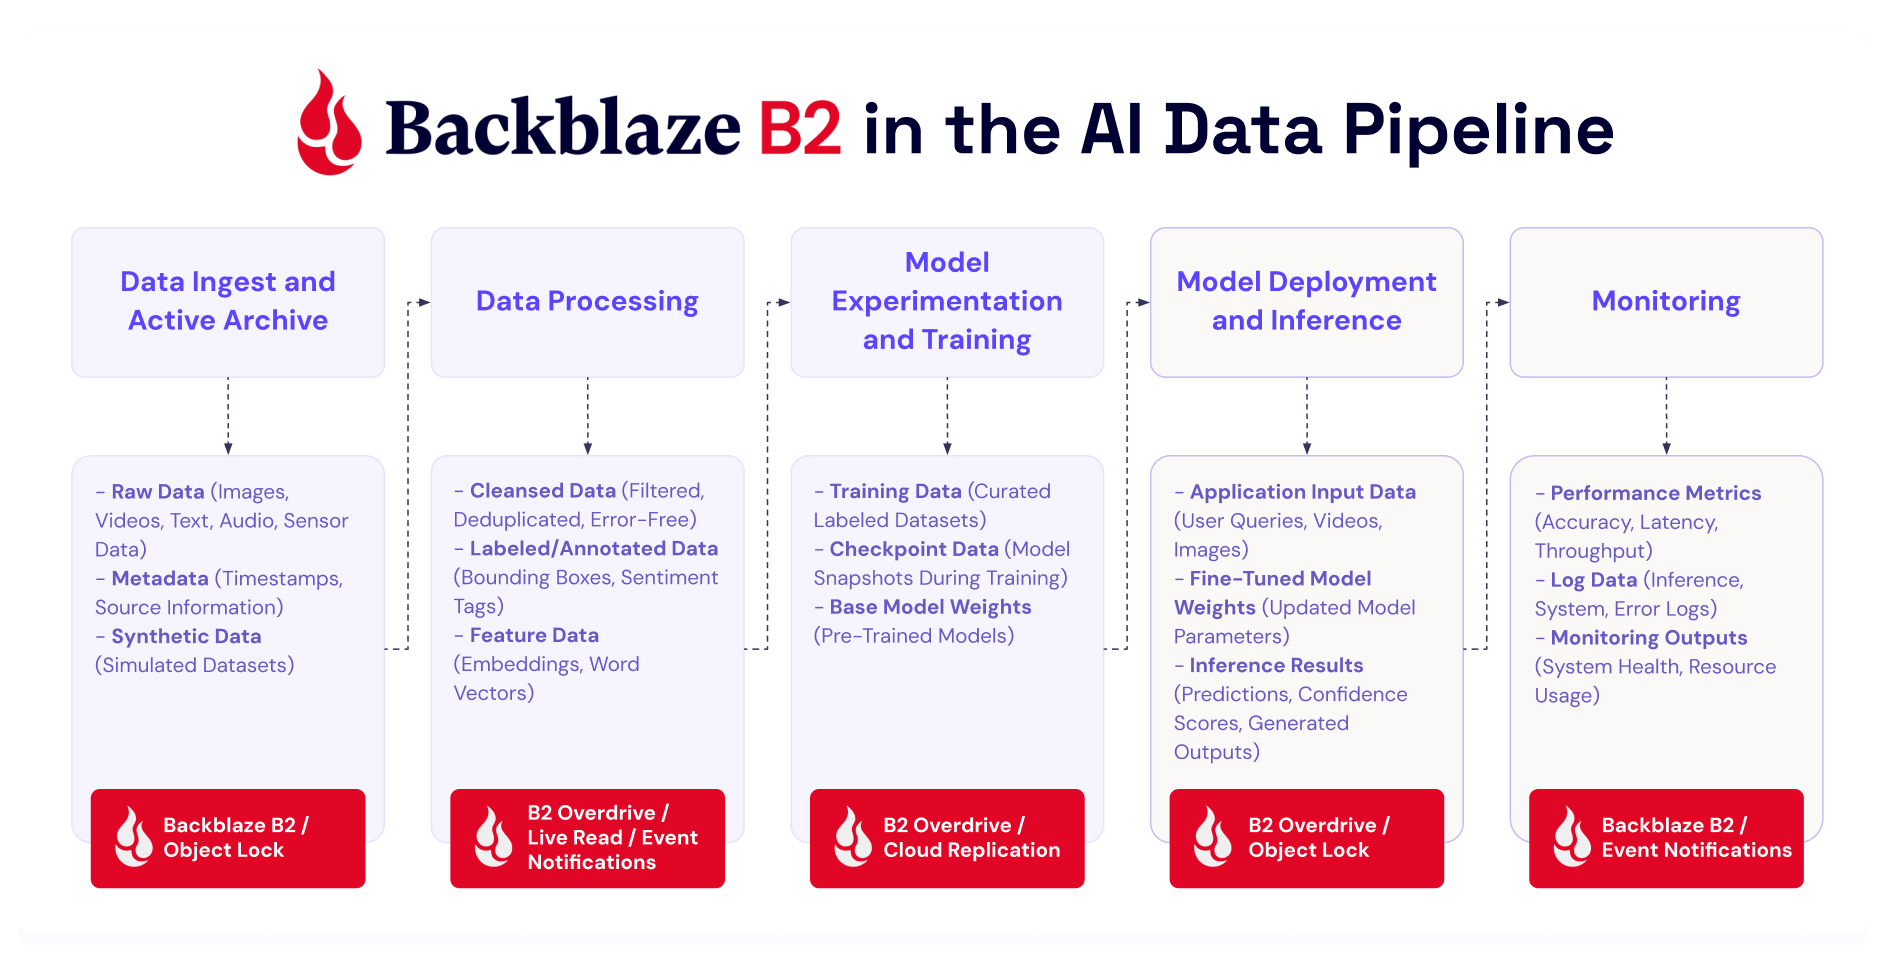
Examples:
  • Packages in Linux and other OS distributions
  • Ubuntu kernel (downstream of Linux with minimal, policy-driven patches)
  • Homebrew / MacPorts packages
  • Debian-patched GNU tools
  • Android Linux kernel (arguably borderline, but many devices are close to upstream + patches)
Downstream fork
  • The fork is based on a rebase of the original code, but with user-visible changes that bring a different user experience while keeping the base 100% compatible with the original project. It is reasonably easy to move to the fork, but harder for users of this fork to move back to the original.
  • The forks usually have the problem that newer major versions have to drop options or features when the original project adds them, which makes upgrades to the next version a bit harder.
Examples:
  • Red Hat Enterprise Linux (downstream of Fedora)
  • Ubuntu (downstream of Debian)
  • Amazon Linux (downstream of RHEL/CentOS lineage)
  • PostgreSQL distributions (EDB Postgres, Amazon Aurora PostgreSQL-compatible)
  • Percona Server
  • MariaDB 5.1 -> 5.4 (these MariaDB versions never had to drop a feature)
Compatibility fork
  • The fork was originally a ‘Downstream fork’ but moved to, instead of using rebases, only merging selected patches from the original project and rewriting things the developers disliked. The goal is still to have high compatibility with the original project.
  • Examples:
  • LibreOffice (from OpenOffice.org)
  • Jenkins (from Hudson, especially post-Oracle divergence)
  • Percona XtraDB Cluster
  • MariaDB 5.5
Independent fork (or “branch”)
  • The fork is no longer dependent on the original project. It may still take selected patches or ideas from the original project.
  • It usually tries to keep things compatible to make it easy for original project users to move to the new project, but the main focus is solving new problems for its growing user base.
Examples:
  • GhostBSD
  • OpenBSD (from NetBSD)
  • Illumos (from OpenSolaris)
  • systemd (initially replacing sysvinit, now fully independent ecosystem)
  • Neo4j Community vs Enterprise split (conceptual fit)
  • Firefox (historically from Mozilla Suite)
  • MariaDB 10+
Some people have recently expressed that they are afraid that MySQL development is stopping or slowing down, and others have started to talk about the need to do a “soft” fork of MySQL.
The point I am trying to make is that if these worries are real, then any fork will sooner or later have to become an independent fork/branch or die together with MySQL (as there will be no new features in the fork).
One of the mantras in open source is that it is better to join an existing project than to create a new one! Instead of talking about creating yet another fork of MySQL, it would be better if everyone gathered around MariaDB! MariaDB development is not dependent on Oracle for its future. This is assured by the MariaDB Foundation, which was created to make it easy for anyone to participate in the development of the MariaDB server. MariaDB plc is working together with the MariaDB Foundation to make this possible.
MariaDB is, after all, created by the same people who created MySQL and is developed in the way it would have been if Oracle had not bought MySQL. The rapid adoption of MariaDB (350+ million database installations and rapidly increasing) shows that MariaDB is truly the future of MySQL.
PS:
Please leave a comment if you have a better name for any of the fork categories, another fork category that should be added, or more examples for the categories.

Имаме си президентка. И?

Post Syndicated from Светла Енчева original https://www.toest.bg/imame-si-prezidentka-i/

Имаме си президентка. И?

Започвам с едно уточнение. Наясно съм, че някои от читателите (и читателките) са свъсили вежди още при вида на женския род в заглавието на тази статия. Наскоро една журналистка, живееща в немскоезична държава, писа във Facebook, че е време думата президентка да влезе в употреба. Голяма част от коментиращите под поста ѝ (повечето от които жени) изразиха категорично несъгласие с призива ѝ. Една от тях дори сложи повръщащ емотикон след словосъчетанието „главнокомандваща на армията“, защото (смея да предположа основанието за отвращението ѝ) как може армията да се предвожда от някого в женски род?

Най-лесно би било да оправдая използването на думата президентка с вътрешните езикови правила на „Тоест“, по силата на които за назоваването на жени се употребяват думи от женски род, освен в строго определени случаи. При обръщение също се използва съществителното от мъжки род за съответната длъжност („Уважаема госпожо Президент“, а не „уважаема госпожо Президентке“). Това вътрешно езиково правило обаче не е случайно хрумване – то се дължи на убеждението, че ролята на жените в обществото следва да намери място и в езика.

Как (не) се става президентка

Фактът, че за първи път президентската институция в България се оглавява от жена, безспорно е събитие. В същото време Илияна Йотова не е избрана на този пост, а го заема по силата на конституционна процедура, след като досегашният президент Румен Радев го напусна, за да влезе в политиката.

Отечество любезно, аз ще те спася!
Точно преди 40 години Тина Търнър изпя We don’t need another hero. Колко продължения на реалност а ла „Лудия Макс“ са ни необходими, за да спрем да повтаряме същата грешка? Емилия Милчева за новия спасител, задаващ се на хоризонта, и за останалите месии, които играят като за последно десет.
Имаме си президентка. И?

Откакто след 1989 г. президентската институция е въведена в България, неведнъж в битката за нея са се включвали жени. Най-значимите опити са на Меглена Кунева през 2011 г. и на Цецка Цачева през 2016 г. За Кунева дават гласа си 14% от участвалите в изборите, което я класира на трето място след Росен Плевнелиев и Ивайло Калфин. На първия тур през 2016 г. дотогавашната председателка на парламента Цецка Цачева е втора след Румен Радев – той получава 25,44% от гласовете, а тя – близо 22%. На втория тур обаче разликата между тях става повече от 20 процентни пункта – Радев е подкрепен от 59,37%, а Цачева – от 36,16%.

Тук следва да се отбележи, че макар в количествено отношение резултатът на Цачева да е по-добър от този на Кунева, той беше провал за ГЕРБ.

Защото управляващата по онова време партия на Бойко Борисов предложи за държавен глава личност, на която не само не ѝ беше в стила да вдъхновява избирателите, а и не се радваше на техните симпатии. Така де факто подари победата на Радев.

За разлика от бившата председателка на парламента, чиято кандидатура беше чисто партийна, пет години по-рано Меглена Кунева разчиташе основно на собствената си личност, за да обедини гласоподаватели около себе си. Ето защо в известен смисъл нейното трето място тежи повече от второто на Цачева. За сравнение, през същата 2011 година обединението от партии и коалиции, включващо Съюза на десните сили – СДС, „Обединени земеделци“, Демократическата партия, Движение „Гергьовден“, Съюза на свободните демократи, БДС „Радикали“ и Българския демократичен форум, с общи усилия успява да постигне за кандидата си Румен Христов… 1,95%.

Вицепрезидентската институция, правомощията и жените

Трябва да се признае, че по отношение на равенството на половете вицепрезидентската институция се представя впечатляващо добре. От общо шестима вицепрезиденти на България трима, което ще рече половината, са жени. За сравнение, сред 21 премиери след 1989 г. има само една жена – служебната министър-председателка Ренета Инджова (преди 1989 г. този пост не е бил заеман от жени).

На какво ли се дължи джендър балансът при вицепрезидентите?

Мой бивш колега се шегуваше, че голямата му мечта е да е вицепрезидент. За да получава добра заплата за пет или десет години, без да му се налага да върши почти нищо. Между 6 юли 1993 г., когато Блага Димитрова напуска вицепрезидентския пост поради несъгласие с президента Желю Желев, и 22 януари 1997 г., когато встъпва в длъжност Тодор Кавалджиев, вицепрезидентската институция остава незаета, ала липсата ѝ на практика не се усеща.

Ако слуша човек Илияна Йотова обаче, работата ѝ на този пост е била не само отговорна, а и тежка. През 2022 г. в интервю за БНТ тя споделя:

Всъщност президентът ми възложи много тежки ресори – помилването, даването на българско гражданство, политическото убежище, работата с нашите сънародници зад граница.

Въпросните „тежки ресори“ впрочем почти изцяло се покриват с правомощията, които според Конституцията президентът има право да делегира на заместника си, само че назначаването на някои категории държавни служители се заменя с работа със сънародниците ни зад граница. Това ще рече повече пътувания в чужбина и срещи с български общности, посещаване на събития зад граница, в които участват изявени българи. Колко да е тежка тази работа…

Що се отнася до останалите ресори,

в България правомощието на вицепрезидента да предоставя убежище се характеризира с това, че то като цяло не се упражнява. И надеждите на политически бежанци като например саудитския дисидент Абдулрахман ал-Халиди, затворен близо пет години в Центъра за задържане на чужденци в Бусманци, да се възползват от тази процедура, след като Държавната агенция за бежанците им е отказала легален статут, остават попарени.

В по-голяма степен Йотова е упражнявала друго свое правомощие – например през същата 2022 година, в която дава цитираното по-горе интервю, тя е помилвала 9 души, повечето от които тежко болни. Въпреки многократните призиви да помилва осъдените за корупция (след зрелищно задържане, кампаниен процес и спорни доказателства) Десислава Иванчева и Биляна Петрова, тя изчаква до последния момент – въпреки влошеното им здраве и малкото дете на Иванчева. През 2024 г. Петрова е предсрочно освободена, а настоящата президентка помилва Иванчева 10 месеца преди изтичането на присъдата ѝ. Така хем бившата кметица на „Младост“ излиза на свобода, хем това става възможно по-скоро преди Йотова да се впусне в кандидатпрезидентската надпревара през 2026 г.

Най-упражняваното от Илияна Йотова правомощие безспорно е предоставянето на българско гражданство. Но нали не мислите, че лично тя решава дали заявлението на всеки кандидат за натурализация да бъде одобрено, или не?

Добра новина за жените?

Фактът, че България за първи път има президентка, ще овласти ли по някакъв начин жените? Ще бъдат ли те по-добре представени в обществения живот, ще бъдат ли интересите им по-защитени, ще последва ли вълна от жени, готови да се включат в политиката?

Отговорът на всички тези въпроси е един – не непременно. Важно е как Илияна Йотова ще изиграе картите си, какви послания ще отправя, какви ценности ще отстоява. Да не забравяме, че една друга силна жена в българската политика – бившата председателка на БСП Корнелия Нинова, много повече навреди на правата на жените с агресивната си реторика срещу Конвенцията на Съвета на Европа за превенция и борба с насилието над жени и домашното насилие, по-известна като Истанбулската конвенция, отколкото ги овласти. Май най-голямата полза от участието ѝ в политиката беше, че благодарение на нея много хора чуха думите фингъринг, фистинг и трибадизъм. И проявиха интерес да узнаят значението им.

Жена начело на държавата? Хубаво е, но не е достатъчно
Ако ротацията мине, за първи път в историята на България начело на редовен кабинет ще застане жена. Това би могло да значи много. Но Мария Габриел може и да е един приемлив параван за пред Брюксел. Светла Енчева разглежда някои от успешните и не чак дотам успешни примери за жени на лидерски позиции.
Имаме си президентка. И?

По отношение на Истанбулската конвенция впрочем реакциите на настоящата президентка бяха в стил „Ако не ви харесват ценностите ми, имам и други“.

Първоначално тя (както впрочем и партията, която издигна кандидатурата ѝ – БСП) твърдо се застъпваше България да ратифицира документа. И когато това не стана, Йотова изрази разочарованието си по време на форум за правата на жените:

В бурния поток от популистки изказвания най-малко се чу гласът на жертвите, на тези, които страдат от домашно насилие. В деня, в който Конвенцията бе изтеглена от Народното събрание, едно младо момиче в България, в столицата, загуби живота си, зверски пребито от приятеля си […] Ще кажете, че една конвенция не е панацея, и ще бъдете прави, но къде е волята за промяна на законите, къде е волята като хора да се справим с тези чудовищни случаи? Дано с поведението си не сме дали допълнителна сила и увереност на насилниците, че могат да продължават така, защото ще останат безнаказани.

Пред по-широка аудитория обаче – в ефира на bTV – Йотова беше доста по-различна. Тя се съгласи с предложението на БСП да се организира референдум за Истанбулската конвенция, което според нея означава, че документът трябва да се разясни на хората. Тогавашната вицепрезидентка не зададе логичния въпрос: защо гражданите на България да бъдат питани дали на част от тях да се попречи да продължат да бият и убиват жените си?

В крайна сметка гласът на Илияна Йотова в защита на жените заглъхна. Тя предпочете да не се стига до разрив с Румен Радев, както навремето между Блага Димитрова и Желю Желев. И е малко вероятно у нея тепърва да се разгори феминистки плам. Освен ако не говори пак на някой форум за женски права, за да каже това, което аудиторията очаква от нея.

Не е лесно да си жена в българската политика

Напоследък се говори за привличането на нови и млади личности в политиката, за представители на Gen Z в листите. Няма да е зле обаче още отсега да се помисли за стратегии за привличането и задържането на жените сред тях.

Неотдавна една от силните млади жени в политиката – Лена Бориславова, обяви, че ще се посвети на друго поприще. Това стана, след като години наред тя беше обект на слухове, компромати (не само от страна на жълти медии, а дори на БНТ), обидна песен (изпята от Слави Трифонов, председател на парламентарно представена партия), съдебни дела… Като се изключат инсинуациите за сексуалния ѝ живот, някои медии (нарочно не слагам линк) си позволиха да я критикуват и че се връща на работа 9 месеца след раждането на детето си. Обвинение, което няма да чуете да се отправя към мъж.

Преди време пък ми бяха казали за друга млада депутатка (понастоящем бивша) – Илина Мутафчиева от Зелено движение, че била несериозна, защото отсъствала от важно гласуване в парламента. После разбрах причината за „прегрешението ѝ“ – по същото време е раждала детето си.

Няма да е лесно на жените в българската политика, или поне на тези от тях, които действително се опитват да постигнат нещо освен собственото си кариерно израстване. Те ще бъдат мразени, ако са красиви, ако не са достатъчно красиви, ако са завършили „Харвард“ или друг престижен университет, ако имат деца, ако нямат деца…

Да се сложат няколко Gen Z-та в листите за цвят е лесно. По-трудно е да се задържат млади и кадърни хора в политиката, особено ако са жени. Засега първата президентка на България не изглежда да е извор на вдъхновение за последните.

The collective thoughts of the interwebz