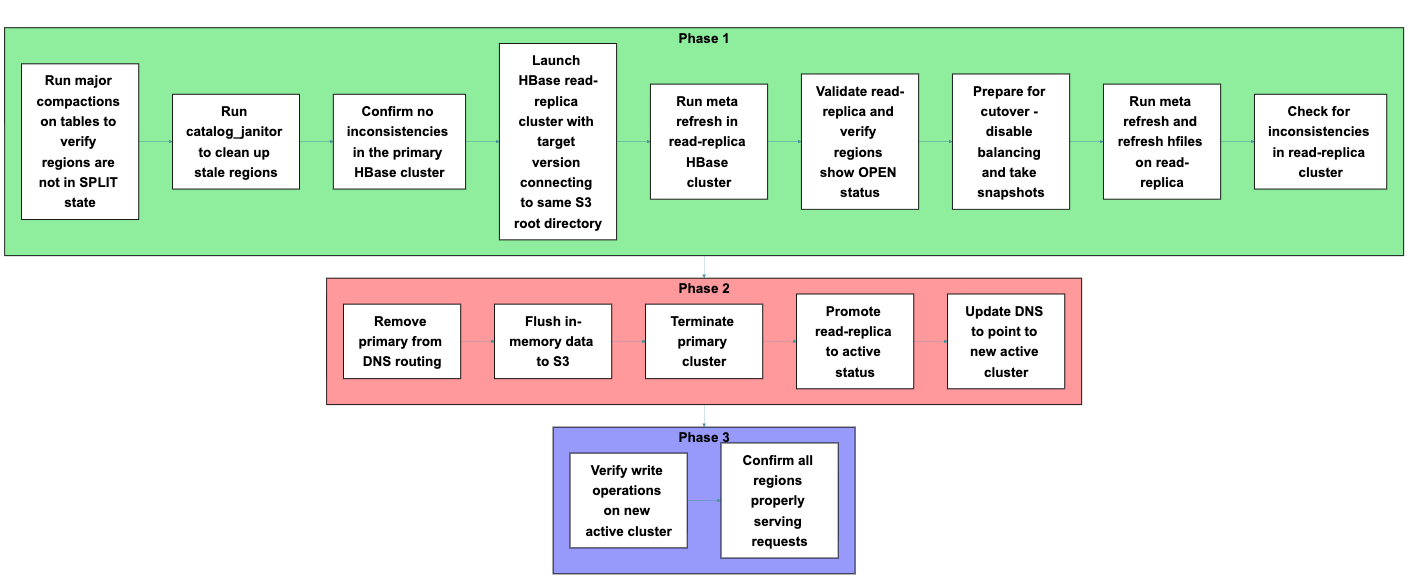
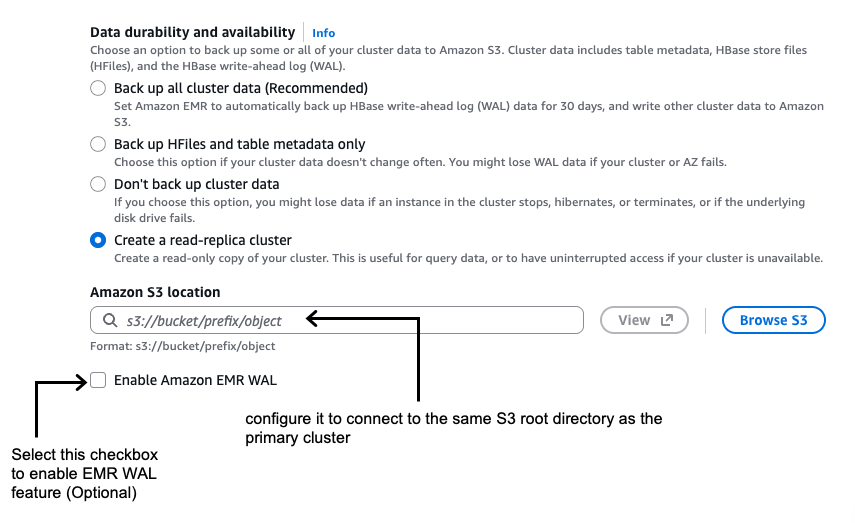
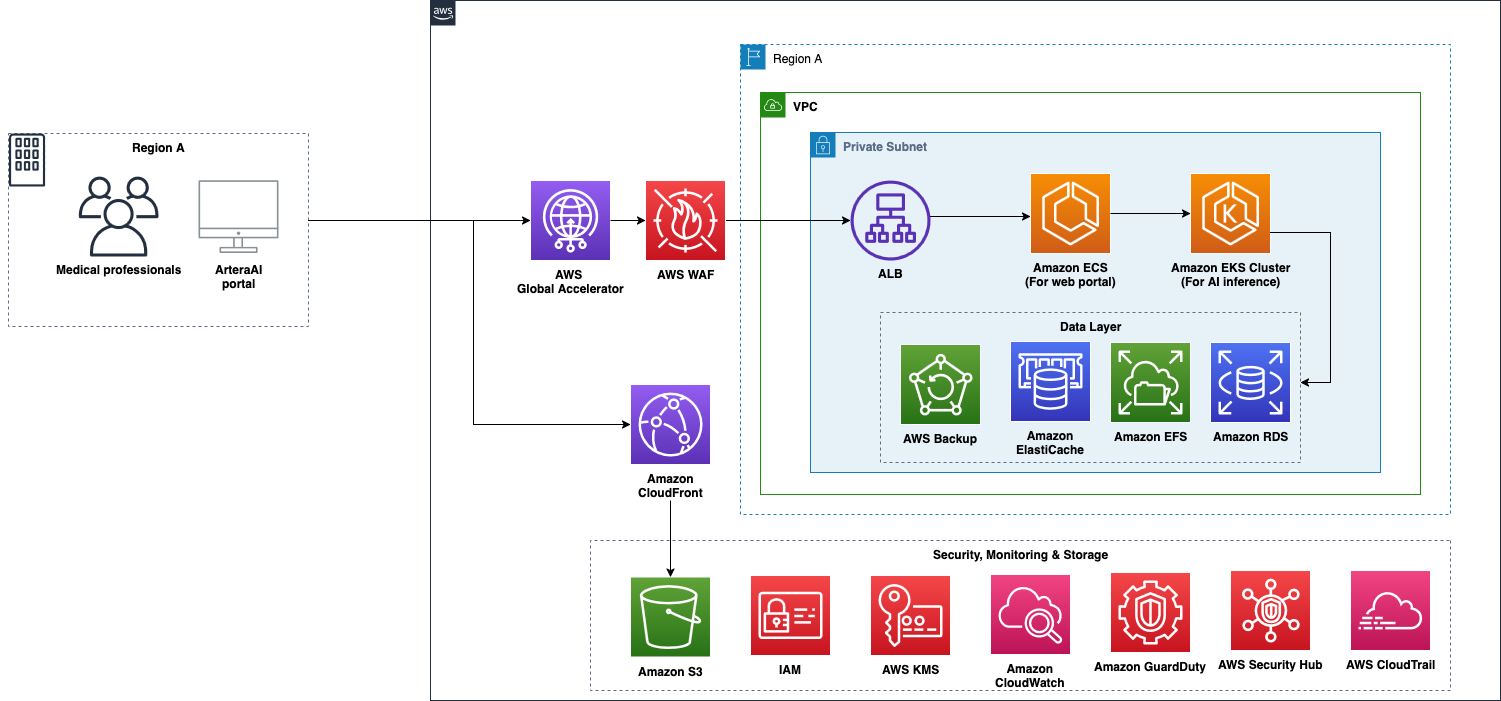
Building vertical microfrontends on Cloudflare’s platform

Post Syndicated from Brayden Wilmoth original https://blog.cloudflare.com/vertical-microfrontends/

Updated at 6:55 a.m. PT

Today, we’re introducing a new Worker template for Vertical Microfrontends (VMFE). This template allows you to map multiple independent Cloudflare Workers to a single domain, enabling teams to work in complete silos — shipping marketing, docs, and dashboards independently — while presenting a single, seamless application to the user.

Most microfrontend architectures are “horizontal”, meaning different parts of a single page are fetched from different services. Vertical microfrontends take a different approach by splitting the application by URL path. In this model, a team owning the `/blog` path doesn’t just own a component; they own the entire vertical stack for that route – framework, library choice, CI/CD and more. Owning the entire stack of a path, or set of paths, allows teams to have true ownership of their work and ship with confidence.

Teams face problems as they grow, where different frameworks serve varying use cases. A marketing website could be better utilized with Astro, for example, while a dashboard might be better with React. Or say you have a monolithic code base where many teams ship as a collective. An update to add new features from several teams can get frustratingly rolled back because a single team introduced a regression. How do we solve the problem of obscuring the technical implementation details away from the user and letting teams ship a cohesive user experience with full autonomy and control of their domains?

Vertical microfrontends can be the answer. Let’s dive in and explore how they solve developer pain points together.

What are vertical microfrontends?

A vertical microfrontend is an architectural pattern where a single independent team owns an entire slice of the application’s functionality, from the user interface all the way down to the CI/CD pipeline. These slices are defined by paths on a domain where you can associate individual Workers with specific paths:

/      = Marketing
/docs  = Documentation
/blog  = Blog
/dash  = Dashboard

We could take it a step further and focus on more granular sub-path Worker associations, too, such as a dashboard. Within a dashboard, you likely segment out various features or products by adding depth to your URL path (e.g. /dash/product-a) and navigating between two products could mean two entirely different code bases. 

Now with vertical microfrontends, we could also have the following:

/dash/product-a  = WorkerA
/dash/product-b  = WorkerB

Each of the above paths are their own frontend project with zero shared code between them. The product-a and product-b routes map to separately deployed frontend applications that have their own frameworks, libraries, CI/CD pipelines defined and owned by their own teams. FINALLY.

You can now own your own code from end to end. But now we need to find a way to stitch these separate projects together, and even more so, make them feel as if they are a unified experience.

We experience this pain point ourselves here at Cloudflare, as the dashboard has many individual teams owning their own products. Teams must contend with the fact that changes made outside their control impact how users experience their product. 

Internally, we are now using a similar strategy for our own dashboard. When users navigate from the core dashboard into our ZeroTrust product, in reality they are two entirely separate projects and the user is simply being routed to that project by its path /:accountId/one.

Visually unified experiences

Stitching these individual projects together to make them feel like a unified experience isn’t as difficult as you might think: It only takes a few lines of CSS magic. What we absolutely do not want to happen is to leak our implementation details and internal decisions to our users. If we fail to make this user experience feel like one cohesive frontend, then we’ve done a grave injustice to our users. 

To accomplish this sleight of hand, let us take a little trip in understanding how view transitions and document preloading come into play.

View transitions

When we want to seamlessly navigate between two distinct pages while making it feel smooth to the end user, view transitions are quite useful. Defining specific DOM elements on our page to stick around until the next page is visible, and defining how any changes are handled, make for quite the powerful quilt-stitching tool for multi-page applications.

There may be, however, instances where making the various vertical microfrontends feel different is more than acceptable. Perhaps our marketing website, documentation, and dashboard are each uniquely defined, for instance. A user would not expect all three of those to feel cohesive as you navigate between the three parts. But… if you decide to introduce vertical slices to an individual experience such as the dashboard (e.g. /dash/product-a & /dash/product-b), then users should never know they are two different repositories/workers/projects underneath.

Okay, enough talk — let’s get to work. I mentioned it was low-effort to make two separate projects feel as if they were one to a user, and if you have yet to hear about CSS View Transitions then I’m about to blow your mind.

What if I told you that you could make animated transitions between different views  — single-page app (SPA) or multi-page app (MPA) — feel as if they were one? Before any view transitions are added, if we navigate between pages owned by two different Workers, the interstitial loading state would be the white blank screen in our browser for some few hundred milliseconds until the full next page began rendering. Pages would not feel cohesive, and it certainly would not feel like a single-page application.


Appears as multiple navigation elements between each site.

If we want elements to stick around, rather than seeing a white blank page, we can achieve that by defining CSS View Transitions. With the code below, we’re telling our current document page that when a view transition event is about to happen, keep the nav DOM element on the screen, and if any delta in appearance exists between our existing page and our destination page, then we’ll animate that with an ease-in-out transition.

All of a sudden, two different Workers feel like one.

@supports (view-transition-name: none) {
  ::view-transition-old(root),
  ::view-transition-new(root) {
    animation-duration: 0.3s;
    animation-timing-function: ease-in-out;
  }
  nav { view-transition-name: navigation; }
}
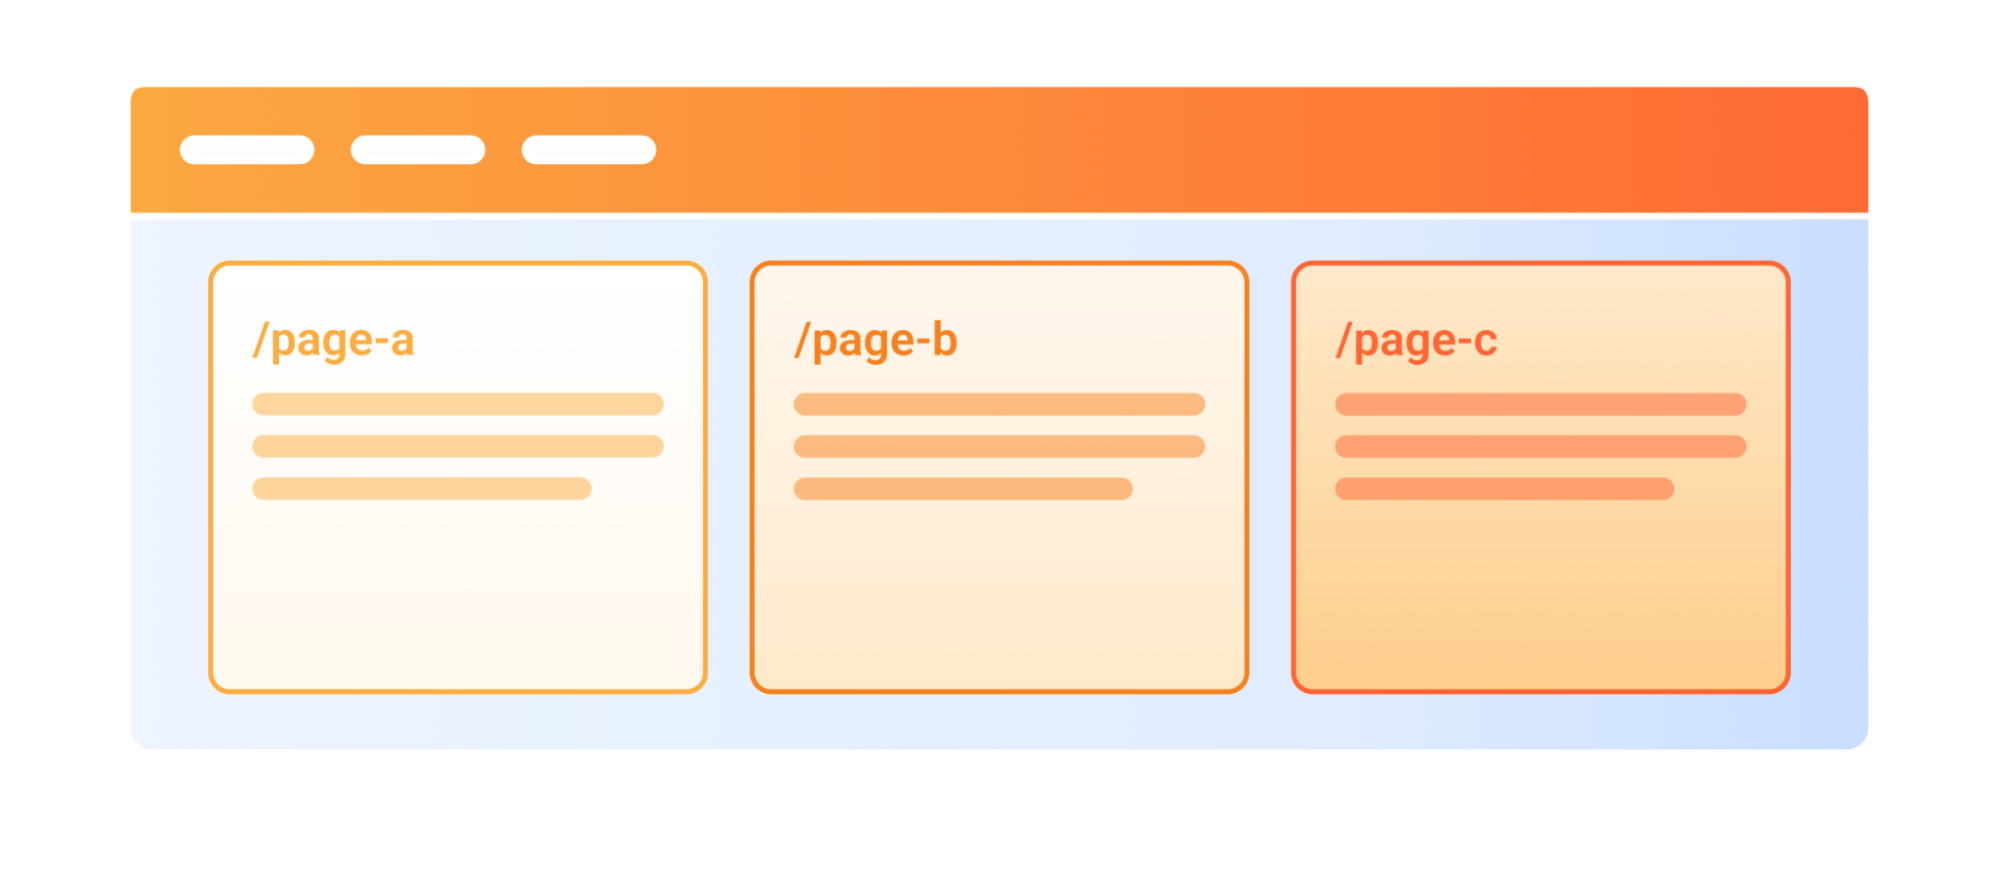
Appears as a single navigation element between three distinct sites.

Preloading

Transitioning between two pages makes it look seamless — and we also want it to feel as instant as a client-side SPA. While currently Firefox and Safari do not support Speculation Rules, Chrome/Edge/Opera do support the more recent newcomer. The speculation rules API is designed to improve performance for future navigations, particularly for document URLs, making multi-page applications feel more like single-page applications.

Breaking it down into code, what we need to define is a script rule in a specific format that tells the supporting browsers how to prefetch the other vertical slices that are connected to our web application — likely linked through some shared navigation.

<script type="speculationrules">
  {
    "prefetch": [
      {
        "urls": ["https://product-a.com", "https://product-b.com"],
        "requires": ["anonymous-client-ip-when-cross-origin"],
        "referrer_policy": "no-referrer"
      }
    ]
  }
</script>

With that, our application prefetches our other microfrontends and holds them in our in-memory cache, so if we were to navigate to those pages it would feel nearly instant.

You likely won’t require this for clearly discernible vertical slices (marketing, docs, dashboard) because users would expect a slight load between them. However, it is highly encouraged to use when vertical slices are defined within a specific visible experience (e.g. within dashboard pages).

Between View Transitions and Speculation Rules, we are able to tie together entirely different code repositories to feel as if they were served from a single-page application. Wild if you ask me.

Zero-config request routing

Now we need a mechanism to host multiple applications, and a method to stitch them together as requests stream in. Defining a single Cloudflare Worker as the “Router” allows a single logical point (at the edge) to handle network requests and then forward them to whichever vertical microfrontend is responsible for that URL path. Plus it doesn’t hurt that then we can map a single domain to that router Worker and the rest “just works.”

Service bindings

If you have yet to explore Cloudflare Worker service bindings, then it is worth taking a moment to do so.

Service bindings allow one Worker to call into another, without going through a publicly-accessible URL. A Service binding allows Worker A to call a method on Worker B, or to forward a request from Worker A to Worker. Breaking it down further, the Router Worker can call into each vertical microfrontend Worker that has been defined (e.g. marketing, docs, dashboard), assuming each of them were Cloudflare Workers.

Why is this important? This is precisely the mechanism that “stitches” these vertical slices together. We’ll dig into how the request routing is handling the traffic split in the next section. But to define each of these microfrontends, we’ll need to update our Router Worker’s wrangler definition, so it knows which frontends it’s allowed to call into.

{
  "$schema": "./node_modules/wrangler/config-schema.json",
  "name": "router",
  "main": "./src/router.js",
  "services": [
    {
      "binding": "HOME",
      "service": "worker_marketing"
    },
    {
      "binding": "DOCS",
      "service": "worker_docs"
    },
    {
      "binding": "DASH",
      "service": "worker_dash"
    },
  ]
}

Our above sample definition is defined in our Router Worker, which then tells us that we are permitted to make requests into three separate additional Workers (marketing, docs, and dash). Granting permissions is as simple as that, but let’s tumble into some of the more complex logic with request routing and HTML rewriting network responses.

Request routing

With knowledge of the various other Workers we are able to call into if needed, now we need some logic in place to know where to direct network requests when. Since the Router Worker is assigned to our custom domain, all incoming requests hit it first at the network edge. It then determines which Worker should handle the request and manages the resulting response. 

The first step is to map URL paths to associated Workers. When a certain request URL is received, we need to know where it needs to be forwarded. We do this by defining rules. While we support wildcard routes, dynamic paths, and parameter constraints, we are going to stay focused on the basics — literal path prefixes — as it illustrates the point more clearly. 

 In this example, we have three microfrontends:

/      = Marketing
/docs  = Documentation
/dash  = Dashboard

Each of the above paths need to be mapped to an actual Worker (see our wrangler definition for services in the section above). For our Router Worker, we define an additional variable with the following data, so we can know which paths should map to which service bindings. We now know where to route users as requests come in! Define a wrangler variable with the name ROUTES and the following contents:

{
  "routes":[
    {"binding": "HOME", "path": "/"},
    {"binding": "DOCS", "path": "/docs"},
    {"binding": "DASH", "path": "/dash"}
  ]
}

Let’s envision a user visiting our website path /docs/installation. Under the hood, what happens is the request first reaches our Router Worker which is in charge of understanding what URL paths map to which individual Workers. It understands that the /docs path prefix is mapped to our DOCS service binding which referencing our wrangler file points us at our worker_docs project. Our Router Worker, knowing that /docs is defined as a vertical microfrontend route, removes the /docs prefix from the path and forwards the request to our worker_docs Worker to handle the request and then finally returns whatever response we get.

Why does it drop the /docs path, though? This was an implementation detail choice that was made so that when the Worker is accessed via the Router Worker, it can clean up the URL to handle the request as if it were called from outside our Router Worker. Like any Cloudflare Worker, our worker_docs service might have its own individual URL where it can be accessed. We decided we wanted that service URL to continue to work independently. When it’s attached to our new Router Worker, it would automatically handle removing the prefix, so the service could be accessible from its own defined URL or through our Router Worker… either place, doesn’t matter.

HTMLRewriter

Splitting our various frontend services with URL paths (e.g. /docs or /dash) makes it easy for us to forward a request, but when our response contains HTML that doesn’t know it’s being reverse proxied through a path component… well, that causes problems. 

Say our documentation website has an image tag in the response <img src="./logo.png" />. If our user was visiting this page at https://website.com/docs/, then loading the logo.png file would likely fail because our /docs path is somewhat artificially defined only by our Router Worker.

Only when our services are accessed through our Router Worker do we need to do some HTML rewriting of absolute paths so our returned browser response references valid assets. In practice what happens is that when a request passes through our Router Worker, we pass the request to the correct Service Binding, and we receive the response from that. Before we pass that back to the client, we have an opportunity to rewrite the DOM — so where we see absolute paths, we go ahead and prepend that with the proxied path. Where previously our HTML was returning our image tag with <img src="./logo.png" /> we now modify it before returning to the client browser to <img src="./docs/logo.png" />.


Let’s return for a moment to the magic of CSS view transitions and document preloading. We could of course manually place that code into our projects and have it work, but this Router Worker will automatically handle that logic for us by also using HTMLRewriter. 

In your Router Worker ROUTES variable, if you set smoothTransitions to true at the root level, then the CSS transition views code will be added automatically. Additionally, if you set the preload key within a route to true, then the script code speculation rules for that route will automatically be added as well. 

Below is an example of both in action:

{
  "smoothTransitions":true, 
  "routes":[
    {"binding": "APP1", "path": "/app1", "preload": true},
    {"binding": "APP2", "path": "/app2", "preload": true}
  ]
}

Get started

You can start building with the Vertical Microfrontend template today.

Visit the Cloudflare Dashboard deeplink here or go to “Workers & Pages” and click the “Create application” button to get started. From there, click “Select a template” and then “Create microfrontend” and you can begin configuring your setup.
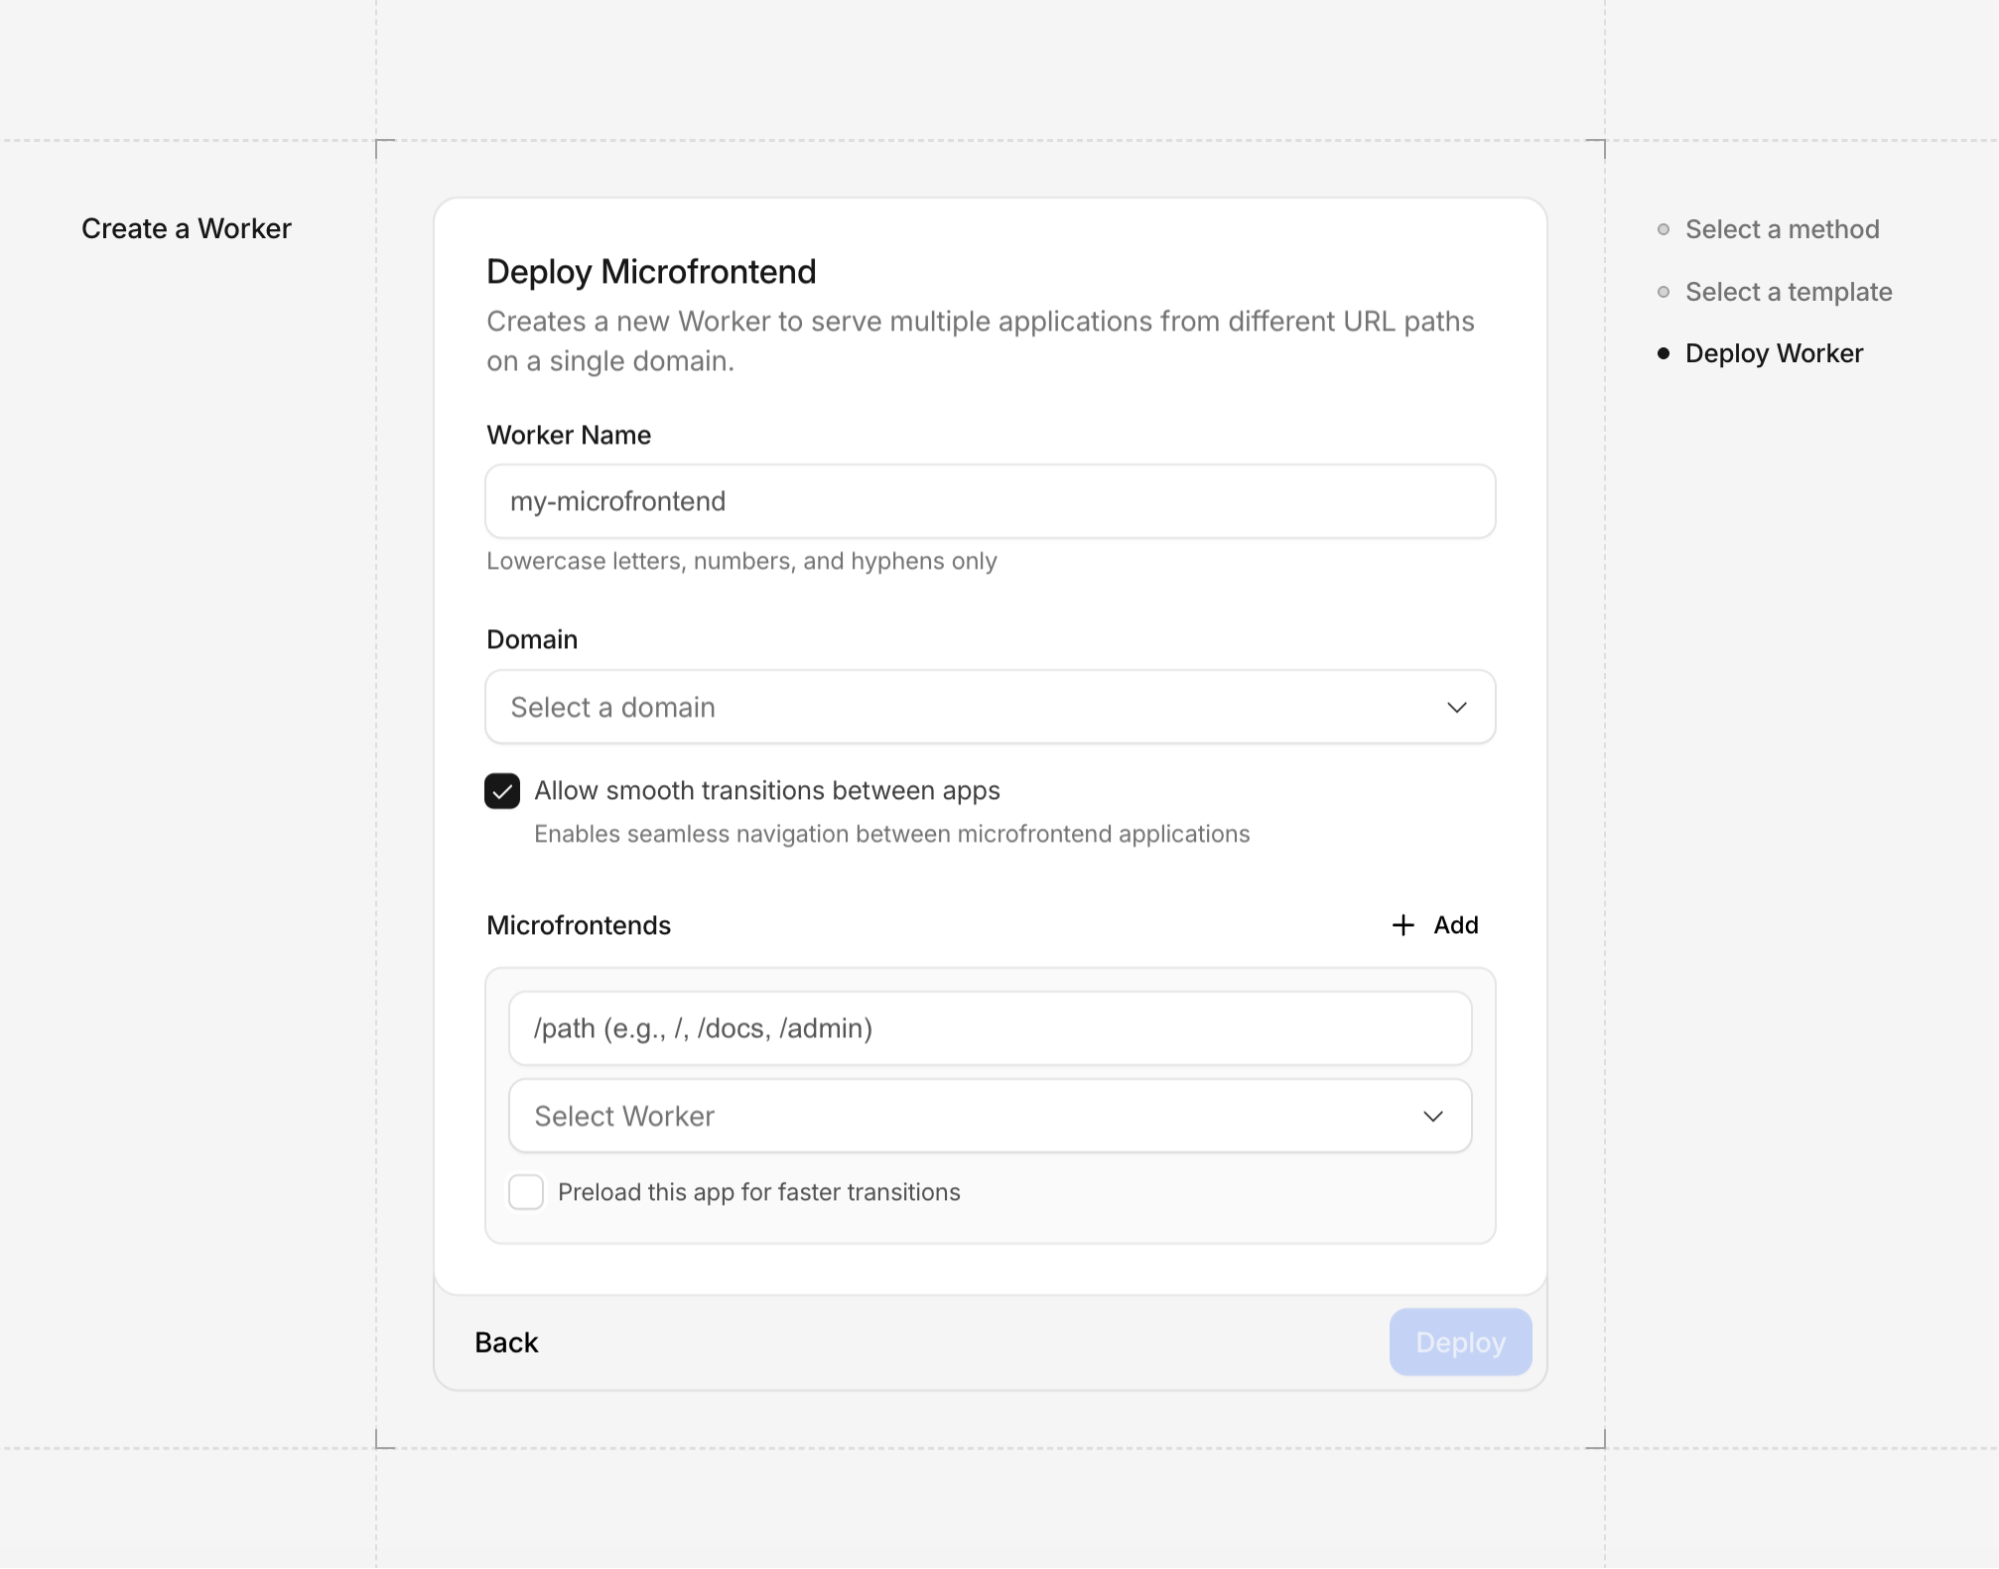

Check out the documentation to see how to map your existing Workers and enable View Transitions. We can’t wait to see what complex, multi-team applications you build on the edge!


Научни новини: Генни технологии, астронавти, химически фосили и климатични промени

Post Syndicated from Михаил Ангелов original https://www.toest.bg/nauchni-novini-genni-tehnologii-astronavti-himicheski-fosili-i-klimatichni-promeni/

Крачка към съвременните генни технологии в Европа

Научни новини: Генни технологии, астронавти, химически фосили и климатични промени

Регулациите относно намесите в генома на растенията в Европа са сравнително стари и все още третират растенията, създадени с новите геномни техники (НГТ), например CRISPR, като „традиционни ГМО“ въпреки големия обем научни доказателства за тяхната безопасност и еквивалентност на сортовете, получени с конвенционални селекционни подходи. С нарастването на риска Европа да изостане от другите държави, в които тези растения са одобрени, широката научна общност и по-прогресивните земеделски производители очаквано започнаха да настояват за осъвременяване на законите.

Така в средата на 2023 г. Европейската комисия предложи преразглеждане на регулациите, като тогава бяха описани някои основни положения. Накратко, идеята беше генетично манипулираните растения да се разделят в две категории. В първата влизат растения с промени, които могат да се срещнат в природата или да се постигнат с традиционните техники за селекция. Втората включва останалите, които могат да носят ДНК от чужди организми или имат по-големи намеси в генома. Оттогава, освен в науката, прогрес има и в бюрокрацията.

Научни новини: ГМО и глобално затопляне
Да си поговорим за ГМО и глобално затопляне. В случая ще говори Михаил Ангелов чрез своите научни новини. Този път е подбрал две големи теми – за генетичните манипулации и за затоплянето на планетата.
Научни новини: Генни технологии, астронавти, химически фосили и климатични промени

В началото на миналия месец Съветът на Европейския съюз постигна предварително споразумение с Европейския парламент за установяване на нов набор от правила, които да оформят законовата рамка за НГТ.

Според споразумението двете категории растения се запазват и тези в първата ще се разглеждат като еквивалентни на традиционните растения. Както и в предложението от 2023 г., етикети ще се поставят само на семената, от които се отглеждат, но на самите растения, както и на продуктите, получени от тях, няма да има етикет, за да се спази принципът за еквивалентност. Според Съвета това няма да доведе до тежест за селекционерите, но ще позволи на производителите да изключат НГТ от процесите си. Все пак се предвиждат някои изключения за конкретни агрономични принципи. Например толерантността към хербициди, както и отделянето на инсектицидни вещества ще означава автоматично прехвърляне на растенията към втората категория.

Растенията в нея ще бъдат регулирани по-стриктно. Освен семената, етикети ще носят и продуктите, получени от такива растения, като етикетът ще съдържа информация за всички агрономични признаци, в които е имало намеса. Така Съветът цели да гарантира, че потребителите ще имат информация за извършените редакции. Важно решение е да се даде възможност на държавите членки да изберат да не отглеждат растения, получени чрез по-сериозни намеси.

Пречките и надеждите пред CRISPR
Като всеки инструмент, CRISPR може да бъде използван и за спорни цели. Но възможностите, които предлага, са много обещаващи. Някоя от модификациите му или нова подобна система ще бъде в основата на…
Научни новини: Генни технологии, астронавти, химически фосили и климатични промени

Интересно е, че националните органи ще проверяват дали растенията принадлежат към първата категория. За това може би ще се разчита и на организациите, регистриращи новите растения, защото намесите в общия случай са неразличими от случайно настъпили мутации, които се срещат в природата, и от традиционния селекционен процес, което е основата на принципа на еквивалентност. Когато тези растения вече са разпределени в първа категория (например регистрирани като сорт), потомството им няма да бъде проверявано впоследствие, подобно на процедурите за новите сортове в момента.

Една от особено важните теми по отношение на новите регулации е защитата на интелектуалната собственост. Намирането на баланс между различните интереси може да се окаже трудно, но е от изключителна важност за постигане на целта на предложението, а тя е нов подем в развитието на биотехнологичния сектор в Европа. Една от големите тънкости ще бъде да се осигурят равни условия за по-малките компании, така че пазарът да не се консолидира в корпорациите, които имат основен контрол върху него в момента.

Съветът и Парламентът ще създадат експертна група по патентоване, която ще се състои от експерти от всички страни членки, с цел разглеждане на въздействието на патентите. Една година след влизането в сила на регламента Комисията ще публикува проучване на въздействието на патентоването върху иновациите, наличието на семена за земеделските стопани и конкурентоспособността на сектора на растителната селекция в ЕС. 

За финализиране на процедурата предварителното споразумение трябва да бъде одобрено от Съвета и Парламента. Това ще открие много нови възможности пред европейските селекционери, като същевременно ще гарантира безопасността на потребителите.

Неочаквано завръщане

Графикът на астронавтите, които пребивават в Международната космическа станция (МКС), се подготвя изключително стриктно и в него няма много място за импровизации. Наред с всекидневната им програма, датите за пристигане на станцията и тръгването от нея се планират месеци предварително. Въпреки това понякога се налагат промени – например удължаването на престоя на Суни Уилямс и Бъч Уилмор, които прекараха 286 вместо планираните 8 дни поради технически проблеми с капсулата, която трябваше да ги върне.

Научни новини: Титанови сърца, генни редакции, биополимери и една космическа одисея с щастлив край
Както сме отбелязвали, научните новини са по-добрите новини. Този път Михаил Ангелов ни разказва за човека с титаново сърце, за яванските макаци и за възможната нова употреба на целулозата, а за финал имаме щастливия край на историята с космокрушенците Суни Уилямс и Бъч Уилмор.
Научни новини: Генни технологии, астронавти, химически фосили и климатични промени

Промени са настъпвали и в предвидени космически разходки извън станцията вследствие на здравословни проблеми, така че когато NASA първоначално съобщи за отлагане на следващото излизане на астронавтите, нямаше особена тревога за тяхното състояние. От МКС трябваше да излязат двамата американци от екипаж 11 на SpaceX – Зина Кардман и Майк Финк. Не се предвиждаше участие на японеца Кимия Юи и руснака Олег Платонов. 

Но ситуацията бързо се превърна в безпрецедентна, когато на пресконференция ръководителят на NASA Джаред Айзъкман съобщи, че един от членовете на екипаж 11 има нужда от медицински преглед, който няма как да бъде извършен на борда на МКС. От Агенцията запазиха името на астронавта и естеството на проблема в тайна, но Айзъкман го определи като „сериозен здравословен проблем“, уточнявайки, че пациентът „вече [е] стабилен“. Това предизвика спекулации от любителите на Космоса, които започнаха внимателно тълкуване на официалните изявления в търсене на следа какво точно се е случило и с кой астронавт.

Потенциална улика беше чут разговор на Юи, в който той иска да говори с медицинско лице, питайки конкретно за хирург. Но това не даде задоволителен отговор на мистерията, тъй като Юи не бе част от планираните ремонтни дейности извън станцията. От Японската агенция за аерокосмически изследвания (JAXA) също съобщиха, че той е здрав.

Така седмица след съобщението капсулата „Дракон“ с екипажа се приводни успешно в бреговата ивица на Калифорния, близо до Сан Диего. По време на живото излъчване астронавтите изглеждаха в добро състояние, без видими здравословни проблеми. Четиримата прекараха една вечер в местна болница, след което се завърнаха в Хюстън за разбор на мисията и среща със семействата си.

Един от интересните коментари, направени от главния медицински директор на NASA д-р Полк, беше, че според математическите анализи на Агенцията вероятността за подобни събития е средно едно на всеки три години. Дали това, че се случва за първи път в рамките на 25 години, е следствие от доброто общо здраве на хората, подбрани за астронавти, или е чист късмет, не е ясно.

Вследствие на извънредната ситуация с екипаж 11, на станцията остана намален състав от други трима астронавти, само един от които американец. Той трябваше да поеме грижите за всички американски модули – вариантът не е оптимален, но не застрашава нормалното функциониране на МКС. Въпреки това в NASA и SpaceX веднага започнаха да разглеждат възможността за изстрелване на следващите астронавти по-рано от предвиденото в средата на февруари. Те вече са в карантина и се подготвят за пътуване след 11 февруари.

Случилото се показва, че дори и при отлично планиране, с каквото е известна NASA (на борда на МКС има сериозен набор от медицинско оборудване), възникват извънредни ситуации, които не могат да се разрешат в орбита. С оглед на предвижданото засилване на човешкото присъствие в Космоса, здравето на астронавтите ще става все по-важен фактор за космическите агенции. Това беше и едно от нещата, на които обърнаха внимание астронавтите на пресконференцията след завръщането си. 

Стъпка към това е планираната за тази година мисия до Луната – „Артемис 2“, в която четирима астронавти (трима от САЩ и един от Канада) ще обиколят спътника ни, както в мисията „Аполо 8“. Целта е да се изпитат ракетата носител SLS и апаратът „Орион“, в който ще пътува екипажът. Както при ранните мисии „Аполо“, орбитата на „Орион“ ще е на „свободно връщане“ към Земята. Тя има форма на осмица и използва гравитационната сила на Луната, така че дори да възникне проблем с двигателите, капсулата да се завърне на планетата. Плановете са ракетата да бъде изстреляна след началото на февруари, но точната дата все още не е ясна.

Еволюционни изненади

Как и кога са възникнали по-сложните форми на живот, е въпрос, на който най-вероятно няма да получим конкретен отговор. Тъй като става дума за малки организми, които нямат кости или черупки, откриването и работата с техните фосили (или сходни отпечатъци) са изключително трудни. За справяне с проблема са разработени различни подходи, всеки със своите предимства и недостатъци.

Един от тях е търсенето на „химически фосили“ – вещества, които се отделят само от отделен тип организми. Сред най-често използваните са стераните, които са стабилни форми на стеролите (вид липиди, най-известният от които е холестеролът). При определени условия на средата те се запазват в скалните пластове, което дава възможност да бъдат извлечени, а после според тяхната структура да се определи от какъв организъм идват. 

Именно по този начин са открити следи от родственици на роговите водни гъби, живели преди Камбрийския взрив. Потвърждението идва от стерани, съдържащи 30 и 31 въглеродни атома – сравнително редки форми, характерни за този тип водни гъби. Това ги прави едни от най-ранно известните ни животни, като почти сигурно те са живеели в океана. Според авторите на изследването, освен доказателство за съществуването на тези животни още през неопротерозоя, това показва полезността на метода за проследяване на появата и разпространението на животните през епохите.

Научни новини: Генни технологии, астронавти, химически фосили и климатични промени
Снимка: Albert Kok, Източник: Wikimedia / CC BY-SA 3.0

Въпреки че този подход е обещаващ, съществува възможност за получаване на грешни резултати вследствие на замърсяване или изненади в биологията на неизследваните видове. Поради това някои учени предпочитат използването на т.нар. молекулярен часовник. Методът се основава на допускането, че мутациите в организмите се натрупват сравнително линейно и така, като се сравняват ДНК на няколко организма, може да се определи еволюционното разстояние между тях.

Именно по този начин ново изследване ни връща още по-назад във времето в опит да се открие повече информация за еволюцията на ранните еукариотни клетки (тези с обособено ядро). Анализът е извършен върху голям набор геноми, а фокусът е върху разликите между прокариотите (без ядро) и еукариотите. Според получените данни в периода мезоархай – палеопротерозой (между 3 и 2,5 млрд. години) еукариотните клетки вече са съществували, при това със сложен клетъчен апарат. Освен ядро те са имали цитоскелет и различни мембранни структури, през които се е извършвал транспорт на вещества. В по-късен момент те са получили и друг важен органел – митохондриите.

Това са структури, в които протича процесът на клетъчно дишане – при него с помощта на кислород въглехидратите се превръщат във въглероден диоксид, вода и енергия, която организмът може да използва за своите нужди. Те са важен фактор за развитието на по-сложни форми на живот и са популяризирани с фразата „митохондриите са електроцентралите на клетката“.

Към момента е приета „ендосимбионтната теория“, според която митохондриите са едноклетъчни организми, погълнати от еукариотна клетка. Вместо да бъдат „изядени“, те са останали в симбиоза с нея: получават хранителни вещества, а гостоприемникът – значително количество енергия. Въпреки че не е пряко доказана, теорията е подкрепена от много информация. Поредното парче от пъзела идва от това изследване, описващо съществуването на сложна еукариотна клетка, в която се асимилира предшественикът на митохондриите.

Климатичните промени накратко

Температурните рекорди продължават.

Данни от услугата за изменение на климата на европейската програма „Коперник“ показват, че температурите през последните 11 години са най-високите измерени досега, с рекорди през последните три. На първо място е 2024-та, последвана от 2023-та, която е на пренебрежимите 0,01℃ от 2025-та. Очакванията са, че тази година няма да бъде много по-различна и ще продължи тенденцията за затопляне. Сходна е ситуацията и в океаните, които са погълнали рекордно количество топлина в последната година. Това е предпоставка за по-непредвидими промени в глобалния климат, които могат да се изразяват и в по-засилени валежи и необичайни застудявания. Отделените емисии продължават да се покачват въпреки различните мерки, които се предлагат. Част от емисиите най-вероятно могат да се обяснят с растящите електрически мощности, нужни за новите ИИ изчислителни центрове.

Комарите стават все по жадни за човешка кръв.

Откриването на човешка кръв в насекоми, събрани от защитена местност в бразилската джунгла, е изненада. Изглежда, с намаляването на видовия състав в екосистемите насекомите се принуждават да търсят нови източници на ценния ресурс. Това се среща дори при видове, които обикновено предпочитат само един вид – изводът е, че те изпитват трудности да откриват обичайните си гостоприемници. 

Освен до промяна в хранителните им навици това може да доведе и до увеличаване на броя им – за връзката между изсичането на горите и намножаването на маларийните комари се знае от повече от 15 години. Данните ясно показват как нарушаването на хабитатите рязко повишава риска от разпространяване на познати или нови заболявания. 

Според авторите на изследването е нужно да се обособят системи за наблюдение, с които да се следи храненето на комарите, а информацията от тях да се използва за по-добър контрол на популациите им и за дейности по възстановяване на засегнатите екосистеми.

Изненада от Ледената епоха.

В стомаха на млад вълк, попаднал в сибирския пермафрост преди около 14 400 години, е открито парче месо, което според ДНК анализа принадлежи на вълнест носорог. Геномът на носорога показва, че местната популация към момента е била достатъчно голяма и няма признаци за близкородствено чифтосване.

Научни новини: Генни технологии, астронавти, химически фосили и климатични промени
Рисунка на вълнести носорози, открита в пещерата Шове в Южна Франция. Според учените пещерата е обитавана преди повече от 30 000 години. Снимка: Claude Valette Източник: Wikimedia / CC BY-SA 4.0

Липсата на следи от намаляване на популацията най-вероятно означава, че тя е изчезнала сравнително бързо. Времево това съвпада с периода на междинно затопляне Bølling–Allerød (14 700–12 900 години), през който температурите в Северното полукълбо се повишават рязко с около 2–3℃. Това води до съществена промяна и за повечето мамути, както и за северноамериканската мегафауна. Освен чисто техническото постижение да се секвенира геном от остатъци, открити в стомаха на животно, живяло през Ледниковата епоха, изследването показва колко пагубни могат да бъдат резките промени в глобалните температури, особено за видове със специфичен ареал и трудности при адаптирането.


Веднъж месечно Михаил Ангелов – биолог, агроном и любим нърд от нашия екип, ни представя най-интересните скорошни новини от различни сфери на науката и обяснява защо тези постижения са толкова значими за света и човечеството. Или най-малкото – любопитни и забавни.

Зимна песен

Post Syndicated from Тоест original https://www.toest.bg/zimna-pesen/

Зимна песен

Газиш в преспи сняг и кал,
севернякът хапе,
лед реката е сковал,
а носът ти капе.
Зимата без зрънце жал
блъска и бедняк и крал,
селяни и папи.

В шал увит, студа кълнеш,
мръзнат ти ушите,
вежди и брада са в скреж,
дебнат те бронхити.
Надалеч от хора беж,
вчера здрав – днес палят свещ,
болестта не пита.

По обед още пада здрач,
три пръста лед върху перваза,
кашлюка всеки минувач
и пръска със зарази.
Върви си, музо, с твоя плач
и с твоя скръбен тъжен грач,
че лютнята ги мрази.

Със другар и кръвен брат
злата зима ще забравя –
още съм и здрав, и млад,
чаши пресушавам,
студ и мраз не ще ме спрат,
тази течна благодат
като огън сгрява.

Ана Мария Ленгрен, 1793 г.
превод от шведски Мария Змийчарова


Ана Мария Ленгрен (1754–1817) е шведска поетеса и един от ключовите автори на Шведското просвещение. Член на Гьотеборгското кралско научно-литературно дружество и на Utile Dulci, научно-музикална общност, която се смята за предшественик на Шведската академия. В поезията си често пародира жанра на пасторала и баладата, използва сатира, сарказъм и ирония и съчетава трезва снизходителност към слабостите на хората с критики срещу класовото разделение в Швеция, привилегиите на аристокрацията и незавидното положение на умната и образована жена.

Мария Змийчарова (р. 1983) превежда поезия, проза и драматургия от английски, шведски, датски и норвежки. Нейни поетични преводи са включени в сборниците „Голямата загадка“, избрани стихотворения от Тумас Транстрьомер („Жанет-45“, 2013) и „Антология на датската поезия XVII–XXI в.“ (Университетско издателство „Св. Климент Охридски“, 2025).


Според Екатерина Йосифова „четящият стихотворение сутрин… добре понася другите часове“ от деня. Убедени, че поезията държи умовете ни будни, а сърцата – отворени, в края на всеки месец ви предлагаме по едно стихотворение. Защото и в най-смутни времена доброто стихотворение е добра новина.

Announcing the AWS Digital Sovereignty Well-Architected Lens

Post Syndicated from Swapnonil Mukherjee original https://aws.amazon.com/blogs/architecture/announcing-the-aws-digital-sovereignty-well-architected-lens/

As organizations accelerate cloud adoption, meeting digital sovereignty requirements has become essential to build trust with customers and regulators worldwide. The challenge isn’t whether to adopt the cloud—it’s how to do so while meeting sovereignty requirements, using a multidisciplinary approach.

Even though requirements vary by geography, organizations commonly address them through technical and operational controls applied consistently at scale. Controls address specific needs related to data residency, data protection, data privacy, access control, and resiliency. These controls also map to security and privacy baselines plus industry regulations. Examples include German BSI C5, UK GDPR, EU DORA, and newer regulations such as the EU AI Act.

Beyond technical and operational controls, in some jurisdictions, customers might have to align with interoperability and portability mandates requiring the adoption of specific infrastructure components, technology standards, and locally sourced software components.Partners and customers have said that they understand how AWS is sovereign-by-design, but they want to go further and apply those same design principles and best practices to their own workloads. Today, we’re introducing the AWS Digital Sovereignty Well-Architected Lens, a framework that helps you design, build, and operate workloads that are sovereign, compliance-aligned, and auditable while being survivable, interoperable, and portable across a range of deployment options.

The Digital Sovereignty Lens is available in the form of a whitepaper and as a custom lens file from AWS Well-Architected custom lens GitHub repository.

The AWS Well-Architected Framework

The AWS Well-Architected Framework is a structured assessment tool divided into six pillars. Each pillar is organized into a hierarchy of themes, questions, and best practices. Best practices describe the benefits of adoption. They also list actionable implementation guidance and implementation steps. The Digital Sovereignty Lens follows the same structure and is meant to complement the Well-Architected Framework. It presents additional questions and best practices designed to improve the digital sovereignty posture of your workloads.

How is the lens organized?

The Digital Sovereignty Lens outlines more than 60 best practices spread across the four pillars of Operational Excellence, Security, Reliability, and Performance Efficiency. It does not add new best practices to the Cost Optimization and Sustainability pillars. You should use existing best practices already defined in the Well-Architected Framework under those two pillars.

Each best practice in the Digital Sovereignty Lens maps to a specific question of the form “How do you do X?” For example, for the question “How do you design your workload for continuous auditability?”, the associated best practices include planning and preparing for audits, and automating evidence collection and reporting.

Underpinning the questions and the associated best practices are a set of design principles. The design principles list the key challenges organizations face and document steps required to address those challenges.

Design principles

The Digital Sovereignty Lens outlines five core design principles that engineering teams can adopt to address sovereignty requirements. These design principles build on top of secure by design and privacy by design principles. The principles and the key areas they address include:

  • Apply standardized enforceable controls – Rather than relying on spreadsheets and manual enforcement, apply standardized compliance-aligned controls using policy as code and compliance as code practices. Automated controls leave no room for interpretation and reduce the risk of inconsistent implementations across teams.
  • Establish adequate security posture in line with data sensitivity levels – Apply access controls, build data perimeters, and protect data at rest, in transit, and during compute. Calibrate controls to data sovereignty requirements—such as residency and export controls—to maintain business agility without compromising security or compliance.
  • Design for continuous compliance – Point-in-time certifications are just snapshots. Integrate compliance checks throughout your software development lifecycle and collect evidence required for audits on a continuous basis. When compliance is built in from the start, you reduce compliance violations and maintain a consistently audit-ready posture.
  • Design for interoperability and portability – Design workloads for interoperability and portability from the start. Build abstractions into your code and configurations, then test across multiple environments to verify consistent functionality.
  • Design for survivability – Document system dependencies and fault isolation boundaries. Align your recovery objectives with business continuity goals, define what a minimum restorable service looks like, and test your recovery paths regularly.

Best practices

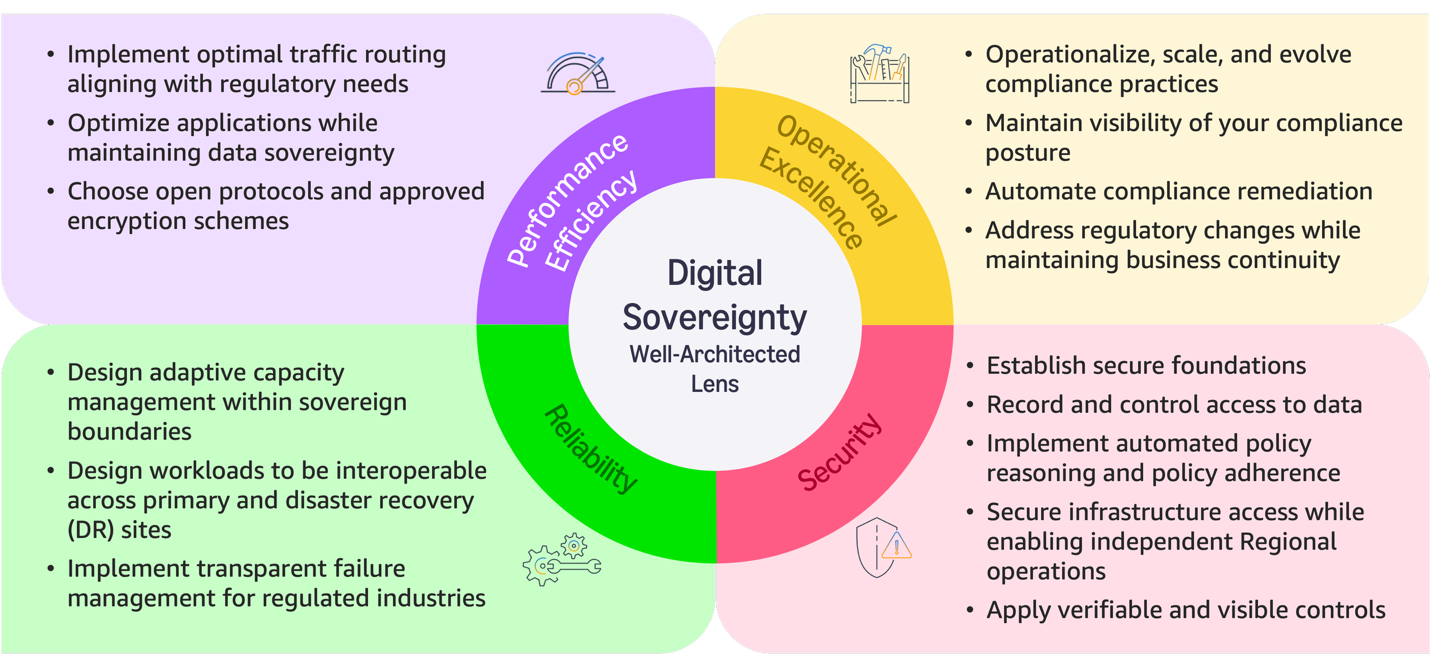
The following diagram provides a snapshot of some of the best practices in the lens.

Trust and transparency are key attributes of a sovereign workload. Trust is achieved through verification, not through claims. The Operational Excellence pillar focuses on best practices that lead to continuous compliance and auditability, improving verifiability. The Security pillar provides best practices that lead to greater visibility of controls and recommends independent Regional operations. The Reliability pillar addresses the need to achieve a balance between sovereignty and survivability by carefully considering how you design workloads for automated recoverability and protect data sovereignty. The Performance Efficiency pillar focuses on adopting standard protocols to optimize networking and compute in alignment with regulatory needs.

Who should use this lens?

The following users can benefit from this lens:

  • Policy-makers and regulators – Use the sovereignty outcomes and general design principles as described earlier in this post to develop jurisdictional and sectoral digital sovereignty models.
  • Technical leaders (CxOs and enterprise architects) – Use the lens as an input while outlining enterprise architecture strategies, or towards making objective technology decisions.
  • Security and compliance consultants – Use the design principles and best practices to develop privacy and security policies that can subsequently be translated into technical and operational controls.
  • Builders – Use the lens as a key input while designing, developing, and validating sovereign-ready workloads.
  • Audit professionals – Use the implementation steps described in the best practices to understand possible sources of evidence and artifacts they should seek during security and privacy audits.
  • Governance risk and compliance professionals – Use the lens to understand and document the overall risk landscape. Develop per-application risk profiles and manage risks over time.

Your path to sovereign-ready workloads

The Digital Sovereignty Lens is part of a wider effort at AWS to equip our customers with comprehensive guidance and tools required to address their sovereignty needs. We recently introduced the AWS European Sovereign Cloud: Sovereign Reference Framework (ESC-SRF). Customers and partners can use the ESC-SRF (available from AWS Artifact) as a foundation upon which they can build their own complementary controls when using the AWS European Sovereign Cloud. This can also be used as supporting documentation as part of audits showing how AWS meets sovereignty requirements across dimensions such as independence, operational control, data residency, and technical isolation.

During and leading up to AWS re:Invent 2025, we announced several new capabilities designed to increase trust, bring more transparency, and provide customers with more control and choice. They include the Nitro Isolation Engine, IAM Policy Autopilot, the Landing Zone Accelerator on AWS Universal Configuration, Controls Dedicated experience in AWS Control Tower, and productivity tools such as the CloudFormation IDE Experience.

We are not stopping here. We look forward to your feedback as we continue to improve the lens content. We will also continue to develop decision guides, reference architectures, prescriptive guidance, and solution accelerators that embed and codify the best practices described in the lens.


About the authors

Build a trusted foundation for data and AI using Alation and Amazon SageMaker Unified Studio

Post Syndicated from Anthony Lempelius, James Mesney original https://aws.amazon.com/blogs/big-data/build-a-trusted-foundation-for-data-and-ai-using-alation-and-amazon-sagemaker-unified-studio/

This post was co-written with Anthony Lempelius and James Mesney from Alation.

When a team wants to reuse a dataset, whether it is to build a new pipeline, launch a dashboard, run an analysis, or power an AI application, the first challenge is rarely the code. Data engineers need to understand lineage, transformations, and operational expectations. Data analysts and BI engineers need consistent definitions, metrics, and trusted sources. Data scientists and AI engineers need to know provenance, quality, access constraints, and how data or features were derived. In many organizations, that context is captured in different places by different teams, often across solutions like Alation and SageMaker Unified Studio, both of which can serve as a system of record for business context depending on who is doing the work and where they operate day to day. When those perspectives are not connected, people revalidate the same information, debate definitions, and duplicate documentation across tools. A unified metadata foundation brings these role specific views together so business context, technical metadata, and governance stay aligned across platforms, making data easier to trust, easier to find, and easier to use across analytics and AI.

The new Alation integration with Amazon SageMaker Unified Studio addresses these challenges by synchronizing catalog metadata between both systems. This synchronization creates a unified metadata experience where technical teams working in SageMaker Unified Studio and business teams working in Alation collaborate on top of the same metadata. You can verify how ML and analytics assets are created, understand dependencies, and maintain traceability across your data lifecycle regardless of which system your teams prefer to use.

In this post, we demonstrate who benefits from this integration, how it works, the specific metadata it synchronizes, and provide a complete deployment guide for your environment.

The value of unified metadata governance

Organizations managing large-scale analytics and ML workloads face critical challenges when metadata is fragmented across multiple systems. When metadata exists in silos, data scientists spend valuable time searching for the right datasets. Teams duplicate metadata management efforts, creating inconsistent definitions and conflicting metrics across the organization.

Regulatory requirements demand clear provenance. Without unified metadata governance, organizations struggle to demonstrate compliance, trace data origins, and maintain audit trails across their ML and analytics pipelines. Data discovery becomes a bottleneck when teams can’t quickly find, understand, and trust the data they need, delaying model development and reducing the overall business value of data investments.

Applying consistent governance policies across disparate systems is nearly impossible without a unified metadata layer. This creates security vulnerabilities, data quality issues, and compliance blind spots. A unified metadata governance approach alleviates these challenges by providing a single source of truth for metadata across ML and analytics systems, enabling faster data discovery, consistent governance, and confident compliance while reducing the operational burden on data and ML teams.

Solution overview

The Alation and SageMaker Unified Studio integration unifies the user experience, synchronizing metadata from cataloged assets between both systems.

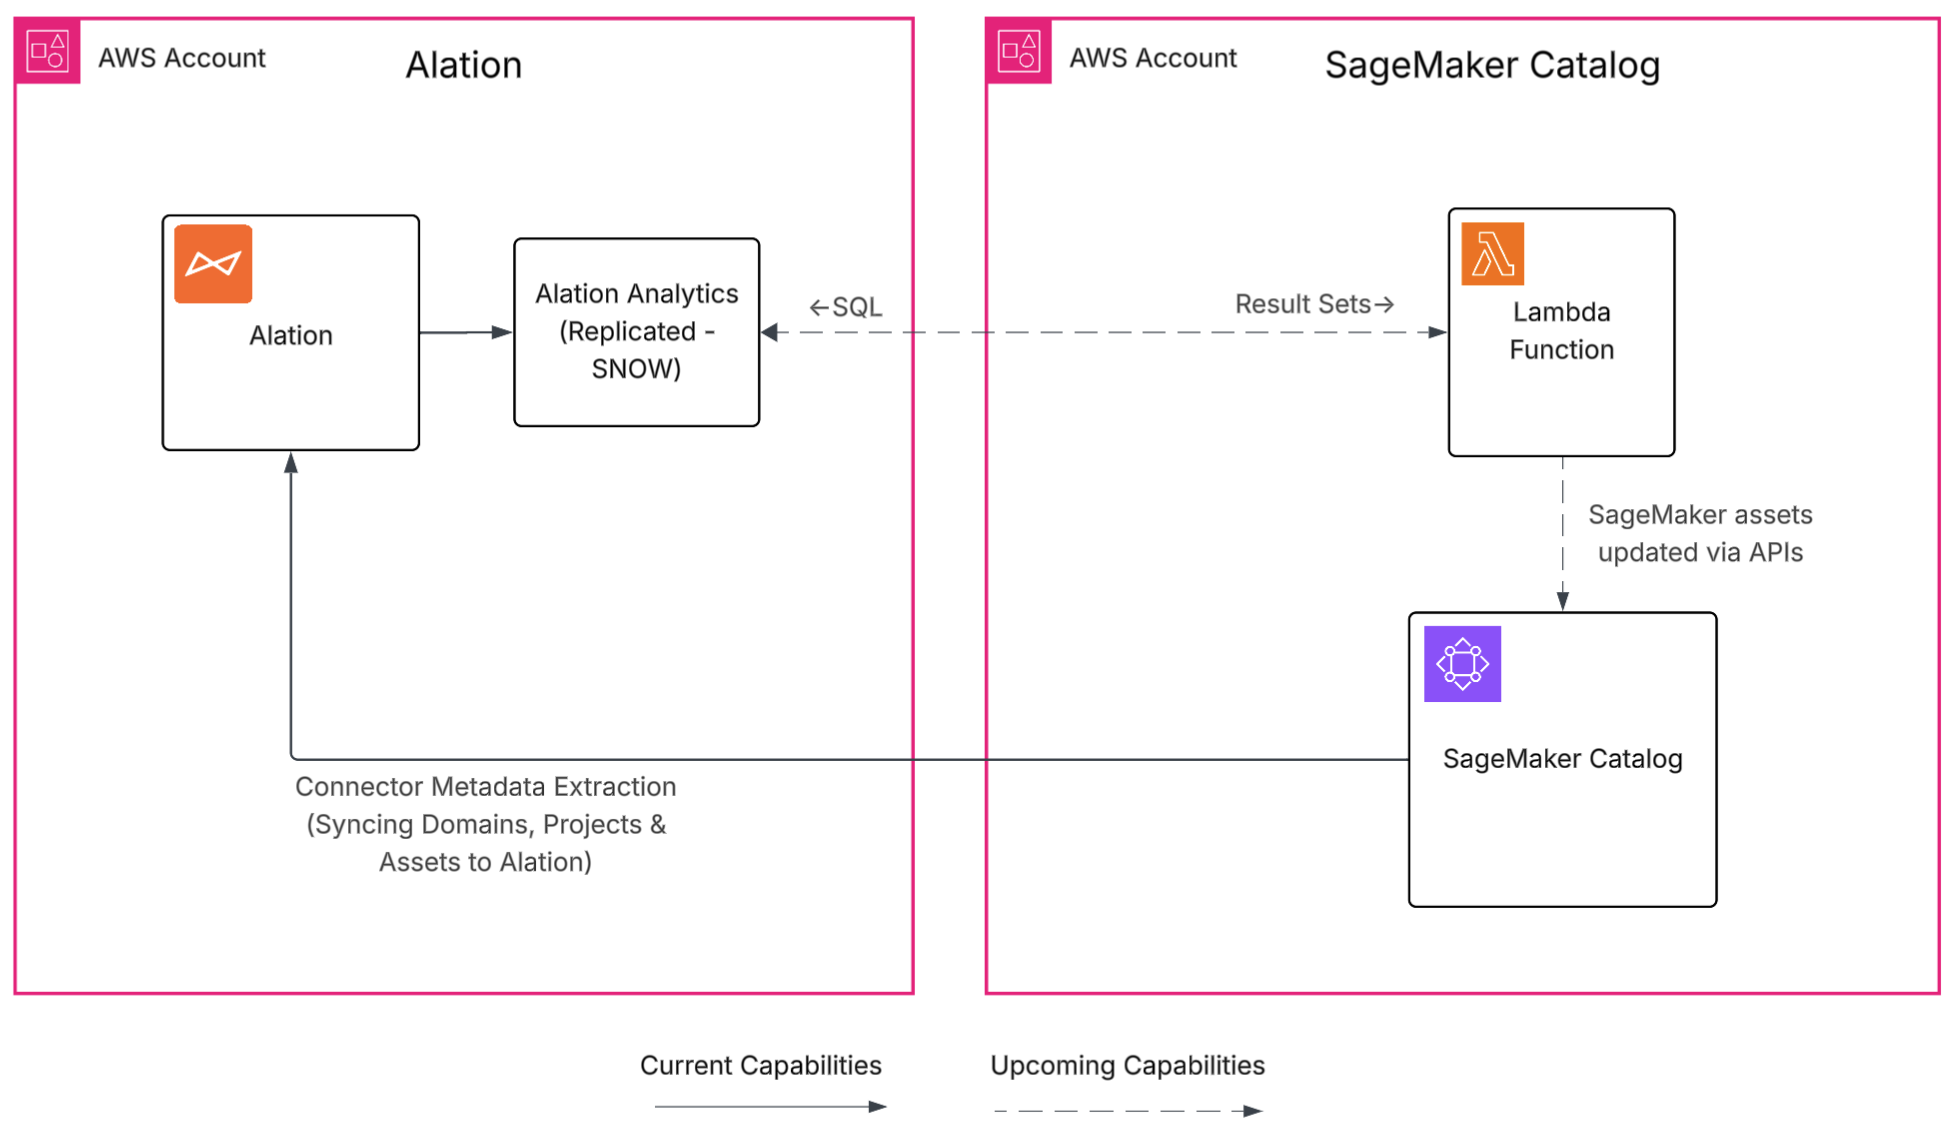
This Phase 1 integration extracts metadata from Amazon SageMaker Catalog into Alation, giving you one place to discover assets.

The integration connects through AWS Identity and Access Management (IAM) authentication and synchronizes key metadata elements, including domains, projects, asset names, descriptions, owners, glossary terms, and custom metadata fields. Every metadata update includes provenance information: the originating service, the person who made the change, and the timestamp, creating comprehensive audit trails for compliance.

You can run metadata extractions on demand or schedule them to run automatically. The system performs an initial bulk extraction of your selected domains and projects, then keeps it up-to-date through incremental updates using either event-driven triggers or scheduled polling. Communication uses encrypted APIs with scoped IAM permissions following least-privilege principles.

This integration helps organizations in financial services, telecommunications, retail, manufacturing, and transportation that manage large numbers of analytics and ML workloads across many systems and teams. You can reduce metadata duplication, accelerate data discovery, and enable your data scientists, analysts, and engineers to find trusted data faster so they can focus on building insights rather than validating data quality.

The following diagram illustrates the solution architecture.

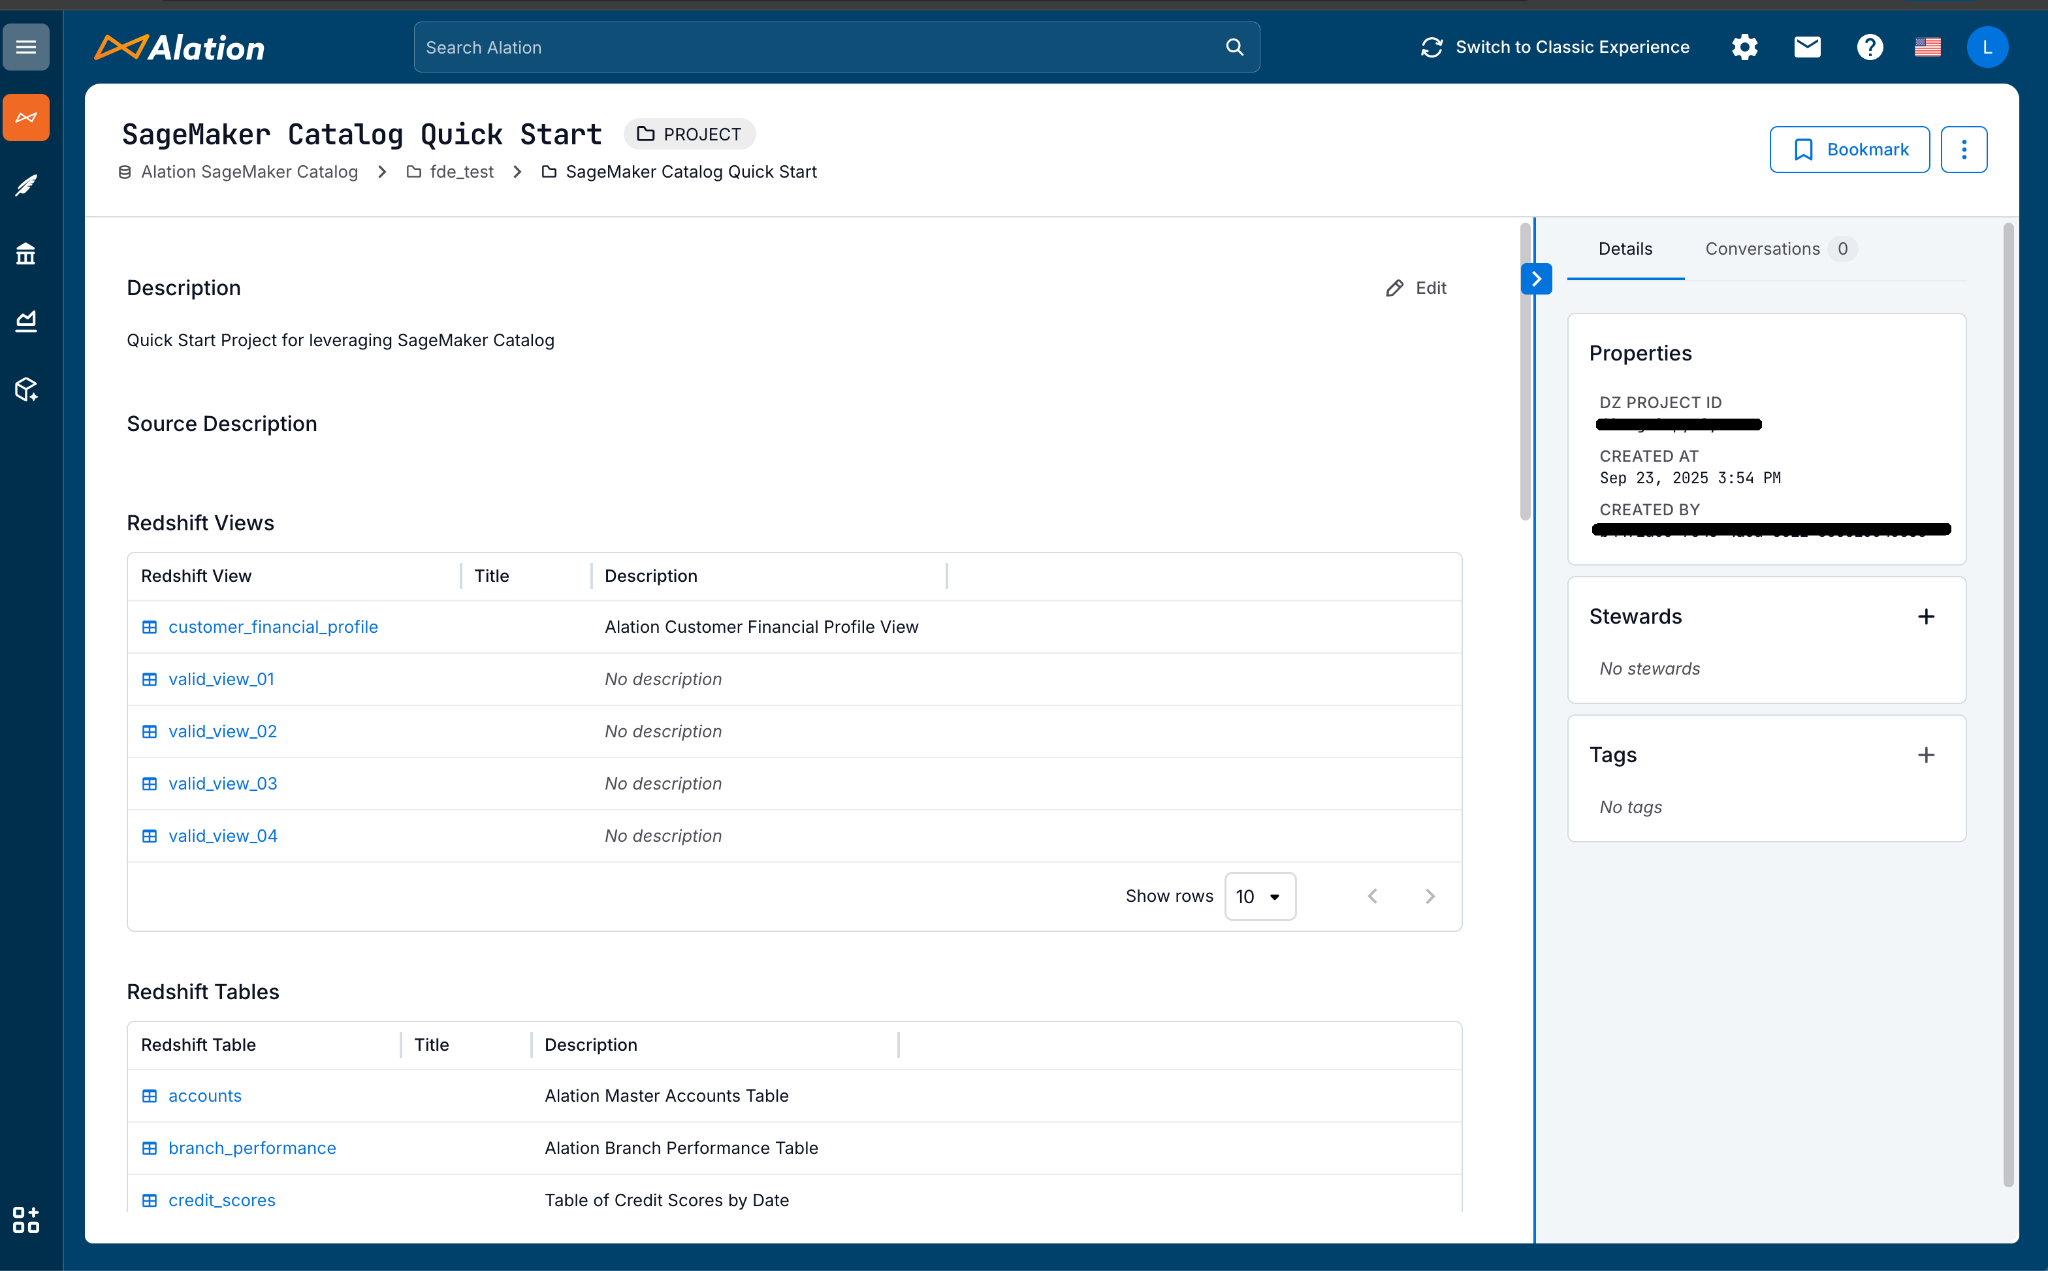
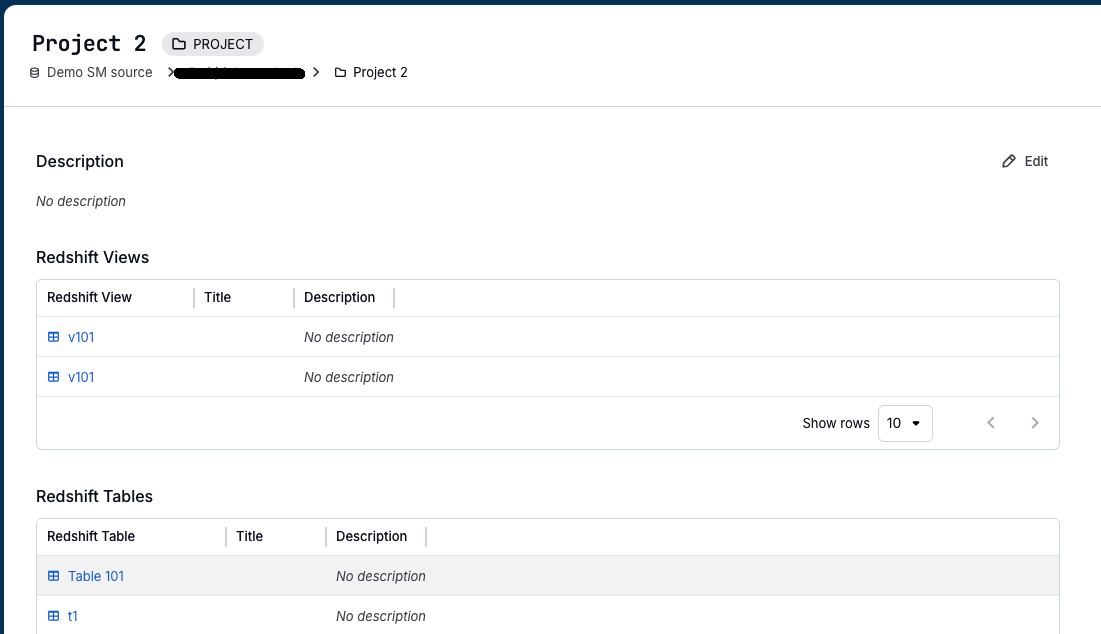
The following screenshot showcases the Alation catalog displaying the SageMaker Unified Studio project and its synchronized assets.

Metadata synchronization

This integration automatically synchronizes essential metadata between SageMaker Unified Studio and Alation, facilitating consistent information across both systems. The synchronization brings together the types of metadata you need for discovery, governance, and audit workflows, giving you clearer insight into how datasets, features, and models relate across your services.

The integration synchronizes catalog metadata, including domains, projects, asset names, descriptions, owners, glossary terms, and metadata forms. Additionally, the integration synchronizes provenance metadata, which includes information about the originating service, the actor who made the change, and the timestamp, to support traceability and audit workflows.

Integration mechanics

The integration connects SageMaker Unified Studio and Alation through a scoped IAM role that provides secure, encrypted communication. After you configure this connection within Alation, the system performs an initial extraction of your selected domains and projects, then keeps information current through incremental updates using either event-driven triggers or scheduled polling.

The integration synchronizes metadata forms from SageMaker Unified Studio into Alation through automated field mapping between both systems’ schemas. Metadata forms can capture various asset specific details like feature store references, training run identifiers, model versions, and evaluation metrics.

Every metadata update includes provenance information: the originating service, the person who made the change, and when it occurred. This supports audit and stewardship workflows. Access controls follow least-privilege principles through IAM while applying Alation’s role-based permissions, letting you limit synchronization by project, namespace, or tag as needed.

Security and compliance

Security and compliance are critical when synchronizing metadata across systems. This integration follows enterprise security practices to facilitate safe, controlled metadata synchronization. The connector uses least-privilege access, encrypted transport, and clear separation between metadata and data, so you can maintain governance without disrupting existing workflows.

You configure a scoped IAM role to define which accounts, projects, and namespaces the connector can access, making sure access follows your organization’s security policies. Metadata moves over TLS-protected APIs, and you control which domains and projects to include in Alation. By default, the integration synchronizes only metadata; your data files and artifacts remain in their original AWS locations unless you explicitly choose to export them.

Alation maintains a complete audit trail by recording extraction events, mapping changes, and stewardship activities. These security controls support compliant metadata governance while preserving your existing operational practices.

Prerequisites

Before setting up this integration, ensure you have the following:

  • An Alation Cloud Service (ACS) instance
  • Alation server admin access
  • An AWS account
  • A SageMaker Unified Studio domain and project with existing metadata

Configure authentication

Before configuring the Alation connector, you must set up the required AWS resources and permissions. The first step is to configure authentication. The Alation connector supports two authentication methods to access SageMaker Unified Studio. Choose the method that best fits your security requirements.

Option 1: IAM role (Recommended)

Create an IAM role that the Alation connector will assume to access SageMaker Unified Studio. For detailed instructions on creating IAM roles, see IAM role creation.

The following is an example IAM permission policy for SageMaker Catalog access:

{
   "Version": "2012-10-17",
    "Statement": [
        {
            "Sid": "AlationSageMakerAccess",
            "Effect": "Allow",
            "Action": [
                "datazone:ListDomains",
                "datazone:GetFormType",
                "datazone:Search",
                "datazone:ListProjects",
                "datazone:GetAsset"
            ],
            "Resource": "arn:aws:datazone:<region>:<account-id>:domain/*”
        }
    ]
}

The following is an example trust policy for the IAM role:

{
    "Version": "2012-10-17",
    "Statement": [
        {
            "Sid": "AlationSageMakerAccessAssumeRole",
            "Effect": "Allow",
            "Principal": {
                "AWS": "<alation_provided_role_arn>"
            },
            "Action": "sts:AssumeRole"
        }
    ]
}     

Option 2: IAM user with access keys

Create an IAM user with programmatic access and attach the necessary permissions. For detailed instructions on creating IAM users, see Create an IAM user in your AWS account.

Create an IAM user with programmatic access enabled, attach the following policy, and generate access keys for use in Alation configuration:

{
   "Version": "2012-10-17",
    "Statement": [
        {
            "Sid": "AlationSageMakerAccess",
            "Effect": "Allow",
            "Action": [
                "datazone:ListDomains",
                "datazone:GetFormType",
                "datazone:Search",
                "datazone:ListProjects",
                "datazone:GetAsset"
            ],
            "Resource": "arn:aws:datazone:<region>:<account-id>:domain/*"
        }
    ]
}

Add IAM role or user to SageMaker Unified Studio domain

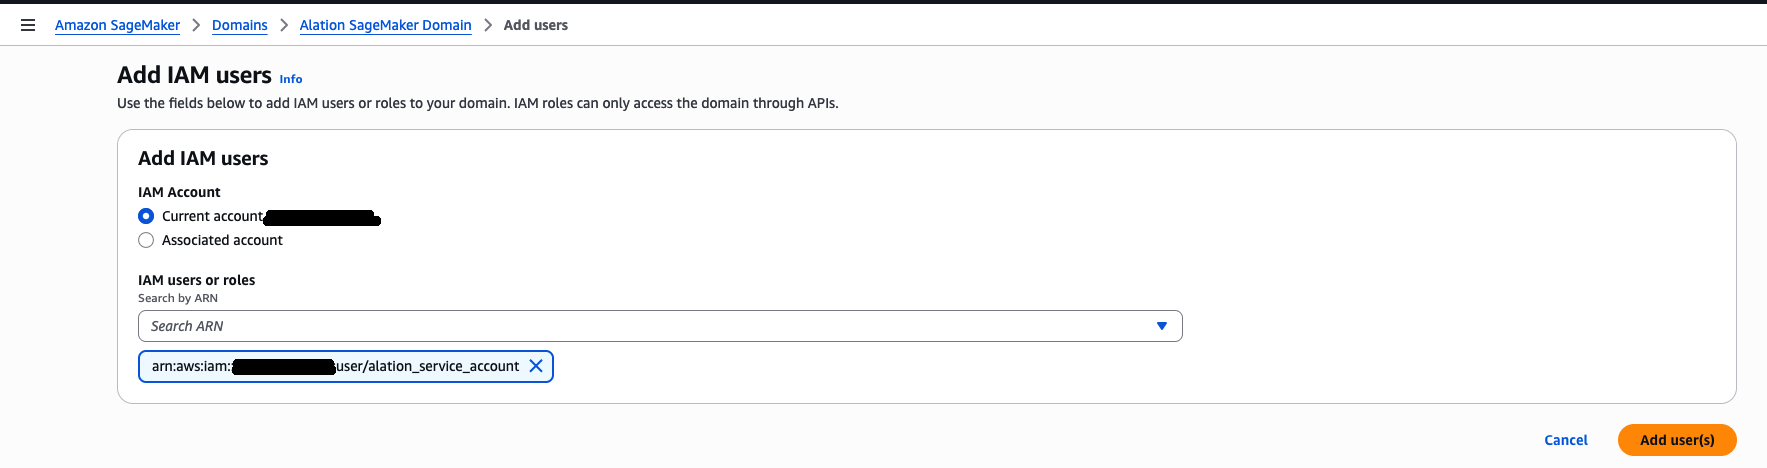
Add the IAM role or user you created to the SageMaker Unified Studio domain. For detailed instructions on adding users to a domain, see User management in Amazon SageMaker Unified Studio. The following screenshot shows an example of adding IAM users on the SageMaker dashboard.

Add IAM role or user to SageMaker Unified Studio projects

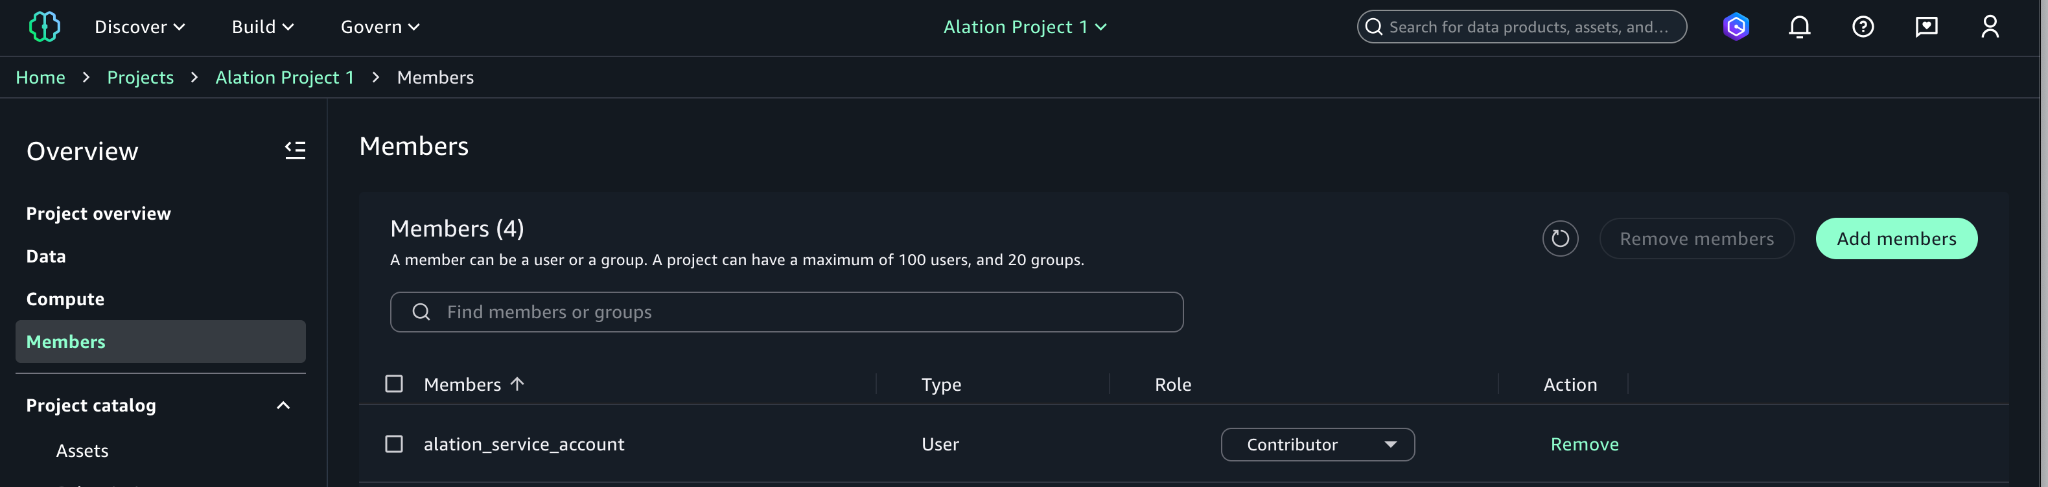
The IAM role or user must be added as a member to all SageMaker Unified Studio projects that contain metadata you want to synchronize with Alation. Projects without this member will not be included in the synchronization process.

Add the IAM role or user as a project member with Contributor or Owner permissions for each project you want to include in the sync, as illustrated in the following screenshot. For detailed instructions on adding project members, see Add project members.

Install SageMaker enhanced connector

After completing the AWS setup, you can configure the Alation connector to establish the integration. The connector is distributed as a .zip package for upload and installation in the Alation application. To obtain the connector, contact the Forward Deployed Engineering team or your Alation Account Manager.

When you have the .zip package, follow the installation procedures to add the connector.

Create and configure Alation’s data source

Navigate to the Data Sources section in Alation, create a new data source, and select SageMaker Catalog as the source type. Configure the connection settings with the authentication method chosen in the AWS setup.

For IAM role authentication, use the following configuration:

  • Connection Type: IAM Role
  • Role ARN: ARN of the IAM role created in AWS setup
  • External ID: External ID configured in the trust policy
  • AWS Region: Region where your SageMaker Unified Studio domain is located

For IAM user authentication, use the following configuration:

  • Connection Type: Access Keys
  • Access Key ID: Access key from AWS setup
  • Secret Access Key: Secret key from AWS setup
  • AWS Region: Region where your SageMaker Unified Studio domain is located

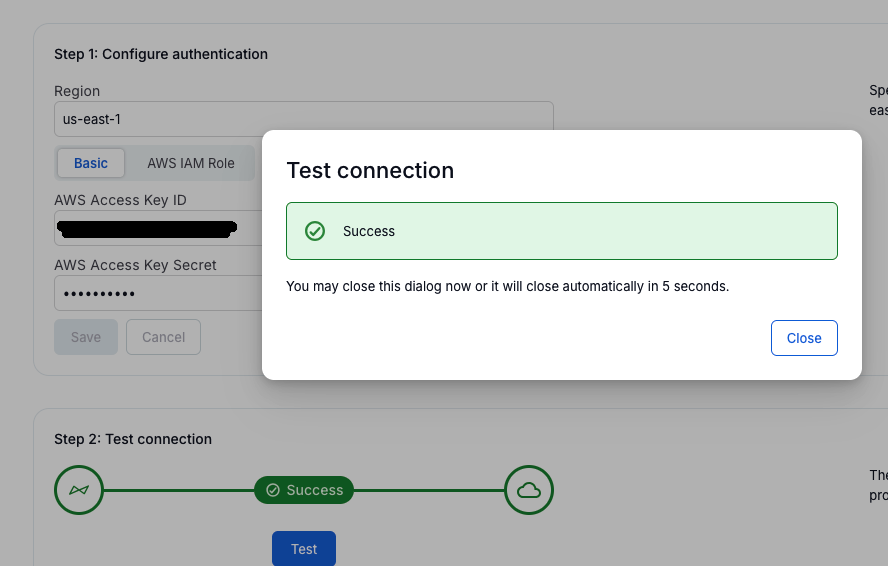
Test the connection to verify authentication and network connectivity, as shown in the following screenshot.

Configure metadata extraction settings

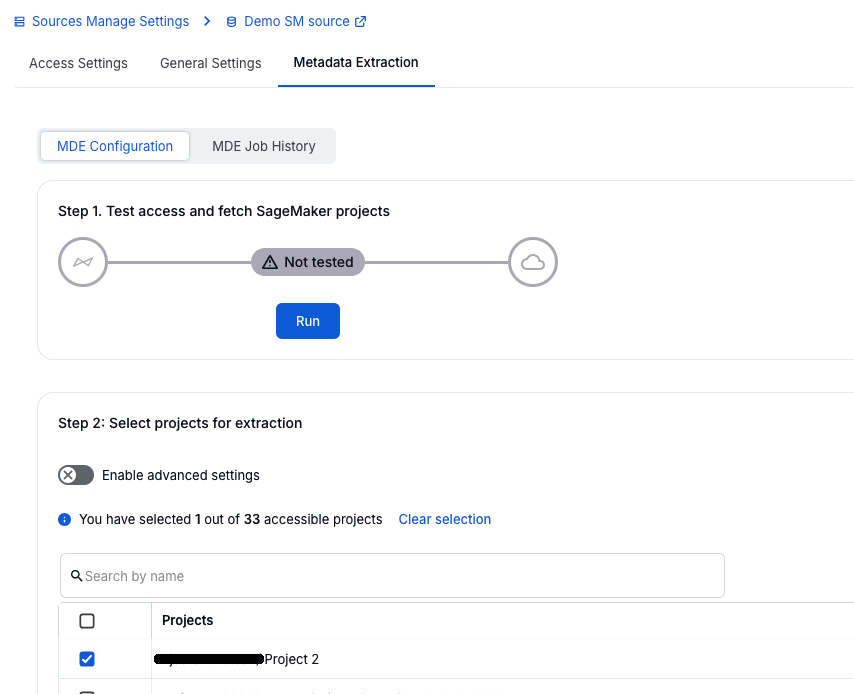
Configure the extraction scope by selecting the SageMaker domains and projects to synchronize, as shown in the following screenshot. Only projects where the IAM role or user is a member will be available for synchronization.

Run initial extraction

Execute the first metadata synchronization to import existing metadata from SageMaker Unified Studio into Alation. Monitor the extraction progress through Alation’s status indicators and validate that SageMaker assets appear correctly in the catalog.

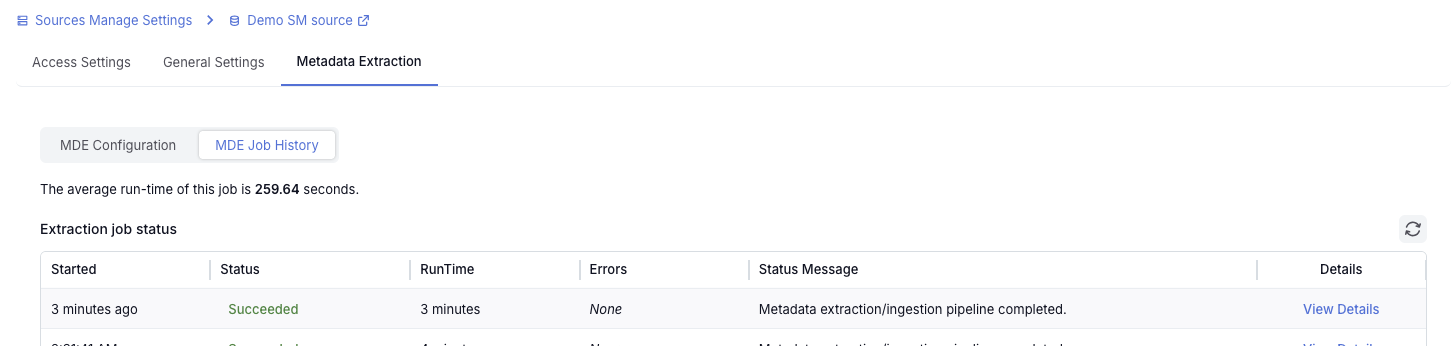
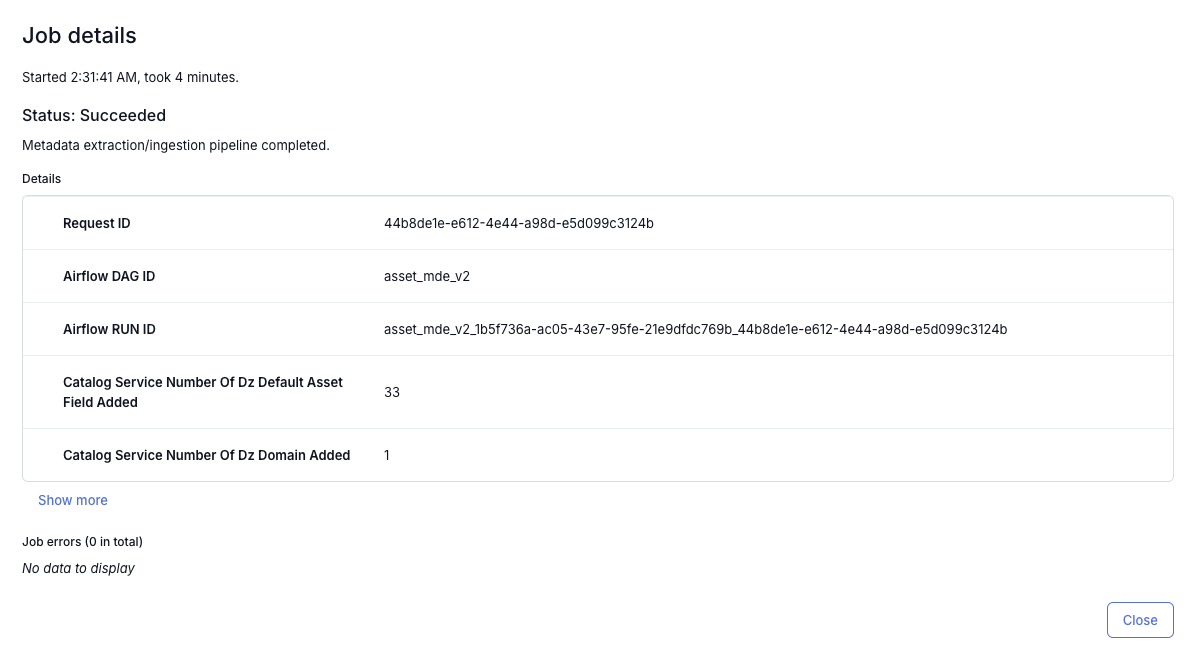
The following screenshot shows the job history page with job status Running.

The following screenshot shows the job history page with job status Succeeded.

The following screenshot shows the Alation catalog displaying the SageMaker Unified Studio project and its synchronized assets.

Operate and tune

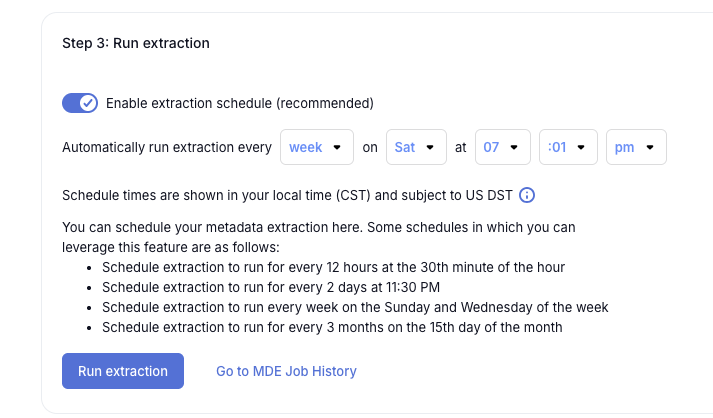
Configure ongoing operations by setting extraction cadence, configuring reconciliation alerts, and monitoring logs regularly. Add data stewards to synchronized assets, and consider enabling AI-generated descriptions or working with Alation Professional Services for advanced governance design.

Enhanced capabilities

The next phase of the integration introduces three key capabilities: bi-directional metadata synchronization, lineage replication, and data quality metadata replication. The bi-directional capability gives you the flexibility to control where metadata updates originate, either in Alation or in SageMaker Unified Studio, so you can manage metadata changes in the service that best aligns with your organizational workflows and governance processes.

The feature set is rolling out in phases. Phase 1 is available at the time of writing this post and provides extraction from SageMaker Unified Studio into Alation, including initial and incremental updates and audit logging. Phase 2 is coming soon and will offer configurable principal catalogs, advanced scoped syncs, and reconciliation workflows for Alation Cloud Service customers.

These enhancements will support governed, scalable ML operations with increasing depth and automation.

Conclusion

The Alation and SageMaker Unified Studio integration helps organizations bridge the gap between fast analytics and ML development and the governance requirements most enterprises face. By cataloging metadata from SageMaker Unified Studio in Alation, you gain a governed, discoverable view of how assets are created and used. This supports leaders, stewards, compliance teams, and ML practitioners who depend on accurate, well-documented data to scale analytics and AI responsibly.

To learn more about this integration and explore additional resources, refer to the Amazon SageMaker Unified Studio User Guide and Alation Documentation.


About the authors

Anthony Lempelius

Anthony Lempelius

Anthony is the Director of Channel and Alliances at Alation, where he leads strategic partnerships with independent software vendor (ISV) and systems integrator (SI) partners. He focuses on bringing joint integrations and solutions to market that help customers unlock value from trusted, well-governed data. Anthony is passionate about building the AWS Partner Network that accelerates innovation across the data and AI landscape.

James Mesney

James Mesney

James is a Principal Product Manager at Alation, where he leads product strategy for advancing Alation’s Agentic capabilities. He focuses on helping organizations make their data more discoverable, governed, and actionable by shaping features that improve metadata quality, user experience, and AI-driven insights. James is passionate about building products that empower enterprises to fully unlock the value of trusted data.

Divij Bhatia

Divij Bhatia

Divij is a Software Development Engineer at AWS. He is passionate about building resilient and scalable cloud-based solutions that solve real-world problems for customers. His free time often takes him outdoors, traveling and shooting landscapes.

Leonardo Gomez

Leonardo Gomez

Leonardo is a Principal Analytics Specialist Solutions Architect at AWS. He has over a decade of experience in data management, helping customers around the globe address their business and technical needs.

More room to build: serverless services now support payloads up to 1 MB

Post Syndicated from Anton Aleksandrov original https://aws.amazon.com/blogs/compute/more-room-to-build-serverless-services-now-support-payloads-up-to-1-mb/

To support cloud applications that increasingly depend on rich contextual data, AWS has raised the maximum payload size from 256 KB to 1 MB for asynchronous AWS Lambda function invocations, Amazon Simple Queue Service (Amazon SQS), and Amazon EventBridge. Developers can use this enhancement to build and maintain context-rich event-driven systems and reduce the need for complex workarounds such as data chunking or external large object storage.

Overview

Modern cloud applications rely on context-rich, structured data to drive intelligent behavior. Large language model (LLM) prompts, telemetry signals, personalization data, machine learning (ML) outputs, and user interaction logs are no longer simple strings. Instead, they’re typically complex, nested JSON or YAML objects carrying meaningful context. Previously, developers working with serverless services such as Amazon SQS, Lambda (asynchronous invocations and Amazon SQS event-source mapping), or EventBridge had to carefully manage their data to fit within the 256 KB payload size limit. This commonly meant chunking larger payloads, externalizing payloads to object stores such as Amazon S3, or using data compression. These workarounds added complexity and latency, creating edge cases that were difficult to monitor and debug.

With the recent launches, you can now transmit payloads up to 1 MB, significantly reducing the need for complex data chunking and architectural workarounds. This increased capacity streamlines design patterns, reduces operational overhead, and makes event-driven systems more intuitive to build and maintain. Developers can now include richer data in single payloads—from detailed LLM prompts and full system states to comprehensive context and complete transaction histories.

The new 1 MB payload size limit applies to asynchronous Lambda function invocations, whether you trigger them using either SQS event-source mapping, AWS Command Line Interface (AWS CLI), AWS SDKs, Lambda Invoke API, or AWS services such as EventBridge. The increased limit also extends to all messages and events flowing through Amazon SQS queues and EventBridge Event Buses.

Getting started

There’s nothing you need to do to get started. This enhancement is automatically applied to all new and existing Lambda functions, SQS queues, and EventBridge Event Buses.

If you were previously chunking data at 256KB (or lower) threshold, then you might need to make changes to your service configurations or business logic code to start using the new limit. For example, if you’ve explicitly set Amazon SQS MaximumMessageSize attribute, then you might need to adjust it to a new desired value. Larger payloads might also result in higher costs, as described in the following section.

Real-world example: rich event context in agentic event-driven architectures

Event-driven architectures allow services to operate independently without centralized coordination. In these systems, comprehensive event context is essential. With the increased 1 MB payload limit, events can now carry more comprehensive data—from user profiles and order details to historical interactions. This enables services such as inventory, shipping, and notifications to act autonomously.

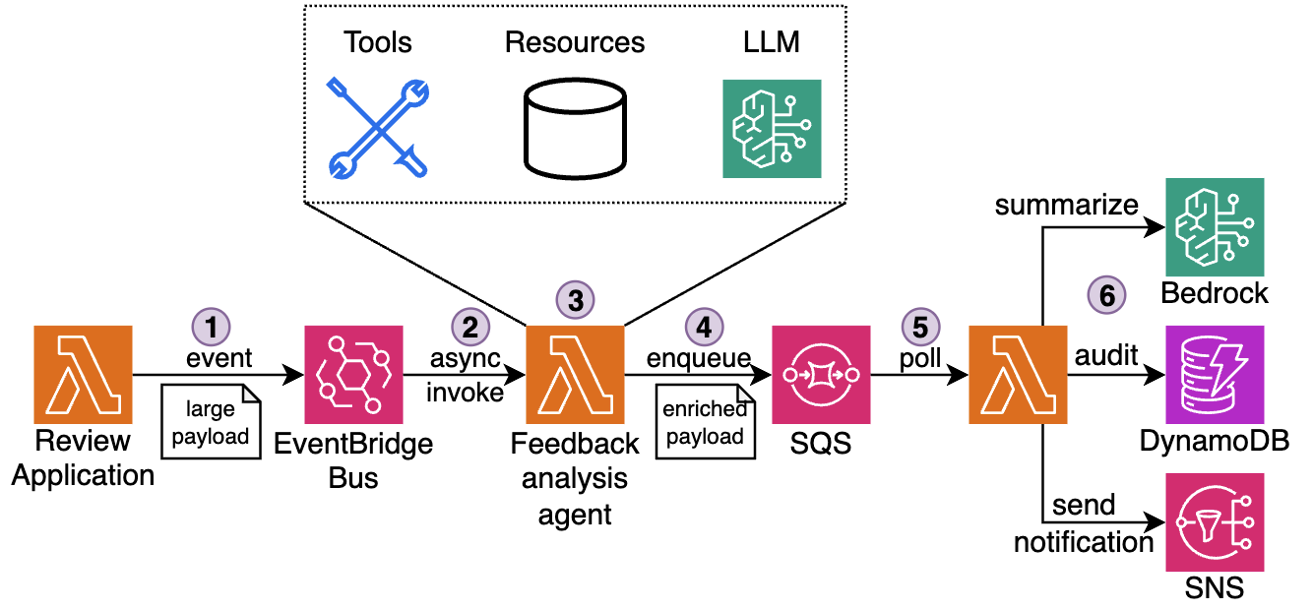
Consider the following example. In hospitality and quick-service industries, customer satisfaction depends on timely, thoughtful service recovery. When a guest submits negative feedback through a survey, review, or complaint form, service teams must gather context, interpret the issue, and craft a response. Traditionally, this meant manually piecing together visit logs, loyalty data, and prior complaints. Now, this can be fully automated using an AI agent powered by AWS serverless services and Amazon Bedrock, as shown in the following figure.

Figure 1: Customer feedback processing pipeline

The workflow:

  1. Receive: A new review is submitted through the Review application and emitted as an event to EventBridge Event Bus.
  2. Detect: Event Bus delivers the event to downstream Feedback analysis agent. The agent running in a Lambda function recognizes the review as low-rating or complaint.
  3. Enrich: The agent collects the guest’s visit metadata, booking details, loyalty activity, and complaint history using attached MCP tools into a single structured JSON payload (up to 1 MB).
  4. Queue: The payload is sent to an SQS queue for further asynchronous processing by downstream components.
  5. Generate: A separate Lambda function polls messages from Amazon SQS and invokes an Amazon Bedrock model to analyze the full complaint context, draft a personalized response, suggest a gesture (such as a refund or credit), and classify issue severity.
  6. Deliver: The message is logged and sent to the customer, and to the service team for further analysis.

This use case demonstrates the importance of having a rich context: current and previous visits details, loyalty tier, prior interactions, and feedback history. Previously, teams had to offload pieces of context to Amazon S3 and reference them externally, adding latency and architectural complexity. The new 1 MB payload size means that all this information can be transported together, improving the serverless agentic workflow efficiency and streamlining maintenance.

Best practices when using large payloads

The following sections outline best practices that you should apply when using larger payloads.

Performance considerations

Monitor Lambda function memory usage carefully when working with larger payloads, because parsing and processing complex JSON objects can increase memory usage and execution duration. Test your systems thoroughly under load, especially for high-throughput applications, by benchmarking with realistic payload sizes and traffic patterns. Although the payload limit has increased to 1 MB, the Lambda 15-minute timeout and memory limits remain unchanged. When applicable, you can use compression to process even larger datasets efficiently, but remember to account for the added CPU overhead of compression and decompression in your performance calculations. Read the Monitoring best practices for event delivery with Amazon EventBridge post for more best practices to tune your event-driven architectures performances.

Operational guidelines

Configure dead-letter-queues (DLQ) to make sure that failed messages are retained for inspection and troubleshooting. This becomes especially important with larger payloads, because debugging complex data structures necessitates access to the complete message context. Implement robust error handling and retries to manage transient failures, particularly when processing rich payload content that may contain nested structures or complex relationships.

To further optimize throughput, you can batch similar smaller events together into a single payload. However, avoid mixing unrelated events and maintain clear boundaries between different business domains and processes.

Always make sure that your downstream dependencies are capable of handling larger payloads.

When to use external storage

Even with the increased 1 MB payload limit, there are scenarios where patterns such as claim check remain a sound architectural choice. These patterns involve storing a full payload in an external system, such as Amazon S3, and passing a lightweight reference through your event stream. This approach continues to provide value when payloads exceed the new limit, when data needs to be reused by multiple consumers, or when strict governance, traceability, and security requirements are involved. For example, audit logs, image metadata, or large ML inference inputs may still surpass the 1 MB boundary, even when compressed. Instead of risking truncation or fragmentation, a claim check enables consistent, scalable access to the complete data set.

You can use open source libraries such as the Kafka sink connector for EventBridge and Amazon SQS Extended Client Library (available for Python and Java) that abstract complexities of storing large objects in external storage.

Cost management

Although larger payloads enable richer context in your applications, logging full payloads can increase storage and processing costs. Services such as CloudWatch Logs charge based on data volume, thus implementing selective logging, payload truncation, or sampling becomes crucial for high-volume events. Consider logging only essential fields or implementing smart sampling strategies based on business importance.

For full payload archival and retention, evaluate cost-effective storage solutions such as Amazon S3 with appropriate lifecycle policies. This can include moving older logs to cheaper storage tiers or implementing automated cleanup procedures for non-critical data. Balance your retention needs with cost optimization by defining clear policies for what data needs to be kept and for how long.

Review the pricing pages for AWS Lambda, Amazon EventBridge, and Amazon SQS to learn about the costs of delivering and processing events and messages.

Conclusion

The increase in maximum payload size from 256 KB to 1 MB enables developers to build more efficient distributed architectures. You can use this enhancement to transport richer context in event and message payloads, reducing the need for complex workarounds that previously added architectural complexity and operational overhead. This added room to transmit rich context means that you can streamline your workflows, improve observability, and reduce architectural complexity whether using choreography or orchestration patterns.

Go to the developer guides for AWS Lambda, Amazon EventBridge, and Amazon SQS, to learn more about how to take advantage of this update.

To learn more about serverless architectures, visit Serverless Land.

How to get started with security response automation on AWS

Post Syndicated from Cameron Worrell original https://aws.amazon.com/blogs/security/how-get-started-security-response-automation-aws/

At AWS, we encourage you to use automation. Not just to deploy your workloads and configure services, but to also help you quickly detect and respond to security events within your AWS environments. In addition to increasing the speed of detection and response, automation also helps you scale your security operations as your workloads in AWS increase and scale as well. For these reasons, security automation is a key principle outlined in the Well-Architected Framework, the AWS Cloud Adoption Framework, and the AWS Security Incident Response Guide.

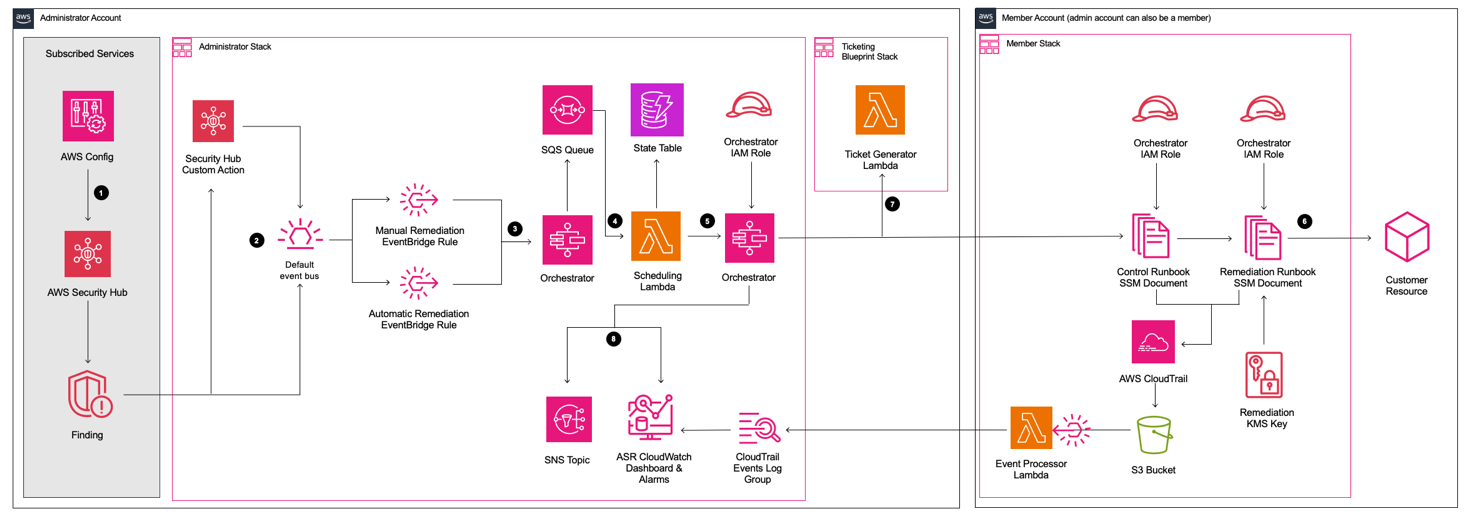
Security response automation is a broad topic that spans many areas. The goal of this blog post is to introduce you to core concepts and help you get started. You will learn how to implement automated security response mechanisms within your AWS environments. This post will include common patterns that customers often use, implementation considerations, and an example solution. Additionally, we will share resources AWS has produced in the form of the Automated Security Response GitHub repo. The GitHub repo includes scripts that are ready-to-deploy for common scenarios.

What is security response automation?

Security response automation is a planned and programmed action taken to achieve a desired state for an application or resource based on a condition or event. When you implement security response automation, you should adopt an approach that draws from existing security frameworks. Frameworks are published materials which consist of standards, guidelines, and best practices in order help organizations manage cybersecurity-related risk. Using frameworks helps you achieve consistency and scalability and enables you to focus more on the strategic aspects of your security program. You should work with compliance professionals within your organization to understand any specific compliance or security frameworks that are also relevant for your AWS environment.

Our example solution is based on the NIST Cybersecurity Framework (CSF), which is designed to help organizations assess and improve their ability to help prevent, detect, and respond to security events. According to the CSF, “cybersecurity incident response” supports your ability to contain the impact of potential cybersecurity events.

Although automation is not a CSF requirement, automating responses to events enables you to create repeatable, predictable approaches to monitoring and responding to threats. When we build automation around events that we know should not occur, it gives us an advantage over a malicious actor because the automation is able to respond within minutes or even seconds compared to an on-call support engineer.

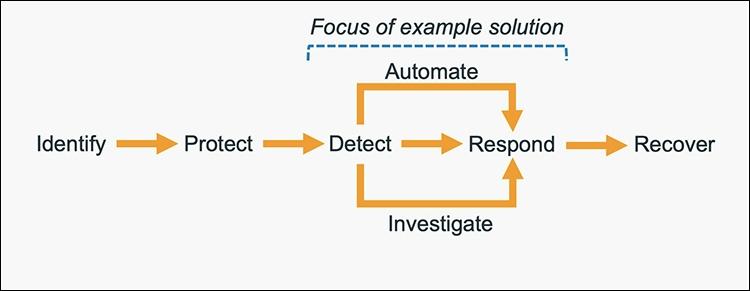
The five main steps in the CSF are identify, protect, detect, respond and recover. We’ve expanded the detect and respond steps to include automation and investigation activities.

Figure 1: The five steps in the CSF

Figure 1: The five steps in the CSF

The following definitions for each step in the diagram above are based on the CSF but have been adapted for our example in this blog post. Although we will focus on the detect, automate and respond steps, it’s important to understand the entire process flow.

  • Identify: Identify and understand the resources, applications, and data within your AWS environment.
  • Protect: Develop and implement appropriate controls and safeguards to facilitate the delivery of services.
  • Detect: Develop and implement appropriate activities to identify the occurrence of a cybersecurity event. This step includes the implementation of monitoring capabilities which will be discussed further in the next section.
  • Automate: Develop and implement planned, programmed actions that will achieve a desired state for an application or resource based on a condition or event.
  • Investigate: Perform a systematic examination of the security event to establish the root cause.
  • Respond: Develop and implement appropriate activities to take automated or manual actions regarding a detected security event.
  • Recover: Develop and implement appropriate activities to maintain plans for resilience and to restore capabilities or services that were impaired due to a security event

Security response automation on AWS

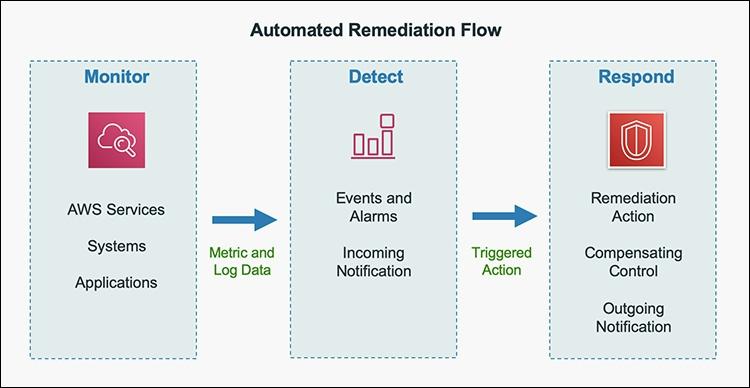
AWS CloudTrail and AWS Config continuously log details regarding users and other identity principals, the resources they interacted with, and configuration changes they might have made in your AWS account. We are able to combine these logs with Amazon EventBridge, which gives us a single service to trigger automations based on events. You can use this information to automatically detect resource changes and to react to deviations from your desired state.

Figure 2: Automated remediation flow

Figure 2: Automated remediation flow

As shown in the diagram above, an automated remediation flow on AWS has three stages:

  1. Monitor: Your automated monitoring tools collect information about resources and applications running in your AWS environment. For example, they might collect AWS CloudTrail information about activities performed in your AWS account, usage metrics from your Amazon EC2 instances, or flow log information about the traffic going to and from network interfaces in your Amazon Virtual Private Cloud (VPC).
  2. Detect: When a monitoring tool detects a predefined condition—such as a breached threshold, anomalous activity, or configuration deviation—it raises a flag within the system. A triggering condition might be an anomalous activity detected by Amazon GuardDuty, a resource out of compliance with an AWS Config rule, or a high rate of blocked requests on an Amazon VPC security group or AWS Web Application Firewall (AWS WAF) web access control list (web-acl).
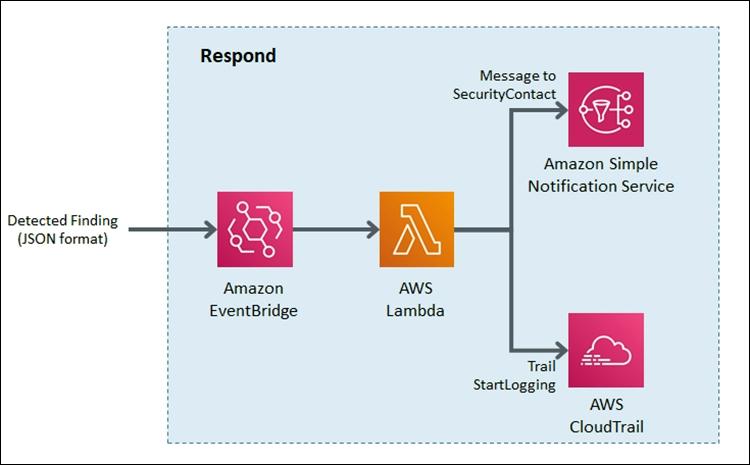
  3. Respond: When a condition is flagged, an automated response is triggered that performs an action you’ve predefined—something intended to remediate or mitigate the flagged condition.

Examples of automated response actions may include modifying a VPC security group, patching an Amazon EC2 instance, rotating various different types of credentials, or adding an additional entry into an IP set in AWS WAF that is part of a web-acl rule to block suspicious clients who triggered a threshold from a monitoring metric.

You can use the event-driven flow described above to achieve a variety of automated response patterns with varying degrees of complexity. Your response pattern could be as simple as invoking a single AWS Lambda function, or it could be a complex series of AWS Step Function tasks with advanced logic. In this blog post, we’ll use two simple Lambda functions in our example solution.

How to define your response automation

Now that we’ve introduced the concept of security response automation, start thinking about security requirements within your environment that you’d like to enforce through automation. These design requirements might come from general best practices you’d like to follow, or they might be specific controls from compliance frameworks relevant for your business.

Customers start with the run-books they already use as part of their Incident Response Lifecycle. Simple run-books, like responding to an exfiltrated credential, can be quickly mapped to automation especially if your run book calls for the disabling of the credential and the notification of on-call personnel. But it can be resource driven as well. Events such as a new AWS VPC being created might trigger your automation to immediately deploy your company’s standard configuration for VPC flowlog collection.

Your objectives should be quantitative, not qualitative. Here are some examples of quantitative objectives:

  • Remote administrative network access to servers should be limited.
  • Server storage volumes should be encrypted.
  • AWS console logins should be protected by multi-factor authentication.

As an optional step, you can expand these objectives into user stories that define the conditions and remediation actions when there is an event. User stories are informal descriptions that briefly document a feature within a software system. User stories may be global and span across multiple applications or they may be specific to a single application.

For example:

“Remote administrative network access to servers should have limited access from internal trusted networks only. Remote access ports include SSH TCP port 22 and RDP TCP port 3389. If remote access ports are detected within the environment and they are accessible to outside resources, they should be automatically closed and the owner will be notified.”

Once you’ve completed your user story, you can determine how to use automated remediation to help achieve these objectives in your AWS environment. User stories should be stored in a location that provides versioning support and can reference the associated automation code.

You should carefully consider the effect of your remediation mechanisms in order to help prevent unintended impact on your resources and applications. Remediation actions such as instance termination, credential revocation, and security group modification can adversely affect application availability. Depending on the level of risk that’s acceptable to your organization, your automated mechanism can only provide a notification which would then be manually investigated prior to remediation. Once you’ve identified an automated remediation mechanism, you can build out the required components and test them in a non-production environment.

Sample response automation walkthrough

In the following section, we’ll walk you through an automated remediation for a simulated event that indicates potential unauthorized activity—the unintended disabling of CloudTrail logging. Outside parties might want to disable logging to avoid detection and the recording of their unauthorized activity. Our response is to re-enable the CloudTrail logging and immediately notify the security contact. Here’s the user story for this scenario:

“CloudTrail logging should be enabled for all AWS accounts and regions. If CloudTrail logging is disabled, it will automatically be enabled and the security operations team will be notified.”

A note about the sample response automation below as it references Amazon EventBridge: EventBridge was formerly referred to as Amazon CloudWatch Events. If you see other documentation referring to Amazon CloudWatch, you can find that configuration now via the Amazon EventBridge console page.

Additionally, we will be looking at this scenario through the lens of an account that has a stand-alone CloudTrail configuration. While this is an acceptable configuration, AWS recommends using AWS Organizations, which allows you to configure an organizational CloudTrail. These organizational trails are immutable to the child accounts so that logging data cannot be removed or tampered with.

In order to use our sample remediation, you will need to enable Amazon GuardDuty and AWS Security Hub in the AWS Region you have selected. Both of these services include a 30-day trial at no additional cost. See the AWS Security Hub pricing page and the Amazon GuardDuty pricing page for additional details.

Important: You’ll use AWS CloudTrail to test the sample remediation. Running more than one CloudTrail trail in your AWS account will result in charges based on the number of events processed while the trail is running. Charges for additional copies of management events recorded in a Region are applied based on the published pricing plan. To minimize the charges, follow the clean-up steps that we provide later in this post to remove the sample automation and delete the trail.

Deploy the sample response automation

In this section, we’ll show you how to deploy and test the CloudTrail logging remediation sample. Amazon GuardDuty generates the finding

Stealth:IAMUser/CloudTrailLoggingDisabled when CloudTrail logging is disabled, and AWS Security Hub collects findings from GuardDuty using the standardized finding format mentioned earlier. We recommend that you deploy this sample into a non- production AWS account.

Select the Launch Stack button below to deploy a CloudFormation template with an automation sample in the us-east-1 Region. You can also download the template and implement it in another Region. The template consists of an Amazon EventBridge rule, an AWS Lambda function, and the IAM permissions necessary for both components to execute. It takes several minutes for the CloudFormation stack build to complete.

Select the Launch Stack button to launch the template

  1. In the CloudFormation console, choose the Select Template form, and then select Next.
  2. On the Specify Details page, provide the email address for a security contact. For the purpose of this walkthrough, it should be an email address that you have access to. Then select Next.
  3. On the Options page, accept the defaults, then select Next.
  4. On the Review page, confirm the details, then select Create.
  5. While the stack is being created, check the inbox of the email address that you provided in step 2. Look for an email message with the subject AWS Notification – Subscription Confirmation. Select the link in the body of the email to confirm your subscription to the Amazon Simple Notification Service (Amazon SNS) topic. You should see a success message like the one shown in Figure 3:

    Figure 3: SNS subscription confirmation

    Figure 3: SNS subscription confirmation

  6. Return to the CloudFormation console. After the Status field for the CloudFormation stack changes to CREATE COMPLETE (as shown in Figure 4), the solution is implemented and is ready for testing.

    Figure 4: CREATE_COMPLETE status

    Figure 4: CREATE_COMPLETE status

Test the sample automation

You’re now ready to test the automated response by creating a test trail in CloudTrail, then trying to stop it.

  1. From the AWS Management Console, choose Services > CloudTrail.
  2. Select Trails, then select Create Trail.
  3. On the Create Trail form:
    1. Enter a value for Trail name and for AWS KMS alias, as shown in Figure 5.
    2. For Storage location, create a new S3 bucket or choose an existing one. For our testing, we create a new S3 bucket.

      Figure 5: Create a CloudTrail trail

      Figure 5: Create a CloudTrail trail

    3. On the next page, under Management events, select Write-only (to minimize event volume).

      Figure 6: Create a CloudTrail trail

      Figure 6: Create a CloudTrail trail

  4. On the Trails page of the CloudTrail console, verify that the new trail has started. You should see the status as logging, as shown in Figure 7.

    Figure 7: Verify new trail has started

    Figure 7: Verify new trail has started

  5. You’re now ready to act like an unauthorized user trying to cover their tracks. Stop the logging for the trail that you just created:
    1. Select the new trail name to display its configuration page.
    2. In the top-right corner, choose the Stop logging button.
    3. When prompted with a warning dialog box, select Stop logging.
    4. Verify that the logging has stopped by confirming that the Start logging button now appears in the top right, as shown in Figure 8.

      Figure 8: Verify logging switch is off

      Figure 8: Verify logging switch is off

    You have now simulated a security event by disabling logging for one of the trails in the CloudTrail service. Within the next few seconds, the near real-time automated response will detect the stopped trail, restart it, and send an email notification. You can refresh the Trails page of the CloudTrail console to verify through the Stop logging button at the top right corner.

    Within the next several minutes, the investigatory automated response will also begin. GuardDuty will detect the action that stopped the trail and enrich the data about the source of unexpected behavior. Security Hub will then ingest that information and optionally correlate with other security events.

    Following the steps below, you can monitor findings within Security Hub for the finding type TTPs/Defense Evasion/Stealth:IAMUser-CloudTrailLoggingDisabled to be generated:

  6. In the AWS Management Console, choose Services > Security Hub.
    1. In the left pane, select Findings.
    2. Select the Add filters field, then select Type.
    3. Select EQUALS, paste TTPs/Defense Evasion/Stealth:IAMUser-CloudTrailLoggingDisabled into the field, then select Apply.
    4. Refresh your browser periodically until the finding is generated.
    Figure 9: Monitor Security Hub for your finding

    Figure 9: Monitor Security Hub for your finding

  7. Select the title of the finding to review details. When you’re ready, you can choose to archive the finding by selecting the Archive link. Alternately, you can select a custom action to continue with the response. Custom actions are one of the ways that you can integrate Security Hub with custom partner solutions.

Now that you’ve completed your review of the finding, let’s dig into the components of automation.

How the sample automation works

This example incorporates two automated responses: a near real-time workflow and an investigatory workflow. The near real-time workflow provides a rapid response to an individual event, in this case the stopping of a trail. The goal is to restore the trail to a functioning state and alert security responders as quickly as possible. The investigatory workflow still includes a response to provide defense in depth and uses services that support a more in-depth investigation of the incident.

Figure 10: Sample automation workflow

Figure 10: Sample automation workflow

In the near real-time workflow, Amazon EventBridge monitors for the undesired activity.

When a trail is stopped, AWS CloudTrail publishes an event on the EventBridge bus. An EventBridge rule detects the trail-stopping event and invokes a Lambda function to respond to the event by restarting the trail and notifying the security contact via an Amazon Simple Notification Service (SNS) topic.

In the investigative workflow, CloudTrail logs are monitored for undesired activities. For example, if a trail is stopped, there will be a corresponding log record. GuardDuty detects this activity and retrieves additional data points regarding the source IP that executed the API call. Two common examples of those additional data points in GuardDuty findings include whether the API call came from an IP address on a threat list, or whether it came from a network not commonly used in your AWS account. An AWS Lambda function responds by restarting the trail and notifying the security contact. The finding is imported into AWS Security Hub, where it’s aggregated with other findings for analyst viewing. Using EventBridge, you can configure Security Hub to export the finding to partner security orchestration tools, SIEM (security information and event management) systems, and ticketing systems for investigation.

AWS Security Hub imports findings from AWS security services such as GuardDuty, Amazon Macie and Amazon Inspector, plus from third-party product integrations you’ve enabled. Findings are provided to Security Hub in AWS Security Finding Format (ASFF), which minimizes the need for data conversion. Security Hub correlates these findings to help you identify related security events and determine a root cause. Security Hub also publishes its findings to Amazon EventBridge to enable further processing by other AWS services such as AWS Lambda. You can also create custom actions using Security Hub. Custom actions are useful for security analysts working with the Security Hub console who want to send a specific finding, or a small set of findings, to a response or a remediation workflow.

Deeper look into how the “Respond” phase works

Amazon EventBridge and AWS Lambda work together to respond to a security finding.

Amazon EventBridge is a service that provides real-time access to changes in data in AWS services, your own applications, and Software-as-a-Service (SaaS) applications without writing code. In this example, EventBridge identifies a Security Hub finding that requires action and invokes a Lambda function that performs remediation. As shown in Figure 11, the Lambda function both notifies the security operator via SNS and restarts the stopped CloudTrail.

Figure 11: Sample “respond” workflow

Figure 11: Sample “respond” workflow

To set this response up, we looked for an event to indicate that a trail had stopped or was disabled. We knew that the GuardDuty finding Stealth:IAMUser/CloudTrailLoggingDisabled is raised when CloudTrail logging is disabled. Therefore, we configured the default event bus to look for this event.

You can learn more regarding the available GuardDuty findings in the user guide.

How the code works

When Security Hub publishes a finding to EventBridge, it includes full details of the finding as discovered by GuardDuty. The finding is published in JSON format. If you review the details of the sample finding, note that it has several fields helping you identify the specific events that you’re looking for. Here are some of the relevant details:

{
   …
   "source":"aws.securityhub",
   …
   "detail":{
      "findings": [{
		…
    	“Types”: [
			"TTPs/Defense Evasion/Stealth:IAMUser-CloudTrailLoggingDisabled"
			],
		…
      }]
}

You can build an event pattern using these fields, which an EventBridge filtering rule can then use to identify events and to invoke the remediation Lambda function. Below is a snippet from the CloudFormation template we provided earlier that defines that event pattern for the EventBridge filtering rule:

# pattern matches the nested JSON format of a specific Security Hub finding
      EventPattern:
        source:
        - aws.securityhub
        detail-type:
          - "Security Hub Findings - Imported"
        detail:
          findings:
            Types:
              - "TTPs/Defense Evasion/Stealth:IAMUser-CloudTrailLoggingDisabled"

Once the rule is in place, EventBridge continuously monitors the event bus for events with this pattern.

When EventBridge finds a match, it invokes the remediating Lambda function and passes the full details of the event to the function. The Lambda function then parses the JSON fields in the event so that it can act as shown in this Python code snippet:

# extract trail ARN by parsing the incoming Security Hub finding (in JSON format)
trailARN = event['detail']['findings'][0]['ProductFields']['action/awsApiCallAction/affectedResources/AWS::CloudTrail::Trail']   

# description contains useful details to be sent to security operations
description = event['detail']['findings'][0]['Description']

The code also issues a notification to security operators so they can review the findings and insights in Security Hub and other services to better understand the incident and to decide whether further manual actions are warranted. Here’s the code snippet that uses SNS to send out a note to security operators:

#Sending the notification that the AWS CloudTrail has been disabled.
snspublish = snsclient.publish(
	TargetArn = snsARN,
	Message="Automatically restarting CloudTrail logging.  Event description: \"%s\" " %description
	)

While notifications to human operators are important, the Lambda function will not wait to take action. It immediately remediates the condition by restarting the stopped trail in CloudTrail. Here’s a code snippet that restarts the trail to reenable logging:

try:
	client = boto3.client('cloudtrail')
	enablelogging = client.start_logging(Name=trailARN)
	logger.debug("Response on enable CloudTrail logging- %s" %enablelogging)
except ClientError as e:
	logger.error("An error occured: %s" %e)

After the trail has been restarted, API activity is once again logged and can be audited.

This can help provide relevant data for the remaining steps in the incident response process. The data is especially important for the post-incident phase, when your team analyzes lessons learned to help prevent future incidents. You can also use this phase to identify additional steps to automate in your incident response.

How to Enable Custom Action and build your own Automated Response

Unlike how you set up the notification earlier, you may not want fully automate responses to findings. To set up automation that you can manually trigger it for specific findings, you can use custom actions. A custom action is a Security Hub mechanism for sending selected findings to EventBridge that can be matched by an EventBridge rule. The rule defines a specific action to take when a finding is received that is associated with the custom action ID. Custom actions can be used, for example, to send a specific finding, or a small set of findings, to a response or remediation workflow. You can create up to 50 custom actions.

In this section, we will walk you through how to create a custom action in Security Hub which will trigger an EventBridge rule to execute a Lambda function for the same security finding related to CloudTrail Disabled.

Create a Custom Action in Security Hub

  1. Open Security Hub. In the left navigation pane, under Management, open the Custom actions page.
  2. Choose Create custom action.
  3. Enter an Action Name, Action Description, and Action ID that are representative of an action that you are implementing—for example Enable CloudTrail Logging.
  4. Choose Create custom action.
  5. Copy the custom action ARN that was generated. You will need it in the next steps.

Create Amazon EventBridge Rule to capture the Custom Action

In this section, you will define an EventBridge rule that will match events (findings) coming from Security Hub which were forwarded by the custom action you defined above.

  1. Navigate to the Amazon EventBridge console.
  2. On the right side, choose Create rule.
  3. On the Define rule detail page, give your rule a name and description that represents the rule’s purpose (for example, the same name and description that you used for the custom action). Then choose Next.
  4. Security Hub findings are sent as events to the AWS default event bus. In the Define pattern section, you can identify filters to take a specific action when matched events appear. For the Build event pattern step, leave the Event source set to AWS events or EventBridge partner events.
  5. Scroll down to Event pattern. Under Event source, leave it set to AWS Services, and under AWS Service, select Security Hub.
  6. For the Event Type, choose Security Hub Findings – Custom Action.
  7. Then select Specific custom action ARN(s) and enter the ARN for the custom action that you created earlier.
  8. Notice that as you selected these options, the event pattern on the right was updating. Choose Next.
  9. On the Select target(s) step, from the Select a target dropdown, select Lambda function. Then, from the Function dropdown, select SecurityAutoremediation-CloudTrailStartLoggingLamb-xxxx. This lambda function was created as part of the Cloudformation template.
  10. Choose Next.
  11. For the Configure tags step, choose Next.
  12. For the Review and create step, choose Create rule.

Trigger the automation

As GuardDuty and Security Hub have been enabled, after AWS Cloudtrail logging is enabled, you should see a security finding generated by Amazon GuardDuty and collected in AWS Security Hub.

  1. Navigate to the Security Hub Findings page.
  2. In the top corner, from the Actions dropdown menu, select the Enable CloudTrail Logging custom action.
  3. Verify the CloudTrail configuration by accessing the AWS CloudTrail dashboard.
  4. Confirm that the trail status displays as Logging, which indicates the successful execution of the remediation Lambda function triggered by the EventBridge rule through the custom action.

How AWS helps customers get started

Many customers look at the task of building automation remediation as daunting. Many operations teams might not have the skills or human scale to take on developing automation scripts. Because many Incident Response scenarios can be mapped to findings in AWS security services, we can begin building tools that respond and are quickly adaptable to your environment.

Automated Security Response (ASR) on AWS is a solution that enables AWS Security Hub customers to remediate findings with a single click using sets of predefined response and remediation actions called Playbooks. The remediations are implemented as AWS Systems Manager automation documents. The solution includes remediations for issues such as unused access keys, open security groups, weak account password policies, VPC flow logging configurations, and public S3 buckets. Remediations can also be configured to trigger automatically when findings appear in AWS Security Hub.

The solution includes the playbook remediations for some of the security controls defined as part of the following standards:

  • AWS Foundational Security Best Practices (FSBP) v1.0.0
  • Center for Internet Security (CIS) AWS Foundations Benchmark v1.2.0
  • Center for Internet Security (CIS) AWS Foundations Benchmark v1.4.0
  • Center for Internet Security (CIS) AWS Foundations Benchmark v3.0.0
  • Payment Card Industry (PCI) Data Security Standard (DSS) v3.2.1
  • National Institute of Standards and Technology (NIST) Special Publication 800-53 Revision 5

A Playbook called Security Control is included that allows operation with AWS Security Hub’s Consolidated Control Findings feature.

Figure 12: Architecture of the Automated Security Solution

Figure 12: Architecture of the Automated Security Solution

Additionally, the library includes instructions in the Implementation Guide on how to create new automations in an existing Playbook.

You can use and deploy this library into your accounts at no additional cost, however there are costs associated with the services that it consumes.

Clean up

After you’ve completed the sample security response automation, we recommend that you remove the resources created in this walkthrough example from your account in order to minimize the charges associated with the trail in CloudTrail and data stored in S3.

Important: Deleting resources in your account can negatively impact the applications running in your AWS account. Verify that applications and AWS account security do not depend on the resources you’re about to delete.

Here are the clean-up steps:

Summary

You’ve learned the basic concepts and considerations behind security response automation on AWS and how to use Amazon EventBridge, Amazon GuardDuty and AWS Security Hub to automatically re-enable AWS CloudTrail when it becomes disabled unexpectedly. Additionally you got a chance to learn about the AWS Automated Security Response library and how it can help you rapidly get started with automations through Security Hub. As a next step, you may want to start building your own custom response automations and dive deeper into the AWS Security Incident Response Guide, NIST Cybersecurity Framework (CSF) or the AWS Cloud Adoption Framework (CAF) Security Perspective. You can explore additional automatic remediation solutions on the AWS Solution Library. You can find the code used in this example on GitHub.

If you have feedback about this blog post, submit them in the Comments section below. If you have questions about using this solution, start a thread in the
EventBridge, GuardDuty or Security Hub forums, or contact AWS Support.

Reduce EMR HBase upgrade downtime with the EMR read-replica prewarm feature

Post Syndicated from Suthan Phillips original https://aws.amazon.com/blogs/big-data/reduce-emr-hbase-upgrade-downtime-with-the-emr-read-replica-prewarm-feature/

HBase clusters on Amazon Simple Storage Service (Amazon S3) need regular upgrades for new features, security patches, and performance improvements. In this post, we introduce the EMR read-replica prewarm feature in Amazon EMR and show you how to use it to minimize HBase upgrade downtime from hours to minutes using blue-green deployments. This approach works well for single-cluster deployments where minimizing service interruption during infrastructure changes is important.

Understanding HBase operational challenges

HBase cluster upgrades have required complete cluster shutdowns, resulting in extended downtime while regions initialize and RegionServers come online. Version upgrades require a complete cluster switchover, with time-consuming steps that include loading and verifying region metadata, performing HFile checks, and confirming proper region assignment across RegionServers. During this critical period—which can extend to hours depending on cluster size and data volume—your applications are completely unavailable.

The challenge doesn’t stop at version upgrades. You must regularly apply security patches and kernel updates to maintain compliance. For Amazon EMR 7.0 and later clusters running on Amazon Linux 2023, instances don’t automatically install security updates after launch; they remain at the patch level from cluster creation time. AWS recommends periodically recreating clusters with newer AMIs, requiring the same hard cutover and downtime risks as a full version upgrade. Similarly, when you need to use different instance types, traditional approaches mean taking your cluster offline.

Solution overview

Amazon EMR 7.12 introduces read-replica prewarm, a new feature that tackles these challenges. This feature lets you make infrastructure changes to Apache HBase on Amazon S3 at scale while reducing downtime risk and maintaining data consistency.

With read-replica prewarm, you can prepare and validate your changes in a read-replica cluster before promoting it to active status, cutting service interruption from hours to minutes. You will learn how to prepare your read-replica cluster with the target version, execute cutover procedures that minimize downtime, and verify successful migration before completing the switchover.

Read-replica prewarm architecture

The following diagram shows the architecture and workflow. Both primary and read-replica clusters interact with the same Amazon S3 storage, accessing the same S3 bucket and root directory.

Amazon EMR HBase architecture diagram showing primary cluster in Availability Zone 1 with read/write access to Amazon S3, and read-replica cluster in Availability Zone 2 with read access to S3.

Distributed locking confirms only one HBase cluster can write at a time (for clusters version 7.12.0 and later). The read-replica cluster performs full HBase region initialization without time pressure, and after promotion, the read replica becomes the active writer as shown in the following diagram.

Amazon EMR HBase failover scenario showing primary cluster unavailable in Availability Zone 1, with read-replica cluster in Availability Zone 2 promoted to handle read and write operations after failover.

Implementation steps HBase cluster upgrade

Now that you understand how read-replica prewarm works and the architecture behind it, let’s put this knowledge into practice. You will follow a process that consists of three main phases: preparation, cutover, and verification. Each phase includes specific steps, shown in the following figure, that you will execute in sequence to complete the migration.

Process flow diagram showing three-phase HBase cluster migration: Phase 1 preparation and validation, Phase 2 cutover and DNS update, Phase 3 post-migration verification.

Phase 1: Preparation

Before starting the migration, prepare both your primary cluster and launch a new read-replica cluster. Each step in this phase builds toward confirming that your new cluster can properly access and serve your existing data.

  1. Run major compactions on tables to verify regions are not in SPLIT state
    Run major compactions to consolidate data files and verify regions are not in SPLIT state. Split regions can cause assignment conflicts during migration, so resolving them at the start helps maintain cluster stability throughout the transition.

    echo “major_compact 'tablename'” | hbase shell

  2. Run catalog_janitor to clean up stale regions
    Execute the catalog_janitor process (HBase’s built-in maintenance tool) to remove stale region references from the metadata. Cleaning up these references prevents confusion during region assignment in the read-replica cluster.

    echo “catalogjanitor_run” | hbase shell

  3. Confirm no inconsistencies in the primary HBase cluster
    Verify cluster integrity before migration:

    sudo -u hbase hbase hbck > hbck_report.txt

    Running the HBase Consistency Check tool version 2 (HBCK2) performs a diagnostic scan that identifies and reports problems in metadata, regions, and table states, confirming your cluster is ready for migration.

  4. Launch HBase read-replica cluster with the target version connecting to the same HBase root directory in Amazon S3 as the primary cluster
    Launch a new HBase cluster with the target version and configure it to connect to the same S3 root directory as the primary cluster. Confirm that read-only mode is enabled by default as shown in the following screenshot.

    AWS console screenshot showing Amazon EMR data durability and availability configuration options, with "Create a read-replica cluster" option selected and S3 location settings.

    If you are using AWS Command Line Interface (AWS CLI), you can enable the read replica while launching the Amazon EMR HBase on the Amazon S3 cluster by setting the hbase.emr.readreplica.enabled.v2 parameter to true in the HBase classification as shown in the following example:

    {
        "Classification": "hbase",
        "Properties": {
          "hbase.emr.readreplica.enabled.v2": "true",
          "hbase.emr.storageMode": "s3"
        }
    }

  5. Run meta refresh in this read-replica HBase cluster
    echo "refresh_meta" | hbase shell

    You’re creating a parallel environment with the new version that can access existing data without modification risk, allowing validation before committing to the upgrade.

  6. Validate the read-replica and verify that regions show OPEN status and are properly assigned:
    Execute sample read operations against your key tables to confirm the read replica can access your data correctly. In the HBase Master UI, verify that regions show OPEN status and are properly assigned to RegionServers. You should also confirm that the total data size matches your previous cluster to verify complete data visibility.
  7. Prepare for cutover on primary cluster
    Disable balancing and compactions on the primary cluster:

    echo "balance_switch false" | hbase shell
    echo "compaction_switch false" | hbase shell

    Preventing background operations from changing data layout or triggering region movements maintains a consistent state during the migration window.

    Take snapshots of your tables for rollback capability:

    # For each table
    echo "snapshot 'table_name', 'table_name_pre_migration_$(date +%Y%m%d)'" | hbase shell
    # For system tables
    echo "snapshot 'hbase:meta', 'meta_pre_migration_$(date +%Y%m%d)'" | hbase shell
    echo "snapshot 'hbase:namespace', 'namespace_pre_migration_$(date +%Y%m%d)'" | hbase shell

    These snapshots enable point-in-time recovery if you discover issues after migration.

  8. Run meta refresh and refresh hfiles on the read replica:
    echo "refresh_meta" | hbase shell
    hbase org.apache.hadoop.hbase.client.example.RefreshHFilesClient "table_name'"

    Refreshing confirms the read replica has the most current region assignments, table structure, and HFile references before taking over production traffic.

  9. Check for inconsistencies in the read-replica cluster
    Run the HBCK2 tool on the read-replica cluster to identify potential issues:

    sudo -u hbase hbase hbck > hbck_report.txt

    When a read replica is created, both the primary and replica clusters show metadata inconsistencies referencing each other’s meta folders: “There is a hole in the region chain”. The primary cluster complains about meta_<read-replica-cluster-id>, while the read replica complains about the primary’s meta folder. This inconsistency doesn’t impact cluster operations but shows up in hbck reports. For a clean hbck report after switching to the read replica and terminating the primary cluster, manually delete the old primary’s meta folder from Amazon S3 after taking a backup of it.

    Additionally, check the HBase Master UI to visually confirm cluster health. Verifying the read-replica cluster has a clean, consistent state before promotion prevents potential data access issues after cutover.

Phase 2: Cutover

Perform the actual migration by shutting down the primary cluster and promoting the read replica. The steps in this phase minimize the window when your cluster is unavailable to applications.

  1. Remove the primary cluster from DNS routing
    Update DNS entries to direct traffic away from the primary cluster, preventing new requests from reaching it during shutdown.
  2. Flush in-memory data to Amazon S3
    Flush in-memory data to confirm durability in Amazon S3:

    # Flush application data  
    echo "flush 'usertable'" | hbase shell
    # Flush system tables
    echo "flush 'hbase:meta'" | hbase shell
    echo "flush 'hbase:namespace'" | hbase shell

    Flushing forces data still in memory (in MemStores, HBase’s write cache) to be written to persistent storage (Amazon S3), preventing data loss during the transition between clusters.

  3. Terminate the primary cluster
    Terminate the primary cluster after confirming the data is persisted to Amazon S3. This step releases resources and eliminates the possibility of split-brain scenarios where both clusters might accept writes to the same dataset.
  4. Promote the read replica to active status
    Convert the read replica to read-write mode:

    echo "readonly_switch false" | hbase shell  
    echo "readonly_state" | hbase shell  # Verify the switch was successful

    The promotion process automatically refreshes meta and HFiles, capturing final changes from the flush operations and confirming complete data visibility.

    When you promote the cluster, it transitions from read-only to read-write mode, allowing it to accept application write operations and fully replace the old cluster’s functionality.

  5. Update DNS to point to the new active cluster
    Update DNS entries to direct traffic to the new active cluster. Routing client traffic to the new cluster restores service availability and completes the migration from the application perspective.

Phase 3: Validation

With your new cluster now active, you’re ready to verify that everything is working correctly before declaring the migration complete.

Execute test write operations to confirm the cluster accepts writes properly. Check the HBase Master UI to verify regions are serving both read and write requests without errors. At this point, your migration to the new Amazon EMR release is complete, and your applications can connect to the new cluster and resume normal read-write operations.

Key benefits

The read-replica prewarm approach delivers several important advantages over traditional HBase upgrade methods. Most notably, you can reduce service interruption from hours to minutes by preparing your new cluster in parallel with your running production environment.

Before committing to the upgrade, you can thoroughly test that data is readable and accessible in the new version. The system loads and assigns regions before activation, eliminating the lengthy startup time that traditionally causes extended downtime. This pre-warming process means your new cluster is ready to serve traffic immediately upon promotion.

You also gain the ability to validate multiple aspects of your deployment before cutover, including data integrity, read performance, cluster stability, and configuration correctness. This validation happens while your production cluster continues serving traffic, reducing the risk of discovering issues during your maintenance window.

For testing and validation workflows, you can run parallel testing environment by creating multiple HBase read replicas. However, you should verify that only one HBase cluster remains in read-write mode to the Amazon S3 data store to prevent data corruption and consistency issues.

Rollback procedures

Always thoroughly test your HBase rollback procedures before implementing upgrades in production environments.

When rolling back HBase clusters in Amazon EMR, you have two primary options.

  • Option 1 involves launching a new cluster with the previous HBase version that points to the same Amazon S3 data location as the upgraded cluster. This approach is straightforward to implement, preserves data written before and after the upgrade attempt, and offers faster recovery with no additional storage requirements. However, it risks encountering data compatibility issues if the upgrade modified data formats or metadata structures, potentially leading to unexpected behavior.
  • Option 2 takes a more cautious approach by launching a new cluster with the previous HBase version and restoring from snapshots taken before the upgrade. This method guarantees a return to a known, consistent state, eliminates version compatibility risks, and provides complete isolation from corruption introduced during the upgrade process. The tradeoff is that data written after the snapshot was taken will be lost, and the restoration process requires more time and planning.

For production environments where data integrity is paramount, the snapshot-based approach (option 2) is generally preferred despite the potential for some data loss.

Considerations

  • Store file tracking migration: Migrating from Amazon EMR 7.3 (or earlier) requires disabling and dropping the hbase:storefile table on the primary cluster, then flushing metadata. When launching the new read-replica cluster, configure the DefaultStoreFileTracker implementation using the hbase.store.file-tracker.impl property. When operational, run change_sft commands to switch tables to FILE tracking method, providing seamless data file access during migration.
  • Multi-AZ deployments: Consider network latency and Amazon S3 access patterns when deploying read replicas across Availability Zones. Cross-AZ data transfer might impact read latency for the read-replica cluster.
  • Cost impact: Running parallel clusters during migration incurs additional infrastructure costs until the primary cluster is terminated.
  • Disabled tables: The disabled state of tables in the primary cluster is a cluster-specific administrative property that isn’t propagated to the read-replica cluster. If you want them disabled in the read replica, you must explicitly disable them.
  • Amazon EMR 5.x cluster upgrade: Direct upgrade from Amazon EMR 5.x to Amazon EMR 7.x using this feature isn’t supported because of the major HBase version change from 1.x to 2.x. For upgrading from Amazon EMR 5.x to Amazon EMR 7.x, follow the steps in our best practices: AWS EMR Best Practices – HBase Migration

Conclusion

In this post, we showed you how the read-replica prewarm feature of Amazon EMR 7.12 improves HBase cluster operations by minimizing the hard cutover constraints that make infrastructure changes challenging. This feature gives you a consistent blue-green deployment pattern that reduces risk and downtime for version upgrades and security patches.

When you can thoroughly validate changes before committing to them and reduce service interruption from hours to minutes, you can maintain HBase infrastructure more confidently and efficiently. You can now take a more proactive approach to cluster maintenance, security compliance, and performance optimization with greater confidence in your operational processes.

To learn more about Amazon EMR and HBase on Amazon S3, visit the Amazon EMR documentation. To get started with read replicas, see the HBase on Amazon S3 guide .


About the authors

Suthan Phillips

Suthan Phillips

Suthan is a Senior Analytics Architect at AWS, where he helps customers design and optimize scalable, high-performance data solutions that drive business insights. He combines architectural guidance on system design and scalability with best practices to provide efficient, secure implementation across data processing and experience layers. Outside of work, Suthan enjoys swimming, hiking, and exploring the Pacific Northwest.

Ramesh Kandasamy

Ramesh Kandasamy

Ramesh is an Engineering Manager at Amazon EMR. He is a long tenured Amazonian dedicated to solve distributed systems problems.

Mehul Gulati

Mehul Gulati

Mehul is a Software Development Engineer for Amazon EMR at Amazon Web Services. His expertise spans big data systems including HBase, Hive, Tez, and distributed storage solutions. His customer obsession and focus on reliability helps Amazon EMR deliver reliable and efficient big data processing capabilities to customers.

How Artera enhances prostate cancer diagnostics using AWS

Post Syndicated from Hariharan Ananthakrishnan original https://aws.amazon.com/blogs/architecture/how-artera-enhances-prostate-cancer-diagnostics-using-aws/

This post was co-written with Hariharan Ananthakrishnan from Artera.

Artificial intelligence (AI) and machine learning (ML) are transforming cancer diagnosis and treatment, enabling faster and more accurate decisions for patients. One company at the forefront of this transformation is Artera, a precision medicine company developing an AI-powered platform for cancer treatment planning. The U.S. Food and Drug Administration (FDA) has granted De Novo authorization for the ArteraAI Prostate, establishing it as the first and only AI-powered software authorized to prognosticate long-term outcomes for patients with nonmetastatic prostate cancer. The ArteraAI Prostate is now recognized as an FDA-regulated software as a medical device (SaMD). In this post, we explore how Artera used Amazon Web Services (AWS) to develop and scale their AI-powered prostate cancer test, accelerating time to results and enabling personalized treatment recommendations for patients.

Customer overview

Artera offers AI-enabled predictive and prognostic cancer tests, including the ArteraAI Prostate Test. This innovative test analyzes images of a patient’s biopsy to accurately predict the risk of localized cancer spreading as well as the likelihood a patient will benefit from specific therapies. This is the first test that can predict therapeutic benefit for patients with localized prostate cancer, and physicians can use it to make treatment decisions with more confidence, ultimately improving patient outcomes.

Artera is making significant strides in the field of precision medicine, operating in multiple regions. Recently, the FDA granted De Novo authorization for the ArteraAI Prostate platform, highlighting its potential to address unmet needs in cancer care. Since 2024, the ArteraAI Prostate Test has been considered the standard of care for localized prostate cancer, being included in the National Comprehensive Cancer Network Clinical Practice Guidelines in Oncology. The technology’s De Novo authorization establishes a new product code category for future AI-powered digital pathology risk-stratification tools, and it enables its implementation at the point of diagnosis at qualified pathology labs across multiple countries. This capability addresses a critical gap in prostate cancer care by reducing delays in delivering actionable insights at diagnosis, helping clinicians and patients make informed treatment decisions with greater confidence.

The challenge of matching treatment to patient

When patients are diagnosed with cancer, their next step is to determine the course of therapy that will yield the best outcome. Typically, more aggressive cancers require more aggressive therapy. However, it’s not always clear how aggressively the cancer may progress. Furthermore, patients respond differently to the same therapy based on their unique biological makeup. As a consequence, some patients with less aggressive disease are inadvertently overtreated, receiving unnecessary therapies involving a host of side effects, while others with more aggressive cancers are undertreated, leading to potentially worse outcomes.

Before Artera’s solution, there were no AI-based tools to help physicians and cancer patients make personalized, timely treatment decisions. Instead, physicians submitted a patient’s biopsy tissue sample to a lab, where a chemical assay measured the expression levels of a small set of genes. The RNA expression of these genes was then used to assess a patient’s risk level. These tests have several limitations:

  • The entire process can take 6 weeks—a long time to wait when making a high-stress decision about cancer therapy.
  • These tests typically only identify a small number of key genes (as science continues to advance faster than the diagnostic tests can keep up) linked to cancer risk.
  • These tests consume the original tissue samples, limiting the physician’s ability to order additional tests, as well as the patient’s ability to enroll in future clinical trials or participate in long-term monitoring

Developing an AI-powered diagnostic tool for cancer treatment presents unique technical challenges. Artera had to manage and process a large volume of high-resolution biopsy image files to power their AI-driven cancer diagnostics. These images are enormous, sometimes reaching 8 GB, and they need to be broken down into tens of thousands of smaller patches for the model to handle. Training Artera’s foundation models (FMs) requires serving millions of image patches at high volume to AWS servers.

Additionally, as a healthcare company handling sensitive patient data, Artera needed to ensure compliance and data residency and regulatory requirements across multiple countries, including the Health Insurance Portability and Accountability Act (HIPAA) in the United States. They needed a robust, scalable storage solution that would enable their ML engineers to focus on the core cancer research rather than infrastructure management.

Modern, scalable design delivers fast results

Artera implemented a comprehensive AWS based solution to address their challenges. The architecture follows a modern, scalable design that enables secure processing of sensitive medical data while delivering fast results to healthcare providers. Their solution starts with training AI models, advanced workflow orchestration, and data locality principles that are critical for global deployment of clinical AI models.

“Artera was founded with the belief that there were a lot of signals in the histopathology image data that were not being used, but if an AI algorithm could be specifically developed with this in mind, you could radically change cancer patient care,”

– Nathan Silberman, Chief Technology Officer of Artera.

The following architecture diagram illustrates how Artera has built a secure, scalable solution on AWS. At its core, Artera’s AI products are composed of many individual steps in a complex workflow, often involving multiple AI models that perform different specialized tasks. This sophisticated workflow orchestration helps them move faster and abstract away complexity as they build their compound AI system.

AWS architecture diagram showing medical professionals accessing ArteraAI portal through AWS Global Accelerator, WAF, load balancer, with ECS web portal and EKS AI inference cluster in a VPC, connected to data storage services and comprehensive security monitoring.

Comprehensive AWS architecture diagram showing the integration of cloud services for a medical professionals’ portal with AI inference capabilities, including data flow from end users through global acceleration services to compute, storage, and security infrastructure in a VPC within Region A.

Medical professionals access the Artera Portal, which serves as the interface for uploading biopsy images and receiving diagnostic results. AWS Global Accelerator sits in front of the Application Load Balancer, providing improved availability and performance by directing traffic through the AWS global network. Amazon CloudFront provides a fast, secure content delivery network for the portal’s static assets, providing low-latency access globally

Within a virtual private cloud (VPC), Elastic Load Balancing distributes incoming traffic across the application servers. Amazon Elastic Container Service (Amazon ECS) hosts the web portal containers, providing the user interface for healthcare professionals. An Amazon Elastic Kubernetes Service (Amazon EKS) cluster runs the AI/ML inference workloads that analyze biopsy images using computer vision models.

Amazon Elastic File System (Amazon EFS) provides shared file storage, accessible by both Amazon ECS and Amazon EKS for storing and processing biopsy images. Amazon Relational Database Service (Amazon RDS) delivers a managed relational database for patient records, diagnostic results, and application data with high availability. Amazon ElastiCache provides in-memory caching to improve application performance and reduce latency for frequently accessed data.

AWS Identity and Access Management (IAM) provides proper access controls and permissions. AWS Key Management Service (AWS KMS) manages encryption keys for sensitive patient data. Amazon CloudWatch monitors the entire infrastructure for performance and health. Amazon Simple Storage Service (Amazon S3) provides durable, secure storage for biopsy images and analysis results.

This architecture enables a complete workflow:

  1. Data ingestion – Biopsy images are securely uploaded through the portal and stored in Amazon S3.
  2. Processing pipeline – The EKS cluster orchestrates containerized preprocessing applications that prepare images for analysis.
  3. ML model training and execution – The AI models are trained and deployed on Amazon EKS and access the preprocessed images from Amazon EFS, then run Artera’s proprietary ML algorithms, with metadata and results stored in Amazon RDS. The company’s ML teams use EKS to train their massive pan-tumor FM, which is capable of assessing patient risk and therapy benefit across any cancer sample.
  4. Results storage and delivery – Analysis results are stored in Amazon S3 and made available to healthcare providers through the secure web portal.

Data locality and global scalability

One of the key challenges Artera faced was maintaining data locality while serving AI globally. The company uses multiple AWS services to create a comprehensive solution that addresses both performance and compliance requirements.

AWS global infrastructure enables Artera to deploy Region-specific resources that keep sensitive patient data within appropriate jurisdictional boundaries. Amazon S3 provides secure, Region-specific storage buckets, and Amazon EKS allows for containerized workloads to run locally in each Region.

“One of the nice things about Amazon EFS is that it’s very simple to achieve data locality,” says Silberman. “We can mount file systems in the same AWS Region as our applications, ensuring data stays close to where it’s processed.”The combination of Amazon S3, Amazon EKS, Amazon EFS, and other AWS networking services creates a robust foundation for Artera’s global operations. This integrated approach helps Artera accelerate time to market in new regions while maintaining the highest standards of data security and compliance with regional regulations.

To learn more about how Artera uses Amazon EFS, visit the case study, Artera Shapes the Future of Cancer Treatment Using Machine Learning on AWS.

Results and patient impact

By using AWS Cloud services, Artera has transformed cancer diagnostics with tangible benefits for patients:

  • Accelerated results – Patients receive personalized treatment recommendations in only 1–2 days, compared to 6 weeks for traditional genomic tests—dramatically reducing the waiting period for critical treatment decisions.
  • Improved clinical decisions – The speed and accuracy of Artera’s AI-powered diagnostics help physicians make more informed treatment decisions, potentially improving outcomes for prostate cancer patients.
  • Tissue preservation – Unlike traditional tests that destroy tissue samples through chemical assays, the ArteraAI Prostate Test uses only digital imagery, preserving the original tissue for additional tests or clinical trials.

In 2024, almost 300,000 Americans were diagnosed with prostate cancer. For these patients, timely and accurate diagnostics are essential.

“Imagine a patient getting the worst news they’ve ever had and having to sit on that for 6 weeks to determine what the treatment plan is,” says Silberman. “Instead, Artera provides custom-tailored, personalized results within days.”

There are over 3.5 million prostate cancer survivors in the United States. By recommending personalized treatment plans, Artera is helping patients determine the best therapeutic options to achieve progression-free survival while minimizing unnecessary side effects.

“We’ve heard from patients who have said that because of our test, they were able to avoid unnecessary treatments with a lot of side effects,” says Silberman. “That’s why all of us at Artera are here, giving clinicians as many data-backed insights as possible to inform the patient and make the best possible choice for their care.”

Operational benefits

Using AWS services has meant that Artera has achieved significant operational advantages:

  • Enhanced focus on innovation – With AWS managing the infrastructure, Artera’s engineers can dedicate more time to refining their ML algorithms and expanding diagnostic capabilities.

“Using AWS, we can focus on the histopathology problems, rather than on maintenance and monitoring,” says Silberman.

  • Global scalability – Artera has successfully expanded operations while maintaining compliance with regional data regulations across multiple countries.
  • Efficient processing – The test processes tens of thousands of image files through ML workflows per biopsy slide, completing in hours instead of weeks. This efficiency comes from Artera’s sophisticated workflow orchestration that breaks up large input images (sometimes reaching 8 GB) into many small patches processed in parallel across EKS clusters.

The FDA’s De Novo authorization for the ArteraAI Prostate Test underscores the potential impact of this technology on cancer care. With AWS powering their infrastructure, Artera is well-positioned to continue revolutionizing how cancer is diagnosed and treated.

Future innovations

As Artera continues to innovate in the field of AI-powered cancer diagnostics, their AWS based infrastructure provides the foundation for future growth. The company’s ultimate goal is a massive pan-tumor FM capable of assessing patient risk and therapy benefit across any cancer sample. Using elastic, scalable solutions on AWS, Artera has a solid foundation for developing ML models for additional cancer tests. The company has announced plans for a breast cancer product, with several more products close behind.

“What we have coming up is a rapid acceleration across different areas of cancer,” says Silberman. “As proud as we are of the work that we’ve done in the prostate cancer space, we’re just getting started.”

Artera plans to expand their AI capabilities in several ways:

  • Analyze additional biomarkers
  • Integrate genomic data with imaging analysis
  • Create more comprehensive diagnostic tools
  • Partner with major healthcare systems to integrate diagnostic tools directly into clinical workflows

With the scalability of AWS services, Artera is positioned to handle the increasing data demands as they expand to new cancer types and regions globally.

Conclusion

Artera’s journey demonstrates how AWS Cloud services can empower healthcare innovators to develop and scale life-changing technologies. By using Amazon EKS, Amazon ECS, Amazon EFS, Amazon RDS, Amazon S3, AWS Global Accelerator, and Amazon ElastiCache, Artera built a robust, scalable infrastructure they use to keep their focus on their core mission: improving cancer treatment through AI-powered diagnostics. To learn more about how AWS can help your healthcare organization implement AI and ML solutions, visit AWS for Healthcare.

To learn more about Artera and their innovative cancer diagnostics, visit Artera.ai.


About the authors

A proposed governance structure for openSUSE

Post Syndicated from corbet original https://lwn.net/Articles/1056593/

Jeff Mahoney, who
holds a vice-president position at SUSE, has posted a detailed
proposal
for improving the governance of the openSUSE project.

It’s meant to be a way to move from governance by volume or
persistence toward governance by legitimacy, transparency, and
process – so that disagreements can be resolved fairly and the
project can keep moving forward. Introducing structure and
predictability means it easier for newcomers to the project to
participate without needing to understand decades of accumulated
history. It potentially could provide a clearer roadmap for
developers to find a place to contribute.

The stated purpose is to start a discussion; this is openSUSE, so he is
likely to succeed.

The collective thoughts of the interwebz