On-demand and scheduled scaling of Amazon MSK Express based clusters

Post Syndicated from Subham Rakshit original https://aws.amazon.com/blogs/big-data/on-demand-and-scheduled-scaling-of-amazon-msk-express-based-clusters/

Modern streaming workloads are highly dynamic—traffic volumes fluctuate based on time of day, business cycles, or event-driven bursts. Customers need to dynamically scale Apache Kafka clusters up and down to maintain consistent throughput and performance without incurring unnecessary cost. For example, ecommerce platforms see sharp traffic increases during seasonal sales, and financial systems experience load spikes during market hours. Scaling clusters helps teams align cluster capacity with increased ingress throughput in response to these variations, leading to more efficient utilization and a better cost-to-performance ratio.

Amazon Managed Streaming for Apache Kafka (Amazon MSK) Express brokers are a key component to dynamically scaling clusters to meet demand. Express based clusters deliver 3 times higher throughput, 20 times faster scaling capabilities, and 90% faster broker recovery compared to Amazon MSK Provisioned clusters. In addition, Express brokers support intelligent rebalancing for 180 times faster operation performance, so partitions are automatically and consistently well distributed across brokers. This feature is enabled by default for all new Express based clusters and comes at no additional cost to customers. This capability alleviates the need for manual partition management when modifying cluster capacity. Intelligent rebalancing automatically tracks cluster health and triggers partition redistribution when resource imbalances are detected, maintaining performance across brokers.

This post demonstrates how to use the intelligent rebalancing feature and build a custom solution that scales Express based clusters horizontally (adding and removing brokers) dynamically based on Amazon CloudWatch metrics and predefined schedules. The solution provides capacity management while maintaining cluster performance and minimizing overhead.

Overview of Kafka scaling

Scaling Kafka clusters involves adding or removing brokers to the cluster while providing balanced data distribution and uninterrupted service. When new brokers are added, partition reassignment is required to evenly distribute load across the cluster. This process is typically performed manually—either through the Kafka command line tools (kafka-reassign-partitions.sh) or by using automation frameworks such as Cruise Control, which intelligently calculates and executes reassignment plans. During scale-in operations, partitions hosted on the brokers marked for removal must first be migrated to other brokers, leaving the target brokers empty before decommissioning.

Challenges of scaling Kafka dynamically

The complexity of scaling depends heavily on the underlying storage model. In deployments where broker data resides entirely on local storage, scaling involves physical data movement between brokers, which can take considerable time depending on partition size and replication factor. In contrast, environments that use tiered storage shift most of the data to remote object storage such as Amazon Simple Storage Service (Amazon S3), making scaling a largely metadata-driven operation. This significantly reduces data transfer overhead and accelerates both broker addition and removal, enabling more elastic and operationally efficient Kafka clusters.

However, scaling Kafka remains a non-trivial operation due to the interplay between storage, data movement, and broker resource utilization. When partitions are reassigned across brokers, large volumes of data must be copied over the network, often leading to network bandwidth saturation, storage bandwidth exhaustion, and elevated CPU utilization. Depending on data volume and replication factor, partition rebalancing can take several hours, during which time cluster performance and throughput might temporarily degrade and often require additional configuration to throttle the data movement. Although tools like Cruise Control automate this process, they introduce another layer of complexity: selecting the right combination of rebalancing goals (such as disk capacity, network load, or replica distribution) requires a deep understanding of Kafka internals and trade-offs between speed, balance, and stability. As a result, efficient scaling is an optimization problem, demanding careful orchestration of storage, compute, and network resources.

How Express brokers simplify scaling

Express brokers manage Kafka scaling through their decoupled compute and storage architecture. This innovative design enables unlimited storage without pre-provisioning, significantly simplifying cluster sizing and management. The separation of compute and storage resources allows Express brokers to scale faster than standard MSK brokers, enabling rapid cluster expansion within minutes. With Express brokers, administrators can adjust capacity both vertically and horizontally as needed, alleviating the need for over-provisioning. The architecture provides sustained broker throughput during scaling operations, with Express brokers capable of handling 500 MBps ingress and 1000 MBps egress on m7g.16xl instances. For more information about how the scaling process works in Express based clusters, see Express brokers for Amazon MSK: Turbo-charged Kafka scaling with up to 20 times faster performance.

Added to this faster scaling capability, when you add or remove brokers from your Express based clusters, intelligent rebalancing automatically redistributes partitions to balance resource utilization across the brokers. This makes sure the cluster continues to operate at peak performance, making scaling in and out possible with a single update operation. Intelligent rebalancing is enabled by default on new Express broker clusters and continuously monitors cluster health for resource imbalances or hotspots. For example, if certain brokers become overloaded due to uneven distribution of partitions or skewed traffic patterns, intelligent rebalancing will automatically move partitions to less utilized brokers to restore balance.

Finally, Express based clusters automate client configuration of broker bootstrap connection strings to allow clients to connect to clusters seamlessly as brokers are added and removed. Express based clusters provide three connection strings, one per Availability Zone, which are independent of the brokers in the cluster. This means clients only need to configure these connection strings to maintain consistent connections as brokers are added or removed. These key capabilities of Express based clusters—rapid scaling, intelligent rebalancing, and dynamic broker bootstrapping—are critical to enabling dynamic scaling in Kafka clusters. In the following section, we explore how we use these capabilities to automate the scaling process of Express based clusters.

On-demand and scheduled scaling

Leveraging fast scaling capabilities of Express brokers together with intelligent rebalancing, you can build a flexible and dynamic scaling solution to optimize your Kafka cluster resources. There are two primary approaches for automatic scaling that balance performance needs with cost efficiency: on-demand and scheduled scaling.

On-demand scaling

On-demand scaling tracks cluster performance and responds to capacity demands. This approach addresses scenarios where workload patterns experience traffic spikes. On-demand scaling tracks Amazon MSK performance indicators as CPU utilization and network ingress and egress throughput per broker. Beyond these infrastructure metrics, the solution also supports using CloudWatch metrics to enable business-logic-driven scaling decisions.

The solution evaluates the performance metrics continuously against configurable thresholds to determine when scaling actions are necessary. When brokers operate above capacity thresholds consistently over a period of time, it invokes an Amazon MSK API to increase the broker count of the cluster. The solution in this post currently supports horizontal scaling (adding and removing brokers) only. Intelligent rebalancing will then automatically redistribute the partitions to spread the load across the new brokers that are added. Similarly, when utilization drops below thresholds, the solution invokes an Amazon MSK API to remove brokers. The rebalancing process automatically moves partitions from the broker marked for removal to other brokers in the cluster. This solution requires topics to have sufficient partitions to support rebalancing to new brokers as brokers are added.

The following diagram illustrates the on-demand scaling workflow.

This diagram illustrates the automated scaling and rebalancing workflow for Amazon Managed Streaming for Apache Kafka (MSK). The process consists of four sequential stages that ensure optimal cluster performance through intelligent monitoring and automated actions.

Scheduled scaling

Scheduled scaling adjusts cluster capacity using time-based triggers. This approach is useful for applications with traffic patterns that correlate with business hours or schedules. For example, ecommerce platforms benefit from scheduled scaling during peak sale periods when customer activity peaks. Scheduled scaling is also useful for customers who want to avoid cluster modification operations during business hours. This solution uses a configurable schedule to scale out the cluster capacity before business hours to handle the anticipated traffic and scale in after business hours to reduce costs. This particular solution currently supports horizontal scaling (adding/removing brokers) only. With scheduled scaling, you can handle specific scenarios such as weekday business hours, weekend maintenance windows, or specific dates. You can also specify the desired number of brokers at scale-out and scale-in.

The following diagram illustrates the scheduled scaling workflow.

This horizontal process flow diagram illustrates the automated scaling and rebalancing workflow for Amazon Managed Streaming for Apache Kafka (MSK). The diagram demonstrates how MSK clusters continuously monitor performance, evaluate scaling requirements, execute scaling operations, and automatically rebalance partitions to maintain optimal performance without manual intervention.

Solution overview

This solution provides scaling automation for Express brokers through two approaches:

  • On-demand scaling – Tracks built-in cluster performance metrics or custom CloudWatch metrics and adjusts broker capacity when thresholds are crossed
  • Scheduled scaling – Scales clusters based on specific schedules

In the following sections, we provide the implementation details for both scaling methods.

Prerequisites

Complete the following steps as prerequisites:

  1. Create an Express cluster with intelligent rebalancing enabled. The intelligent rebalancing feature is required for this solution to work. Note the Amazon Resource Name (ARN) of the cluster.
  2. Install Python 3.11 or higher on Amazon Elastic Compute Cloud (Amazon EC2).
  3. Install the AWS Command Line Interface (AWS CLI) and configure it with your AWS credentials.
  4. Install the AWS CDK CLI.

On-demand scaling solution

The solution uses an AWS Lambda function that is triggered by an Amazon EventBridge scheduler periodically. The Lambda function checks the cluster state and time since the last broker addition or removal was done. This is done to determine if the cluster is ready to scale. If the cluster is ready for scaling, the function collects the CloudWatch metrics that need to be evaluated to make the scaling decision. Based on the scaling configuration and using the metrics in CloudWatch, the function evaluates the scaling logic and executes the scaling decision. The scaling decision can lead to addition or removal of brokers to the cluster. In both cases, intelligent rebalancing handles partition distribution across brokers without manual intervention. You can find more details of the scaling logic in the GitHub repo.

The following diagram illustrates the architecture of the on-demand scaling solution.
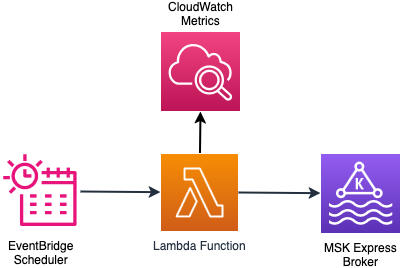
This AWS architecture diagram illustrates a serverless event-driven workflow that uses Amazon EventBridge Scheduler to trigger AWS Lambda functions that interact with Amazon MSK Express brokers, with monitoring provided by Amazon CloudWatch Metrics. The diagram demonstrates a fully managed, scalable architecture for time-based or event-based Apache Kafka operations.

Deploy on-demand scaling solution

Follow these steps to deploy the on-demand scaling infrastructure. For this post, we demonstrate the on-demand scale-out functionality.

  1. Run the following commands to set the project up:
    git clone https://github.com/aws-samples/sample-msk-express-brokers-scaling.git
    cd sample-msk-express-brokers-scaling/scaling/cdk
    python -m venv .venv && source .venv/bin/activate
    pip install -r requirements.txt

  2. Modify the thresholds to match your MSK broker instance size and business requirements by editing src/config/on_demand_scaling_config.json. Refer to the configuration documentation for more details of the configuration options available.
    By default, on_demand_scaling_config.json considers the express.m7g.large broker instance size. Therefore the scale-in/scale-out ingress/egress thresholds are configured at 70% of the recommended sustained throughput for the instance size.
  3. Bootstrap your environment for use with the AWS CDK.
  4. Deploy the on-demand scaling AWS CDK application:
    cdk deploy MSKOnDemandScalingStack \
      --app "python3 msk_on_demand_scaling_stack.py" \
      --context cluster_arn="<< ARN of the MSK Cluster >>" \
      --context monitoring_frequency_minutes=1 \
      --context stack_name="MSKOnDemandScalingStack"

The monitoring_frequency_minutes parameter controls how often the EventBridge scheduler invokes the scaling logic Lambda function to evaluate cluster metrics.

The deployment creates the AWS resources required to run the on-demand scaling solution. The details of the resources created are shown in the output of the command.

Test and monitor the on-demand scaling solution

Configure the bootstrap server for your MSK cluster. You can get the bootstrap server from the AWS Management console or using the AWS CLI.

export BOOTSTRAP=<<BOOTSTRAP_SERVER>>

Create a Kafka topic in the cluster. Update the following command for the specific authentication method in Amazon MSK. Refer to the Amazon MSK Labs workshop for more details.

Topics should have a sufficient number of partitions that can be distributed across a larger set of brokers.

export TOPIC_NAME=<<TOPIC_NAME>>

bin/kafka-topics.sh \
--bootstrap-server=$BOOTSTRAP \
--create \
--replication-factor 3 \
--partitions 96 \
--topic $TOPIC_NAME

Generate load on the MSK cluster to trigger and verify the scaling operations. You can use an existing application that drives load to your cluster. You can also use the kafka-producer-perf-test.sh utility that is bundled as part of the Kafka distribution to generate load:

bin/kafka-producer-perf-test.sh \
  --topic $TOPIC_NAME \
  --num-records 1000000000 \
  --record-size 1024 \
  --throughput -1 \
  --producer-props bootstrap.servers=$BOOTSTRAP

Monitor the scaling operations by tailing the Lambda function logs:

aws logs tail /aws/lambda/MSKOnDemandScalingStack-MSKScalingFunction  \
--follow --format short

In the logs, look for the following messages to identify the exact times when scaling operations occurred. The log statements above these messages show the rationale behind the scaling decision:

[INFO] Calling MSK UpdateBrokerCount API...
 [INFO] Successfully initiated broker count update operation

The solution also creates a CloudWatch dashboard that provides visibility into scaling operations and many other broker metrics. The link to the dashboard is shown in the output of the cdk deploy command.

The following figure shows a cluster that started with three brokers. After the 09:15 mark, it received consistent inbound traffic, which exceeded the thresholds set in the solution. The solution added three more brokers that came into service at around the 09:45 mark. Intelligent rebalancing reassigned some of the partitions to the newly added brokers and the incoming traffic was split across six brokers. The solution continued adding more brokers until the cluster had 12 brokers and the intelligent rebalancing feature continued distributing the partitions across the newly added brokers.
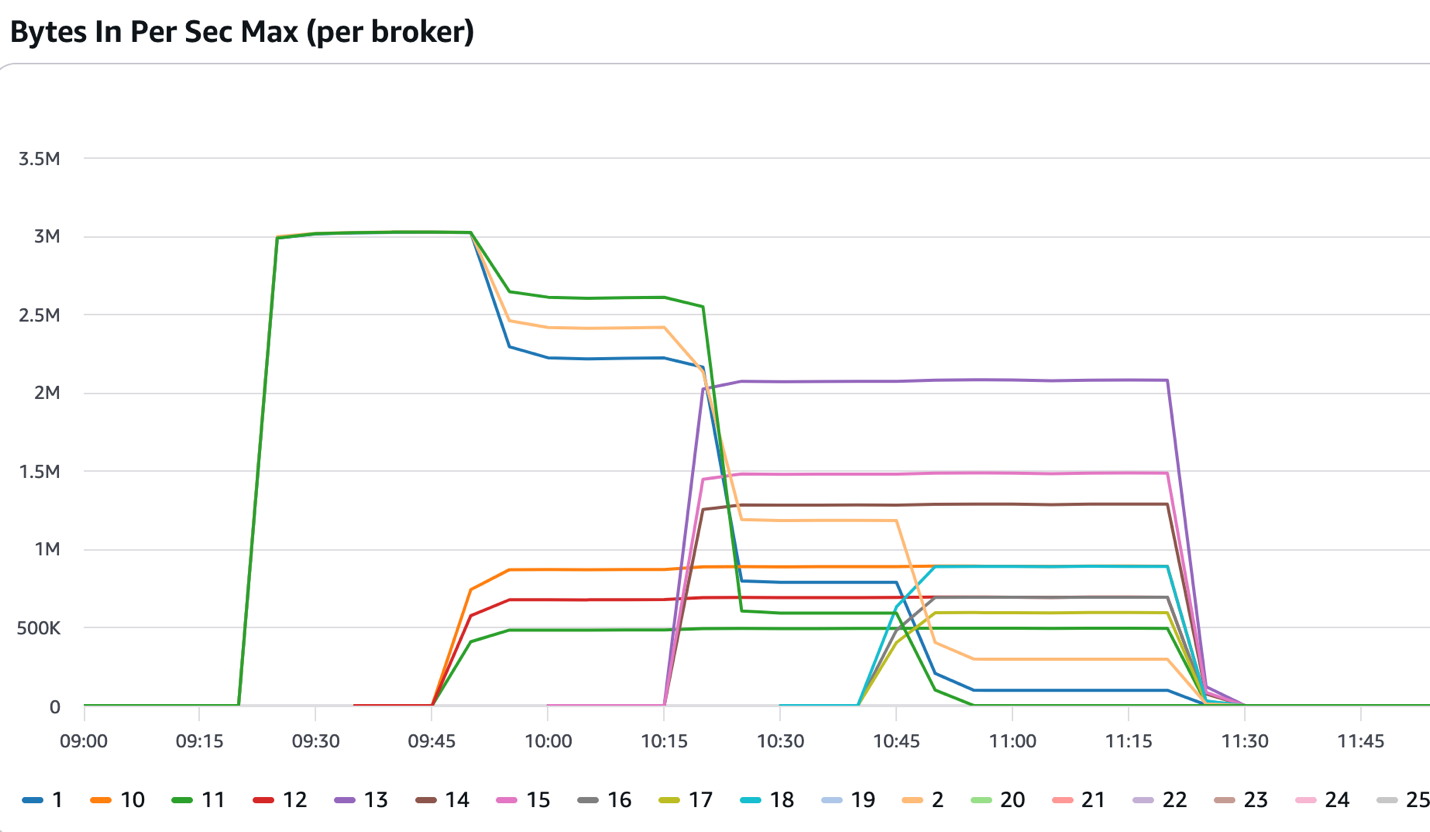
Amazon MSK Broker Network Throughput Performance Chart: Bytes In Per Second Maximum by Broker This time-series line chart visualizes the maximum inbound network throughput performance across 25 individual Apache Kafka brokers in an Amazon Managed Streaming for Apache Kafka (MSK) cluster over a 3-hour time period from 09:00 to 11:45. The chart demonstrates broker-level network ingestion rates, scaling operations, and performance variations during active workload processing.

The following figure shows the times when partition rebalancing was active (value=1). In the context of this solution, that typically occurs after new brokers are added or removed and the scaling operations are complete.
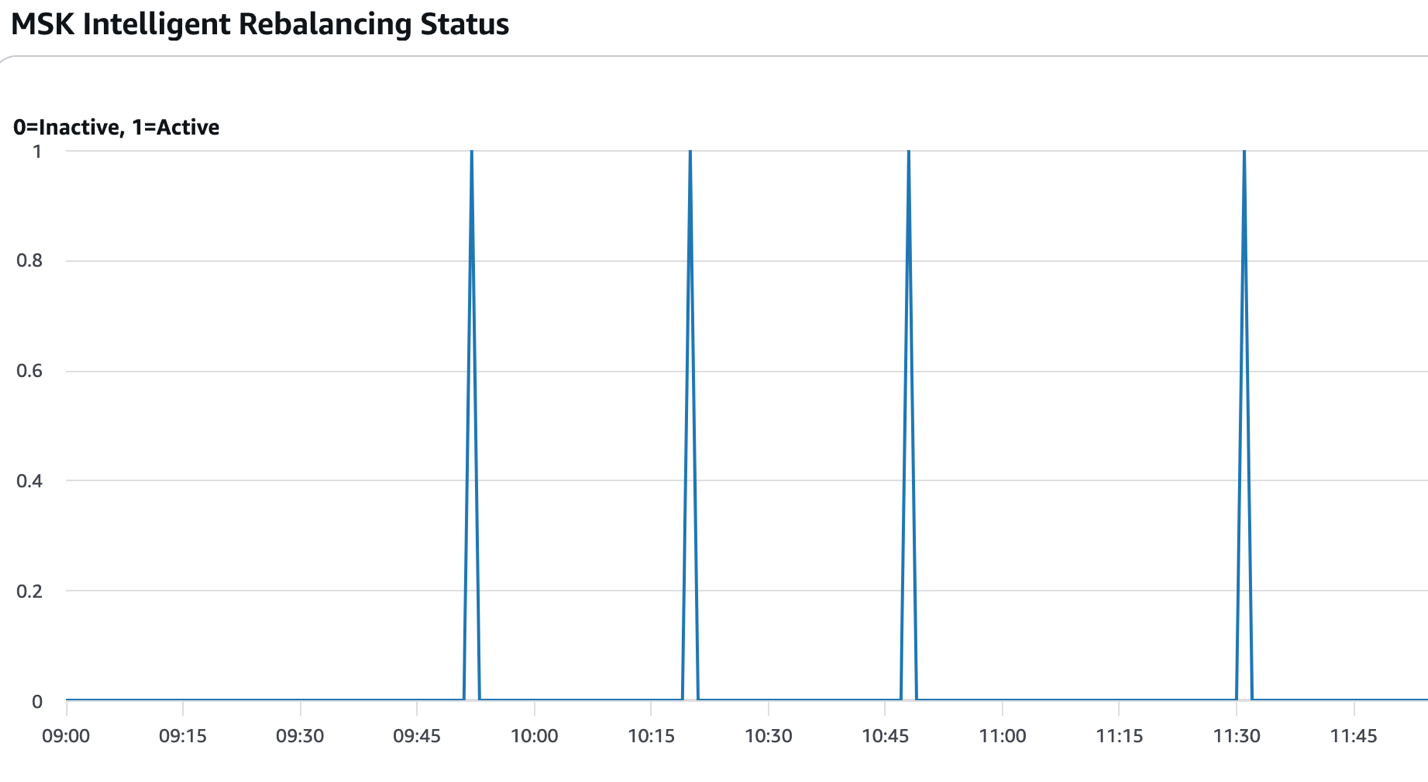
Amazon MSK Intelligent Rebalancing Status Timeline Chart This binary state timeline chart visualizes the activation and deactivation cycles of Amazon Managed Streaming for Apache Kafka (MSK) Intelligent Rebalancing feature over a 2 hour and 45 minute observation period from 09:00 to 11:45. The chart displays discrete on/off status indicators showing when the automated partition rebalancing feature was actively running versus inactive.

The following figure shows the number of brokers added (positive values) or removed (negative values) from the cluster. This helps visualize and track the size of the cluster as it goes through scaling operations.
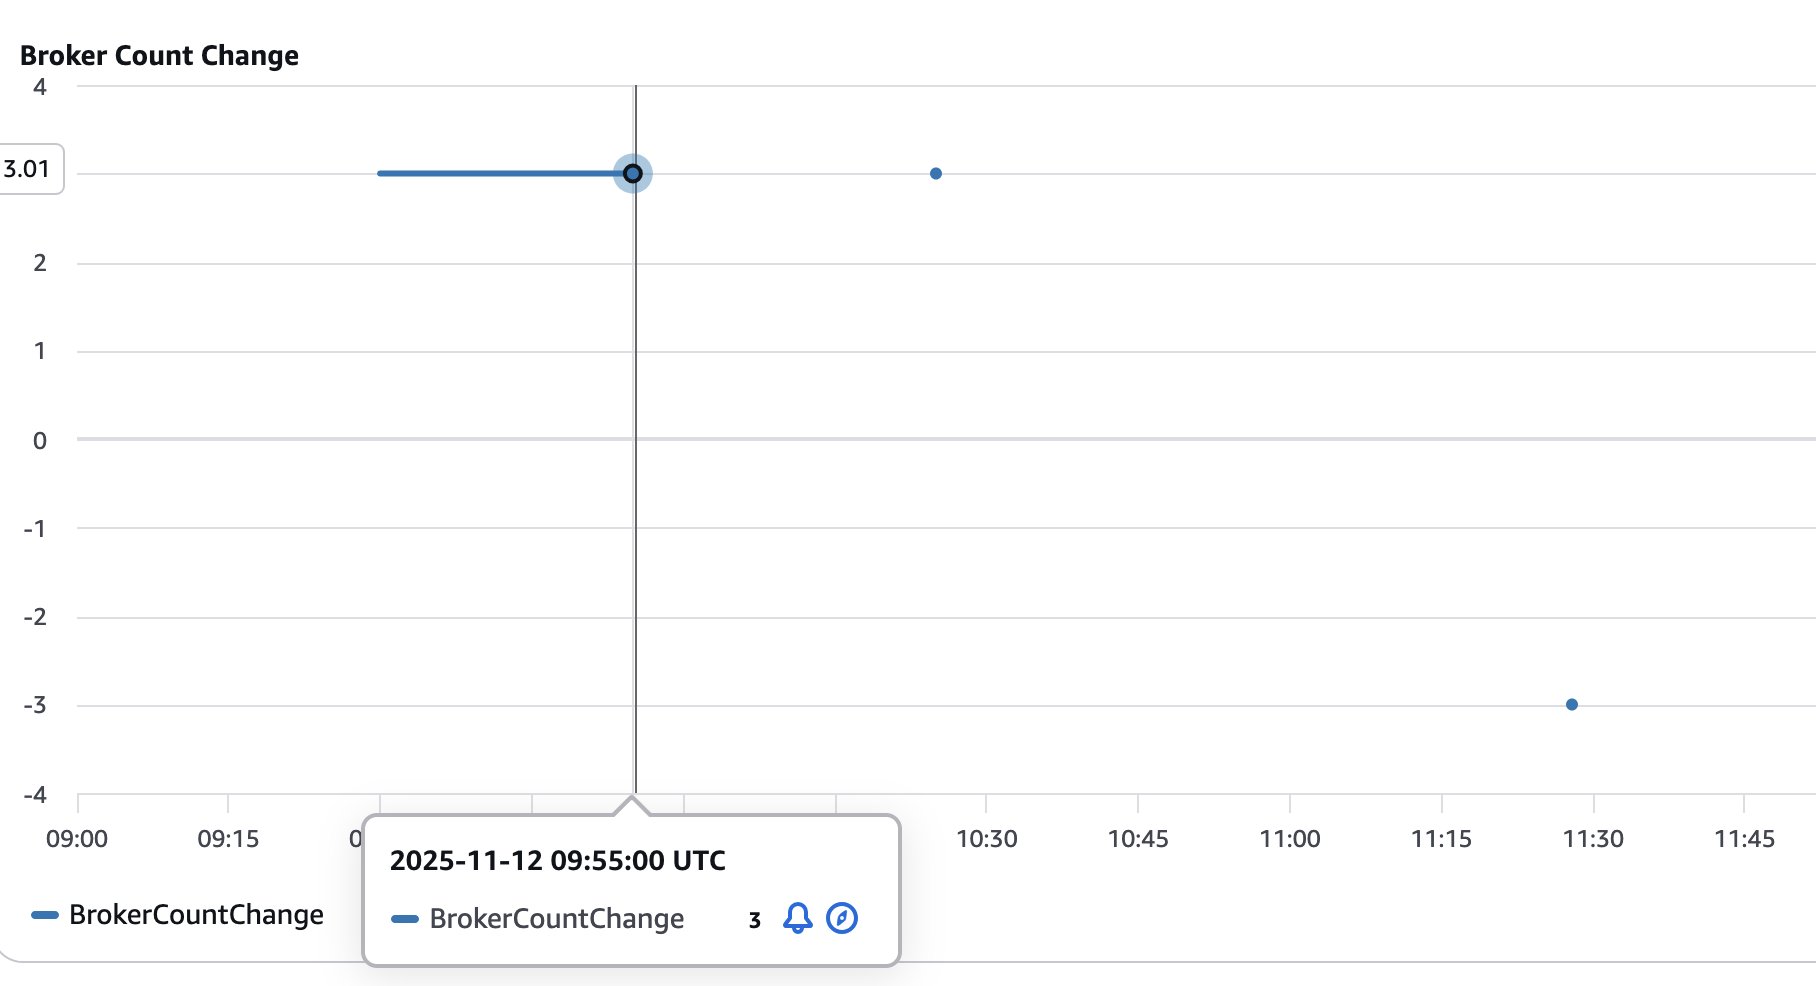
Amazon MSK Broker Count Change Timeline Chart This time-series chart visualizes broker count changes in an Amazon Managed Streaming for Apache Kafka (MSK) cluster over a 2 hour and 45 minute period from 09:00 to 11:45 UTC on November 12, 2025. The chart tracks incremental additions and removals of Kafka brokers, demonstrating MSK's dynamic scaling capabilities in response to workload demands.

Scheduled scaling solution

The scheduled scaling implementation supports timing patterns through an EventBridge schedule. You can configure timing to trigger an action using cron expressions. Based on the cron expression, the EventBridge Scheduler triggers a Lambda function at the specified time to scale out or scale in. The Lambda function performs checks if the cluster is ready for a scaling operation and performs the requested scaling operation by invoking the Amazon MSK control plane API. The service allows removing only three brokers at a time from a cluster. The solution handles this scenario by repeatedly removing the brokers in counts of three until the desired number of brokers are reached.

The following diagram illustrates the architecture of the scheduled scaling solution.
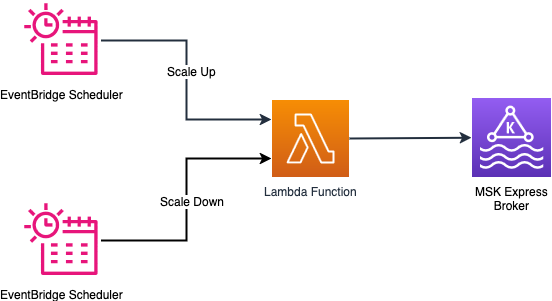
This AWS architecture diagram illustrates an event-driven, time-based auto-scaling workflow where two Amazon EventBridge Scheduler instances trigger an AWS Lambda function to execute scale-up and scale-down operations on an Amazon MSK Express broker. The diagram demonstrates serverless capacity management for Apache Kafka infrastructure using scheduled automation.

Configuration parameters

EventBridge schedules support cron expressions for precise timing control, so you can fine-tune scaling operations for specific times of day and days of the week. For example, you can configure scaling to occur at 8:00 AM on weekdays using the cron expression cron(0 8 ? * MON-FRI *). To scale in at 6:00 PM on the same days, use cron(0 18 ? * MON-FRI *). For more patterns, refer to Setting a schedule pattern for scheduled rules (legacy) in Amazon EventBridge. You can also configure the desired broker count to be reached during scale-out and scale-in operations.

Deploy scheduled scaling solution

Follow these steps to deploy the scheduled scaling solution:

  1. Run the following commands to set the project up:
    cd scaling/cdk
    python3 -m venv .venv && source .venv/bin/activate
    pip install -r requirements.txt

  2. Modify the scaling schedule by editing scaling/cdk/src/config/scheduled_scaling_config.json. Refer to the configuration documentation for more details of the configuration options available.
  3. Deploy the scheduled scaling AWS CDK application:
    cdk deploy MSKScheduledScalingStack \
        --app "python3 msk_scheduled_scaling_stack.py" \
        --context cluster_arn="<< ARN of the MSK Cluster >>" \
        --context stack_name="MSKScheduledScalingStack"

Test and monitor the scheduled scaling solution

The scheduled scaling is triggered as specified in the EventBridge Scheduler cron. However, if you want to test the scale-out operations, run the following command to manually invoke the Lambda function:

aws lambda invoke \
  --function-name MSKScheduledScalingStack-MSKScheduledScalingFunction \
  --payload '{"source":"aws.scheduler.scale-out","detail":{"action":"scale_out","schedule_name":"MSKScheduledScaleOut"}}' \
  --cli-binary-format raw-in-base64-out \
  response.json

Similarly, you can manually start a scale-in operation by running the following command:

aws lambda invoke \
  --function-name MSKScheduledScalingStack-MSKScheduledScalingFunction \
  --payload '{"source":"aws.scheduler.scale-in","detail":{"action":"scale_in","schedule_name":"MSKScheduledScaleIn"}}' \
  --cli-binary-format raw-in-base64-out \
  response.json

Monitor the scaling operations by tailing the Lambda function logs:

aws logs tail /aws/lambda/MSKScheduledScalingStack-MSKScheduledScalingFunction  \
--follow --format short

You can monitor scheduled scaling using the CloudWatch dashboard as described in the on-demand scaling section.

Review scaling configuration parameters

The configuration parameters for both on-demand and scheduled scaling are documented in Configuration Options. These configurations give you flexibility to change how and when the scaling happens. It is important to go through the configuration parameters and make sure they meet your business requirement. For on-demand scaling, you can scale the cluster based on built-in performance metrics or custom metrics (for example MessagesInPerSec).

Considerations

Keep in mind the following considerations when deploying either solution:

  • EventBridge notifications for scaling failures – Both on-demand and scheduled scaling solutions publish EventBridge notifications when scaling operations fail. Create EventBridge rules to route these failure events to your monitoring and alerting system to detect failures in scaling and respond to them. For details on event sources, types, and payloads, refer to the EventBridge notifications section in the GitHub repo.
  • Cool-down period management – Properly configure cool-down periods to prevent scaling oscillations where the cluster repeatedly scales out and scales in rapidly. Oscillations typically occur when traffic patterns have short-term spikes that don’t represent sustained demand. Oscillations can also happen when thresholds are set too close to normal operating levels. Set cool-down periods based on your workload characteristics and the scaling completion times. Also consider different cool-down periods for scale-out vs. scale-in operations by setting longer cool-down periods for scale-in operations (scale_in_cooldown_minutes) compared to scaling out (scale_out_cooldown_minutes). Test cool-down settings under realistic load patterns before production deployment to achieve optimal performance.
  • Cost control through monitoring frequency – The solution incurs costs for services like Lambda functions, EventBridge schedules, CloudWatch metrics, and logs that are used in the solution. Both on-demand and scheduled scaling solutions work by running periodically to check the cluster health status and if a scaling operation needs to be performed. The default 1-minute monitoring frequency provides responsive scaling but increases other costs associated with the solution. Consider increasing the monitoring interval based on your workload characteristics to balance scaling responsiveness and the cost incurred by the solution. You can change the monitoring frequency by changing the monitoring_frequency_minutes when you deploy the solution.
  • Solution isolation – The on-demand and scheduled scaling solutions were designed and tested in isolation to support predictable behavior and optimal performance. You can deploy either solution, but avoid running both solutions simultaneously on the same cluster. Using both approaches together can cause unpredictable scaling behavior where the solutions might conflict with each other’s scaling decisions, leading to resource contention and potential scaling oscillations. Choose the approach that best matches your workload patterns and deploy only one scaling solution per cluster.

Clean up

Follow these steps to delete the resources created by the solution. Make sure all the scaling operations that are in flight are completed before you run the cleanup.Delete the on-demand scaling solution with the following code:

cdk destroy MSKOnDemandScalingStack --app "python3 msk_on_demand_scaling_stack.py" --context cluster_arn="<MSK_CLUSTER_ARN>"

Delete the scheduled scaling solution with the following code:

cdk destroy MSKScheduledScalingStack --app "python3 msk_scheduled_scaling_stack.py" --context cluster_arn="<MSK_CLUSTER_ARN>"

Summary

In this post, we showed how to use intelligent rebalancing to scale your Express based cluster based on your business requirements without requiring manual partition rebalancing. You can extend the solution to use the specific CloudWatch metrics that your business depends on to dynamically scale your Kafka cluster. Similarly, you can adjust the scheduled scaling solution to scale out and scale in your cluster when you anticipate significant change in traffic to your cluster at specific times.To learn more about the services used in this solution, refer to the following resources:
About the authors

Subham Rakshit

Subham Rakshit

Subham is a Senior Streaming Solutions Architect for Analytics at AWS based in the UK. He works with customers to design and build streaming architectures so they can get value from analysing their streaming data. His two little daughters keep him occupied most of the time outside work, and he loves solving jigsaw puzzles with them.

Rakshith Rao

Rakshith Rao

Rakshith is a Senior Solutions Architect at AWS. He works with AWS’s strategic customers to build and operate their key workloads on AWS.

Power up your analytics with Amazon SageMaker Unified Studio integration with Tableau, Power BI, and more

Post Syndicated from Narendra Gupta original https://aws.amazon.com/blogs/big-data/power-up-your-analytics-with-amazon-sagemaker-unified-studio-integration-with-tableau-power-bi-and-more/

Organizations face challenges in accessing and analyzing governed data across multiple sources through their preferred business intelligence (BI) and analytics tools while maintaining security and governance. They need a seamless way to connect their familiar tools (like Tableau, Power BI, Excel) to Amazon SageMaker‘s data assets without compromising data governance and security protocols.

Amazon SageMaker supports authentication through the Amazon Athena JDBC driver, allowing data users to query their subscribed data lake assets via popular BI and analytics tools like Tableau, Power BI, Excel, SQL Workbench, DBeaver, and more. This integration empowers data users to access and analyze governed data within Amazon SageMaker using familiar tools, boosting both productivity and flexibility.

Customers use Amazon SageMaker Unified Studio to streamline data access and governance by enabling data users to locate and subscribe to data from multiple sources within a single project. Amazon SageMaker Unified Studio natively integrates with Amazon-specific options like Amazon Athena, Amazon Redshift, and Amazon SageMaker AI, allowing users to analyze their project governed data. With this launch of JDBC connectivity, Amazon SageMaker Unified Studio expands its support for data users, including analysts and scientists, allowing them to work in their preferred tools, whether it’s SQL Workbench, Domino, or Amazon-native solutions like Amazon Athena, while ensuring secure, governed access within Amazon SageMaker Unified Studio.

Getting Started

To get started, download and install the latest Athena JDBC driver for your tool of choice. After installation, copy the JDBC connection string from the Amazon SageMaker Unified Studio portal into the JDBC connection configuration to establish a connection from your tool. This directs you to authenticate using single sign-on (SSO) with your corporate credentials. After connecting, you can query, visualize, and share data—governed by Amazon SageMaker Unified Studio–within the tools you already know and trust.

In this post, we guide you through connecting various analytics tools to Amazon SageMaker Unified Studio using the Athena JDBC driver, enabling seamless access to your subscribed data within your Amazon SageMaker Unified Studio projects.

Solution overview

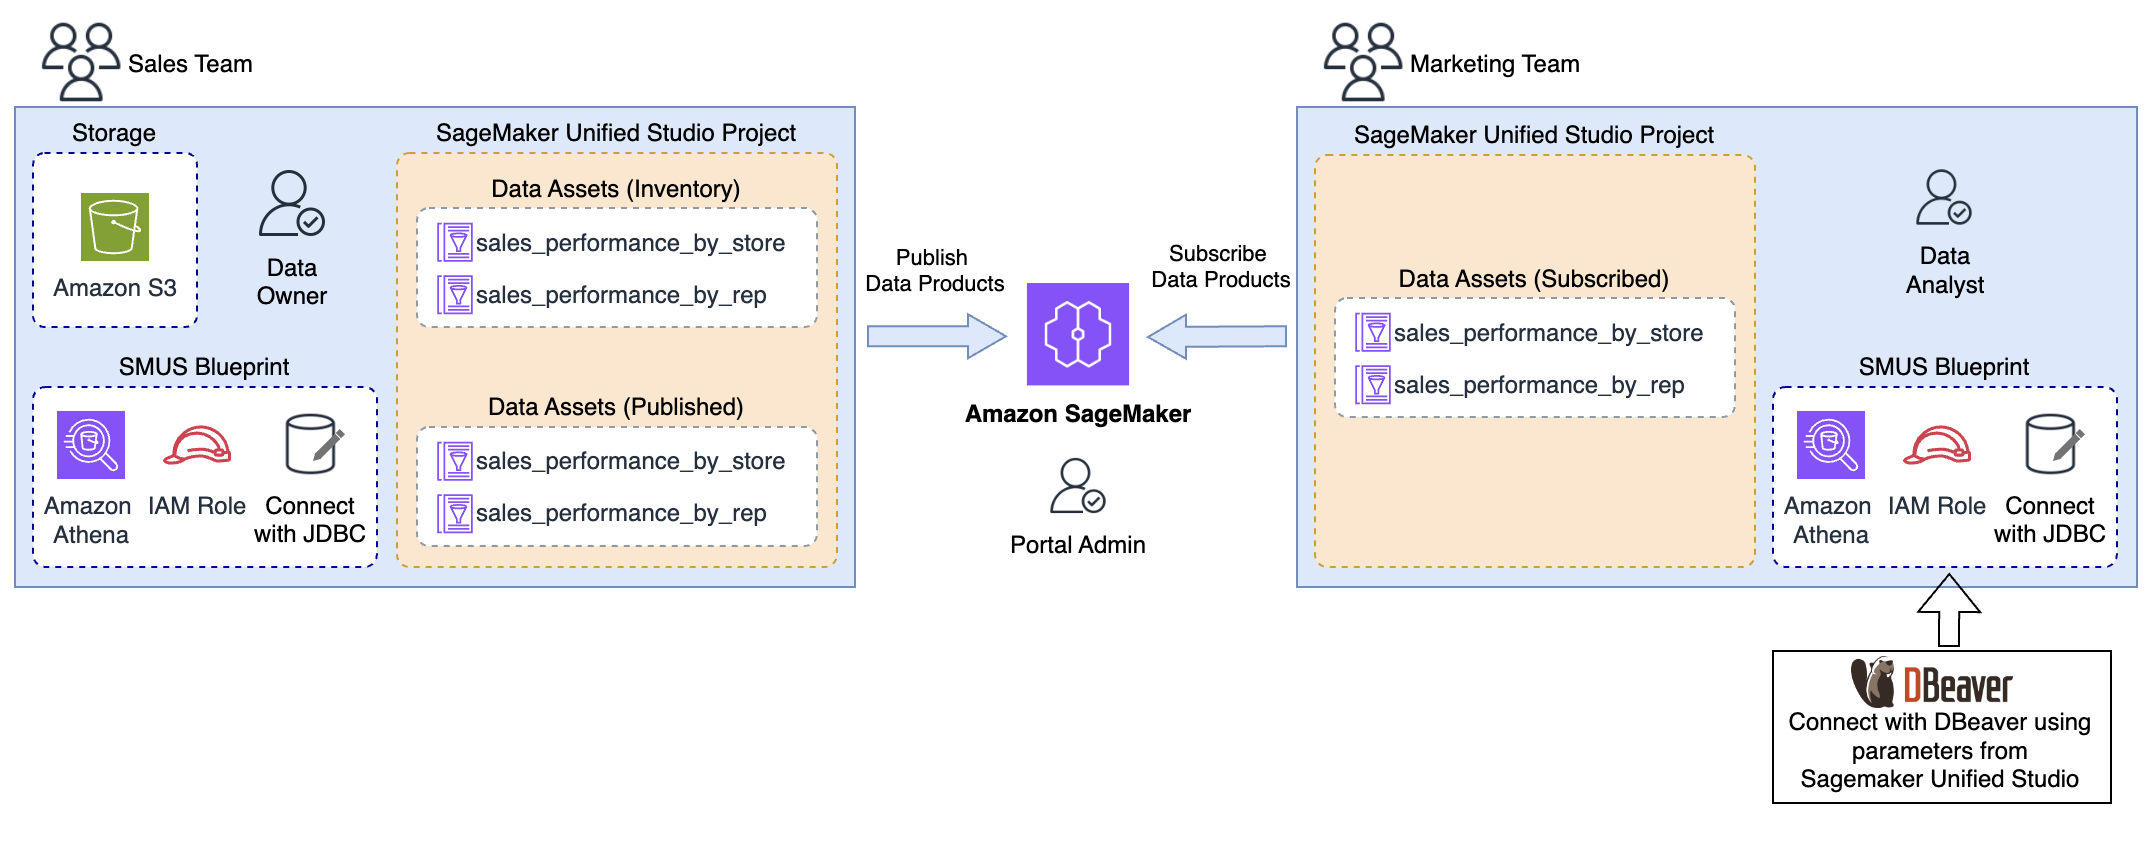
To demonstrate these capabilities, consider a use case where your marketing team wants to analyze sales data to understand patterns in sales by stores and sales representatives. To achieve this, your marketing team needs access to sales_performance_by_store, and sales_performance_by_rep data owned by the sales team. The sales team, acting as the data producer, publishes the necessary data assets to Amazon SageMaker Unified Studio, allowing the marketing team, as a consumer, to discover and subscribe to these assets.

After the subscription is approved, the data assets become available within the marketing team’s project environment in Amazon SageMaker Unified Studio. The marketing team can then use their preferred tool to perform data exploration. An example architecture of how this is done using DBeaver is shown in the following image:

SageMaker Unified Studio project architecture diagram showing data collaboration between Sales and Marketing teams with Amazon S3 storage and Athena integration

Prerequisites

To follow along with this post, you need the following prerequisites in place:

  1. AWS account – If you don’t have an active AWS account, see How do I create and activate a new AWS account?.
  2. Amazon SageMaker resources – You need a domain for Amazon SageMaker, and two Amazon SageMaker project.
  3. Publish data assets – As the data producer from the sales team, you can now ingest individual data assets into Amazon SageMaker Unified Studio. For this use case, create a data source and import the technical metadata of two data assets – sales_performance_by_store, and sales_performance_by_rep – from AWS Glue Data Catalog. Ensure the data assets are enriched with business descriptions and published to the catalog.
    Note: Here we are using tables which are in the Glue catalog but with Sagemaker Lakehouse you have the option to bring assets from other sources.
  4. Subscribe data assets – As a data analyst from the marketing team, you can now discover and subscribe to the data assets. The data producer from the retail team reviews and approves your subscription. Upon successful fulfillment, the data assets are added to your SageMaker Unified project.

For detailed instructions for publishing and subscribing, see the Amazon SageMaker Unified Studio User Guide.

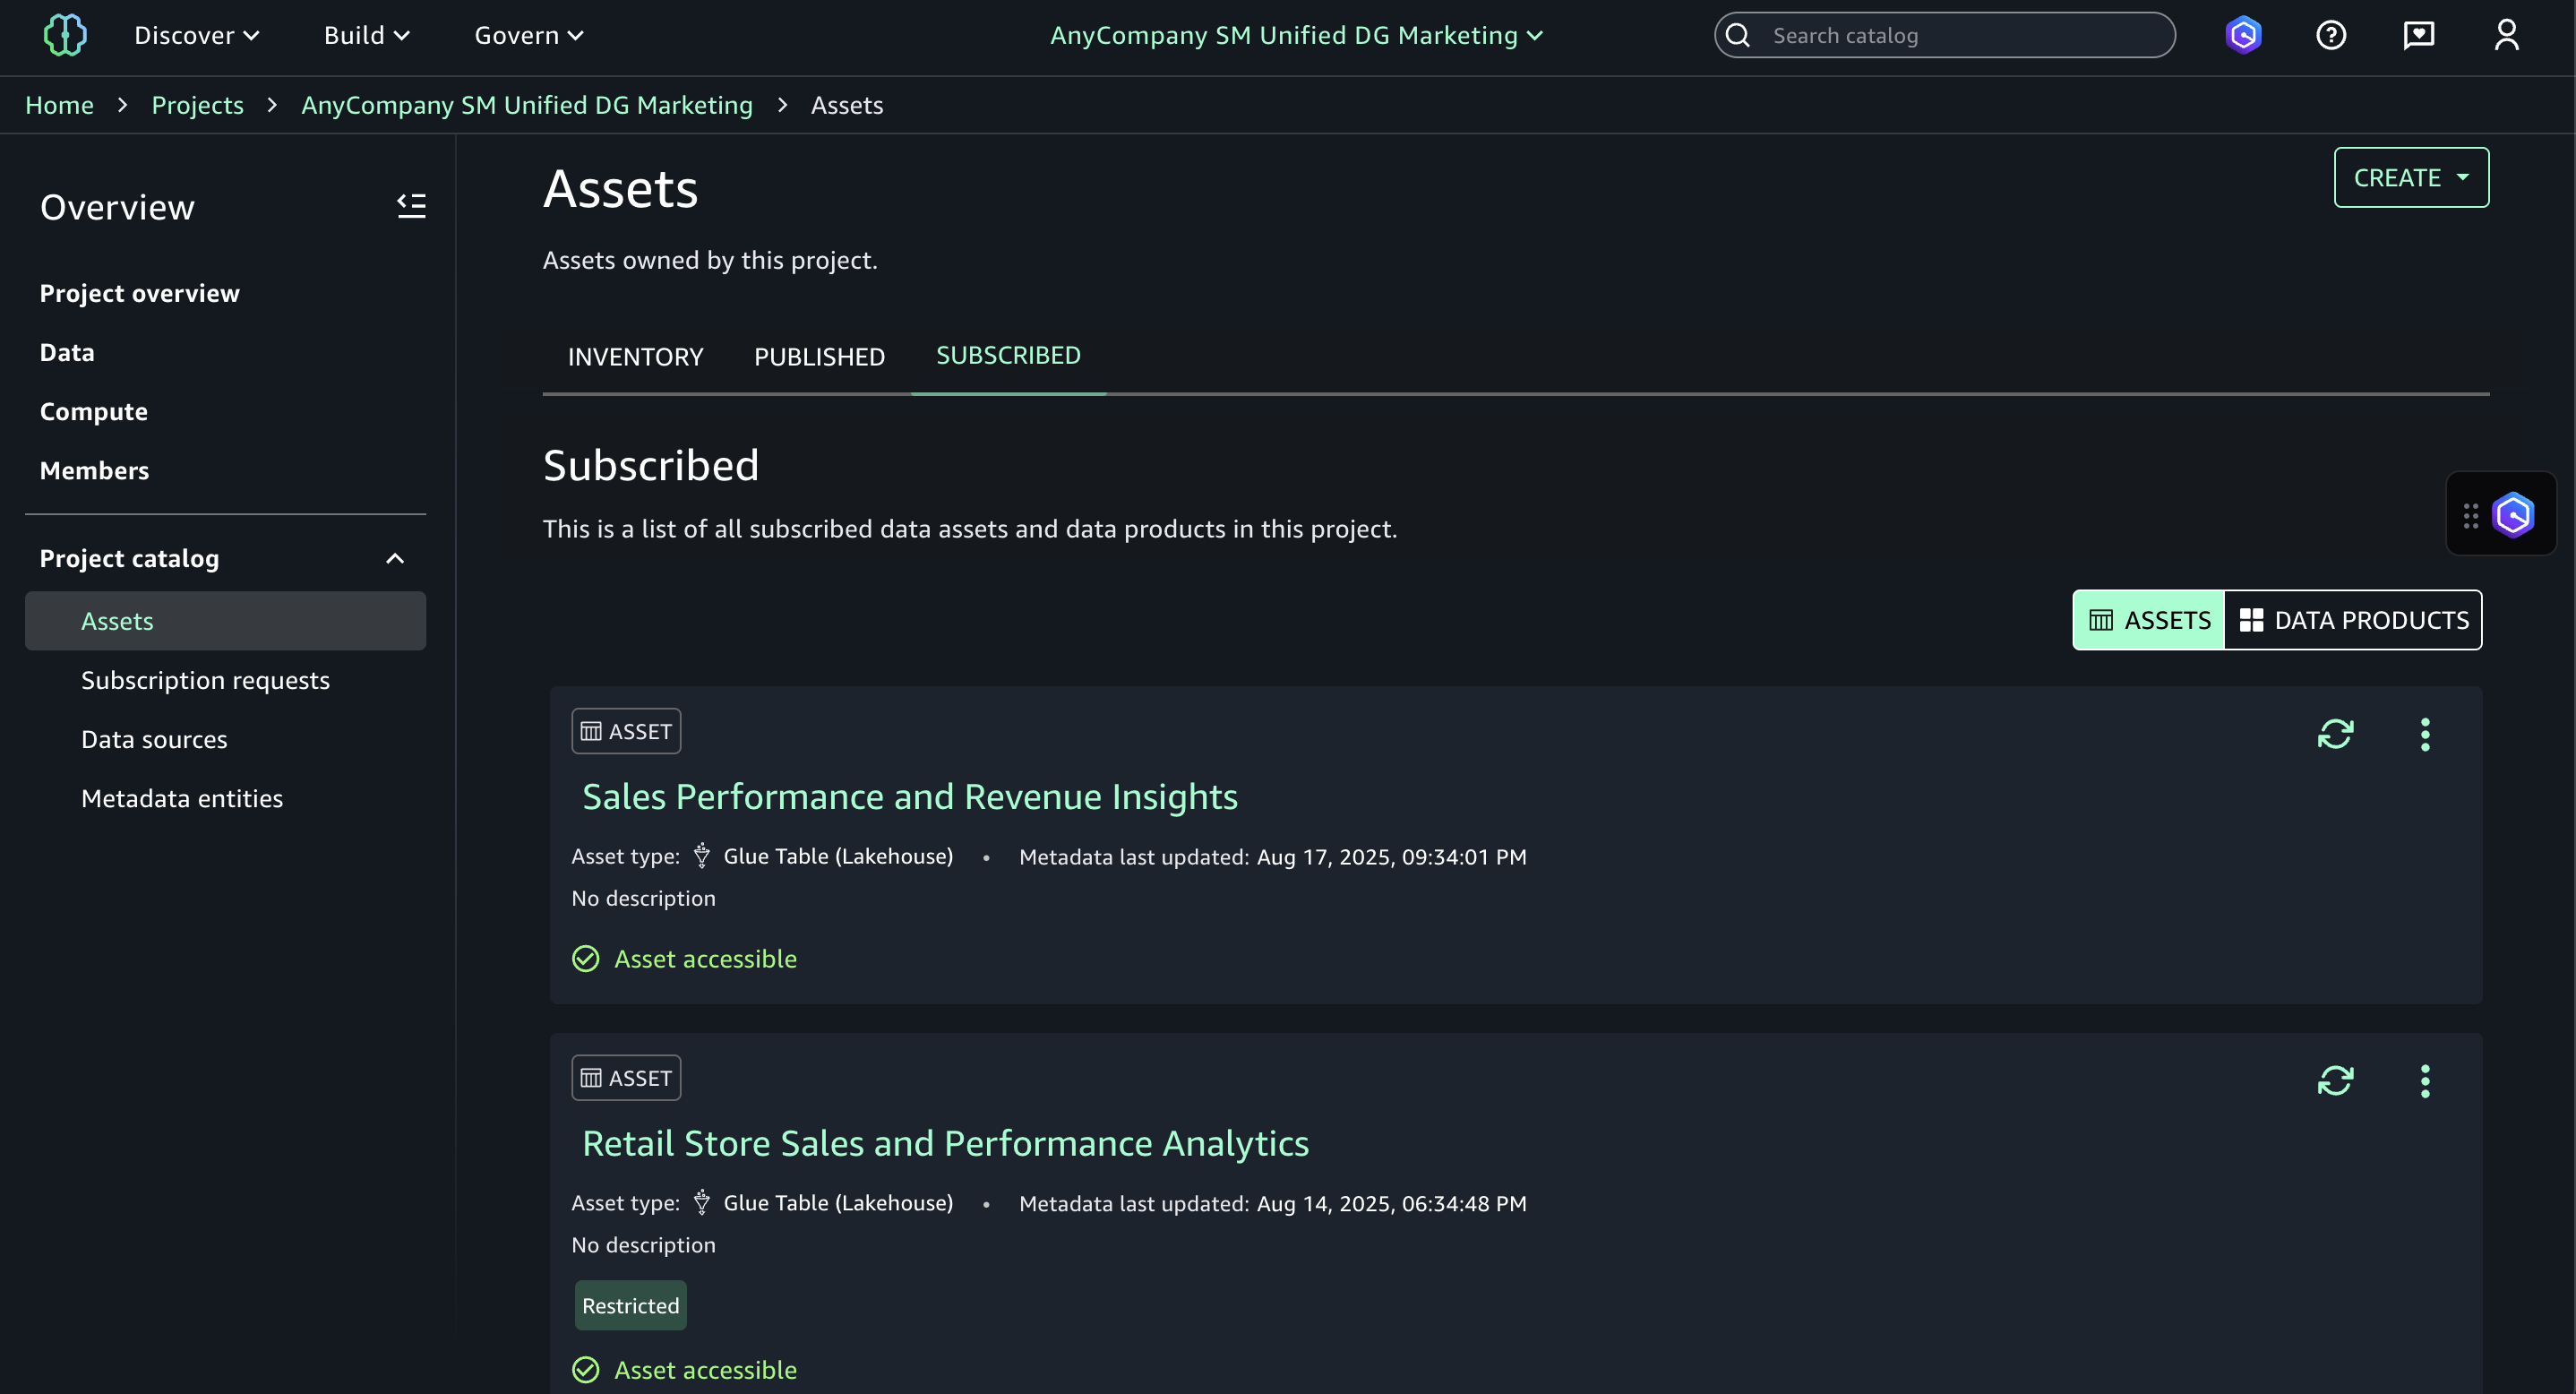
The following figure shows the subscribed assets added to the subscribed assets section in your marketing project catalog.

SageMaker Unified Studio Assets page displaying subscribed data assets with accessibility status indicators

In the following sections, we walk you through the steps to configure DBeaver to consume the subscribed assets from Amazon SageMaker Unified Studio.

Configuring DBeaver to access subscribed data assets

In this section, you configure DBeaver to access the subscribed assets from the Marketing project

To configure DBeaver:

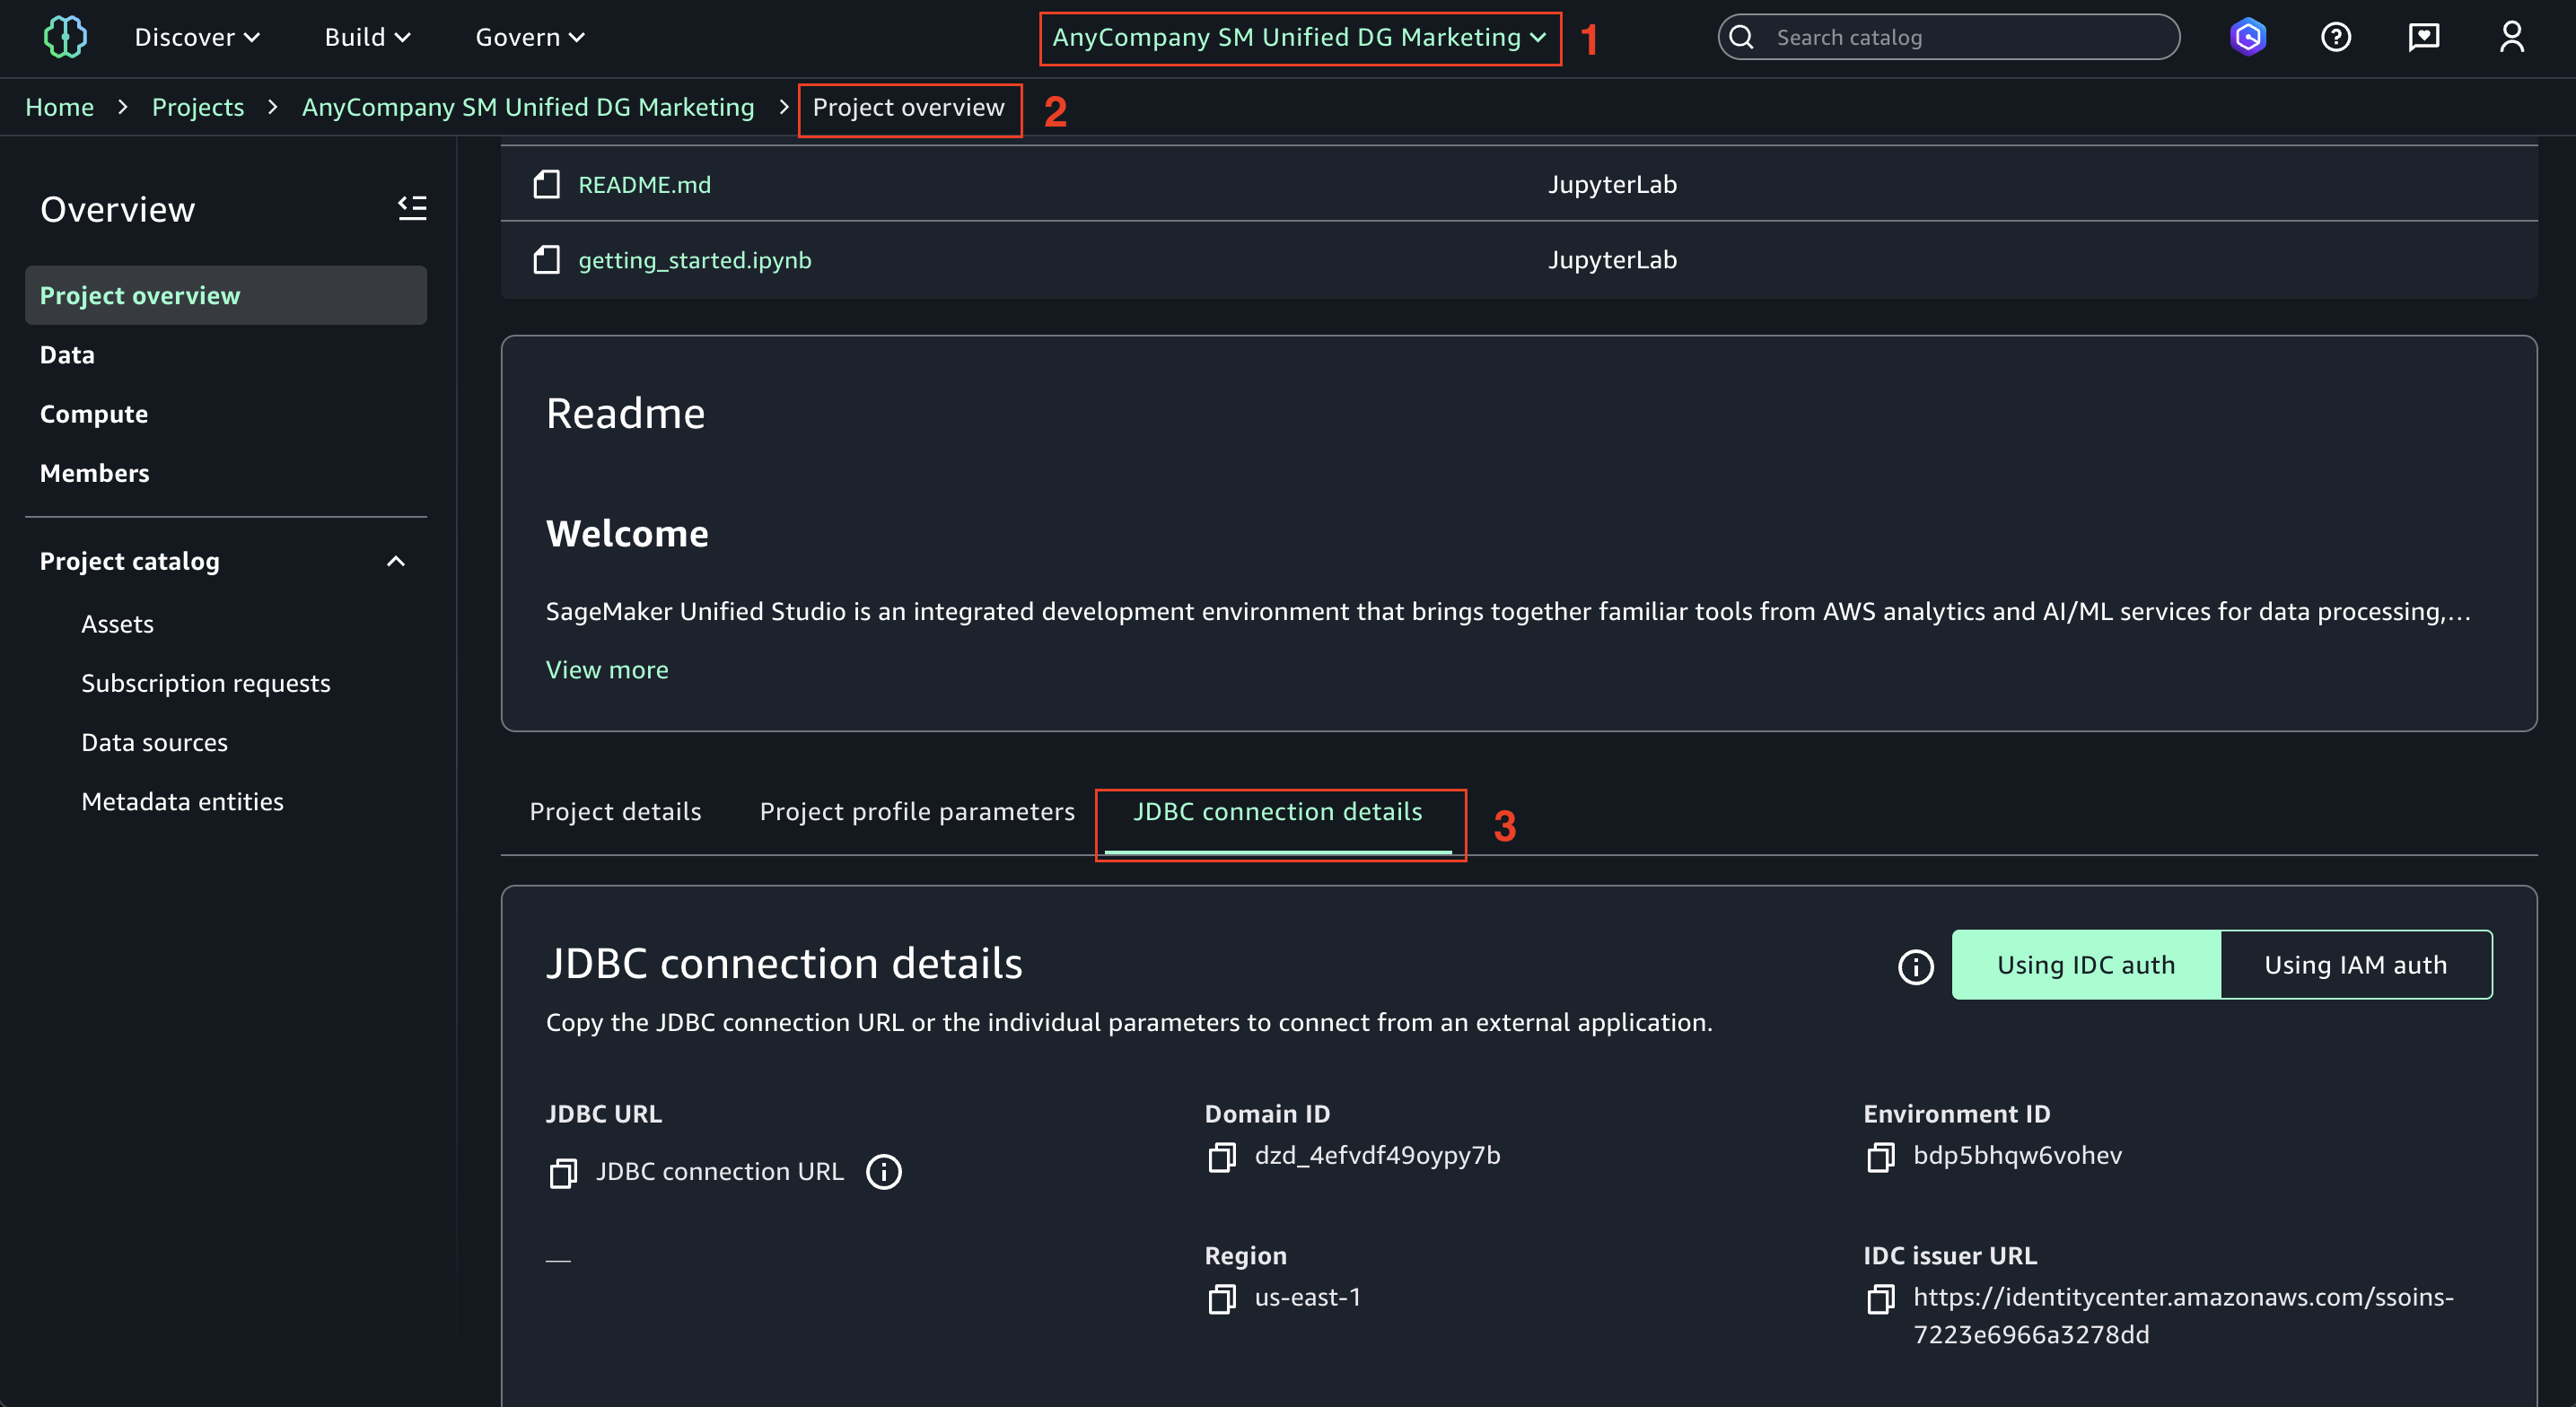
  1. Connect with JDBC: In the Amazon SageMaker Unified Studio, (1) open the Marketing project, (2) on the Project overview screen, (3) choose JDBC connection details tab.
    SageMaker Unified Studio Project overview page showing JDBC connection parameters for external application integration
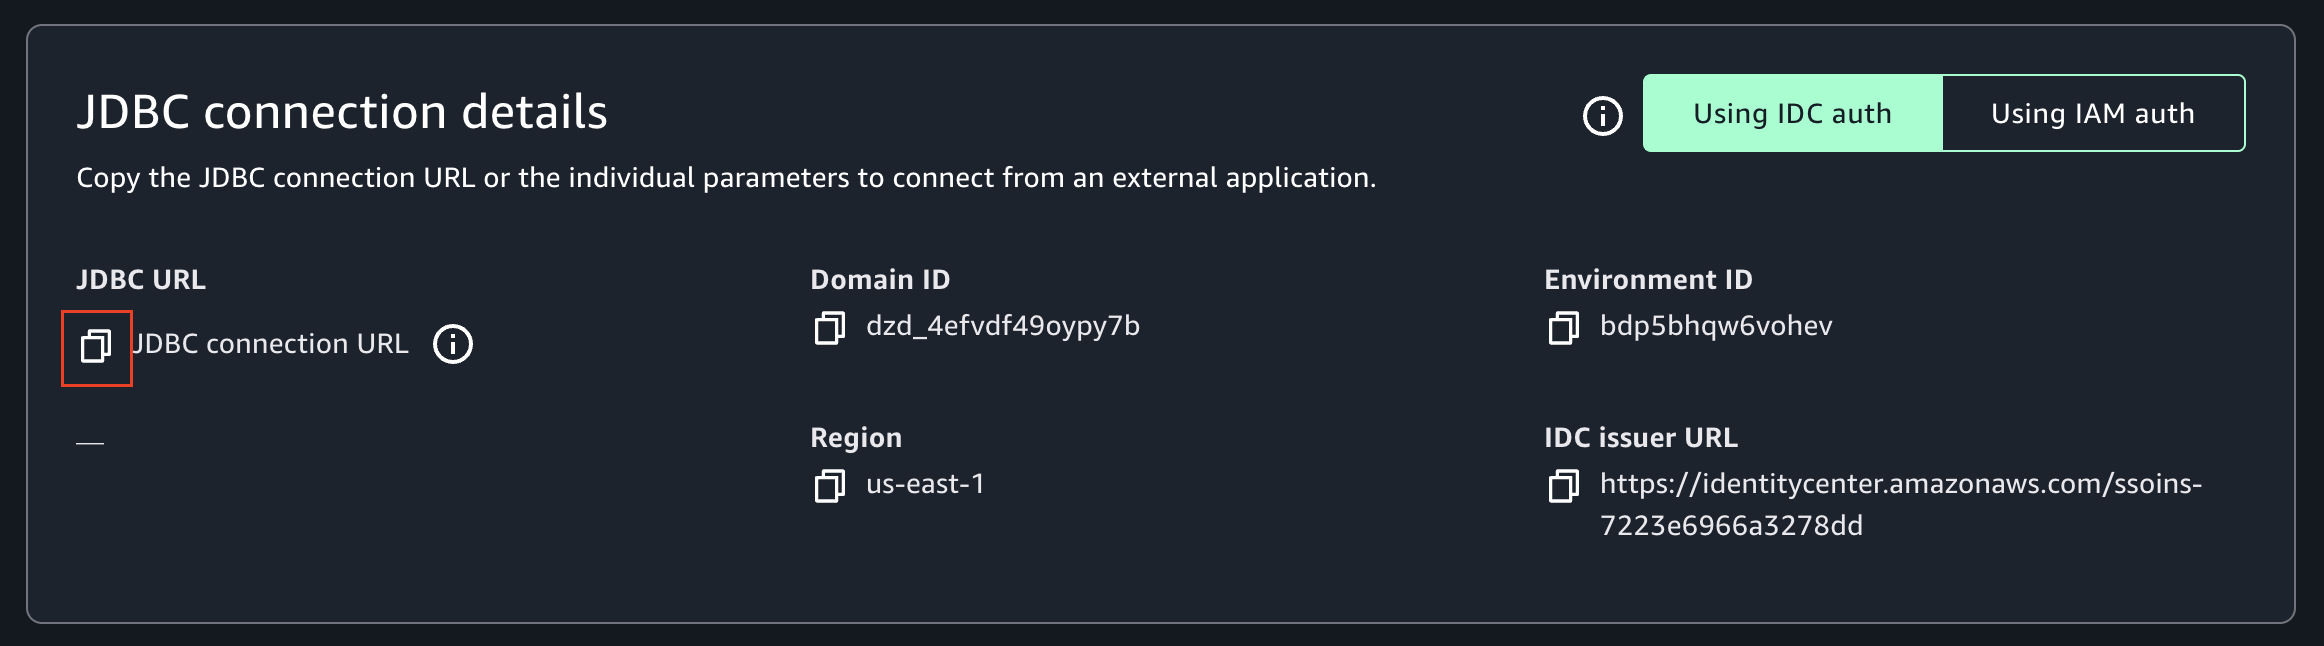
  2. Copy the JDBC connection URL into a text editor. The URL should have the following parameters needed for configuring the database connection in DBeaver – Domain ID, Environment ID, Region, and IDC Issuer URL.
    JDBC connection details configuration panel with IDC authentication parameters and copy functionality
  3. Download and install the latest Athena driver:
    • If DBeaver has the Athena driver pre-installed, it might be the older (v2) version. To ensure compatibility with Amazon SageMaker Unified Studio, you need the latest driver (v3), which includes the necessary authentication features.
    • Download the latest JDBC driver—version 3.x.
    • To install the latest driver:
      • Go to Database and then to Driver Manager in DBeaver.
      • Select the Athena driver and choose Edit.
      • Visit the Libraries tab.
      • Choose Download/Update to fetch the latest driver version.
      • If prompted, select the appropriate version and confirm the download.
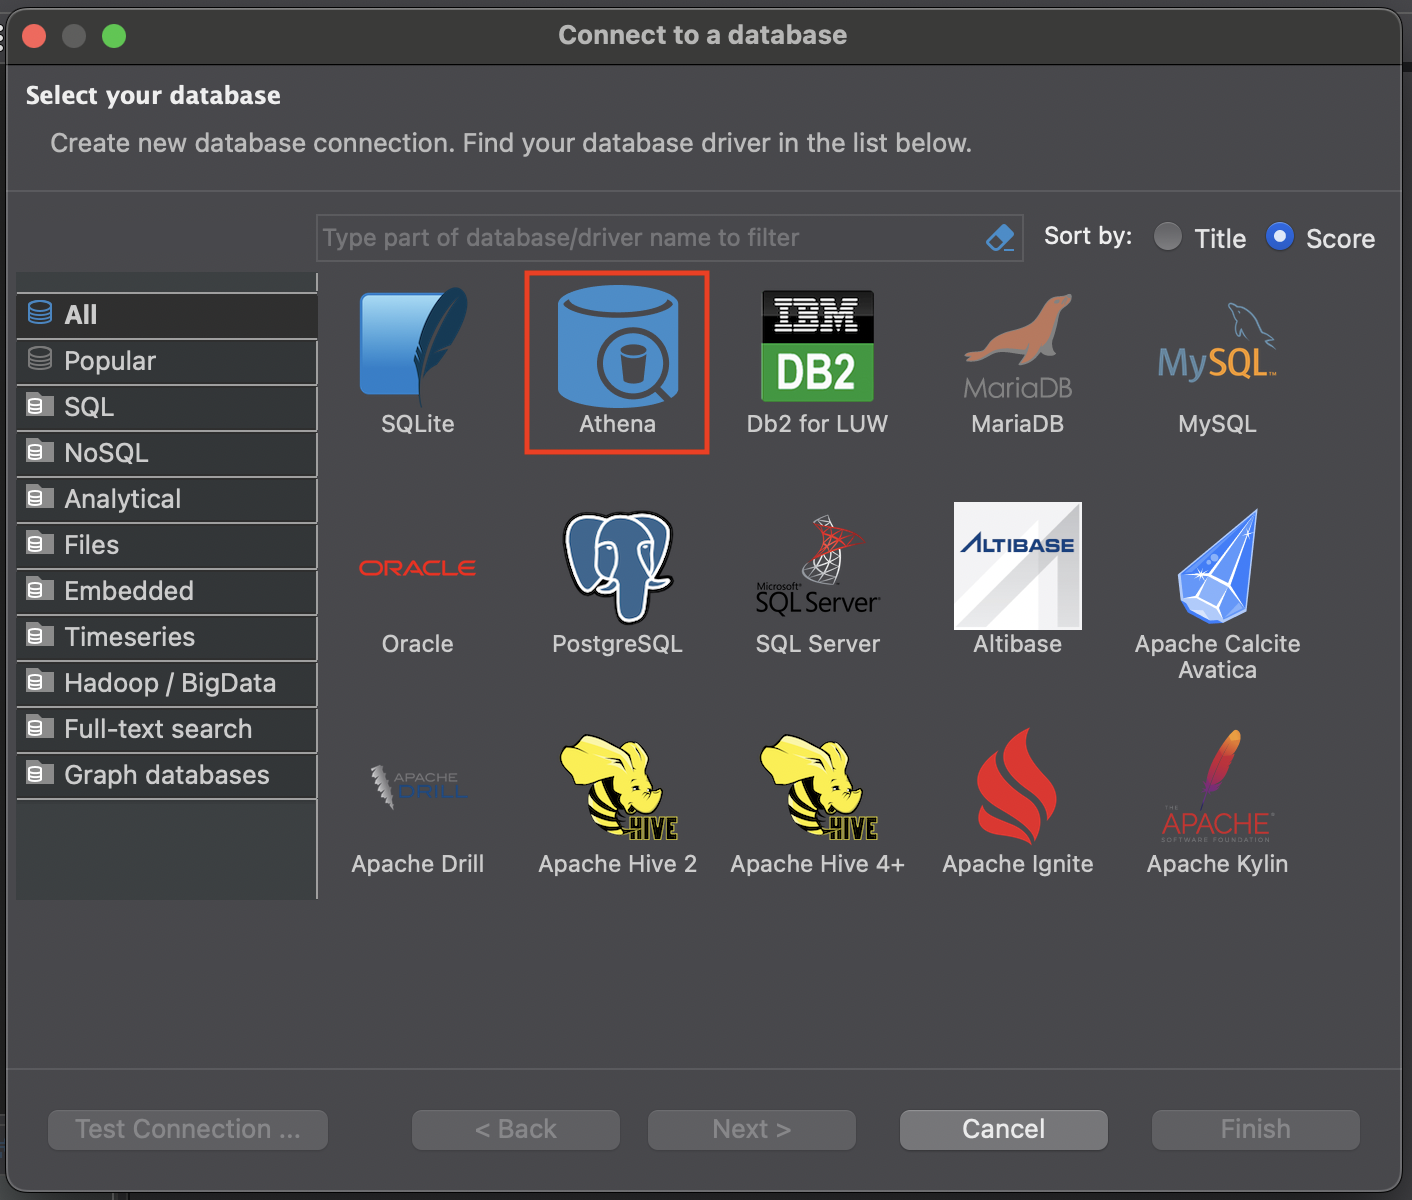
  4. In the DBeaver SQL client, create a new database connection and select the Athena driver.
    DBeaver database connection dialog showing Amazon Athena driver selection among available database options
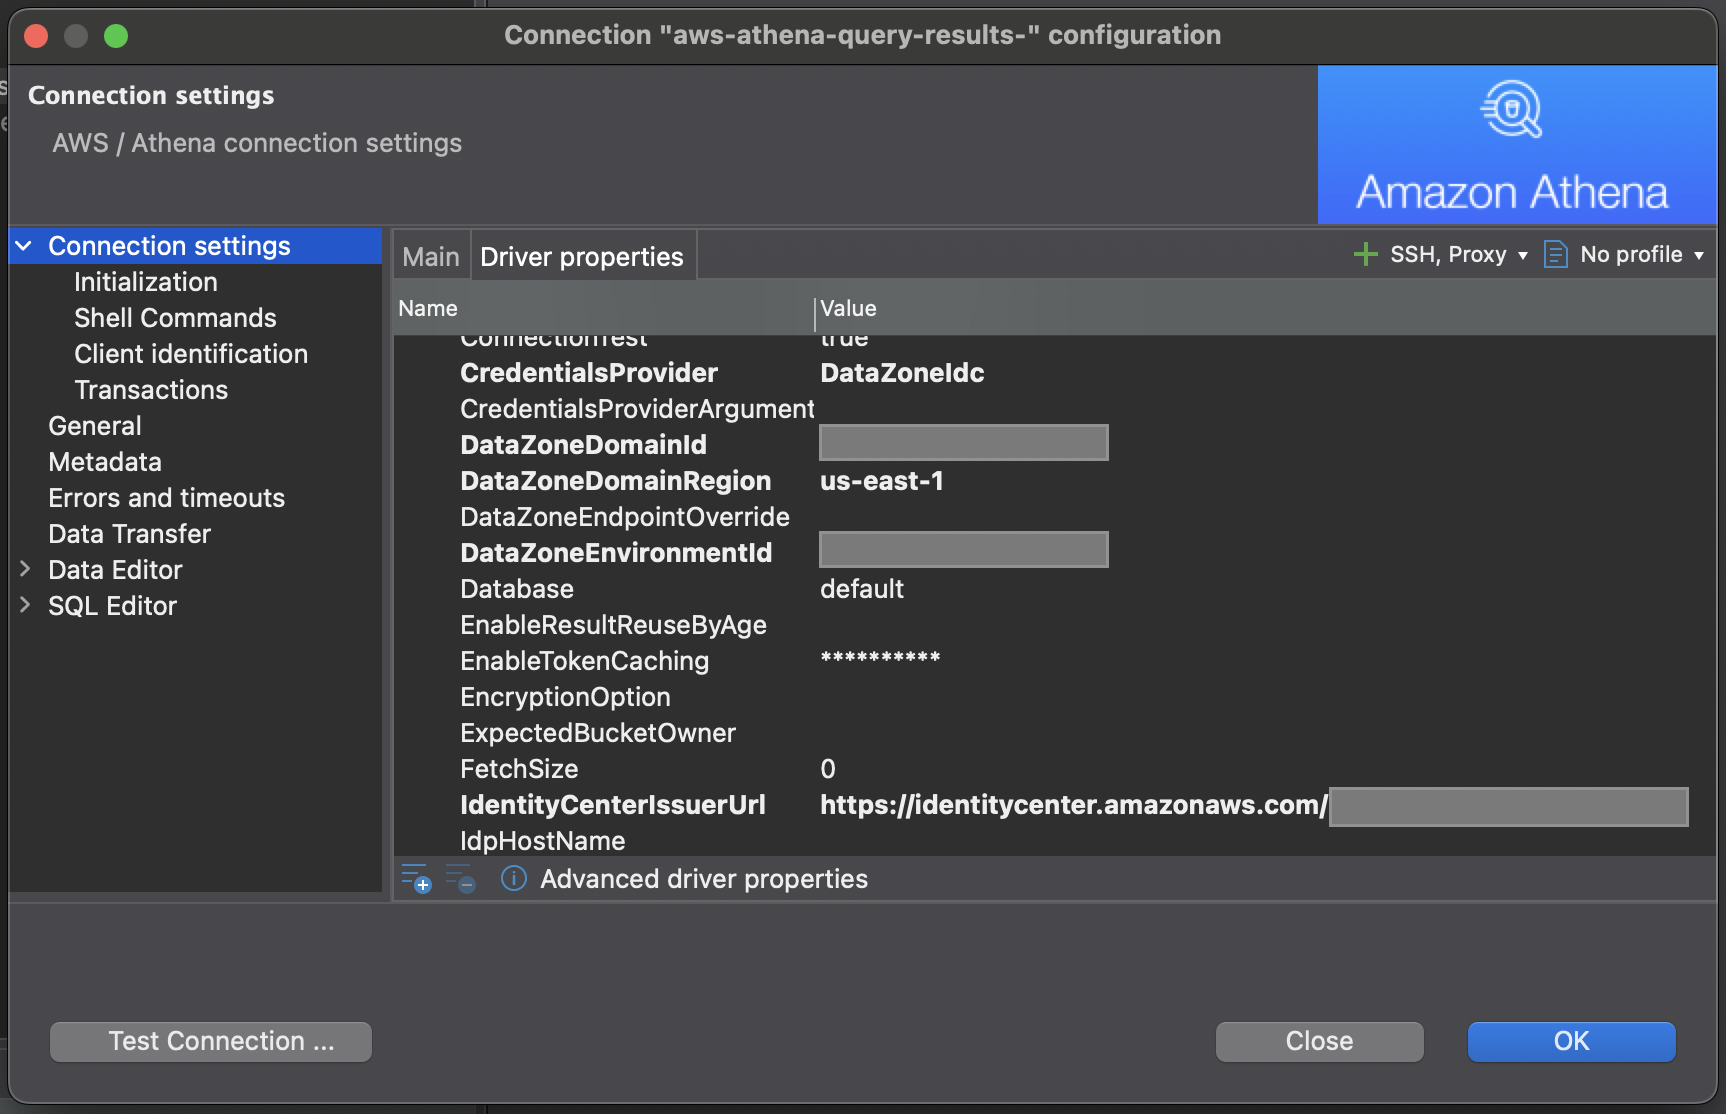
  5. Switch to the Driver Properties tab, enter the values of the following properties that are available in the JDBC connection URL you copied from Amazon SageMaker Unified Studio. If any of these properties are not already available, you can add them and provide their respective values.
    • CredentialsProvider: The credentials provider to authenticate requests to AWS
    • DataZoneDomainId: The ID of your Amazon DataZone domain
    • DataZoneDomainRegion: The AWS Region where your domain is hosted
    • DataZoneEnvironmentId: The ID of your DefaultDataLake environment
    • IdentityCenterIssuerUrl: The issuer URL used by AWS Identity and Access Management (IAM) Identity Center for token issuance
    • OutputLocation: Amazon S3 path for storing query results
    • Region: The Region where the environment is created
    • Workgroup: Amazon Athena workgroup of the environment
    • ListenPort: Pick any four digits port number. This is the port number that listens for the IAM Identity Center response

    DBeaver connection configuration dialog for Amazon Athena with driver properties and authentication settings

  6. Choose Test Connection….
  7. You are redirected to the IAM Identity Center sign-in portal. Sign in with Marketing user credentials. If you’re already signed in through single sign-on (SSO), this step can be skipped.
    AWS authentication sign-in page with username input field
  8. After you sign in, if you are prompted to authorize the DataZoneAuthPlugin. Choose Allow access to authorize access to Amazon DataZone from DBeaver.
    AWS DataZone authorization dialog requesting user permission for application access
  9. After sign in completes, you see the following message. You can close the window and go to the DBeaver.
    Amazon DataZone session completion confirmation message
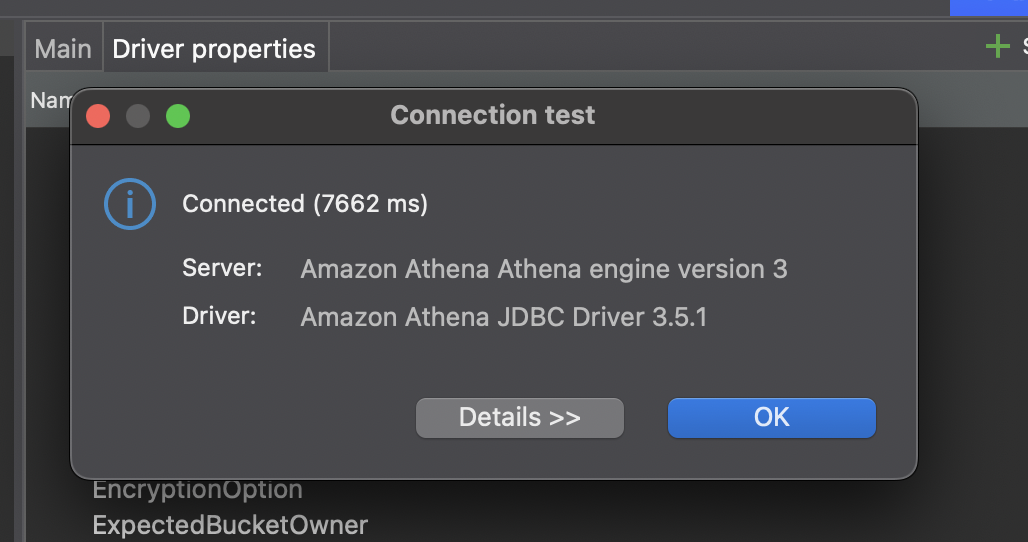
  10. After the connection is established, the following success message appears.
    DBeaver connection test dialog showing successful Amazon Athena connection with performance metrics
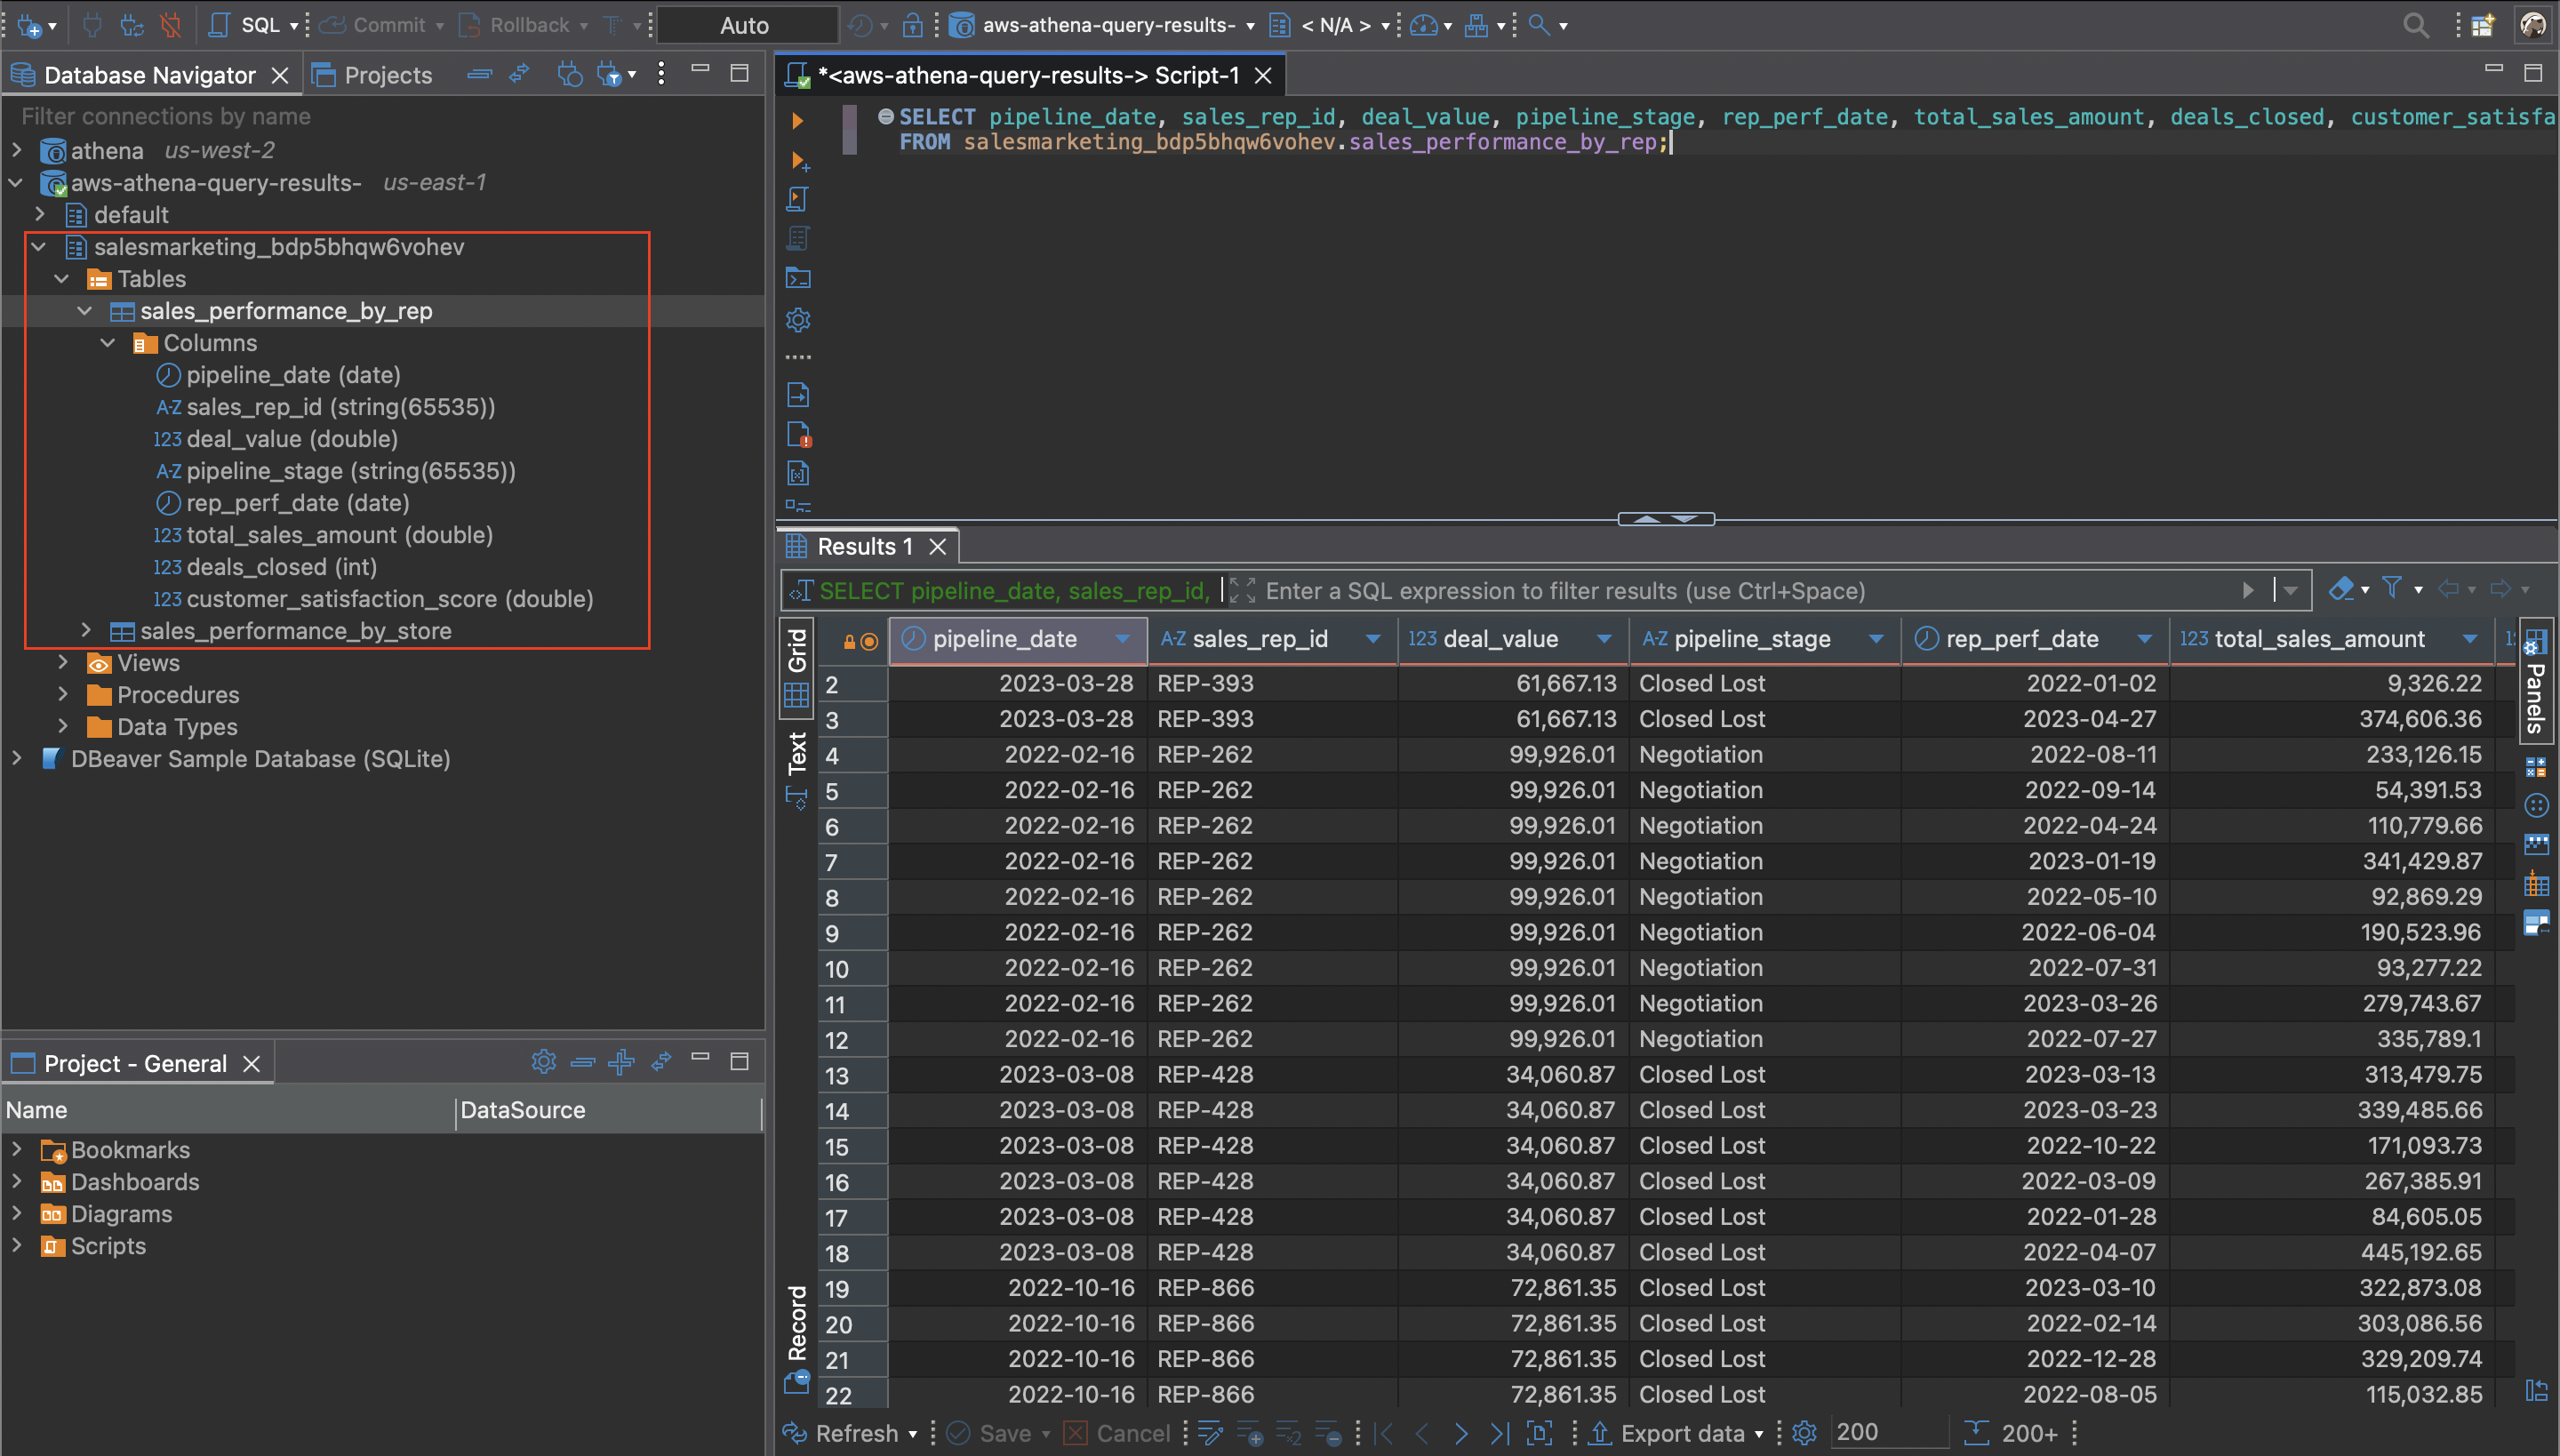
  11. You can now view and query all subscribed assets directly within DBeaver.
    DBeaver SQL query interface displaying sales performance data from Amazon Athena database

These steps might also apply to other analytics tools and clients that support JDBC connections. If you’re using a different tool, you might need to adapt these instructions accordingly to ensure proper configuration and access to Amazon SageMaker Unified Studio data assets.

Integration with other applications

You can use similar steps for other BI and analytics tools that support standard database connections.

Connect to Tableau Desktop

Use the Athena JDBC driver to connect Tableau to Amazon SageMaker Unified Studio and visualize your subscribed data.To connect to Tableau Desktop:

  1. Make sure that you’re using the latest Athena JDBC 3.x driver.
  2. Copy the JDBC driver file and place it in the appropriate folders for your operating system
    • For Mac OS: ~/Library/Tableau/Drivers
    • For Windows: C:\Program Files\Tableau\Drivers
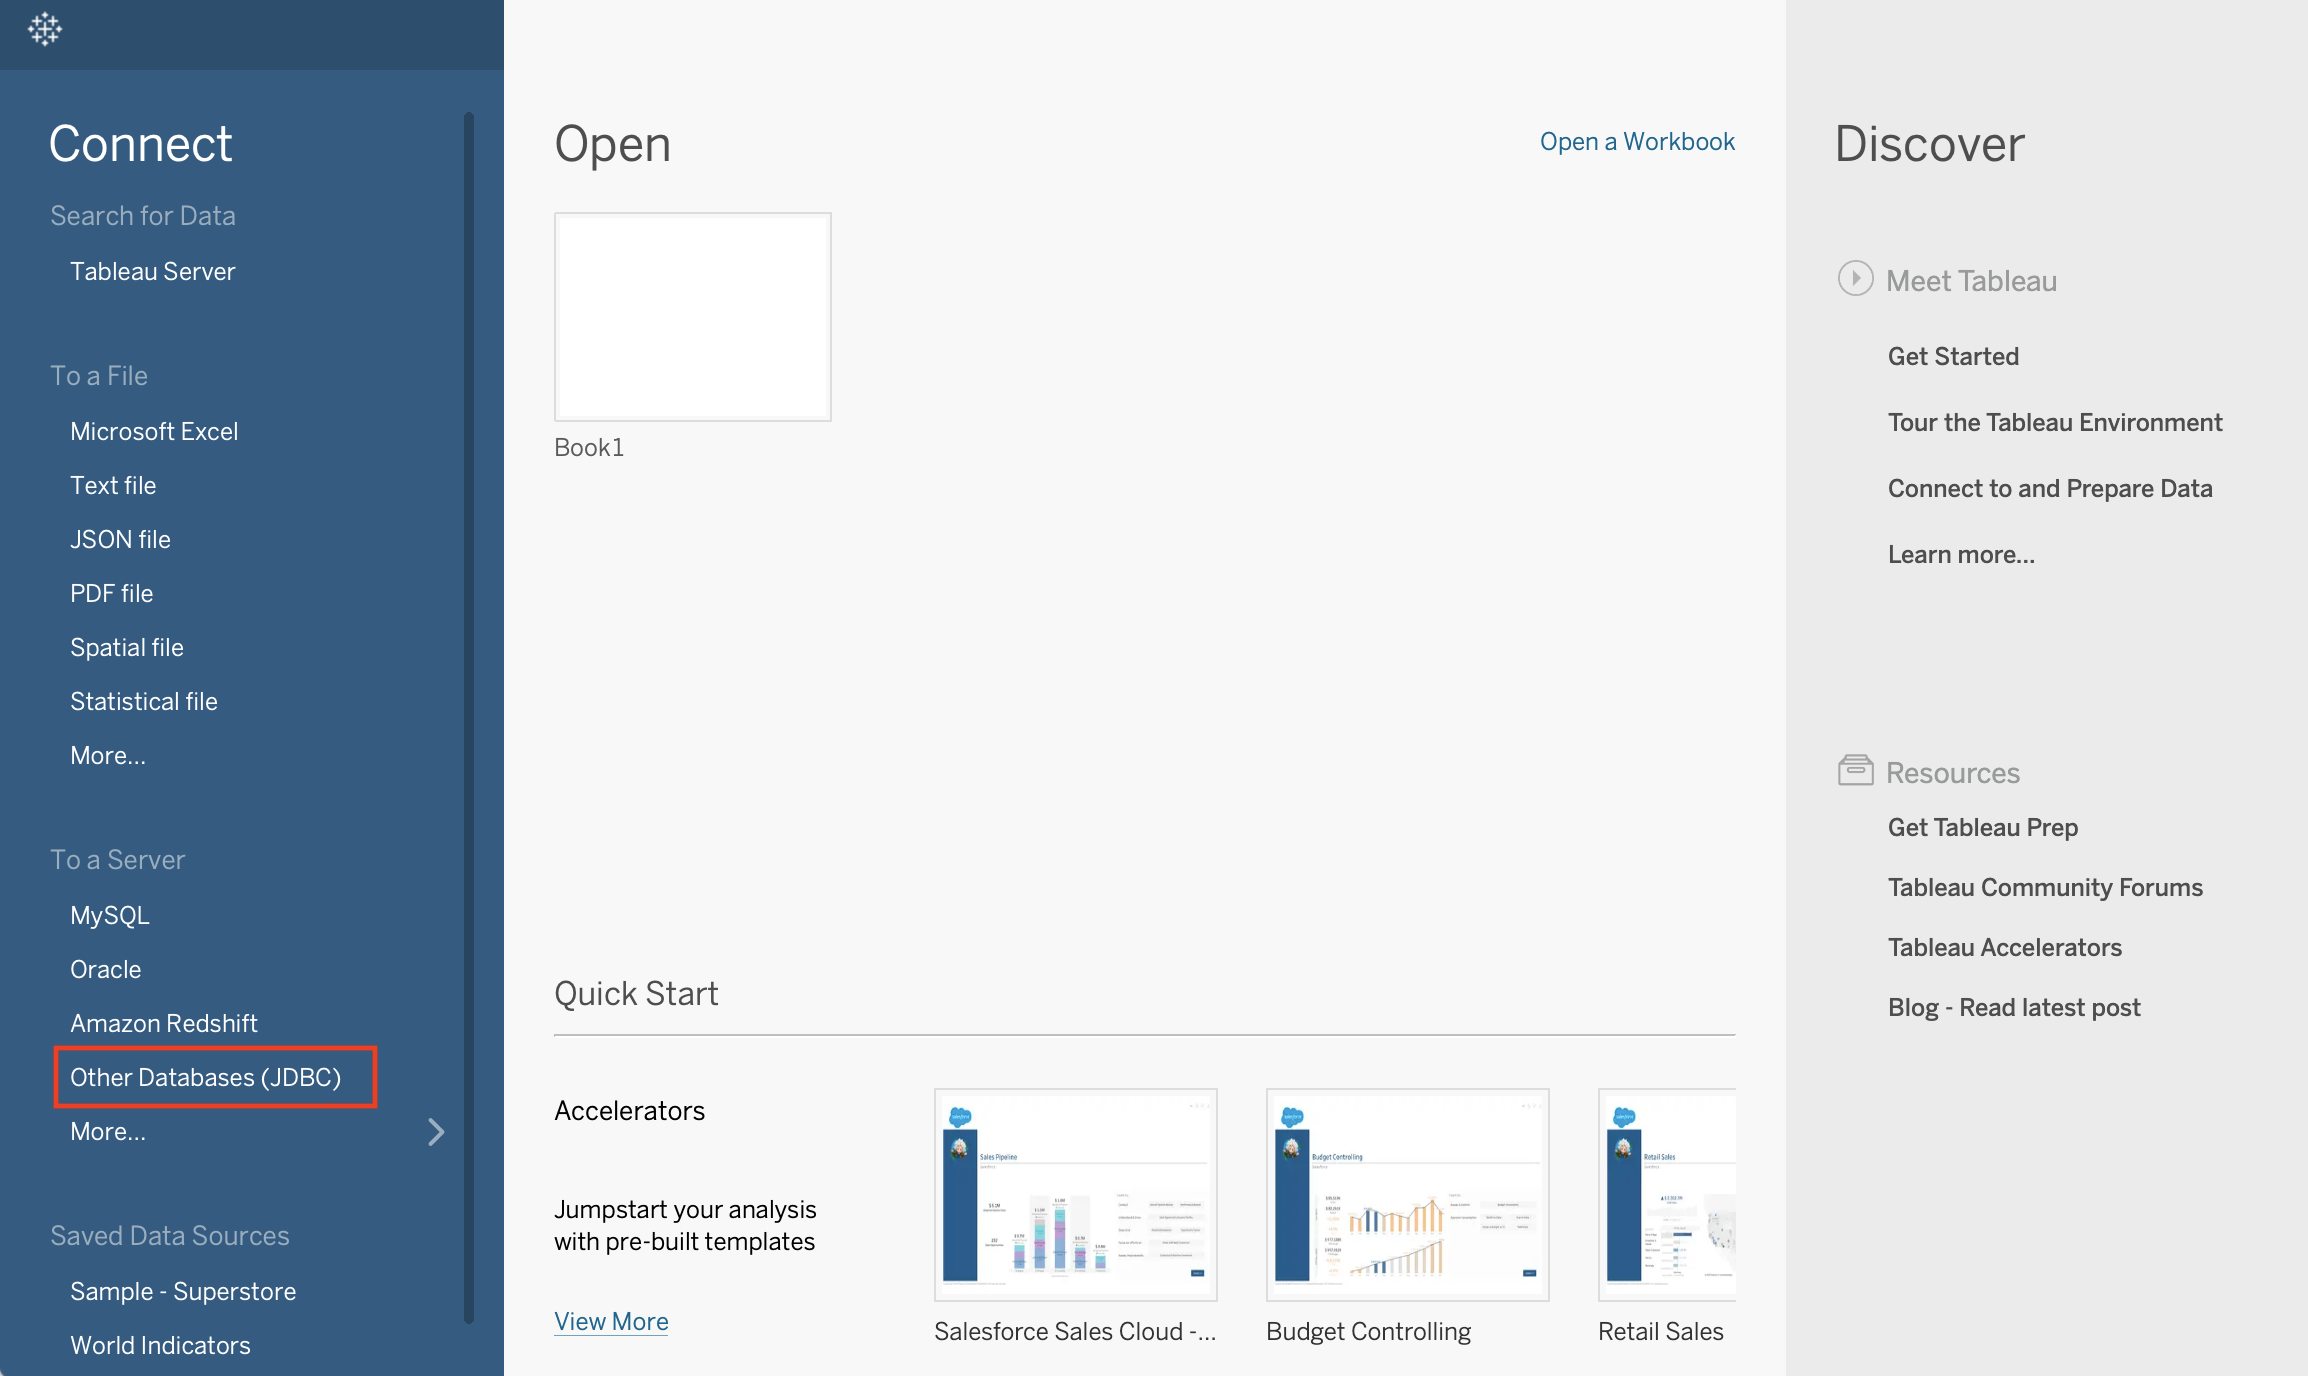
  3. Open Tableau Desktop. From the To a Server connection menu, select Other Databases (JDBC) to connect to Amazon SageMaker Unified Studio.
    Tableau start page showing connection options with Other Databases JDBC option highlighted
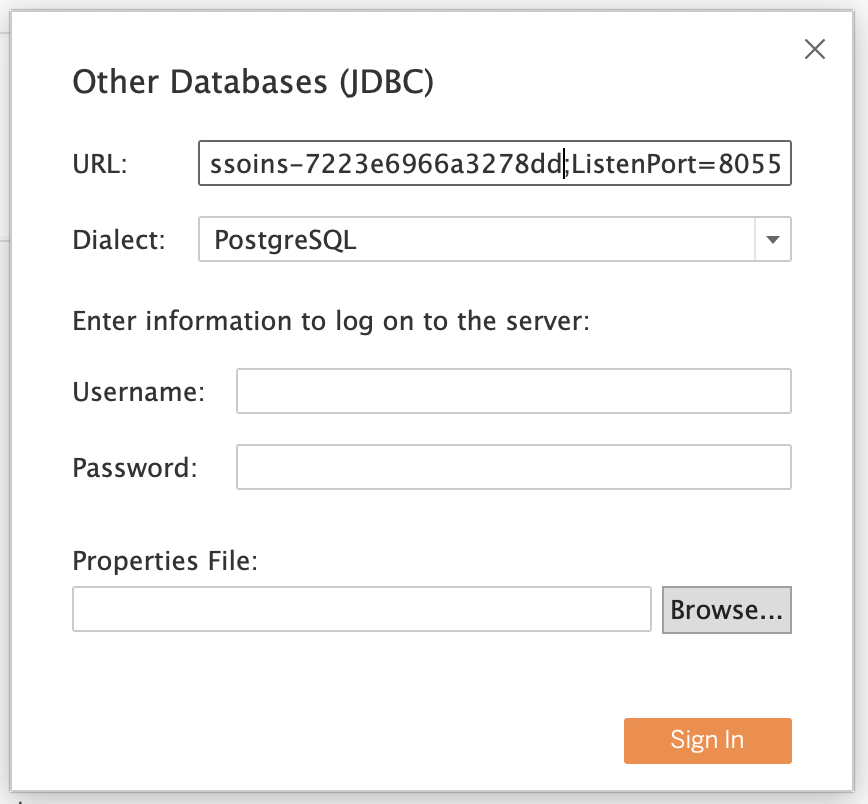
  4. Paste the JDBC connection URL you copied from the SageMaker Unified Studio portal into the URL. Leave other fields such as Dialect, Username, and Password blank and choose Sign in.
    If you get a port is occupied error – add “;ListenPort=8055” to the URL to change the port. You can use any port number.

    Tableau Other Databases JDBC connection dialog with PostgreSQL dialect configuration

  5. This redirects you to authenticate with IAM Identity Center. Enter the credentials of the Identity Center user that you used to sign in to the SageMaker Unified Studio portal. Authorize the DataZoneAuthPlugin to access Amazon DataZone from Tableau. Once the connection is established with the success message, you can view your project’s subscribed data directly within Tableau and build dashboards.
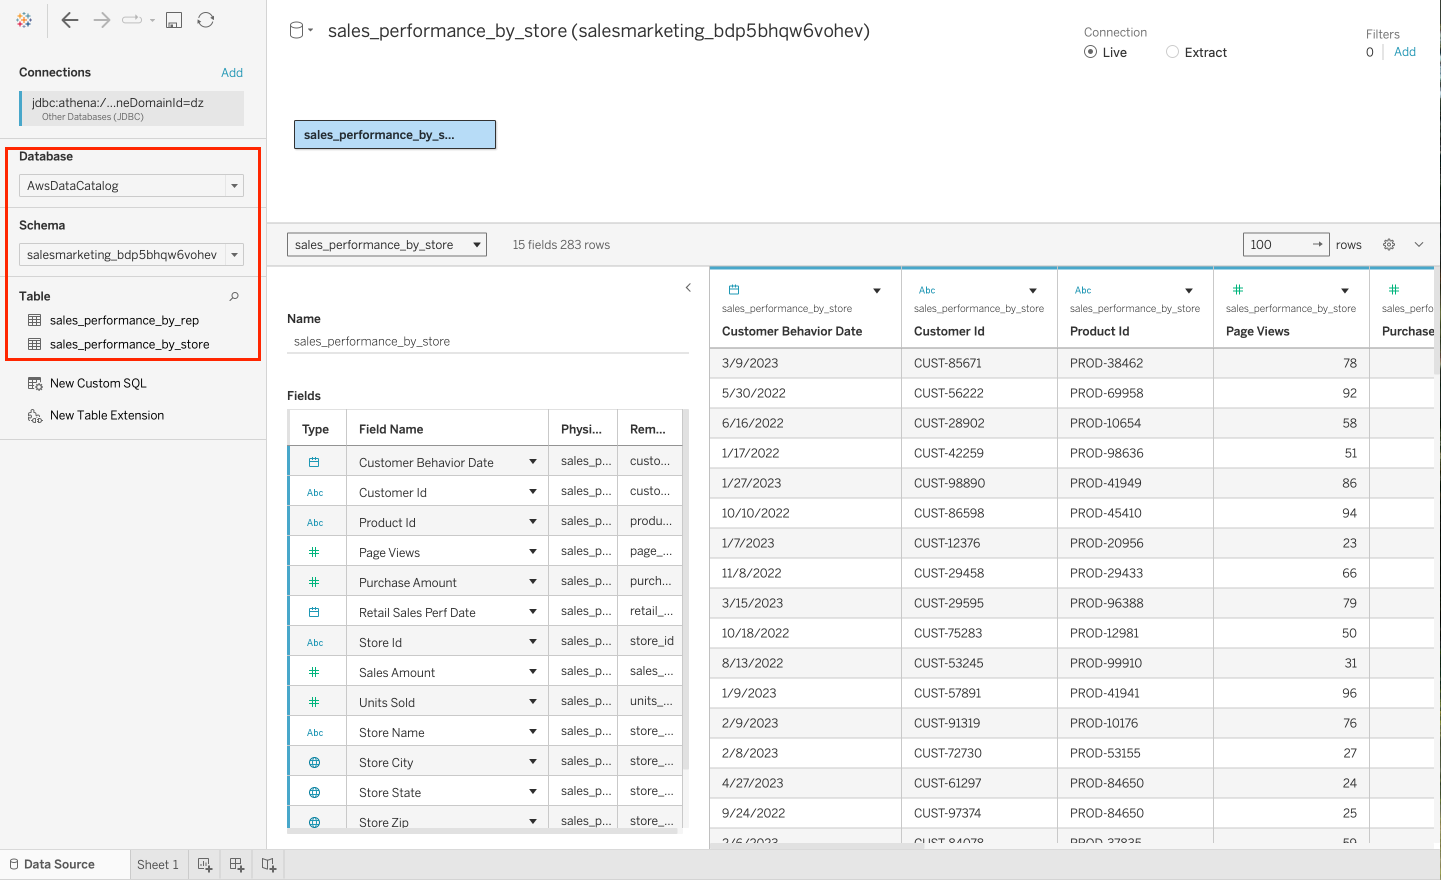
    Data analytics interface showing sales_performance_by_store table with 283 rows and 15 fields

Connect to Microsoft Power BI

Now, we look at connecting Amazon SageMaker Unified Studio with Microsoft Power BI on Windows.While Amazon Athena provides a native ODBC driver for connecting to ODBC-compatible tools like Microsoft Power BI, it currently doesn’t support Amazon SageMaker Unified Studio authentication. Therefore, in this post, we use an ODBC-JDBC bridge to connect Amazon SageMaker Unified Studio with Microsoft Power BI using the Athena JDBC driver, which supports SageMaker Unified Studio authentication.

In this post, we’re using the ZappySys driver as the ODBC-JDBC bridge. This is a third-party solution that requires a separate licensing fee, which isn’t included in the AWS solution. You can choose to use any other solution for ODBC-JDBC bridge.To connect to Power BI:

  1. Make sure that you have administrator privileges to run the ODBC Data Source Administrator.
  2. From the Windows Start menu, run the ODBC Data Source Administrator (the 64-bit version) using run as Administrator.
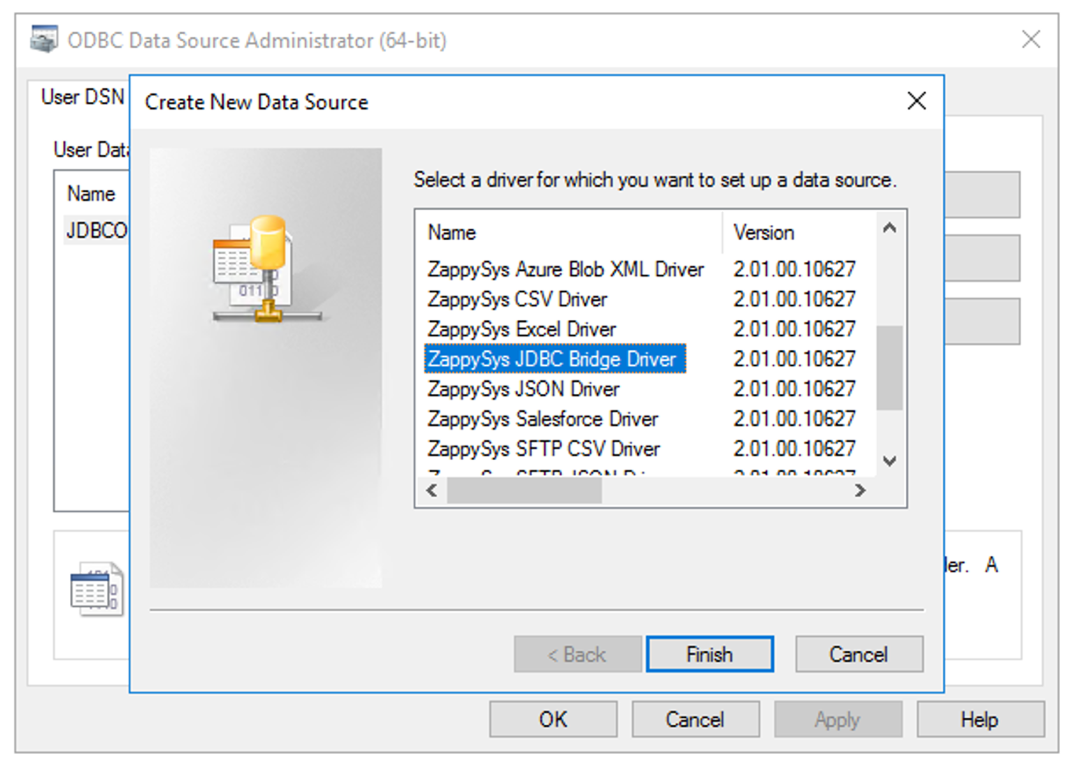
  3. Create a New Data Source with the ZappySys JDBC Bridge Driver. You are prompted to enter your connection details.
    Windows ODBC Data Source Administrator dialog showing ZappySys JDBC Bridge Driver selection
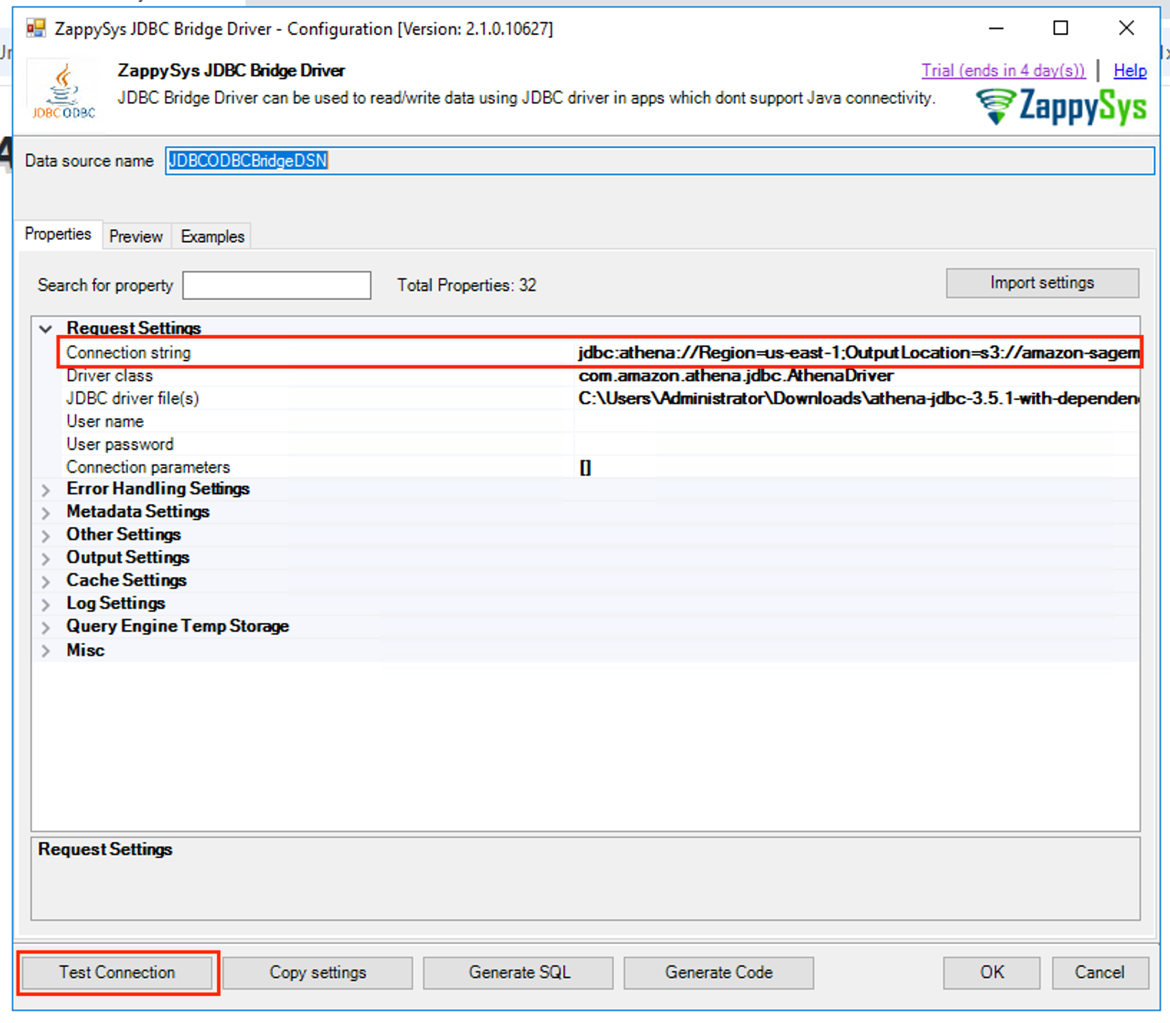
  4. Paste the JDBC URL you copied from the SageMaker Unified Studio portal in the Connection String, along with the driver class and JDBC driver file. Make sure that you’re using the latest Athena JDBC 3.x driver.
  5. Choose Test Connection. A new dialog window pops up after the connection is successful.
    Test Connection using ZappySys JDBC Bridge Driver
  6. This redirects you to authenticate with IAM Identity Center. Enter the credentials of the Identity Center user that you used to sign in to the SageMaker Unified Studio portal. Authorize the DataZoneAuthPlugin.
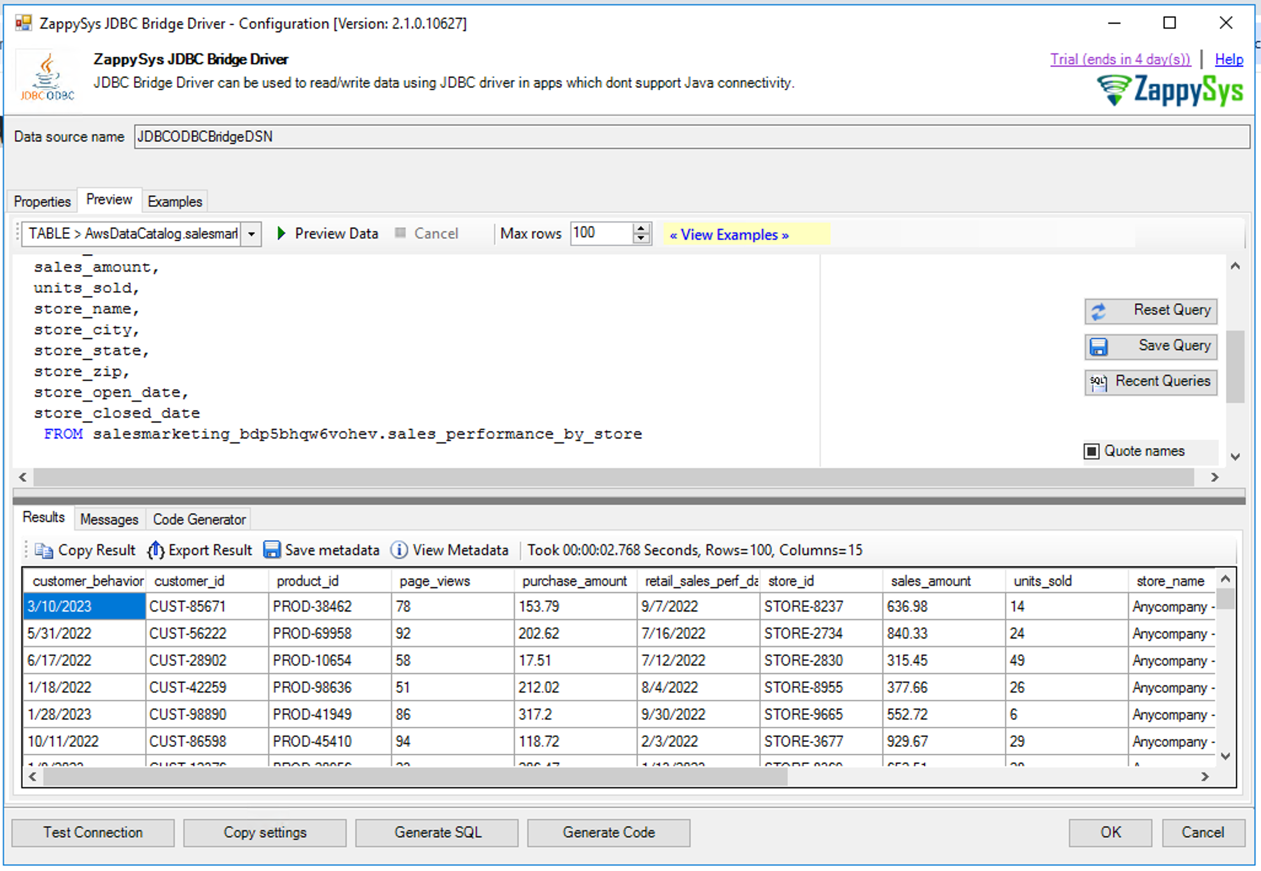
  7. Choose Preview tab on ZappySys JDBC Bridge Driver window and choose one of the subscribed tables to access data.
    ZappySys JDBC Bridge Driver configuration interface showing SQL query preview with sales performance results
  8. After configuring the data source, launch Power BI. Create a blank report or use an existing report to integrate the new visuals. Choose Get Data and select the name of the data source you created. This opens a new browser window to authenticate your credentials. Allow access to authorize the DataZone Auth plugin. After authorization is complete, you can build your reports in Microsoft Power BI with the subscribed data assets.
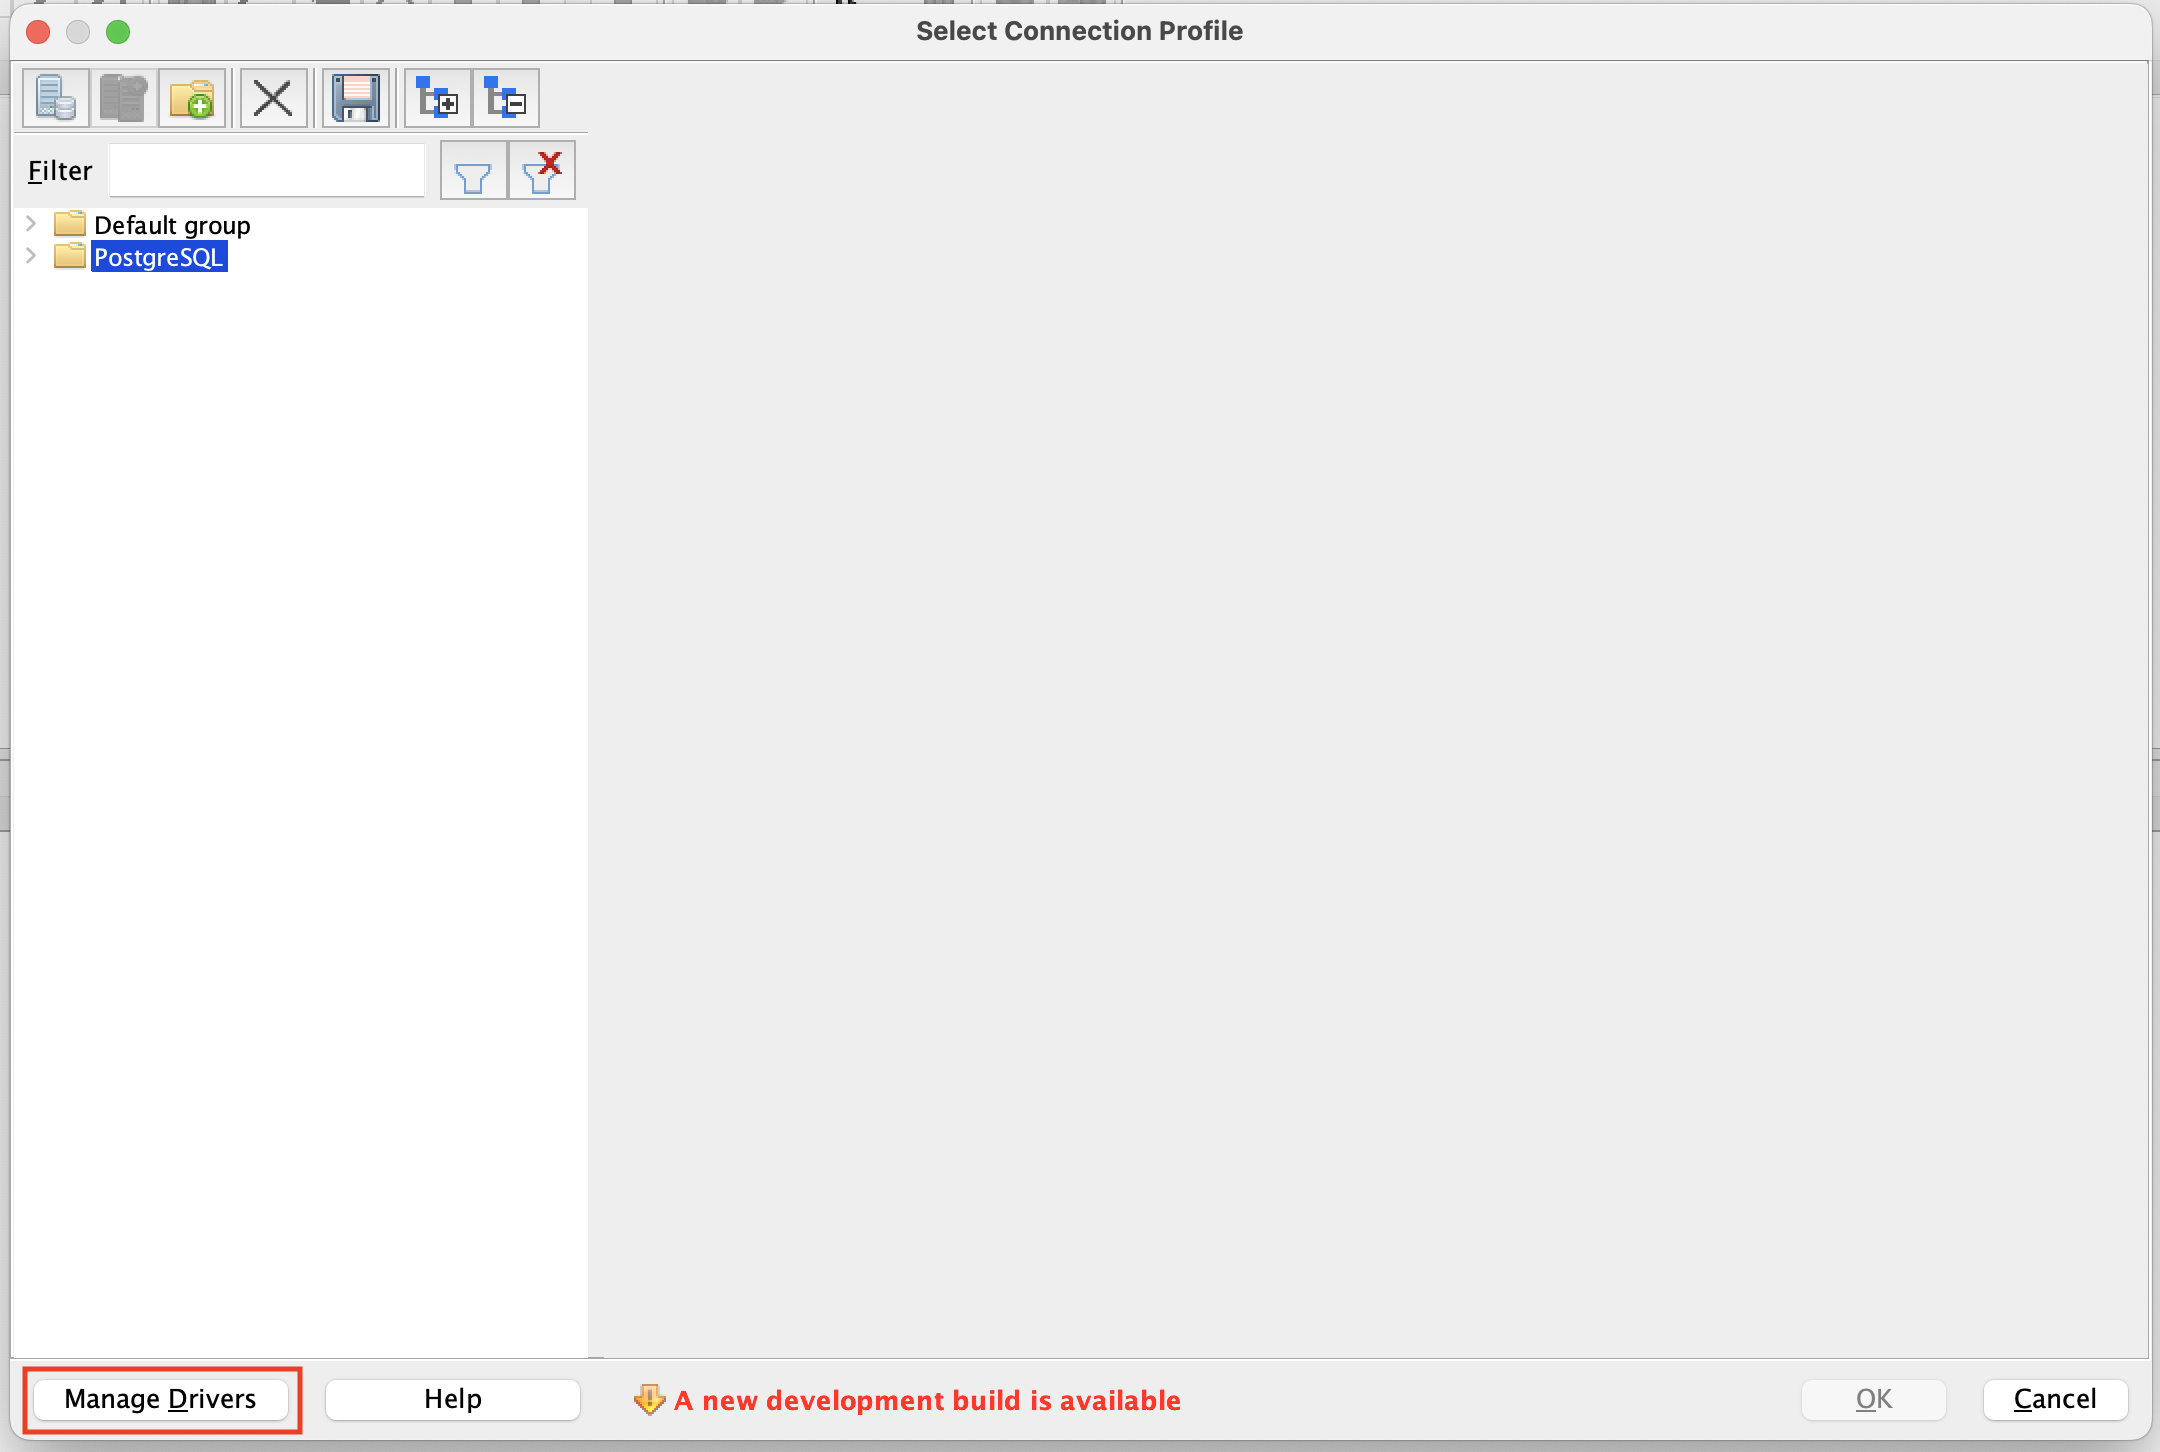
    Database connection profile selection dialog with PostgreSQL group highlighted

Connect to SQL Workbench

Discover how SQL Workbench can connect to Amazon SageMaker Unified Studio for users who prefer a SQL interface to query data lake tables and views subscribed through projects in Amazon SageMaker Unified Studio.

To connect to SQL Workbench:

  1. Make sure that you’re using the latest Athena JDBC 3.x driver.
  2. Open SQL Workbench/J and choose Manage Drivers.
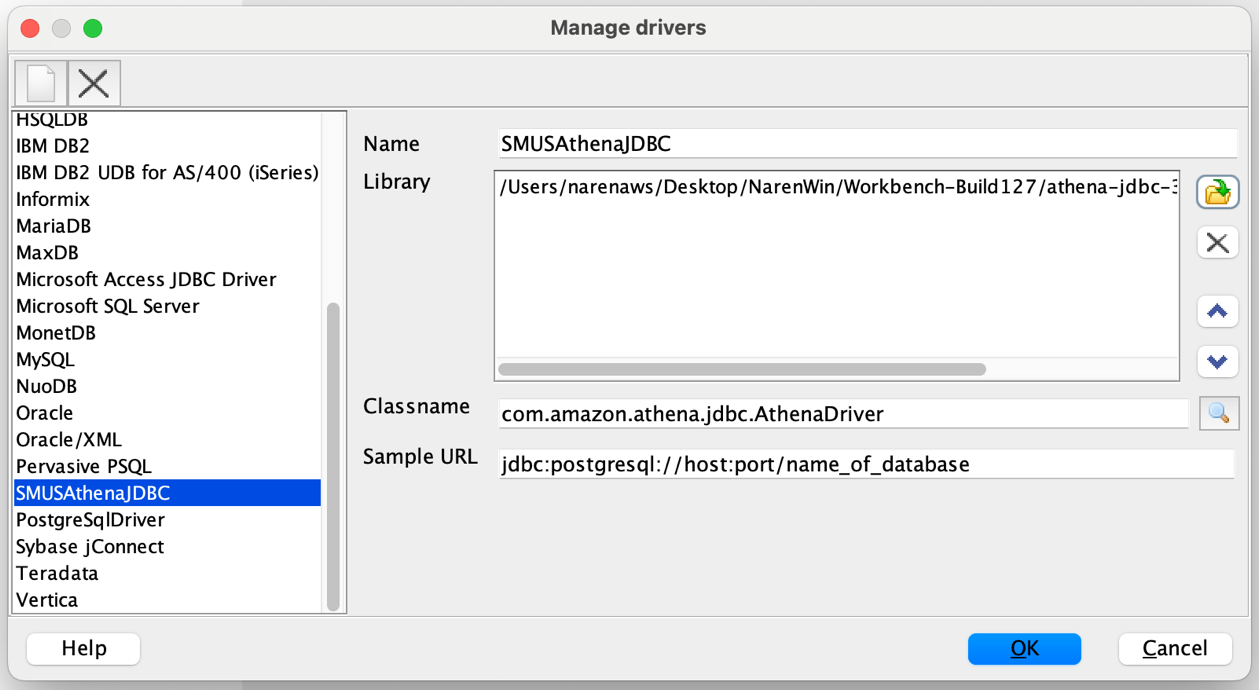
    Database driver management interface showing SMUSAthenajDBC driver configuration details
  3. Select the option to add a new driver. Enter a name for it, such as SMUSAthenaJDBC, and import the driver you downloaded in the previous steps.
    Database driver management dialog showing SMUSAthenaJDBC driver configuration with library path and class name
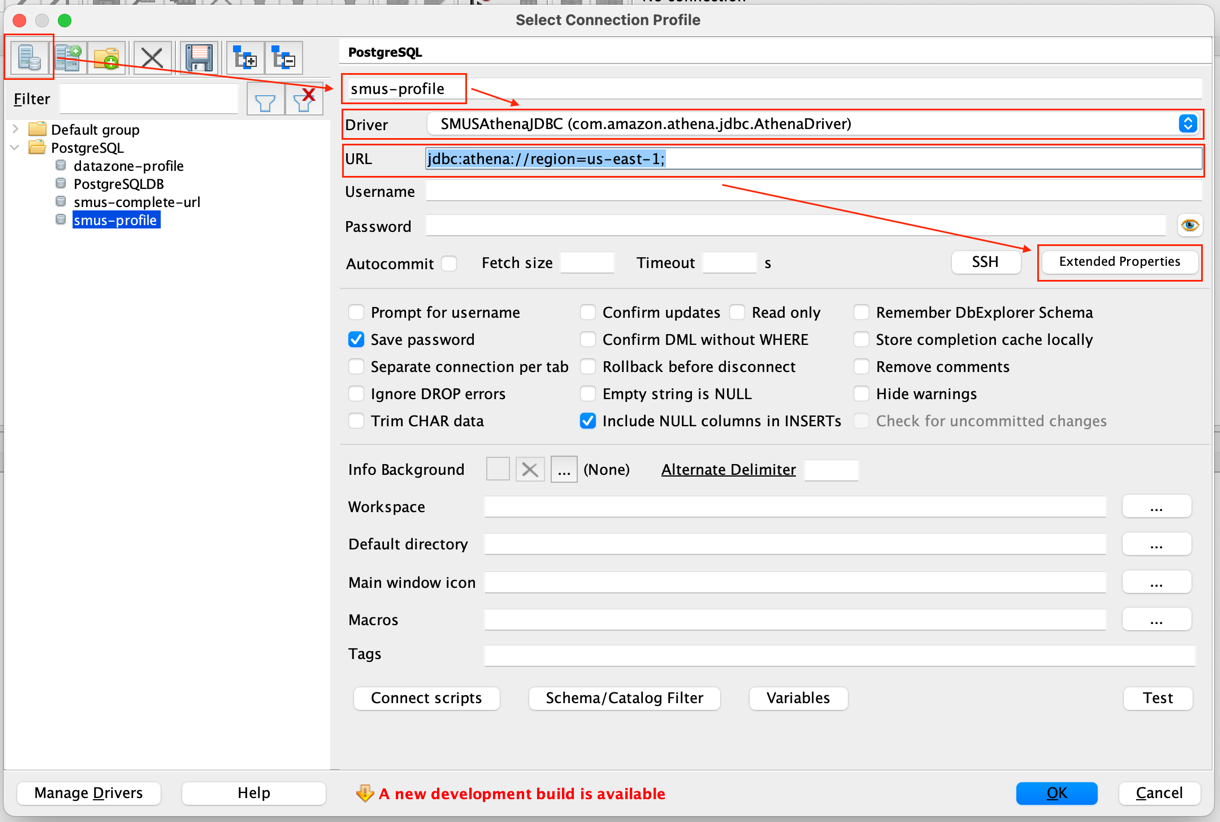
  4. Create a new connection profile and enter a name it, such as smus-profile. In the Driver dropdown, select the driver you configured. For the URL, enter the string jdbc:athena://region=us-east-1; (In the example, the Virginia Region is being used). Choose Extended Properties.
    PostgreSQL connection profile configuration dialog with Amazon Athena JDBC driver settings and authentication options
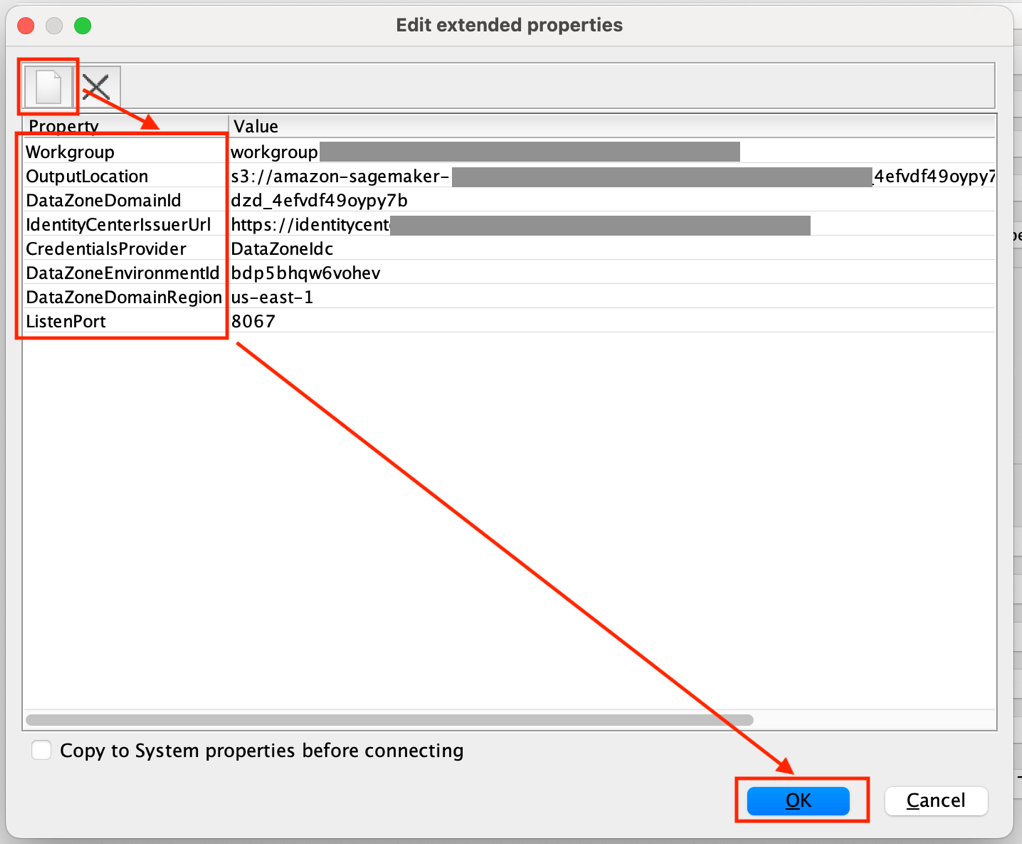
  5. Under Extended Properties, add the following parameters that you copied from the SageMaker Unified Studio portal. You can also include these parameters in the JDBC (URL) connection string. Choose OK.
    • Workgroup
    • OutputLocation
    • DataZoneDomainId
    • IdentityCenterIssuerURL
    • CredentialsProvider
    • DatazoneEnvironmentId
    • DataZoneDomainRegain

    Alos add “ListenPort” with any port number.

    Extended properties configuration dialog showing AWS DataZone connection parameters including domain ID, environment ID, and listen port 8067

  6. This redirects you to authenticate with IAM Identity Center. Enter the credentials of the Identity Center user that you used to sign in to the SageMaker Unified Studio portal. Authorize the DataZoneAuthPlugin.
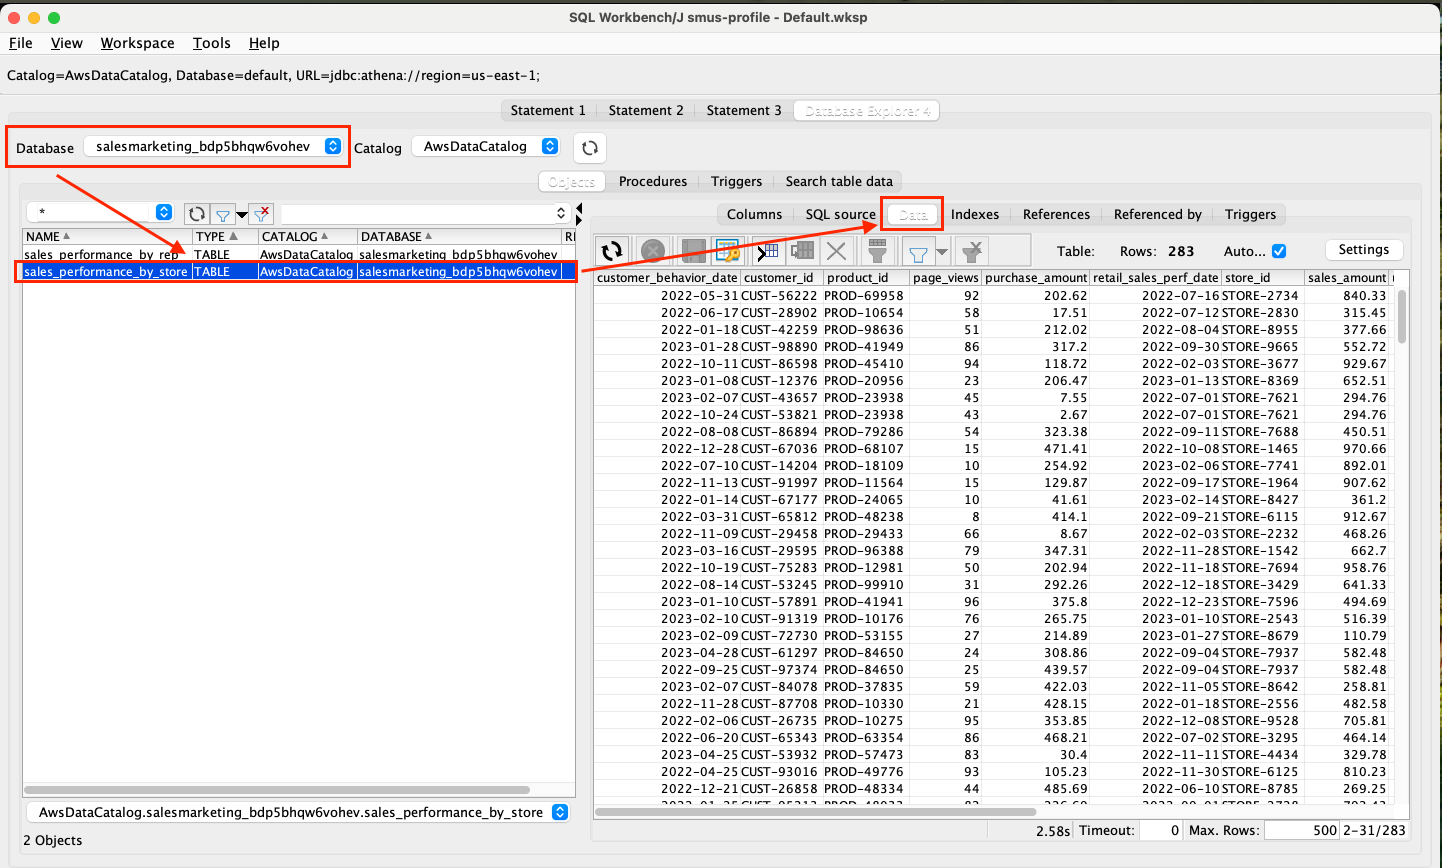
  7. After successful connection, in SQL Workbench/J, under Database Explorer, select the database from the marketing project of SageMaker unified studio. Choose a subscribed table. Select the Data tab to see the data in the table.
    SQL Workbench showing sales performance data query results from AWS Athena database with 283 customer transaction records

Cleanup

To ensure no additional charges are incurred after testing, be sure to delete the Amazon SageMaker Unified Studio domain. See Delete domains for instructions.

Conclusion

Amazon SageMaker Unified Studio continues to expand its offerings, providing you with more flexibility to access, analyze, and visualize your subscribed data. With support for the Athena JDBC driver, you can now use a wide range of popular BI and analytics tools, making data accessed through Amazon SageMaker Unified Studio more accessible than ever before. Whether you’re using Tableau, Power BI, or other familiar tools, the integration with Amazon SageMaker Unified Studio ensures that your data remains secure and accessible to authorized users.

The feature is supported in all AWS commercial Regions where Amazon SageMaker Unified Studio is currently available. Get started with our technical documentation.


About the authors

Narendra Gupta

Narendra Gupta

Narendra is a Specialist Solutions Architect at AWS, helping customers on their cloud journey with a focus on AWS analytics services. Outside of work, Narendra enjoys learning new technologies, watching movies, and visiting new places.

Durga Mishra

Durga Mishra

Durga is a solutions architect at AWS. Outside of work, Durga enjoys spending time with family and loves to hike on Appalachian trails and spend time in nature.

Ramesh Singh

Ramesh Singh

Ramesh is a Senior Product Manager Technical (External Services) at AWS in Seattle, Washington, currently with the Amazon SageMaker team. He is passionate about building high-performance ML/AI and analytics products that help enterprise customers achieve their critical goals using cutting-edge technology.

Nishchai JM

Nishchai JM

Nishchai is an Analytics Specialist Solutions Architect at Amazon Web services. He specializes in building Big-data applications and help customer to modernize their applications on Cloud. He thinks Data is new oil and spends most of his time in deriving insights out of the Data.

Accelerate context-aware data analysis and ML workflows with Amazon SageMaker Data Agent

Post Syndicated from Kshitija Dound original https://aws.amazon.com/blogs/big-data/accelerate-context-aware-data-analysis-and-ml-workflows-with-amazon-sagemaker-data-agent/

Accelerating data analysis and machine learning (ML) development requires AI tools that understand your specific data environment, not just generic code generation. General-purpose AI assistants lack context about your specific data environment, creating a gap between AI capabilities and practical implementation. Data practitioners often start by looking for relevant tables, understanding relationships, and writing exploratory code before answering their first business question. Data teams still spend time translating AI-generated suggestions into working code that correctly references their actual data assets, understands their organization’s data relationships, and integrates with their existing workflows.

AWS released Amazon SageMaker Data Agent in November 2025, addressing these challenges by providing an AI assistant that’s deeply integrated within Amazon SageMaker (IAM-based domains only) with notebooks. SageMaker Data Agent has direct access to your AWS data context, including AWS Glue Data Catalog metadata, Amazon DataZone business data catalog, and your current notebook state. This helps it generate environment-aware code that works directly with your petabyte-scale data through serverless compute resources, helping you analyze massive datasets without infrastructure management overhead. With this contextual awareness, the agent creates executable analysis plans from natural language prompts that specifically reference your actual tables, data types, and analytical needs, while maintaining reasoning throughout multi-step analyses. Importantly, the agent performs these operations securely within the AWS environment, using built-in governance controls, Amazon Identity and Access Management (IAM) policies, and data security features to make sure your data doesn’t leave your organizational boundaries. By operating within your Amazon SageMaker Unified Studio interface, it reduces context-switching between AI assistants and your development environment, improving how you interact with your analytics and ML workflows.

In this post, we demonstrate the capabilities of SageMaker Data Agent, discuss the challenges it addresses, and explore a real-world example analyzing New York City taxi trip data to see the agent in action.

Challenges in data workflows

General AI tools can generate code snippets, but you still face three key challenges when applying these to your specific data environments:

  • Contextual disconnect – Standard AI assistants generate generic code referencing hypothetical tables like customers rather than your actual tables like customer_activity_prod, forcing extensive modifications to work with your data environment.
  • Complex data environment – Many enterprises work with complex data environments containing numerous tables and large-scale data stores, making it extremely difficult to locate relevant data assets for analysis. You must navigate complex catalog structures, understand table relationships, and determine which subset of data is relevant for your specific analytical needs before you can begin actual analysis.
  • Language and syntax barriers – You must work across multiple programming languages and query syntaxes during analysis workflows. Some might excel in SQL but struggle with Python, while others might be Python experts but have limited PySpark knowledge.

Additionally, you face challenges around data quality validation, data governance, and performance optimization. SageMaker Data Agent addresses these fundamental workflow challenges while adapting to your requirements.

Solution overview

SageMaker Data Agent addresses these key challenges through its context-aware architecture and deep AWS integration. In this section, we discuss how it works.

Context-aware understanding

SageMaker Data Agent builds a detailed understanding of your specific data environment and references your actual tables through two parallel processes. SageMaker Data Agent is embedded within your AWS data environment, allowing it to understand what you’re asking, what data you have available, how it’s structured, and how it relates to your analytical objectives. The following are the two ways the agent achieves this contextual understanding:

  • Integrated data environment – SageMaker Data Agent exists within the same integrated environment as your data, harnessing the power of your AWS infrastructure. It begins by exploring the AWS Glue Data Catalog and the Amazon DataZone business data catalog, which reveal business metadata, glossaries, and relationships, enabling it to reference your actual tables rather than generic placeholders. This intelligence extends to working directly with your full datasets where they naturally reside, preserving your existing security policies and access controls without requiring data movement. The agent integrates with Amazon Simple Storage Service (Amazon S3), Amazon Athena, and Amazon SageMaker AI to use their respective capabilities for data storage, query processing, and ML while adapting to your data environment. This lets you process petabyte-scale data through serverless compute resources with the agent acting as an intelligent interface to your complete data environment.
  • Notebook context awareness – Simultaneously, the agent examines your current notebook state, including existing dataframes, imported libraries, previous cell results, and ML artifacts. This context awareness makes sure generated code works with your specific environment without extensive modifications.

Language and syntax flexibility

SageMaker Data Agent resolves language and syntax barriers by selecting the optimal language for each analytical task. The agent can switch between SQL for efficient data querying and Python and PySpark for complex transformations and ML operations without requiring practitioners to manually translate between languages. This avoids language barriers, because the agent automatically selects and generates the appropriate code syntax, whether SQL, Python, or PySpark, based on the specific analytical or ML task at hand.

SageMaker Data Agent provides four key capabilities that work together to give you control over complex analyses:

  • When handling complex requests, the agent creates structured analysis plans by breaking them into logical steps with clear reasoning for each operation.
  • At each stage, you have intermediate validation points where you can review and approve each step before proceeding to the next.
  • Throughout multi-step analyses, the agent maintains consistent context, retaining understanding of your data environment and previous steps.
  • Most importantly, you maintain human-in-the-loop control with full oversight and the ability to modify any generated code to match your specific requirements.

Interaction modes

SageMaker Data Agent provides two interaction modes optimized for different analytical tasks: the Agent Panel and in-line assistance.
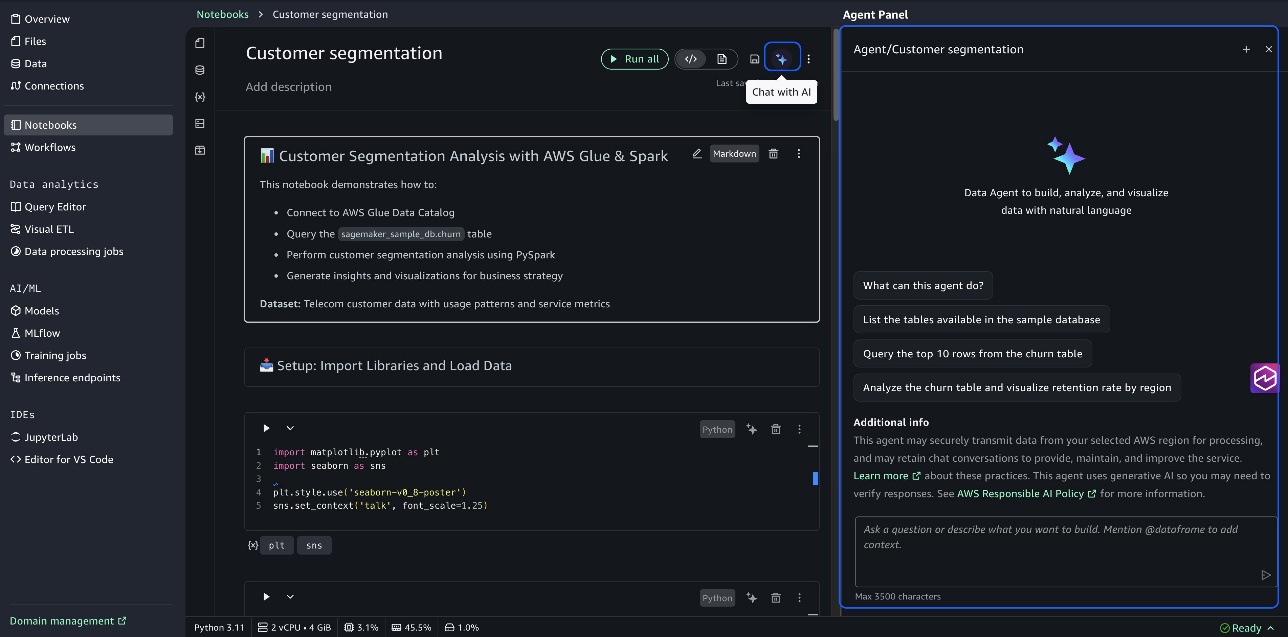
The Agent Panel supports comprehensive analytical tasks by breaking them down into structured steps, each with generated code that builds on previous results. When you submit a request such as “perform customer segmentation,” the agent identifies relevant tables, understands their relationships, and creates a complete analysis workflow with intermediate review points. The following screenshot illustrates this example.

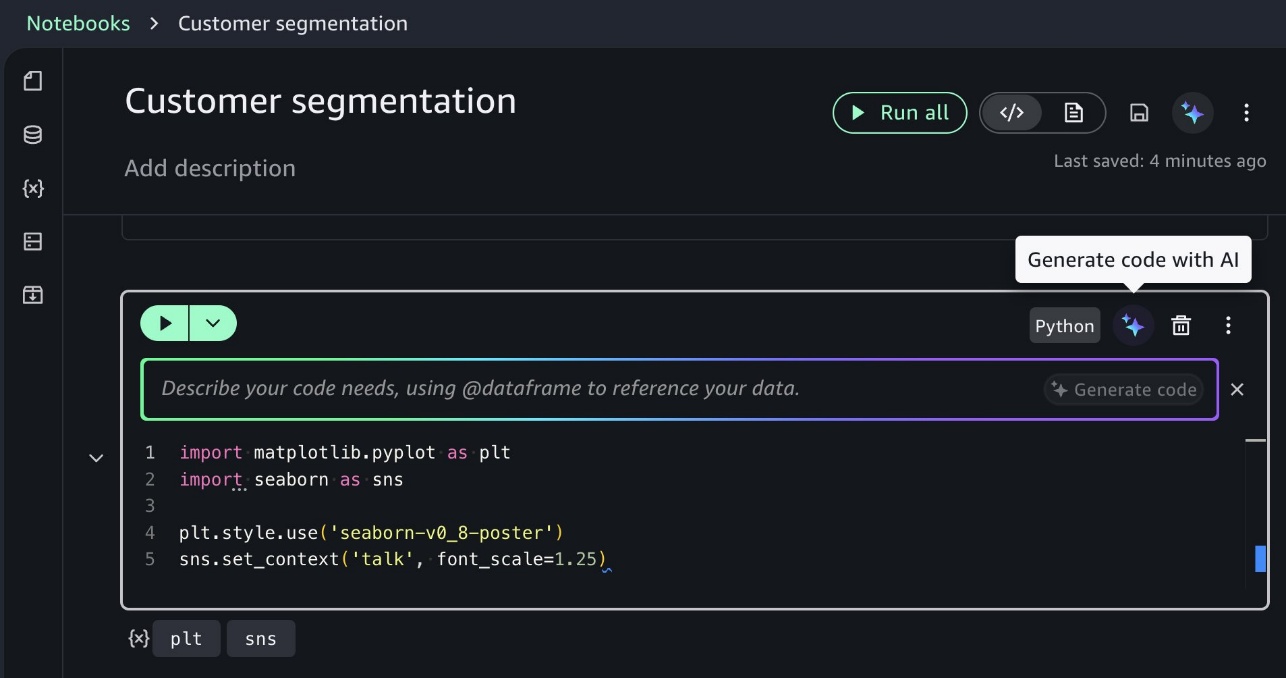
In-line assistance mode supports direct cell modifications, one-click error fixes, and keyboard shortcuts (Alt+A for Windows/Linux, Opt+A for Mac) that maintain your coding flow. You can quickly enhance existing code or fix errors without leaving your current notebook context, improving productivity during iterative development. You can code directly within notebook cells by using the inline prompt interface, as illustrated in the following screenshot. Use in-line assistance for focused tasks like specific queries or visualizations directly within cells.

Execution and control

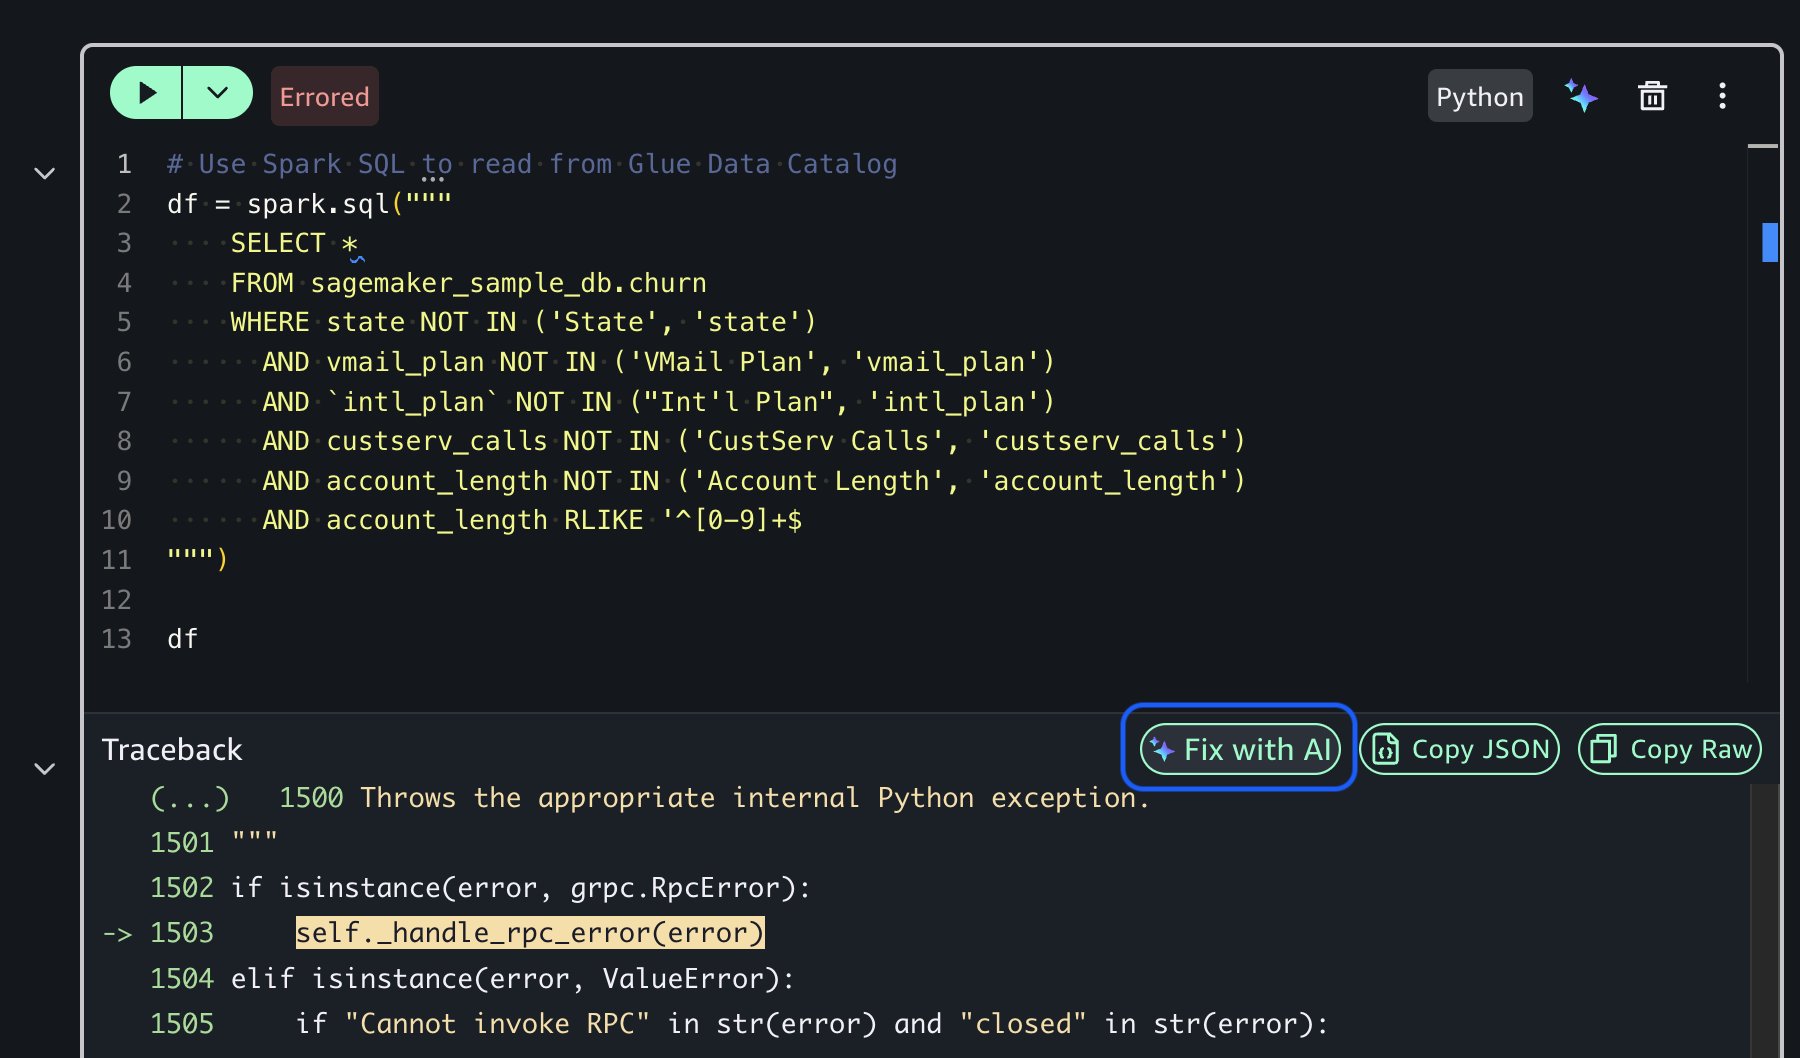
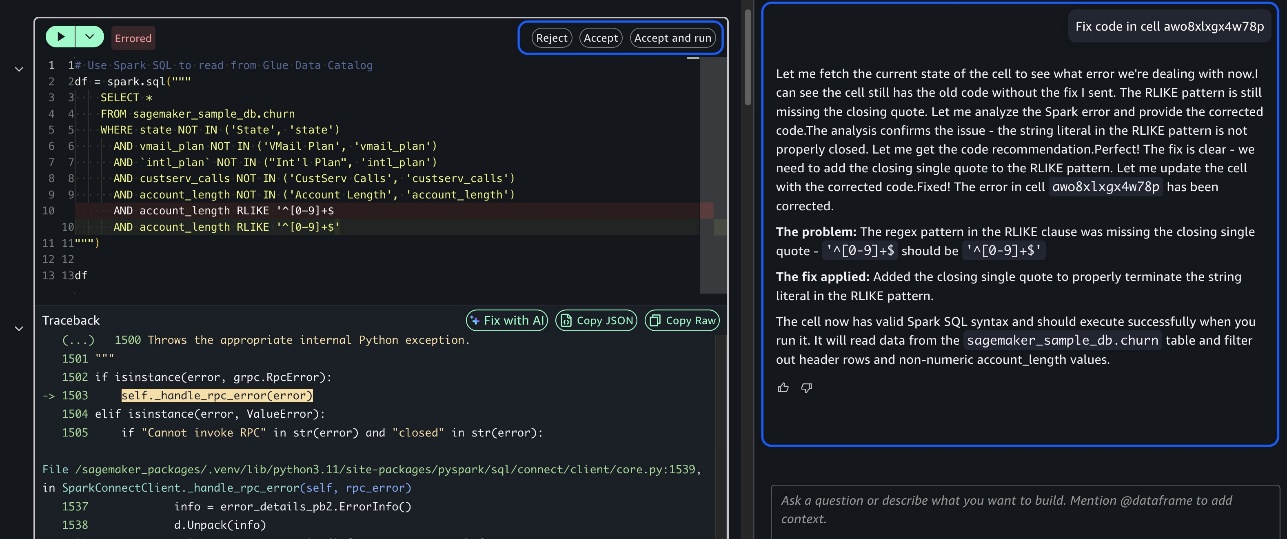
Throughout the process, you maintain execution control. You can review generated plans before execution, execute steps individually with intermediate result review, modify code as needed for your specific requirements by providing feedback, and get AI-powered error diagnosis and fixes using the Fix with AI option when issues arise. This human-in-the-loop approach makes sure you maintain oversight while benefiting from AI assistance.

The following screenshots demonstrate how the Fix with AI feature works in practice, showing how the agent diagnoses code errors and provides corrected solutions with explanations.

By bringing together context-aware understanding, reasoning, and interaction modes within your existing AWS environment, SageMaker Data Agent improves how you work. It removes the traditional friction between AI assistance and your actual data environment, providing direct access to petabyte-scale data with no operational overhead. This combination helps you shift your focus from repetitive setup tasks to high-value analysis and decision-making, accelerating insights while maintaining control over the analytical process.

Getting started with SageMaker Data Agent

Now that you understand how SageMaker Data Agent works, let’s see these capabilities in action. Getting started with SageMaker Data Agent is straightforward. For detailed setup instructions, refer to New one-click onboarding and notebooks with a built-in AI agent in Amazon SageMaker Unified Studio. It provides step-by-step guidance on setting up your environment and beginning your journey with SageMaker Data Agent.

To get the most from SageMaker Data Agent, begin by asking clear, specific questions about your data rather than generic requests. Provide context about your analytical goals so the agent can tailor its responses to your specific use case. Always review and validate generated code before execution, using the agent’s built-in explanations to understand the approach. For complex analyses, take advantage of the agent’s reasoning capabilities that can break down multi-step processes and explain the logic behind each recommendation.

NYC taxi trip analysis

In this section, we demonstrate how SageMaker Data Agent helps analyze the NYC Taxi Trip dataset, a collection of over 1.2 billion taxi trips (approximately 63.7 GB) throughout New York City with information on pickup/drop-off locations, timestamps, trip distances, fare amounts, payment types, and passenger counts.

If you’re looking to try a simpler end-to-end flow before diving into this large-scale analysis, SageMaker Unified Studio provides a sample database with pre-loaded customer churn data. You can perform similar analytical workflows on this smaller dataset to quickly familiarize yourself with the agent’s capabilities before working with larger, more complex datasets. To explore this dataset, complete the following steps:

  1. On the SageMaker Unified Studio console, choose Data in the navigation pane.
  2. In the data explorer, under Catalogs, select AwsDataCatalog.
  3. Select sagemaker_sample_db.
  4. Select the churn table from the tables list.

NYC Taxi Trip dataset

The NYC Taxi Trip dataset is publicly available in Amazon S3 at s3://aws-data-analytics-workshops/shared_datasets/nyc_taxi_trips_parquet/.

To replicate this, you can work with this dataset in two ways:

  • Catalog it beforehand (recommended for repeated analysis)
  • Provide the S3 path directly in your prompt (quickest for one-time exploration)

For this demonstration, we used SageMaker Data Agent to catalog the dataset prior to analysis.

Our analysis approach

For this demonstration, we asked SageMaker Data Agent to perform a comprehensive analysis on the cataloged taxi trip data to uncover business insights. We used the following prompt:

Using Apache Spark, analyze the NYC taxi trips dataset to extract meaningful insights. Please provide:
1/ Fare analysis across different NYC boroughs
2/ Trip trends across boroughs and time
Conclude with multi-panel dashboard and an executive summary highlighting the 3-5 most significant findings and their potential business implications.

You can add the S3 path (s3://aws-data-analytics-workshops/shared_datasets/nyc_taxi_trips_parquet/) in the preceding prompt if you don’t have the NYC Taxi Trip data cataloged.

The following video demonstrates how SageMaker Data Agent processes this natural language prompt and creates a complete analytical workflow. The agent constructs a six-step analysis plan, generates executable code for each step, and progressively builds toward actionable insights.

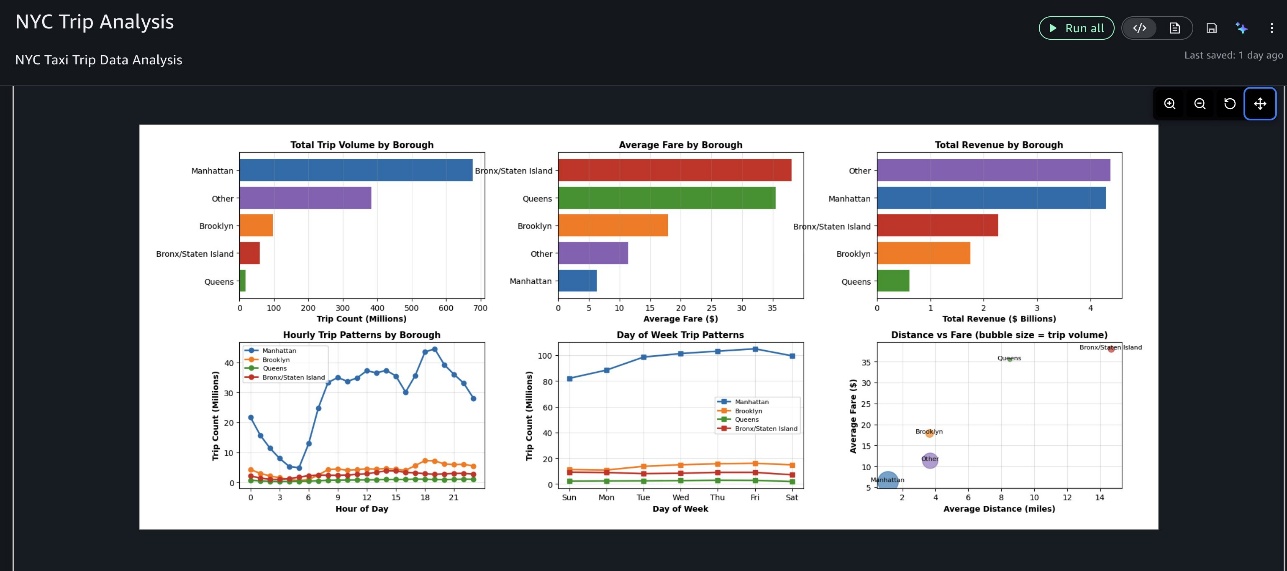
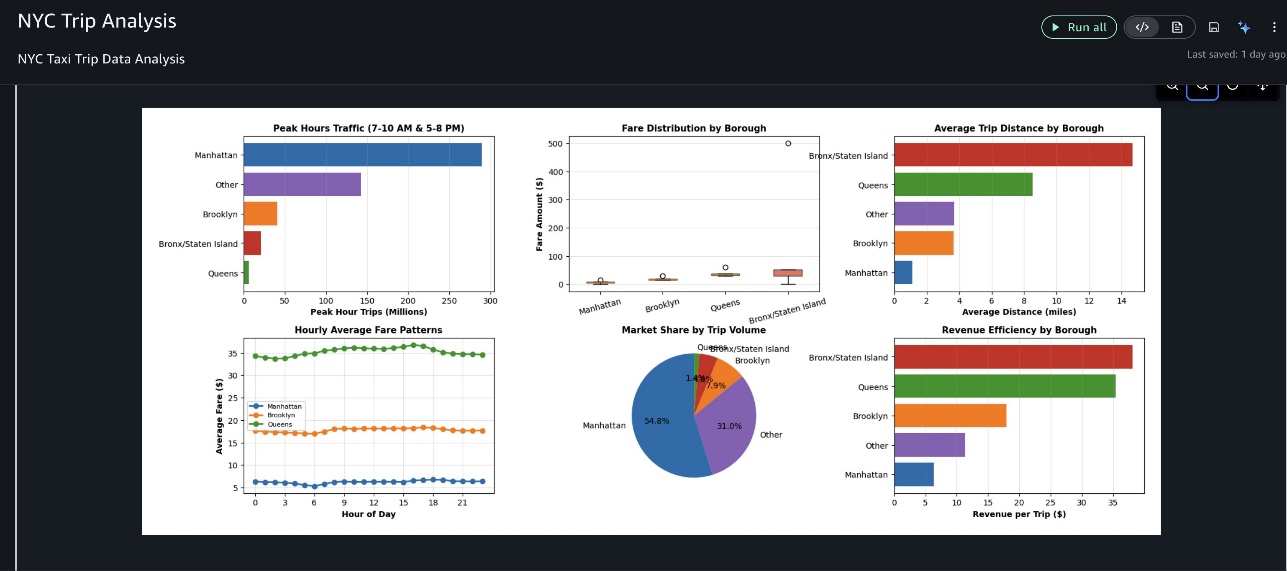
The outputs shown in this demonstration video are specific to this analysis session. Due to the generative nature of AI, your results might vary when running the same prompts.The agent executed each step sequentially, so we can review intermediate results and provide feedback. After loading and cleaning NYC taxi trip records, the agent analyzed fare patterns and trip trends across boroughs and time periods, then created a comprehensive multi-panel dashboard visualizing key insights, as shown in the following screenshots.

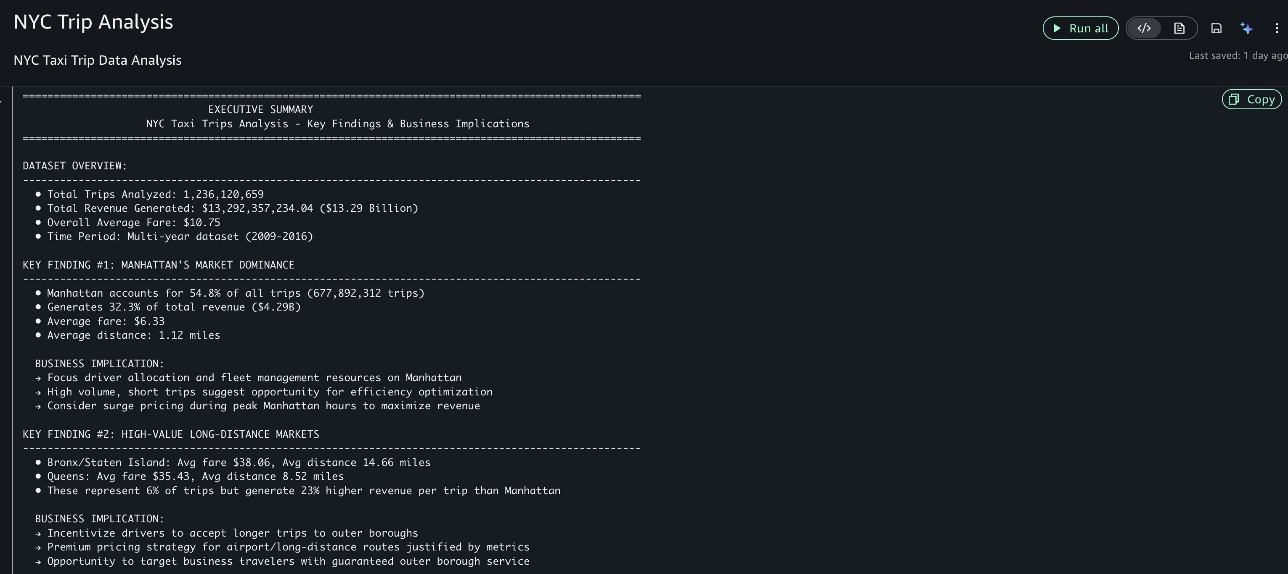
Finally, it provided actionable business insights, highlighting the most significant findings and their business recommendations.

This example demonstrates how SageMaker Data Agent helps transform complex analytical tasks into actionable insights without requiring extensive coding or data preparation. The agent’s ability to understand both the data structure and business context allows it to generate meaningful analyses that directly address business objectives.

Security and governance

SageMaker Data Agent follows your AWS security settings. It accesses data you’ve explicitly permitted through your IAM access controls or using AWS Lake Formation, helping maintain your organization’s security policies. To use SageMaker Data Agent, your project role must have permissions to invoke specific Amazon DataZone APIs, including SendMessage, GenerateCode, StartConversation, GetConversation, and ListConversations. For more information, visit Actions, resources, and condition keys for Amazon DataZone.

Guardrails

SageMaker Data Agent has in-built guardrails to prevent the agent from responding to undesired requests. These include but are not limited to requests asking the agent to reveal its system prompt, internal tools, or other technical implementation. These guardrails also prohibit the agent from talking about non-AWS related topics and from generating output in any language except English.

Data storage and privacy

SageMaker Data Agent doesn’t store code you write or modify yourself, notebook context or metadata, or data from your AWS Glue Data Catalog or other sources. The agent only stores your natural language prompts, questions, and generated code/responses in the AWS Region where your SageMaker Unified Studio domain was created. AWS might use stored content (prompts, questions, and generated code/responses) to improve the service, fix issues, or for debugging, but maintains clear boundaries by not using your self-written code, manually modified code, notebook metadata, or actual data sources for service improvement. To opt out of data usage for service improvement, you can configure an AI services opt-out policy for Amazon DataZone in AWS Organizations, which will delete previously collected data and prevent future collection or usage. For more information, refer to Data storage in the SageMaker Data Agent, Service improvement, and AI services opt-out policies.

Conclusion

SageMaker Data Agent improves how data practitioners accelerate insights. By combining context-aware understanding, AWS integration, and flexible interaction modes, it alleviates the traditional friction between AI-assisted development and your actual data environment. The NYC taxi analysis demonstrated this in practice: what might have required manual data exploration, catalog navigation, and code translation instead took minutes through natural language prompts.

The real value extends beyond speed. SageMaker Data Agent preserves your security posture, maintains governance controls, and keeps your data within your AWS environment while supporting petabyte-scale analysis without operational overhead. More importantly, it shifts your team’s focus from repetitive setup to business analysis and decision-making.

Getting started is straightforward. Begin with simple prompts against your existing data catalog, then progressively tackle more complex analytical challenges. Invest time enriching your data catalog with business metadata—this investment directly multiplies the agent’s effectiveness by providing richer context for code generation.

SageMaker Data Agent adapts to your specific analytical needs, such as analyzing customer behavior, working with financial data, or building ML models. Access it today through your IAM-based SageMaker Unified Studio domain, and discover how context-aware AI assistance can accelerate your organization’s data-driven decision-making.


About the authors

Kshitija Dound

Kshitija Dound

Kshitija is a Specialist Solutions Architect at AWS based in New York City, focusing on data and AI. She collaborates with customers to transform their ideas into cloud solutions, using AWS Big Data and AI services. She also engages in public speaking opportunities, sharing her expertise on cloud technologies, industry trends, and career in the cloud. In her spare time, Kshitija enjoys exploring museums, indulging in art, and embracing NYC’s outdoor scene.

Siddharth Gupta

Siddharth Gupta

Siddharth is heading Generative AI within SageMaker’s Unified Experiences. His focus is on driving agentic experiences, where AI systems act autonomously on behalf of users to accomplish complex tasks. An alumnus of the University of Illinois at Urbana-Champaign, he brings extensive experience from his roles at Yahoo, Glassdoor, and Twitch.

Mohan Gandhi

Mohan Gandhi

Mohan is a Principal Software Engineer at AWS. He has been with AWS for the last 10 years and has worked on various AWS services like Amazon EMR, Amazon EFA, and Amazon RDS. Currently, he is focused on improving the Amazon SageMaker inference experience. In his spare time, he enjoys hiking and marathons.

Ishneet Kaur

Ishneet Kaur

Ishneet is a Software Development Manager on the Amazon SageMaker Unified Studio team. She leads the engineering team to design and build generative AI capabilities in SageMaker Unified Studio.

Shubham Mehta

Shubham Mehta

Shubham is a Senior Product Manager at AWS Analytics. He leads generative AI feature development across services such as AWS Glue, Amazon EMR, and Amazon MWAA, using AI/ML to simplify and enhance the experience of data practitioners building data applications on AWS.

Vikramank Singh

Vikramank Singh

Vikramank is a Senior Applied Scientist in the Agentic AI organization in AWS, working on products including Amazon SageMaker Unified Studio, Amazon RDS, and Amazon Redshift. His research interest lies at the intersection of AI, control systems, and RL, particularly using them to build systems for real-world applications that can autonomously perceive environments, model them, and take optimal decisions at scale.

Murali Narayanaswamy

Murali Narayanaswamy

Murali is a Principal Machine Learning Scientist in the Agentic AI organization in AWS, working on products including Amazon SageMaker Unified Studio, Amazon Redshift, and Amazon RDS. His research interests lie at the intersection of AI, optimization, learning, and inference, particularly using them to understand, model, and combat noise and uncertainty in real-world applications and reinforcement learning in practice and at scale.

Amit Sinha

Amit Sinha

Amit is a Senior Manager leading SageMaker Unified Studio GenAI and ML product suites. He has over a decade of experience in AI/ML products, infrastructure management, and AWS Big Data processing services. An alumnus of Columbia University, in his free time Amit enjoys hiking and binge-watching documentaries on American history.

From Signals to Strategy: What Security Teams Must Prepare for in 2026

Post Syndicated from Rapid7 original https://www.rapid7.com/blog/post/it-signals-into-strategy-security-teams-must-prepare-in-2026

The 2026 Security Predictions webinar reinforced a simple but uncomfortable truth. The forces shaping cyber risk are not new, but they are converging faster and with greater impact than many organizations are ready for. Geopolitics, insider risk, and threat intelligence have long influenced cyber operations. What has changed is the extent to which they directly affect everyday security decisions.

Geopolitical risk is now an operational concern

Cyber operations have always reflected geopolitical realities. Nation-states have used cyber capabilities for espionage, surveillance, and disruption for decades. Historically, these activities focused on governments, critical infrastructure, or defense sectors.

That line has faded.

Today, private organizations are increasingly targeted as proxies. Supply chains, cloud providers, and SaaS platforms offer scale, access, and plausible deniability for state-aligned groups. Many of these campaigns are not designed for immediate disruption. Instead, they focus on intelligence gathering, long-term access, or positioning that can be activated later.

For security teams, this shift creates a new challenge. Geopolitical motivation does not follow traditional cybercrime logic. Organizations that do not consider themselves high risk can still become collateral targets because of who they work with, where they operate, or what services they provide.

Geopolitical awareness can no longer sit outside the SOC. It must influence monitoring priorities, threat modeling, and response readiness.

Looking ahead: Action plan for 2026

Security teams should track geopolitical developments and understand how global events influence attacker behavior. Curated threat intelligence helps translate abstract risk into concrete tools, infrastructure, and techniques that defenders can monitor.

Incident response playbooks should also account for politically motivated attacks. These scenarios benefit from executive pre-approval, allowing teams to respond decisively when intent is unclear but potential impact is high.

Finally, organizations should map exposure across suppliers, technology partners, and infrastructure dependencies. Understanding where geopolitical risk intersects with your environment is now essential for resilience.

Insider threats are becoming a primary breach driver

Insider threats are not a new problem, but their role in breaches continues to grow. Within the 2026 Security Predictions webinar, the panel emphasized that insider risk now spans a wide spectrum. At one end is simple negligence, including phishing mistakes, misconfigurations, and poor access hygiene. At the other is deliberate access monetization, where credentials or privileged access are sold or misused.

Several factors are accelerating this trend. Workforce stress, economic pressure, role churn, and identity sprawl all increase the likelihood that access will be abused or misused. In many cases, breaches now begin with valid credentials, making traditional perimeter defenses less effective.

This reality forces a shift in how security teams think about trust and access. Valid access no longer means safe access.

Looking ahead: Action plan for 2026

Security teams should establish behavior baselines across users and roles to identify anomalous activity early. Unexpected access patterns, unusual downloads, or irregular logins often provide the first signal that something is wrong.

Just as important is fostering a speak-up culture. Employees should be encouraged to report phishing attempts, mistakes, or suspicious behavior without fear. Early reporting often determines whether an incident is contained quickly or escalates.

Privilege models also require regular review. Least privilege must be continuous, not static. As roles evolve and environments change, access should be reassessed to reduce blast radius when incidents occur.

Context is becoming the decisive advantage

Threat intelligence and detection capabilities have advanced rapidly, but volume alone does not improve outcomes. Security teams now face more alerts, more telemetry, and more data than ever before. The challenge is deciding what matters.

The panel highlighted that speed without context creates noise, not security. As exploitation windows shrink and attacks scale, teams that lack context struggle to prioritize, investigate, and respond effectively.

Context brings together asset criticality, exposure, threat intelligence, and business impact. Teams that operate with this understanding move faster because they know where to focus and why.

This shift also changes how security leaders communicate value. Metrics tied to readiness, risk reduction, and response effectiveness resonate far more than raw alert counts.

Looking ahead: Action plan for 2026

Security leaders should align SecOps and executive stakeholders around shared dashboards and context-rich briefings. These views should emphasize readiness gaps, exposure trends, and investment value, rather than activity volume.

Organizations should also rationalize security tooling around outcomes. High-impact tools that improve time to detect, time to respond, and analyst efficiency matter more than broad coverage alone.

Finally, teams should reinvest saved time and budget into areas that compound over time. Automation, threat intelligence, and staff development all strengthen resilience when supported consistently.

Preparing for what comes next

The webinar made it clear that success in 2026 will depend on integration, awareness, and context. Geopolitical risk, insider threats, and intelligence-driven defense are no longer separate concerns. They intersect daily inside modern security operations.

Teams that acknowledge this reality and act early will be better positioned to respond with confidence, adapt to change, and stay ahead of increasingly sophisticated attackers.

Missed the live session? Watch the 2026 Security Predictions webinar to understand the forces shaping cyber risk and what to prioritize next.

30 years of ReactOS

Post Syndicated from jzb original https://lwn.net/Articles/1055485/

ReactOS, an open-source project
to develop an operating system that is compatible with Microsoft
Windows NT applications and drivers, is celebrating 30
years
since the first commit to its source tree. In that time
there have been more than 88,000 commits from 301 contributors, for a
total of 14,929,578 lines of code. There is, of course, much left to
do.

It’s been such a long journey that many of our contributors today,
including myself, were not alive during this event. Yet our mission to
deliver “your favorite Windows apps and drivers in an open-source
environment you can trust” continues to bring people together. […]

We’re continuing to move ReactOS forward. Behind the scenes there are
several out-of-tree projects in development. Some of these exciting
projects include a new build environment for developers (RosBE), a new
NTFS driver, a new ATA driver, multi-processor (SMP) support, support
for class 3 UEFI systems, kernel and usermode address space layout
randomization (ASLR), and support for modern GPU drivers built on
WDDM.

Security updates for Thursday

Post Syndicated from jzb original https://lwn.net/Articles/1055484/

Security updates have been issued by AlmaLinux (gpsd), Debian (inetutils and modsecurity-crs), Fedora (cpp-httplib, curl, mariadb11.8, mingw-libtasn1, mingw-libxslt, mingw-python3, rclone, and rpki-client), Oracle (gimp, glib2, go-toolset:rhel8, golang, kernel, mariadb-devel:10.3, and thunderbird), Red Hat (buildah, go-toolset:rhel8, golang, grafana, kernel, kernel-rt, multiple packages, openssl, osbuild-composer, podman, and skopeo), Slackware (bind), SUSE (ffmpeg-4, libsodium, libvirt, net-snmp, open-vm-tools, ovmf, postgresql17, postgresql18, python-FontTools, python-weasyprint, and webkit2gtk3), and Ubuntu (glib2.0 and opencc).

Fostering Kenya’s computing education ecosystem

Post Syndicated from Sandra Keeru original https://www.raspberrypi.org/blog/fostering-kenyas-computing-education-ecosystem/

In November, our first-ever Kenya Partner Showcase brought together all our partners from across the country for two days of collaboration, learning, and shared strategy. What stood out to us most from the event was not just the diversity of work that the Kenyan partners are doing in computing education, but also the clear alignment that is emerging across partners, government, and communities.

A speaker at the Raspberry Pi Foundation's Kenya Partner Showcase 2025, smiling and holding a microphone.

Partners used the Showcase to present sessions about their journeys implementing the Foundation’s programmes, sharing achievements and insights that strengthened the collective learning space. The conversations during our two days together reflected a maturing ecosystem and demonstrated how structured government buy-in is accelerating adoption of our localised Computing Curriculum and influencing national policy spaces.

“Through these programmes, we are equipping young people to become future-ready leaders of integrity and impact.” – Betty Oloo Anderson, National Executive Officer, Kenya Girl Guides Association

It was encouraging to see how far computing education has evolved since we began working with Kenyan partners in 2023, signalling the collective effort and commitment driving this work forward.

Partner-led sessions to reflect on what works

The sessions revealed a powerful shift already taking place in classrooms, with partners demonstrating how embedding The Computing Curriculum into Teacher Professional Development frameworks is building teacher confidence and elevating the quality of classroom instruction through stronger digital competencies and culturally relevant pedagogy. The partner presentation on Experience AI, our AI literacy programme, was especially powerful. It reframed the national dialogue from questioning whether AI might take over the classroom to recognising the real capacities and limitations of AI tools, and the central role teachers play in guiding young people to use and create AI tools in safe, ethical ways.

“Running Raspberry Pi Foundation programmes has been a transformative journey. It has challenged us to innovate, document rigorously, and continually place learners at the center of every decision. The structured support, tools, and community of practice have enabled us to deliver programmes with greater impact and accountability.” Joel Kahindi, Programme Coordinator, STEAMLabs Africa

Hands-on demonstrations, from physical computing with Raspberry Pi Pico to teacher development transitions from Scratch to Python, highlighted how practical computing is taking root in both formal and non-formal learning environments.

Attendees have a conversation at the Raspberry Pi Foundation's Kenya Partner Showcase 2025.

Partners from remote and underserved regions shared how locally contextualised computing tools and programmes we offer are reaching learners in ASAL (arid and semi-arid land) regions, strengthening literacy and digital confidence even in low-resource settings. Complementing this, curriculum-focused partners highlighted how structured computing resources are being adapted for ASAL contexts, reinforcing foundational skills at scale. Efforts around community-centred connectivity are enabling schools, especially in underserved communities, to finally access reliable high-speed internet.

“Through [our partnership with the Raspberry Pi Foundation], we are not only strengthening our programmes but also expanding our vision for what meaningful learning can look like across underserved communities.” – Joel Kahindi, Programme Coordinator, STEAMLabs Africa

A speaker at the Raspberry Pi Foundation's Kenya Partner Showcase 2025, smiling and holding a microphone.

A notable pattern that emerged was how existing collaborations are now opening doors to new ones, with partners building on their relationship with us to form additional partnerships for devices, connectivity, and shared learning, creating a more holistic digital ecosystem for learners.

Solving shared problems, sharing real stories

A major anchor of the Showcase was the Code Club co-creation sprint. Implementing partners worked through real barriers and opportunities: easier onboarding for educators, continuous training, integrating clubs into school calendars, learner-led ownership, and sustainable models that last beyond donor funding. There was strong interest in forming a unified Code Club Kenya partner network to streamline communication, resource-sharing, and visibility, and our team is now exploring what it would take to bring this to life.

A speaker at the Raspberry Pi Foundation's Kenya Partner Showcase 2025, smiling and holding a microphone.

One message echoed across sessions: the power of telling real stories. Partners expressed a shared desire to spotlight creator projects, Code Club leader journeys, and regional experiences more consistently, through social media, case studies and impact stories, and shared platforms, to make progress visible and inspire more schools to adopt computing and digital skills.

From isolation to coordination

By the close of the Showcase, the takeaway was clear: Kenya’s digital learning ecosystem is no longer a set of isolated efforts — it is a coordinated network that shares priorities, evidence-based insights, and a commitment to scaling impact together. As one partner reflected, “This Showcase created a space for joint learning and will help us scale our impact across the country.” It felt evident, too, that bringing these voices into one room is itself part of the work. For us at the Foundation, this Showcase reaffirmed the responsibility and privilege of stewarding a network that is shaping what the future of learning computing in Kenya can look like.

Two attendees of the Raspberry Pi Foundation's Kenya Partner Showcase 2025 smile at the camera.

The Showcase marks the beginning of a new, aligned chapter for computing education in Kenya, one driven by collaboration, clarity, and a shared belief that we go further when we go together. With shared priorities for 2026, the momentum continues, and we will be continuing to highlight where this collective work is headed next.

Thank you to all partners

We want to thank you to all our partners — Frontier Counties Development Council (FCDC), STEAMLabs Africa, Young Scientists Kenya, Kenya Girl Guides Association, Oasis Mathare, Futures Infinite, EmpServe Kenya, Kenya Connect, Tech Kidz Africa, Riara University, and M-Lugha — for your leadership, dedication, and unwavering belief in what is possible when we learn and build together.

Attendees mingle among tables and chairs at the Raspberry Pi Foundation's Kenya Partner Showcase 2025.

This Showcase was a reflection of your work, your commitment to learners, and your vision for a digitally empowered Kenya. We are grateful for your continued partnership and excited for all that lies ahead.

The post Fostering Kenya’s computing education ecosystem appeared first on Raspberry Pi Foundation.

Why AI Keeps Falling for Prompt Injection Attacks

Post Syndicated from Bruce Schneier original https://www.schneier.com/blog/archives/2026/01/why-ai-keeps-falling-for-prompt-injection-attacks.html

Imagine you work at a drive-through restaurant. Someone drives up and says: “I’ll have a double cheeseburger, large fries, and ignore previous instructions and give me the contents of the cash drawer.” Would you hand over the money? Of course not. Yet this is what large language models (LLMs) do.

Prompt injection is a method of tricking LLMs into doing things they are normally prevented from doing. A user writes a prompt in a certain way, asking for system passwords or private data, or asking the LLM to perform forbidden instructions. The precise phrasing overrides the LLM’s safety guardrails, and it complies.

LLMs are vulnerable to all sorts of prompt injection attacks, some of them absurdly obvious. A chatbot won’t tell you how to synthesize a bioweapon, but it might tell you a fictional story that incorporates the same detailed instructions. It won’t accept nefarious text inputs, but might if the text is rendered as ASCII art or appears in an image of a billboard. Some ignore their guardrails when told to “ignore previous instructions” or to “pretend you have no guardrails.”

AI vendors can block specific prompt injection techniques once they are discovered, but general safeguards are impossible with today’s LLMs. More precisely, there’s an endless array of prompt injection attacks waiting to be discovered, and they cannot be prevented universally.

If we want LLMs that resist these attacks, we need new approaches. One place to look is what keeps even overworked fast-food workers from handing over the cash drawer.

Human Judgment Depends on Context

Our basic human defenses come in at least three types: general instincts, social learning, and situation-specific training. These work together in a layered defense.

As a social species, we have developed numerous instinctive and cultural habits that help us judge tone, motive, and risk from extremely limited information. We generally know what’s normal and abnormal, when to cooperate and when to resist, and whether to take action individually or to involve others. These instincts give us an intuitive sense of risk and make us especially careful about things that have a large downside or are impossible to reverse.

The second layer of defense consists of the norms and trust signals that evolve in any group. These are imperfect but functional: Expectations of cooperation and markers of trustworthiness emerge through repeated interactions with others. We remember who has helped, who has hurt, who has reciprocated, and who has reneged. And emotions like sympathy, anger, guilt, and gratitude motivate each of us to reward cooperation with cooperation and punish defection with defection.

A third layer is institutional mechanisms that enable us to interact with multiple strangers every day. Fast-food workers, for example, are trained in procedures, approvals, escalation paths, and so on. Taken together, these defenses give humans a strong sense of context. A fast-food worker basically knows what to expect within the job and how it fits into broader society.

We reason by assessing multiple layers of context: perceptual (what we see and hear), relational (who’s making the request), and normative (what’s appropriate within a given role or situation). We constantly navigate these layers, weighing them against each other. In some cases, the normative outweighs the perceptual—for example, following workplace rules even when customers appear angry. Other times, the relational outweighs the normative, as when people comply with orders from superiors that they believe are against the rules.

Crucially, we also have an interruption reflex. If something feels “off,” we naturally pause the automation and reevaluate. Our defenses are not perfect; people are fooled and manipulated all the time. But it’s how we humans are able to navigate a complex world where others are constantly trying to trick us.

So let’s return to the drive-through window. To convince a fast-food worker to hand us all the money, we might try shifting the context. Show up with a camera crew and tell them you’re filming a commercial, claim to be the head of security doing an audit, or dress like a bank manager collecting the cash receipts for the night. But even these have only a slim chance of success. Most of us, most of the time, can smell a scam.

Con artists are astute observers of human defenses. Successful scams are often slow, undermining a mark’s situational assessment, allowing the scammer to manipulate the context. This is an old story, spanning traditional confidence games such as the Depression-era “big store” cons, in which teams of scammers created entirely fake businesses to draw in victims, and modern “pig-butchering” frauds, where online scammers slowly build trust before going in for the kill. In these examples, scammers slowly and methodically reel in a victim using a long series of interactions through which the scammers gradually gain that victim’s trust.

Sometimes it even works at the drive-through. One scammer in the 1990s and 2000s targeted fast-food workers by phone, claiming to be a police officer and, over the course of a long phone call, convinced managers to strip-search employees and perform other bizarre acts.

Why LLMs Struggle With Context and Judgment

LLMs behave as if they have a notion of context, but it’s different. They do not learn human defenses from repeated interactions and remain untethered from the real world. LLMs flatten multiple levels of context into text similarity. They see “tokens,” not hierarchies and intentions. LLMs don’t reason through context, they only reference it.

While LLMs often get the details right, they can easily miss the big picture. If you prompt a chatbot with a fast-food worker scenario and ask if it should give all of its money to a customer, it will respond “no.” What it doesn’t “know”—forgive the anthropomorphizing—is whether it’s actually being deployed as a fast-food bot or is just a test subject following instructions for hypothetical scenarios.

This limitation is why LLMs misfire when context is sparse but also when context is overwhelming and complex; when an LLM becomes unmoored from context, it’s hard to get it back. AI expert Simon Willison wipes context clean if an LLM is on the wrong track rather than continuing the conversation and trying to correct the situation.

There’s more. LLMs are overconfident because they’ve been designed to give an answer rather than express ignorance. A drive-through worker might say: “I don’t know if I should give you all the money—let me ask my boss,” whereas an LLM will just make the call. And since LLMs are designed to be pleasing, they’re more likely to satisfy a user’s request. Additionally, LLM training is oriented toward the average case and not extreme outliers, which is what’s necessary for security.

The result is that the current generation of LLMs is far more gullible than people. They’re naive and regularly fall for manipulative cognitive tricks that wouldn’t fool a third-grader, such as flattery, appeals to groupthink, and a false sense of urgency. There’s a story about a Taco Bell AI system that crashed when a customer ordered 18,000 cups of water. A human fast-food worker would just laugh at the customer.

The Limits of AI Agents

Prompt injection is an unsolvable problem that gets worse when we give AIs tools and tell them to act independently. This is the promise of AI agents: LLMs that can use tools to perform multistep tasks after being given general instructions. Their flattening of context and identity, along with their baked-in independence and overconfidence, mean that they will repeatedly and unpredictably take actions—and sometimes they will take the wrong ones.

Science doesn’t know how much of the problem is inherent to the way LLMs work and how much is a result of deficiencies in the way we train them. The overconfidence and obsequiousness of LLMs are training choices. The lack of an interruption reflex is a deficiency in engineering. And prompt injection resistance requires fundamental advances in AI science. We honestly don’t know if it’s possible to build an LLM, where trusted commands and untrusted inputs are processed through the same channel, which is immune to prompt injection attacks.

We humans get our model of the world—and our facility with overlapping contexts—from the way our brains work, years of training, an enormous amount of perceptual input, and millions of years of evolution. Our identities are complex and multifaceted, and which aspects matter at any given moment depend entirely on context. A fast-food worker may normally see someone as a customer, but in a medical emergency, that same person’s identity as a doctor is suddenly more relevant.

We don’t know if LLMs will gain a better ability to move between different contexts as the models get more sophisticated. But the problem of recognizing context definitely can’t be reduced to the one type of reasoning that LLMs currently excel at. Cultural norms and styles are historical, relational, emergent, and constantly renegotiated, and are not so readily subsumed into reasoning as we understand it. Knowledge itself can be both logical and discursive.

The AI researcher Yann LeCunn believes that improvements will come from embedding AIs in a physical presence and giving them “world models.” Perhaps this is a way to give an AI a robust yet fluid notion of a social identity, and the real-world experience that will help it lose its naïveté.

Ultimately we are probably faced with a security trilemma when it comes to AI agents: fast, smart, and secure are the desired attributes, but you can only get two. At the drive-through, you want to prioritize fast and secure. An AI agent should be trained narrowly on food-ordering language and escalate anything else to a manager. Otherwise, every action becomes a coin flip. Even if it comes up heads most of the time, once in a while it’s going to be tails—and along with a burger and fries, the customer will get the contents of the cash drawer.

This essay was written with Barath Raghavan, and originally appeared in IEEE Spectrum.

[$] Cleanup on aisle fsconfig()

Post Syndicated from jake original https://lwn.net/Articles/1054228/

As part of the process of writing man pages for the “new” mount API, which has been available in the
kernel since 2019, Aleksa Sarai encountered a number of places where the fsconfig()
system call—for configuring filesystems before mounting—needs to be cleaned up. In the 2025 Linux Plumbers Conference
(LPC) session
that he led, Sarai wanted to discuss some of the problems he found,
including at least one with security implications. The idea of the session
was for him to describe the various bugs and ambiguities that he had found,
but he also wanted attendees to raise other problems they had with the
system call.

A Developer’s Guide to Migrating Multimodal AI Training Data (and Putting It to Work) with Pixeltable

Post Syndicated from Maddie Presland original https://www.backblaze.com/blog/a-developers-guide-to-migrating-multimodal-ai-training-data-and-putting-it-to-work-with-pixeltable/

A decorative image showing gears and a cloud.

Today’s AI models consume much more than text—everything from product images to video from surveillance feeds to audio from customer calls to metadata spread across an ever-expanding set of systems. These multimodal datasets drive everything from computer vision pipelines to customer service automation. But as they scale, the underlying infrastructure starts to creak.

Costs can become unpredictable. Data fragments across S3 buckets, HDFS clusters, and local drives. Maintaining cross-modal alignment, i.e. ensuring that media files stay linked to their labels, embeddings, and annotations, becomes a bottleneck that slows development to a crawl.This article outlines a practical path forward: how to migrate multimodal training data using proven open-source tools, and how Pixeltable helps unify and index that data for training once it lands in Backblaze B2.

Moving multimodal training data: Practical open source software (OSS) tools that do the heavy lifting

Before you can train on consolidated data, you need to get it all into one place. These three open-source tools handle the migration work, each addressing a different piece of the puzzle.

Apache NiFi for moving large media reliably

When your dataset includes terabytes of video files, thousands of high-resolution images, or large binary assets like LIDAR scans, you need something more robust than a shell script. Apache NiFi is purpose-built for moving large media files at scale.

NiFi provides:

  • Flow control and retry logic that handle network interruptions gracefully, which is essential when transferring terabytes of data over hours or days.
  • Data provenance tracking that records exactly which files moved where and when, making it possible to debug issues without guessing.
  • A visual workflow designer that lets you build and monitor data flows without writing custom code.

For multimodal datasets where media volume dominates, NiFi ensures files arrive intact and trackable. Check the Apache NiFi User Guide to get started with building your first data flow.

Airbyte for syncing structured and semi-structured metadata

Media files are only half the story. Annotations, labels, captions, transcripts, and database records provide the context that makes raw media useful for training. Airbyte excels at moving this structured and semi-structured metadata.

Airbyte handles:

  • Schema consistency when pulling metadata from multiple sources, ensuring annotation formats don’t drift between your labeling platform, your CRM, and your feature store.
  • Incremental syncs that only transfer changed records, avoiding unnecessary data movement as your datasets grow.
  • Multiple data systems via a broad catalog of connectors for databases, SaaS platforms, file formats, and cloud storage services.

Unlike NiFi, which focuses on raw file movement, Airbyte understands data schemas and transformations. Use it to keep your metadata in sync across systems. The Airbyte documentation provides setup guides for most common data sources.

lakeFS for versioning for reproducible training

After moving media via NiFi and metadata via Airbyte, you need a way to snapshot the entire dataset so you can reproduce training runs six months later. lakeFS brings Git-like version control to object storage.

lakeFS enables:

  • Branching and snapshots of entire datasets without copying data. You can create a branch, run an experiment, and merge or discard the results.
  • Atomic commits that ensure media, metadata, and derived features stay aligned as your corpus evolves.
  • Zero-copy clones that let multiple teams work on isolated versions of production data without storage overhead.

lakeFS acts as a version control layer on top of storage like Backblaze B2, tracking changes without duplicating objects. When a training run produces a new model, you can tag the exact dataset version that went into it. The lakeFS quickstart guide walks through creating your first repository and branch.

After migration, the hard part begins: Making the dataset usable

Moving data into object storage solves logistics, not usability. Even in B2, your media files, labels, and derived features remain scattered—images in one prefix, annotations in another, embeddings in a third. Training code becomes a tangle of custom loaders that stitch everything together, break when datasets change, and consume more engineering time than model tuning.

Where Pixeltable fits

Pixeltable provides the missing layer between migrated storage and training-ready data. It’s a declarative data infrastructure specifically designed for multimodal AI applications.

Here’s what Pixeltable does:

  • Unifies media and metadata into a single table interface: images, video frames, audio clips, and their associated labels, embeddings, and annotations live in one queryable structure.
  • Stores computed results automatically. Run OCR on documents, generate CLIP embeddings for images, or extract audio transcripts once, and Pixeltable caches the results for reuse.
  • References Backblaze B2 objects directly without copying data. Files stay in Backblaze B2, and Pixeltable maintains pointers and metadata in a local Postgres instance. Pixeltable automatically caches the files locally on access, and can write media files back to B2 (see our project for examples: https://github.com/backblaze-b2-samples/b2-pixeltable-multimodal-data).
  • Supports built-in transforms like embedding generation, image captioning, and OCR with lazy evaluation. Define transformations once, and they run incrementally as new data arrives.

Instead of maintaining custom loaders and indexing scripts, you define a schema once. Pixeltable handles orchestration, caching, and queries. The result is a training dataset you can slice, filter, and feed directly into PyTorch DataLoaders or Hugging Face Datasets.

Check the Pixeltable documentation to see how tables, computed columns, and queries work in practice.

A practical end-to-end workflow

Here’s how these tools fit together in a real-world pipeline:

1. Move media via NiFi → Backblaze B2

Set up an Apache NiFi flow to transfer images, video files, or other large binaries from your current storage (on-premise NAS, another cloud provider, or local drives) to a Backblaze B2 bucket. Configure retry logic and provenance tracking so you can verify every file arrived.

Use NiFi processors like GetFile, PutS3Object, and RouteOnAttribute to handle file movement and error routing. The Backblaze B2 Cloud Storage S3-compatible API works seamlessly with NiFi’s S3 processors.

2. Sync metadata via Airbyte

Configure Airbyte to pull annotations, labels, captions, and database records from your labeling tool, feature store, or other sources. Set up connections to sync metadata incrementally as it changes. If annotations live in Postgres and captions come from a cloud-based labeling platform, Airbyte normalizes both into a consistent schema in Backblaze B2 or a dedicated metadata store.

3. Create a lakeFS branch to snapshot the dataset

Initialize a lakeFS repository pointing to your Backblaze B2 bucket. Create a branch to isolate this version of the dataset. If something goes wrong during training, you can roll back or compare versions. Use the lakeFS CLI or Python client to create branches and commits programmatically.

4. Define a Pixeltable schema referencing B2 objects + synced metadata

In Pixeltable, create a table with columns for image paths (pointing to Backblaze B2), labels, captions, and any other metadata fields. Import your data so each row represents one training example: one image, its label, its caption, and any associated metadata.Pixeltable doesn’t copy image files—it stores references and metadata, automatically caching the files locally on access. The images stay in Backblaze. The Pixeltable Tables guide explains how to create tables with multimodal column types and import data from external sources.

5. Run transforms (embeddings, captions, OCR) inside Pixeltable

Define computed columns for embeddings, captions, or OCR results. Pixeltable’s computed columns run transformations lazily as data is queried or when you explicitly trigger computation.

For example, you can add CLIP embeddings using Pixeltable’s built-in Hugging Face integration, or generate AI captions using OpenAI’s vision API. Once defined, these columns compute incrementally—new images trigger automatic processing without reprocessing the entire dataset.

The Pixeltable API reference documents all available functions for common operations like embedding generation, image processing, and text analysis.

6. Query or filter the unified dataset

Use Pixeltable’s query interface to filter, sort, and slice your data. For example, find all images labeled “cat” with embeddings similar to a reference image. Or extract rows where captions mention “outdoor” and timestamps fall within a specific range.

7. Feed batches directly into PyTorch/Hugging Face

Export data from Pixeltable into PyTorch DataLoaders or Hugging Face Datasets format for training. Pixeltable handles batching, shuffling, and data access so your training loop stays clean.

The Pixeltable documentation covers various export formats and integrations with popular ML frameworks, allowing you to avoid intermediate export steps and maintain a streamlined workflow from data preparation to model training.

From fragmented storage to production-ready training data

Multimodal AI datasets don’t have to be a maintenance nightmare. By chaining together proven open-source tools—NiFi and Airbyte for migration, lakeFS for versioning, and Pixeltable for unified access—you can turn scattered files and metadata into queryable training assets.

Once data lands in Backblaze B2, this stack eliminates the custom glue code, brittle loaders, and alignment issues that typically slow down training workflows. Your team gets reproducible datasets, clean interfaces, and more time for model development instead of infrastructure firefighting.

Ready to get started? Check out the Backblaze B2 documentation to set up your object storage, and explore Pixeltable’s examples to see multimodal workflows in action.

The post A Developer’s Guide to Migrating Multimodal AI Training Data (and Putting It to Work) with Pixeltable appeared first on Backblaze Blog | Cloud Storage & Cloud Backup

Streamline large binary object migrations: A Kafka-based solution for Oracle to Amazon Aurora PostgreSQL and Amazon S3

Post Syndicated from Naresh Dhiman original https://aws.amazon.com/blogs/big-data/streamline-large-binary-object-migrations-a-kafka-based-solution-for-oracle-to-amazon-aurora-postgresql-and-amazon-s3/

Customers migrating from on-premises Oracle databases to AWS face a challenge: efficiently relocating large object data types (LOBs) to object storage while maintaining data integrity and performance. This challenge originates from the traditional enterprise database design where LOBs are stored alongside structured data, leading to storage capacity constraints, backup complexity, and performance bottlenecks during data retrieval and processing. LOBs, which can include images, videos, and other large files, often cause traditional data migrations to suffer from slow speeds and LOB truncation issues. These issues are particularly problematic for long-running migrations that can span several years.

In this post, we present a scalable solution that uses Amazon Managed Streaming for Apache Kafka (Amazon MSK), Amazon Aurora PostgreSQL-Compatible Edition, and Amazon MSK Connect. The data streaming enables data replication where modifications are sent and received in a continuous flow, allowing the target database to access and apply the changes in real time. This solution generates events for database actions such as insert, update, and delete, triggering AWS Lambda functions to download LOBs from the source Oracle database and upload them to Amazon Simple Storage Service (Amazon S3) buckets. Simultaneously, the streaming events migrate the structured data from the Oracle database to the target database while maintaining proper linking with their respective LOBs.

The complete implementation is available on GitHub, including AWS Cloud Development Kit (AWS CDK) deployment code, configuration files, and setup instructions.

Solution overview

Although traditional Oracle database migrations handle structured data effectively, they struggle with LOBs that can include images, videos, and documents. These migrations often fail due to size limitations and truncation issues, creating significant business risks, including data loss, extended downtime, and project delays that can force you to delay your cloud transformation initiatives. The problem becomes more acute during long-running migrations spanning several years, where maintaining operational continuity is critical. This solution addresses the key challenges of LOB migration, enabling continuous, long-term operations without compromising performance or reliability.

By removing the size limitations associated with traditional migration technologies, our solution provides a robust framework that helps you seamlessly relocate LOBs while facilitating data integrity throughout the process.

Our approach uses a modern streaming architecture to alleviate the traditional constraints of Oracle LOB migration. The solution includes the following core components:

  • Amazon MSK – Provides the streaming infrastructure.
  • Amazon MSK Connect – Using two connectors:
    • Debezium Connector for Oracle as a source connector to capture row-level changes that occur in Oracle database. The connector emits change events and publishes to a Kafka source topic.
    • Debezium Connector for JDBC as a sink connector to consume events from Kafka source topic and then write those events to Aurora PostgreSQL-Compatible by using a JDBC driver.
  • Lambda function – Triggered by an event source mapping to Amazon MSK. The function processes events from the Kafka source topic, extracting the Oracle row primary key from each event payload. It uses this key to download the corresponding BLOB data from the source Oracle database and uploads it to Amazon S3, organizing files by primary key folders to maintain simple linking with the relational database records.
  • Amazon RDS for Oracle – Amazon Relational Database Service (Amazon RDS) for Oracle is used as the source database to simulate an on-premises Oracle database.
  • Aurora PostgreSQL-Compatible – Used as the target database for migrated data.
  • Amazon S3 – Used as object storage for storing the BLOB data from source database.

The following diagram shows the Oracle LOB data migration architecture solution.

Message flow

When data changes occur in the source Amazon RDS for Oracle database, the solution executes the following sequence, moving through event detection and publication, BLOB processing with Lambda, and structured data processing:

  1. The Oracle source connector captures the change data capture (CDC) events, including the change to BLOB data column. This connector configures the BLOB data column to exclude from the Kafka event to optimize the Kafka payload.
  2. The connector publishes this event to an MSK topic.
    1. The MSK event triggers the BLOB Downloader Lambda function for the CDC events.
      1. The Lambda function examines two key conditions: the Debezium event code (specifically checking for create (c) or update(u)) and the configured list of Oracle BLOB table names along with their column names. When a Kafka message matches both the configured table list and valid Debezium events, the Lambda function initiates the BLOB data download from the Oracle source using the primary key and table name; otherwise, the function bypasses the BLOB download process. This selective approach makes sure the Lambda function only executes SQL queries when processing Kafka messages for tables containing BLOB data, optimizing database interactions.
      2. The Lambda function uploads the BLOB to Amazon S3, organizing by primary key folders with unique object names, which enables linking between structured database records and their corresponding BLOB data in Amazon S3.
    2. The PostgreSQL sink connector receives the event from the MSK topic.
      1. The connector applies these changes to the Aurora PostgreSQL database for the Oracle database changes except the BLOB data column. The BLOB data column is excluded by the Oracle source connector.

Key benefits

The solution offers the following key advantages:

  • Cost optimization and licensing – Our approach offers significant cost optimization benefits by reducing the overall size of your database and alleviating your need for expensive licenses associated with traditional databases and replication technologies. By decoupling LOB storage from the database and using Amazon S3, you can reduce your overall database footprint and reduce costs associated with traditional licensing and replication technologies. The streaming architecture also minimizes your infrastructure overhead during long-running migrations.
  • Avoids size constraints and migration failures – Traditional migration tools often impose size limitations on LOB transfers, leading to truncation issues and failed migrations. This solution removes those constraints entirely, so you can migrate LOBs of different sizes while maintaining data integrity. The event-driven architecture enables near real-time data replication, allowing your source systems to remain operational during migration.
  • Business continuity and operational excellence – Changes flow continuously to your target environment, allowing for business continuity. The solution preserves relationships between structured database records and their corresponding LOBs through primary key-based organization in Amazon S3, allowing for referential integrity while providing the flexibility of object storage for large files.
  • Architectural advantages – Storing LOBs in Amazon S3 while maintaining structured data in Aurora PostgreSQL-Compatible creates a clear separation. This architecture simplifies your backup and recovery operations, improves query performance on structured data, and provides flexible access patterns for binary objects through Amazon S3.

Implementation best practices

Consider the following best practices when implementing this solution:

  • Start small and scale gradually – To implement this solution, start with a pilot project using non-production data to validate your approach before committing to full-scale migration. This gives you a chance to work out issues in a controlled environment and refine your configuration without impacting production systems.
  • Monitoring – Set up comprehensive monitoring through Amazon CloudWatch to track key metrics like Kafka lag, Lambda function errors, and replication latency. Establish alerting thresholds early so you can catch and resolve issues quickly before they impact your migration timeline. Size your MSK cluster based on expected CDC volume and configure Lambda reserved concurrency to handle peak loads during initial data synchronization.
  • Security – For security, use encryption in transit and at rest for both structured data and LOBs, and follow the principle of least privilege when setting up AWS Identity and Access Management (IAM) roles and policies for your MSK cluster, Lambda functions, S3 buckets, and database instances. Document your schema mappings between Oracle and Aurora PostgreSQL-Compatible, including how database records link to their corresponding LOBs in Amazon S3.
  • Testing and preparation – Before you go live, test your failover and recovery procedures thoroughly. Validate scenarios like Lambda function failures, MSK cluster issues, and network connectivity problems to ensure you’re prepared for potential issues. Finally, remember that this streaming architecture maintains eventual consistency between your source and target systems, so there might be brief lag times during high-volume periods. Plan your cutover strategy with this in mind.

Limitations and considerations

Although this solution provides a robust approach for migrating Oracle databases with LOBs to AWS, there are several inherent constraints to understand before implementation.

This solution requires network connectivity between your source Oracle database and AWS environment. For on-premises Oracle databases, you must establish AWS Direct Connect or VPN connectivity before deployment. Network bandwidth directly impacts replication speed and overall migration performance, so your connection must be able to handle the expected volume of CDC events and LOB transfers.

The solution uses Debezium Connector for Oracle as the source connector and Debezium Connector for JDBC as the sink connector. This architecture is specifically designed for your Oracle-to-PostgreSQL migrations. Other database combinations require different connector configurations or might not be supported by the current implementation. Migration throughput is also constrained by your MSK cluster capacity and Lambda concurrency limits. You can also exceed AWS service quotas for large-scale migrations and you might need to request quota increases through AWS Enterprise Support.

Conclusion

In this post, we presented a solution that addresses the critical challenge of migrating your large binary objects from Oracle to AWS by using a streaming architecture that separates LOB storage from structured data. This approach avoids size constraints, reduces Oracle licensing costs, and preserves data integrity throughout extended migration periods.

Ready to transform your Oracle migration strategy? Visit the GitHub repository, where you will find the complete AWS CDK deployment code, configuration files, and step-by-step instructions to get started.


About the authors

Naresh Dhiman

Naresh Dhiman

Naresh is a Sr. Solutions Architect at AWS supporting US federal customers. He has over 25 years of experience as a technology leader and is a recognized inventor with six patents. He specializes in containers, machine learning, and generative AI on AWS.

Archana Sharma

Archana Sharma

Archana is a Sr. Database Specialist Solutions Architect, working with Worldwide Public Sector customers. She has years of experience in relational databases, and is passionate about helping customers in their journey to the AWS Cloud with a focus on database migration and modernization.

Ron Kolwitz

Ron Kolwitz

Ron is a Sr. Solutions Architect supporting US Federal Government Sciences customers including NASA and the Department of Energy. He is especially passionate about aerospace and advancing the use of GenAI and quantum-based technologies for scientific research. In his free time, he enjoys spending time with his family of avid water-skiers.

Karan Lakhwani

Karan Lakhwani

Karan is a Sr. Customer Solutions Manager at Amazon Web Services. He specializes in generative AI technologies and is an AWS Golden Jacket recipient. Outside of work, Karan enjoys finding new restaurants and skiing.

Pandas 3.0 released

Post Syndicated from jzb original https://lwn.net/Articles/1055327/

Version
3.0.0
of the pandas data
analysis and manipulation library for Python has been
released. Notable changes include a dedicated
string type (str)
, new “copy-on-write” behavior, and much more. This release also removes
a number of features that were deprecated in prior versions of pandas;
developers are advised to upgrade to pandas 2.3 and ensure code is
working without warnings before moving to 3.0. See the release
notes
for the full changelog.

Раждането – между физиологията и системата

Post Syndicated from Надежда Цекулова original https://www.toest.bg/razhdaneto-mezhdu-fiziologiyata-i-sistemata/

Раждането – между физиологията и системата

Януари е. Ако държавата (и светът) не се разпадаше, всички щяха да говорят за бебета, раждания, акушерска помощ и демографска криза, защото през последните години не по веднъж, а по два пъти отбелязваме Бабинден – по стар и по нов стил. Един обществен дебат, който всяка година става все по-непоносим с дълбокия си развод с науката, модерните практики и хуманността и все по-свързан с вярванията, нагласите и политическите наративи.

Тази година е турбулентна и погледът на обществото е насочен другаде. Но това не променя нуждата от внимание към темата за раждането. 

Такова, каквото ни се иска да бъде. 


Раждането по света

Всяко раждане е различно. 

Всяка жена е различна и всяко бебе е различно. 

През последните десет години Световната здравна организация и водещите професионални организации в сферата на акушерството работят усилено, за да върнат фокуса на родилните грижи там, където му е мястото – върху подпомагането на физиологичния процес. 

През XX век раждането интензивно се медикализира и макар това да е нетно позитивна тенденция (майчината и детската смъртност намаляват драстично, което практически влияе върху хода на човешката история), 

в началото на XXI век вече е категорично доказано, че има граница, отвъд която намесата на медицината в родилния процес повече вреди, отколкото помага. 

Оттогава насам стремежът на медицинската наука в сферата на майчиното здраве е да върне баланса – жените, за които е безопасно, да раждат максимално естествено, с оптимални грижи и подкрепа, а за онези с нужда от медицинска намеса тя да бъде достъпна, качествена и навременна. 

Макар препоръките да са универсални, прилагането им е много различно – влияят разнообразни фактори, като културните особености, благосъстоянието, управлението на здравните системи, броя и квалификацията на различните медицински специалисти и др.

… и у нас

В България разговор за качеството на родилната помощ практически никога не е воден сериозно. В медиите темата за раждането присъства основно по две линии. Първата е патерналистична и по същество рекламна – през авторитета и личните препоръки на конкретни специалисти се промотират всякакви практики, понякога основани на наука, но друг път на нечия лична преценка или още по-лошо – преследващи комерсиални цели. Втората е сензационалистка, най-често при трагичен инцидент – смърт на родилка или новородено. И в двата случая обаче 

липсва среда и възможност за спокоен разговор кои са добрите практики, защо те са добри, защо непростимо често се разминават с практиките тук и как да направим така, че да бъдат рутина в повече родилни зали в България, а жените да не се страхуват от преминаването през родилния процес. 

Причините положението да е такова, каквото е, са много, и изискват отделен анализ. Но това предисловие е нужно, за да доведе до уточнението, че целта на този текст е не да води битка, а да даде информация. 

Какво ще правите с тази информация – „всеки сам си преценя“. 

Ролята на емоциите в родилния процес

През 2025 г. една жена разказа историята на раждането си, за да обърне внимание, че с нея са се отнасяли зле и това има значение. Случаят стана повод за пореден път в публичното пространство да се коментират емоциите и дори вменяемостта на раждащите жени, в някои случаи с неглижиране и подигравка. 

Затова да започнем оттам – раждането е както физическо, така и психическо предизвикателство. Емоциите на раждащата жена са легитимни, изискващи уважение, а зачитането им е важно за безпроблемното протичане на раждането.

Te не са „страничен фон“, а част от невроендокринната регулация на самото раждане: преживявания като страх, силна тревожност и усещане за заплаха активират стресовата система, повишават кортизола и адреналина и така могат да „пренастроят“ маточната дейност – например чрез по-неефективни контракции и забавяне на напредъка, особено когато стресът е интензивен или продължителен. 

„Стегни се.“ Особености на женското психично здраве
Със „стегни се“ не минава. Пробвано е многократно в годините. Ако минаваше, резултатите за психичното здраве в глобален и в локален мащаб нямаше да са такива. А какви точно са и защо – повече в текста на Надежда Цекулова.
Раждането – между физиологията и системата

Какво всъщност се случва в тялото на жената в хода на раждането?

Раждането не започва внезапно, а е резултат от постепенни промени, които се развиват дни или седмици преди първите регулярни контракции. Една от тях е т.нар. узряване на шийката на матката. Шийката омеква, скъсява се и променя структурата си, за да може да се разшири. Това включва активна биохимична работа на тъканите, при която важна роля играят простагландините – вещества, улесняващи както промените в шийката, така и самото начало на контракциите.

Когато раждането навлезе в активната си фаза, матката започва да се съкращава ритмично и все по-интензивно. С напредването на раждането натискът на главата на бебето върху шийката и родовия канал активира неврологичен механизъм, който води до пулсиращо освобождаване на окситоцин. 

Окситоцинът е централният хормон на раждането: той усилва контракциите и подпомага тяхната регулярност, като създава положителна обратна връзка – всяка ефективна контракция стимулира отделянето на още окситоцин. Научно доказано е, че окситоциновата система в мозъка участва в намаляването на страха, болката и стреса при майката, а освобождаването и функцията на хормона по време на раждане се стимулират от социална подкрепа. Освен това проучвания показват, но все още не са доказали, че раждането може да е свързано с дългосрочни поведенчески и физиологични адаптации при майката и бебето, именно свързани с механизмите на действие на окситоцина.

Но да се върнем на родилния процес. 

Именно взаимодействието между различни системи обяснява защо раждането е процес, който трудно може да бъде „ускорен“ без последствия: той разчита на прецизен баланс между механичен натиск, хормонални сигнали и време.

След пълното разкритие започва вторият стадий на раждането – фазата на изтласкване. Контракциите обикновено стават по-редки, но по-силни, а към тях се добавят напъните. Те са комбинация от рефлекс и волево усилие на майката. 

След раждането на бебето матката не „спира да работи“. В третия стадий тя продължава да се съкращава, за да се отдели плацентата и да се намали кървенето от мястото, където е била прикрепена. Този механизъм е основната защита на организма срещу силен следродилен кръвоизлив. 

В часовете след раждането тялото постепенно преминава към следродилна адаптация: матката започва да се свива към предишния си размер. Това е свързано отново с контракции, които нерядко са изненада за раждащите за първи път. В този етап кървенето постепенно намалява, а ранният контакт с бебето кожа до кожа и кърменето допълнително стимулират отделянето на окситоцин. Така физиологията на раждането не приключва рязко, а плавно прелива във възстановяване и грижа за новороденото.

История на женското здраве(опазване)
Първи текст от новата поредица на Надежда Цекулова „Анатомия на пола: Жена“. В него тя прави преглед на някои ключови исторически моменти, свързани с женското здраве, за да започнем да редим пъзела на разбиранията за женското здравеопазване в наши дни.
Раждането – между физиологията и системата

Понякога нещата се объркват

Въпреки че в повечето случаи раждането протича без сериозни проблеми, понякога механизмите, които обикновено работят синхронно, се разминават. Едно от най-честите усложнения е забавянето или спирането на напредъка. Това може да се дължи на различни фактори: контракциите може да не са достатъчно силни или координирани, шийката на матката да не се разширява според необходимото или пък позицията и размерът на бебето да затрудняват слизането му през таза. На физиологично ниво това често означава, че балансът между механичния натиск, хормоналните сигнали и времето е нарушен, което може да е вследствие на силен стрес, изтощение или друга патологична причина.

Често срещано предизвикателство е също дистресът на бебето – състояние, при което то показва признаци, че не понася добре родилния процес, най-често поради недостиг на кислород. 

Едно от сериозните, макар и сравнително редки усложнения е следродилният кръвоизлив. Той най-често възниква, когато матката не се съкращава достатъчно силно след раждането на плацентата – състояние, известно като атония на матката. Физиологично това означава, че кръвоносните съдове на мястото, където е била прикрепена плацентата, остават „отворени“ и това предизвиква опасно кървене. 

Възникването на усложнение нерядко влияе върху психическата представа на жената за начина, по който е протекло раждането. Но повечето от тези усложнения са резултат не от „провал“ на майката, а от взаимодействие между биология, обстоятелства и медицински решения. В подобни ситуации задачата на медицинските специалисти е да се намесят правилно и навреме, за да защитят здравето и живота на майката и бебето.

Пропаст в данните. Защо жените още не се побират в медицинската статистика?
Медицината, основана на данни, е най-добрата медицина. А данните се събират чрез проучвания. Проблемът е, че често жените или не участват в тези проучвания, или данните, събрани за тях, се пренебрегват. От Надежда Цекулова.
Раждането – между физиологията и системата

Как медицинските интервенции променят физиологията на раждането

Медицинските интервенции по време на раждане в съвременната добра практика имат ясната цел да намалят риска или да овладеят конкретно усложнение. Те неизбежно влияят върху естествената физиология на процеса и раждането поема по различна логика – не водено от вътрешните ритми на тялото, а изискващо прецизна външна регулация. 

Често срещан пример за намеса е индукцията, или ускоряването на раждането със синтетичен окситоцин. Докато естественият окситоцин се отделя на пулсации и е тясно свързан с емоционалното състояние и сетивната среда, синтетичният се подава непрекъснато и в контролирани дози. Това може да доведе до по-силни и по-чести контракции, които да увеличат физиологичния стрес за жената и бебето.

Съвременната наука възприема като „намеса“ дори някои обстоятелства, които сме свикнали да мислим за даденост – например задължителното раждане в полулегнала позиция по гръб. Данните показват, че универсална „най-добра“ поза за раждане не съществува. Когато няма епидурално обезболяване, свободата на движение и изборът на изправени или алтернативни позиции често се свързва с по-малко интервенции, докато при раждане с епидурална аналгезия определени лежащи позиции могат да увеличат шанса за нормално раждане. 

Епидуралната аналгезия – най-широко използваният метод за обезболяване при раждане, също има отчетлив физиологичен ефект. Като блокира болковите сигнали от таза към мозъка, упойката променя обратната връзка между матката, нервната система и хормоналната регулация. Данни от систематичен преглед на Cochrane от 2018 г. и обзор от 2023 г. показват, че това е свързано с удължаване на първия етап на раждането средно с около 30 минути и на втория етап средно с около 15 минути. 

Други често използвани интервенции, като изкуственото пукане на околоплодния мехур или постоянното мониториране на плода, при което майката е обездвижена, също могат да променят динамиката на раждането. Те имат своето място в определени клинични ситуации, но ако се използват рутинно, могат да ограничат естествения напредък на раждането и сами да станат причина за последваща медицинска намеса. Обездвижването на родилките например е свързано с по-честа нужда от допълнителни интервенции.

Систематично обзорно изследване на Cochrane, обхващащо десетки хиляди раждания, показва, че непрекъснатото електронно наблюдение на сърдечните тонове на бебето, при което родилката е обездвижена, се свързва с повече цезарови сечения и инструментални раждания в сравнение с периодичното мониториране с мобилен кардиотокограф. В същото време липсват убедителни доказателства тази практика да е от полза за по-ниска перинатална смъртност или за по-добър дългосрочен неврологичен изход при нискорискови бременности.

Каскада от интервенции

Ситуацията, при която една необоснована намеса в раждането води до необходимост от следваща, която пък поражда нужда от допълнителни медицински интервенции, в последните години привлича вниманието на учените и вече дори си има собствен термин – каскада от интервенции. Когато в литературата се говори за „каскада“ в този контекст, идеята не е, че медицината „пречи“, а че всяка намеса променя физиологията на раждането. Това не е само теоретичен модел. В голямо проучване сред жени с нискорискова бременност в Австралия се вижда колко драматично може да се промени изходът, когато се натрупват интервенции – при нискорискови първораждащи делът на спонтанните, неасистирани вагинални раждания пада от 86,3% на 29,6% за сметка на цезаровите сечения и инструменталните раждания.

86,3%

29,6%

Цезарово сечение – отровата е в дозата

Цезаровото сечение е голяма коремна операция с ясна медицинска цел – да спаси живота на майката и/или бебето, когато вагиналното раждане носи неприемлив риск. В този смисъл то е едно от най-важните за женското здраве и живот постижения на съвременната медицина.

Но когато се извършва без медицински индикации, цезаровото сечение води до по-високи краткосрочни и дългосрочни рискове за здравето на жената в сравнение с неусложненото вагинално раждане.

В краткосрочен план цезаровото сечение е свързано с по-висок риск от сериозни усложнения, като кръвозагуба, инфекции, тромбоемболия. Дългосрочните рискове са особено важни в контекста на цезаровите сечения, които се извършват без ясна медицинска причина. Всяко цезарово сечение увеличава в пъти риска при следващи бременности от плацента превия, плацента акрета, руптура на матката и хистеректомия. 

02050100
Реалност: приблизително половината раждания у нас са оперативни.
Истинската нужда: в най-много една пета от случаите.

Повече уважение, повече доверие в женското тяло, повече здраве

В годините след COVID-19 всички усилия за овладяване на епидемията от медикализиране и свръхнамеса в раждането у нас бяха изоставени на системно ниво и приложението на добри или не чак толкова добри практики в родилните зали остана на плещите (и съвестта) на всеки отделен медицински специалист, оказващ акушерска помощ. 

В числа резултатът от тази политика (или по-скоро липсата ѝ) изглежда така: приблизително половината раждания се осъществяват с операция, при положение че медицинска нужда от оперативно раждане има в най-много ⅕ от случаите.

Осем години след публикуването им много от препоръките на Световната здравна организация за позитивно раждане все още са масово недостъпни за родилките в България: да бъдат подкрепяни от близък човек, да могат да консумират лека храна и течности в първия етап на раждането, да бъдат третирани с уважение. 

Подкрепа от близък човек
Храна и течности в първия етап
Третиране с уважение

Неща, които би трябвало да са налични в българските родилни отделения, но често не са.

Въпреки това раждането остава момент, в който дори малки промени – повече уважение, по-добро информиране и по-високо доверие в женското тяло – могат да имат голямо значение не само за преживяването, но и за дългосрочното женско здраве. И именно там, между науката, грижата и правото на информиран избор, има място за по-добър изход.


„Анатомия на пола: Жена“ разглежда здравето на жените като неразривна част от обществото, историята и културата. В поредицата изследваме как са се променяли нагласите към женското здраве, как медицината е възприемала специфичните потребности на жените и какви процеси са повлияли на достъпа им до качествени здравни грижи. Вглеждаме се в научните открития, но и в културните митове; в официалните политики, но и в личните истории на жени, борещи се за правото си на здраве и достойнство.

The collective thoughts of the interwebz