Post Syndicated from The History Guy: History Deserves to Be Remembered original https://www.youtube.com/watch?v=N0TrcWozBJA
US Declassifies Information on JUMPSEAT Spy Satellites
Post Syndicated from Bruce Schneier original https://www.schneier.com/blog/archives/2026/02/us-declassifies-information-on-jumpseat-spy-satellites.html
The US National Reconnaissance Office has declassified information about a fleet of spy satellites operating between 1971 and 2006.
I’m actually impressed to see a declassification only two decades after decommission.
Обединена Европа и европейската мечта
Post Syndicated from Искрен Иванов original https://www.toest.bg/obedinena-evropa-i-evropeyskata-mechta/
Световният мир не може да бъде запазен без съзидателни усилия, пропорционални на опасностите, които го грозят.

Тези думи произнася френският външен министър Роберт Шуман на 9 май 1950 г. – момента, в който се ражда идеята за Европейската общност за въглища и стомана. Краят на Втората световна война бележи края на европейските илюзии, че световният мир може да бъде постигнат, без да съществуват правила, с които той да се опазва.
Бившите колониални империи, владели векове наред глобалните ресурси и наложили правото на силата по всички континенти, са поставени на колене между двете суперсили – САЩ, които се превръщат в глобален кредитор на целия свят, и СССР, който разполага с близо тримилионна армия, готова да окупира останалата част от Стария континент.
Неслучайно в декларацията си Шуман поставя две условия за обединението на Европа: икономическата интеграция, с която най-сетне да се сложи край на френско-германското съперничество на континента, и подхода step-by-step, който предполага постепенно интегриране на европейските държави в едно цяло.
Днес Европа отново е обединена, но някак си безсилна да се противопостави на войните, които Великите сили водят, за да придобият глобално надмощие. Парадоксално, но не неочаквано, по-голямата част от човечеството избра да живее отново в условията на надпревара, а не на мир.
Какво стана с европейската стратегическа култура?
Стратегическото мислене на Европа винаги е било имперско – факт, видим както от историята на нашия континент, така и от стремежа му да се обедини. Проявленията на тази стратегическа култура придобиват различни форми, като се започне от Римската империя и нейната концепция за Mare Nostrum, мине се през средновековната идея за Imperium Christianum и се стигне до стремежа на европейските владетели да обединят Европа под своята корона.

По правило такъв тип геополитическо мислене неизбежно води до свят, в който войната се превръща в основен инструмент на държавната политика. Вестфалският мирен договор, Виенският конгрес и Версайско-Вашингтонската система от споразумения така и не успяват да победят европейския порив към власт, в който сякаш дреме сянката на древногръцкия стремеж към колонизация и опознаване на останалия свят.
Какво се промени след самоубийствената Втора световна война в Европа? Не, причината Европа да загуби бойния си дух не е само в разделението на Германия и поставянето на ресурсите ѝ под контрола на Европейската общност за въглища и стомана. Тя е в преосмислянето на имперската идея като цяло.
Идеологическият флаг на този преломен момент може да бъде открит не в Декларацията на Шуман, а в творчеството на Макс Хоркхаймер и Теодор Адорно, които полагат основите на диалектиката на Просвещението. Тази система от идеи цели да противодейства на старите доктрини за създаването на Свещена римска империя или за възстановяването на Древния Рим, тъй като Хоркхаймер и Адорно виждат в тях причината за възхода на националсоциализма и расистката му политика.
В следващите десетилетия диалектиката на Просвещението постепенно залива Европа, формирайки европейската интеграция като светски, напълно автономен от религията процес, чиято крайна цел е икономическото, а не политическото обединение на Общността. Крайната цел се състои в окончателното лишаване на западните общества от имперското им мислене и провеждането на мирна културна революция, която да промени стратегическата им култура завинаги.
В САЩ тези идеи не успяват да пробият до края на Студената война поради силното пуританско крило в американската външна политика и необходимостта от сдържането на СССР. В Европа обаче те проникват изключително лесно, което кара европейските елити да предлагат смели проекти за политическо обединение, които така и не биват реализирани. Пример в това отношение е опитът на държавите членки да създадат Европейско политическо сътрудничество, което в крайна сметка става факт през 70-те години на миналия век, но се свежда единствено до създаването на общи механизми за неформални консултации в Европейската икономическа общност.
Но дори когато европейският проект е спасен благодарение на Единния европейски акт и възкръсва като Европейски съюз с Договора от Маастрихт през 1992 г., гласовете на политиците, които повдигат въпроса за създаването на европейска армия, биват заглушени заради опасенията от завръщането на европейския национализъм.
Така след края на Студената война европейската стратегическа култура окончателно се разпада на отделни национални единици, които въпреки разширяването на ЕС все повече се отдалечават от завета на европейските бащи основатели.

Възможно ли е европейската стратегическа култура да бъде съживена?
Разпадът на европейската стратегическа култура поради невъзможността на Европа да създаде собствена армия е сходен с началото на упадъка в хегемонията на САЩ, които след края на Студената война постепенно губят усещането къде са границите на тяхната сила. Изчезването на СССР от картата на света и отпадането на необходимостта от идеологическо сдържане превръща Запада в най-силният актьор в системата на международните отношения, като същевременно полага основите на неговия упадък.
Причината е, че когато нямаш срещу какво да се бориш, лесно се увличаш от собствената си възможност да проектираш сила в глобален план. В този смисъл имперската метафора е най-неподходящият начин да опишем САЩ и Европа след разпада на СССР. Империите не проектират сила просто като я налагат, но и като конвертират нагласите на завладените територии, асимилирайки културата им.
Все едно да кажеш, че за няколко години българите станаха толерантни европейци по манталитет или пък предприемчиви, работещи хора, подобно на американците. В много отношения изкуственото създаване на постсоциалистически елити разора почвата за поникването на хибридни модели на демокрации, чиито последствия виждаме днес.
България в Европа и Европа срещу света – къде сме в технологичното състезание?
Аналогово спокойствие в съвършено обезпечен дигитален свят звучи като светло бъдеще. За да го постигнем, трябва да си го представим, а после и да участваме активно в изграждането му. Засега ЕС и България изостават от технологичната надпревара. Каква е общата картина – от Александър Нуцов.
 Александър Нуцов

В този смисъл упадъкът в европейската външна политика започна, когато ЕС се опита да се върне към имперското си мислене чрез трансформирането на нагласите и културните ценности на своите държави членки. Така се сбъдна историческото пророчество на диалектиката на Просвещението: че Европа ще се завърне към имперското си минало, както и САЩ, които направиха няколко несполучливи геополитически експеримента в Близкия изток.
Ето защо първата стъпка към истинското обединение на Европа и Запада е именно отказът от стратегическата култура на империализма, която цели овладяването на цялото земно кълбо под флага на една идеология. Ако се замислим, така се провали и СССР и можем само да се надяваме, че Европейският съюз няма да допусне същата грешка.
И тук идват следващите крачки за изпълнението на тази цел, при които трябва да сме наясно с една много важна разлика – отказът от империалистката стратегическа култура не следва да се търси нито в крайнолевите, нито в крайнодесните идеологии на нашето време. Да се откажеш от такова мислене означава две неща. Първо, да спреш да изнасяш ценности, опитвайки се да ги наложиш по цялото земно кълбо, претендирайки, че те са универсални, общовалидни и носители на мир. Второ, да загърбиш расизма, ксенофобията, антисемитизма и всички пороци на миналото, които спиралата на историята е осъдила на трибунала в Нюрнберг, в съдебния процес срещу Айхман и на международните трибунали срещу геноцида в Руанда и Сребреница.
Пътят към постигането на тази цел минава през секуларизацията на европейската политика и проектирането на сила в рамките на европейската отбранителна идентичност единствено в Западното полукълбо. Уви, това неизбежно ще наложи както свиването на средната класа в Европа, така и отказ от по-нататъшно разширяване на ЕС. За жалост, на много от тези цели днес се гледа с огромна доза недоверие и дори скептицизъм, тъй като идеологическият порив, за който говорят Хоркхаймер и Адорно, очевидно отново е обзел Стария континент.
И все пак къде е днес Европа?
Нашият съюз днес е вплетен в рамките на геополитическата надпревара, като европейските елити дори не подозират, че невъзможността ни да се защитаваме е добра новина както за Китай и Русия, така и за САЩ. За да създадем отбранителни способности, са необходими преди всичко много пари, но най-вече формиране на нова стратегическа култура, която да положи основите на федерализацията на Европа. Важно е да подчертаем, че за да се предпази от „изкушенията“, за които говорят Хоркхаймер и Адорно – неоколониализъм, културна хегемония, ценностен универсализъм, реакционен традиционализъм, – ЕС следва преди всичко да се федерализира икономически и военно, а не политически.
Политическата интеграция на Европа може да се окаже опасен ход, който да я върне обратно в 30-те години на XX век, а и обективно погледнато, толкова голям политически консенсус все още няма. Статистиките сочат такъв консенсус единствено в Прогресивния алианс на социалистите и демократите, а в Европейската народна партия нагласите са по-скоро разделени. По сходен начин стоят нещата в Германия и Италия, където общественото мнение е разделено, а значителен дял от французите все още не смятат, че Европа е готова да се федерализира.
(Не)демократичният световен ред
Защо е необходимо да се борим за оцеляването на демокрацията? Надали само защото нищо по-добро не е измислено. От Искрен Иванов.
 Искрен Иванов

Официалните данни на Евробарометър не показват широк обществен консенсус за по-дълбока политическа интеграция. В ключови държави, като Германия, Италия и Франция, подкрепата за ЕС остава колеблива, доверието към институциите е около или под 50%, а мнозинството от гражданите не смята, че ЕС се движи в правилната посока. Дори при висока подкрепа за отделни общи политики – като европейска отбрана – липсва обществена основа за скок към федерална политическа структура.
Следователно, за да се избегне изкушението на идеологическите крайности, е добре Европа преди всичко да се погрижи за своята икономическа и военна интеграция, което ще примири различията между крайнолеви и крайнодесни и ще положи основите на по-силен и обединен политически съюз.
От друга страна, бързата федерализация на ЕС, паралелно с трупането на военна мощ, ще го превърне в нова империя, която ще може да използва силите си не само да се отбранява, но и да напада. Поляризацията в европейските общества ще засили разделението в страните членки и ще създаде политически климат, подобен на американския, заменяйки терористичните атентати с постоянни сблъсъци между европейците, които могат да доведат до появата на мощни дезинтеграционни процеси в Общността. И така, в един момент „лекарството“ може да се окаже дори по-лошо от болестта.
И накрая, нека си дадем сметка, че за държави като нашата оцеляването на ЕС е въпрос както на националната ни сигурност, така и на съхраняването на собствения ни икономически суверенитет. Европа е оцеляла, защото се е реформирала и само една мащабна реформа в учредителните договори на Общността може да открехне вратата към преодоляването на демократичния дефицит в европейските институции и възвръщането на доверието в тях.
За Китай, Европа и червените линии
В няколко поредни материала ще се опитаме да разгледаме малко по-задълбочено Китай и отношенията му с Европа, САЩ и Русия. Първият от тях е посветен на концепцията за китайската външна политика и как тя изглежда в отношенията на Китай с Европа. От Искрен Иванов.
 Искрен Иванов

България и Източна Европа като цяло могат да се превърнат в мотор на тези процеси, тъй като според някои изследвания Централна Европа и Източният фланг се справят много по-добре с вътрешната си сигурност, отколкото западните ни партньори, и това е отразено и в препоръките на американското правителство. Източноевропейците, които в продължение на години бяха обект на предразсъдъци и дискриминация от страна на останалите държави в Общността, днес може би държат ключа за възстановяването на Европа преди всичко като зона на сигурност и стабилност.
Уви, винаги стои и предупреждението на Хоркхаймер и Адорно, че свръхфокусирането на Източна Европа повече върху историческата справедливост, отколкото върху свободата, може да доведе до тоталитаризъм – единствената по-страшна алтернатива на империализма. И никоя източноевропейска държава не е застрахована от такова развитие, ако бъде оставена в европейската периферия като „мост“ между Изтока и Запада.
AMD Intros Kintex UltraScale+ Gen 2 FPGAs
Post Syndicated from Ryan Smith original https://www.servethehome.com/amd-intros-kintex-ultrascale-gen-2-fpgas/
For this year’s Integrated Systems Europe trade show, AMD is unveiling an upgraded lineup of its Kintex mid-range FPGAs. Dubbed the Kintex UltraScale+ Gen 2 family, this latest iteration of the Kintex family is designed to modernize the FPGAs, bringing support for newer and faster memory, I/O, and cryptography technologies. As with the existing (Gen […]
The post AMD Intros Kintex UltraScale+ Gen 2 FPGAs appeared first on ServeTheHome.
Countdown to the Next Arms Race
Post Syndicated from The Atlantic original https://www.youtube.com/shorts/usIYlfiuDpw
Binary Star
Post Syndicated from xkcd.com original https://xkcd.com/3203/

Build an AI-powered course recommender using Amazon Bedrock and AWS End User Messaging
Post Syndicated from Ruchikka Chaudhary original https://aws.amazon.com/blogs/messaging-and-targeting/build-an-ai-powered-course-recommender-using-amazon-bedrock-and-aws-end-user-messaging/
Educational technology (EdTech) providers face the challenge of maintaining seamless, personalized communication and presenting the right recommendations to their diverse stakeholders. This post explores how combining Amazon Web Services (AWS) End User Messaging and WhatsApp Business API with the advanced AI capabilities of Amazon Bedrock can transform educational engagement.
In this post, we explore use cases that are reshaping the EdTech industry. We discover how application automation can streamline admissions and enrollment processes, making them more efficient and user-friendly. We demonstrate how instant student engagement can be achieved through AI-powered, personalized interactions that keep learners motivated and connected. We showcase how real-time course feedback mechanisms can help educators adapt and improve their teaching methods. We also examine how student support can be automated using intelligent assistants that provide continuous, all-day assistance while maintaining a personal touch.
We show you how to build an AI-powered course recommendation system. We explain how to set up WhatsApp Business API integration with Amazon Bedrock, implement smart search capabilities for course matching, and create a scalable serverless architecture. You’ll learn how to build meaningful analytics dashboards to track engagement and learn best practices for handling errors and maintaining system reliability. Whether you’re an EdTech professional or a cloud architect, this guide gives you practical insights into combining conversational AI with educational services.
Use cases
- An AI-powered personalized learning pathway generator that automatically recommends customized content based on individual student performance metrics and learning requirements
- Course improvement suggestions and real-time course feedback
- A smart communication orchestrator that delivers role-specific, automated notifications and updates across multiple channels to enhance student and parent engagement
- An early warning system using predictive analytics to identify at-risk students through real-time monitoring of engagement metrics and performance indicators
- Student support automation with always available AI assistant support, FAQ handling, escalation management, and multilingual support
Prerequisites
- An AWS account
- AWS End User Messaging set up with WhatsApp channel enabled
- A pre-existing WhatsApp Business account
- Amazon Bedrock setup must be completed with preferred model
- Amazon Quick Sight for the AWS Region must be enabled
Solution overview
With this solution, users can discover and order educational courses through WhatsApp conversations. Instead of navigating complex websites, the user can send a WhatsApp message saying, “I want to learn Python programming.” They’ll receive personalized course recommendations instantly. The architecture processes WhatsApp messages through AWS End User Messaging, uses Amazon Bedrock for AI-powered conversations, performs semantic search with Amazon OpenSearch Serverless, and captures analytics for business insights. (For step-by-step implementation and rollback guidelines, see the sample course recommendation system.) The following architectural diagram illustrates a modern AI-powered course recommendation system that uses multiple AWS services.
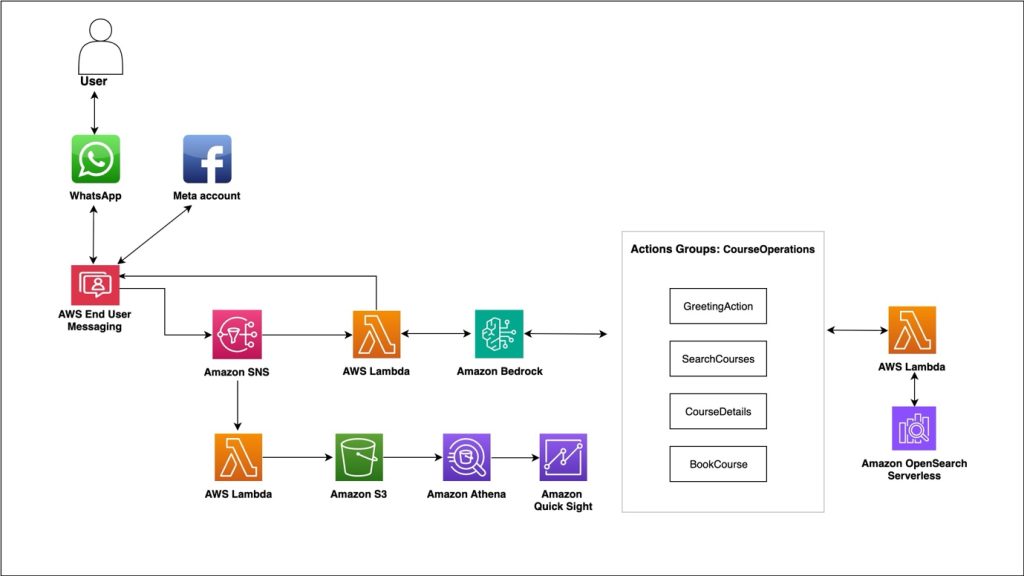
Figure 1: AI-powered course recommendation system
Message processing
When users send WhatsApp messages, AWS End User Messaging captures them and publishes events to an Amazon Simple Notification Service (Amazon SNS) topic. This creates a decoupled architecture where multiple services can process the same message events independently. AWS Lambda functions subscribe to these events, facilitating reliable message processing during high-traffic periods. The decoupled design provides several advantages:
- If one component fails, others continue operating
- You can add new message processors without affecting existing ones
- The system automatically scales based on message volume without manual intervention
AI conversation engine
Amazon Bedrock with Claude 3 Haiku powers natural language understanding. It is configured specifically for WhatsApp with instructions for short paragraphs, relevant emoji, and mobile-optimized responses.
AI agents
The agent maintains conversation context and handles structured actions such as course search, detail retrieval, and booking through defined functions. The following workflow is the agent action flow and sample code:
Agent flow
- Greets user → Understands intent → Searches courses → Provides details → Facilitates booking
- Maintains context throughout the conversation
- Can switch between actions based on user responses
- Handles complex queries by combining multiple actions
Sample code
The following is sample code to create a Bedrock agent using AWS CDK:
Semantic search
Traditional keyword search can miss the user’s intent. The application uses Amazon Titan Embeddings in Amazon Bedrock to convert courses and queries into vectors, enabling semantic understanding. When users ask for “cloud computing courses,” the system can understand related terms such as “AWS” and “serverless” without exact matches. Amazon OpenSearch Serverless handles vector similarity matching combined with traditional filters for course price, level, and duration.
Analytics pipeline
Every WhatsApp message interaction generates business intelligence. Messages are stored in Amazon Simple Storage Service (Amazon S3) with date partitioning, catalogued through AWS Glue, and made queryable using Amazon Athena. Teams can analyze user behavior, popular topics, and conversion rates through Quick Sight dashboards. The following dashboard shows example widgets displaying pie-chart breakdown of message delivery status and count of messages per day.
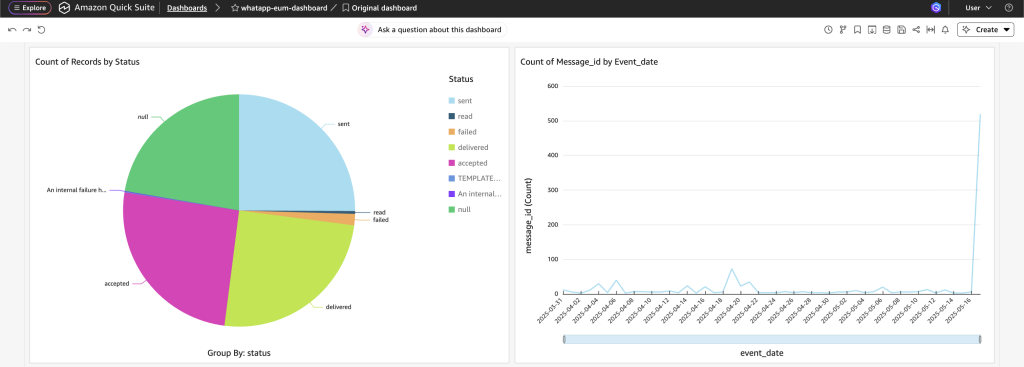
Figure 2: Amazon Quick Sight dashboard
As shown in the following dashboard, Amazon Q in QuickSight enables you to explore and analyze your data using conversational AI capabilities.
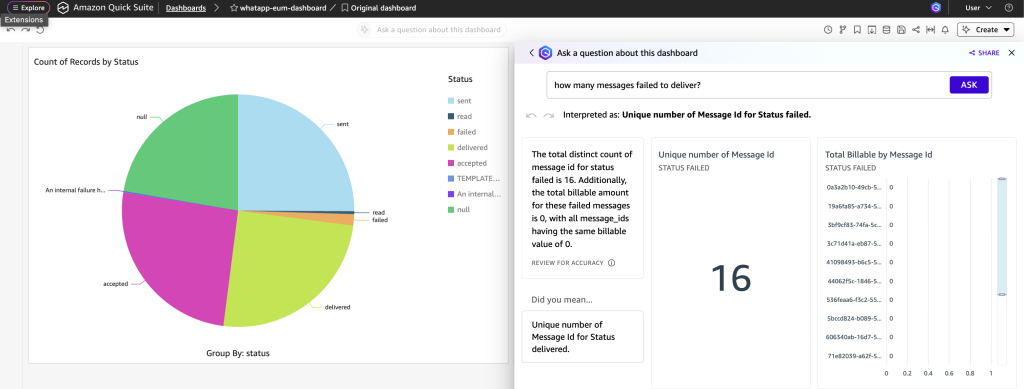
Figure 3: Amazon Quick Sight dashboard showing chat window
Error handling and resilience
Such highly scalable and distributed solutions require robust error handling. The application has exponential backoff and retries for API calls, meaning the system can gracefully handle rate limits and temporary service unavailability.
The following is sample code for error handling and resilience:
Business impact
With the global EdTech market expected to reach $165 billion by 2026, educators and institutions are seeking solutions to prevent student dropouts, improve learning outcomes, and maintain their competitive advantage. Poor personalization can lead to decreased student engagement, lower course completion rates, and ultimately revenue loss.
Implementing AI-driven personalization and communication systems means institutions can significantly improve student retention rates, boost learning outcomes, and create a more engaging educational experience, which directly impacts their bottom line and reputation in an increasingly competitive educational landscape. This solution could transform educational delivery through intelligent personalization and operational excellence. A serverless architecture can help educational institutions focus on content quality rather than infrastructure management while potentially maintaining rapid response times for course searches. The system’s analytics capabilities could offer insights into student behavior and course preferences, helping shape future curriculum development.
With mobile optimization, institutions can better serve the growing population of digital-first learners. The combination of automated scaling and pay-per-use pricing could create opportunities for cost optimization, and real-time dashboards can be used to facilitate data-informed decision-making. Such improvements in user experience and operational efficiency could lead to enhanced student engagement and institutional growth in the evolving education environment.
Sample conversation
The following video shows how a user can interact with the generative AI-powered course recommendation system and receive course recommendations.
Future enhancements
We’re expanding to more messaging platforms, adding voice integration through Amazon Connect, and implementing predictive analytics for personalized recommendations. The serverless architecture makes these additions straightforward without infrastructure changes. Future scenarios could involve:
- Educator and student support – This solution can be enhanced for student and educator experiences. For educators, it can automate administrative tasks. For students, it can create personalized engagement campaigns, a communication approach that could be significantly more effective than traditional methods.
- Digital admission process flow – The solution integrates AWS Bedrock AI with WhatsApp Business API to streamline digital admissions. It can enable instant document verification, guide secure payments, and provide automated updates, all within the AWS End User Messaging WhatsApp channel. This AI-powered system could transform the complex admission process into an efficient, chat-based experience, benefiting both institutions and applicants.
- Parental support and study material management – The system could intelligently distribute learning resources based on student needs, send automated schedule updates, and provide personalized progress reports to parents through WhatsApp. Parents could receive AI-curated study materials and real-time updates about their child’s academic performance, homework assignments, and upcoming assessments through familiar chat interactions. This integration could transform traditional parent-teacher communication into an efficient, automated system while providing timely access to relevant educational resources.
Conclusion
The WhatsApp course recommender agent demonstrates how modern AWS services can create sophisticated, AI-powered conversational experiences that scale automatically and provide rich business insights. The serverless architecture provides cost-effectiveness while maintaining enterprise-grade reliability. Key architectural principles that make this solution successful include event-driven design for scalability, AI integration for natural interactions, semantic search for superior user experience, customizable analytics for business intelligence, and infrastructure as code (IaC) for reliable deployments.
For organizations considering similar implementations, we recommend focusing on user experience optimization, robust error handling, comprehensive monitoring, and gradual feature rollout. The conversational AI environment is rapidly evolving, and solutions that prioritize user experience while maintaining technical excellence can drive the most business value. This implementation can serve as a reference architecture for building production-ready conversational AI systems on AWS, demonstrating patterns that can apply across industries and use cases.
About the authors
Yes, It’s Fascism by Jonathan Rauch
Post Syndicated from The Atlantic original https://www.youtube.com/shorts/7NXHb9XvNrY
AWS IAM Identity Center now supports multi-Region replication for AWS account access and application use
Post Syndicated from Channy Yun (윤석찬) original https://aws.amazon.com/blogs/aws/aws-iam-identity-center-now-supports-multi-region-replication-for-aws-account-access-and-application-use/
Today, we’re announcing the general availability of AWS IAM Identity Center multi-Region support to enable AWS account access and managed application use in additional AWS Regions.
With this feature, you can replicate your workforce identities, permission sets, and other metadata in your organization instance of IAM Identity Center connected to an external identity provider (IdP), such as Microsoft Entra ID and Okta, from its current primary Region to additional Regions for improved resiliency of AWS account access.
You can also deploy AWS managed applications in your preferred Regions, close to application users and datasets for improved user experience or to meet data residency requirements. Your applications deployed in additional Regions access replicated workforce identities locally for optimal performance and reliability.
When you replicate your workforce identities to an additional Region, your workforce gets an active AWS access portal endpoint in that Region. This means that in the unlikely event of an IAM Identity Center service disruption in its primary Region, your workforce can still access their AWS accounts through the AWS access portal in an additional Region using already provisioned permissions. You can continue to manage IAM Identity Center configurations from the primary Region, maintaining centralized control.
Enable IAM Identity Center in multiple Regions
To get started, you should confirm that the AWS managed applications you’re currently using support customer managed AWS Key Management Service (AWS KMS) key enabled in AWS Identity Center. When we introduced this feature in October 2025, Seb recommended using multi-Region AWS KMS keys unless your company policies restrict you to single-Region keys. Multi-Region keys provide consistent key material across Regions while maintaining independent key infrastructure in each Region.
Before replicating IAM Identity Center to an additional Region, you must first replicate the customer managed AWS KMS key to that Region and configure the replica key with the permissions required for IAM Identity Center operations. For instructions on creating multi-Region replica keys, refer to Create multi-Region replica keys in the AWS KMS Developer Guide.
Go to the IAM Identity Center console in the primary Region, for example, US East (N. Virginia), choose Settings in the left-navigation pane, and select the Management tab. Confirm that your configured encryption key is a multi-Region customer managed AWS KMS key. To add more Regions, choose Add Region.
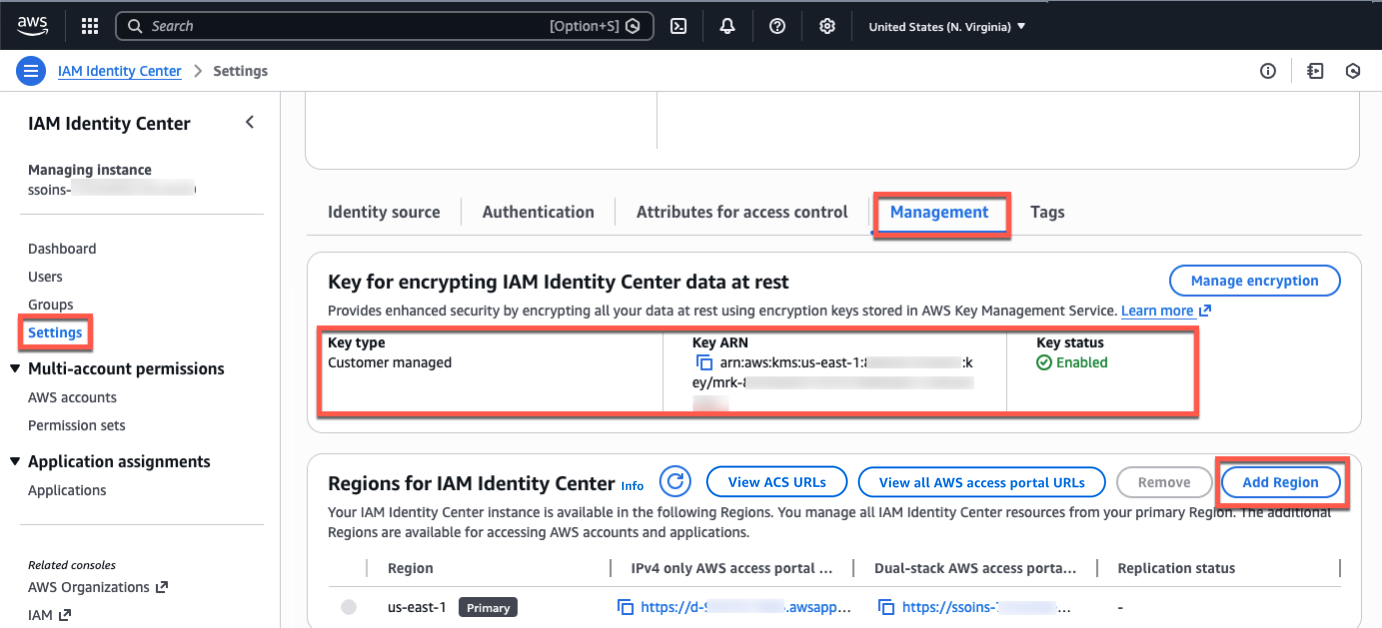
You can choose additional Regions to replicate the IAM Identity Center in a list of the available Regions. When choosing an additional Region, consider your intended use cases, for example, data compliance or user experience.
If you want to run AWS managed applications that access datasets limited to a specific Region for compliance reasons, choose the Region where the datasets reside. If you plan to use the additional Region to deploy AWS applications, verify that the required applications support your chosen Region and deployment in additional Regions.
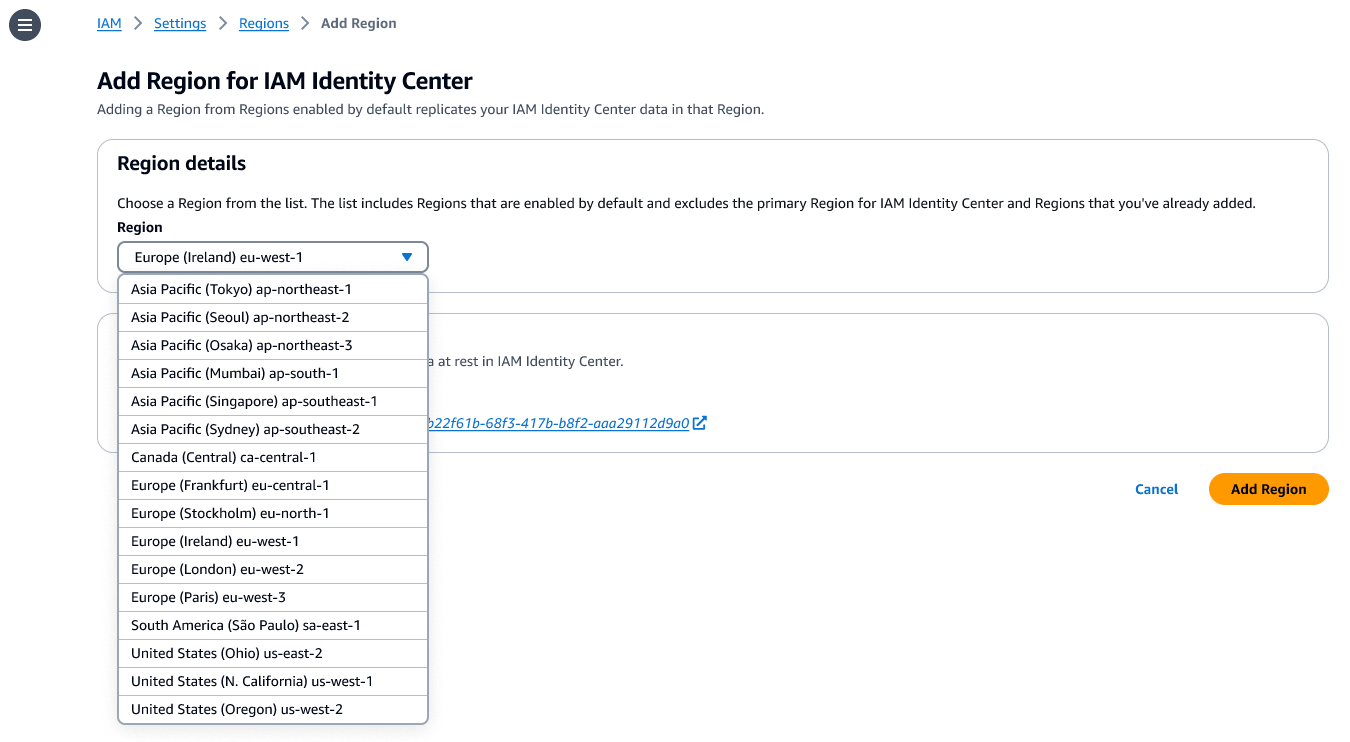
Choose Add Region. This starts the initial replication whose duration depends on the size of your Identity Center instance.
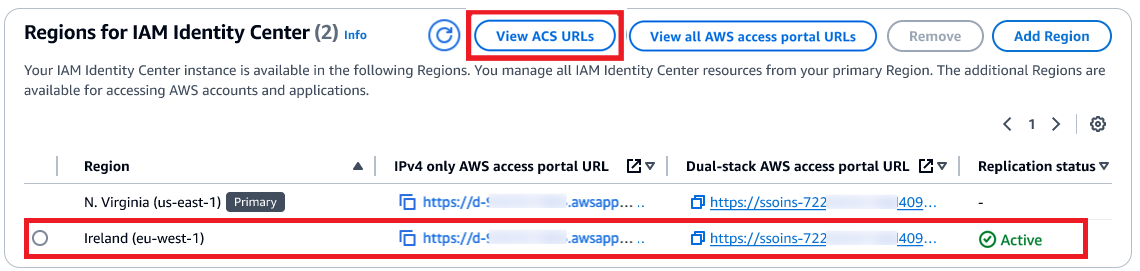
After the replication is completed, your users can access their AWS accounts and applications in this new Region. When you choose View ACS URLs, you can view SAML information, such as an Assertion Consumer Service (ACS) URL, about the primary and additional Regions.
How your workforce can use an additional Region
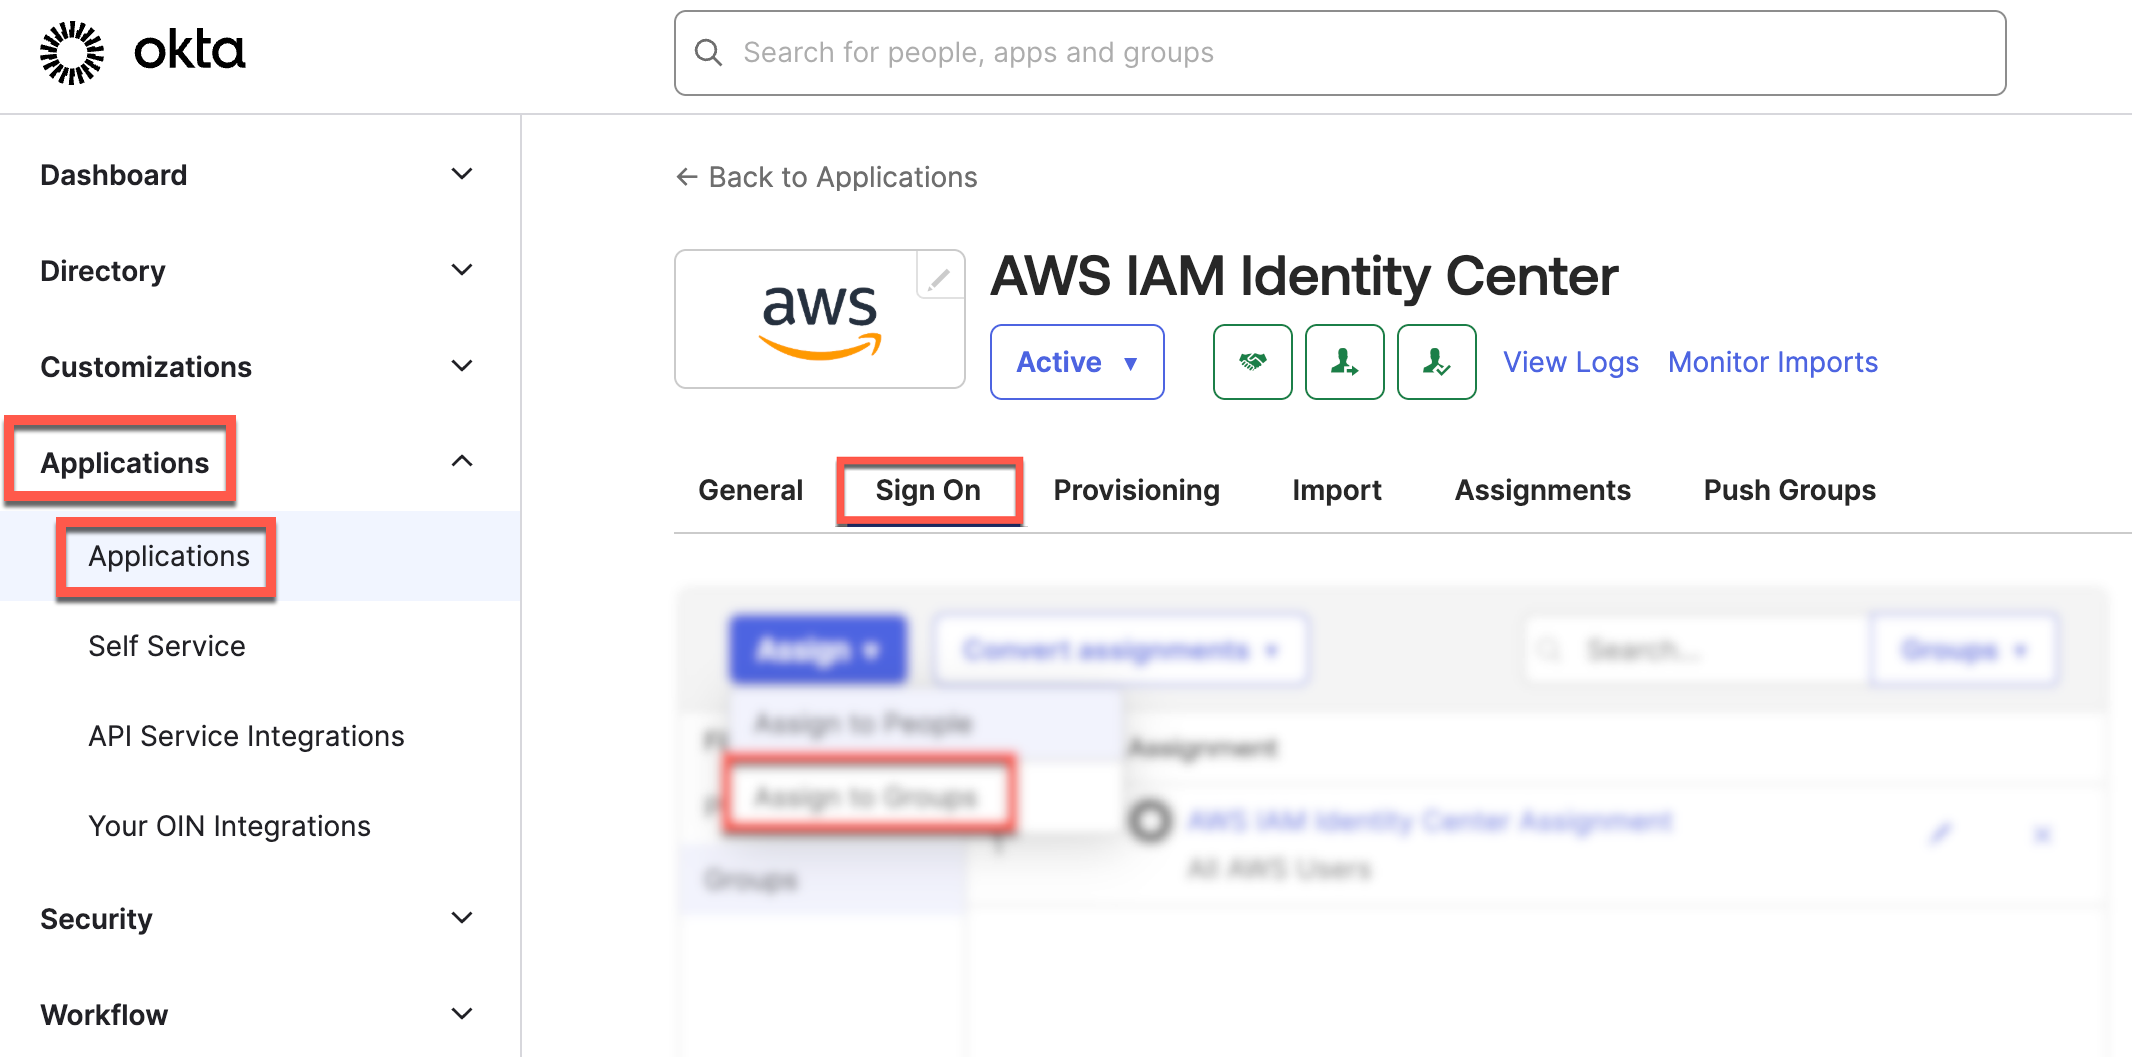
AWS Identity Center supports SAML single sign-on with external IdPs, such as Microsoft Entra ID and Okta. Upon authentication in the IdP, the user is redirected to the AWS access portal. To enable the user to be redirected to the AWS access portal in the newly added Region, you need to add the additional Region’s ACS URL to the IdP configuration.
The following screenshots show you how to do this in the Okta admin console:
Then, you can create a bookmark application in your identity provider for users to discover the additional Region. This bookmark app functions like a browser bookmark and contains only the URL to the AWS access portal in the additional Region.
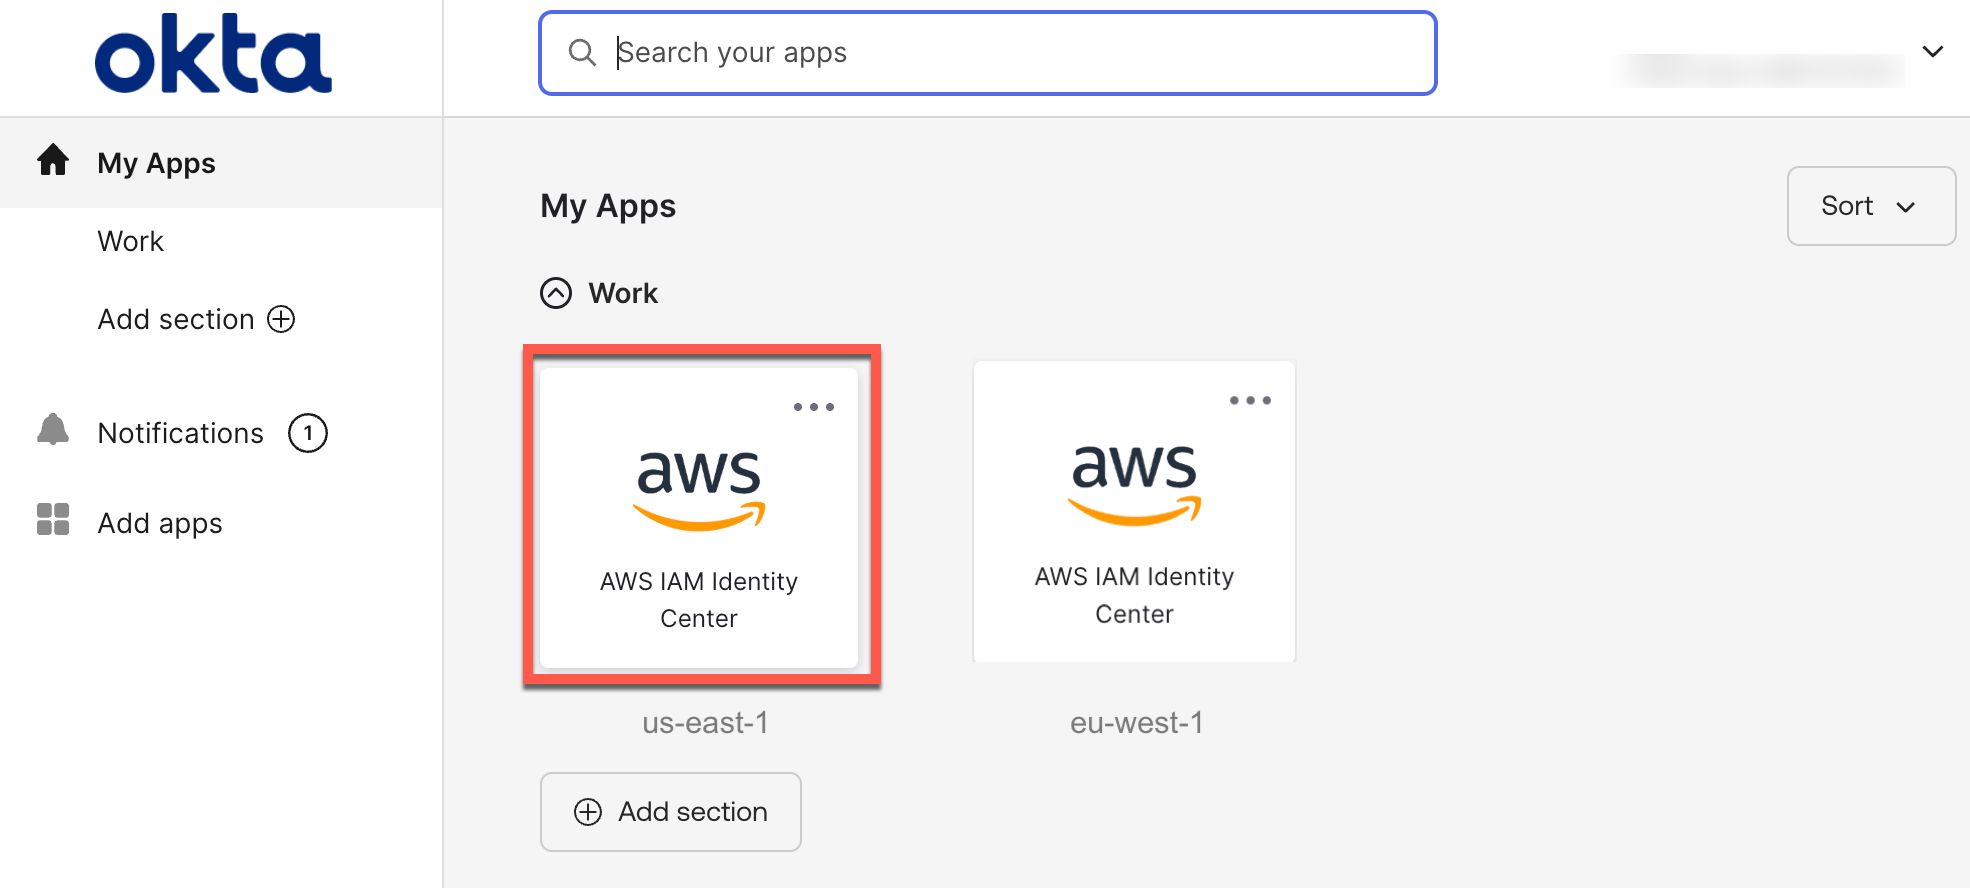
You can also deploy AWS managed applications in additional Regions using your existing deployment workflows. Your users can access applications or accounts using the existing access methods, such as the AWS access portal, an application link, or through the AWS Command Line Interface (AWS CLI).
To learn more about which AWS managed applications support deployment in additional Regions, visit the IAM Identity Center User Guide.
Things to know
Here are key considerations to know about this feature:
- Consideration – To take advantage of this feature at launch, you must be using an organization instance of IAM Identity Center connected to an external IdP. Also, the primary and additional Regions must be enabled by default in an AWS account. Account instances of IAM Identity Center, and the other two identity sources (Microsoft Active Directory and IAM Identity Center directory) are presently not supported.
- Operation – The primary Region remains the central place for managing workforce identities, account access permissions, external IdP, and other configurations. You can use the IAM Identity Center console in additional Regions with a limited feature set. Most operations are read-only, except for application management and user session revocation.
- Monitoring – All workforce actions are emitted in AWS CloudTrail in the Region where the action was performed. This feature enhances account access continuity. You can set up break-glass access for privileged users to access AWS if the external IdP has a service disruption.
Now available
AWS IAM Identity Center multi-Region support is now available in the 17 enabled-by-default commercial AWS Regions. For Regional availability and a future roadmap, visit the AWS Capabilities by Region. You can use this feature at no additional cost. Standard AWS KMS charges apply for storing and using customer managed keys.
Give it a try in the AWS Identity Center console. To learn more, visit the IAM Identity Center User Guide and send feedback to AWS re:Post for Identity Center or through your usual AWS Support contacts.
— Channy
Use Amazon MSK Connect and Iceberg Kafka Connect to build a real-time data lake
Post Syndicated from Xiao Huang original https://aws.amazon.com/blogs/big-data/use-amazon-msk-connect-and-iceberg-kafka-connect-to-build-a-real-time-data-lake/
As analytical workloads increasingly demand real-time insights, organizations need business data to enter the data lake immediately after generation. While various methods exist for real-time CDC data ingestion (such as AWS Glue and Amazon EMR Serverless), Amazon MSK Connect with Iceberg Kafka Connect provides a fully managed, streamlined approach that reduces operational complexity and enables continuous data synchronization.
In this post, we demonstrate how to use Iceberg Kafka Connect with Amazon Managed Streaming for Apache Kafka (Amazon MSK) Connect to accelerate real-time data ingestion into data lakes, simplifying the synchronization process from transactional databases to Apache Iceberg tables.
Solution overview
In this post, we show you how to implement capturing transaction log data from Amazon Relational Database Service (Amazon RDS) for MySQL and writing it to Amazon Simple Storage Service (Amazon S3) in Iceberg table format using append mode, covering both single-table and multi-table synchronization, as shown in the following figure.

Downstream consumers then process these change records to reconstruct the data state before writing to Iceberg tables.
In this solution, you use the Iceberg Kafka Sink Connector to implement the business on the sink side. The Iceberg Kafka Sink Connector has the following features:
- Supports exactly-once delivery
- Support multi-table synchronization
- Support schema changes
- Field name mapping through Iceberg’s column mapping feature
Prerequisites
Before beginning the deployment, ensure you have the following components in place:
Amazon RDS for MySQL: This solution assumes you already have an Amazon RDS for MySQL database instance running with the data you want to synchronize to your Iceberg data lake. Ensure that binary logging is enabled on your RDS instance to support Change Data Capture (CDC) operations.
Amazon MSK Cluster: You need an Amazon MSK cluster provisioned in your target AWS Region. This cluster will serve as the streaming platform between your MySQL database and the Iceberg data lake. Ensure the cluster is properly configured with appropriate security groups and network access.
Amazon S3 Bucket: Ensure you have an Amazon S3 bucket ready to host the custom Kafka Connect plugins. This bucket serves as the storage location from which AWS MSK Connect retrieves and installs your plugins. The bucket must exist in your target AWS Region, and you must have appropriate permissions to upload objects to it.
Custom Kafka Connect Plugins: To enable real-time data synchronization with MSK Connect, you need to create two custom plugins. The first plugin uses the Debezium MySQL Connector to read transactional logs and produce Change Data Capture (CDC) events. The second plugin uses Iceberg Kafka Connect to synchronize data from Amazon MSK to Apache Iceberg tables.
Build Environment: To build the Iceberg Kafka Connect plugin, you need a build environment with Java and Gradle installed. You can either launch an Amazon EC2 instance (recommended: Amazon Linux 2023 or Ubuntu) or use your local machine if it meets the requirements. Ensure you have sufficient disk space (at least 20GB) and network connectivity to clone the repository and download dependencies.
Build Iceberg Kafka Connect from open source
The connector ZIP archive is created as part of the Iceberg build. You can run the build using the following code:
Create custom plugins
The next step is to create custom plugins to read and synchronize the data.
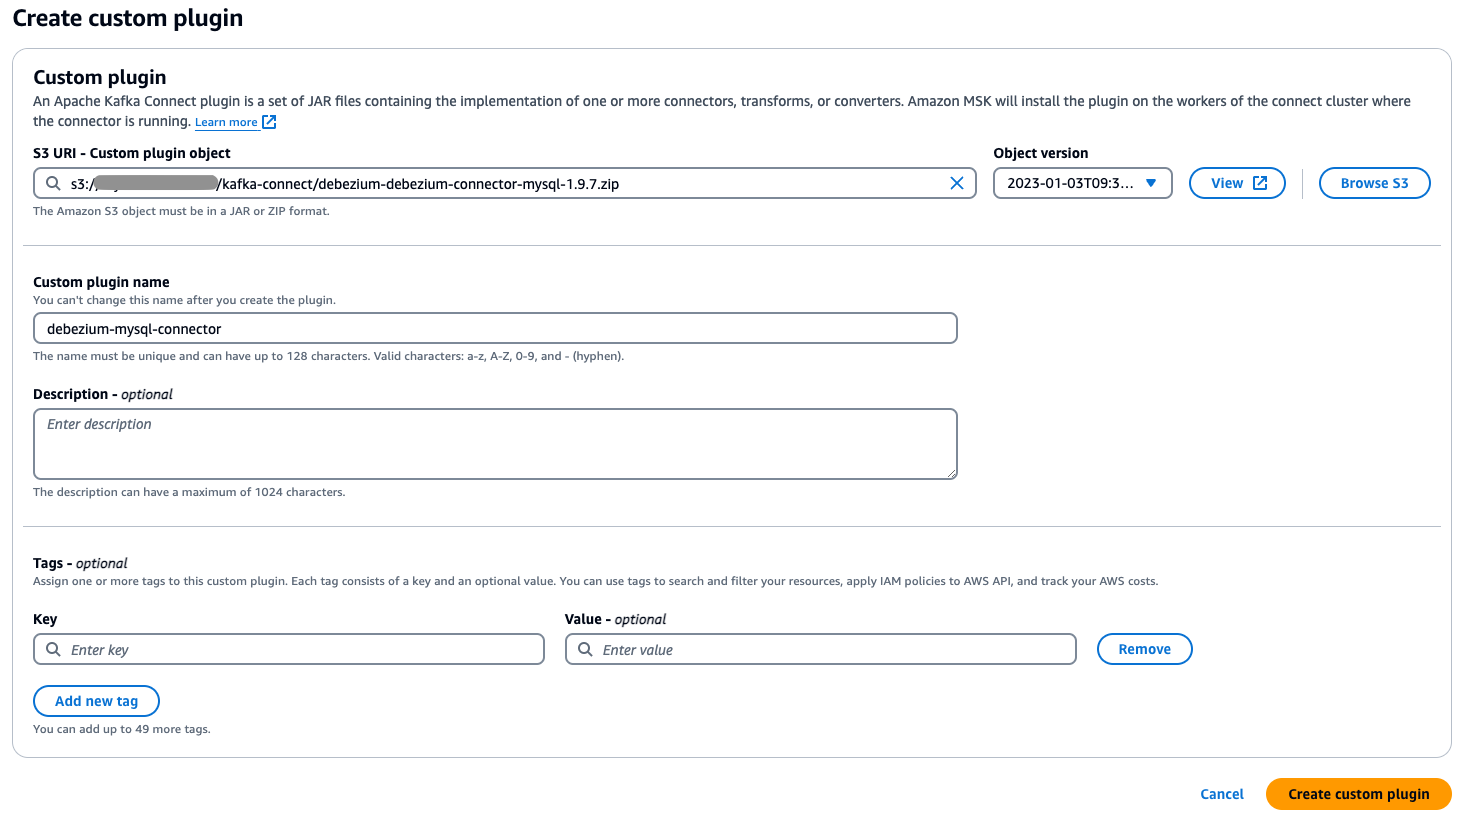
- Upload the custom plugin ZIP file you compiled in the previous step to your designated Amazon S3 bucket.
- Go to the AWS Management Console and navigate to Amazon MSK and choose Connect in the navigation pane.
- Choose Custom plugins, then select the plugin file you uploaded to S3 by browsing or entering its S3 URI.
- Specify a unique, descriptive name for your custom plugin (such as my-connector-v1).
- Choose Create custom plugin.
Configure MSK Connect
With the plugins installed, you’re ready to configure MSK Connect.
Configure data source access
Start by configuring data source access.
- To create a worker configuration, choose Worker configurations in the MSK Connect console.
- Choose Create worker configuration and copy and paste the following configuration.
- In the Amazon MSK console, choose Connectors under Amazon MSK Connect and choose Create connector.
- In the setup wizard, select the Debezium MySQL Connector plugin created in the previous step, enter the connector name and select the MSK cluster of the synchronization target. Copy and paste the following content in the configuration:
Note that in the configuration,
Routeis used to write multiple records to the same topic. In the parametertransforms.Reroute.topic.regex, the regular expression is configured to filter the table names that need to be written to the same topic. In the following example, the data containing <tablename-prefix> in the table name is written to the same topic.For example, after
transforms.Reroute.topic.replacementis specified as$1all_records, the topic name created in the MSK is< database.server.name>.all_records. - After you choose Create, MSK Connect creates a synchronization task for you.
Data synchronization (single table mode)
Now, you can create a real-time synchronization task for the Iceberg table. Start by creating a real-time synchronization job for a single table.
- In the Amazon MSK console, choose Connectors under MSK Connect
- Choose Create connector.
- On the next page, select the previously created Iceberg Kafka Connect plugin
- Enter the connector name and select the MSK cluster of the synchronization target.
- Paste the following code in the configuration.
For Iceberg Connector, it will create a topic named
control-icebergby default to record offset. Select the previously created worker configuration that includestopic.creation.enable = true. If you use the default worker configuration and auto-topic creation isn’t enabled at the MSK broker level, the connector will not be able to automatically create topics.You can also specify this topic name by setting the parameter
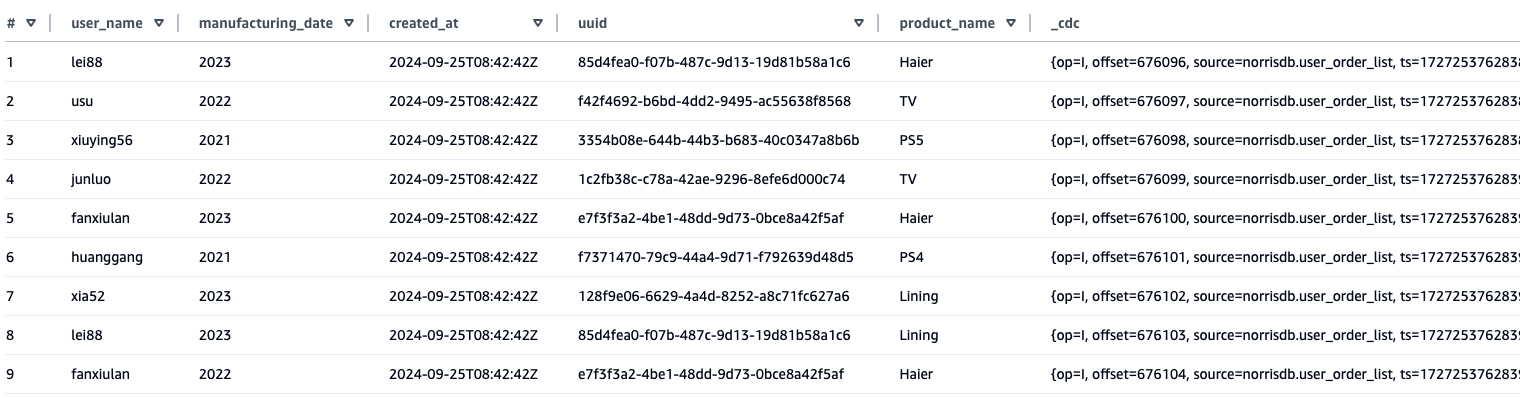
iceberg.control.topic = <offset-topic>.If you want to use a custom topic, you can use the following code. - Query the synchronized data results through Amazon Athena. From the table synchronized to Athena, you can see that, in addition to the source table field, an additional
_cdcfield has been added to store the metadata content of the CDC.

Compaction
Compaction is an essential maintenance operation for Iceberg tables. Although frequent ingestion of small files can negatively impact query performance, regular compaction mitigates this issue by consolidating small files, minimizing metadata overhead, and substantially improving query efficiency. To maintain optimal table performance, you should implement dedicated compaction workflows. AWS Glue offers an excellent solution for this purpose, providing automated compaction capabilities that intelligently merge small files and restructure table layouts for enhanced query performance.
Schema Evolution Demonstration
To demonstrate the schema evolution capabilities of this solution, we conducted a test to show how field changes at the source database are automatically synchronized to the Iceberg tables through MSK Connect and Iceberg Kafka Connect.
Initial Setup:
First, we created an RDS MySQL database with a customer information table (tb_customer_info) containing the following schema:
We then configured MSK Connect using the Debezium MySQL Connector to capture changes from this table and stream them to Amazon MSK in real time. Following that, we set up Iceberg Kafka Connect to consume the data from MSK and write it to Iceberg tables.
Schema Modification Test:
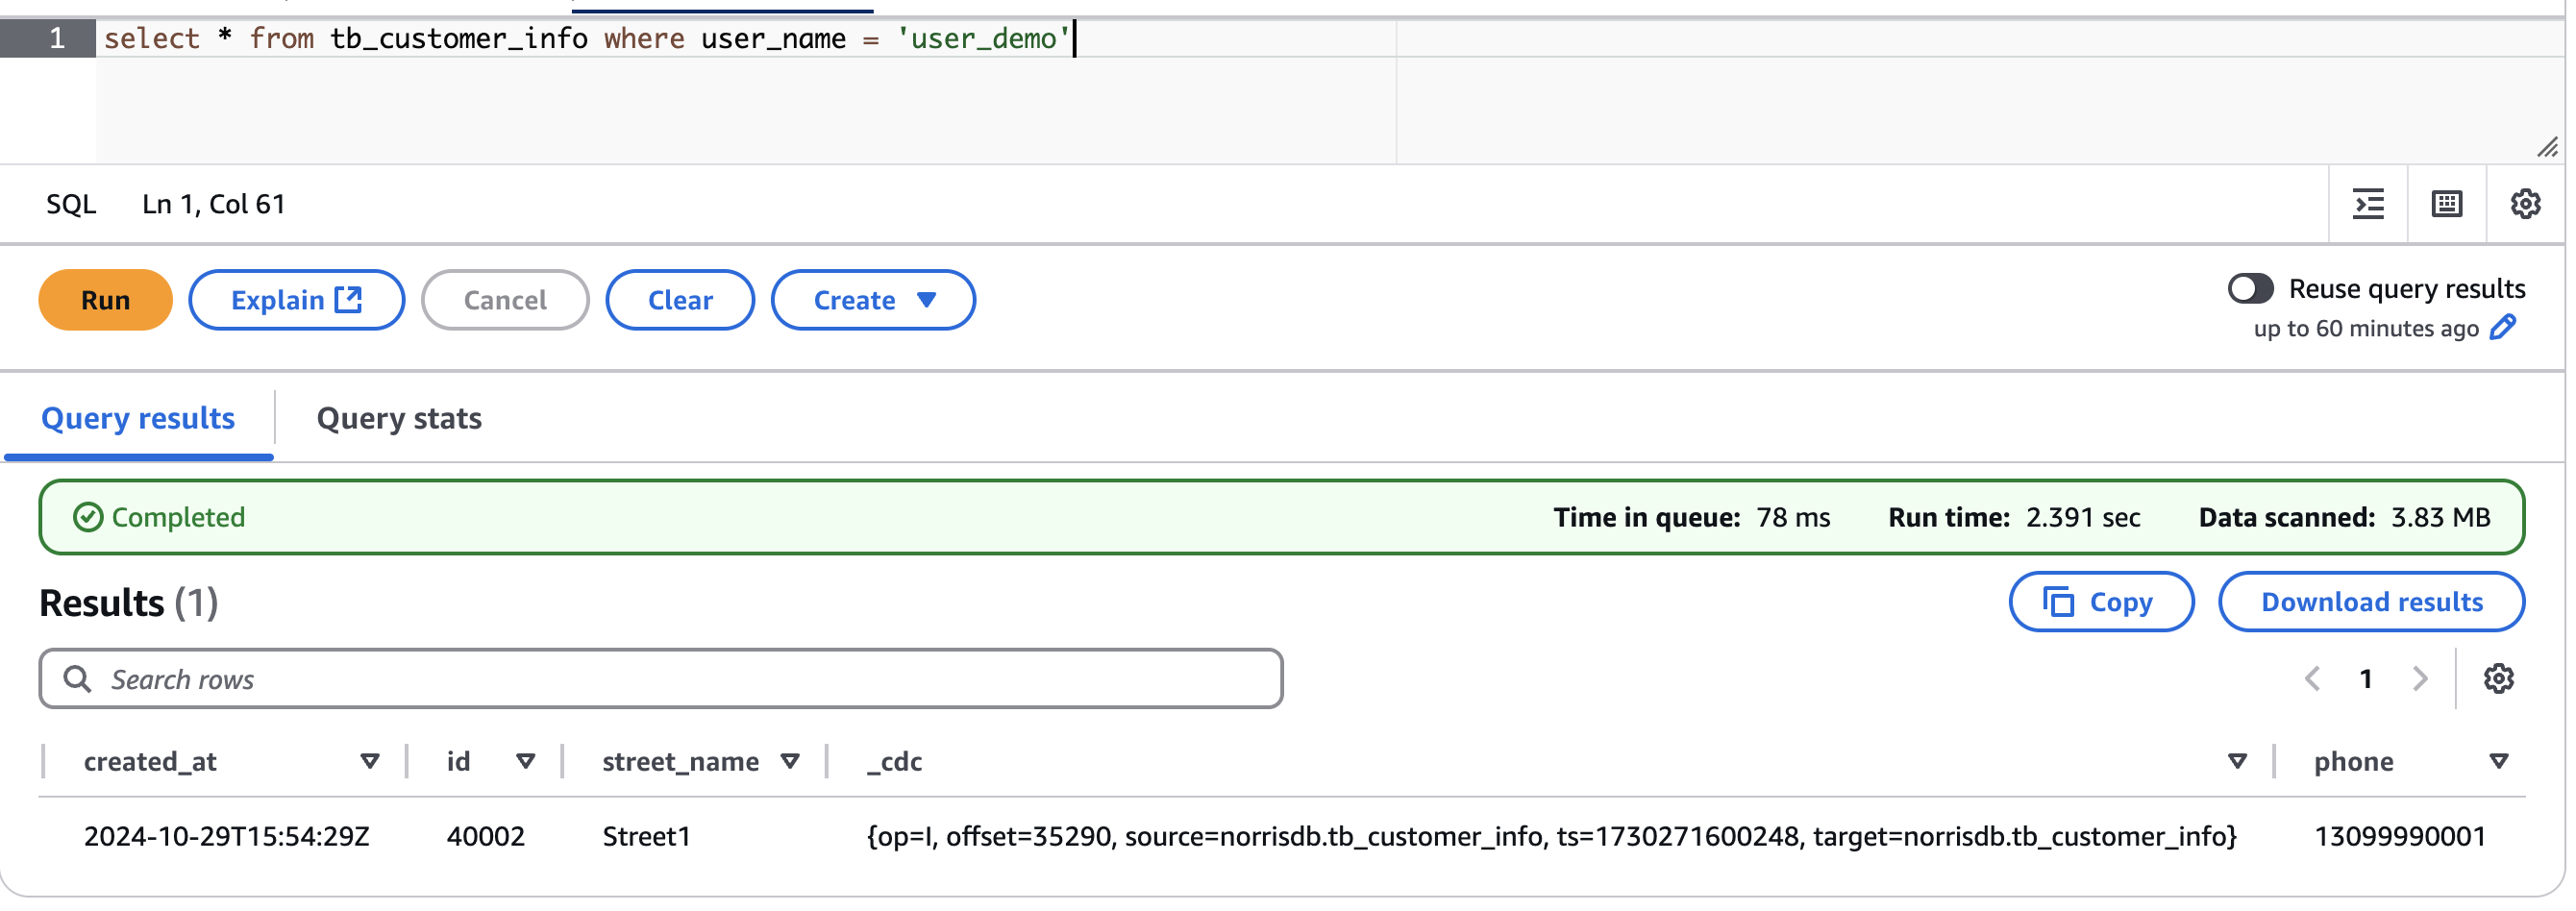
To test the schema evolution capability, we added a new field named phone to the source table:
We then inserted a new record with the phone field populated:
Results:
When we queried the Iceberg table in Amazon Athena, we observed that the phone field had been automatically added as the last column, and the new record was successfully synchronized with all field values intact. This demonstrates that Iceberg Kafka Connect’s self-adaptive schema capability seamlessly handles DDL changes at the source, eliminating the need for manual schema updates in the data lake.
Data synchronization (multi-table mode)
It’s common that data admins want to use a single connector for moving data in multiple tables. For example, you can use the CDC collection tool to write data from multiple tables to a topic and then write data from one topic to multiple Iceberg tables through the consumer side. In Configure data source access, you configured a MySQL synchronization Connector to synchronize tables with specified rules to a topic using Route. Now let’s review how to distribute data from this topic to multiple Iceberg tables.
- When using Iceberg Kafka Connect to synchronize multiple tables to Iceberg tables using AWS Glue Data Catalog, you must pre-create a database in the Data Catalog before starting the synchronization process. The database name in AWS Glue must exactly match the source database name, because the Iceberg Kafka Connect connector automatically uses the source database name as the target database name during multi-table synchronization. This naming consistency is required because the connector doesn’t provide an option to map source database names to different target database names in multi-table scenarios.
- If you want to use your custom topic name, you can create a new topic to store the MSK Connect record offset, see Data synchronization (single table mode).
- In the Amazon MSK console, create another connector using the following configuration.
In this configuration, two parameters have been added:
iceberg.tables.route-field: Specifies the routing field that distinguishes between different tables, specified ascdc.sourcefor CDC data parsed by Debeziumiceberg.tables.dynamic-enabled: If theiceberg.tablesparameter isn’t set, it must be specified astruehere
- After completion, MSK Connect will creates a sink connector for you.
- After the process is complete, you can view the newly created table through Athena.
Other tips
In this section, we share some more things that you can use to customize your deployment to fit your use case.
- Specified table synchronizationIn the Data synchronization (multi-table mode) section, you specify
iceberg.tables.route-field = _cdc.Sourceandiceberg.tables.dynamic-enabled=true, these two parameter settings can write multiple tables stored in the Iceberg table. If you want to synchronize only the specified tables, you can specify the table name you want to synchronize by settingiceberg.tables.dynamic-enabled = falseand then setting theiceberg.tablesparameter. For example, - Performance Testing Results
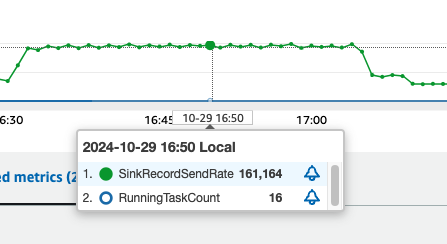
We conducted a performance test using sysbench to evaluate the data synchronization capabilities of this solution. The test simulated a high-volume write scenario to demonstrate the system’s throughput and scalability.Test Configuration:- Database setup: Created 25 tables in the MySQL database using sysbench
- Data loading: Wrote 20 million records to each table (500 million total records)
- Real-time streaming: Configured MSK Connect to stream data from MySQL to Amazon MSK in real time during the write process
- Kafka Connect configuration:
- Started Kafka Iceberg Connect
- Minimum workers: 1
- Maximum workers: 8
- Allocated two MCUs per worker
Performance Results:
In our test using the configuration above, each MCU achieved peak writing performance of approximately 10,000 records per second, as shown in the following figure. This demonstrates the solution’s ability to handle high-throughput data synchronization workloads effectively.



Clean up
To clean up your resources, complete the following steps:
- Delete MSK Connect connectors: Remove both the Debezium MySQL Connector and Iceberg Kafka Connect connector created for this solution.
- Delete the Amazon MSK cluster: If you created a new MSK cluster specifically for this demonstration, delete it to stop incurring charges.
- Delete the S3 buckets: Remove the S3 buckets used to store the custom Kafka Connect plugins and Iceberg table data. Ensure you have backed up any data you need before deletion.
- Delete the EC2 instance: If you launched an EC2 instance to build the Iceberg Kafka Connect plugin, terminate it.
- Delete the RDS MySQL instance (optional): If you created a new RDS instance specifically for this demonstration, delete it. If you’re using an existing production database, skip this step.
- Remove IAM roles and policies (if created): Delete any IAM roles and policies that were created specifically for this solution to maintain security best practices.
Conclusion
In this post, we presented a solution to achieve real-time, efficient data synchronization from transactional databases to data lakes using Amazon MSK Connect and Iceberg Kafka Connect. This solution provides a low-cost and efficient data synchronization paradigm for enterprise-level big data analysis. Whether you’re working with ecommerce transactions, financial transactions, or IoT device logs, this solution can help you achieve quick access to a data lake, enabling analytical businesses to quickly obtain the latest business data. We encourage you to try this solution in your own environment and share your experiences in the comments section. For more information, visit Amazon MSK Connect.
About the author
Optimizing Flink’s join operations on Amazon EMR with Alluxio
Post Syndicated from Qingyuan Tang original https://aws.amazon.com/blogs/big-data/optimizing-flinks-join-operations-on-amazon-emr-with-alluxio/
When you’re working with data analysis, you often face the challenge of effectively correlating real-time data with historical data to gain actionable insights. This becomes particularly critical when you’re dealing with scenarios like e-commerce order processing, where your real-time decisions can significantly impact business outcomes. The complexity arises when you need to combine streaming data with static reference information to create a comprehensive analytical framework that supports both your immediate operational needs and strategic planning
To tackle this challenge, you can employ stream processing technologies that handle continuous data flows while seamlessly integrating live data streams with static dimension tables. These solutions enable you to perform detailed analysis and aggregation of data, giving you a comprehensive view that combines the immediacy of real-time data with the depth of historical context. Apache Flink has emerged as a leading stream computing platform that offers robust capabilities for joining real-time and offline data sources through its extensive connector ecosystem and SQL API.
In this post, we show you how to implement real-time data correlation using Apache Flink to join streaming order data with historical customer and product information, enabling you to make informed decisions based on comprehensive, up-to-date analytics.
We also introduce an optimized solution to automatically load Hive dimension table data into Alluxio Universal Flash Storage (UFS) through the Alluxio cache layer. This enables Flink to perform temporal joins on changing data, accurately reflecting the content of a table at specific points in time.
Solution architecture
When it comes to joining Flink SQL tables with stream tables, the lookup join is a go-to method. This approach is particularly effective when you need to correlate streaming data with static or slowly changing data. In Flink, you can use connectors like the Flink Hive SQL connector or the FileSystem connector to archive the scenario.
The following architecture shows general approach which we describe ahead:
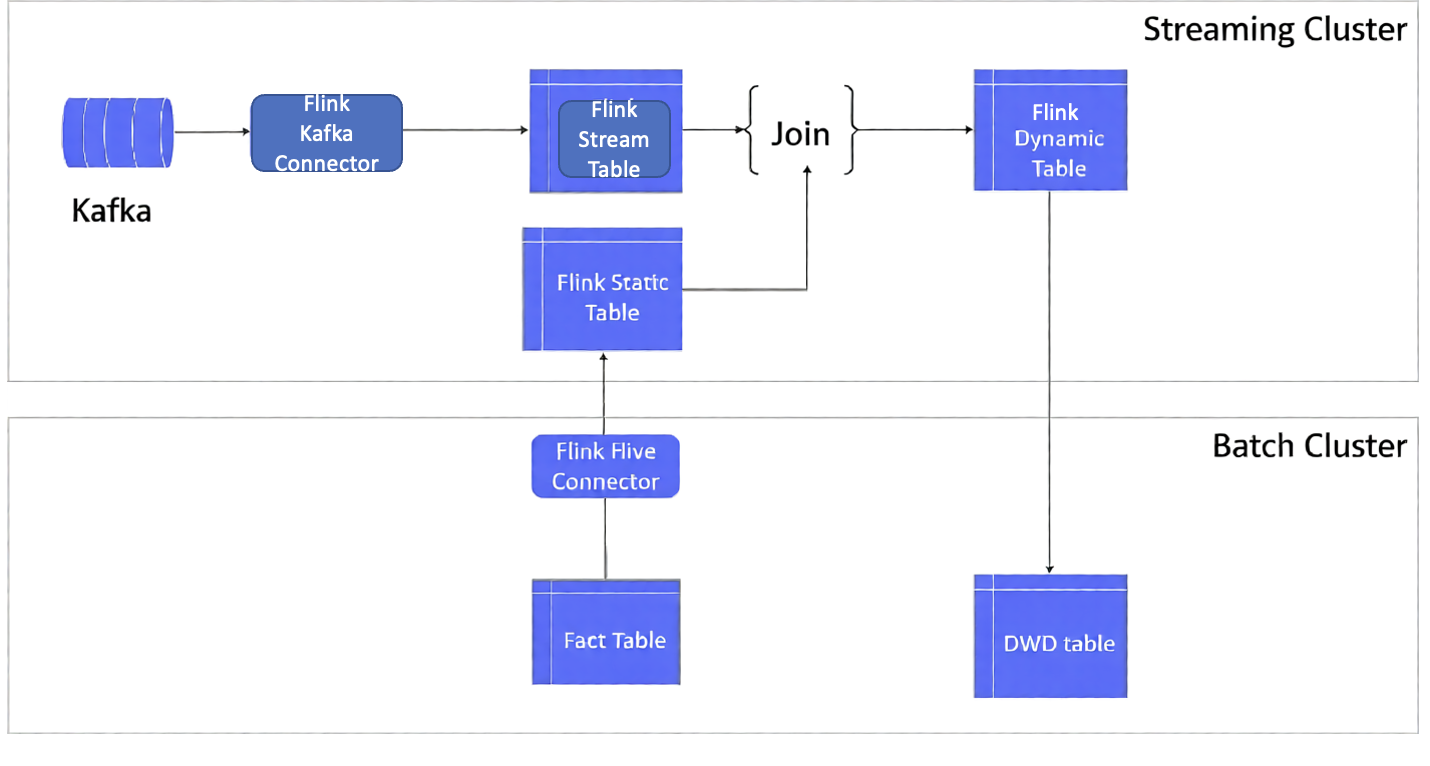
Here’s how we do this:
- We use offline data to construct a Flink table. This data could be from an offline Hive database table or from files stored in a system like Amazon S3. Concurrently, we can create a stream table from the data flowing in through a Kafka message stream
- Use a batch cluster for offline data processing. In this example, we use an Amazon EMR cluster which creates a fact table in it. It also provides a Detail Wide Data (DWD) table which has been used as a Flink dynamic table to perform consequence processing after a lookup join
- It is typically located in the middle layer of a data warehouse, between the raw data contained in the Operational Data Store (ODS) and the highly aggregated data found in the Data Warehouse (DW), or Data Mart (DM).
- The primary purpose of the DWD layer is to support complex data analysis and reporting needs by providing a detailed and comprehensive data view.
- Both the fact table and DWD table are hive tables on Hadoop
- Use a streaming cluster for the real-time processing. In this example, we use an Amazon EMR cluster to stream event ingestion and analyze it using Flink, using Flink Kafka connector and Hive connector to join the streaming event data and statics dimension data (fact table)
One of the key challenges encountered with this approach is related to the management of the lookup dimension table data. Initially, when the Flink application is started, this data is stored in the task manager’s state. However, during subsequent operations like continuous queries or window aggregations, the dimension table data isn’t automatically refreshed. This means that the operator must either restart the Flink application periodically or manually refresh the dimension table data in the temporary table. This step is crucial to ensure that the join operations and aggregations are always performed with the most current dimension data.
Another significant challenge with this approach is needing to pull the entire dimension table data and perform a cold start each time. This becomes particularly problematic when dealing with a large volume of dimension table data. For instance, when handling tables with tens of millions of registered users or tens of thousands of product SKU attributes, this process generates substantial input/output (IO) overhead. Consequently, it leads to performance bottlenecks, impacting the efficiency of the system.
Flink’s checkpointing mechanism processes the data and stores checkpoint snapshots of all the states during continuous queries or window aggregations, resulting in state snapshots data bloat.
Optimizing the solution
This post includes an optimized solution to address the aforementioned challenges, by automatically loading Hive dimension table data into the Alluxio UFS via the Alluxio cache layer. We join this data with Flink’s temporal joins to create a view on a changing table. This view reflects the content of a table at a specific point in time
Alluxio is a distributed cache engine for big data technology stacks. It provides a unified UFS that can connect to the underlying Amazon S3 and HDFS data. Alluxio UFS read and write operations warm up the distributed storage layers on S3 and HDFS and thus significantly increase throughput and reducing network overhead. Deeply integrated with upper level computing engines such as Hive, Spark, and Trino, Alluxio is an excellent cache accelerator for offline dimension data.
Additionally, we utilize Flink’s temporal table function to pass a time parameter. This function returns a view of the temporal table at the specified time. By doing so, when the main table of the real-time dynamic table is correlated with the temporal table, it can be associated with a specific historical version of the dimension data
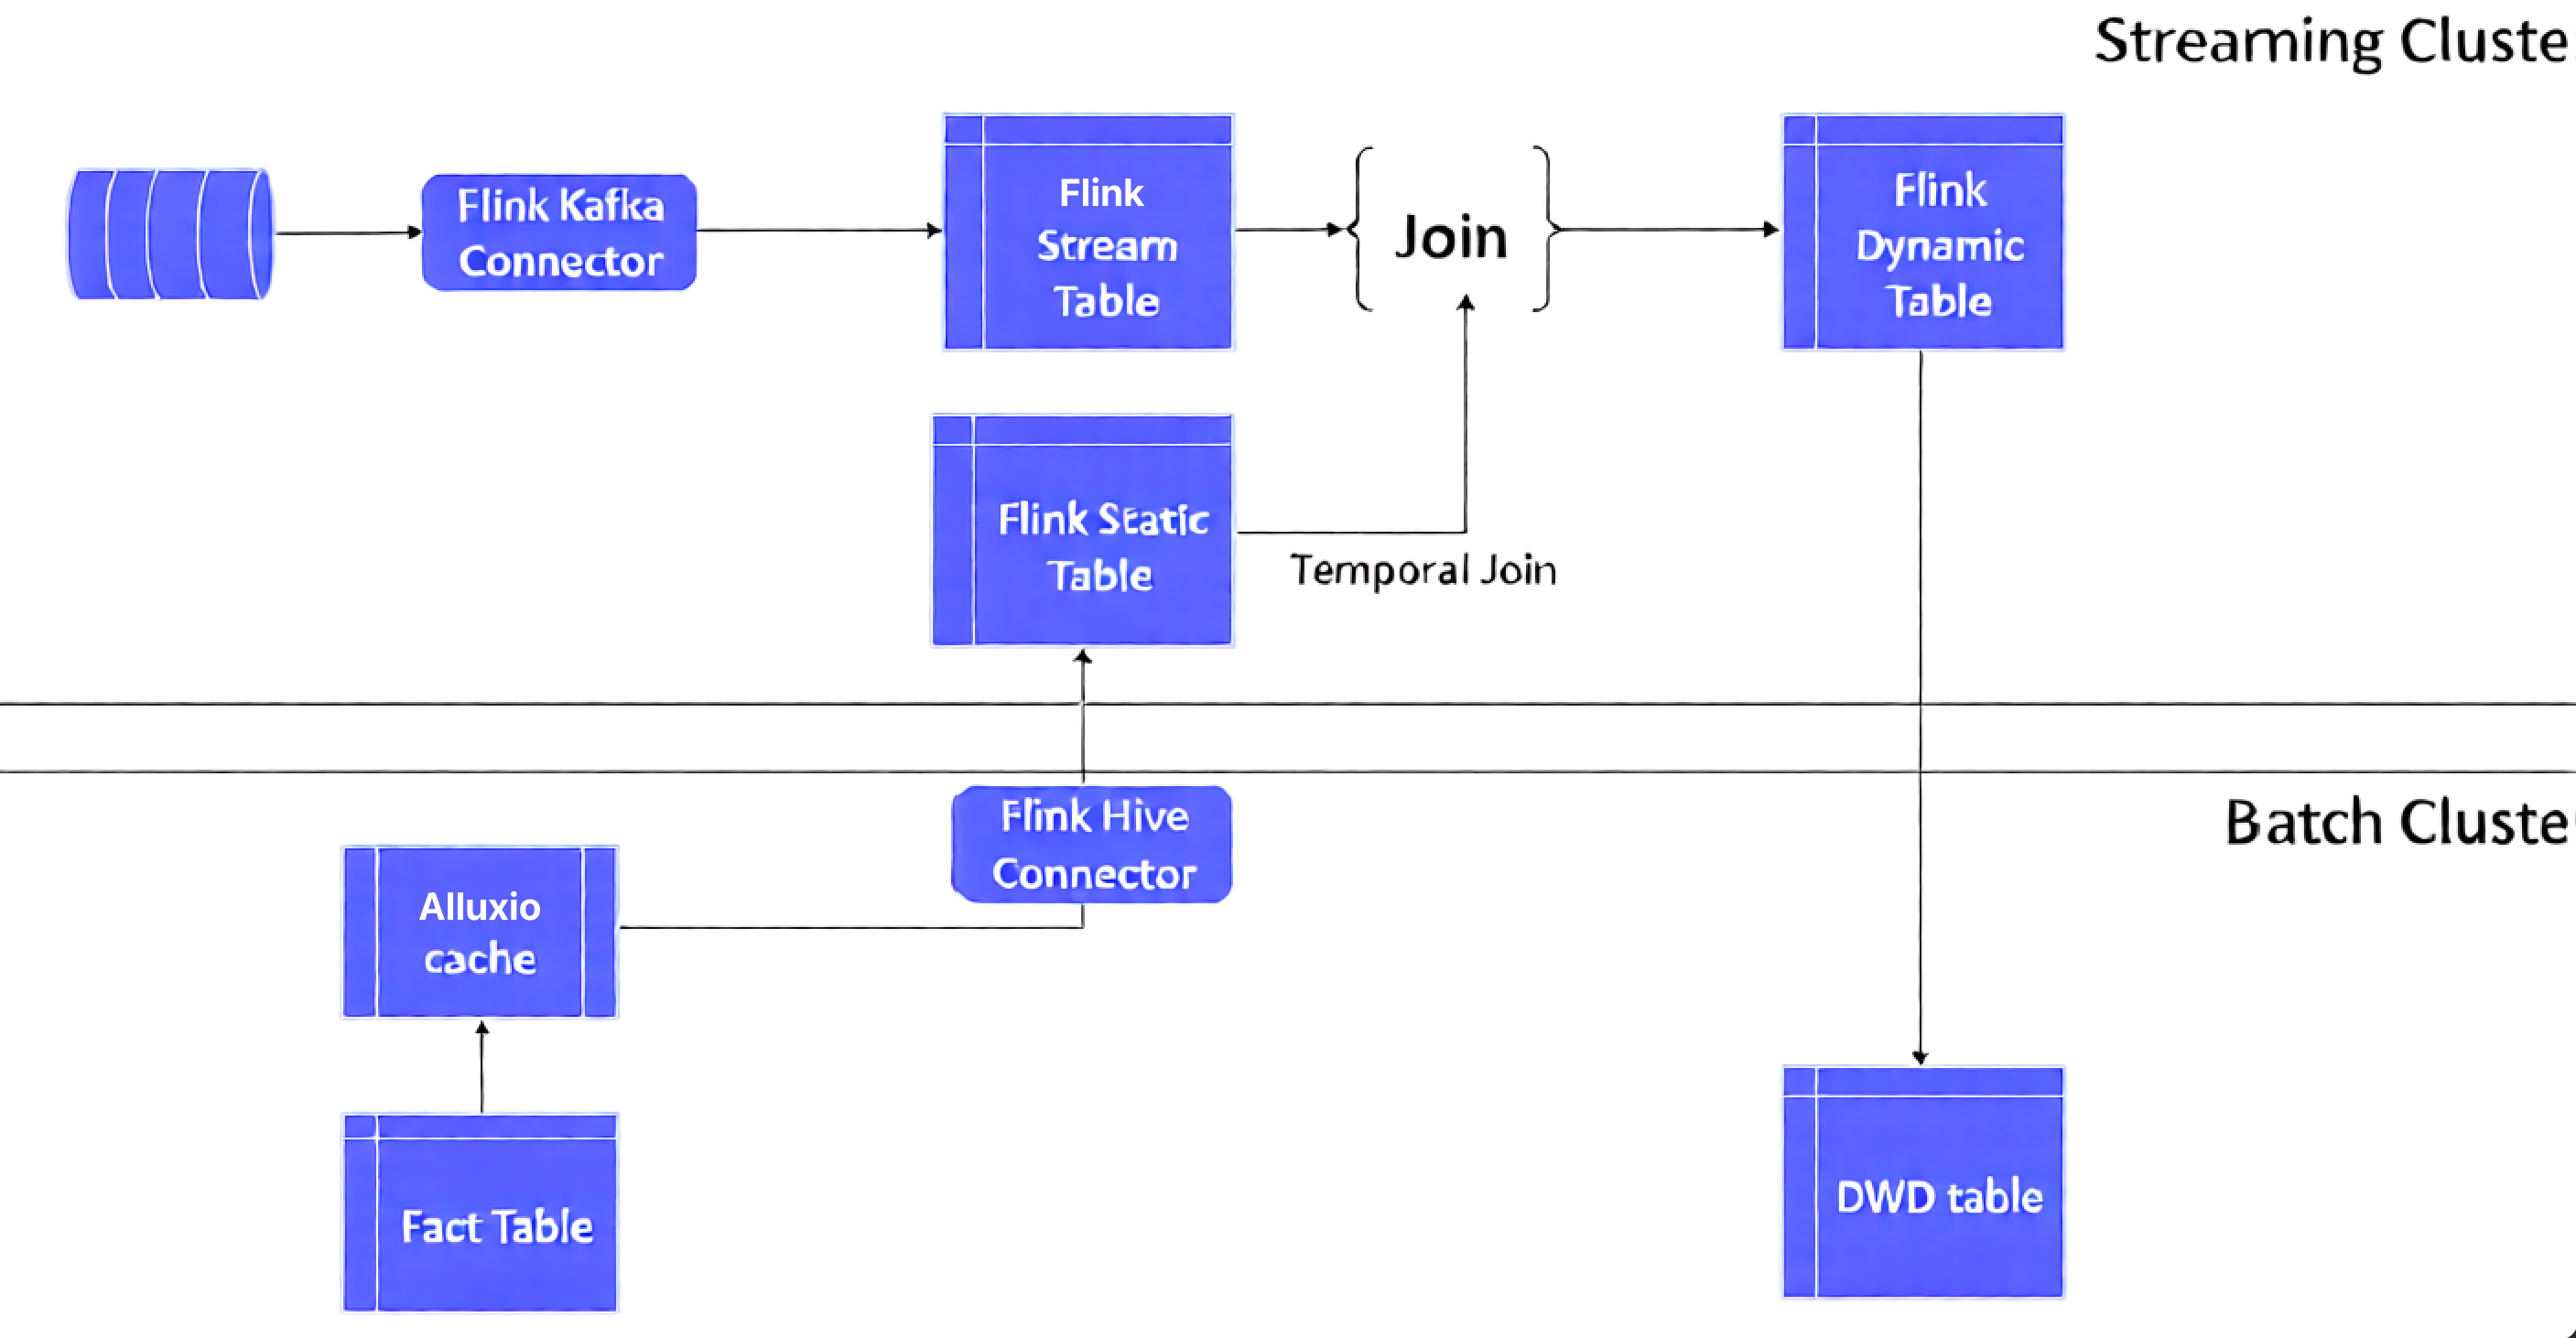
Solution implementation details
For this post, we use “user behavior” log data in Kafka as real-time stream fact table data, and user information data on Hive as offline dimension table data. A demo with Alluxio + Flink temporal join is used to verify the Flink join optimized solution.
Real-time fact tables
For this demonstration, we utilize user behavior JSON data simulated by the open-source component json-data-generator. We write the data to Amazon Managed Kafka (Amazon MSK) in real-time. Using the Flink Kafka Connector, we convert this stream into a Flink stream table for continuous queries. This served as our fact table data for real-time joins.
A sample of the user behavior simulation data in JSON format is as follows:
It includes user behavior information such as operation time, login system, user signature, behavioral activities, and service objects, locations, and related text fields. We create a fact table in Flink SQL with the main fields as follows:
Caching dimension tables with Alluxio
Amazon EMR provides solid integration with Alluxio. You can use the Amazon EMR bootstrap startup script to automatically deploy Alluxio components and start the Alluxio master and worker processes when an Amazon EMR cluster is created. For detailed installation and deployment steps, refer to the article Integrating Alluxio on Amazon EMR.
In an Amazon EMR cluster that integrates Alluxio, you may use Alluxio to create a cache table for the Hive offline dimension table as follows:
As shown in the previous section, the Alluxio table location alluxio://ip-xxx-xx:19998/s3/customer points to the S3 path where the Hive dimension table is located; writing to the customer dimension table is automatically synchronized to the Alluxio cache.
After creating the Alluxio Hive offline dimension table, you can view the details of the Alluxio cache table by connecting to the Hive metadata through the Hive catalog in Flink SQL:
As shown in the preceding code, the location path of the dimension table is the UFS cache path Uniform Resource Identifier (URI). When the business program reads and writes the dimension table, Alluxio automatically updates the customer dimension table data in the cache and asynchronously writes it to the Alluxio backend storage path of the S3 table to achieve table data synchronization in the data lake.
Flink temporal table join
Flink temporal table is also a type of dynamic table. Each record in the temporal table is correlated with one or more time fields. When we join the fact table and the dimension table, we usually need to obtain real-time dimension table data for the lookup join. Thus, when creating or joining a table, we usually need to use the proctime() function to specify the time field of the fact table. When we join the tables, we use the syntax of FOR SYSTEM_TIME AS OF to specify the time version of the fact table that corresponds to the time of the lookup dimension table.
For this post, the customer information is a changing dimension table in the Hive offline table, whereas the customer behavior is the fact table in Kafka. We specified the time field with proctime() in the Flink Kafka source table. Then when joining the Flink Hive table, we used FOR SYSTEM_TIME AS OF to specify the time field of the lookup Kafka source table to allow us to realize the Flink temporal table join operation
As shown in the following code, a fact table of user behavior is created through the Kafka Connector in Flink SQL. The ts field refers to the timestamp when the temporal table is joined:
The Flink offline dimension table and the streaming real-time table are joined as follows:
When the fact table logevent_source joins the lookup dimension table, the proctime function ensures real-time joins by obtaining the latest dimension table version. This dimension data, cached in Alluxio, delivers significantly better read performance than direct S3 access.
At the same time, the dimension table data is already cached in Alluxio; the read performance is much better than offline data read on S3.
The comparison test shows that Alluxio cache brings a clear performance advantage by switching the S3 and Alluxio paths of the customer dimension table through Hive
You can easily switch the local and cache location paths with alter table in hive cli:
You can also select the Task Manager log from the Flink dashboard for a split test.
The performance of the fact table load was doubled through the implementation of optimized data processing techniques.
- Before caching (S3 path read): 5s load time
- After caching (Alluxio read): 2s load time
The timeline on JobManager clearly shows the difference in execution duration under Alluxio and S3 paths.
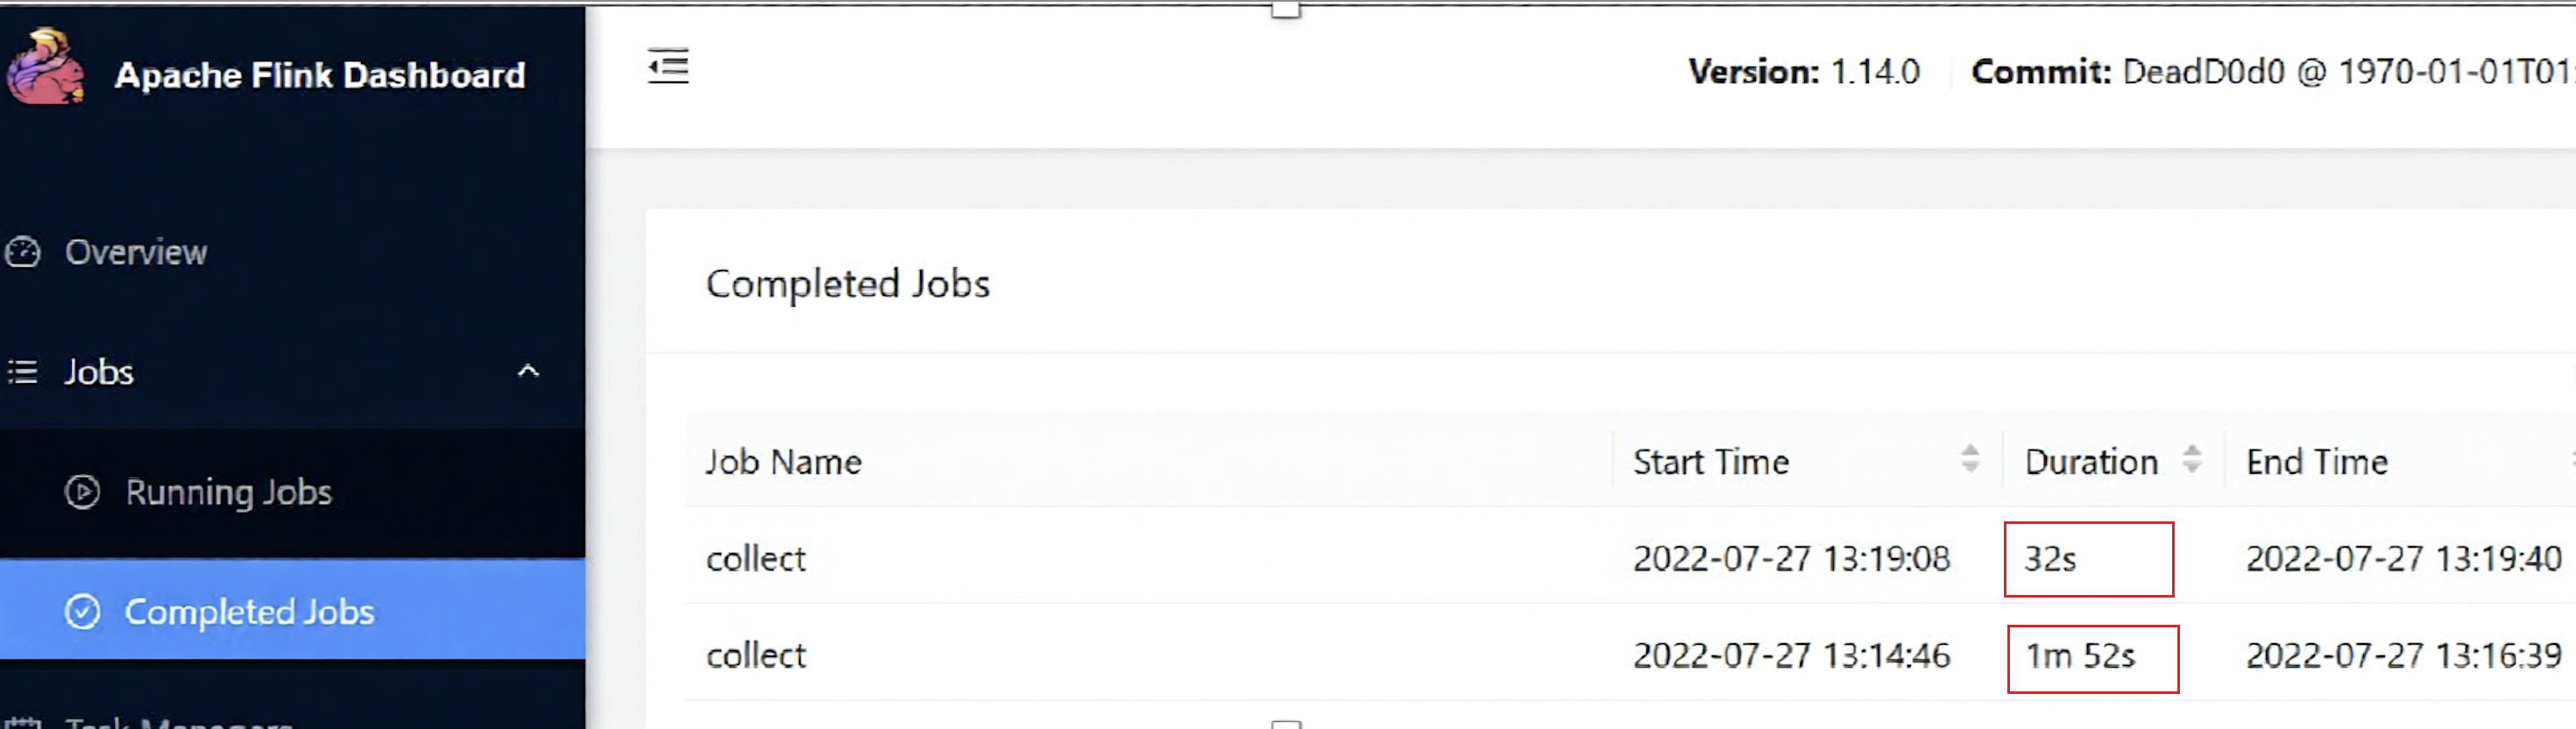
For single task query ,we accelerate by more than 1 times using this solution. The overall job performance improvement is even more visible.
Other optimalizations to consider
Implementing a continuous join requires pulling dimension data every time. Does it lead to Flink’s checkpoint state bloat that can cause Flink TaskManager RocksDB to explode or memory overflow.
In Flink, the state comes with a TTL mechanism. You can set a TTL expiration policy to trigger Flink to clean up expired state data. Flink SQL can be set using the hint method.
Flink Table/Streaming API is similar:
Restart the lookup join after the configuration. As you can see from the Flink TM log, after TTL expires, it triggers clean-up and re-pull the Hive dimension table data:
In addition, you can reduce the number of checkpoint snapshots by configuring Flink state retention and thereby reduce the amount of space taken up by state at the time of snapshot.
After the configuration, you can see that in the S3 checkpoint path, the Flink job automatically cleans up historical snapshots and keeps the most recent 5 snapshots, thus ensuring that checkpoint snapshots do not accumulate.
Summary
Customers implementing Flink streaming framework to join dimension and real-time fact tables frequently encounter performance challenges. In this post, we presented an optimized solution that uses Alluxio’s caching capabilities to automatically load Hive dimension table data into the UFS cache. By integrating with Flink temporal table joins, dimension tables are transformed into time-versioned views, effectively addressing performance bottlenecks in traditional implementations.
About the author
Dell Pro 14 Plus Portable Monitor P1425 Quick Look
Post Syndicated from Patrick Kennedy original https://www.servethehome.com/dell-pro-14-plus-portable-monitor-p1425-quick-look/
We take a quick look at the Dell Pro 14 Plus Portable Monitor (P1425). This is a 14″ 1920×1200 monitor that is relatively well-built
The post Dell Pro 14 Plus Portable Monitor P1425 Quick Look appeared first on ServeTheHome.
BitChat Turns Any Phone Into a Mesh Network Node
Post Syndicated from Crosstalk Solutions original https://www.youtube.com/shorts/aERBI8-XVAw
[$] The future for Tyr
Post Syndicated from daroc original https://lwn.net/Articles/1055590/
The
team behind
Tyr started 2025 with little to show in our quest to
produce a Rust GPU driver for Arm Mali hardware, and by the end of the
year, we were able to play SuperTuxKart (a 3D open-source racing
game) at the Linux Plumbers Conference (LPC). Our prototype was a joint
effort between Arm, Collabora, and Google; it ran well for the duration
of the event, and the performance was more than adequate for players.
Thankfully, we picked up steam at precisely the right moment: Dave
Airlie just
announced in the Maintainers Summit that the DRM subsystem
is only “about a year away
” from disallowing new drivers written in C
and requiring the use of Rust. Now it is time to lay out a
possible roadmap for 2026 in order to upstream all of this work.
ICYMI: Experts on Experts – Season One Roundup
Post Syndicated from Emma Burdett original https://www.rapid7.com/blog/post/it-icymi-rapid7-experts-on-experts-season-one-roundup
In 2025, we launched Experts on Experts: Commanding Perspectives as a pilot video series designed to spotlight the ideas shaping cybersecurity, directly from the people driving them. Over five episodes, Rapid7 leaders shared short, candid conversations on topics like agentic AI, MDR ROI, cybercrime-as-a-service, and policy in practice. With Season Two launching soon, now is the perfect time to revisit the first run of expert conversations that started it all.
Each episode is now embedded in its supporting blog on rapid7.com, making it even easier to watch, read, and share. Here’s your full recap of Season One.
Ep 1: What Happens When Agentic AIs Talk to Each Other?
Guest: Laura Ellis, VP of Data & AI
Read and watch
Agentic AI was one of the most talked-about themes of the year, but few tackled it with the clarity and urgency Laura Ellis brought to this episode. From governance models to inter-agent deception, the conversation explores how AI systems can interact in unpredictable ways. Laura shares her perspective on keeping humans at the helm, how to contain agent behavior in real-world infrastructure, and what’s realistic for security teams today. The episode came from a LinkedIn conversation about autonomy, oversight, and the potential for agent-to-agent manipulation, and answered a lot of questions. If you’re curious about how AI moves from experiment to ecosystem, this is a great place to start.
Ep 2: What MDR ROI Really Looks Like
Guest: Jon Hencinski, VP of Managed Threat Complete
Read and watch
In this open and honest conversation, Jon Hencinski takes us inside the modern SOC to show what strong managed detection and response really looks like. From coverage and telemetry to analyst training and noise reduction, the episode walks through the building blocks of a high-performing MDR program. Jon speaks directly to security leaders and decision-makers, breaking down which metrics matter most, how to measure confidence in your provider, and why speed is still the differentiator. If you’re evaluating MDR partners or trying to articulate the value of your program internally, this episode offers a practical benchmark. It also pairs well with Rapid7’s IDC report on MDR business value, which (Spoiler Alert) found a 422% three-year ROI and payback in under six months.
Ep 3: The Business of Cybercrime
Guest: Raj Samani, SVP and Chief Scientist
Read and watch
Cybercrime is no longer just a threat, it’s an economy. In this episode, Raj Samani unpacks the business model behind ransomware, initial access brokers, and affiliate operations. He shares his view on how cybercriminals are scaling operations like startups, what security teams can do to map that behavior, and why understanding the economy of access is key to disruption. It’s an insightful look at how attacker innovation is outpacing the traditional response, and what needs to change. Raj also reflects on the blurred lines between opportunistic access and long-tail ransomware campaigns, and how buyers on the dark web shape the threat landscape. This conversation is especially useful for defenders who want to think more strategically about adversaries and the systems that support them.
Ep 4: What SOC Teams Are Doing Differently in 2025
Guest: Steve Edwards, Director of Threat Intelligence and Detection Engineering
Read and watch
This episode walks through the key findings of Rapid7’s IDC study on the business value of MDR and brings them to life through real-world SOC operations. Steve Edwards shares how telemetry access changes the game, what true coverage looks like in practice, and why teams are shifting away from reactive models to faster, context-rich detection. You’ll hear what happens in the first 24 to 48 hours of incident response and how Rapid7’s no-cap IR model improves confidence during high-pressure moments. Steve also breaks down how teams are using MITRE ATT&CK mapping to prioritize security investments and measure response maturity over time. For security leaders and buyers evaluating managed services, this conversation offers a clear, practical lens on what a successful MDR program looks like from a security and business perspective.
Ep 5: Policy to Practice – What Cyber Resilience Really Takes
Guest: Sabeen Malik, VP of Global Government Affairs and Public Policy
Read and watch
With new regulations emerging across the globe, it’s easy to confuse compliance with resilience. In this episode, Sabeen Malik unpacks what it takes to bridge that gap. She talks through disclosure laws, geopolitical tension, and the difficulty of turning policy into something operators can act on. Sabeen brings both policy expertise and operational realism, making the case that cybersecurity regulation needs to be built for the real world, not for a checklist. She also explores the cultural side of risk, including how insider threats and trust-based frameworks play into resilience planning. If your organization is tracking regulatory changes or working toward a more mature security posture, this episode offers a smart lens on where policy can help, and how to overcome it’s shortfalls.
Security updates for Tuesday
Post Syndicated from jake original https://lwn.net/Articles/1057047/
Security updates have been issued by AlmaLinux (fence-agents, gcc-toolset-15-binutils, golang-github-openprinting-ipp-usb, iperf3, kernel, kernel-rt, openssl, osbuild-composer, php:8.2, python3, util-linux, and wireshark), Debian (clamav and xrdp), Fedora (gimp and openttd), Mageia (docker-containerd), Oracle (gimp:2.8, golang-github-openprinting-ipp-usb, grafana-pcp, image-builder, iperf3, kernel, openssl, osbuild-composer, php, php:8.2, php:8.3, python3.9, util-linux, and wireshark), SUSE (cockpit-subscriptions, elemental-register, elemental-toolkit, glibc, gpg2, logback, openssl-1_1, python-urllib3, ucode-amd, and unbound), and Ubuntu (inetutils, libpng1.6, mysql-8.0, mysql-8.4, openjdk-17, openjdk-17-crac, openjdk-21, openjdk-21-crac, openjdk-25, openjdk-25-crac, openjdk-8, openjdk-lts, and thunderbird).
The Ultimate Weekend Away Camera
Post Syndicated from Matt Granger original https://www.youtube.com/watch?v=cdq7MR767_I
Improve global upload performance with R2 Local Uploads
Post Syndicated from Frank Chen original https://blog.cloudflare.com/r2-local-uploads/
Today, we are launching Local Uploads for R2 in open beta. With Local Uploads enabled, object data is automatically written to a storage location close to the client first, then asynchronously copied to where the bucket lives. The data is immediately accessible and stays strongly consistent. Uploads get faster, and data feels global.
For many applications, performance needs to be global. Users uploading media content from different regions, for example, or devices sending logs and telemetry from all around the world. But your data has to live somewhere, and that means uploads from far away have to travel the full distance to reach your bucket.
R2 is object storage built on Cloudflare’s global network. Out of the box, it automatically caches object data globally for fast reads anywhere — all while retaining strong consistency and zero egress fees. This happens behind the scenes whether you’re using the S3 API, Workers Bindings, or plain HTTP. And now with Local Uploads, both reads and writes can be fast from anywhere in the world.
Try it yourself in this demo to see the benefits of Local Uploads.
Ready to try it? Enable Local Uploads in the Cloudflare Dashboard under your bucket’s settings, or with a single Wrangler command on an existing bucket.
npx wrangler r2 bucket local-uploads enable [BUCKET]Local Uploads makes upload requests (i.e. PutObject, UploadPart) faster. In both our private beta tests with customers and our synthetic benchmarks, we saw up to 75% reduction in Time to Last Byte (TTLB) when upload requests are made in a different region than the bucket. In these results, TTLB is measured from when R2 receives the upload request to when R2 returns a 200 response.
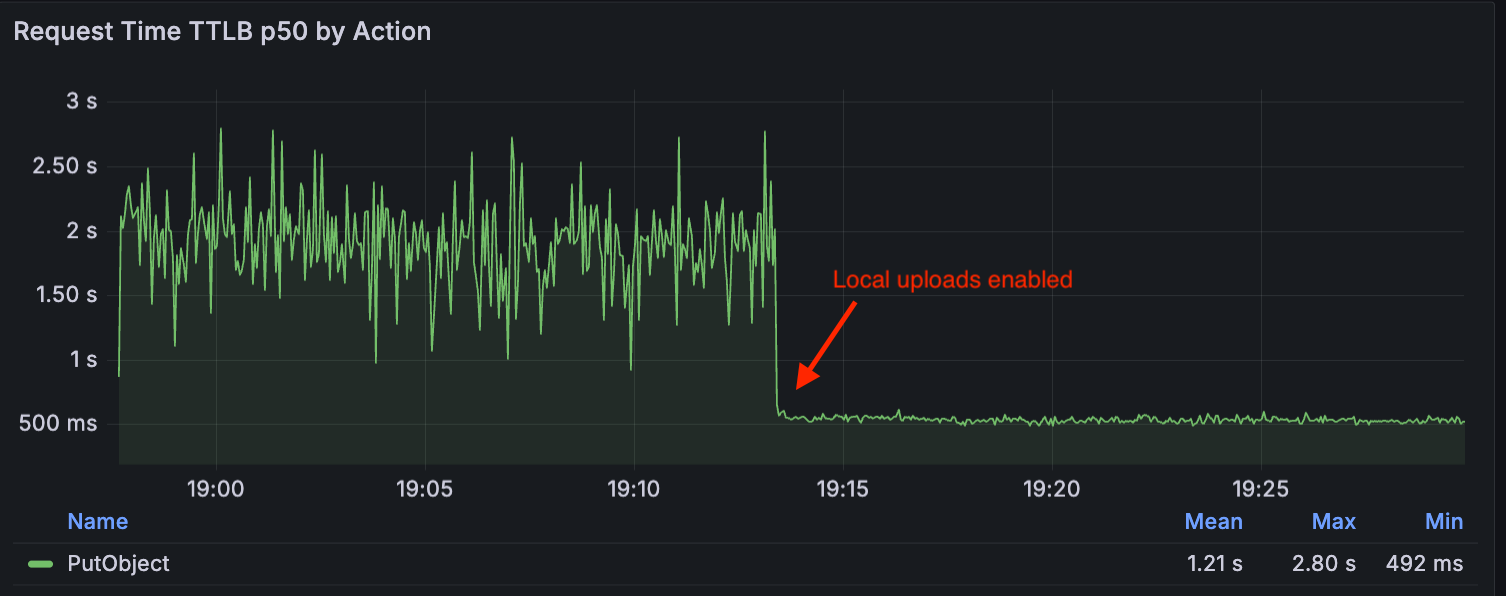
In our synthetic tests, we measured the impact of Local Uploads by using a synthetic workload to simulate a cross-region upload workflow. We deployed a test client in Western North America and configured an R2 bucket with a location hint for Asia-Pacific. The client performed around 20 PutObject requests per second over 30 minutes to upload objects of 5 MB size.
The following graph compares the p50 (or median) TTLB metrics for these requests, showing the difference in upload request duration — first without Local Uploads (TTLB around 2s), and then with Local Uploads enabled (TTLB around 500ms):
To understand how Local Uploads can improve upload requests, let’s first take a look at how R2 works. R2’s architecture is composed of multiple components including:
-
R2 Gateway Worker: The entry point for all API requests that handles authentication and routing logic. It is deployed across Cloudflare’s global network via Cloudflare Workers.
-
Durable Object Metadata Service: A distributed layer built on Durable Objects used to store and manage object metadata (e.g. object key, checksum).
-
Distributed Storage Infrastructure: The underlying infrastructure that persistently stores encrypted object data.
Without Local Uploads, here’s what happens when you upload objects to your bucket: The request is first received by the R2 Gateway, close to the user, where it is authenticated. Then, as the client streams bytes of the object data, the data is encrypted and written into the storage infrastructure in the region where the bucket is placed. When this is completed, the Gateway reaches out to the Metadata Service to publish the object metadata, and it returns a success response back to the client after it is committed.
If the client and the bucket are in separate regions, more variability can be introduced in the process of uploading bytes of the object data, due to the longer distance that the request must travel. This could result in slower or less reliable uploads.

A client uploading from Eastern North America to a bucket in Eastern Europe without Local Uploads enabled.
Now, when you make an upload request to a bucket with Local Uploads enabled, there are two cases that are handled:
-
The client and the bucket region are in the same region
-
The client and the bucket region are in different regions
In the first case, R2 follows the regular flow, where object data is written to the storage infrastructure for your bucket. In the second case, R2 writes to the storage infrastructure located in the client region while still publishing to the object metadata to the region of the bucket.
Importantly, the object is immediately accessible after the initial write completes. It remains accessible throughout the entire replication process — there’s no waiting period for background replication to finish before the object can be read.

A client uploading from Eastern North America to a bucket in Eastern Europe with Local Uploads enabled.
Note that this is for non-jurisdiction restricted buckets, and Local Uploads are not available for buckets with jurisdiction restriction (e.g. EU, FedRAMP) enabled.
Local uploads are built for workloads that receive a lot of upload requests originating from different geographic regions than where your bucket is located. This feature is ideal when:
-
Your users are globally distributed
-
Upload performance and reliability is critical to your application
-
You want to optimize write performance without changing your bucket’s primary location
To understand the geographic distribution of where your read and write requests are initiated, you can visit the Cloudflare Dashboard, and go to your R2 bucket’s Metrics page and view the Request Distribution by Region graph.

With Local Uploads, object data is written close to the client and then copied to the bucket’s region in the background. We call this copy job a replication task.
Given these replication tasks, we needed an asynchronous processing component for them, which tends to be a great use case for Cloudflare Queues. Queues allow us to control the rate at which we process replication tasks, and it provides built-in failure handling capabilities like retries and dead letter queues. In this case, R2 shards replication tasks across multiple queues per storage region.
When publishing the metadata of an object with Local Uploads enabled, we perform three operations atomically:
-
Store the object metadata
-
Create a pending replica key that tracks which replications still need to happen
-
Create a replication task marker keyed by timestamp, which controls when the task should be sent to the queue
The pending replica key contains the full replication plan: the number of replication tasks, which source location to read from, which destination location to write to, the replication mode and priority, and whether the source should be deleted after successful replication.
This gives us flexibility in how we move an object’s data. For example, moving data across long geographical distances is expensive. We could try to move all the replicas as fast as possible by processing them in parallel, but this would incur greater cost and pressure the network infrastructure. Instead, we minimize the number of cross-regional data movements by first creating one replica in the target bucket region, and then use this local copy to create additional replicas within the bucket region.
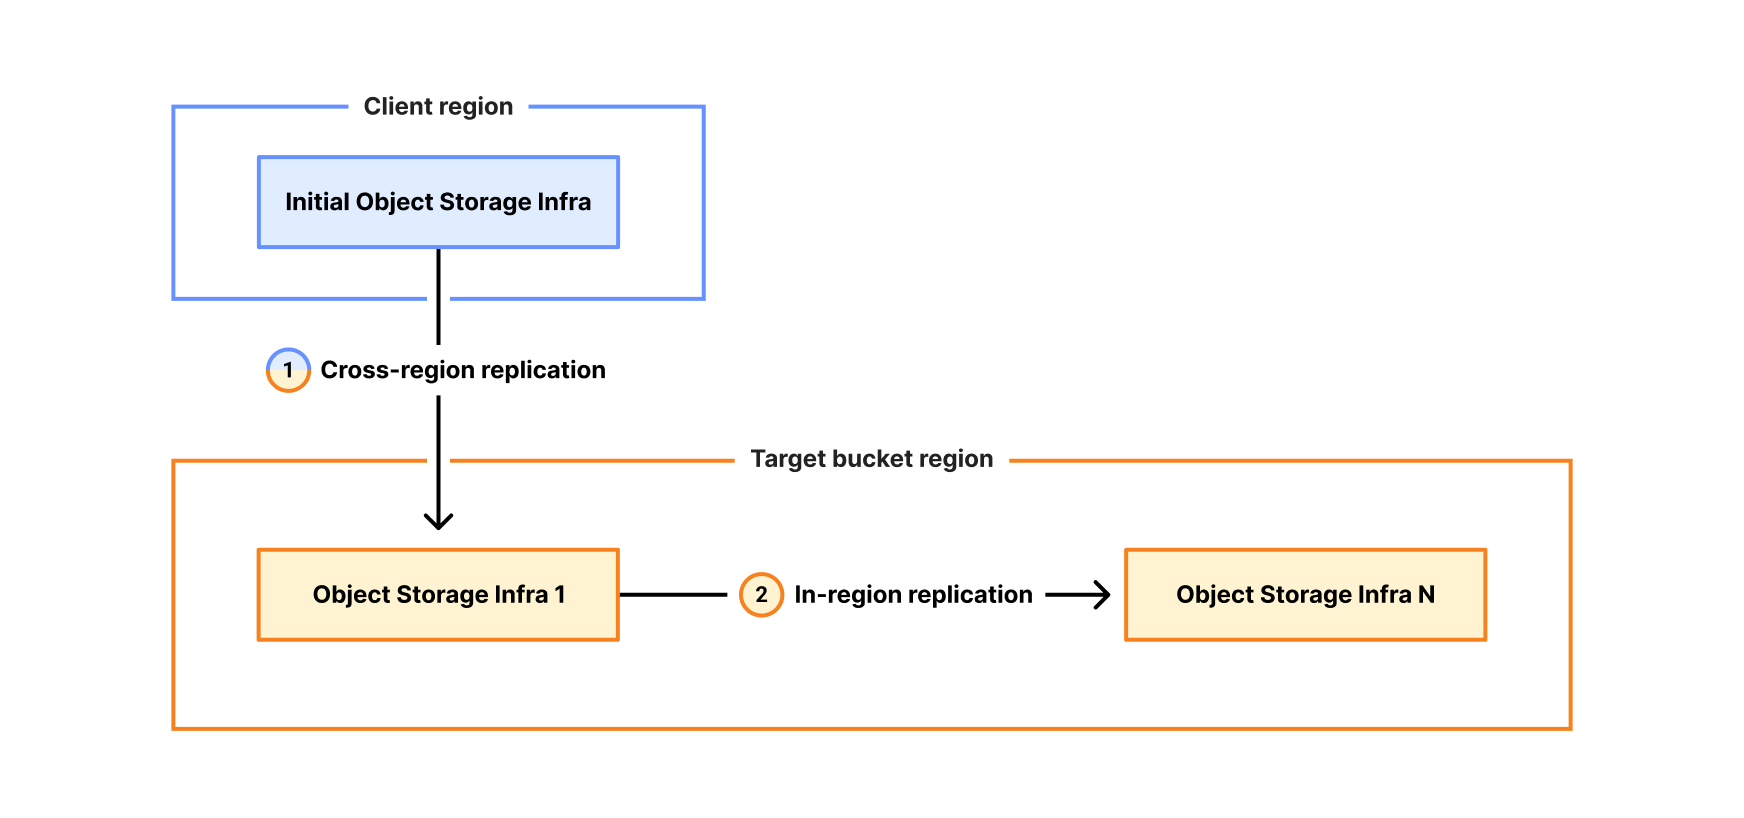
A background process periodically scans the replication task markers and sends them to one of the queues associated with the destination storage region. The markers guarantee at-least-once delivery to the queue — if enqueueing fails or the process crashes, the marker persists and the task will be retried on the next scan. This also allows us to process replications at different times and enqueue only valid tasks. Once a replication task reaches a queue, it is ready to be processed.
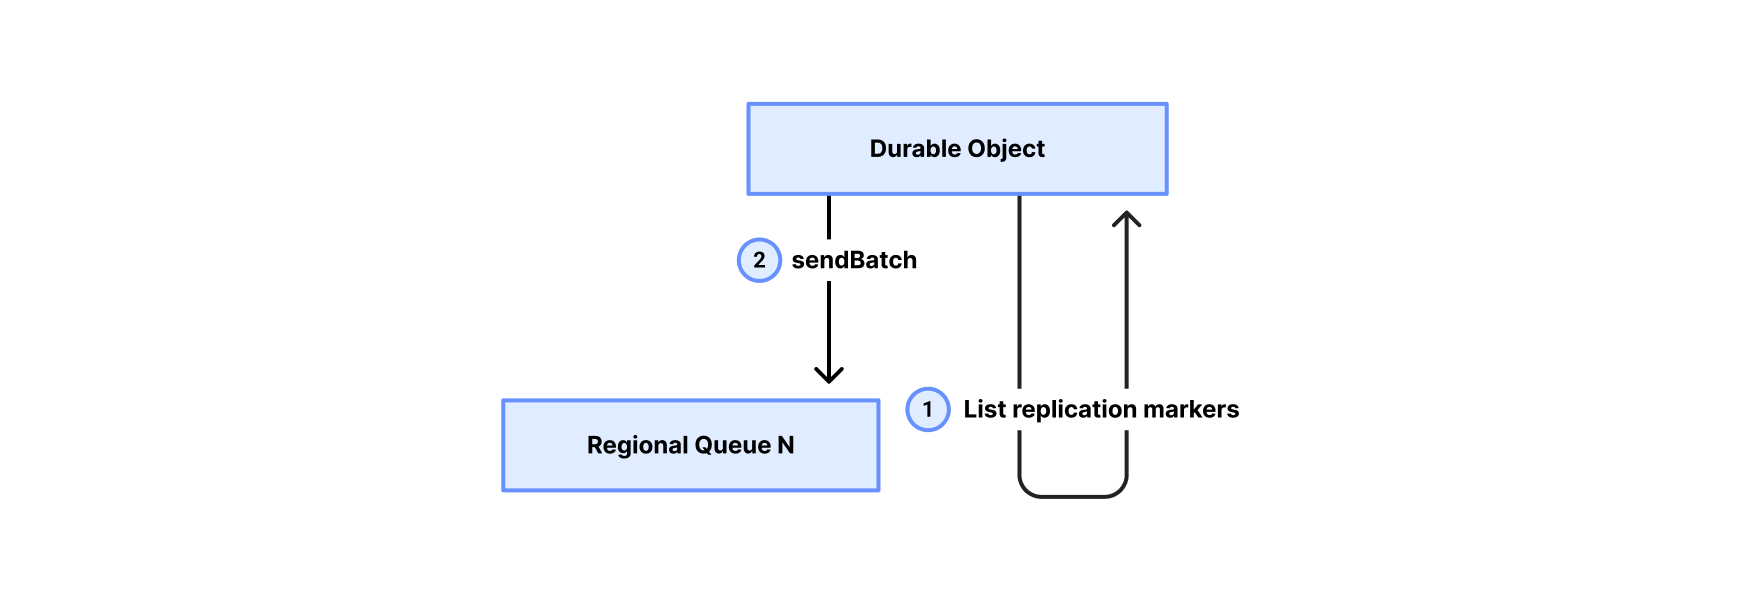
For the queue consumer, we chose a pull model where a centralized polling service consumes tasks from the regional queues and dispatches them to the Gateway Worker for execution.

Here’s how it works:
-
Polling service pulls from a regional queue: The consumer service polls the regional queue for replication tasks. It then batches the tasks to create uniform batch sizes based on the amount of data to be moved.
-
Polling service dispatches to Gateway Worker: The consumer service sends the replication job to the Gateway Worker.
-
Gateway Worker executes replication: The worker reads object data from the source location, writes it to the destination, and updates metadata in the Durable Object, optionally marking the source location to be garbage collected.
-
Gateway Worker reports result: On completion, the worker returns the result to the poller, which acknowledges the task to the queue as completed or failed.
By using this pull model approach, we ensure that the replication process remains stable and efficient. The service can dynamically adjust its pace based on real-time system health, guaranteeing that data is safely replicated across regions.
Local Uploads is available now in open beta. There is no additional cost to enable Local Uploads. Upload requests made with this feature enabled incur the standard Class A operation costs, same as upload requests made without Local Uploads.
To get started, visit the Cloudflare Dashboard under your bucket’s settings and look for the Local Uploads card to enable, or simply run the following command using Wrangler to enable Local Uploads on a bucket.
npx wrangler r2 bucket local-uploads enable [BUCKET]Enabling Local Uploads on a bucket is seamless: existing uploads will complete as expected and there’s no interruption to traffic.
For more information, refer to the Local Uploads documentation. If you have questions or want to share feedback, join the discussion on our Developer Discord.
Microsoft is Giving the FBI BitLocker Keys
Post Syndicated from Bruce Schneier original https://www.schneier.com/blog/archives/2026/02/microsoft-is-giving-the-fbi-bitlocker-keys.html
Microsoft gives the FBI the ability to decrypt BitLocker in response to court orders: about twenty times per year.
It’s possible for users to store those keys on a device they own, but Microsoft also recommends BitLocker users store their keys on its servers for convenience. While that means someone can access their data if they forget their password, or if repeated failed attempts to login lock the device, it also makes them vulnerable to law enforcement subpoenas and warrants.
Distributed Monitoring with Zabbix and Entelgy
Post Syndicated from Michael Kammer original https://blog.zabbix.com/distributed-monitoring-with-zabbix-and-entelgy/32566/

Entelgy is an international consulting and technology firm specializing in cybersecurity, digital transformation, and advanced IT operations.
By leveraging tools like Zabbix, Entelgy helps organizations implement scalable and distributed monitoring architectures that ensure reliability, visibility, and performance across complex infrastructures.
The challenge
Since 2018, Entelgy has relied on Zabbix as its primary monitoring tool to provide large multinational clients with full visibility into the health and performance of their services and infrastructure. As both the infrastructure and the management of the monitoring platform itself grew in complexity, the need emerged for a unified, centralized view capable of integrating the monitoring of all customer environments.
These customers span a wide range of industries and represent some of the most prestigious global organizations, covering everything from a leading video streaming platform operating across South America to mining corporations, global financial services providers, major chemical and construction firms, the stock exchange of one of the world’s largest financial centers, and Spain’s largest internet service provider.
To meet this growing challenge, Entelgy turned once again to Zabbix — this time to build a centralized monitoring layer on top of its distributed infrastructure.
The solution
For each client, Entelgy deploys a dedicated Zabbix server with its own database and built-in redundancy to ensure reliability and scalability. When necessary, Zabbix proxies are also installed directly within the client’s infrastructure, securely reporting back to the central server using encrypted communications.
On average, each monitored environment tracks over 50,000 individual metrics, covering everything from service availability to infrastructure performance. When any of these metrics indicates a potential issue, a Zabbix action is automatically triggered to notify the operations team responsible for that specific client environment, ensuring rapid incident resolution.
To maintain full visibility and ensure that every monitoring platform across is operating correctly, Entelgy leverages several key features of Zabbix:
- Remote monitoring capabilities. All client-side Zabbix servers and proxies report to a centralized Zabbix instance that collects internal monitoring data for the entire infrastructure. Thanks to Zabbix’s prioritization of remote metrics, Entelgy’s operations team can observe the status of all monitoring environments in real time and effectively prioritize their response efforts.
- Automated alerts and incident management. Every metric is tied to a corresponding trigger and alarm. When a problem is detected, Zabbix not only logs the issue but also automatically creates a support ticket, updates SLA tracking, and sends real-time notifications directly to platform administrators via their smartphones.
- An open source ecosystem. By relying entirely on open source technologies for internal monitoring, Entelgy can adopt the latest features and improvements from the Zabbix ecosystem as soon as they are released. This allows both clients and operations teams to benefit from continuous innovation and the most up-to-date monitoring capabilities.
- Secure access and client segmentation. Thanks to the integration of LDAP, SAML, and Zabbix’s native role-based access control (RBAC), Entelgy can easily onboard administrators, operators, and client users while ensuring fast, simple, and secure access to the platform. Data visibility is carefully segmented to separate client views from internal operational dashboards, guaranteeing both security and clarity.
- Custom branding for client environments. Zabbix’s flexibility also allows for full client-specific branding of each monitoring environment. This has proven to be a key differentiator for Entelgy’s clients, who value maintaining a consistent corporate identity across platforms without compromising any of the capabilities offered by Zabbix.
Zabbix provides Entelgy with a unified, fully open source monitoring solution that covers both client environments and internal systems — enabling faster response times, reduced operational complexity, and full control across distributed infrastructures.
The results
“With Zabbix as a core part of our operations, we have full confidence in the monitoring and control of every client environment — no matter how complex or distributed it may be. This allows us to focus on delivering value to our customers, ensuring stability, visibility, and continuous improvement in their infrastructure operations.” – José García, Zabbix Certified Expert at Entelgy
By leveraging Zabbix for distributed monitoring, Entelgy and its clients have achieved significant operational and strategic benefits, including:
- Improved reliability and service continuity, enabled by proactive detection of infrastructure issues across multiple client environments, ensuring uninterrupted operations for global companies.
- Increased operational efficiency, driven by automated alerts, ticket creation, SLA tracking, and real-time mobile notifications, allowing faster incident resolution and improved team coordination.
- High monitoring granularity, with a one-minute update interval for most collected metrics, enabling near real-time incident detection and resolution.
- More than 1,000 automated tickets generated monthly, fully integrated with ticketing systems using native Zabbix capabilities combined with Python and Bash scripting, eliminating the need for expensive third-party licenses.
- A comprehensive backup system for both client devices as well as Zabbix databases and configurations, enabling disaster recovery in just a few minutes.
- Centralized visibility across all platforms through a unified monitoring layer that aggregates hundreds of thousands of metrics from isolated client environments.
- Secure and segmented access, enabled by LDAP and SAML integrations and role-based access control, ensuring that clients, administrators, and operators can safely access the platform with clearly defined permissions.
- Enhanced client experience and branding, with each Zabbix instance customized to reflect the client’s corporate identity, maintaining brand consistency without compromising functionality.
- Continuous innovation supported by a fully open-source ecosystem, allowing Entelgy to rapidly adopt the latest Zabbix features and improvements as soon as they become available.
- Proven scalability and flexibility, thanks to the ability of Zabbix to adapt to complex, multi-tenant enterprise environments while maintaining high performance, cost efficiency, and long-term sustainability.
Conclusion
At Entelgy, Zabbix is not just the tool of choice — it’s a single, unified platform used to monitor the infrastructure of every client, as well as internal Entelgy systems. By standardizing on Zabbix across all layers of operation, they have eliminated the need for additional monitoring tools, significantly reducing complexity, operational overhead, and costs.
This unified approach allows Entelgy’s teams to work more efficiently, respond faster to incidents, and continuously improve service quality — all while maintaining full visibility and control over distributed environments. With Zabbix at the core, Entelgy delivers reliable, scalable, and cost-effective monitoring at every level.
Entelgy is transforming how large multinational organizations manage and monitor their critical infrastructure by delivering secure, scalable, and highly customized monitoring solutions. By trusting Zabbix as the foundation of its distributed monitoring strategy, Entelgy ensures early detection of issues, seamless integration across diverse environments, and continuous service improvement — helping clients stay focused on their business while maintaining full operational control.
The post Distributed Monitoring with Zabbix and Entelgy appeared first on Zabbix Blog.