Aruba Central is a SaaS solution that allows you to manage your Enterprise Aruba network environment. Due to the increasing number of cloud migrations, we can expect that more and more Aruba customers will move their on-premise environment to it, which will also mean a change in their monitoring environment. In this article, I will show you how to switch to API- based monitoring using Aruba Central and Zabbix. All custom resources mentioned can be found in my repository.
Aruba Central’s API
Oauth 2.0 is used, so you can forget the simple token management. At the end it is great, but for monitoring purposes it is overkill. There is pretty good documentation (referred to later) regarding how you can generate your access token, but after two hours it expires so you need to continually refresh it. To do this, you must use a refresh token, which can help you to get a new access token AND a new refresh token.
Within two hours, use the latest refresh token to repeat this action again. At this point you can imagine that this is not something you can implement easily by using the Zabbix GUI only. Well, maybe with some javascript magic, but otherwise there is no native support for this logic at this point of time. So how can we do this? In short:
Generate your client credentials
Generate your first token
Schedule the token refresh for every two hours
Update your host macro via Zabbix API
Use the token in Zabbix HTTP agent checks
Monitor your environment based on JSONPath pre-processing
Initial steps within Aruba Central
To manage your API access, you need to launch your “HPE Aruba Networking Central” application, so do NOT look into your workspace modules – the “Personal API clients” menu is NOT what we are looking for. Turn off the “New Central” view – at this point the early access version is not so useful (hopefully it will change soon).
The first time you get there, you will not see any items, but under the “My Apps & Tokens” tab you can click the “Add Apps & Tokens” button and generate it. Technically, this is already enough to start to monitoring your network infrastructure, but within two hours it would stop. So the relevant data for us are the “Client ID” and “Client Secret.” Feel free to revoke the recently created token at the bottom area as we do not need it.
Record your credentials
For this article, I am using a simple file to store all the credentials, which will be sourced into a bash script. Please keep in mind that storing your sensitive credentials in a single file is a BAD practice! Your SECO/CISO would probably have a few words with you about it, so please consider a better approach. A more secure way would be to use some Key Vault solution (like Azure, AWS, Google, or Hashicorp). Anyway, let’s continue with this unsecure example:
#!/bin/bash

### ZABBIX VARS ###

# URL of your zabbix instance (assuming you do not use the "/zabbix" ending, if yes, then add it to the end)
zabbix_url="https://your.zabbix.instance.net"
# Your Zabbix API token. If you do not know how to get it, check the documentation.
zabbix_api_token="1234_your_zabbix_api_key_5678"
# Create a host with a macro, remain at the "Macros" tab, turn on debug mode, look for "[hostmacroid] =>"
zabbix_macro_id="12345"

### ARUBA VARS ###
# To find yours, go here and check "Table: Domain URLs for API Gateway Access"
base_url="YOUR_ARUBA_CENTRAL_BASE_URL"
# Click on your profile in the Central app and you will find it there: 32 char long hexa string
client_id="YOUR_CLIENT_ID"
# provided in the previous step
client_secret="YOUR_CLIENT_ID"
# provided in the previous step
customer_id="YOUR_CUSTOMER_ID"
# your login credential
account_username="YOUR_CENTRAL_LOGIN_USERNAME"
# your login credential
account_password="YOUR_CENTRAL_LOGIN_PASSWORD"
# to be populated later
csrftoken=""
session=""
auth_code=""
Get or refresh your token and update the Zabbix host macro
The next steps are based on the official Aruba documentation, which you can find here. Please remember that there are many ways to achieve our target – this is just one example and probably not the most optimal one. Feel free to change / improve it with your code in your preferred scripting language.
The below script assumes that the file containing the credentials (previous step) is named as “variables” and located in the folder named “central.”
Filename: aruba_central_token_new.sh
Purpose: To be used for first time token generation. Later, you only have to refresh your token with the script after this one.
Remarks: Aruba is limiting this API query set, so you can run it only ONCE every 30 minutes! If you made a typo somewhere, wait 30 minutes before your next attempt or tweak the result files.
Purpose: To refresh your existing token. It is expecting an existing refresh token in the “token_refresh.latest” file, so better to run the previous script one time before this.
Remarks: You can run this script as many times you want, but it will result in new tokens only once per every two hours (when the current one expires). Therefore, refreshing too frequently is pointless.
In my case, both the scripts and variables files are in the same “central” folder, which is in a git repository. Each time I call one of the scripts, it will record the new tokens in files, which are committed and pushed to the repo. In my own implementation, this is how I call the refresh script and sync the result with my repo:
You must run your refresh script at least once per every two hours. To make this happen you have many options, including:
cron (old-school, outdated way)
systemctl timer (a better way, but only if it is monitored)
Jenkins / Github Actions/etc.
Zabbix itself, by calling your bash script
In my case, Jenkins does the scheduling and execution and the job is monitored via Zabbix.
Monitor your network infrastructure
When everything is in place, then the monitoring part is pretty simple. The usual JSONPath based logic can be used. API call documentation can be found here. The template contains only the wireless components, since I do not have my switches in Central. Implementing the switching part should not be difficult – just have a look at the “Switch” section, then clone and adjust one of your “get” items.
Screenshots
Latest data – tag based filtering:
Latest data – Site health
Latest data – Gateway info
Latest data – AP info
Triggers:
Some triggers are intentionally disabled, because they are a bit redundant. However, I wanted to cover all options. Sometimes less alerting is better if you have a ticketing system integration, otherwise your monitoring system will turn into a ticket factory.
Known issues and limitations
Since we are not querying the devices directly, some delay can be expected. Based on my recent testing, the delay compared to real time is between 3-10 minutes. In my test I disconnected my test environment and then started to do manual updates frequently. Some items got the real state earlier, some only later.
If your refresh script will malfunction for whatever reason (normally it should not), then you may have to run the other script once to generate a new token, or you can go to the GUI and check the last refresh token, with which you can override the content of the “token_refresh.latest” file.
Aruba is limiting the number of API queries to 5,000 per day. This could seem annoying, but it is way more than what you need (you should expect less than 1,000 in normal conditions, depending on your update frequency).
Zabbix API will not authorize your call unless you insert a line into your apache vhost configuration. This is a more generic Zabbix API issue that is not related to Aruba Central.
If Aruba Central has a maintenance activity, then the token refreshing way could break. Running the token request script once should address the issue.
Summary
Aruba Central’s API is pretty decent, but if you start from zero it could take a while to get to the end of it. With this guide, my intention was to speed you up, but please do not consider my scripts and the shown example as the only or best possible way – I’m just hoping it can give you a good base for your own solution. Have fun!
Democracy is colliding with the technologies of artificial intelligence. Judging from the audience reaction at the recent World Forum on Democracy in Strasbourg, the general expectation is that democracy will be the worse for it. We have another narrative. Yes, there are risks to democracy from AI, but there are also opportunities.
We have just published the book Rewiring Democracy: How AI will Transform Politics, Government, and Citizenship. In it, we take a clear-eyed view of how AI is undermining confidence in our information ecosystem, how the use of biased AI can harm constituents of democracies and how elected officials with authoritarian tendencies can use it to consolidate power. But we also give positive examples of how AI is transforming democratic governance and politics for the better.
Here are four such stories unfolding right now around the world, showing how AI is being used by some to make democracy better, stronger, and more responsive to people.
Japan
Last year, then 33-year-old engineer Takahiro Anno was a fringe candidate for governor of Tokyo. Running as an independent candidate, he ended up coming in fifth in a crowded field of 56, largely thanks to the unprecedented use of an authorized AI avatar. That avatar answered 8,600 questions from voters on a 17-day continuous YouTube livestream and garnered the attention of campaign innovators worldwide.
Two months ago, Anno-san was elected to Japan’s upper legislative chamber, again leveraging the power of AI to engage constituents—this time answering more than 20,000 questions. His new party, Team Mirai, is also an AI-enabled civic technology shop, producing software aimed at making governance better and more participatory. The party is leveraging its share of Japan’s public funding for political parties to build the Mirai Assembly app, enabling constituents to express opinions on and ask questions about bills in the legislature, and to organize those expressions using AI. The party promises that its members will direct their questioning in committee hearings based on public input.
Brazil
Brazil is notoriously litigious, with even more lawyers per capita than the US. The courts are chronically overwhelmed with cases and the resultant backlog costs the government billions to process. Estimates are that the Brazilian federal government spends about 1.6% of GDP per year operating the courts and another 2.5% to 3% of GDP issuing court-ordered payments from lawsuits the government has lost.
Since at least 2019, the Brazilian government has aggressively adopted AI to automate procedures throughout its judiciary. AI is not making judicial decisions, but aiding in distributing caseloads, performing legal research, transcribing hearings, identifying duplicative filings, preparing initial orders for signature and clustering similar cases for joint consideration: all things to make the judiciary system work more efficiently. And the results are significant; Brazil’s federal supreme court backlog, for example, dropped in 2025 to its lowest levels in 33 years.
While it seems clear that the courts are realizing efficiency benefits from leveraging AI, there is a postscript to the courts’ AI implementation project over the past five-plus years: the litigators are using these tools, too. Lawyers are using AI assistance to file cases in Brazilian courts at an unprecedented rate, with new cases growing by nearly 40% in volume over the past five years.
It’s not necessarily a bad thing for Brazilian litigators to regain the upper hand in this arms race. It has been argued that litigation, particularly against the government, is a vital form of civic participation, essential to the self-governance function of democracy. Other democracies’ court systems should study and learn from Brazil’s experience and seek to use technology to maximize the bandwidth and liquidity of the courts to process litigation.
Germany
Now, we move to Europe and innovations in informing voters. Since 2002, the German Federal Agency for Civic Education has operated a non-partisan voting guide called Wahl-o-Mat. Officials convene an editorial team of 24 young voters (under 26 and selected for diversity) with experts from science and education to develop a slate of 80 questions. The questions are put to all registered German political parties. The responses are narrowed down to 38 key topics and then published online in a quiz format that voters can use to identify the party whose platform they most identify with.
In the past two years, outside groups have been innovating alternatives to the official Wahl-o-Mat guide that leverage AI. First came Wahlweise, a product of the German AI company AIUI. Second, students at the Technical University of Munich deployed an interactive AI system called Wahl.chat. This tool was used by more than 150,000 people within the first four months. In both cases, instead of having to read static webpages about the positions of various political parties, citizens can engage in an interactive conversation with an AI system to more easily get the same information contextualized to their individual interests and questions.
However, German researchers studying the reliability of such AI tools ahead of the 2025 German federal election raised significant concerns about bias and “hallucinations”—AI tools making up false information. Acknowledging the potential of the technology to increase voter informedness and party transparency, the researchers recommended adopting scientific evaluations comparable to those used in the Agency for Civic Education’s official tool to improve and institutionalize the technology.
United States
Finally, the US—in particular, California, home to CalMatters, a non-profit, nonpartisan news organization. Since 2023, its Digital Democracy project has been collecting every public utterance of California elected officials—every floor speech, comment made in committee and social media post, along with their voting records, legislation, and campaign contributions—and making all that information available in a free online platform.
CalMatters this year launched a new feature that takes this kind of civic watchdog function a big step further. Its AI Tip Sheets feature uses AI to search through all of this data, looking for anomalies, such as a change in voting position tied to a large campaign contribution. These anomalies appear on a webpage that journalists can access to give them story ideas and a source of data and analysis to drive further reporting.
This is not AI replacing human journalists; it is a civic watchdog organization using technology to feed evidence-based insights to human reporters. And it’s no coincidence that this innovation arose from a new kind of media institution—a non-profit news agency. As the watchdog function of the fourth estate continues to be degraded by the decline of newspapers’ business models, this kind of technological support is a valuable contribution to help a reduced number of human journalists retain something of the scope of action and impact our democracy relies on them for.
These are just four of many stories from around the globe of AI helping to make democracy stronger. The common thread is that the technology is distributing rather than concentrating power. In all four cases, it is being used to assist people performing their democratic tasks—politics in Japan, litigation in Brazil, voting in Germany and watchdog journalism in California—rather than replacing them.
In none of these cases is the AI doing something that humans can’t perfectly competently do. But in all of these cases, we don’t have enough available humans to do the jobs on their own. A sufficiently trustworthy AI can fill in gaps: amplify the power of civil servants and citizens, improve efficiency, and facilitate engagement between government and the public.
One of the barriers towards realizing this vision more broadly is the AI market itself. The core technologies are largely being created and marketed by US tech giants. We don’t know the details of their development: on what material they were trained, what guardrails are designed to shape their behavior, what biases and values are encoded into their systems. And, even worse, we don’t get a say in the choices associated with those details or how they should change over time. In many cases, it’s an unacceptable risk to use these for-profit, proprietary AI systems in democratic contexts.
To address that, we have long advocated for the development of “public AI”: models and AI systems that are developed under democratic control and deployed for public benefit, not sold by corporations to benefit their shareholders. The movement for this is growing worldwide.
Switzerland has recently released the world’s most powerful and fully realized public AI model. It’s called Apertus, and it was developed jointly by the Swiss government and the university ETH Zurich. The government has made it entirely open source—open data, open code, open weights—and free for anyone to use. No illegally acquired copyrighted works were used in its training. It doesn’t exploit poorly paid human laborers from the global south. Its performance is about where the large corporate giants were a year ago, which is more than good enough for many applications. And it demonstrates that it’s not necessary to spend trillions of dollars creating these models. Apertus takes a huge step forward to realizing the vision of an alternative to big tech—controlled corporate AI.
AI technology is not without its costs and risks, and we are not here to minimize them. But the technology has significant benefits as well.
AI is inherently power-enhancing, and it can magnify what the humans behind it want to do. It can enhance authoritarianism as easily as it can enhance democracy. It’s up to us to steer the technology in that better direction. If more citizen watchdogs and litigators use AI to amplify their power to oversee government and hold it accountable, if more political parties and election administrators use it to engage meaningfully with and inform voters and if more governments provide democratic alternatives to big tech’s AI offerings, society will be better off.
This essay was written with Nathan E. Sanders, and originally appeared in The Guardian.
Listening to the voices of young people is crucial in creating genuinely effective learning resources. That’s why we recently ran a survey of students who use Ada Computer Science, our platform designed to help students learn and revise key computer science concepts.
“The different topics are nicely categorised and it is easy to find the information I wish to revise.” – Ada Computer Science student
We were delighted to hear from 103 students, most of whom are 16–19 years old and studying in England, and their insights are invaluable in helping us to continue to develop Ada CS.
Students think Ada CS is high quality and useful
The most common ways students use Ada CS are for revision and to check whether they understand concepts. The majority of respondents are building Ada CS into their regular study habits, with over half of respondents using the platform every week.
We were pleased to see the benefits of updates we’ve made, including a redesign of the question finder released in March 2025 — students reported that it is easy to navigate the platform and find what they need: 81% reported being able to find relevant content, and 77% could find the questions they were looking for.
“It’s SO EASY to find exactly what I want.” – Ada Computer Science student
Overall, students perceive Ada CS as both useful for learning about computer science concepts and of high quality. They reported finding the content clear, with a good level of detail.
“The topics are broken down into easily digestible sections, and the provided diagrams really help with understanding the topics.” – Ada Computer Science student
“The resource is really well designed, short and concise.” – Ada Computer Science student
We also received helpful suggestions for future improvements. Students shared feedback on how the information on the platform is presented, asking for more concise, revision-friendly content as well as guidance for exploring concepts in more depth. We’ll therefore be looking into alternative ways to structure content as we continue to develop Ada CS.
Students rate the quizzes highly
The most popular feature is the quizzes and practice questions,including the immediate feedback and hints provided. Students value how these resources help them solidify their knowledge, learn from mistakes, and prepare for assessments.
“The questions are clear and make me think, they’re relevant to my studies and the hints for the questions are very useful.” – Ada Computer Science student
We also appreciated the suggestions we received for how we can further develop this feature, for example, creating more questions, extending the range of question types per topic, and making improvements to the hints.
Impact on learning
Students also feel that using Ada CS has a tangible impact on their learning. 82% agreed they were more confident that they understand CS concepts as a result of using Ada CSand 79% feel more confident learning about computer science concepts without a teacher to explain.
“I do CS A level but I hadn’t done the GCSE and I found that all of the resources gave me enough information to learn the concepts from scratch and now I’m much more confident in my knowledge of the theory.” – Ada Computer Science student
What’s coming next?
Students provided us with lots of useful feedback and suggestions for how we can further improve Ada CS, especially relating to practice questions. We’re already working on adding more questions across topics, creating more challenging questions, and adding more question types that will enhance students’ learning experience. We’ve got some other exciting developments in the pipeline too, which we’ll announce soon!
Thank you to everyone who took the time to complete the survey. These findings are invaluable for shaping the future of Ada Computer Science, helping us to continue to provide the best possible learning platform for students.
В края на октомври в София се проведе първото преброяване на бездомни хора в България. То се осъществи от Института за изследване на населението и човека към БАН с подкрепа от Столичната община. Част е от пилотен проект на Европейския съюз за проучване на мащабите на бездомността в Съюза и предприемане на действия за превенцията ѝ. Координатор на проекта за цяла Европа е университетът в белгийския град Льовен. Миналата година е проведено преброяване в 15 града с повече от 200 000 жители, а тази година са включени 35 града в 21 държави, сред които и София.
Европейският парламент си постави за цел през 2020 г. да сложи край на бездомността в ЕС до 2030 г. В Резолюцията за справяне с нивата на бездомност в ЕС се посочва, че са получени няколко петиции, сигнализиращи за над 4 млн. бездомни и 70% увеличаване на бездомните хора в Съюза през последните десет години. Акцентира се и върху липсата на права на хората без дом, тъй като те нямат достъп до здравеопазване и често са обект на престъпления от омраза.
Колко са бездомните в България? Няма надежден отговор на този въпрос. Частична и противоречива информация може да се намери в някои медии: за 2022 г. OFFNews споменава, че броят им е 4664, като на 3860 е предложено ползване на социални услуги. В статията се уточнява, че Министерството на труда и социалната политика не води официална статистика за броя на хората без дом. „Дневник“ цитира данни на Агенцията за социално подпомагане, според които от януари до септември 2024 г. са регистрирани 1260 бездомни. Според Нова телевизия обаче това число (1260) отговаря на броя на бездомните за последните девет месеца.
2022 г.
4664 бездомни
Данни, цитирани от OFFNews.
На 3860 от тях е предложено ползване на социални услуги.
януари – септември 2024 г.
1260 бездомни
Според Агенцията за социално подпомагане, цитирана от „Дневник“.
Март – Декември 2024 г.
1260 бездомни
Според Агенцията за социално подпомагане, цитирана от Нова телевизия.
В статията на OFFNews се уточнява, че Министерството на труда и социалната политика не води официална статистика за броя на хората без дом.
Как броим бездомните хора?
Преброяването, в което се включих и аз като доброволка, се извърши по определени маршрути. За разработването им са използвани данни от получените сигнали за хора без дом на спешните телефони. През 2024 г. тези сигнали са били 3460, а в контактния център на Столичната община за периода октомври–ноември са постъпили 77, каза пред „Тоест“ Стоянка Черкезова от Института за изследване на населението и човека към БАН и координаторка на проекта в България. Това обаче не означава непременно, че са намерени общо 3537 души без подслон – възможно е за един човек да е имало повече от едно обаждане. Следователно данните не представляват информация за броя на хората без дом.
Методологията на преброяването откроява шест категории бездомни, като тазгодишното му издание включва само първите три:
които нямат дом и спят на улицата;
които нощуват в кризисни центрове;
които живеят в центрове за временно настаняване;
живеещи в институции (затвори, психиатрични болници, домове за хора с увреждания, центрове за бежанци и пр.)
които живеят в несигурни жилища, застрашени от събаряне;
хора без дом, които живеят при приятели.
Причини за бездомността
Идентифицираните бездомници трябваше да отговорят на въпроси от анкетна карта, свързани с жилищната им ситуация: дали живеят сами, имат ли достъп до жилище, български граждани ли са и ако да, къде са родени, работят ли в момента и как са се озовали на улицата. Респондентите ни посочваха основно семейни или финансови причини за бездомността си. Говорихме с хора, изгонени от роднините си, както и с такива, чийто дом е бил продаден от роднини. Някои бяха загубили работата си, а с това и възможността да плащат наем за квартира. В един случай човекът е изгонен от единствената квартира, която е можел да си позволи, защото хазяйката решила да продаде апартамента. Немалко респонденти посочиха измами – имотни или от работодатели. Един каза, че просто е решил да си направи голяма тренировка с ходене.
Бездомността може да се предава и между поколенията. Това важи с особена сила за хората, израснали в институции, и техните деца. След навършване на 18 години възпитаниците на домовете в общия случай се преместват в т.нар. преходни жилища, където могат да останат, докато си стъпят на краката, но не повече от пет години. Ако не успеят да се включат в обществения и икономическия живот, остават бездомни и търсят подслон в центровете, в които могат да пребивават с години и дори да създадат дете. По време на преброяването са идентифицирани около 500 резиденти в центровете за временно настаняване, като ⅓ от тях са деца, живеещи с родителите си.
500 резиденти
Деца, живеещи с родителите си
Достъп до здравеопазване на улицата
Повечето преброени твърдят, че нямат здравословни проблеми. В отговор на въпрос на „Тоест“ за видовете здравни грижи, които се предоставят на бездомни и здравно неосигурени лица, от офиса на заместник-кметицата по социални дейности на София Надежда Бачева уточниха, че при нужда разходите по болничното лечение или долекуването на хората без дом се поемат от държавата чрез дирекциите „Социално подпомагане“. На практика обаче самите медицински лица отказват да изпълнят задълженията си, когато попаднат на бездомен човек.
Стоянка Черкезова разказа, че мобилните екипи на организациите, работещи с бездомни, са споменали за случаи, в които викат линейка, но тя отказва да прибере нуждаещия се с аргумента, че казусът не е за тях.
Председателката на Управителния съвет на Центъра за хуманни политики Юлия Георгиева сподели, че се е сблъсквала лично с този отказ. Преди години закарала човек в „ужасно състояние, полужив, адски мръсен“ в спешно отделение, откъдето го изхвърлили два часа по-късно. Той починал.
Проблем за повечето бездомни хора е липсата на здравно осигуряване.
В спешните центрове би трябвало да приемат всеки, без значение какъв е здравноосигурителният му статус. Този принцип е заложен и в Националната програма за подобряване на майчиното и детско здраве, предоставяща възможност за прегледи при гинеколог и проследяване на бременността на здравно неосигурени жени. Елмира Нешева, социална работничка в нископраговия център за хора със зависимости „Розовата къща“ – инициатива на Центъра за хуманни политики, разказа, че в болница „Св. Анна“ с жените се работи за превенция на изоставянето. Целта е да им се предостави възможност да получат нужните умения да се грижат за детето, тъй като здравно неосигурените жени са рискова група.
В „Розовата къща“ оказват помощ на клиентите чрез осигуряване на базовите им нужди, подкрепа за издаване на лични документи, подобряване на житейската ситуация и справяне със зависимостта, подкрепа за здравна помощ, както и чрез обучения за управление на личните финанси и спазване на работен режим. Съдействат и за издаване на свидетелство за ТЕЛК. Средствата, които се получават по ТЕЛК обаче, не стигат за наемане на квартира и се събират няколко души, които живеят заедно и си помагат финансово.
В центровете с приоритет са „семейства с по-малки деца и честно казано, избягват да вземат хора, […] употребяващи наркотици, поради това, че има вероятност те да създадат повече проблеми“, каза още Нешева.
А защо просто не си намерят работа?
В повечето ситуации човекът, останал без дом, няма контрол над случващото се и се оказва жертва на обстоятелствата, твърди Стоянка Черкезова. Според нея отношението към хора, изпаднали в подобна ситуация, трябва да се изразява в институционална подкрепа. Правилният път е овластяване на човека – да му се даде увереност, че може да се справи и сам, но най-важно е да има покрив над главата си, смята тя.
На същото мнение е и Юлия Георгиева. Когато нямаш къде да се изкъпеш или да си заредиш телефона, нямаш светлина и храна вечер, но въпреки това успееш да си намериш работа и дори се задържиш на нея – това, по думите на Георгиева, е „героизъм“. Тя обаче посочва и случаи на злоупотреба, в които бездомният човек е останал без лична карта – например защото я е заложил или е открадната. След това със същата тази лична карта е изтеглен кредит или е регистрирана фирма. И когато започне работа, жертвата може да се окаже със запорирани сметки и съдебно преследване, което обезсмисля усилията за легални доходи.
Къде нощуват хората без дом?
Повечето анкетирани нощуват, където намерят – на улицата, пейките, автогарата или жп гарата, във входове на блокове или преддверия на магазини. Един от тях сподели личната си статистика за броя на пейките в парка, в който разговаряхме. Преди били 72, а сега – около 30. И нямало пейка, на която да не е спал. Той разказа, че живее на улицата от 30 години и вечер, освен едно одеяло, ползва за завивка трите си кучета.
Снимка: Теодора Станимирова
Някои от хората, с които разговаряхме, твърдяха, че имат дом. В един случай той се оказа барака с течащ покрив в ромската махала, в друг – изоставена будка, която респондентът наричаше „хралупата“ и споделяше с куче. Живеещите в такива паянтови бараки, в повечето от които няма ток и вода, а покривът тече, също влизат в статистиката на бездомните и се включват в първата категория на преброяването – които спят на улицата.
Проблеми пред настаняването
Някои респонденти имаха достъп до жилище извън София. Според Черкезова се наблюдава движение на бездомни хора към столицата заради възможностите за прехрана и наличието на (по-добри) социални услуги. Достъпът до жилище в други части на страната не означава, че ще имат с какво да се прехранват и да си плащат сметките.
Обикновено ако човек без дом иска да бъде приет в център за временно настаняване, първо трябва да премине през оценка в Агенция „Социално подпомагане“. Пренасочването обаче е по настоящ адрес и ако той не е в София, кандидатурата се отхвърля и от човека се очаква да се прибере някак в родното си място.
Изгонените от роднини, които все още имат имот на свое име, не могат да кандидатстват за общинско жилище според Наредбата за реда и условията за управление и разпореждане с общински жилища на територията на Столична община. Там приоритетно се настаняват семейства. От друга страна, местата в центровете са недостатъчни – 510 легла за цяла София, разпределени между три центъра. До редакционното приключване на статията никой от ръководителите на тези центрове, с които разговаряхме, не се съгласи да даде интервю за „Тоест“.
От офиса на Надежда Бачева казаха, че центровете поддържат комуникация с бюрата по труда или насочват резидентите към услуги за социални помощи, и обещаха, че след обобщаването на данните от преброяването ще се планират конкретни мерки и при нужда капацитетът на центровете ще се увеличи. Споменаха също, че се подготвя „първата стратегия за социални жилища на София до 2040 г.“, чиято цел е да бъдат изградени поне 5000 нови жилища, за да се обхванат най-уязвимите и да се създаде стимул да останат да работят в София.
Що за хора са бездомните?
По време на преброяването срещнахме човек без крайник, друг, който беше изкарал позволените шест месеца в център за настаняване и беше отново на улицата, трети, който се определи като австрийски ирландец, понеже родителите му били австрийски граждани, живеещи в Ирландия. Последният каза, че е бил известно време в дом за деца, лишени от родителска грижа. Двама споделиха, че са лежали в затвор, а един – в психиатрия. Възрастен мъж ни обясняваше къде да отидем да се напием рано сутринта, а друг продаваше книги, за които каза, че са му дадени от разни хора или ги намира до контейнерите. Срещнахме и човек, който се представи за историк, станал жертва на измама. Ровеше в контейнера за отпадъци с ръкавици и отказа да говори с нас.
Снимка: Теодора Станимирова
Бездомни жени е на практика много трудно да се открият.
Жените са по-уязвима група от мъжете и затова при тях бездомността често е скрита. Дори и да нямат достъп до жилище, успяват да си намерят вариант да останат при приятели или познати. За трите дни, през които се извършваше преброяването, разговаряхме с три, но всички твърдяха, че по принцип имат дом, макар да им се случва да останат без подслон. Две от тях работеха нископлатена работа – едната разнасяше писма, а другата метеше улиците и сподели, че се е случвало да спи навън. Третата живееше в барака с пробит покрив и се грижеше за петте си внучета, а като причина да не работи посочи здравословни проблеми и липсата на лична карта.
Много хора не правят разлика между бездомен човек и просяк. Огромната част от бездомните хора обаче не просят: за трите дни разговаряхме само с двама, които ни искаха пари – те живееха в бараки в ромската махала.
Омагьосаният кръг на бездомността
В седмицата на преброяването са получени много сигнали от „будни“ граждани, както ги определи Стоянка Черкезова, недоволни, че има бездомни хора на гарата. Общинската полиция беше изгонила приютилите се там, като това не е първата подобна акция по наблюдения на БАН от предварителното проучване.
Бездомниците няма къде да отидат и в крайна сметка ще се върнат пак там, откъдето са били изгонени. На Централната гара действително могат да се видят доста от тях. Един от респондентите ни каза, че спи там, когато вали. В края на миналата година на гарата имаше инцидент, при който загинаха четирима души, водещи „скитнически начин на живот“, както беше описано в медиите. Тримата запалили огън в един от вагоните на влак, за да се стоплят, и така избухнал пожар. Впоследствие обаче започна да се води разследване за умишлен палеж.
Трите дни разговори с бездомници показаха колко е лесно да изпаднеш от обществото в рамките на месеци. Резултатите от преброяването ще покажат размерите на проблема, но без качествени услуги и човешки подход в грижата за най-уязвимите то ще си остане още една статистика.
Organizations running critical workloads on Amazon Elastic Compute Cloud (Amazon EC2) reserve compute capacity using On-Demand Capacity Reservations (ODCR) to have availability when needed. However, reserved capacity can intermittently sit idle during off-peak periods, between deployments, or when workloads scale down. This unused capacity represents a missed opportunity for cost optimization and resource efficiency across the organization.
Amazon EC2 now offers interruptible ODCRs, a new capability that lets you make unused compute capacity temporarily available to other workloads while maintaining control to reclaim it. This feature helps you optimize reservations and reduce costs across your AWS organization.
In this post, we explore how this works through a practical customer scenario.
Customer scenario: Maximizing reservation utilization across
Consider a financial services company where the trading platform team maintains a large fleet of r7i.4xlarge instances reserved around-the-clock for critical blue/green deployments. During off-peak trading hours and weekends, a significant portion of this reserved capacity sits idle. Meanwhile, the data analytics team regularly runs batch processing jobs for risk modeling—workloads that could benefit from additional compute capacity but don’t require the same availability guarantees as the trading platform.
Previously, sharing this capacity meant losing control over when it could be reclaimed, creating operational challenges when the trading platform needed to scale up quickly during market volatility. Interruptible ODCRs solve this problem by giving the reservation owner control to reclaim capacity when needed for critical operations.
In the following sections, we walk through the key steps to configure capacity sharing, launch instances, and reclaim capacity. The high-level steps are:
Set up capacity sharing
Discover available capacity and launch instances
Reclaim capacity and handle interruptions
Step 1: Set up capacity sharing
The trading platform team begins by identifying unused capacity patterns through Amazon EC2 Capacity Manager. They determine that approximately 60% of their reserved r7i.4xlarge capacity remains unused during overnight hours and weekends.
To repurpose this idle capacity, the trading platform team creates an interruptible ODCR using the AWS Management Console, SDK, or AWS Command Line Interface (AWS CLI). To use the console, they complete the following steps:
On the Amazon EC2 console, choose Capacity Reservations in the navigation pane.
Select the source ODCR and choose Create interruptible reservation.
For Instances to allocate, enter how many instances to allocate (out of a 100-instance reservation). For this example, we allocate 60 instances.
Choose Create interruptible reservation.
This configuration withdraws 60 instances from their original reservation and creates a new ODCR with interruptible configuration. The original reservation now shows 40 instances, and the new interruptible reservation shows 60.
Share resources across the organization
With the interruptible reservation created, the reservation owning team uses AWS Resource Access Manager (AWS RAM)—a service that helps you securely share AWS resources across accounts and organizations—to share the newly created ODCR with additional accounts in their organization. When sharing your ODCR, you specify which consumer account IDs in your organization will get access to the interruptible ODCR. Alternatively, you can share the ODCR with your entire AWS Organization or Organizational Unit (OU). When it’s complete, the specified accounts get access to the interruptible ODCR capacity and establish a setup like the one illustrated in the following diagram.
Sharing with all accounts (at once) within the organization requires organization-wide sharing to be enabled in AWS Organizations setup. If organization-wide sharing is not enabled, a user can still share with individual accounts by enumerating each account.
Step 2: Discover available capacity and launch instances
After the reservation owner (the trading platform team) shares their reservation, the capacity consumer (data analytics team) needs to find the capacity in their account and launch into it. In this section, we walk through the interruptible ODCR discovery and launch process.
Discover available capacity
The data analytics team, running batch processing jobs in a separate AWS account, can now find the shared interruptible capacity in their account using the console, SDK, or AWS CLI. To use the console, they complete the following steps:
On the Amazon EC2 console, choose Capacity Reservations in the navigation pane.
Choose the ODCR to view its details page.
The interruptible reservation appears with a clear indication that it’s interruptible, showing the instance type (r7i.4xlarge), Availability Zone, and available capacity.
Configure Auto Scaling groups for interruptible capacity
To use this capacity for their batch processing workloads, the analytics team creates a new launch template specifically designed for interruptible capacity. The key configuration element is setting the new market-type parameter and targeting the interruptible ODCR.
In the launch template, specify the following:
Instance type: r7i.4xlarge (matching the shared capacity)
Capacity reservation specification: Targeted
Capacity reservation ID: Enter the ID of the shared interruptible ODCR
Market type: Use the type interruptible-capacity-reservation
Next, create an Auto Scaling group that uses this launch template. The group is configured as follows:
Maximum size: 40 (within the available shared capacity)
Desired capacity: Set based on job queue length
Launch instances into interruptible capacity
When the analytics team’s batch processing jobs trigger scaling events, the Auto Scaling group launches instances that automatically target the shared interruptible ODCR. These instances launch immediately if capacity is available, providing the team with access to reserved capacity for their fault-tolerant workloads. The instances appear on the Amazon EC2 console with their instance lifecycle as interruptible-capacity-reservation and the ODCR ID in which they’re running. This provides clear indication that they’re running on interruptible capacity, helping with monitoring and cost allocation.
Step 3: Reclaim capacity and handle interruptions
In this section, we review how the capacity owner (the trading platform team) can reclaim their capacity when needed for their critical operations and how the capacity consumer can gracefully handle such interruptions.
Trigger reclamation
When market volatility increases and the trading platform needs to scale up quickly, the platform team initiates capacity reclamation through the console, SDK, or AWS CLI. To use the console, they complete the following steps:
On the Amazon EC2 console, choose Capacity Reservations in the navigation pane.
Choose the ODCR to view its details page.
Choose Edit Interruptible Allocation.
Specify how many instances are needed back (in this case, all 60 instances for maximum trading capacity).
Choose Update, then choose Confirm.
The reclamation process can also be automated using AWS Lambdafunctions triggered by Amazon CloudWatch alarms or scheduled events, providing proactive capacity management based on predictable usage patterns.
Consumer notification and graceful shutdown
After the owner triggers capacity reclamation, consuming instances receive a 2-minute instance interruption warning notice through Amazon EventBridge. The analytics team has configured their batch processing applications to listen for these events. Their applications receive this 2-minute warning and immediately begin checkpointing their current work, saving intermediate results to Amazon Simple Storage Service (Amazon S3), and gracefully shutting down. For EventBridge notification details, refer to the Monitor interruptible Capacity Reservations with EventBridge section in the EC2 Capacity Reservations User Guide.
Automatic capacity restoration to source ODCR
After the 2-minute notice period, Amazon EC2 starts shutting down the consuming instances. After the instances are successfully shut down, Amazon EC2 restores the capacity to the trading platform’s original ODCR. The trading platform can then launch their critical workloads into the same ODCR, resulting in minimal delay for their scaling requirements. The reservation owner can track their capacity reclamation status through the console or API. On the Amazon EC2 console, the ODCR details page shows the current instance allocation, target instance allocation, and request status. When current and target counts match, the status changes to Active, confirming completion.
After the reservation owner requests their capacity back, the capacity reclamation process can take a few minutes, so reservation owners should account for this delay when planning critical activities. This is because Amazon EC2 provides a 2-minute warning to the consumer instances, followed by the instance shutdown period.
Billing and cost considerations
The billing model for interruptible ODCRs follows a clear usage-based approach that aligns costs with consumption:
Reservation owner (trading platform team) – Pays EC2 On-Demand rates for unused capacity in the interruptible ODCR, just like any standard ODCR. For example, when the analytics team uses 30 out of 60 available instances, the trading platform pays for the remaining 30 unused instances.
Consumer (analytics team) – Pays EC2 On-Demand rates only for the instances they actually launch and use. For example, when they use 30 instances for 4 hours, they’re charged for 30 × 4 = 120 instance-hours at the standard r7i.4xlarge On-Demand rate.
Conclusion
Amazon EC2 interruptible ODCR helps organizations optimize compute spending while maintaining operational control. Through capacity reclamation mechanisms, teams can achieve better resource utilization without compromising availability guarantees. In this post, we showed how this capability addresses real operational challenges through an example use case—enabling a trading platform to maintain their critical capacity guarantees while helping other teams access high-quality compute resources for their workloads. The predictable interruption model creates a sustainable approach to capacity sharing that benefits the entire organization.
In recent months, we’ve seen a leap forward for closed-source image generation models with the rise of Google’s Nano Banana and OpenAI image generation models. Today, we’re happy to share that a new open-weight contender is back with the launch of Black Forest Lab’s FLUX.2 [dev] and available to run on Cloudflare’s inference platform, Workers AI. You can read more about this new model in detail on BFL’s blog post about their new model launch here.
We have been huge fans of Black Forest Lab’s FLUX image models since their earliest versions. Our hosted version of FLUX.1 [schnell] is one of the most popular models in our catalog for its photorealistic outputs and high-fidelity generations. When the time came to host the licensed version of their new model, we jumped at the opportunity. The FLUX.2 model takes all the best features of FLUX.1 and amps it up, generating even more realistic, grounded images with added customization support like JSON prompting.
Our Workers AI hosted version of FLUX.2 has some specific patterns, like using multipart form data to support input images (up to 4 512×512 images), and output images up to 4 megapixels. The multipart form data format allows users to send us multiple image inputs alongside the typical model parameters. Check out our developer docs changelog announcement to understand how to use the FLUX.2 model.
What makes FLUX.2 special? Physical world grounding, digital world assets, and multi-language support
The FLUX.2 model has a more robust understanding of the physical world, allowing you to turn abstract concepts into photorealistic reality. It excels at generating realistic image details and consistently delivers accurate hands, faces, fabrics, logos, and small objects that are often missed by other models. Its knowledge of the physical world also generates life-like lighting, angles and depth perception.
Figure 1. Image generated with FLUX.2 featuring accurate lighting, shadows, reflections and depth perception at a café in Paris.
This high-fidelity output makes it ideal for applications requiring superior image quality, such as creative photography, e-commerce product shots, marketing visuals, and interior design. Because it can understand context, tone, and trends, the model allows you to create engaging and editorial-quality digital assets from short prompts.
Aside from the physical world, the model is also able to generate high-quality digital assets such as designing landing pages or generating detailed infographics (see below for example). It’s also able to understand multiple languages naturally, so combining these two features – we can get a beautiful landing page in French from a French prompt.
Générer une page web visuellement immersive pour un service de promenade de chiens. L'image principale doit dominer l'écran, montrant un chien exubérant courant dans un parc ensoleillé, avec des touches de vert vif (#2ECC71) intégrées subtilement dans le feuillage ou les accessoires du chien. Minimiser le texte pour un impact visuel maximal.
Character consistency – solving for stochastic drift
FLUX.2 offers multi-reference editing with state-of-the-art character consistency, ensuring identities, products, and styles remain consistent for tasks. In the world of generative AI, getting a high-quality image is easy. However, getting the exact same character or product twice has always been the hard part. This is a phenomenon known as “stochastic drift”, where generated images drift away from the original source material.
Figure 2. Stochastic drift infographic (generated on FLUX.2)
One of FLUX.2’sbreakthroughs is multi-reference image inputs designed to solve this consistency challenge. You’ll have the ability to change the background, lighting, or pose of an image without accidentally changing the face of your model or the design of your product. You can also reference other images or combine multiple images together to create something new.
In code, Workers AI supports multi-reference images (up to 4) with a multipart form-data upload. The image inputs are binary images and output is a base64 encoded image:
curl --request POST \
  --url 'https://api.cloudflare.com/client/v4/accounts/{ACCOUNT}/ai/run/@cf/black-forest-labs/flux-2-dev' \
  --header 'Authorization: Bearer {TOKEN}' \
  --header 'Content-Type: multipart/form-data' \
  --form 'prompt=take the subject of image 2 and style it like image 1' \
  --form input_image_0=@/Users/johndoe/Desktop/icedoutkeanu.png \
  --form input_image_1=@/Users/johndoe/Desktop/me.png \
  --form steps=25
  --form width=1024
  --form height=1024
We also support this through the Workers AI Binding:
const image = await fetch("http://image-url");
const form = new FormData();

const image_blob = await streamToBlob(image.body, "image/png");
form.append('input_image_0', image_blob)
form.append('prompt', 'a sunset with the dog in the original image')

const resp = await env.AI.run("@cf/black-forest-labs/flux-2-dev", {
    multipart: {
        body: form,
        contentType: "multipart/form-data"
    }
})
Built for real world use cases
The newest image model signifies a shift towards functional business use cases, moving beyond simple image quality improvements. FLUX.2 enables you to:
Create Ad Variations: Generate 50 different advertisements using the exact same actor, without their face morphing between frames.
Trust Your Product Shots: Drop your product on a model, or into a beach scene, a city street, or a studio table. The environment changes, but your product stays accurate.
Build Dynamic Editorials: Produce a full fashion spread where the model looks identical in every single shot, regardless of the angle.
Figure 3. Combining the oversized hoodie and sweatpant ad photo (generated with FLUX.2) with Cloudflare’s logo to create product renderings with consistent faces, fabrics, and scenery. **Note: we prompted for white Cloudflare font as well instead of the original black font.
Granular controls — JSON prompting, HEX codes and more!
The FLUX.2 model makes another advancement by allowing users to control small details in images through tools like JSON prompting and specifying specific hex codes.
For example, you could send this JSON as a prompt (as part of the multipart form input) and the resulting image follows the prompt exactly:
{
  "scene": "A bustling, neon-lit futuristic street market on an alien planet, rain slicking the metal ground",
  "subjects": [
    {
      "type": "Cyberpunk bounty hunter",
      "description": "Female, wearing black matte armor with glowing blue trim, holding a deactivated energy rifle, helmet under her arm, rain dripping off her synthetic hair",
      "pose": "Standing with a casual but watchful stance, leaning slightly against a glowing vendor stall",
      "position": "foreground"
    },
    {
      "type": "Merchant bot",
      "description": "Small, rusted, three-legged drone with multiple blinking red optical sensors, selling glowing synthetic fruit from a tray attached to its chassis",
      "pose": "Hovering slightly, offering an item to the viewer",
      "position": "midground"
    }
  ],
  "style": "noir sci-fi digital painting",
  "color_palette": [
    "deep indigo",
    "electric blue",
    "acid green"
  ],
  "lighting": "Low-key, dramatic, with primary light sources coming from neon signs and street lamps reflecting off wet surfaces",
  "mood": "Gritty, tense, and atmospheric",
  "background": "Towering, dark skyscrapers disappearing into the fog, with advertisements scrolling across their surfaces, flying vehicles (spinners) visible in the distance",
  "composition": "dynamic off-center",
  "camera": {
    "angle": "eye level",
    "distance": "medium close-up",
    "focus": "sharp on subject",
    "lens": "35mm",
    "f-number": "f/1.4",
    "ISO": 400
  },
  "effects": [
    "heavy rain effect",
    "subtle film grain",
    "neon light reflections",
    "mild chromatic aberration"
  ]
}
To take it further, we can ask the model to recolor the accent lighting to a Cloudflare orange by giving it a specific hex code like #F48120.
Try it out today!
The newest FLUX.2 [dev] model is now available on Workers AI — you can get started with the model through our developer docs or test it out on our multimodal playground.
Amazon Redshift Serverless makes it convenient to run and scale analytics without managing clusters, offering a flexible pay-as-you-go model. With Redshift Serverless Reservations, you can optimize compute costs and improve cost predictability for your Redshift Serverless workloads.
In this post, you learn how Amazon Redshift Serverless Reservations can help you lower your data warehouse costs. We explore ways to determine the optimal number of RPUs to reserve, review example scenarios, and discuss important considerations when purchasing these reservations.
How Amazon Redshift Serverless Reservations work
Amazon Redshift measures data warehouse capacity in Redshift Processing Units (RPUs). You pay for the workloads you run in RPU-hours on a per-second basis (with a 60-second minimum charge). 1 RPU provides 16 GB of memory. You can commit to a specific number of Redshift Processing Units (RPUs) for a one-year term. Two payment options are available: a no-upfront option with a 20% discount off on-demand rates, or an all-upfront option with a 24% discount. The reserved amount of RPUs is billed 24 hours a day, seven days a week
Key benefits of Amazon Redshift Serverless Reservations
The following are some of the key benefits of subscribing to Redshift Serverless Reservations.
Cost savings through commitment: Redshift Serverless Reservations help you reduce your overall Redshift Serverless spend compared to on-demand (non-reserved) usage.
Centralized management: Supports reservation administration at the AWS payer account level for simplified governance and visibility across your organization.
Per-second metering with hourly billing: Offers per-second metering with hourly billing, so that you only pay for what you use. This cost-effective pricing model eliminates wasted resources and unnecessary charges, lowering your Amazon Redshift Serverless spend.
Predictable costs: The 24 hours a day, 7 days a week billing model offers stable monthly costs that simplify forecasting and budgeting.
Sharing capabilities between multiple AWS accounts: Enhances collaboration across different teams and departments, enabling improved resource utilization throughout your organization.
Determining optimal RPU reservation
You can determine your RPU reservation level through your serverless usage history and the AWS Billing and Cost Management recommendations.
Serverless usage history
You can use the Redshift Serverless Dashboard, which provides a detailed view of your workgroup and namespace activities. The dashboard helps you to analyze trends and patterns in your data warehouse usage. You can easily monitor your RPU capacity usage and total compute usage, helping you make informed decisions about resource allocation. For more granular analysis, you have the option to query the SYS_SERVERLESS_USAGE system table, which provides detailed historical usage data. To optimize costs while ensuring performance, you can reserve the minimum consistent RPUs used per hour by analyzing the usage patterns across all your workgroups.
AWS Billing and Cost Management recommendations
You can use AWS Billing and Cost Management to help you estimate your capacity needs:
Choose required Term, Payment option, and Based on the past to select the history to determine reservation recommendations.
You will find the recommendations in the Recommendations section. The following is an example screen:
The following example shows a Redshift Serverless purchase recommendation from AWS Cost Management. The interface displays a specific recommendation to buy Reserved Instances with key details including the term length, AWS Region, payment option, and expected utilization rate. The recommendation includes upfront and recurring cost information, with a direct link to the Amazon Redshift console for implementation.
If reservations are not recommended based on your usage, then you will see “Based on your selections, no purchase recommendations are available for you at this time. Adjust your selections to view recommendation” message under the Recommended actions section.
Cost Explorer generates your reservation recommendations by identifying your On-demand usage during a specific period and identifying the best number of reservations to purchase to maximize your estimated savings.
Disclaimer: The approaches described above provide an estimate of your optimal RPU reservation level. Actual results may vary depending on workload patterns, peak usage, and utilization variability. Your RPU commitment may not always yield the maximum available discount percentage, as savings depend on how closely your Redshift Serverless Reserved RPUs aligns with real usage over time. This recommendation does not guarantee the cost for your actual use of AWS services.
Let’s examine two different scenarios to understand how reservations can help you optimize costs, we’ll walk through the scenario of a single Redshift Serverless workgroup and a scenario with multiple Redshift serverless workgroups.
Scenario 1: Single Redshift Serverless workgroup
Let’s consider you have only one Redshift Serverless workgroup in your environment and the workload is spread as described in the following table.
In the table, hourly RPU consumption metrics for workgroup1 across different time intervals. The data shows a reservation of 64 RPUs with no upfront payment option, which provides a 20% discount. The table breaks down the compute usage into two categories: Reserved compute, consistently showing 64 RPUs across all hours, and On-demand compute, which varies based on actual consumption above the reserved capacity. The bottom row displays the Total charged RPUs, which reflects the final billing after applying the reserved instance discount. This helps visualize how the workload utilizes the reserved capacity and any additional on-demand usage throughout the specified time period.The total actual RPU consumption is 1,664 and the total charged consumption is 1,484.8. This configuration results in a 10.7% net discount.
In this scenario, you have multiple Redshift serverless workgroup in your environment and the workload is spread as described in the following table.
Similar to the previous single workgroup scenario, you can see hourly RPU consumption metrics for workgroups across different time intervals. In this scenario, you have also opted for 64 RPUs reserved with no upfront option, which applies a 20% discount to the workload. However, you can notice that the total consumption across workgroups matches the total reserved RPUs. This maximizes your total savings even though individual workgroups consumed less than the total RPUs reserved at the payer account level.
The total actual RPU consumption is 1,536 (768+512+256) across workgroups and the total charged consumption is 1,228.8. This configuration results in a 20% net discount.
You can use the following query to find the average RPUs consumed in each hour in a workgroup.
SELECT
date_trunc('hour',end_time) AS run_hr,
avg(compute_capacity)
FROM SYS_SERVERLESS_USAGE
GROUP BY 1
ORDER BY 1
You can use the output of this query to populate a spreadsheet with a similar structure as the ones used in the previous scenarios.
Considerations
We recommend you consider the following when using Redshift Serverless Reservations:
Start conservatively: Avoid over-purchasing Serverless Reservations RPUs. It’s best to begin with a minimum base RPU level or align your commitment to the average RPU usage across all Redshift Serverless workgroups under your AWS payer and linked accounts.
Reservations are immutable: Once purchased, Redshift Serverless Reservations can’t be changed or deleted. However, you can add additional reservations later to increase your coverage as your workloads grow.
Discount sharing control: The management account in an AWS Organization can disable Reserved Instance or Savings Plan discount sharing for any linked accounts, including itself. See the AWS documentation for details.
Automatic discount application: Redshift Serverless Reservations billing model automatically applies all the reserved RPU discount to your workloads before using on-demand cost, helping you save on costs.
Reservations are Regional: They apply only within the AWS Region where they are purchased and cannot be shared across Regions.
Handling excess usage: If your workload exceeds the number of reserved RPUs, the additional usage is billed at the standard on-demand rate.
Use a 30 to 60-day window for recommendations: To receive the most accurate reservation recommendations, we suggest using a 30- to 60-day usage window in the Billing and Cost Management console, under Reservations, in the Recommendations section. This approach assumes that your typical production workloads have been running during that period so that the recommendations reflect real-world usage.
Conclusion
In this post, we described how Amazon Redshift Serverless Reservations provide a way to reduce your data warehouse costs while maintaining the flexibility of Redshift serverless pricing. By carefully planning your Amazon Redshift Serverless Reservation strategy and monitoring usage patterns, you can achieve up to 24% cost savings for your Redshift Serverless analytics workloads. For detailed documentation, see Billing for serverless reservations.
Next week, don’t miss AWS re:Invent, Dec. 1-5, 2025, for the latest AWS news, expert insights, and global cloud community connections! Our News Blog team is finalizing posts to introduce the most exciting launches from our service teams. If you’re joining us in person in Las Vegas, review the agenda, session catalog, and attendee guides before arriving. Can’t attend in person? Watch our Keynotes and Innovation Talks via livestream.
AWS CloudFormation StackSets offers deployment ordering for auto-deployment mode. You can define the sequence in which your stack instances automatically deploy across accounts and Regions.
AWS NAT Gateway supports Regional availability to create a single NAT Gateway that automatically expands and contracts across availability zones (AZs).
Back in July 2024, we announced plans to de-emphasize AWS CodeCommit based on adoption patterns and our assessment of customer needs. We never stopped looking at the data or listening to you, and what you’ve shown us is clear: you need an AWS-managed solution for your code repositories. Based on this feedback, CodeCommit is returning to full General Availability, effective immediately.
We Listened, and We Heard You
After the de-emphasis announcement last year, we heard from many of you. Your feedback was direct and revealing. You told us that CodeCommit isn’t just another code repository for you—it’s a critical piece of your infrastructure. Its deep IAM integration, VPC endpoint support, CloudTrail logging, and seamless connectivity with CodePipeline and CodeBuild provide value that’s difficult to replicate with third-party solutions, especially for teams operating in regulated industries or those who want all their development infrastructure within AWS boundaries. In short, we learned that CodeCommit is essential for many of you, so we’re bringing it back.
We acknowledge the uncertainty the de-emphasis has caused. If you invested time and resources planning or executing a migration away from CodeCommit, we apologize. We’ve learned from this, and we’re committed to doing better.
What’s Changing Today
Here’s what you need to know:
CodeCommit is open to new customers again – New customer sign-ups are open as of today. If you’ve been waiting to onboard new accounts or create repositories, you can do so right now through the AWS Console, CLI, or APIs.
For current and former customers – If you already migrated away, we understand you may have completed your transition to GitHub, GitLab, Bitbucket, or another provider. Those are excellent platforms, and we fully support your decision to use them. If you’re interested in returning to CodeCommit, our support team and account teams are available to help.
If you’re mid-migration, you can pause or reverse your plans. Contact AWS Support or your account team to discuss your specific situation and determine the best path forward.
If you stayed with CodeCommit, thank you for your patience during this period. We’re working through the backlog of feature requests and support tickets that accumulated, prioritizing by customer need. Continue to tell us how we can improve the service and support your workflows (human, machine, and agentic) moving forward.
What’s Coming Next
We’re not just maintaining CodeCommit—we’re investing in it. Here’s what’s on the roadmap:
Git LFS Support (Q1 2026) – This has been your most requested feature. Git Large File Storage will enable you to efficiently manage large binary files like images, videos, design assets, and compiled binaries without bloating your repositories. You’ll get faster clones, better performance, and cleaner version history for large assets.
Regional Expansions (Starting Q3 2026) – CodeCommit will expand to additional AWS Regions in eu-south-2 and ca-west-1, bringing the service closer to where you’re building and deploying your applications.
We’ll share more details about these features and additional roadmap items in the coming months. Keep an eye on our What’s New feed for the latest AWS launches.
Pricing, SLA, and Getting Started
Pricing remains unchanged—you can review the current structure on the CodeCommit pricing page. We continue to maintain our 99.9% uptime SLA as defined in our service terms.
If you’re new to CodeCommit or returning after a migration, check out our Getting Started Guide for step-by-step instructions. For migration assistance or questions about your specific setup, contact AWS Support or your account team.
Available Now
AWS CodeCommit is available now in 29 regions. New customers can begin creating repositories immediately. Visit the CodeCommit console to get started.
Thank you for your feedback, your patience, and your continued trust in AWS. We’re committed to making CodeCommit the best integrated Git repository service for AWS development.
AlmaLinux 10.1 has been released. In
addition to providing binary compatibility with Red Hat Enterprise
Linux (RHEL) 10.1, the most notable feature in AlmaLinux 10.1 is
the addition of support
for Btrfs, which is not available in RHEL:
Btrfs support encompasses both kernel and userspace enablement, and it
is now possible to install AlmaLinux OS on a Btrfs filesystem from the
very beginning. Initial enablement was scoped to the installer and
storage management stack, and broader support within the AlmaLinux
software collection for Btrfs features is forthcoming.
In addition to Btrfs support, AlmaLinux OS 10.1 includes numerous
other improvements to serve our community. We have continued to extend
hardware support both by adding
drivers and by adding a secondary version of AlmaLinux OS and EPEL
to extend support of x86_64_v2 processors.
Amazon Web Services (AWS) provides many mechanisms to optimize the price performance of workloads running on Amazon Elastic Compute Cloud (Amazon EC2), and the selection of the optimal infrastructure to run on can be one of the most impactful levers. When we started building the AWS Graviton processor, our goal was to optimize AWS Graviton features and capabilities to deliver a processor that provides the best price performance across a broad array of cloud workloads running on Amazon EC2. That goal continues to be our guiding principle, and today customers who adopt AWS Graviton-based EC2 instances see up to 40% better price performance on their cloud workloads when compared to equivalent non-Graviton EC2 instances. The price performance improvement is the result of both the performance improvement and the lower price in using AWS Graviton-based instances.
Price performance blends the cost of infrastructure with the amount of work you can achieve with infrastructure usage. After talking to many AWS Graviton customers, we’ve learned that the cost savings go beyond the lower AWS Graviton-based instances price. Many AWS Graviton customers told us that the performance increase from AWS Graviton allows them to consume fewer computing hours than comparable non-Graviton instances for equivalent workload throughput. In turn, this leads to further cost reduction.
The following are some of examples from our customers:
Pinterest achieved 47% cost savings and 38% savings on compute resources while reducing carbon emissions by 62% for its web API workload.
SAP powers its SAP HANA Cloud with AWS Graviton to enhance its price performance by 35% while lowering carbon impact by 45%.
Sprinklr improved their machine learning (ML) inference workloads’ throughput by up to 20% while reducing costs by up to 25%.
To help organizations capture similar benefits, we’ve enhanced the AWS Graviton Savings Dashboard (GSD) with new features that account for both pricing and performance improvements. In the following section we explore these new capabilities and how they can help optimize your infrastructure costs.
Understanding performance-driven cost optimization in the GSD
The GSD helps organizations identify ideal workloads for AWS Graviton migration through automated resource matching and data-driven visualizations. You can learn the GSD details and setup in this AWS compute post.
Although the dashboard has traditionally focused on calculating direct cost savings from the AWS Graviton pricing advantages, we’ve observed that customers often experience more benefits when their applications perform more efficiently on AWS Graviton processors, leading to decreased compute resource usage. To better reflect these real-world scenarios, we’ve enhanced the dashboard with new features highlighting Normalized Instance Hours (NIH) analysis capabilities so that you can model potential savings based on both pricing benefits and compute hour reductions. Although this tool helps estimate potential savings, actual performance improvements can only be determined by testing your specific workloads on AWS Graviton instances. Performance is always workload and use case specific, so we encourage you to test your AWS Graviton-based workloads using the Optimization and Performance Runbook to help you determine the actual possible NIH percent reduction.
Key dashboard components
This section outlines the following three key dashboard components: NIH reduction analysis, enhanced cost analysis visualizations, and detailed savings analysis.
NIH reduction analysis
The dashboard now features a new slider that lets you model potential cost savings by inputting the percentage reduction in NIH. Many organizations have found it challenging to calculate their total possible savings since the benefits come from two sources: the lower instance pricing of AWS Graviton and the reduced compute hours.
You can use the slider to model different cost scenarios by adjusting a theoretical NIH reduction between 0% and 40%. You can use this slider to input NIH reductions validated through your workload testing, model the combined impact of both pricing benefits and reduced compute hours, and explore different scenarios to help prioritize which workloads to test first.
Figure 1: NIH slider location
Assume that your testing shows that your workload runs just as effectively with 15% fewer normalized instance hours on AWS Graviton. You can now plug that exact number into the slider to see your modeled savings combining both pricing differences and compute hour reductions. Although we’ve heard success stories of significant reductions from customers, we recommend starting your initial estimate with a conservative 10% baseline and adjusting based on your own testing results.
Enhanced cost analysis visualizations
The dashboard presents key visualizations that demonstrate the direct relationship between NIH reduction and cost savings. First, you see the Potential Graviton Base Savings from pricing differences alone. In the following diagram, we can observe an example of $61.54K of cost savings from migrating to equivalent AWS Graviton instances. Next, the Estimated Additional Savings Due to Performance in the same diagram shows $42.40K in savings if your performance testing confirms a 15% NIH reduction in your workload. Finally, the dashboard sums these two values into the Total Potential Graviton Savings of $103.94K. The Total Potential Graviton Savings helps visualize how both pricing benefits and any validated compute hour reductions could contribute to your overall savings.
Figure 2: Visualization with relationship between NIH reduction and cost savings
The Amortized Cost Breakdown and Normalized Instance Hrs Breakdown charts in the following figure show 6-month historical trends, helping you spot patterns such as seasonal spikes or high-usage periods. These patterns can help you identify where even small efficiency improvements might yield significant savings, for example, workloads with consistently high usage or predictable peak periods that would be good candidates for testing.
Figure 3: Amortized Cost, NIH, and Total Potential Savings Breakdown charts
Detailed savings analysis
Building on our commitment to help customers optimize cloud costs, we’ve enhanced the Potential Graviton Savings Details table with two columns focused on performance-based savings modeling. The Estimated Additional Savings Due to Performance column shows the modeled savings based on your chosen NIH reduction percentage, while Total Potential Graviton Savings combines this with the base pricing benefits.
As you examine your current instance family, you can observe both baseline AWS Graviton savings and these added saving opportunities clearly laid out in a comprehensive breakdown. The analysis presents your total savings potential in both dollar amounts and percentages. This allows you to build a compelling business case for migration. Although this detailed breakdown provides valuable planning insights, remember that actual savings may vary depending on your specific workload patterns, implementation approaches, and operational considerations.
Conclusion
The Graviton Savings Dashboard (GSD) serves as a powerful analytics tool that streamlines your journey to cost-effective cloud computing. The GSD provides clear visualizations and interactive features to help you understand and maximize potential savings when migrating to AWS Graviton-based instances. To further explore the new features, navigate to the GSD interactive demo, where you can model an example of potential savings using the NIH reduction slider and detailed cost breakdowns.
Ready to explore how AWS Graviton can transform your infrastructure costs? Visit the GSD page to deploy or update your GSD dashboard. Access implementation guides, such as the CFM Technical Implementation Playbook (CFM TIPs), and start optimizing your cloud spend today with the enhanced capabilities of the GSD.
Over 85,000 AWS customers have discovered the benefits of AWS Graviton, with many completing their adoptions in just hours. We have created this resource guide so that you can accelerate your AWS Graviton adoption with minimal effort and enjoy significant price performance benefits.
“What I always tell customers is one week, one application, one engineer, and see what you can do. They always are pleasantly surprised by how much progress they can make. If you’re out there and you haven’t yet moved to AWS Graviton, what are you waiting for? Let’s make it happen!”
Dave Brown, VP, AWS Compute & ML Services
Important note about performance testing The GSD does not attempt to estimate the potential NIH percent reduction or your workload’s performance when transitioned to AWS Graviton. You can use it to perform what-if analysis of your potential savings for a projected NIH percent reduction. In the absence of this variable, GSD only considers the price delta between instance types and misses an important contributor to the overall savings potential of AWS Graviton from the performance upside. Compute performance is always workload and use case specific, so we encourage you to test your AWS Graviton-based workloads using the Optimization and Performance Runbook to help you determine the actual possible NIH percent reduction.
It is rarely newsworthy when a project or package picks up a new
dependency. However, changes in a core tool like Debian’s Advanced Package
Tool (APT) can have far-reaching effects. For example, Julian
Andres Klode’s declaration
that APT would require Rust in May 2026 means that a few of Debian’s
unofficial ports must either acquire a working Rust toolchain or
depend on an old version of APT. This has raised several questions
within the project, particularly about the ability of a single
maintainer to make changes that have widespread impact.
Ransomware has evolved from simple digital extortion into a structured, profit-driven criminal enterprise. Over time, it has led to the development of a complex ecosystem where stolen data is not only leveraged for ransom, but also sold to the highest bidder. This trend first gained traction in 2020 when the Pinchy Spider group, better known as REvil, pioneered the practice of hosting data auctions on the dark web, opening a new chapter in the commercialization of cybercrime.
In 2025, contemporary groups such as WarLock and Rhysida have embraced similar tactics, further normalizing data auctions as part of their extortion strategies. By opening additional profit streams and attracting more participants, these actors are amplifying both the frequency and impact of ransomware operations. The rise of data auctions reflects a maturing underground economy, one that mirrors legitimate market behavior, yet drives the continued expansion and professionalization of global ransomware activity.
Anatomy of victim data auctions
Most modern ransomware groups employ double extortion tactics, exfiltrating data from a victim’s network before deploying encryption. Afterward, they publicly claim responsibility for the attack and threaten to release the stolen data unless their ransom demand is met. This dual-pressure technique significantly increases the likelihood of payment.
In recent years, data-only extortion campaigns, in which actors forgo encryption altogether, have risen sharply. In fact, such incidents doubled in 2025, highlighting how the threat of data exposure alone has become an effective extortion lever. Most ransomware operations, however, continue to use encryption as part of their attack chain.
Certain ransomware groups have advanced this strategy by introducing data auctions when ransom negotiations with victims fail. In these cases, threat actors invite potential buyers, such as competitors or other interested parties, to bid on the stolen data, often claiming it will be sold exclusively to a single purchaser. In some instances, groups have been observed selling partial datasets, likely adjusted to a buyer’s specific budget or area of interest, while any unsold data is typically published on dark web leak sites.
This process is illustrated in Figure 1, under the assumption that the threat actor adheres to their stated claims. However, in practice, there is no guarantee that the stolen data will remain undisclosed, even if the ransom is paid. This highlights the inherent unreliability of negotiating with cybercriminals.
⠀
Figure 1 – Victim data auctioning process
⠀
This auction model provides an additional revenue stream, enabling ransomware groups to profit from exfiltrated data even when victims refuse to pay. It should be noted, however, that such auctions are often reserved for high-profile incidents. In these cases, the threat actors exploit the publicity surrounding attacks on prominent organizations to draw attention, attract potential buyers, and justify higher starting bids.
This trend is likely driven by the fragmentation of the ransomware ecosystem following the recent disruption of prominent threat actors, including 8Base and BlackSuit. This shift in cybercrime dynamics is compelling smaller, more agile groups to aggressively compete for visibility and profit through auctions and private sales to maintain financial viability. The emergence of the Crimson Collective in October 2025 exemplified this dynamic when the group auctioned stolen datasets to the highest bidder. Although short-lived, this incident served as a proof of concept (PoC) for the growing viability of monetizing data exfiltration independently of traditional ransom schemes.
Threat actor spotlight
WarLock
The WarLock ransomware group has been active since at least June 2025. The group targets organizations across North America, Europe, Asia, and Africa, spanning sectors from technology to critical infrastructure. Since its emergence, WarLock has rapidly gained prominence for its repeated exploitation of vulnerable Microsoft SharePoint servers, leveraging newly disclosed vulnerabilities to gain initial access to targeted systems.
The group adopts double extortion tactics, exfiltrating data from the victim’s systems before deploying its ransomware variant. From a recent incident Rapid7 responded to, we observed the threat actor exfiltrating the data from a victim to an S3 bucket using the tool Rclone. An anonymized version of the command used by the threat actor can be found below:
WarLock operates a dedicated leak site (DLS) on the dark web, where it lists its victims. From the outset of its operations, the group has auctioned stolen data, publishing only the unsold information online (Figure 2). The group further mentions that the exfiltrated data may be sold to third parties if the victim refuses to pay in their ransom note (Figure 3).
⠀
Figure 2 – Example of purchased data
⠀
Figure 3 – WarLock ransom note
⠀
Although WarLock shares updates on the progress and results of these auctions through its DLS, it also relies heavily on its presence on the RAMP4 cybercrime forum to attract potential buyers (Figure 4). This approach likely allows WarLock to reach a wider buyer base by publishing these posts under the relevant thread “Auction \ 拍卖会”. It should be noted that WarLock is assessed to be of Chinese origin, which is further supported by the Chinese-language reference in this thread title.
⠀
Figure 4 – Mention of an auction on WarLock’s DLS
⠀
Using the alias “cnkjasdfgd,” the group advertises details about the nature and volume of exfiltrated data, along with sample files (Figure 5). WarLock further directs interested buyers to its Tox account, a peer-to-peer encrypted messaging and video-calling platform, where the auctions appear to take place.
⠀
Figure 5 – WarLock’s post on RAMP4
⠀
This approach appears to be highly effective for WarLock. Despite being a recent entrant to the ransomware ecosystem, the group has reportedly sold victim data in approximately 55% of its claimed attacks, accounting for 55 victims to date as of November 2025, demonstrating significant traction within underground markets. The remaining victims’ data has been publicly released on the group’s DLS, following unsuccessful ransom negotiations and a lack of interested buyers.
Rhysida
The Rhysida ransomware group was first identified by cybersecurity researchers in May 2023. The group primarily targets Windows operating systems across both public and private organizations in sectors such as government, defense, education, and manufacturing. Its operations have been observed in several countries, including the United Kingdom, Switzerland, Australia, and Chile. The threat actors portray themselves as a so-called “cybersecurity team” that assists organizations in securing their networks by exposing system vulnerabilities.
Rhysida maintains an active DLS, where it publishes data belonging to victims who refuse to pay the ransom, in alignment with double extortion tactics. Since at least June 2023, the group has also conducted data auctions via a dedicated “Auctions Online” section of its DLS. These auctions typically run for seven days, and Rhysida claims that each dataset is sold exclusively to a single buyer. As of mid-October 2025, the group was hosting five ongoing auctions, with starting prices ranging from 5 to 10 Bitcoin (Figure 6).
⠀
Figure 6 – Example of an auction on Rhysida’s DLS
⠀
Once the auction period ends, Rhysida publicly releases any unsold data on its DLS (Figure 7). Instead, if the auction is successful, the data is marked as “sold”, without being released on the group’s DLS (Figure 8). In many cases, the group publishes only a subset of the stolen data, often accompanied by the note “not sold data was published” (Figure 9).
⠀
Figure 7 – Example of full data release on Rhysida’s DLS
⠀
Figure 8 – Example of sold data on Rhysida’s DLS
⠀
Figure 9 – Example of partial data release on Rhysida’s DLS
⠀
With 224 claimed attacks to date as of November 2025, approximately 67% resulting in full or partial data sales, auctions represent a significant additional revenue stream for Rhysida. The group’s auction model appears to be considerably more effective than WarLock’s (Figure 10), likely due to Rhysida’s established reputation within the cybercrime ecosystem and its involvement in several high-profile attacks.
⠀
Figure 10 – Overview of auction outcomes
Conclusion
The cyber extortion ecosystem is undergoing a profound transformation, shifting from traditional ransom payments to a diversified, market-driven model centered on data auctions and direct sales. This evolution marks a turning point in how ransomware groups generate revenue, transforming what were once isolated extortion incidents into structured commercial transactions.
Groups such as WarLock and Rhysida exemplify this shift, illustrating how ransomware operations increasingly mirror illicit e-commerce ecosystems. By auctioning exfiltrated data, these actors not only create additional revenue streams but also reduce their dependence on ransom compliance, monetizing stolen data even when victims refuse to pay. This approach has proven particularly lucrative for these threat actors, likely setting a precedent for newer extortion groups eager to replicate their success.
As a result, proprietary and sensitive data, including personally identifiable and financial information, is flooding dark web marketplaces at an unprecedented pace. This expanding secondary market intensifies both the operational and reputational risks faced by affected organizations, extending the impact of an attack well beyond its initial compromise.
To adapt to this evolving threat landscape, organizations must move beyond reactive crisis management and embrace a proactive, intelligence-driven defense strategy. Continuous dark web monitoring, early breach detection, and the integration of cyber threat intelligence into response workflows are now essential. In a world where stolen data functions as a tradable commodity, resilience depends not on negotiation but on vigilance, preparedness, and rapid action.
The collective thoughts of the interwebz
Manage Consent
To provide the best experiences, we use technologies like cookies to store and/or access device information. Consenting to these technologies will allow us to process data such as browsing behavior or unique IDs on this site. Not consenting or withdrawing consent, may adversely affect certain features and functions.
Functional
Always active
The technical storage or access is strictly necessary for the legitimate purpose of enabling the use of a specific service explicitly requested by the subscriber or user, or for the sole purpose of carrying out the transmission of a communication over an electronic communications network.
Preferences
The technical storage or access is necessary for the legitimate purpose of storing preferences that are not requested by the subscriber or user.
Statistics
The technical storage or access that is used exclusively for statistical purposes.The technical storage or access that is used exclusively for anonymous statistical purposes. Without a subpoena, voluntary compliance on the part of your Internet Service Provider, or additional records from a third party, information stored or retrieved for this purpose alone cannot usually be used to identify you.
Marketing
The technical storage or access is required to create user profiles to send advertising, or to track the user on a website or across several websites for similar marketing purposes.

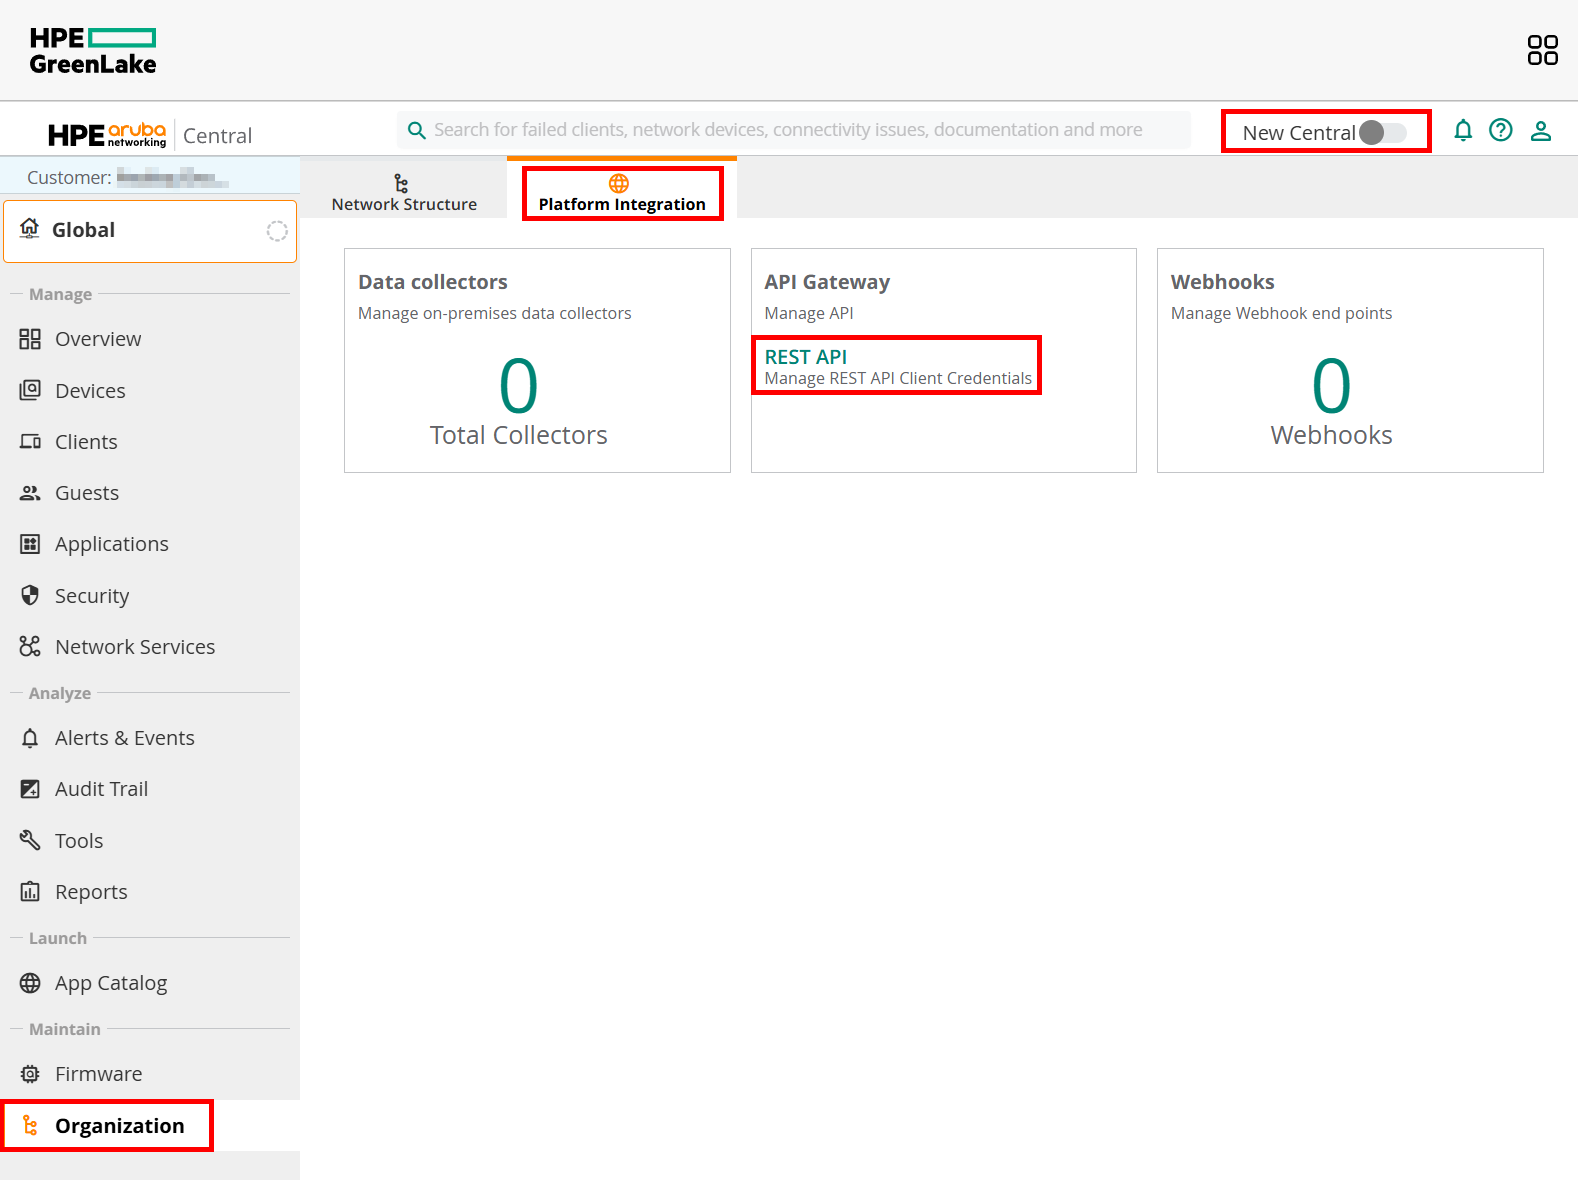
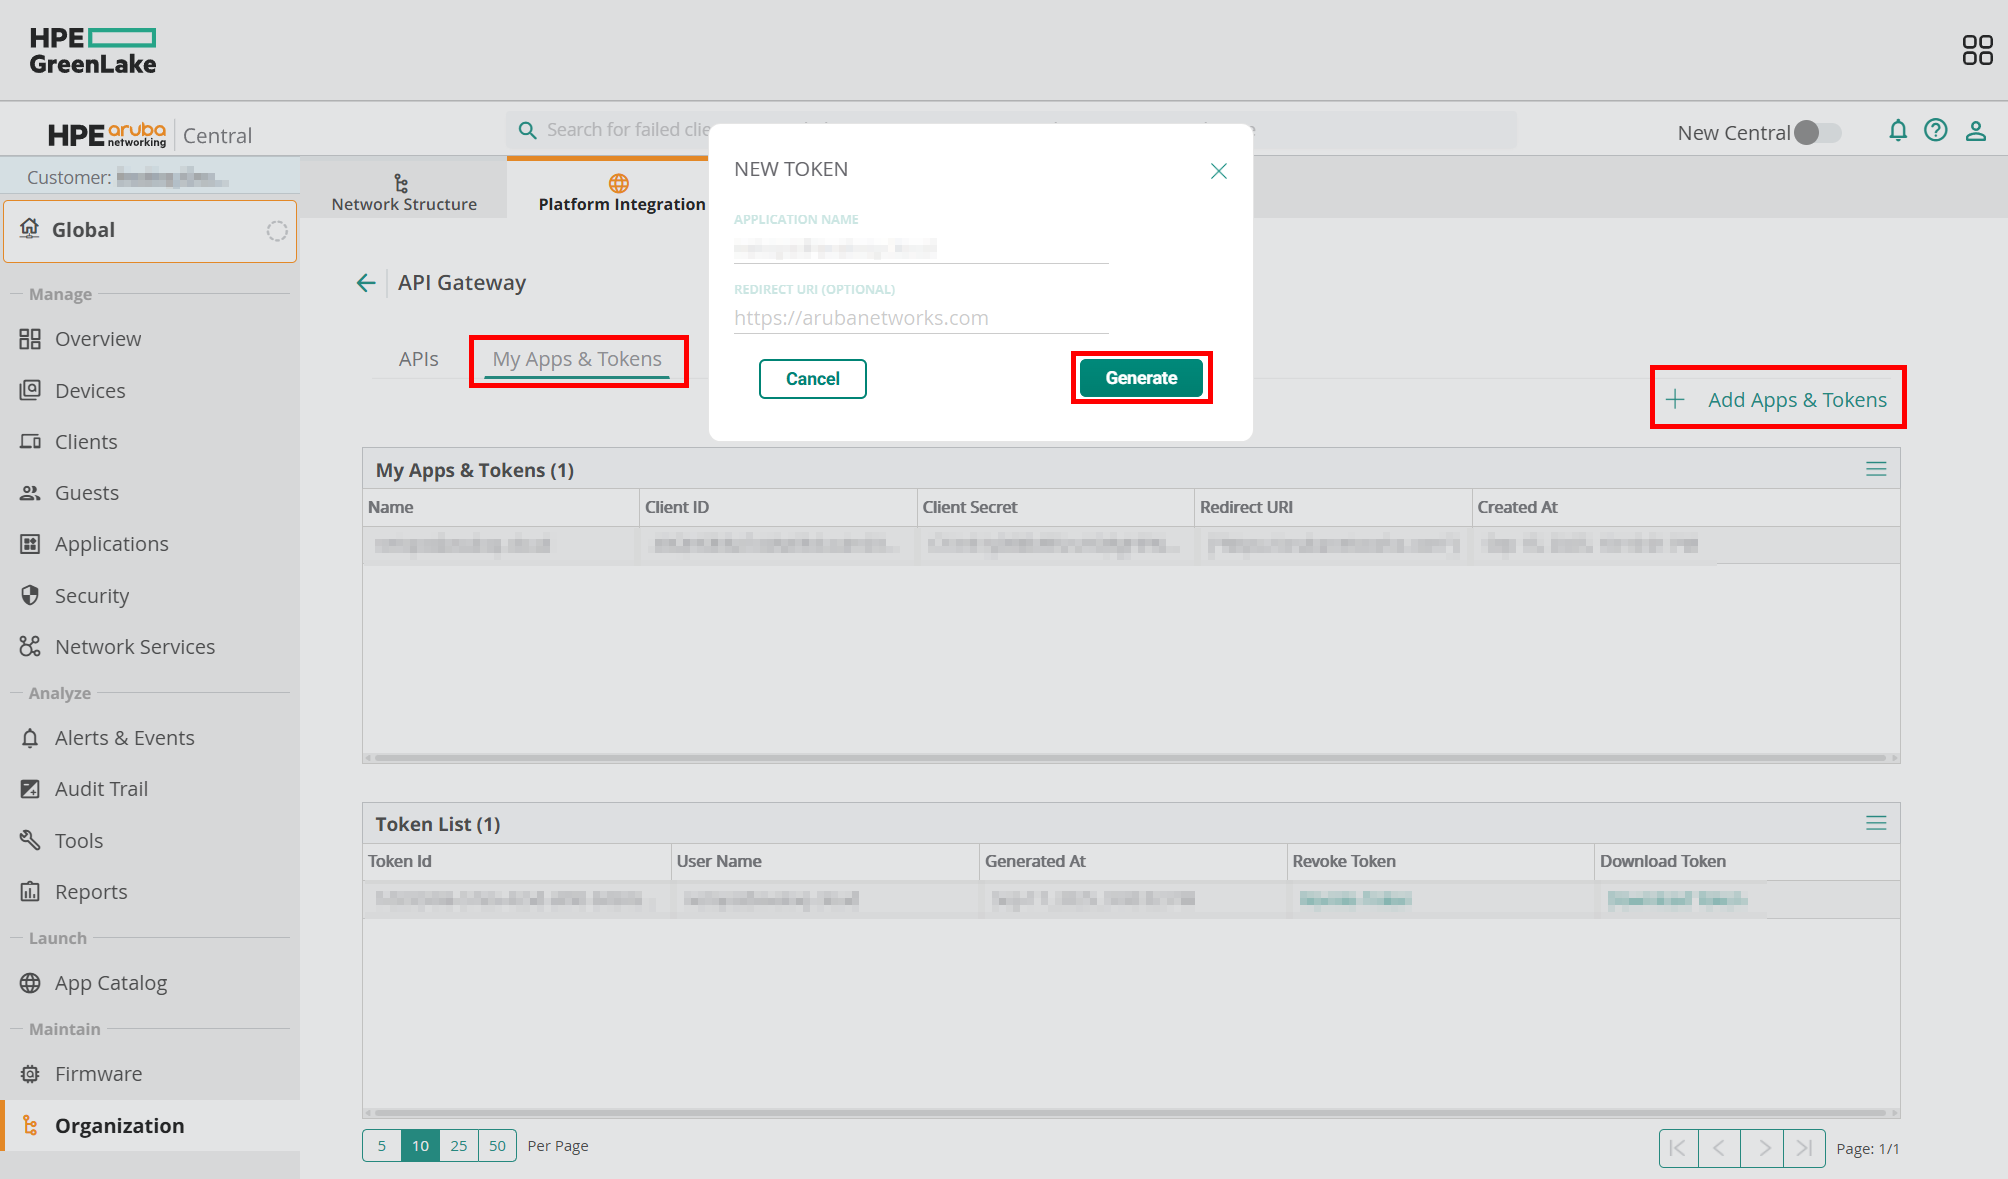
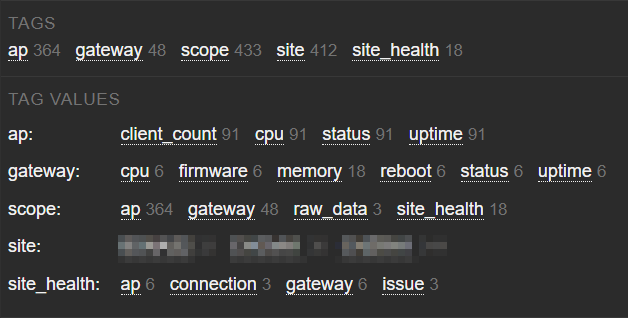
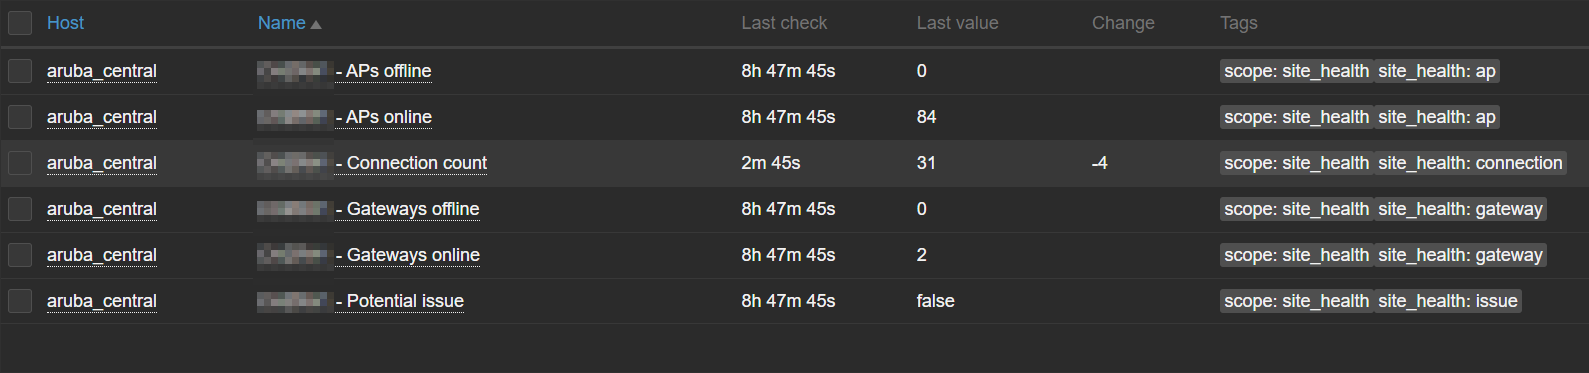
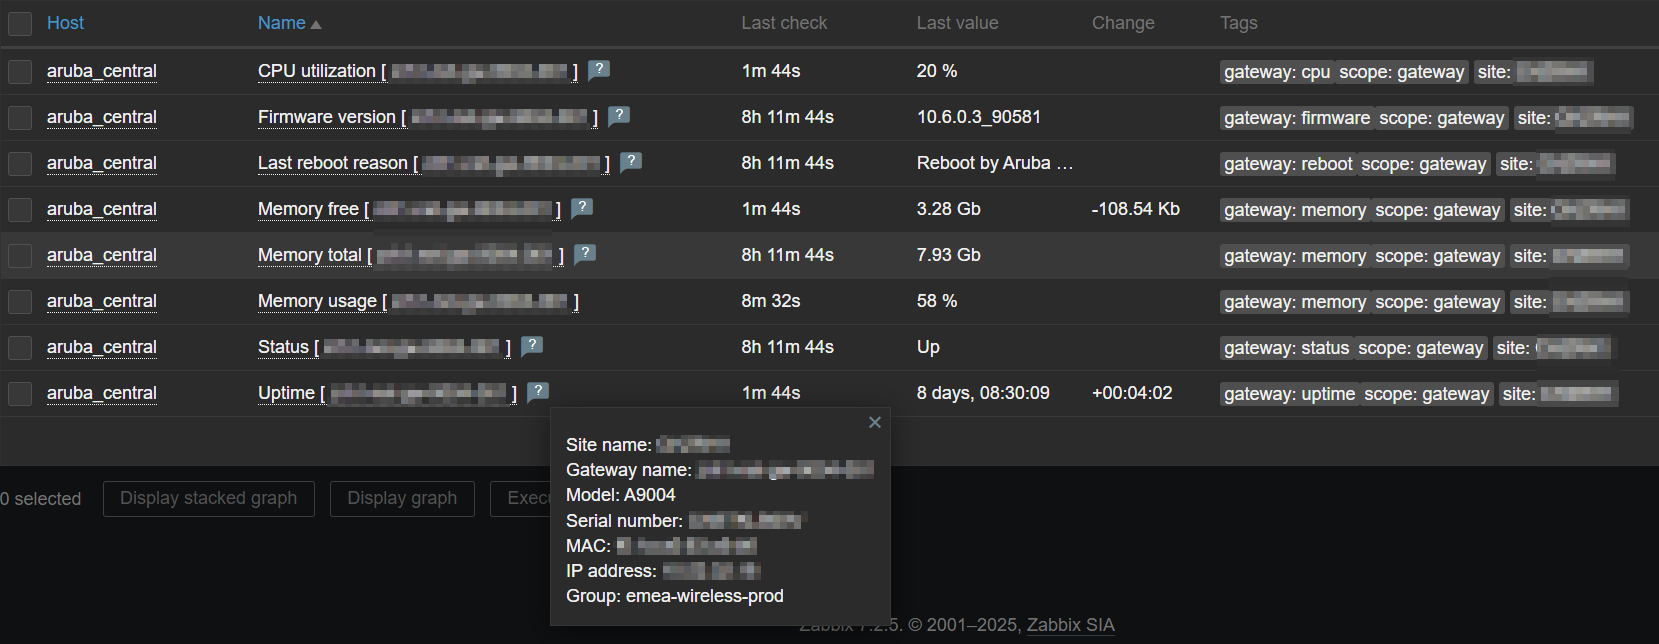
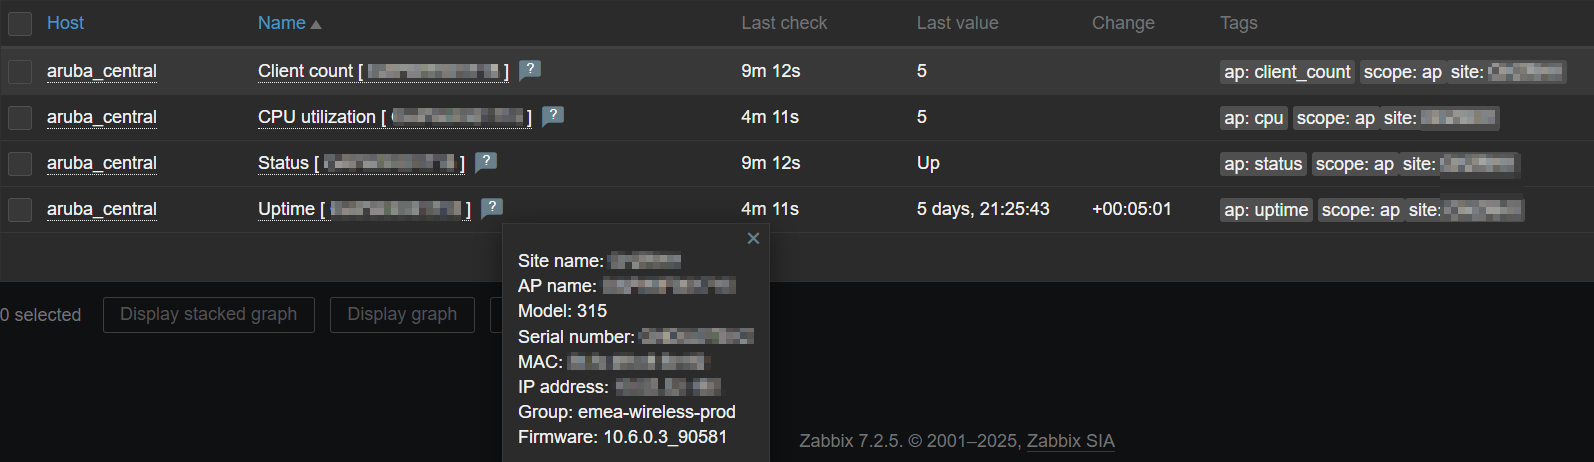
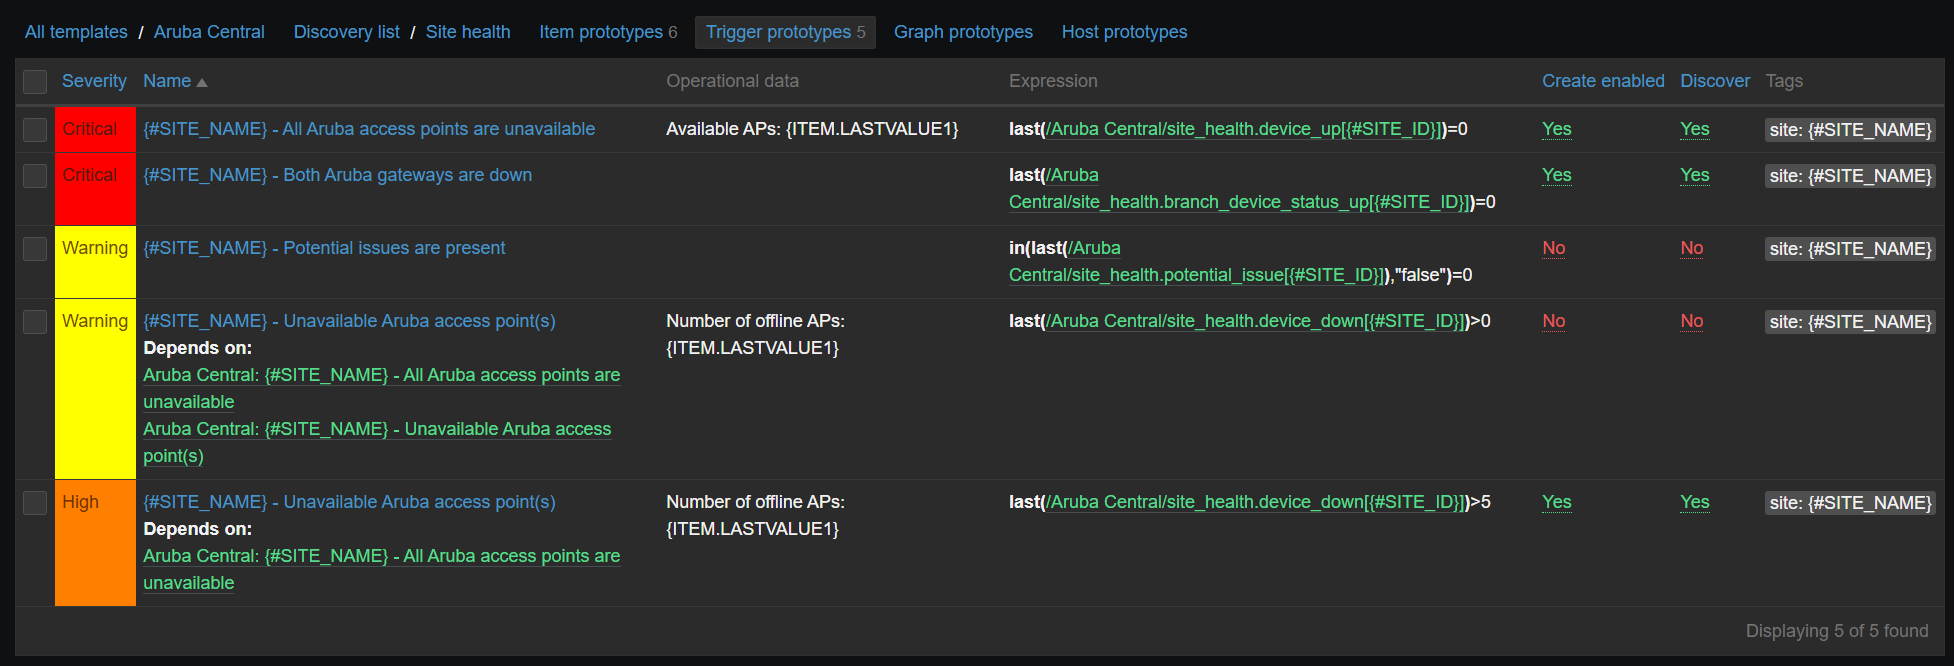
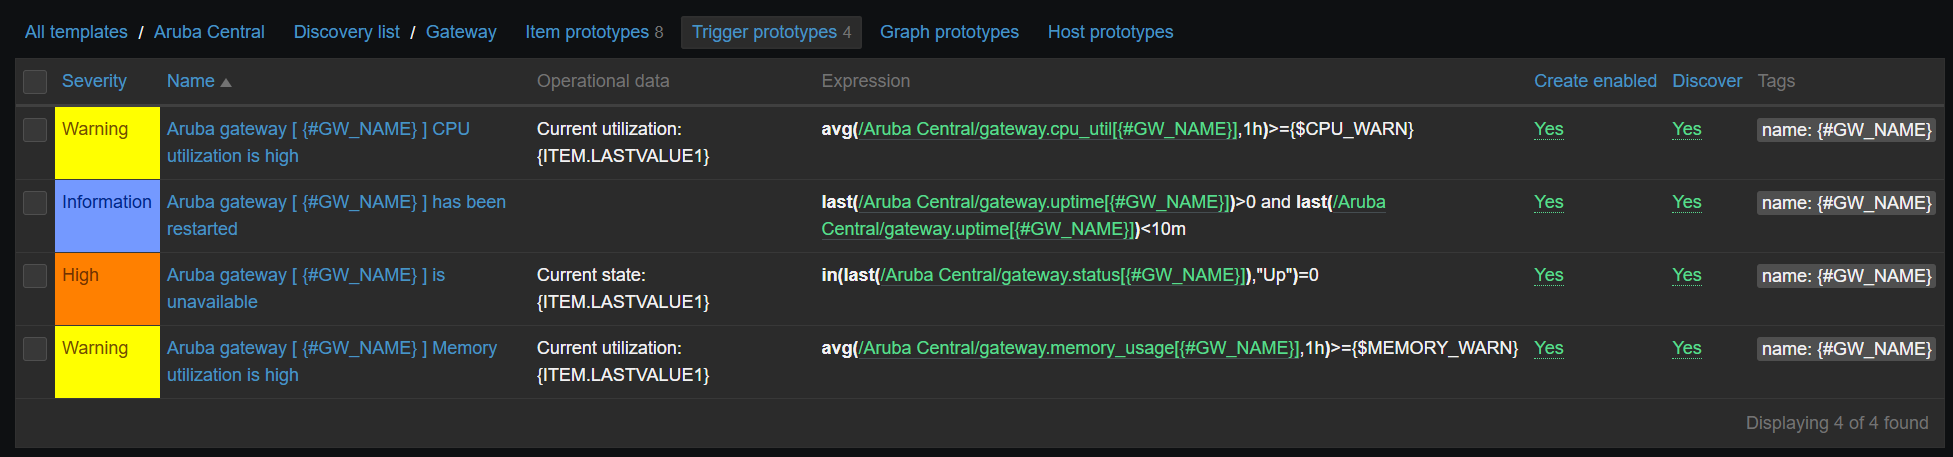


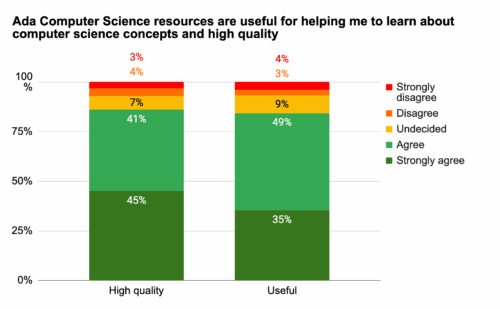
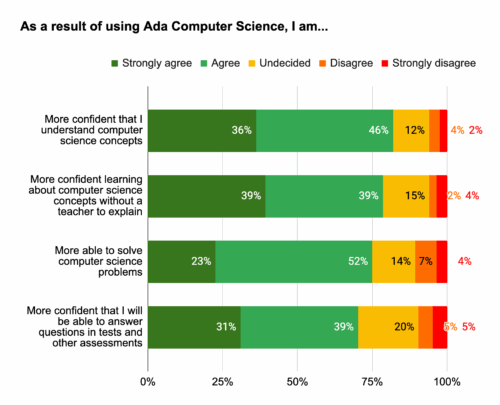



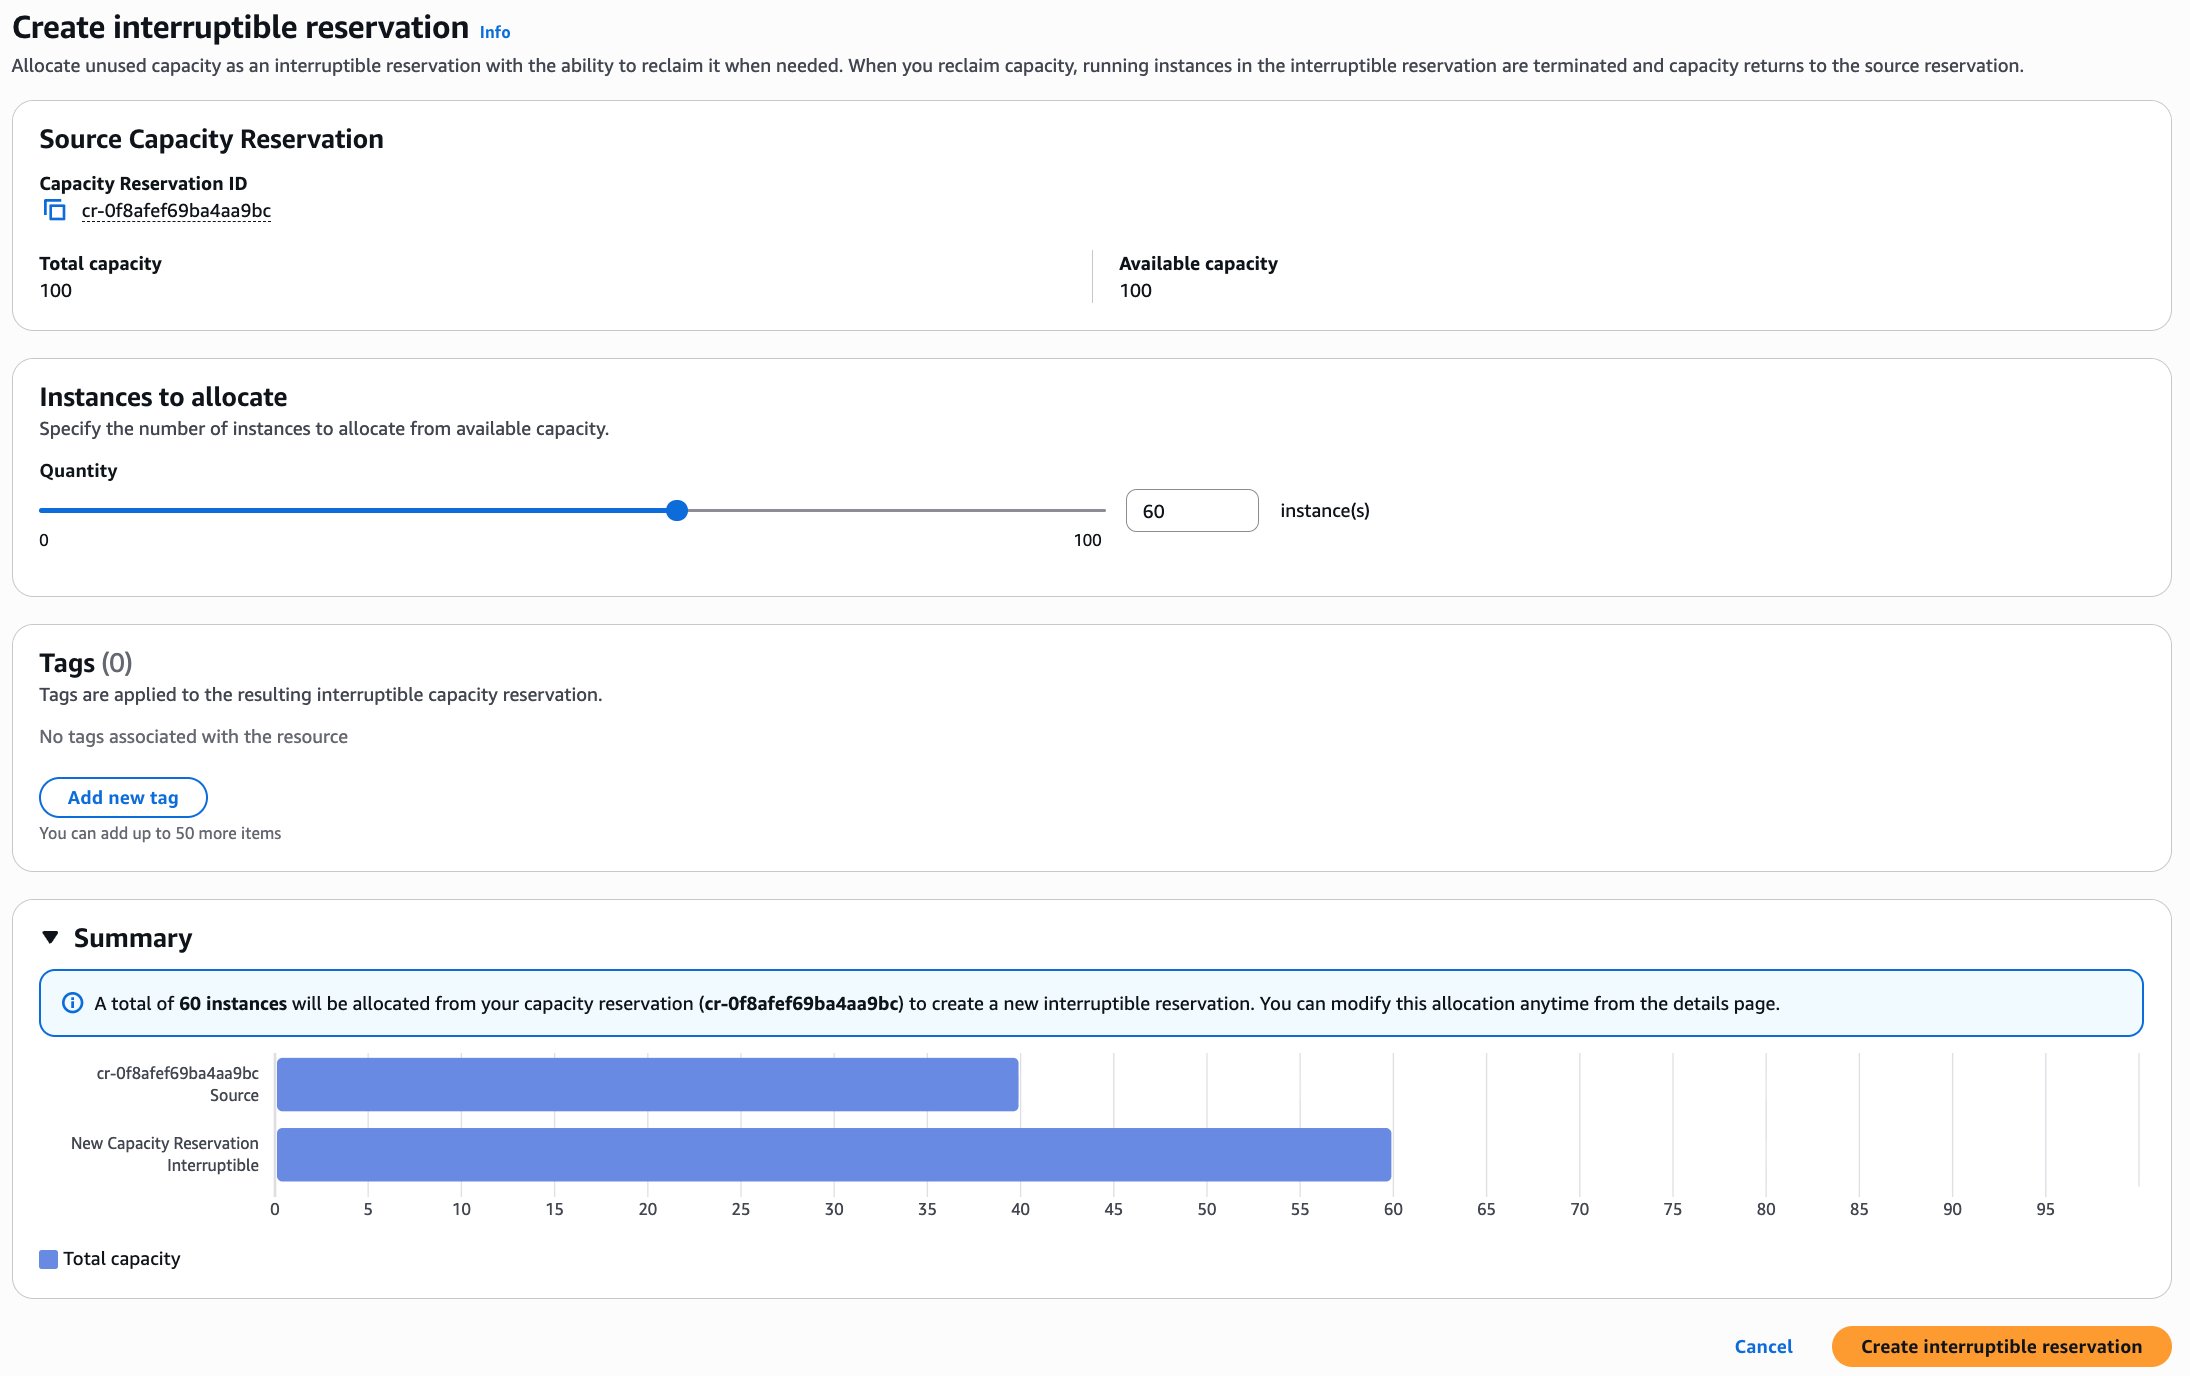
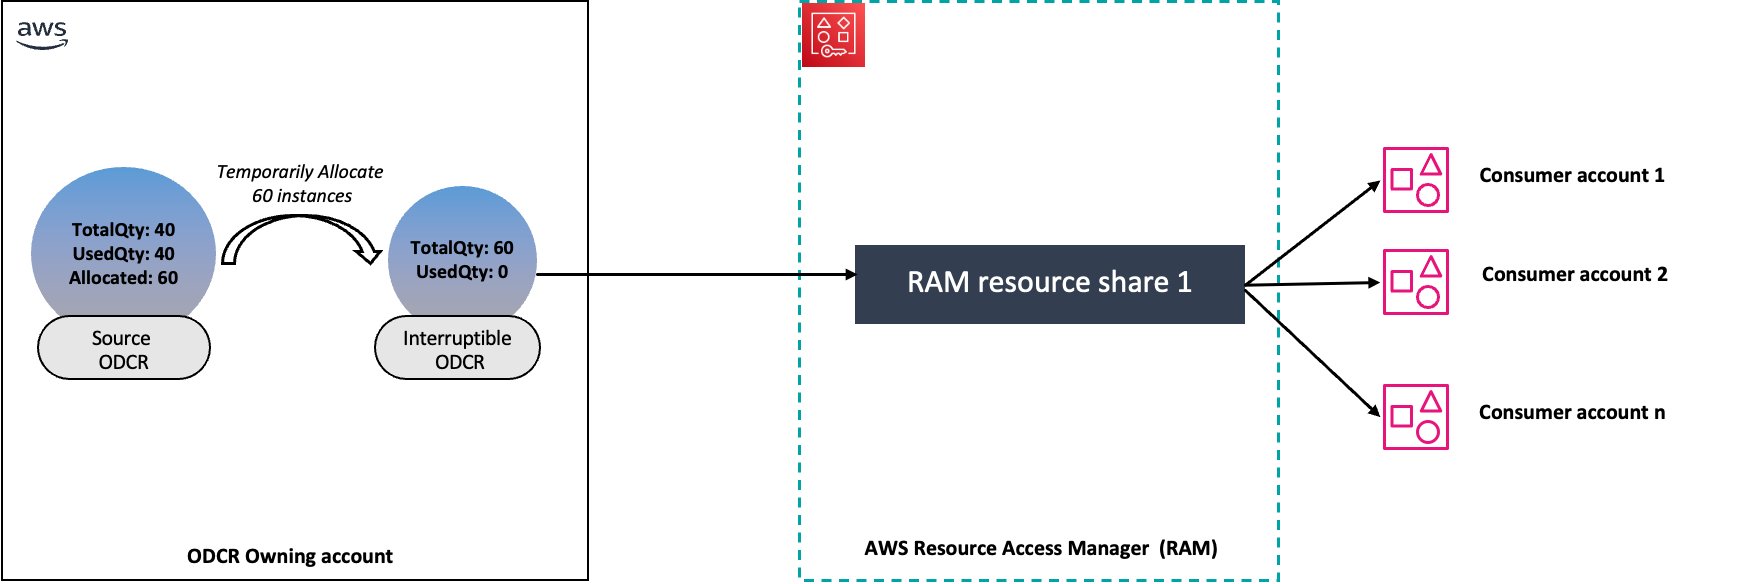
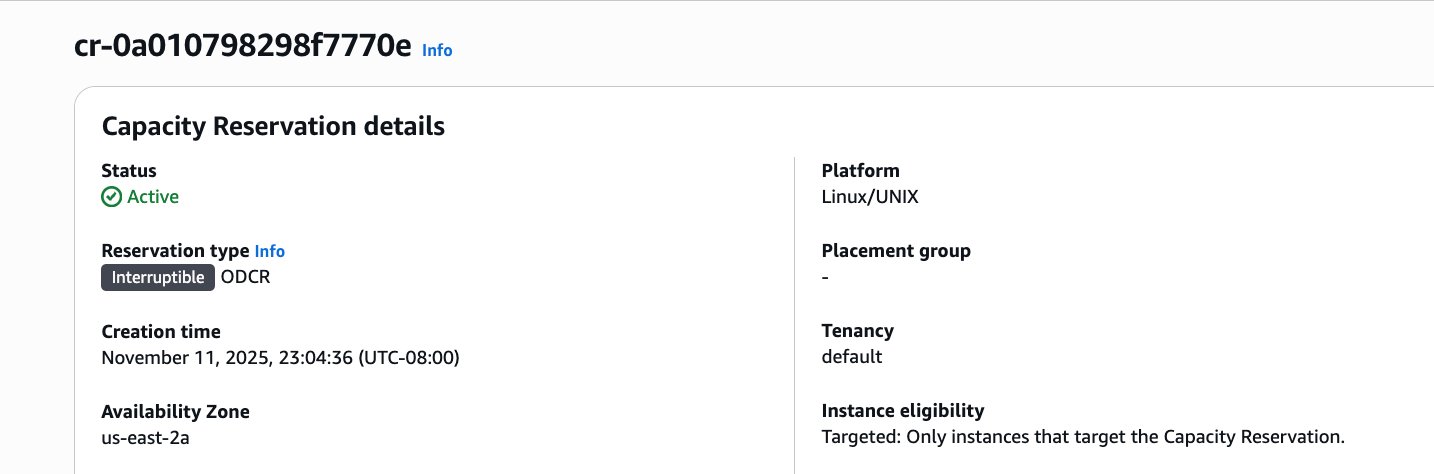
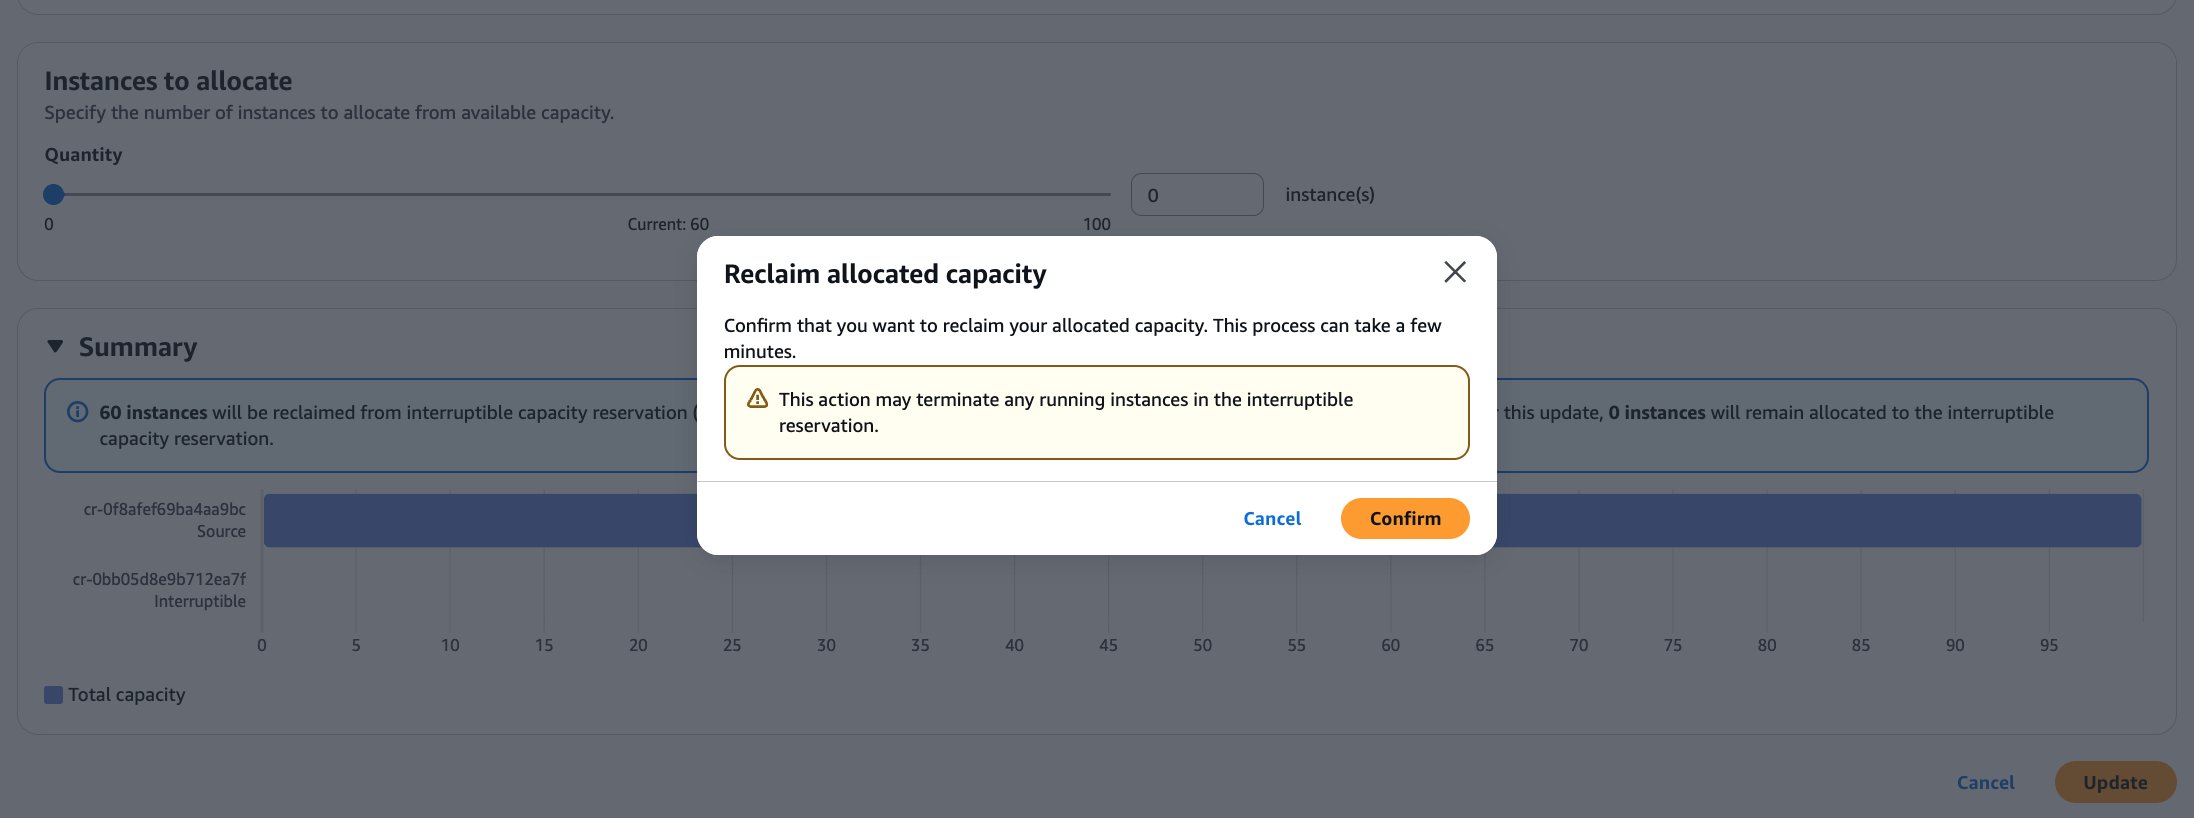


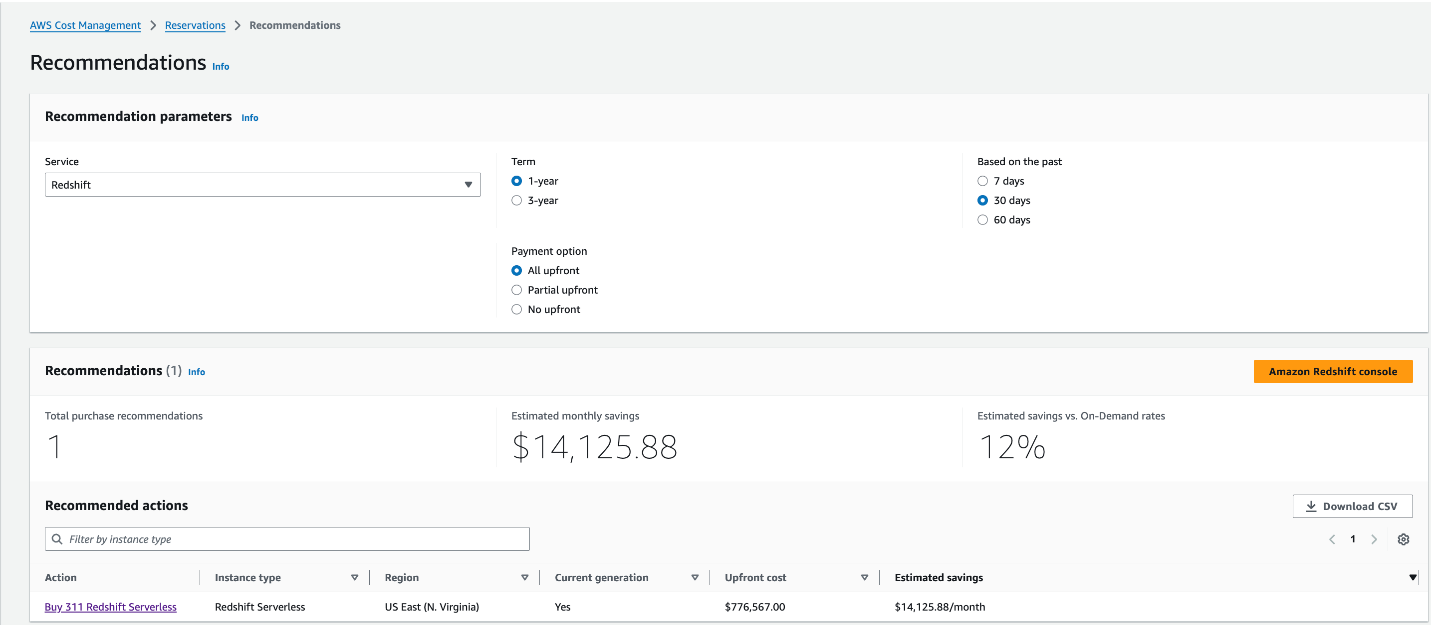
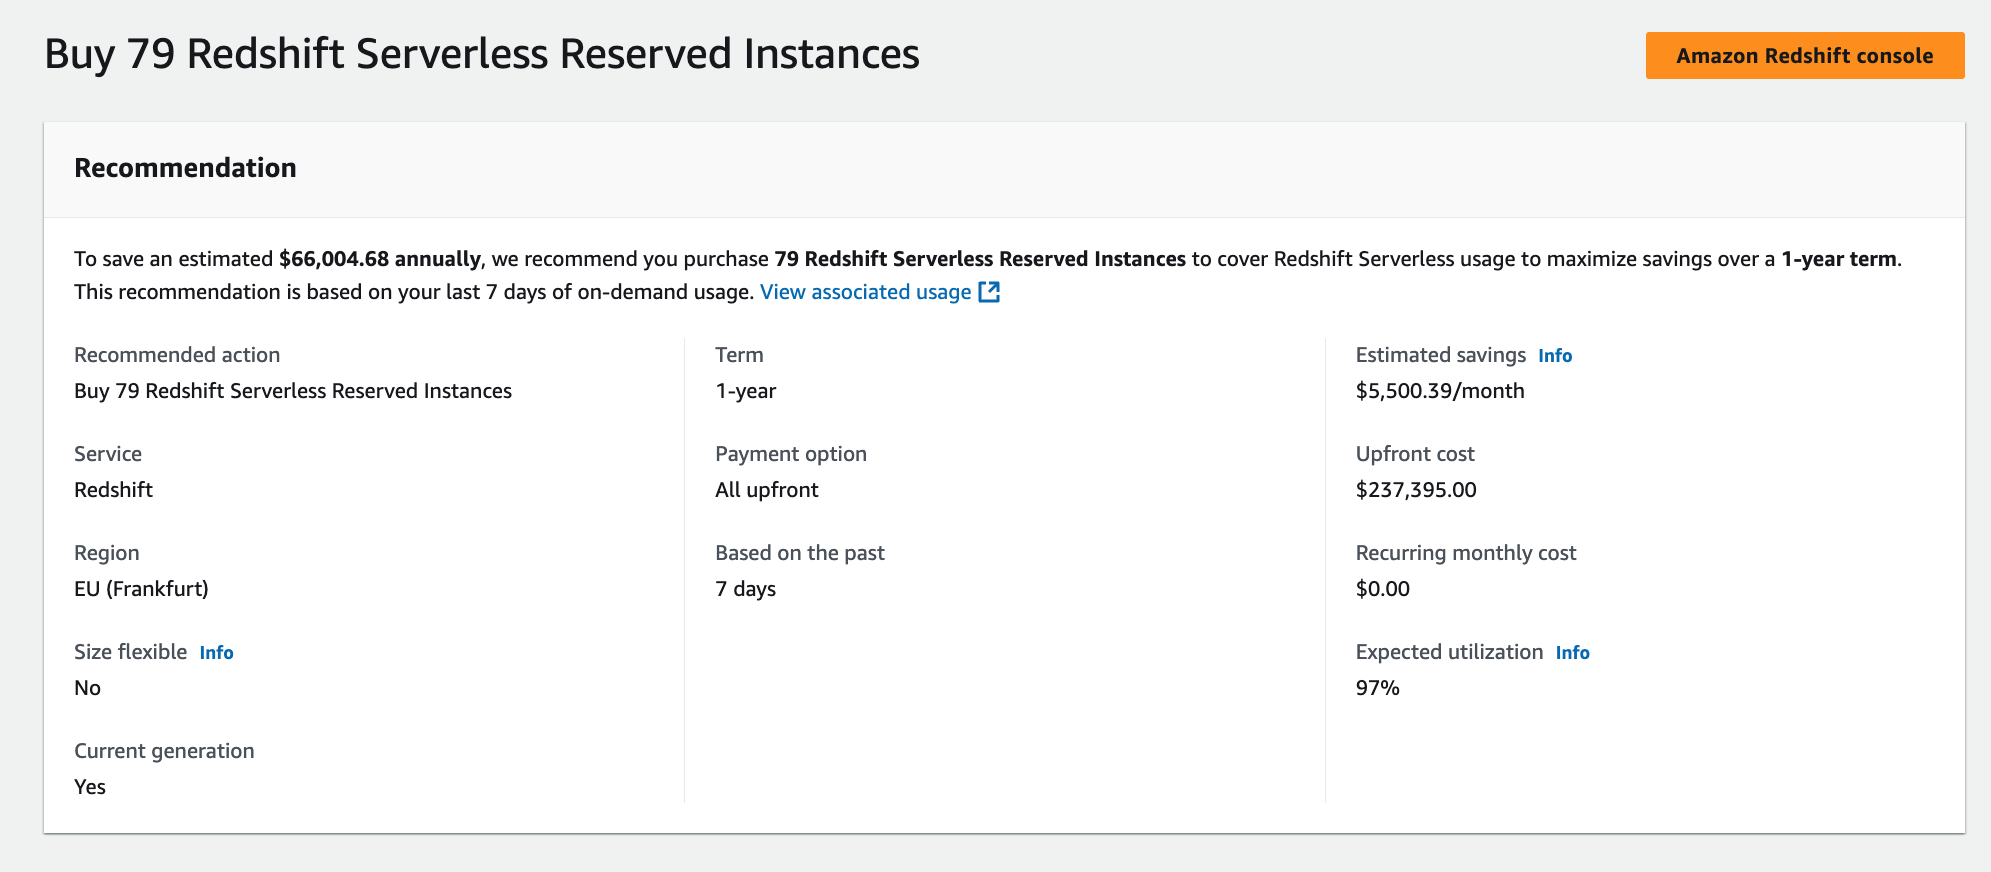





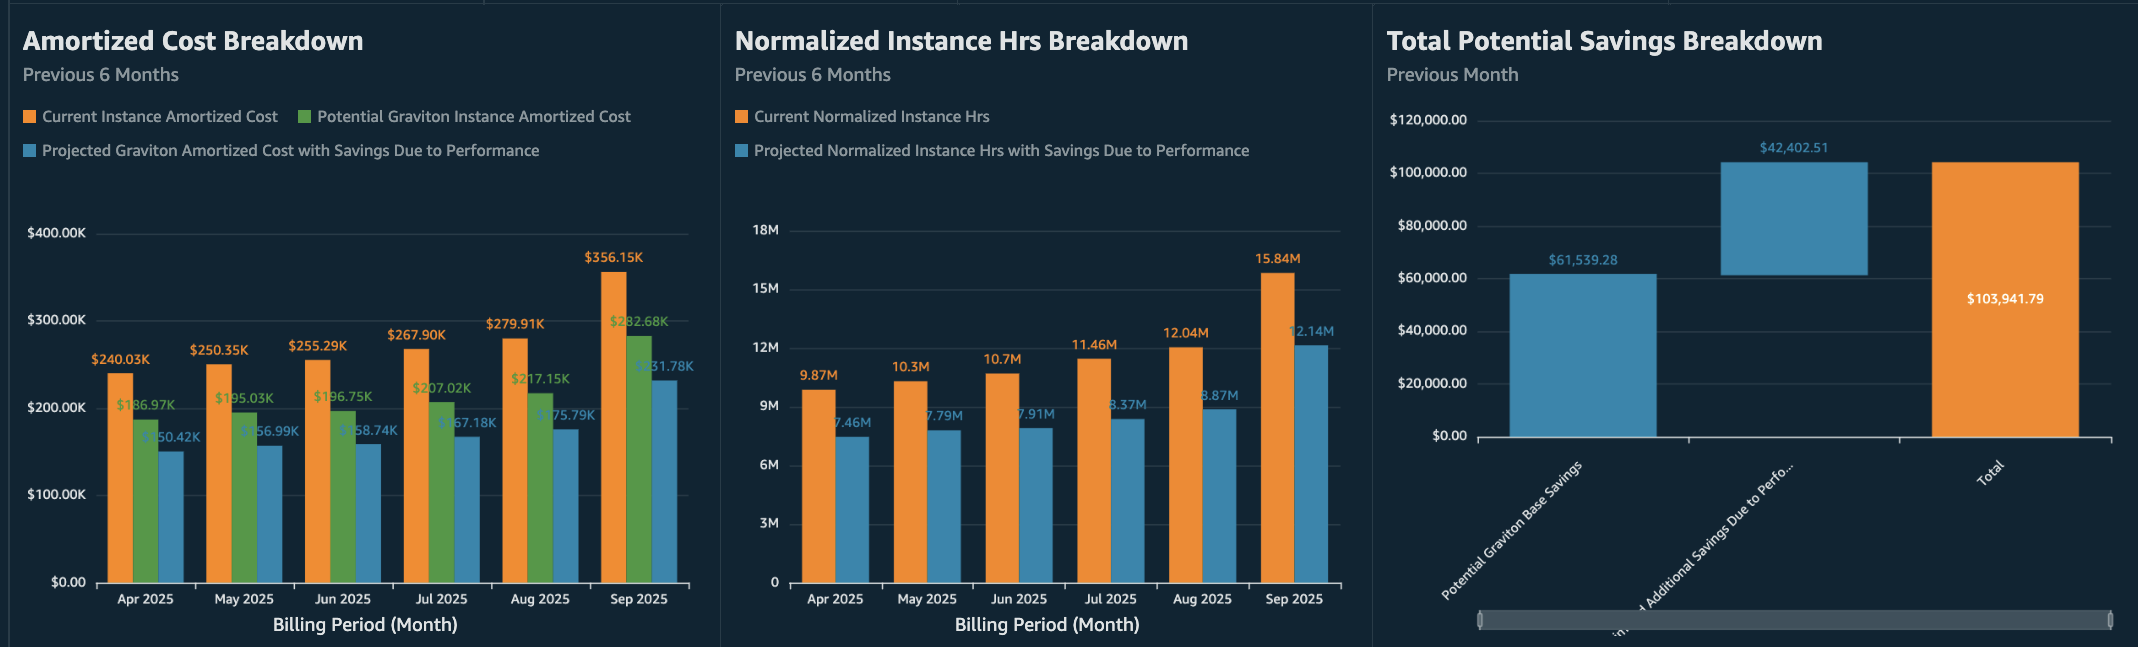
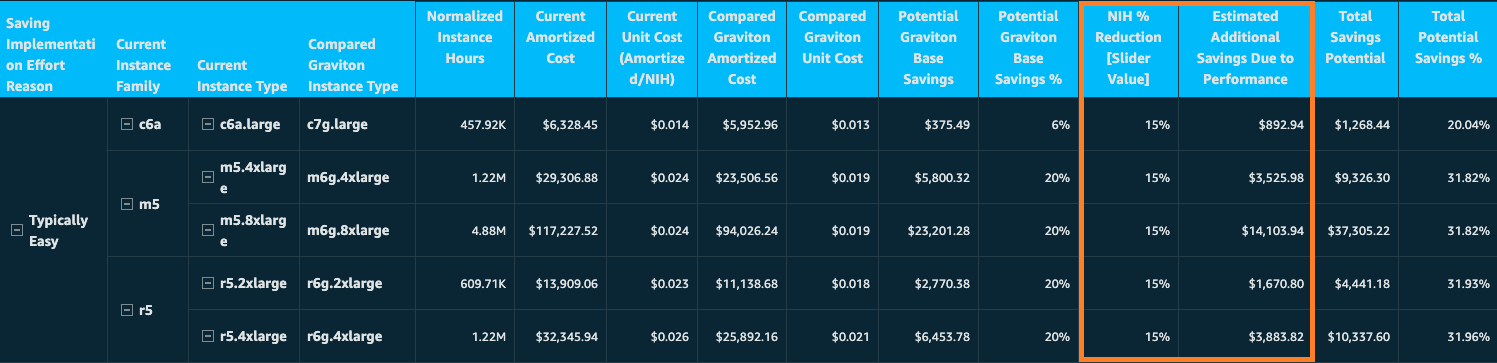
.jpg)