Искаме си еврото

Post Syndicated from Искрен Иванов original https://www.toest.bg/iskame-si-evroto/

Искаме си еврото

Една от най-поразителни черти на българската политическа действителност е начинът, по който определени групи в обществото изразяват недоволството си. В много европейски страни позицията на една група по интереси се формира след доста четене, информираност и съвместна работа, докато у нас процесите на когнитивни възприятия по отношение на един или друг проблем в обществото често вкарват българските граждани в капана на дезинформацията.

Дебатът – ако изобщо може да го наречем така – около присъединяването на България към еврозоната е болезнено белязан от тази действителност, която се дължи на два фактора: неспособността на политическия елит да сподели с избирателите си предимствата и недостатъците от приемането на общата европейска валута и силната вълна от дезинформация, представяща еврото като събирателен образ на всичко лошо, което очаква България. 

Казано с други думи, кампанията срещу еврото не е толкова успешна, колкото е слаба информираността на хората какво ни очаква в еврозоната. Ето защо в тази статия ще се постараем да анализираме кои са политическите ефекти от присъединяването на България към еврозоната, като ще се убедим, че те далеч надхвърлят като ползи и изгоди икономическите.

Защо ни е еврозоната? Да не би датчани и поляци да са по-глупави от нас!?

Едва ли противниците на единната европейска валута си дават сметка, че основната причина за приемането на еврото всъщност се крие в историята и спецификата на Прехода. Краят на социализма през 1989 г. отвори вратата за частната собственост и пазарната инициатива – двете характеристики на капитализма, които в политическо и социално отношение далеч надхвърлят легендарната предвидимост и спокойствие на „развитото“ социалистическо общество. 

В рамките на няколко години българите, които останаха или се завърнаха в страната след промените, се опитаха да се позиционират трайно в тази нова система, която даваше на мнозина надежди за по-добро бъдеще. Оптимизмът рухна, когато България преживя най-сериозната икономическа криза след края на Втората световна война, останала в историята ни като печално известната Виденова зима. По-дълбоки като психологическо отражение от това злощастно събитие са единствено годините на сеч и гибел, сполетели страната ни по време на Междусъюзническата и двете световни войни.

Казано накратко, през януари 1997 г. българската икономика рухна безславно, а левът беше поставен на животоподдържащи системи в условията на валутен борд. Тези години бяха най-унизителните в историята на българската валута, която дори през социализма се ползва със златно покритие и е фиксирана стабилно към курса на щатския долар. Щетите, нанесени върху валутата ни, бяха особено дълбоки и поради факта, че тя никога повече нямаше да успее да се възстанови от девалвацията, а трябваше раболепно да следва курса на марката, за да може парите да възстановят покупателната си способност, а икономиката да бъде изградена отново. 

В дните, когато Германия извърши символично погребение на марката и я замени с еврото, стана ясно, че България се превръща в прецедент, тъй като нейната полуфункционираща валута на практика е вързана за курса на друга несъществуваща валута.

След тази кратка историческа ретроспекция е редно да си дадем сметка, че причината, поради която България стигна дотук, е икономическото фиаско от 1997 г. Приемането на еврото на практика ще завърши започнатото от валутния борд. Ако все пак се опитаме да пресъздадем една алтернативна историческа реалност, в която Виденовата зима отсъства, то тогава левът би успял да запази фиксиран курс към долара и днес успешно да се вмести в датския, полския или пък румънския сценарий. Но тъй като в историята няма „ако“, дилемата пред нашата страна е тази: да избере лева – валута с фиктивна покупателна стойност, която ще девалвира все повече с времето, или да избере еврото, чието златно покритие му гарантира позицията на втората най-силна валута в света.

Политическите ефекти от приемането на еврото

Първият и най-важен политически ефект засяга трайното и категорично позициониране на България като европейска държава в глобалния икономически ред. Понятието „глобален икономически ред“ е особено важно за осмислянето на предимствата на еврозоната, тъй като този ред на практика е едно неголямо семейство, в което съжителстват няколко резервни валути. С най-голям дял от тях са щатският долар и еврото, а с периферен – японската йена, китайският юан и британският паунд – остатък от колониалното минало на Британия. Еврото на практика е по-силно и от азиатските валути, и от паунда, като единствено доларът е в състояние да го конкурира. Негативните ефекти от тази конкуренция често се тушират от стабилните отношения между икономиките на САЩ и Европа, които очевидно ще надживеят сегашните турбуленции. 

Важно е да поясним, че когато имаш резервна валута, която е закрепена за стойността на златото, можеш да печаташ пари. Колкото поискаш. Чудили ли сте се как Америка винаги намира пари да воюва и да отстоява интересите си по света? Защото валутата ѝ е най-силната в света и хазната може да печата неограничено количество долари, които редовно да инжектира в американската военна машина и икономика. 

Същата логика е приложима и за еврото – винаги когато страна членка е заплашена от икономическа криза, Европейската централна банка във Франкфурт е в състояние да печата валута. В тези условия политическата стабилност и увереност на България ще се засилят, защото противниците на еврото няма да могат да легитимират твърденията си, че сме позорният длъжник на Международния валутен фонд и Световната банка, чиито заеми ще плащат идните поколения българи. България ще се сдобие с паричен и икономически суверенитет, а не с псевдовалутен васалитет.

Вторият политически ефект е отражението, което присъединяването ни към еврозоната ще окаже върху корупцията и сивия сектор. Те ще продължат да съществуват, тъй като няма развита демокрация, която да е напълно имунизирана против ефектите от корупцията, противно на претенциите на автокрациите и тоталитарните режими, които са най-яркият съвременен символ на самата корупция. Но общественият статут на корупцията и на сивия сектор, както и нивото на съществуването им ще се променят. Ефектите им няма да са толкова осезаеми за гражданите, а упражняването на корупционни практики ще е привилегия на политическите елити и кръговете около тях, която ще приема далеч по-изтънчени форми. 

Казано иначе, корупцията у нас вече няма да е балканска, а европейскa, коeто ще даде лице и мандат на България да претендира за развита демократична държава, чиито корупционни практики следват европейските стандарти и санкцията на Франкфурт. И ако за прозападните кръгове у нас това е добре дошло, то за онези, които искат България да остане извън европейското семейство, подобна крачка ще е крайно делегитимираща, тъй като няма да могат да вземат пари директно от руските си спонсори.

Третият политически ефект се отнася до скъсването на зависимостта с евразийското икономическо пространство. България ще стане част от онова глобално икономическо пространство, което смели мъже като Хенри Моргентау-младши, Хари Декстър Уайт, Густав Щреземан и Жак Делор разчертават за бъдните поколения. Всъщност една от причините, поради които еврото е толкова недолюбвано, е, че компактни маси в българското общество не желаят да се разделят със спомените от социализма, но в същото време отказват да признаят факта, че ниските стойности на пенсионното осигуряване се дължат на инфлацията, която посече българската икономика през 1997 г.

По същия начин стои въпросът с онези групи, които гледат на европейския капитализъм като на нещо страшно и враждебно, без да си дават сметка, че на фона на англосаксонския той гарантира развитието на средна класа. Такива проблеми са плод на сериозна дезинформация в българското общество, която цели да го убеди, че единната европейска валута ще направи от България колония.

Ако трябва да обобщим, присъединяването на България към еврозоната не просто ще допринесе страната ни да придобие паричен суверенитет и по-значима роля в глобалната икономика, но и трайно да се позиционира като част от Европа.

В тези условия еврото ще спомогне за затваряне на ножицата между много богати и много бедни и при последователна и градивна икономическа политика ще насърчи формирането на европейска средна класа. 

Неудобната истина е, че приемането на еврото ще наложи и много по-стриктни стандарти и условия за динамиката на труда, което ще изисква от страната да стане доста по-прозрачна при прилагането на националното и европейското законодателство. Това ще изтръгне много противници на еврото от удобната роля на бездействащи критици на НАТО и ЕС, които сглобяват аргументите си с помощта на конспиративни теории, а не на рационални аргументи, и ще даде възможност на реално критичния поглед към функционирането на общността и Алианса да излезе на преден план. Този поглед неведнъж е сблъсквал европейските и американските представители, но в крайна сметка изходът винаги е бил един и същ: от двете страни на океана са осъзнавали, че са като едно семейство, чийто икономически възход е двигателят на световната икономика.

Ами ако не успеем?

Какво би се случило в една паралелна реалност, в която България остава извън еврозоната? Или пък какво би станало, ако липсата на консенсус в политическия дебат у нас доведе до нестабилност, на която Брюксел и Франкфурт няма да погледнат добре?

Ако България не се присъедини към еврозоната, това ще създаде доста благоприятна почва за ръст на антизападните настроения у нас и за изолиране на страната. Това на практика е път обратно към Малтийския консенсус, но тъй като той отдавна не функционира, България може да се окаже в позицията на failed state вътре в Европа. В крайна сметка едно е съществуването на българската икономика, без еврото изобщо да е на дневен ред, друго е тя да функционира в условия, при които приемането на единната европейска валута се е провалило. 

Това ще консолидира антиевропейските кръгове и ще даде възможност за създаването на икономически климат, който да препозиционира България в рамките на евроатлантическото пространство. Нашата страна за пореден път ще се окаже в ролята на мост между Изтока и Запада, а както е известно, през годините тази роля ни е довлякла много проблеми.

Провалът на приемането на единната европейска валута ще даде мандат да бъде поставена под въпрос цялостната геополитическа ориентация на нашата страна.

Това няма да се случи изведнъж и веднага, но ще придобие по-осезаеми форми с наративите, че Европейският съюз няма бъдеще и упадъкът му е неизбежен. 

Тук е мястото да кажем, че никой не знае какво точно е бъдещето и че общността неведнъж е изпадала в трудни моменти. По-старото поколение от европейски политици помни периода на „eвросклероза“ и кризата на европейската валутна змия. Но Европа винаги е намирала начин да оцелее, защото се е реформирала. Тази реформа и днес предстои да бъде много болезнена предвид геополитическите предизвикателства, които стоят пред Стария континент, но рано или късно ще започне. Показателни са плановете на Германия и Франция да разделят общността на концентрични кръгове, които да се ползват в различна степен от облагите, предоставяни от интеграционния процес. Ако България се окаже в някой от външните кръгове – това е неизбежно, ако не се присъединим към еврозоната, – едва ли в бъдещите десетилетия ще ни се удаде да бъдем пълноценен член на Европейския съюз.

В дългосрочен план, ако се провалим с приемането на еврото, твърде е възможно отново да се озовем на входа на тунела, от който се опитваме да излезем вече три десетилетия. Това ще се случи, когато животоподдържащите системи на лева откажат и валутният борд спре да работи. И когато страната изпадне в икономическа криза и спре да обслужва главоломно нарастващия си външен дълг, което рано или късно ще стане, ако навлезем в нова икономическа криза в резултат на глобална рецесия или латентна политическа нестабилност. Мнозина биха определили такова твърдение като заблуда, но малко хора през славното лято на 1994 г. очакваха, че само три години по-късно ще се редят на опашки в банките, за да изтеглят спестяванията си. И всъщност, ако тези събития се повторят, политическата цена, която ще платят гражданите и бъдещите поколения, ще бъде много висока.
Cloudflare Log Explorer is now GA, providing native observability and forensics

Post Syndicated from Jen Sells original https://blog.cloudflare.com/logexplorer-ga/

We are thrilled to announce the General Availability of Cloudflare Log Explorer, a powerful new product designed to bring observability and forensics capabilities directly into your Cloudflare dashboard. Built on the foundation of Cloudflare’s vast global network, Log Explorer leverages the unique position of our platform to provide a comprehensive and contextualized view of your environment.

Security teams and developers use Cloudflare to detect and mitigate threats in real-time and to optimize application performance. Over the years, users have asked for additional telemetry with full context to investigate security incidents or troubleshoot application performance issues without having to forward data to third party log analytics and Security Information and Event Management (SIEM) tools. Besides avoidable costs, forwarding data externally comes with other drawbacks such as: complex setups, delayed access to crucial data, and a frustrating lack of context that complicates quick mitigation. 

Log Explorer has been previewed by several hundred customers over the last year, and they attest to its benefits: 

“Having WAF logs (firewall events) instantly available in Log Explorer with full context — no waiting, no external tools — has completely changed how we manage our firewall rules. I can spot an issue, adjust the rule with a single click, and immediately see the effect. It’s made tuning for false positives faster, cheaper, and far more effective.” 

“While we use Logpush to ingest Cloudflare logs into our SIEM, when our development team needs to analyze logs, it can be more effective to utilize Log Explorer. SIEMs make it difficult for development teams to write their own queries and manipulate the console to see the logs they need. Cloudflare’s Log Explorer, on the other hand, makes it much easier for dev teams to look at logs and directly search for the information they need.”

With Log Explorer, customers have access to Cloudflare logs with all the context available within the Cloudflare platform. Compared to external tools, customers benefit from: 

  • Reduced cost and complexity: Drastically reduce the expense and operational overhead associated with forwarding, storing, and analyzing terabytes of log data in external tools.

  • Faster detection and triage: Access Cloudflare-native logs directly, eliminating cumbersome data pipelines and the ingest lags that delay critical security insights.

  • Accelerated investigations with full context: Investigate incidents with Cloudflare’s unparalleled contextual data, accelerating your analysis and understanding of “What exactly happened?” and “How did it happen?”

  • Minimal recovery time: Seamlessly transition from investigation to action with direct mitigation capabilities via the Cloudflare platform.

Log Explorer is available as an add-on product for customers on our self serve or Enterprise plans. Read on to learn how each of the capabilities of Log Explorer can help you detect and diagnose issues more quickly.

Monitor security and performance issues with custom dashboards

Custom dashboards allow you to define the specific metrics you need in order to monitor unusual or unexpected activity in your environment.

Getting started is easy, with the ability to create a chart using natural language. A natural language interface is integrated into the chart create/edit experience, enabling you to describe in your own words the chart you want to create. Similar to the AI Assistant we announced during Security Week 2024, the prompt translates your language to the appropriate chart configuration, which can then be added to a new or existing custom dashboard.

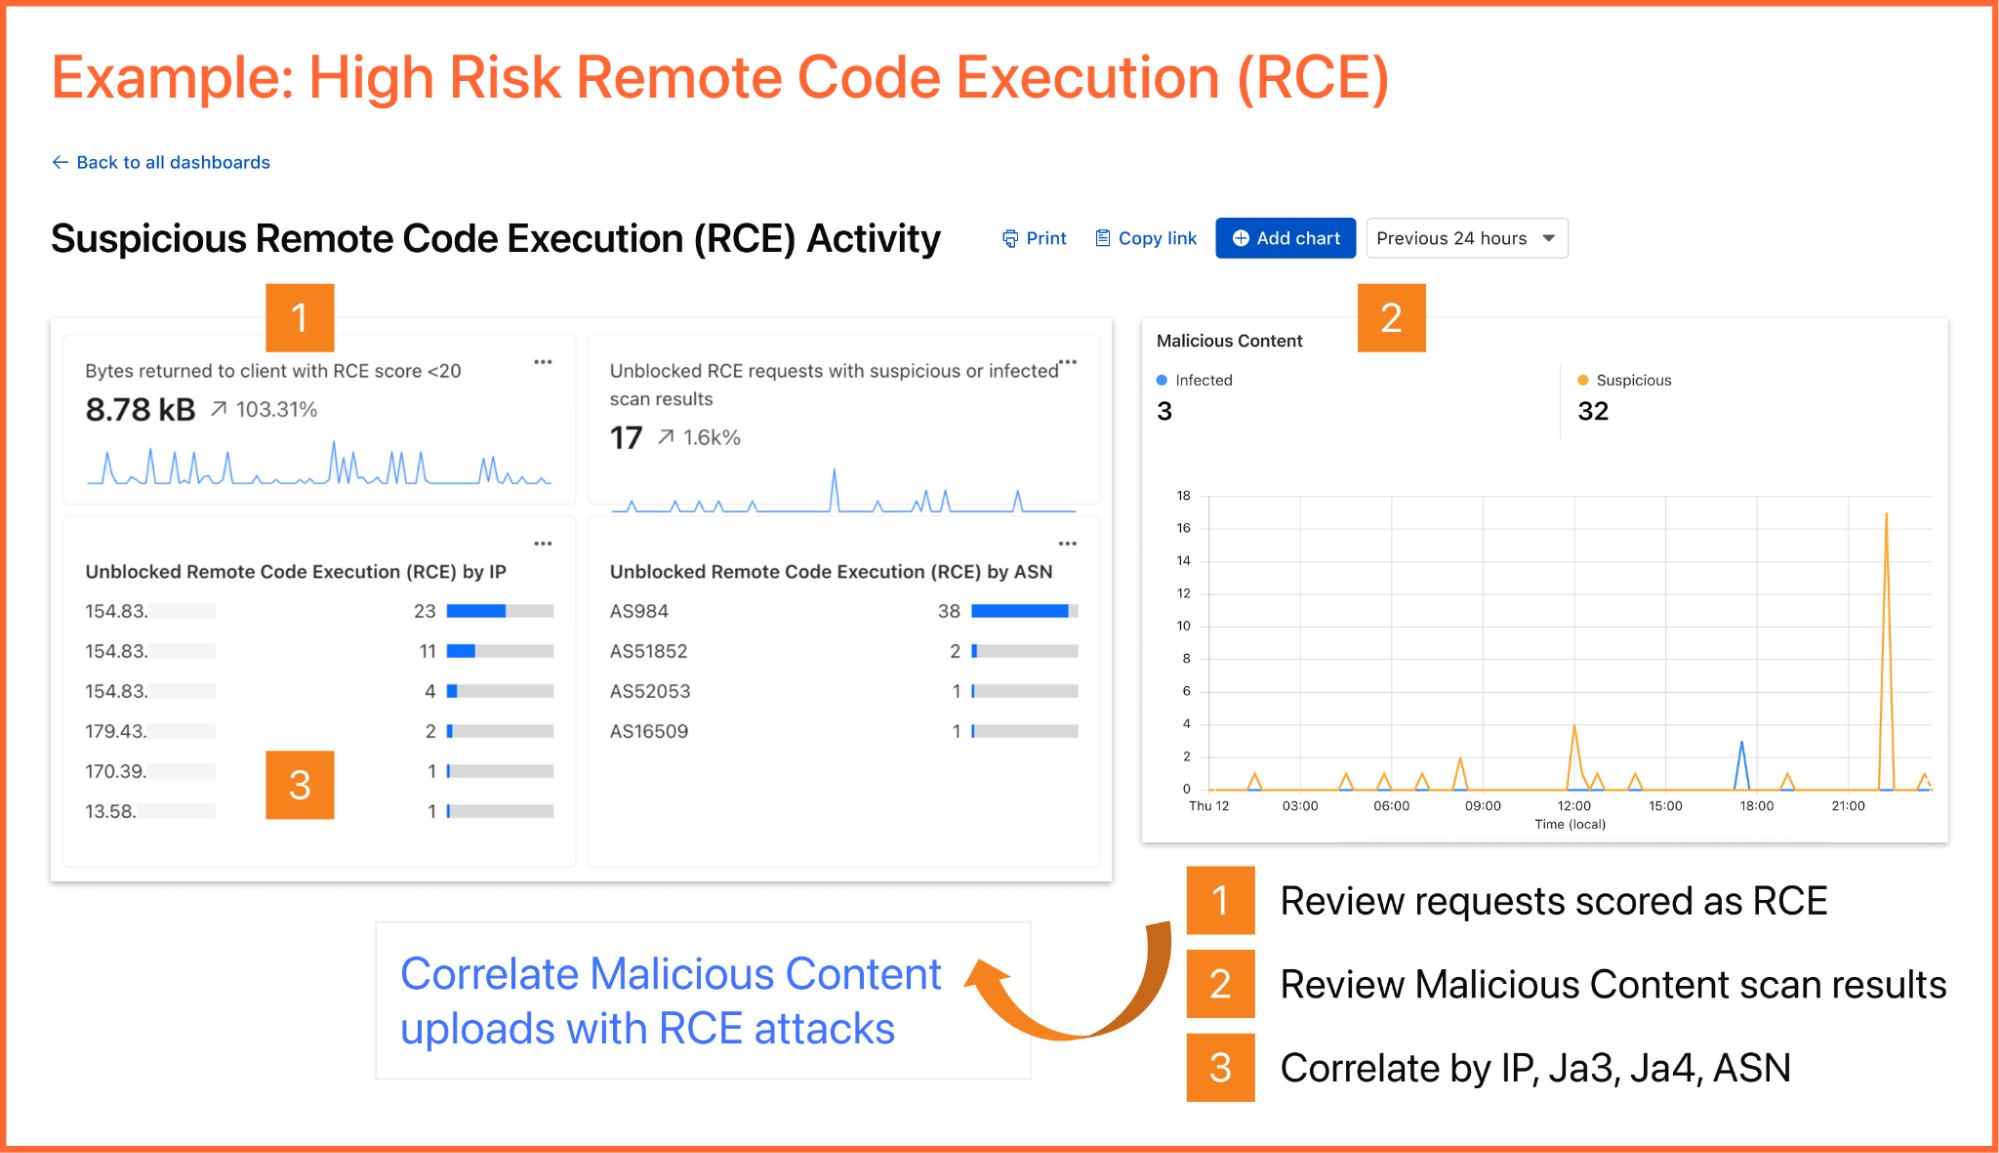
As an example, you can create a dashboard for monitoring for the presence of Remote Code Execution (RCE) attacks happening in your environment. An RCE attack is where an attacker is able to compromise a machine in your environment and execute commands. The good news is that RCE is a detection available in Cloudflare WAF.  In the dashboard example below, you can not only watch for RCE attacks, but also correlate them with other security events such as malicious content uploads, source IP addresses, and JA3/JA4 fingerprints. Such a scenario could mean one or more machines in your environment are compromised and being used to spread malware — surely, a very high risk incident!


A reliability engineer might want to create a dashboard for monitoring errors. They could use the natural language prompt to enter a query like “Compare HTTP status code ranges over time.” The AI model then decides the most appropriate visualization and constructs their chart configuration.

While you can create custom dashboards from scratch, you could also use an expert-curated dashboard template to jumpstart your security and performance monitoring. 

Available templates include: 

  • Bot monitoring: Identify automated traffic accessing your website

  • API Security: Monitor the data transfer and exceptions of API endpoints within your application

  • API Performance: See timing data for API endpoints in your application, along with error rates

  • Account Takeover: View login attempts, usage of leaked credentials, and identify account takeover attacks

  • Performance Monitoring: Identify slow hosts and paths on your origin server, and view time to first byte (TTFB) metrics over time

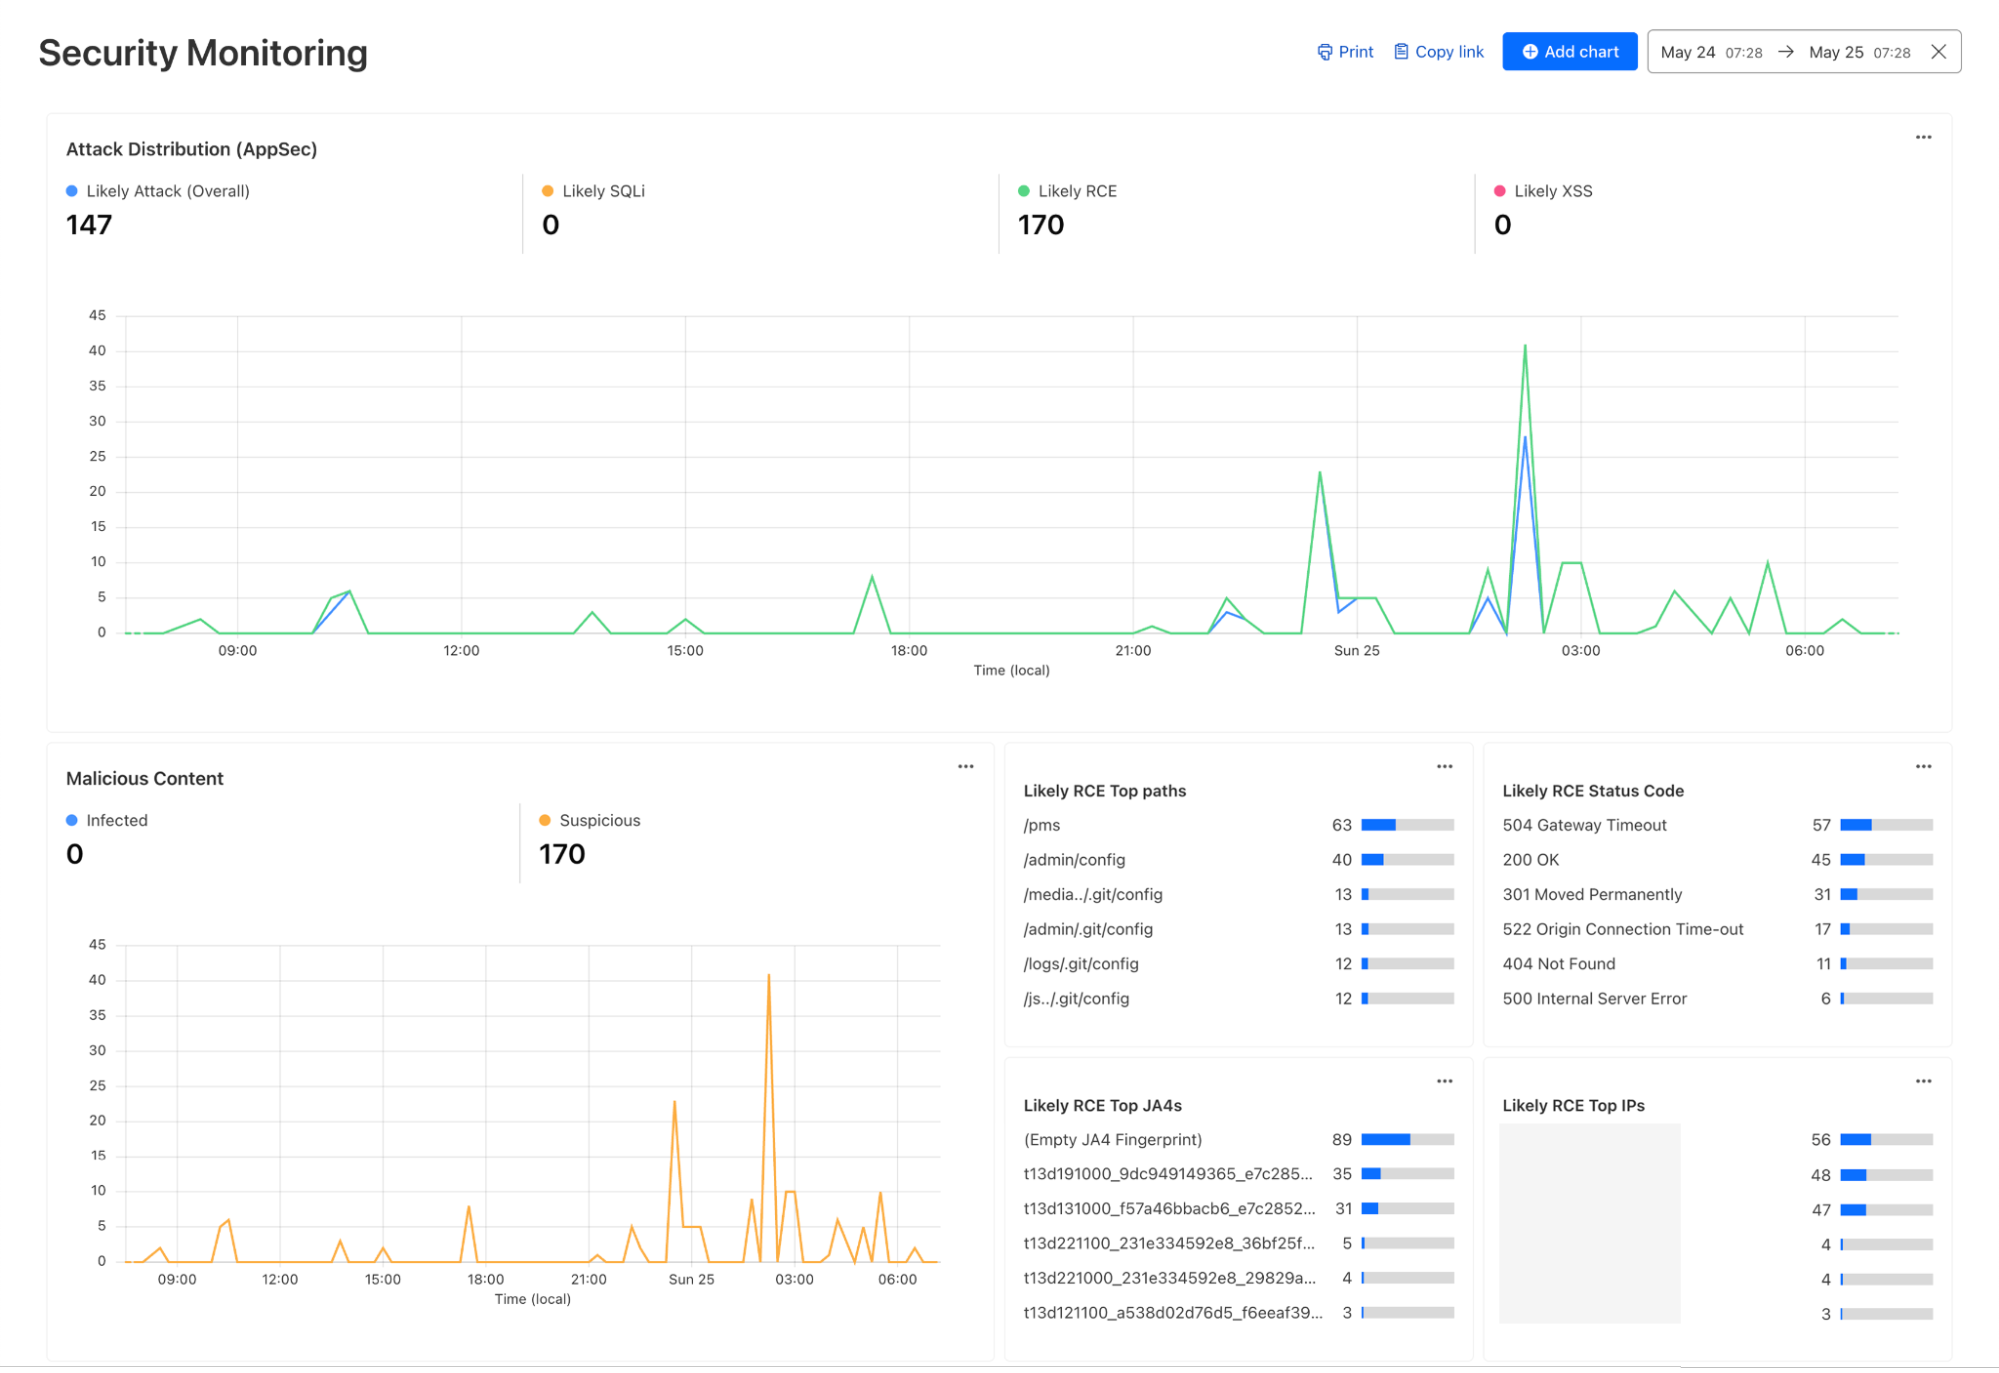
  • Security Monitoring: monitor attack distribution across top hosts and paths, correlate DDoS traffic with origin Response time to understand the impact of DDoS attacks.


Investigate and troubleshoot issues with Log Search 

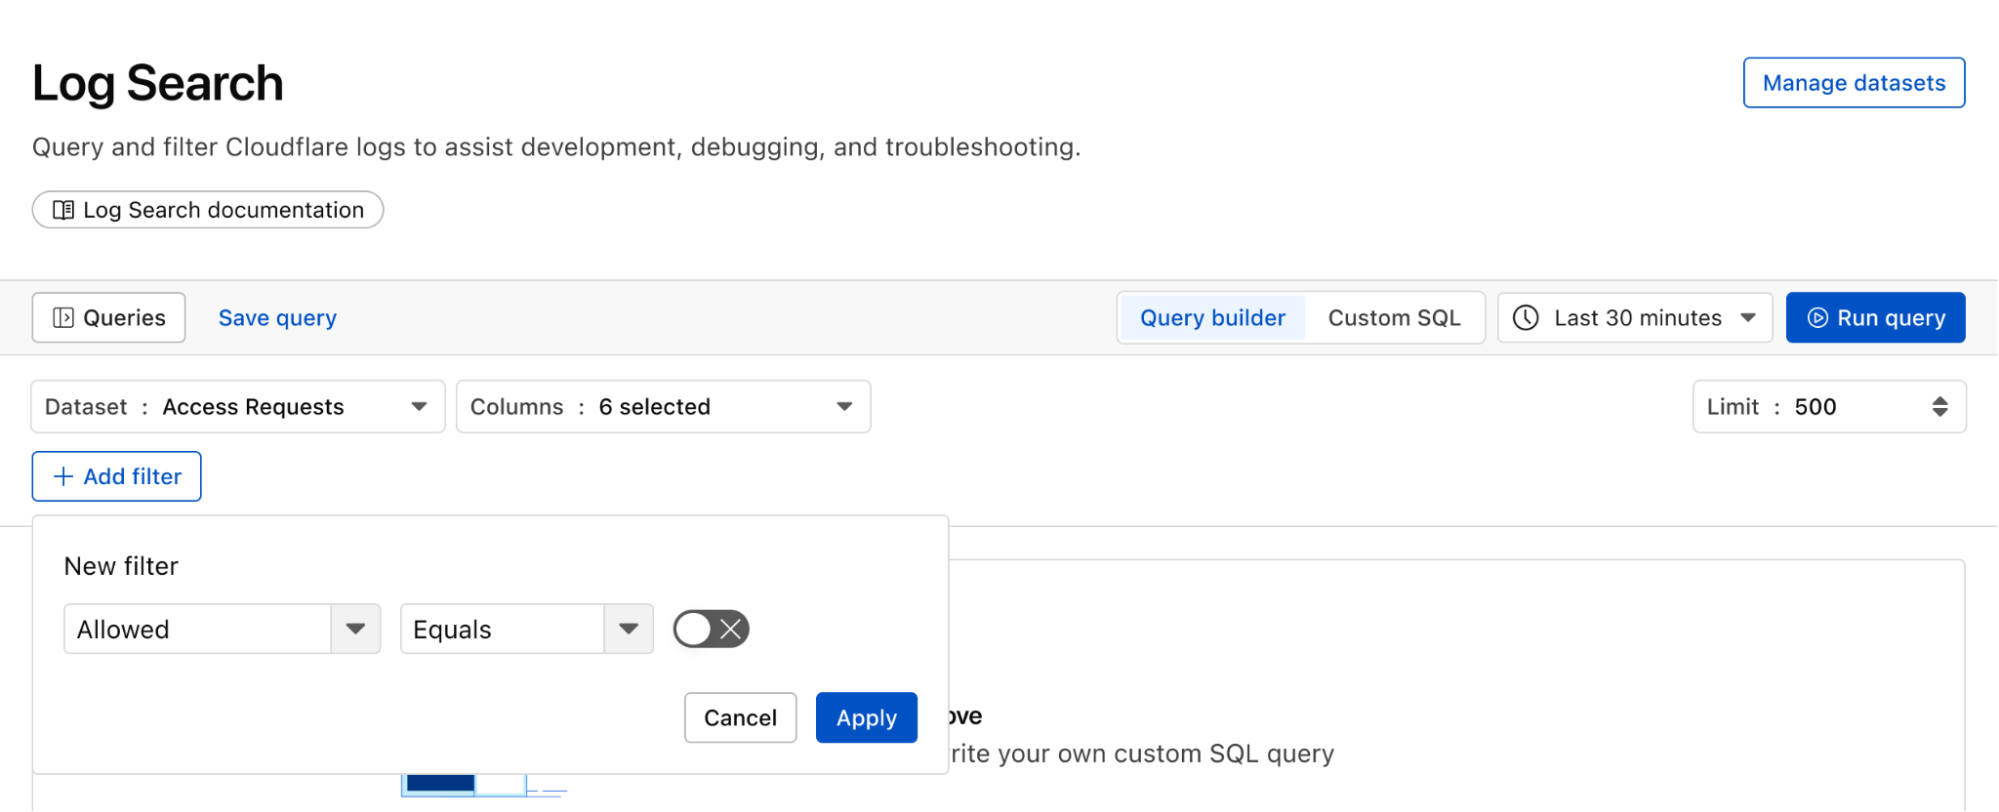
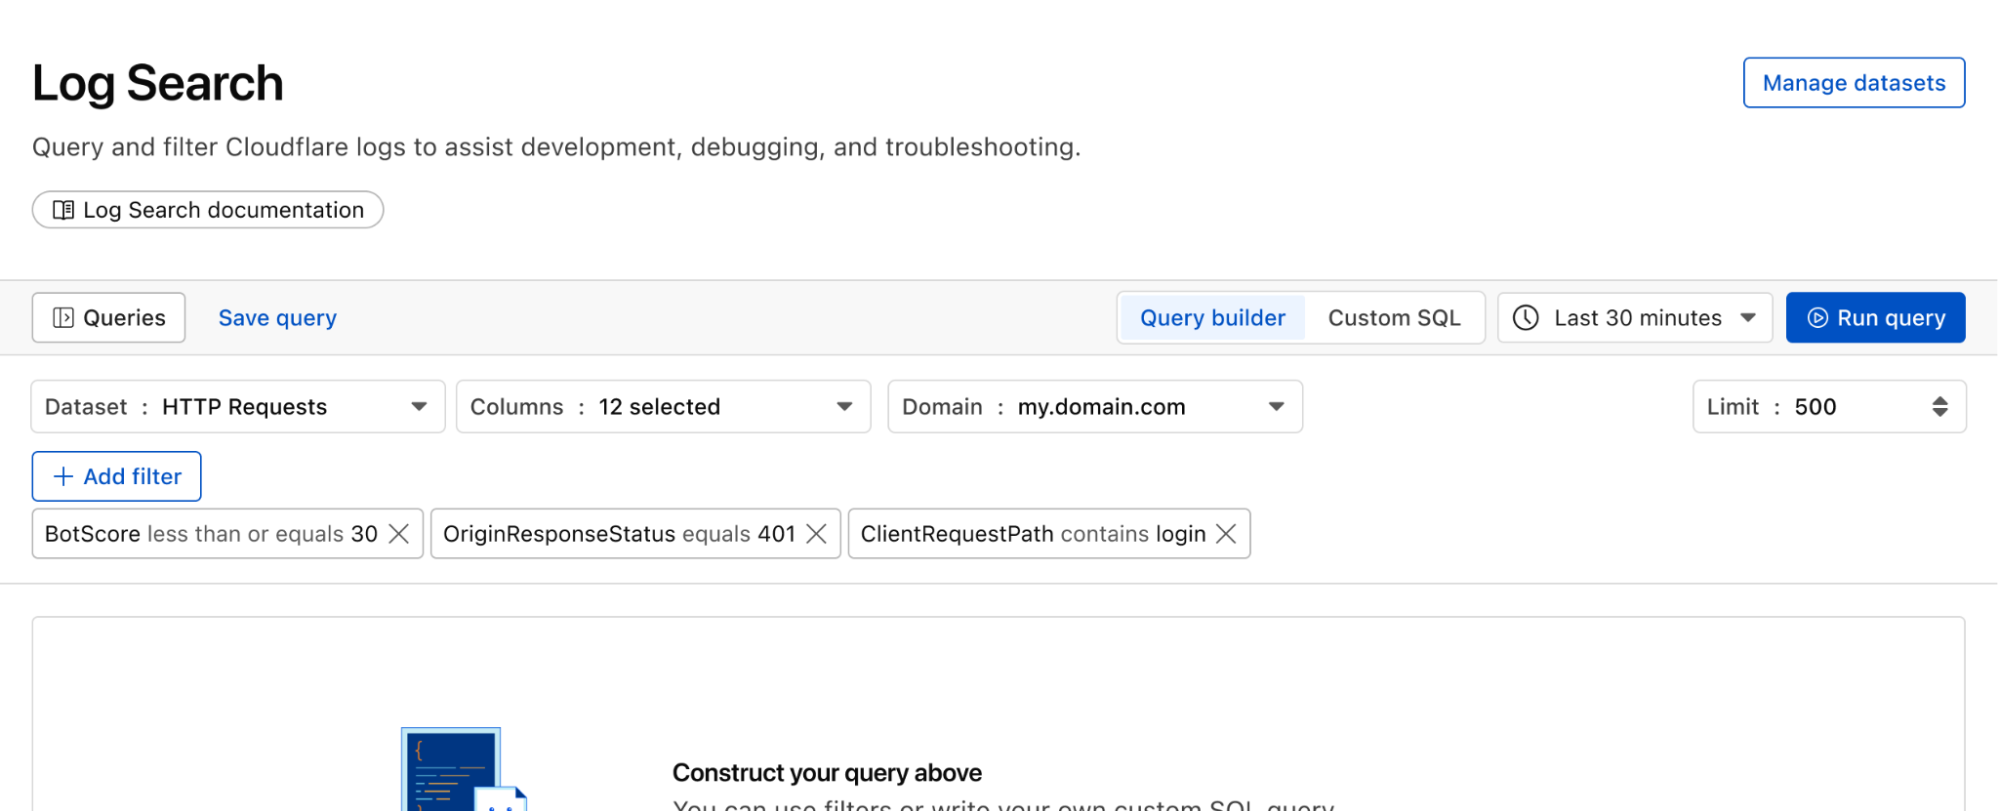
Continuing with the example from the prior section, after successfully diagnosing that some machines were compromised through the RCE issue, analysts can pivot over to Log Search in order to investigate whether the attacker was able to access and compromise other internal systems. To do that, the analyst could search logs from Zero Trust services, using context, such as compromised IP addresses from the custom dashboard, shown in the screenshot below: 


Log Search is a streamlined experience including data type-aware search filters, or the ability to switch to a custom SQL interface for more powerful queries. Log searches are also available via a public API. 


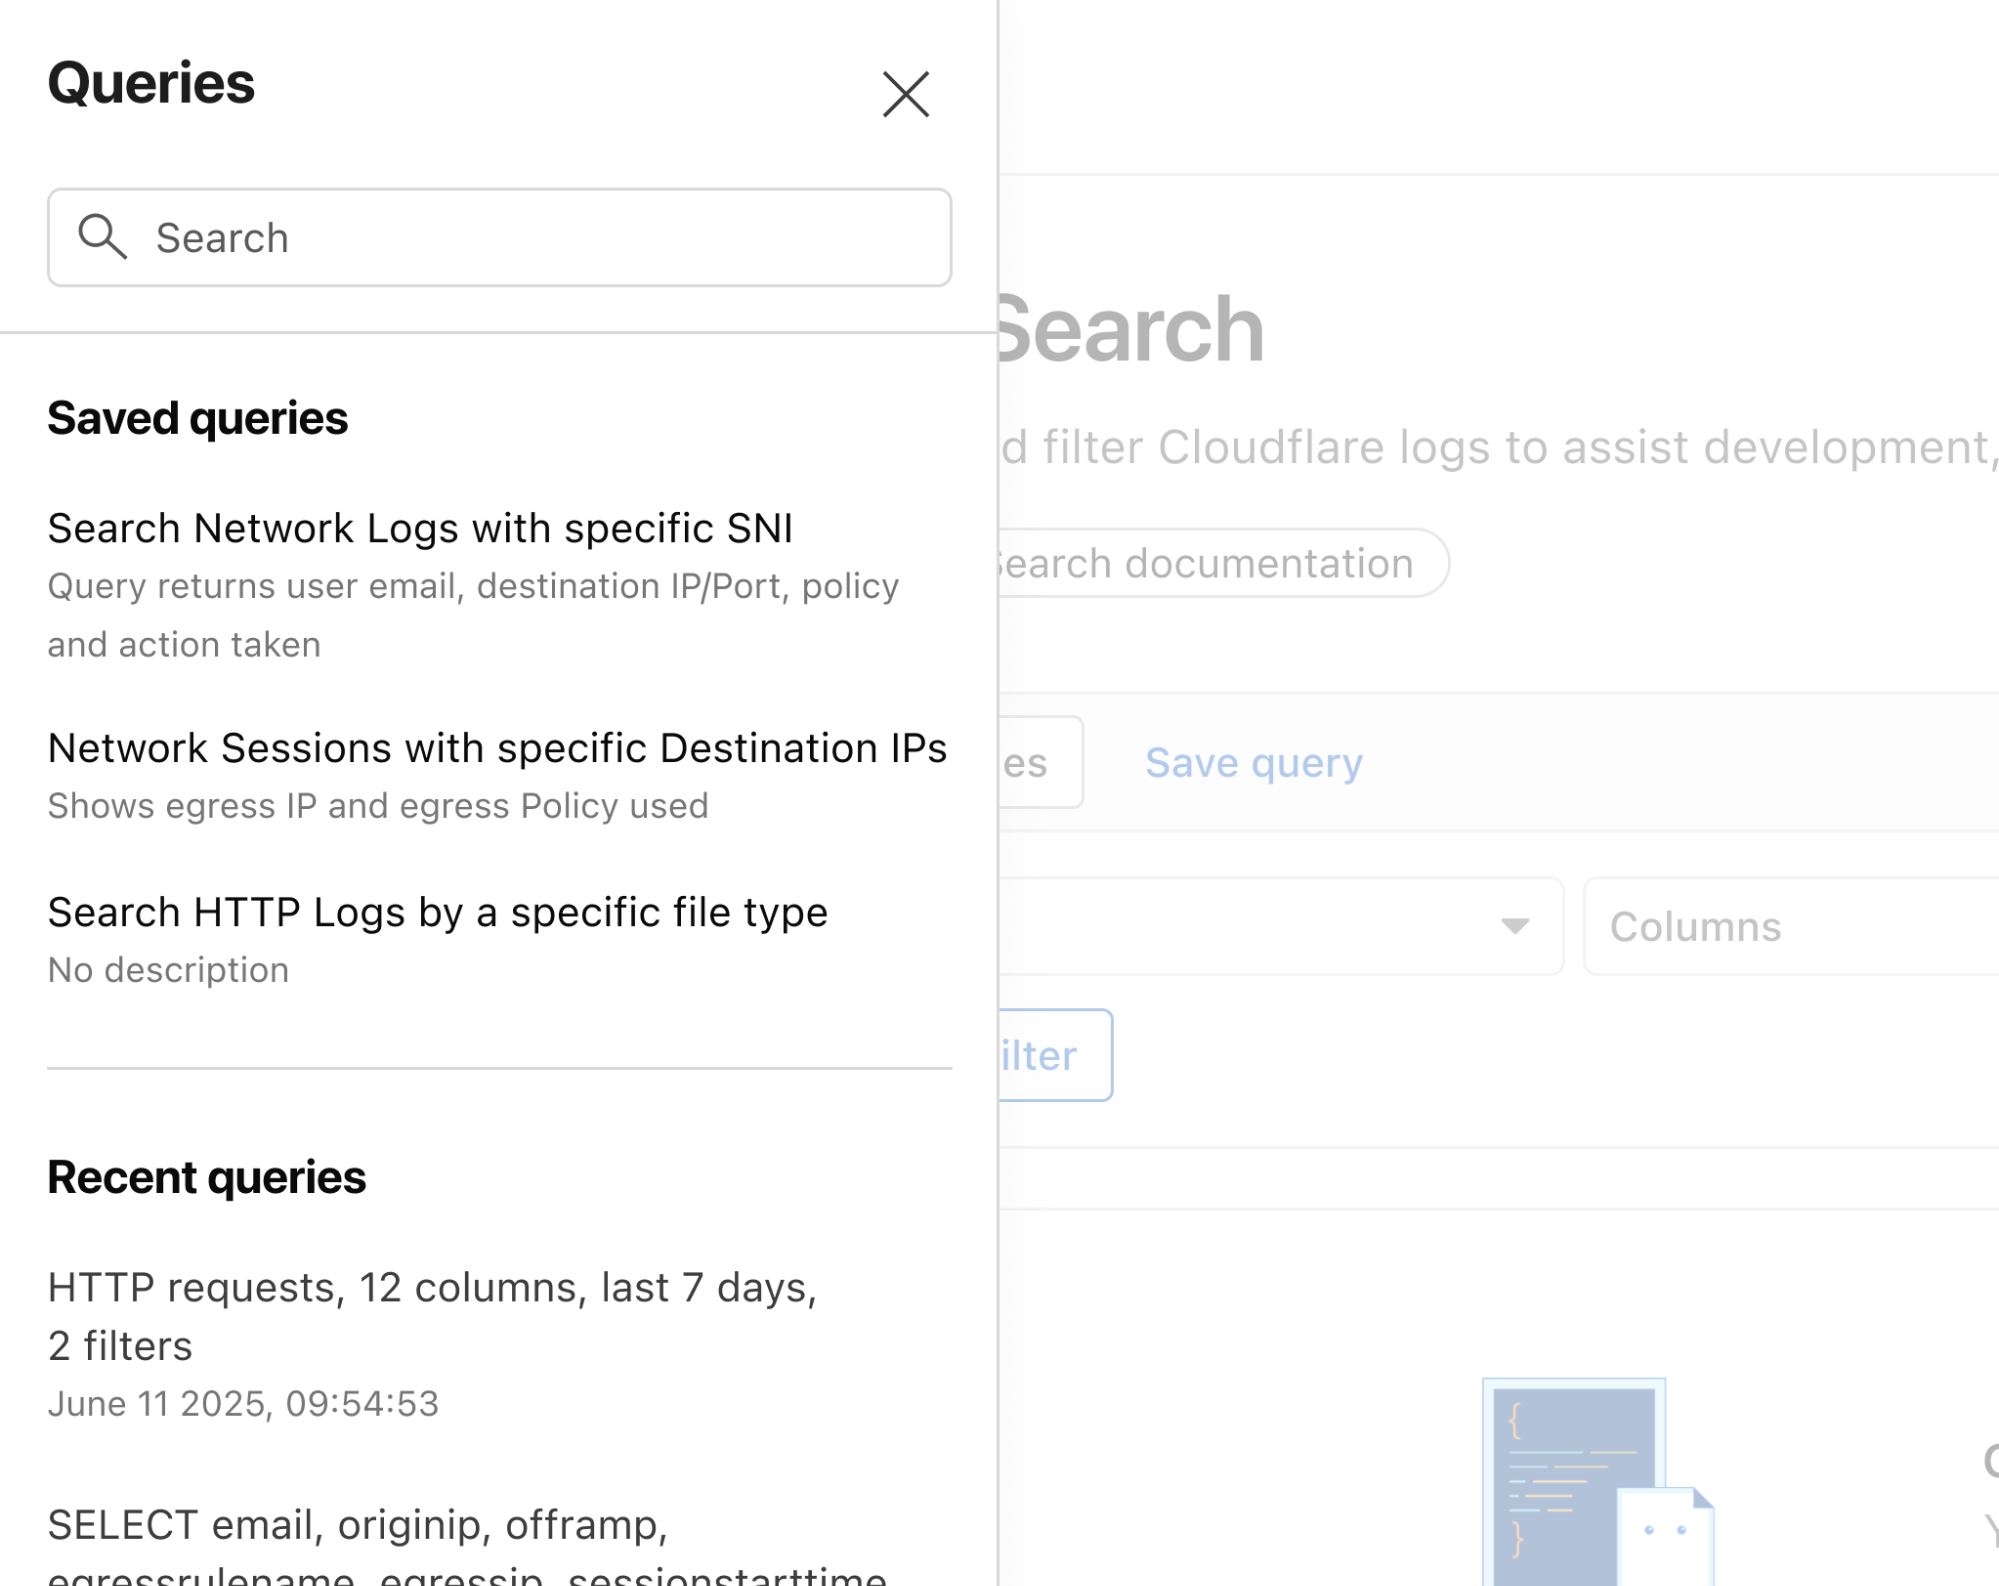
Save time and collaborate with saved queries

Queries built in Log Search can now be saved for repeated use and are accessible to other Log Explorer users in your account. This makes it easier than ever to investigate issues together. 


Monitor proactively with Custom Alerting (coming soon)

With custom alerting, you can configure custom alert policies in order to proactively monitor the indicators that are important to your business. 

Starting from Log Search, define and test your query. From here you can opt to save and configure a schedule interval and alerting policy. The query will run automatically on the schedule you define.

Tracking error rate for a custom hostname

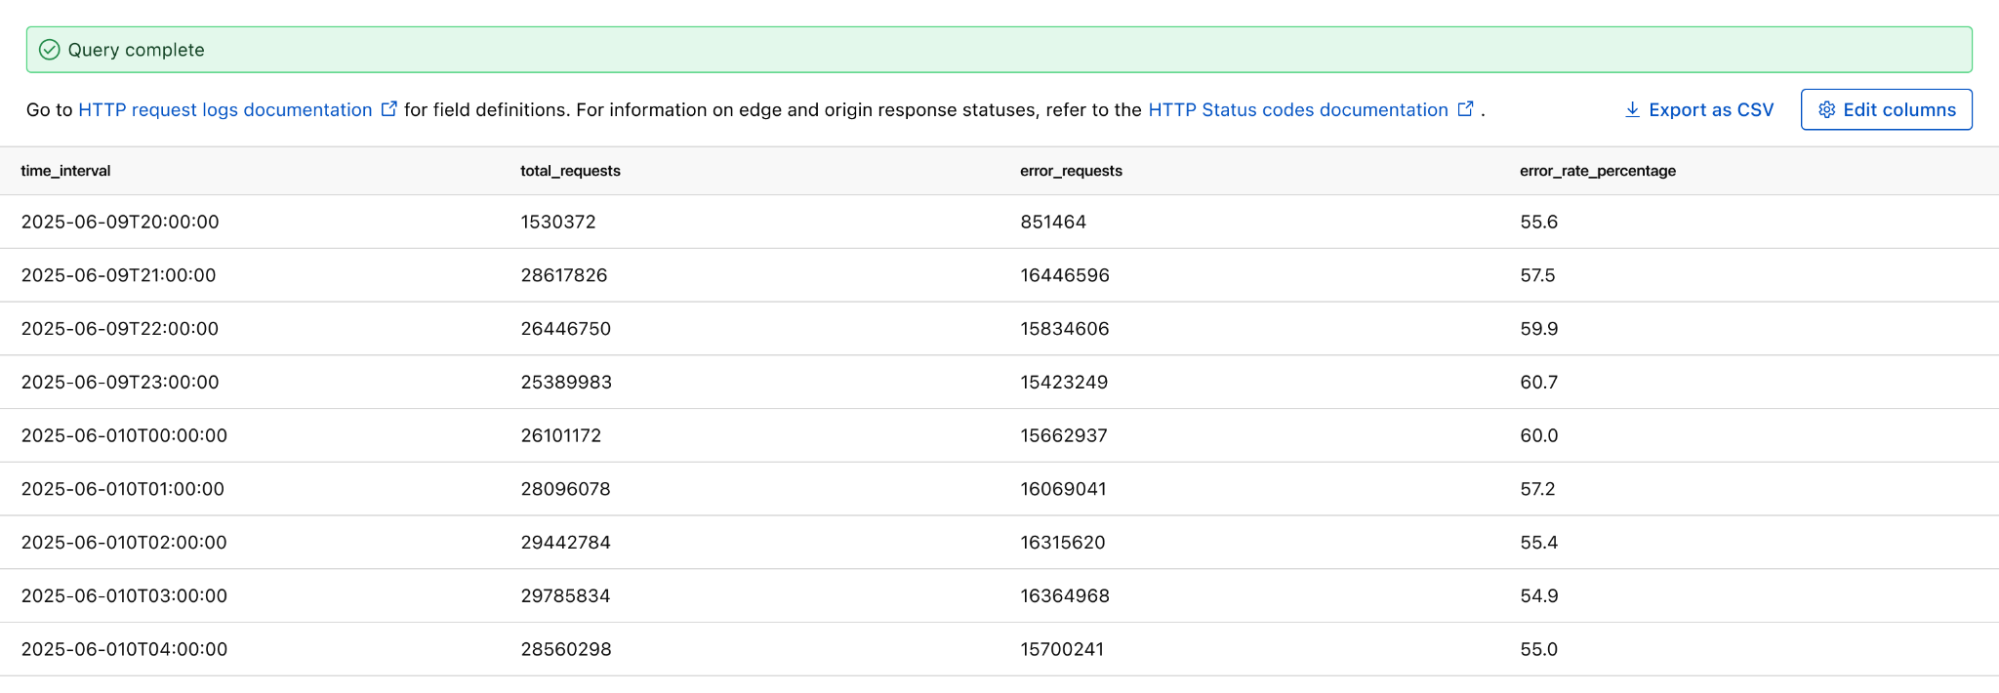
If you want to monitor the error rate for a particular host, you can use this Log Search query to calculate the error rate per time interval:

SELECT SUBSTRING(EdgeStartTimeStamp, 1, 14) || '00:00' AS time_interval,
       COUNT() AS total_requests,
       COUNT(CASE WHEN EdgeResponseStatus >= 500 THEN 1 ELSE NULL END) AS error_requests,
       COUNT(CASE WHEN EdgeResponseStatus >= 500 THEN 1 ELSE NULL END) * 100.0 / COUNT() AS error_rate_percentage
 FROM http_requests
WHERE EdgeStartTimestamp >= '2025-06-09T20:56:58Z'
  AND EdgeStartTimestamp <= '2025-06-10T21:26:58Z'
  AND ClientRequestHost = 'customhostname.com'
GROUP BY time_interval
ORDER BY time_interval ASC;

Running the above query returns the following results. You can see the overall error rate percentage in the far right column of the query results.


Proactively detect malware

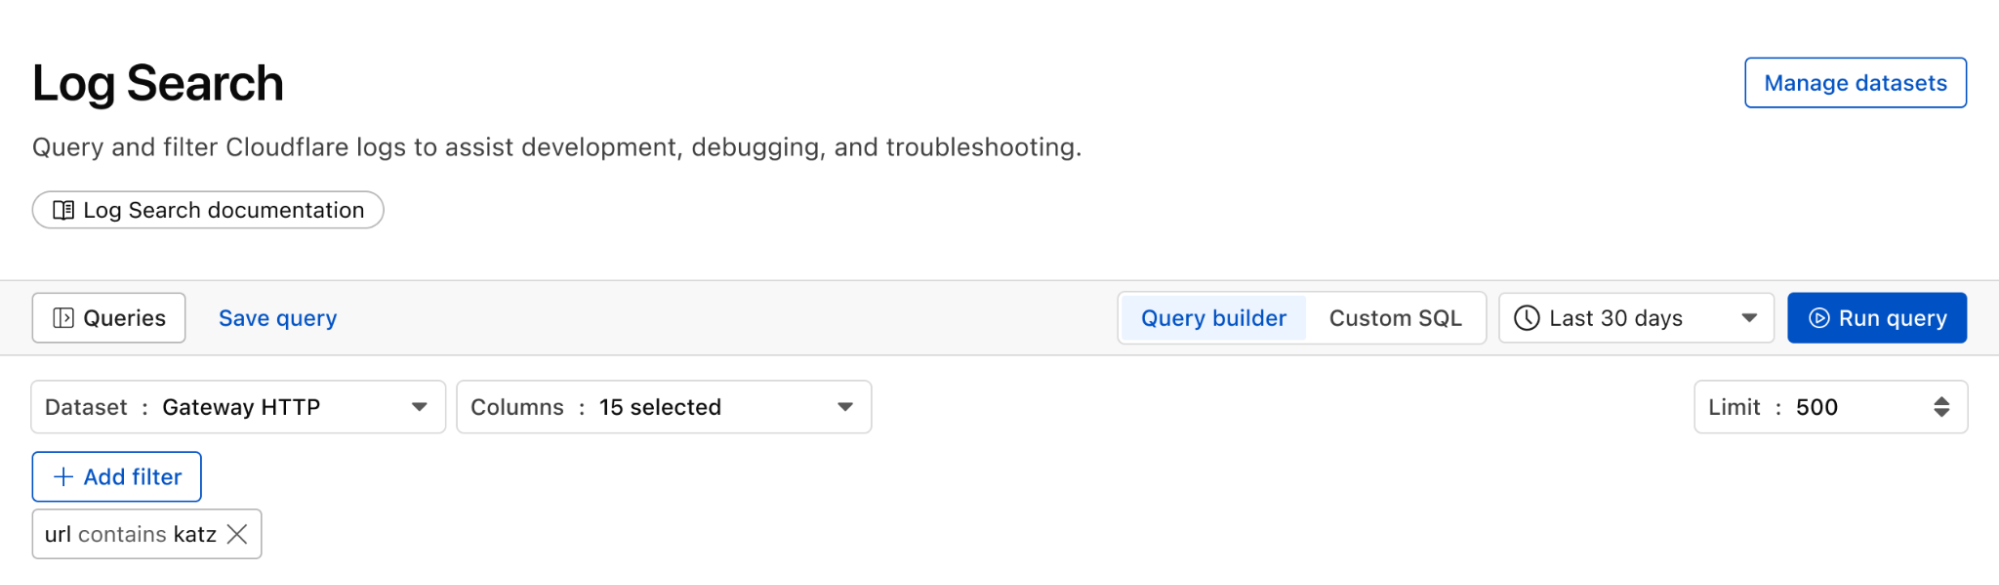
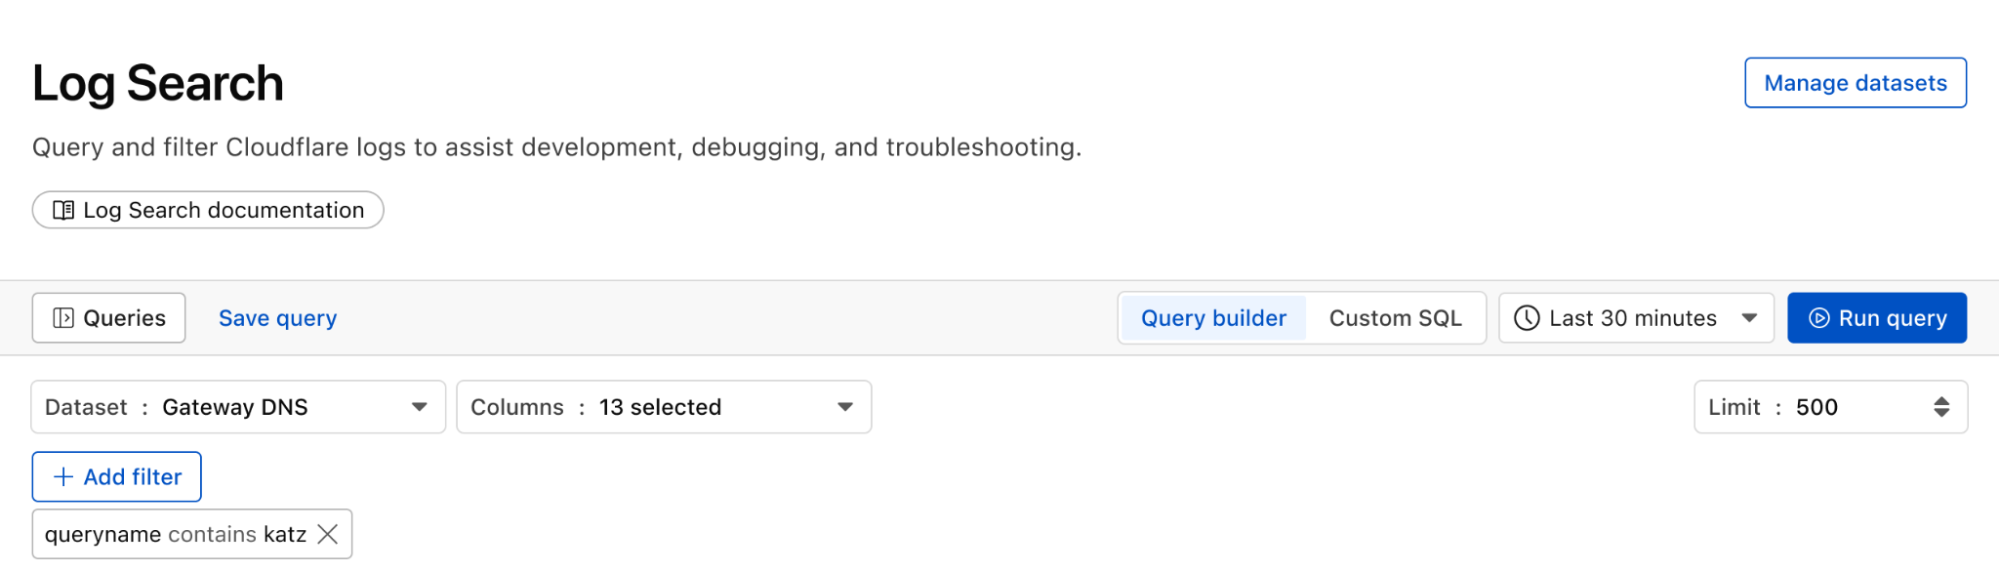
We can identify malware in the environment by monitoring logs from Cloudflare Secure Web Gateway. As an example, Katz Stealer is malware-as-a-service designed for stealing credentials. We can monitor DNS queries and HTTP requests from users within the company in order to identify any machines that may be infected with Katz Stealer malware. 


And with custom alerts, you can configure an alert policy so that you can be notified via webhook or PagerDuty.

Maintain audit & compliance with flexible retention (coming soon)

With flexible retention, you can set the precise length of time you want to store your logs, allowing you to meet specific compliance and audit requirements with ease. Other providers require archiving or hot and cold storage, making it difficult to query older logs. Log Explorer is built on top of our R2 storage tier, so historical logs can be queried as easily as current logs. 

How we built Log Explorer to run at Cloudflare scale

With Log Explorer, we have built a scalable log storage platform on top of Cloudflare R2 that lets you efficiently search your Cloudflare logs using familiar SQL queries. In this section, we’ll look into how we did this and how we solved some technical challenges along the way.

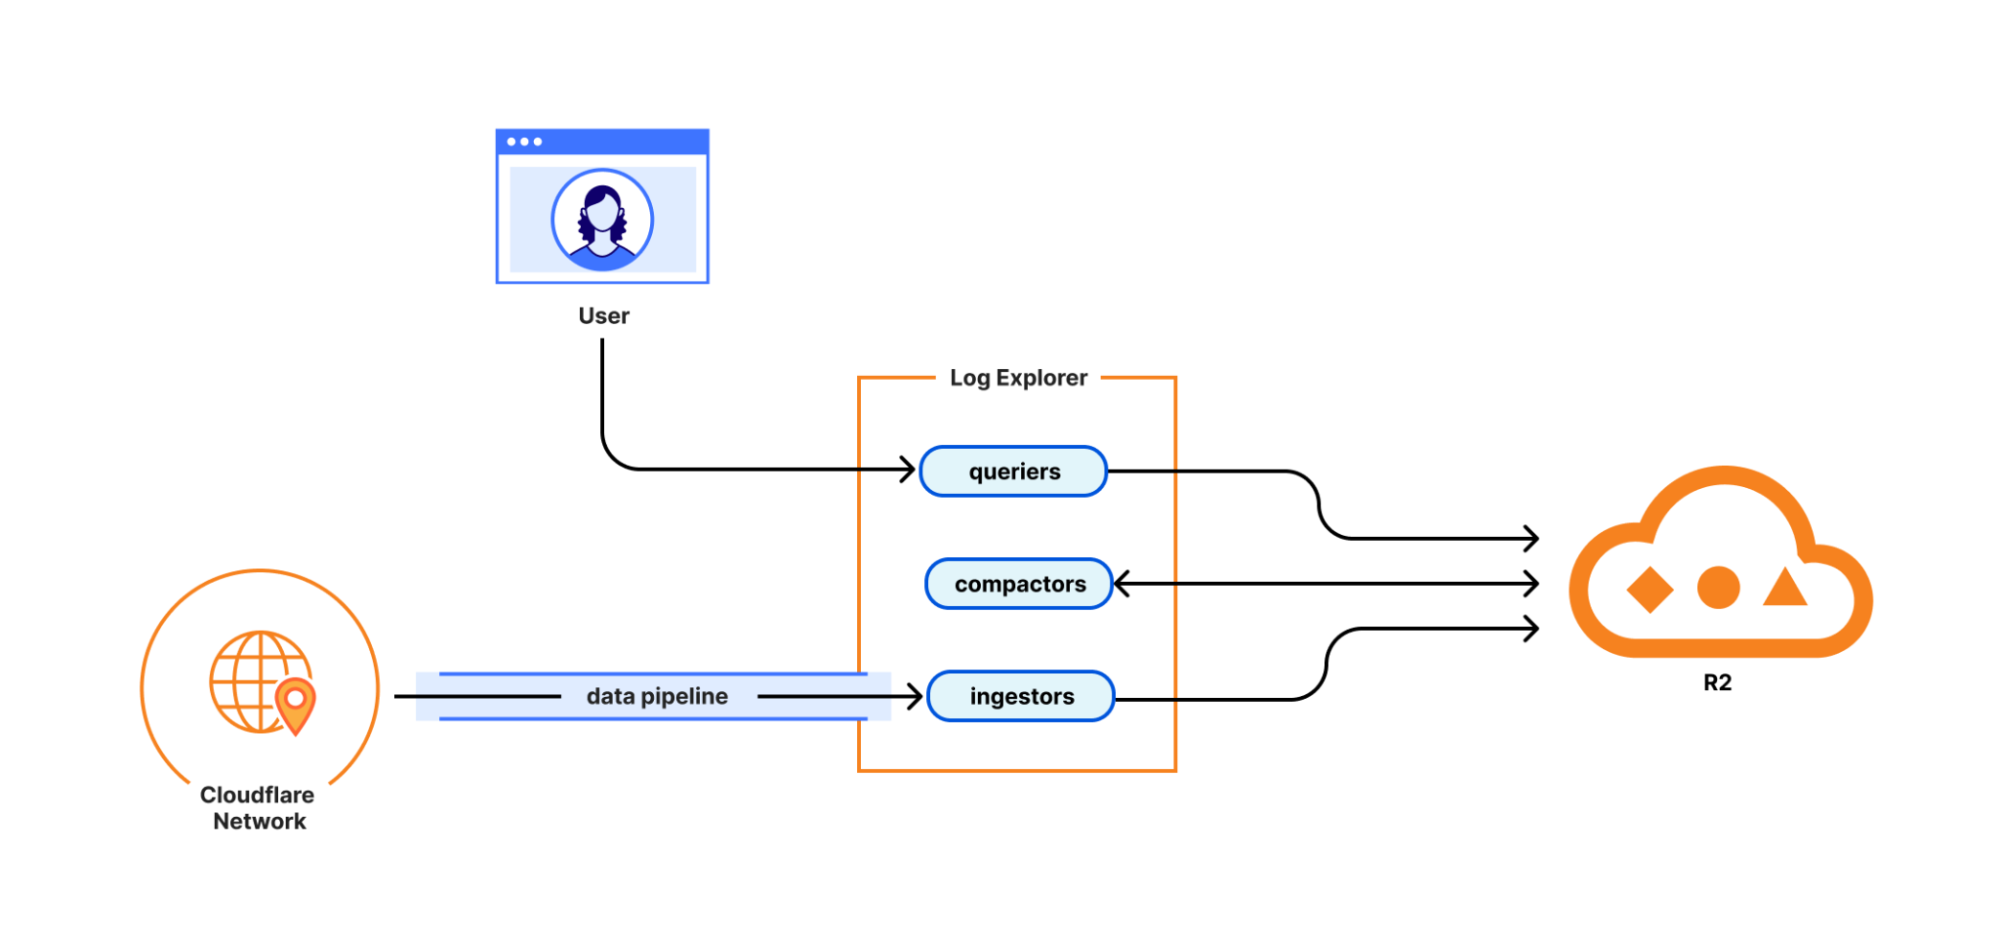
Log Explorer consists of three components: ingestors, compactors, and queriers. Ingestors are responsible for writing logs from Cloudflare’s data pipeline to R2. Compactors optimize storage files, so they can be queried more efficiently. Queriers execute SQL queries from users by fetching, transforming, and aggregating matching logs from R2.


During ingestion, Log Explorer writes each batch of log records to a Parquet file in R2. Apache Parquet is an open-source columnar storage file format, and it was an obvious choice for us: it’s optimized for efficient data storage and retrieval, such as by embedding metadata like the minimum and maximum values of each column across the file which enables the queriers to quickly locate the data needed to serve the query.

Log Explorer stores logs on a per-customer level, just like Cloudflare D1, so that your data isn’t mixed with that of other customers. In Q3 2025, per-customer logs will allow you the flexibility to create your own retention policies and decide in which regions you want to store your data.

But how does Log Explorer find those Parquet files when you query your logs? Log Explorer leverages the Delta Lake open table format to provide a database table abstraction atop R2 object storage. A table in Delta Lake pairs data files in Parquet format with a transaction log. The transaction log registers every addition, removal, or modification of a data file for the table – it’s stored right next to the data files in R2.

Given a SQL query for a particular log dataset such as HTTP Requests or Gateway DNS, Log Explorer first has to load the transaction log of the corresponding Delta table from R2. Transaction logs are checkpointed periodically to avoid having to read the entire table history every time a user queries their logs.

Besides listing Parquet files for a table, the transaction log also includes per-column min/max statistics for each Parquet file. This has the benefit that Log Explorer only needs to fetch files from R2 that can possibly satisfy a user query. Finally, queriers use the min/max statistics embedded in each Parquet file to decide which row groups to fetch from the file.

Log Explorer processes SQL queries using Apache DataFusion, a fast, extensible query engine written in Rust, and delta-rs, a community-driven Rust implementation of the Delta Lake protocol. While standing on the shoulders of giants, our team had to solve some unique problems to provide log search at Cloudflare scale.

Log Explorer ingests logs from across Cloudflare’s vast global network, spanning more than 330 cities in over 125 countries. If Log Explorer were to write logs from our servers straight to R2, its storage would quickly fragment into a myriad of small files, rendering log queries prohibitively expensive.

Log Explorer’s strategy to avoid this fragmentation is threefold. First, it leverages Cloudflare’s data pipeline, which collects and batches logs from the edge, ultimately buffering each stream of logs in an internal system named Buftee. Second, log batches ingested from Buftee aren’t immediately committed to the transaction log; rather, Log Explorer stages commits for multiple batches in an intermediate area and “squashes” these commits before they’re written to the transaction log. Third, once log batches have been committed, a process called compaction merges them into larger files in the background.

While the open-source implementation of Delta Lake provides compaction out of the box, we soon encountered an issue when using it for our workloads. Stock compaction merges data files to a desired target size S by sorting the files in reverse order of their size and greedily filling bins of size S with them. By merging logs irrespective of their timestamps, this process distributed ingested batches randomly across merged files, destroying data locality. Despite compaction, a user querying for a specific time frame would still end up fetching hundreds or thousands of files from R2.

For this reason, we wrote a custom compaction algorithm that merges ingested batches in order of their minimum log timestamp, leveraging the min/max statistics mentioned previously. This algorithm reduced the number of overlaps between merged files by two orders of magnitude. As a result, we saw a significant improvement in query performance, with some large queries that had previously taken over a minute completing in just a few seconds.

Follow along for more updates

We’re just getting started! We’re actively working on even more powerful features to further enhance your experience with Log Explorer. Subscribe to the blog and keep an eye out for more updates in our Change Log to our observability and forensics offering soon.

Get access to Log Explorer

To get access to Log Explorer, reach out for a consultation or contact your account manager. Additionally, you can read more in our Developer Documentation.

Connect any React application to an MCP server in three lines of code

Post Syndicated from Dina Kozlov original https://blog.cloudflare.com/connect-any-react-application-to-an-mcp-server-in-three-lines-of-code/

You can deploy a remote Model Context Protocol (MCP) server on Cloudflare in just one-click. Don’t believe us? Click the button below.

This will get you started with a remote MCP server that supports the latest MCP standards and is the reason why thousands of remote MCP servers have been deployed on Cloudflare, including ones from companies like Atlassian, Linear, PayPal, and more. 

But deploying servers is only half of the equation — we also wanted to make it just as easy to build and deploy remote MCP clients that can connect to these servers to enable new AI-powered service integrations. That’s why we built use-mcp, a React library for connecting to remote MCP servers, and we’re excited to contribute it to the MCP ecosystem to enable more developers to build remote MCP clients.

Today, we’re open-sourcing two tools that make it easy to build and deploy MCP clients:

  1. use-mcp — A React library that connects to any remote MCP server in just 3 lines of code, with transport, authentication, and session management automatically handled. We’re excited to contribute this library to the MCP ecosystem to enable more developers to build remote MCP clients. 

  2. The AI Playground — Cloudflare’s AI chat interface platform that uses a number of LLM models to interact with remote MCP servers, with support for the latest MCP standard, which you can now deploy yourself. 

Whether you’re building an AI-powered chat bot, a support agent, or an internal company interface, you can leverage these tools to connect your AI agents and applications to external services via MCP. 

Ready to get started? Click on the button below to deploy your own instance of Cloudflare’s AI Playground to see it in action.

use-mcp: a React library for building remote MCP clients

use-mcp is a React library that abstracts away all the complexity of building MCP clients. Add the useMCP() hook into any React application to connect to remote MCP servers that users can interact with. 

Here’s all the code you need to add to connect to a remote MCP server: 

mport { useMcp } from 'use-mcp/react'
function MyComponent() {
  const { state, tools, callTool } = useMcp({
    url: 'https://mcp-server.example.com'
  })
  return <div>Your actual UI code</div>
}

Just specify the URL, and you’re instantly connected. 

Behind the scenes, use-mcp handles the transport protocols (both Streamable HTTP and Server-Sent Events), authentication flows, and session management. It also includes a number of features to help you build reliable, scalable, and production-ready MCP clients. 

Connection management 

Network reliability shouldn’t impact user experience. use-mcp manages connection retries and reconnections with a backoff schedule to ensure your client can recover the connection during a network issue and continue where it left off. The hook exposes real-time connection states (“connecting”, “ready”, “failed”), allowing you to build responsive UIs that keep users informed without requiring you to write any custom connection handling logic. 

const { state } = useMcp({ url: 'https://mcp-server.example.com' })

if (state === 'connecting') {
  return <div>Establishing connection...</div>
}
if (state === 'ready') {
  return <div>Connected and ready!</div>
}
if (state === 'failed') {
  return <div>Connection failed</div>
}

Authentication & authorization

Many MCP servers require some form of authentication in order to make tool calls. use-mcp supports OAuth 2.1 and handles the entire OAuth flow.  It redirects users to the login page, allows them to grant access, securely stores the access token returned by the OAuth provider, and uses it for all subsequent requests to the server. The library also provides methods for users to revoke access and clear stored credentials. This gives you a complete authentication system that allows you to securely connect to remote MCP servers, without writing any of the logic. 

const { clearStorage } = useMcp({ url: 'https://mcp-server.example.com' })

// Revoke access and clear stored credentials
const handleLogout = () => {
  clearStorage() // Removes all stored tokens, client info, and auth state
}

Dynamic tool discovery

When you connect to an MCP server, use-mcp fetches the tools it exposes. If the server adds new capabilities, your app will see them without any code changes. Each tool provides type-safe metadata about its required inputs and functionality, so your client can automatically validate user input and make the right tool calls.

Debugging & monitoring capabilities

To help you troubleshoot MCP integrations, use-mcp exposes a log array containing structured messages at debug, info, warn, and error levels, with timestamps for each one. You can enable detailed logging with the debug option to track tool calls, authentication flows, connection state changes, and errors. This real-time visibility makes it easier to diagnose issues during development and production. 

Future-proofed & backwards compatible

MCP is evolving rapidly, with recent updates to transport mechanisms and upcoming changes to authorization. use-mcp supports both Server-Sent Events (SSE) and the newer Streamable HTTP transport, automatically detecting and upgrading to newer protocols, when supported by the MCP server. 

As the MCP specification continues to evolve, we’ll keep the library updated with the latest standards, while maintaining backwards compatibility. We are also excited to contribute use-mcp to the MCP project, so it can grow with help from the wider community.

MCP Inspector, built with use-mcp

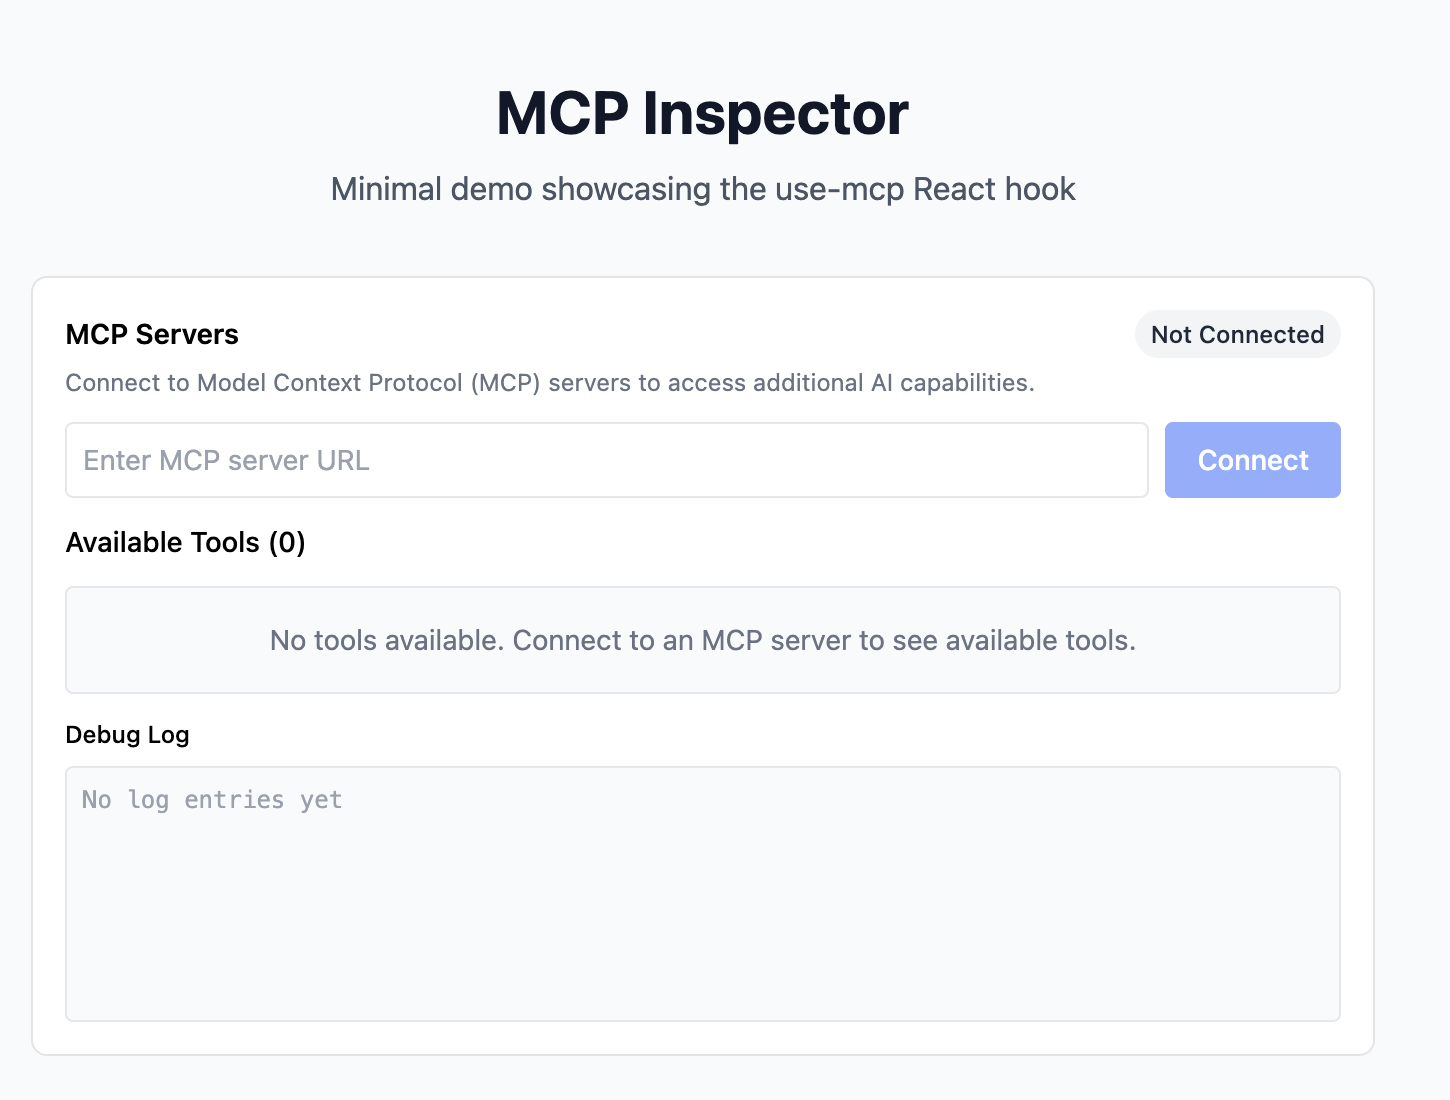
In use-mcp’s examples directory, you’ll see a minimal MCP Inspector that was built with the use-mcp hook. . Enter any MCP server URL to test connections, see available tools, and monitor interactions through the debug logs. It’s a great starting point for building your own MCP clients or something you can use to debug connections to your MCP server. 


Open-sourcing the AI Playground 

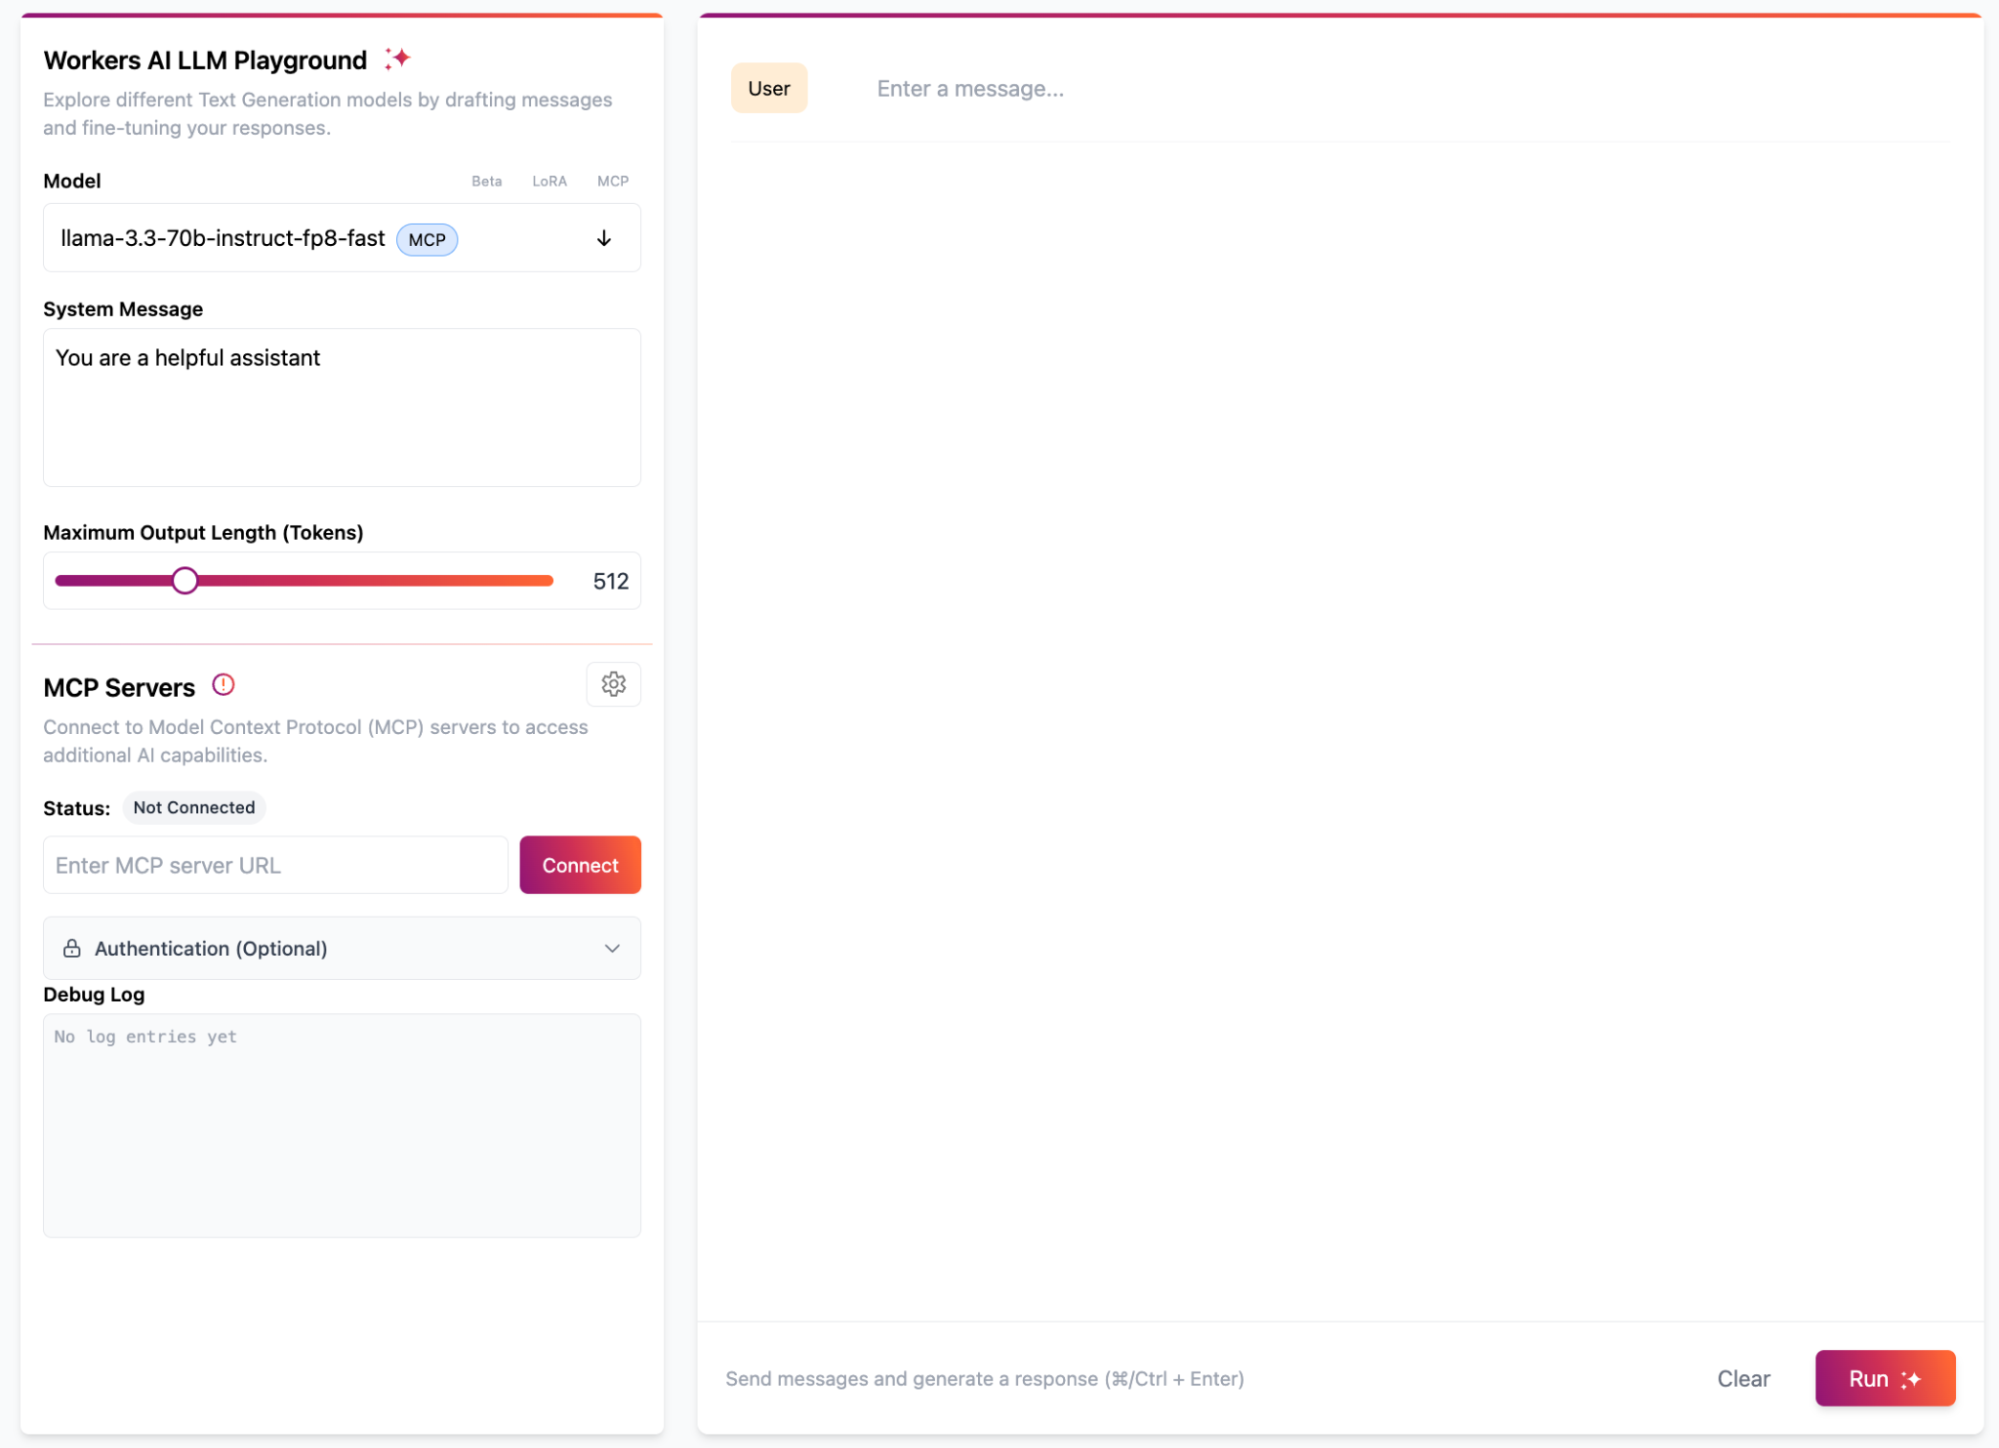
We initially built the AI Playground to give users a chat interface for testing different AI models supported by Workers AI. We then added MCP support, so it could be used as a remote MCP client to connect to and test MCP servers. Today, we’re open-sourcing the playground, giving you the complete chat interface with the MCP client built in, so you can deploy it yourself and customize it to fit your needs. 

The playground comes with built-in support for the latest MCP standards, including both Streamable HTTP and Server-Sent Events transport methods, OAuth authentication flows that allow users to sign-in and grant permissions, as well as support for bearer token authentication for direct MCP server connections.


How the AI Playground works

The AI Playground is built on Workers AI, giving you access to a full catalog of large language models (LLMs) running on Cloudflare’s network, combined with the Agents SDK and use-mcp library for MCP server connections.

The AI Playground uses the use-mcp library to manage connections to remote MCP servers. When the playground starts up, it initializes the MCP connection system with const{tools: mcpTools} = useMcp(), which provides access to all tools from connected servers. At first, this list is empty because it’s not connected to any MCP servers, but once a connection to a remote MCP server is established, the tools are automatically discovered and populated into the list. 

Once connected, the playground immediately has access to any tools that the MCP server exposes. The use-mcp library handles all the protocol communication and tool discovery, and maintains the connection state. If the MCP server requires authentication, the playground handles OAuth flows through a dedicated callback page that uses onMcpAuthorization from use-mcp to complete the authentication process.

When a user sends a chat message, the playground takes the mcpTools from the use-mcp hook and passes them directly to Workers AI, enabling the model to understand what capabilities are available and invoke them as needed. 

const stream = useChat({
  api: "/api/inference",
  body: {
    model: params.model,
    tools: mcpTools, // Tools from connected MCP servers
    max_tokens: params.max_tokens,
    system_message: params.system_message,
  },
})

Debugging and monitoring

To monitor and debug connections to MCP servers, we’ve added a Debug Log interface to the playground. This displays real-time information about the MCP server connections, including connection status, authentication state, and any connection errors. 

During the chat interactions, the debug interface will show the raw message exchanged between the playground and the MCP server, including the tool invocation and its result. This allows you to monitor the JSON payload being sent to the MCP server, the raw response returned, and track whether the tool call succeeded or failed. This is especially helpful for anyone building remote MCP servers, as it allows you to see how your tools are behaving when integrated with different language models. 

Contributing to the MCP ecosystem

One of the reasons why MCP has evolved so quickly is that it’s an open source project, powered by the community. We’re excited to contribute the use-mcp library to the MCP ecosystem to enable more developers to build remote MCP clients. 

If you’re looking for examples of MCP clients or MCP servers to get started with, check out the Cloudflare AI GitHub repository for working examples you can deploy and modify. This includes the complete AI Playground source code, a number of remote MCP servers that use different authentication & authorization providers, and the MCP Inspector. 

We’re also building the Cloudflare MCP servers in public and welcome contributions to help make them better. 

Whether you’re building your first MCP server, integrating MCP into an existing application, or contributing to the broader ecosystem, we’d love to hear from you. If you have any questions, feedback, or ideas for collaboration, you can reach us via email at [email protected].


New AMD Ryzen Threadripper 9000 Series and AMD Radeon AI Pro R9700 Series Details

Post Syndicated from Cliff Robinson original https://www.servethehome.com/new-amd-ryzen-threadripper-9000-series-and-amd-radeon-ai-pro-r9700-series-details/

AMD has new details on the AMD Ryzen Threadripper 9000 series of workstation CPUs and the AMD Radeon AI Pro R9700 32GB workstation GPU

The post New AMD Ryzen Threadripper 9000 Series and AMD Radeon AI Pro R9700 Series Details appeared first on ServeTheHome.

[$] A parallel path for GPU restore in CRIU

Post Syndicated from daroc original https://lwn.net/Articles/1024747/

The fundamental concept of checkpoint/restore is elegant: capture a
process’s state and resurrect it later, perhaps elsewhere. Checkpointing
meticulously records a process’s memory, open files, CPU state, and more into a
snapshot. Restoration then reconstructs the process from this state. This
established technique faces new challenges with GPU-accelerated applications,
where low-latency restoration is crucial for
fault
tolerance
, live migration, and
fast startups. Recently, the restore process for AMD GPUs has been redesigned to
eliminate substantial bottlenecks.

Hyperscale Doesn’t Mean Hyper-Resilient

Post Syndicated from David Johnson original https://www.backblaze.com/blog/hyperscale-doesnt-mean-hyper-resilient/

A decorative image showing clouds connected by digital lines.

Last week, a misconfiguration in Google Cloud’s API infrastructure led to a major global outage. Not long before that, IBM Cloud suffered its second significant disruption in a matter of weeks. The incidents impacted everything from enterprise infrastructure to consumer-facing apps—Gmail, Spotify, Cloudflare, and countless internal systems built on top of these platforms.

Understandably, much of the coverage has focused on what went wrong. But the more important question might be: Why does something like this ripple so far and wide in a system supposedly built for resilience?

Single points of failure in a multi-service world

One might assume that as cloud providers scale, their reliability scales with them. However, these outages reveal a critical distinction: the difference between data-layer resilience and control-plane fragility.

The problem is, that robust data layer can be rendered useless if the “front door” is locked. Hyperscale cloud platforms have grown so interdependent and complex that a fault in one layer can bring vast swaths of unrelated services to a halt. This is the risk of vertical integration: When one vendor provides compute, storage, networking, and identity, a simple bug or misconfiguration can cascade through thousands of applications, not because the applications are fragile, but because they’ve all tied themselves to the same operational backbone. 

Redundancy, or the illusion of it?

In theory, cloud architecture encourages redundancy. But in practice, many companies—even those using multi-cloud strategies—tend to consolidate key services like authentication and orchestration with a single vendor. When that vendor’s services go down, it doesn’t matter that your data is replicated across three availability zones in the same data center. If you can’t log in to access it, your redundancy becomes purely theoretical.

After last week’s outages, some companies may re-evaluate their cloud strategy—but it’s not as easy as flipping a switch. True diversification is complex, requiring time, engineering resources, and a cultural shift toward designing for failure.

The reality: Fewer assumptions, more contingencies

The knee-jerk reaction to events like these is often to demand better SLAs, more transparency, or faster recovery times. Those are valid asks. But they might miss the deeper lesson: Assumptions about uptime and “X-nines” reliability are only helpful until the moment they aren’t. What users need are not just better guarantees, but clearer paths to self-determination when things break.

That might look like:

  • Designing for graceful degradation. What can your service do when its cloud provider is partially offline?
  • Reconsidering dependencies. Are you tying core logic to a provider’s proprietary APIs, or abstracting where possible?
  • Asking harder questions during vendor selection. Not just, “Can it scale?” but “What happens when it fails?”

Case study: Sardius Media bakes in redundancy

Sardius Media, a global video platform, built cloud redundancy into its DNA. Every piece of media is replicated across multiple S3 compatible storage providers—including Backblaze B2—using a proprietary “race” mechanism that always delivers the fastest, most reliable storage experience for end users. This architecture keeps files available, resilient, and protected, even if one provider has an outage.

  • No single point of failure: Content lives across multiple clouds
  • Best performance: Requests race to the fastest provider in real time
  • Durability, affordability, and global reach—Backblaze B2 wins the race up to 80% of the time globally
  • Sardius Media’s strategy proves that open, multi-provider storage isn’t just theory—it’s operational resilience in action.

What does that mean for you?

The answer isn’t to abandon the cloud, but to get smarter about how you use it. This means architecting systems that don’t just have data redundancy, but true operational independence.

Maybe that means replicating data to providers who specialize rather than consolidate. Or maybe it just means revisiting architectures that have become too reliant on invisible scaffolding.

What’s clear is this: reliability isn’t a feature you buy from the cloud. It’s a design philosophy that must be shared.

The post Hyperscale Doesn’t Mean Hyper-Resilient appeared first on Backblaze Blog | Cloud Storage & Cloud Backup

AWS re:Inforce roundup 2025: top announcements

Post Syndicated from AWS News Blog Team original https://aws.amazon.com/blogs/aws/aws-reinforce-roundup-2025-top-announcements/

At AWS re:Inforce 2025 (June 16-18, Philadelphia), AWS Vice President and Chief Information Security Officer Amy Herzog delivered the keynote address, announcing new security innovations. Throughout the event, AWS announced additional security capabilities focused on simplifying security at scale and enabling organizations to build more resilient applications in the cloud. Below is a comprehensive roundup of the major security launches and updates announced at this year’s conference.

Verify internal access to critical AWS resources with new IAM Access Analyzer capabilities
A new capability in AWS Identity and Access Management Access Analyzer helps security teams verify which principals within their AWS organization have access to critical resources like S3 buckets, DynamoDB tables, and RDS snapshots by using automated reasoning to evaluate multiple policies and provide findings through a unified dashboard.

AWS IAM now enforces MFA for root users across all account types
The new Multi-Factor Authentication enforcement prevents over 99% of password-related attacks. You can use a range of supported IAM MFA methods, including FIDO-certified security keys to harden access to your AWS accounts. AWS supports FIDO2 passkeys for a user-friendly MFA implementation and allows you to register up to 8 MFA devices per root and IAM user.

Improve your security posture using Amazon threat intelligence on AWS Network Firewall
This new Network Firewall managed rule group offers protection against active threats relevant to workloads in AWS. The feature uses the Amazon threat intelligence system MadPot to continuously track attack infrastructure, including malware hosting URLs, botnet command and control servers, and crypto mining pools, identifying indicators of compromise (IOCs) for active threats.

AWS Certificate Manager introduces exportable public SSL/TLS certificates to use anywhere
You can now use AWS Certificate Manager to issue exportable public certificates for your AWS, hybrid, or multicloud workloads that require secure TLS traffic termination.

AWS WAF simplified console experience
The new AWS WAF console experience reduces security configuration steps by up to 80% through pre-configured protection packs. Security teams can quickly implement comprehensive protection for specific application types, with consolidated security metrics and customizable controls through an intuitive interface.

Amazon CloudFront simplifies web application delivery and security with new user-friendly interface
Try the simplified console experience with Amazon CloudFront to accelerate and secure web applications within a few clicks by automating TLS certificate provisioning, DNS configuration, and security settings through an integrated interface with AWS WAF’s enhanced Rule Packs.

New AWS Shield feature discovers network security issues before they can be exploited (Preview)
Shield network security posture management automatically discovers and analyzes network resources across AWS accounts, prioritizes security risks based on AWS best practices, and provides actionable remediation recommendations to protect applications against threats like SQL injections and DDoS attacks.

Unify your security with the new AWS Security Hub for risk prioritization and response at scale (Preview)
AWS Security Hub has been enhanced to transform security signals into actionable insights, helping security teams prioritize and respond to critical issues at scale. This unified solution provides comprehensive visibility across your cloud environment while reducing the complexity of managing multiple security tools.

Amazon GuardDuty expands Extended Threat Detection coverage to Amazon EKS clusters
Amazon GuardDuty Extended Threat Detection now supports Amazon EKS clusters, helping you detect sophisticated multistage attacks by correlating security signals across Kubernetes audit logs, runtime behaviors, and AWS API activities. This enhancement automatically identifies critical attack sequences that might otherwise go unnoticed, enabling faster response to threats.

New categories for the AWS MSSP Competency
The AWS MSSP Competency (previously AWS Level 1 MSSP Competency) now includes new categories covering infrastructure security, workload security, application security, data protection, identity and access management, incident response, and cyber recovery. Partners provide 24/7 monitoring and incident response through dedicated Security Operations Centers.

Secure your Express application APIs in minutes with Amazon Verified Permissions
Amazon Verified Permissions announced the release of the verified-permissions-express-toolkit, an open-source package that allows developers to implement authorization for Express web application APIs in minutes using Amazon Verified Permissions.

Beyond compute: Shifting vulnerability detection left with Amazon Inspector code security
Amazon Inspector code security capabilities are now generally available, helping you secure applications before production by rapidly identifying and prioritizing security vulnerabilities and misconfigurations across application source code, dependencies, and infrastructure as code (IaC).

AWS Backup adds new Multi-party approval for logically air-gapped vaults
Multi-party approval for AWS Backup logically air-gapped vaults enables you to recover your backup data even when your AWS account is compromised, by leveraging authorization from a designated approval team of trusted individuals who can enable vault sharing with a recovery account.

[$] Enhancing screen-reader functionality in modern GNOME

Post Syndicated from jzb original https://lwn.net/Articles/1025127/

Accessibility features and the work that goes into developing those features
often tend to be overlooked and are poorly understood by all but the people who actually
depend on such features. At Fedora’s annual developer conference, Flock, Lukáš Tyrychtr sought to
improve understanding and raise awareness about accessibility with his session on accessibility
barriers and screen-reader functionality in GNOME
. His talk provided rare insight
into the world of using and developing open-source software for visually-impaired
users—including landing important accessibility improvements in
the latest GNOME release.

Amazon GuardDuty expands Extended Threat Detection coverage to Amazon EKS clusters

Post Syndicated from Esra Kayabali original https://aws.amazon.com/blogs/aws/amazon-guardduty-expands-extended-threat-detection-coverage-to-amazon-eks-clusters/

Today, I’m happy to announce Amazon GuardDuty Extended Threat Detection with expanded coverage for Amazon Elastic Kubernetes Service (Amazon EKS), building upon the capabilities we introduced in our AWS re:Invent 2024 announcement of Amazon GuardDuty Extended Threat Detection: AI/ML attack sequence identification for enhanced cloud security.

Security teams managing Kubernetes workloads often struggle to detect sophisticated multistage attacks that target containerized applications. These attacks can involve container exploitation, privilege escalation, and unauthorized movement within Amazon EKS clusters. Traditional monitoring approaches might detect individual suspicious events, but often miss the broader attack pattern that spans across these different data sources and time periods.

GuardDuty Extended Threat Detection introduces a new critical severity finding type, which automatically correlates security signals across Amazon EKS audit logs, runtime behaviors of processes associated with EKS clusters, malware execution in EKS clusters, and AWS API activity to identify sophisticated attack patterns that might otherwise go unnoticed. For example, GuardDuty can now detect attack sequences in which a threat actor exploits a container application, obtains privileged service account tokens, and then uses these elevated privileges to access sensitive Kubernetes secrets or AWS resources.

This new capability uses GuardDuty correlation algorithms to observe and identify sequences of actions that indicate potential compromise. It evaluates findings across protection plans and other signal sources to identify common and emerging attack patterns. For each attack sequence detected, GuardDuty provides comprehensive details, including potentially impacted resources, timeline of events, actors involved, and indicators used to detect the sequence. The findings also map observed activities to MITRE ATT&CK® tactics and techniques and remediation recommendations based on AWS best practices, helping security teams understand the nature of the threat.

To enable Extended Threat Detection for EKS, you need at least one of these features enabled: EKS Protection or Runtime Monitoring. For maximum detection coverage, we recommend enabling both to enhance detection capabilities. EKS Protection monitors control plane activities through audit logs, and Runtime Monitoring observes behaviors within containers. Together, they create a complete view of your EKS clusters, enabling GuardDuty to detect complex attack patterns.

How it works
To use the new Amazon GuardDuty Extended Threat Detection for EKS clusters, go to the GuardDuty console to enable EKS Protection in your account. From the Region selector in the upper-right corner, select the Region where you want to enable EKS Protection. In the navigation pane, choose EKS Protection. On the EKS Protection page, review the current status and choose Enable. Select Confirm to save your selection.

After it’s enabled, GuardDuty immediately starts monitoring EKS audit logs from your EKS clusters without requiring any additional configuration. GuardDuty consumes these audit logs directly from the EKS control plane through an independent stream, which doesn’t affect any existing logging configurations. For multi-account environments, only the delegated GuardDuty administrator account can enable or disable EKS Protection for member accounts and configure auto-enable settings for new accounts joining the organization.

To enable Runtime Monitoring, choose Runtime Monitoring in the navigation pane. Under the Configuration tab, choose Enable to enable Runtime Monitoring for your account.

Now, you can view from the Summary dashboard the attack sequences and critical findings specifically related to Kubernetes cluster compromise. You can observe that GuardDuty identifies complex attack patterns in Kubernetes environments, such as credential compromise events and suspicious activities within EKS clusters. The visual representation of findings by severity, resource impact, and attack types gives you a holistic view of your Amazon EKS security posture. This means you can prioritize the most critical threats to your containerized workloads.

The Finding details page provides visibility into complex attack sequences targeting EKS clusters, helping you understand the full scope of potential compromises. GuardDuty correlates signals into a timeline, mapping observed behaviors to MITRE ATT&CK® tactics and techniques such as account manipulation, resource hijacking, and privilege escalation. This granular level of insight reveals exactly how attackers progress through your Amazon EKS environment. It identifies affected resources like EKS workloads and service accounts. The detailed breakdown of indicators, actors, and endpoints provides you with actionable context to understand attack patterns, determine impact, and prioritize remediation efforts. By consolidating these security insights into a cohesive view, you can quickly assess the severity of Amazon EKS security incidents, reduce investigation time, and implement targeted countermeasures to protect your containerized applications.

The Resources section of the Finding details page shows context about the specific assets affected during an attack sequence. This unified resource list provides you with visibility into the exact scope of the compromise—from the initial access to the targeted Kubernetes components. Because GuardDuty includes detailed attributes such as resource types, identifiers, creation dates, and namespace information, you can rapidly assess which components of your containerized infrastructure require immediate attention. This focused approach eliminates guesswork during incident response, so you can prioritize remediation efforts on the most critical affected resources and minimize the potential blast radius of Amazon EKS targeted attacks.

Now available
Amazon GuardDuty Extended Threat Detection with expanded coverage for Amazon EKS clusters provides comprehensive security monitoring across your Kubernetes environment. You can use this capability to detect sophisticated multistage attacks by correlating events across different data sources, identifying attack sequences that traditional monitoring might miss.

To start using this expanded coverage, enable EKS Protection in your GuardDuty settings and consider adding Runtime Monitoring for enhanced detection capabilities.

For more information about this new capability, refer to the Amazon GuardDuty Documentation.

— Esra

Secure your Express application APIs in minutes with Amazon Verified Permissions

Post Syndicated from Trevor Schiavone original https://aws.amazon.com/blogs/security/secure-your-express-application-apis-in-minutes-with-amazon-verified-permissions/

Today, Amazon Verified Permissions announced the release of @verifiedpermissions/authorization-clients-js, an open source package that developers can use to implement external fine-grained authorization for Express.js web application APIs in minutes when using Verified Permissions.

Express is a minimal and flexible Node.js web application framework that provides a robust set of features for web and mobile applications. By using this standardized integration with Verified Permissions, developers can externalize authorization using up to 90 percent less code compared to writing their own custom integrations, saving them time and effort and improving application security posture by reducing the amount of custom integration code.

Why externalize authorization?

Traditionally, developers implemented authorization within their application by embedding authorization logic directly into application code. This embedded authorization logic is designed to support a few permissions, but as applications evolve, there is often a need to incrementally update the embedded authorization logic to support more complex use cases, resulting in code that is complex and difficult to maintain. As code complexity increases, further evolving the security model and performing audits of permissions becomes more challenging, resulting in an application that becomes more difficult to maintain over its lifecycle.

By externalizing authorization, you can decouple authorization logic from your application. This yields multiple benefits including freeing up development teams to focus on application logic and simplifying software audits.

One approach to externalize authorization from your application code is to use Cedar. Cedar is an open source language and software development kit (SDK) for writing and enforcing authorization policies for your applications. You specify fine-grained permissions as Cedar policies, and your application authorizes access requests by calling the Cedar SDK. For example, if you’re building a pet store application, you can use the following Cedar policy to control that only a user with a jobLevel of employee can access the POST /pets API.


permit (
	principal,
	action in [Action::"POST /pets"], 
	resource
) when {
	principal.jobLevel = "employee"
};

One option for using Cedar is to self-manage the implementation; you can find an example for this pattern in another post: Secure your application APIs in 5 minutes with Cedar.

Self-managed Cedar provides the benefits of externalizing authorization but requires ongoing operational management. Organizations are responsible for Cedar version upgrades, applying security patches, managing policies, and auditing authorizations. Another option for using Cedar is to use Verified Permissions. Verified Permissions removes these operational requirements by providing a managed service for Cedar. Verified Permissions manages scaling, simplifies policy governance by supporting centralized policy management, and logs policy changes and authorization requests to simplify auditing.

This post describes how web application developers can use the new Express package to simplify the integration of Express web applications with Verified Permissions. The step-by-step guide uses a sample Pet Store application to show how access to APIs can be restricted based on user groups. You can find the sample Pet Store application in the verifiedpermissions repository on GitHub.

Pet Store application API overview

The Pet Store application is used to manage a pet store. The pet store is built using Express with Node.js and exposes the APIs in the following table.

API Description
GET /api/pets Returns the list of available pets
GET /api/pets/{petId} Returns the specified pet found
POST /api/pets Adds a pet to the pet store
PUT /api/pets/{petId} Updates an existing pet
DELETE /api/pets/{petId} Removes a pet from the pet store

This application doesn’t allow all users to access all APIs. Instead, it enforces the following rules:

  • Administrators: Full access to pets and management functions
  • Employees: Can view, create, and update pets
  • Customers: Can view pets and create new pets

Implementing authorization for the Pet Store APIs

Let’s walk through how to secure your application APIs using Verified Permissions and the new package for Express. The initial application, with no authorization, can be found in the start folder; use this to follow along with the post. You can find a completed version of the application in the finish folder.

When completed, you’ll have implemented the application architecture shown in Figure 1. A React frontend application that uses Amazon Cognito for authentication. The application then includes the identity token returned from Cognito as an authorization header to the Express backend APIs. The Express backend, using the new Verified Permissions authorization middleware package, calls Verified Permissions to authorize the user request.

Figure 1: Architecture of the Pet Store application

Figure 1: Architecture of the Pet Store application

Prerequisites

Before you get started, make sure you have the following prerequisites in place.

Step 1: Set up the AWS CLI

Some of the commands require the AWS Command Line Interface (AWS CLI). See Installing or updating to the latest version of the AWS CLI and Configuring settings for the AWS CLI.

Step 2: Set up an OpenID Connect identity provider and a database

The Pet Store application uses an OpenID Connect (OIDC) identity provider to manage users. For this example, you use an Amazon Cognito user pool called PetStoreUserPool with three users, one Admin, one Employee, and one Customer.

The application also uses a Amazon DynamoDB database to store the pets.

You can set up Amazon Cognito and DynamoDB in your AWS account by running the following command in the /start directory.

./scripts/setup-infrastructure.sh

The setup script will prompt you to set passwords for the three users (passwords must be at least 8 characters and require at least one number, one uppercase letter, and one lowercase letter).

Note the outputs of running this script because you’ll use them in step 5 of Integrate Verified Permissions.

Note: In your own applications, you can set up Amazon Cognito by following the instructions in Create a new application in the Amazon Cognito console, or you can bring your own OIDC identity provider.

Step 3 (optional): Run the application

Now that the infrastructure is set up, you can run the application. In two separate terminals, run the following commands in the /start directory:

./scripts/run-backend-dev.sh
./scripts/run-frontend-dev.sh

Test the application by creating some pets.

Integrate Verified Permissions

With the prerequisites in place, the next step is to integrate Verified Permissions. Verified Permissions can be integrated into an Express application in six steps:

  1. Create a Verified Permissions policy store
  2. Add the Cedar and Verified Permissions authorization middleware packages
  3. Create and deploy a Cedar schema
  4. Create and deploy Cedar policies
  5. Connect the Verified Permissions policy store to your OIDC identity provider
  6. Update the application code to call Verified Permissions to authorize API access

The Verified Permissions integration happens with the Express web application backend. All commands in the section should be run in the /start/backend directory.

Step 1: Create a Verified Permissions policy store 

  1. Create a policy store in Verified Permissions using the AWS CLI by running the following command
    aws verifiedpermissions create-policy-store  --validation-settings "mode=STRICT"
    

    Example successful command output:

    {
        "policyStoreId": "AAAAbbbbCCCCdddd",
        "arn": "arn:aws:verifiedpermissions::111122223333:policy-store/AAAAbbbbCCCCdddd",
        "createdDate": "2025-06-05T19:30:37.896119+00:00",
        "lastUpdatedDate": "2025-06-05T19:30:37.896119+00:00"
    }
    

  2. Save the policyStoreId value from the command output to use in step 3.

Step 2: Add the Cedar and Verified Permissions authorization middleware packages

  • Run the following command to add two new dependencies on @verifiedpermissions/authorization-clients and @cedar-policy/authorization-for-expressjs
    npm i --save @verifiedpermissions/authorization-clients
    npm i --save @cedar-policy/authorization-for-expressjs
    

Step 3: Create and deploy the Cedar schema 

A Cedar schema defines the authorization model for an application, including the entity types in the application and the actions users are allowed to take. You attach your schema to your Verified Permissions policy stores, and when policies are added or modified, the service automatically validates the policies against the schema.

The @cedar-policy/authorization-for-expressjs package can analyze the OpenAPI specification of your application and generate a Cedar schema. Specifically, the paths object in the OpenAPI schema is required in your specification.

If you don’t have an OpenAPI spec, you can generate one using the tool of your choice. There are several open source libraries that you can use to do this for Express; you might need to add some code to your application, generate the OpenAPI spec, and then remove the code. Alternatively, some generative AI based tools such as the Amazon Q Developer CLI are effective at generating OpenAPI spec documents. Regardless of how you generate the spec, be sure to validate the correct output from the tool.

For the sample application an OpenAPI spec document has been included and is named openapi.json.

  1. Run the following command to generate the Cedar schema.
    npx @cedar-policy/authorization-for-expressjs generate-schema --api-spec schemas/openapi.json --namespace PetStoreApp --mapping-type SimpleRest
    

    Example successful command output:

    Cedar schema successfully generated. Your schema files are named: v2.cedarschema.json, v4.cedarschema.json.
    v2.cedarschema.json is compatible with Cedar 2.x and 3.x
    v4.cedarschema.json is compatible with Cedar 4.x and required by the nodejs Cedar plugins.
    

  2. Next, format the Cedar schema for use with the AWS CLI. The specific format required is described in the documentation Amazon Verified Permissions policy store schema. To format the Cedar schema run the following command.
    ../scripts/prepare-cedar-schema.sh v2.cedarschema.json v2.cedarschema.forAVP.json
    

    Example successful command output:

    Cedar schema prepared successfully: v2.cedarschema.forAVP.json
    You can now use it with AWS CLI:
    

  3. After the schema is formatted, run the following command to upload the schema to Verified Permissions. Note that you need to replace <policy store id> with the actual policy store ID, which is provided as an output from the command in step 1.
    aws verifiedpermissions put-schema --definition file://v2.cedarschema.forAVP.json --policy-store-id <policy store id>
    

    Example successful command output:

    {
        "policyStoreId": "AAAAbbbbCCCCdddd",
        "namespaces": [
            "PetStoreApp"
        ],
        "createdDate": "2025-06-03T20:19:33.480528+00:00",
        "lastUpdatedDate": "2025-06-05T19:42:45.198325+00:00"
    }
    

Step 4: Create and deploy Cedar policies

If no policies are configured, Cedar denies authorization requests. The next step is to create policies that will allow specific user groups access to specific resources. The Express framework integration helps bootstrap this process by generating example policies based on the previously generated schema. You can then then customize these policies based on your use cases.

  1. Run the following command to generate sample Cedar policies.
    npx @cedar-policy/authorization-for-expressjs generate-policies --schema v2.cedarschema.json
    

    Example successful command output:

    Cedar policy successfully generated in policies/policy_1.cedar
    Cedar policy successfully generated in policies/policy_2.cedar
    

    Two sample policies are generated in the /policies directory: policy_1.cedar and policy_2.cedar.

    policy_1.cedar provides permissions for users in the admin user group to perform any action on any resource.

    
    // policy_1.cedar
    // Allows admin usergroup access to everything
    permit (
    	principal in PetStoreApp::UserGroup::"admin",
    	action,
    	resource
    );
    

    policy_2.cedar provides more access to the individual actions defined in the Cedar schema with a place holder for a specific group.

    // policy_2.cedar
    // Allows more granular user group control, change actions as needed
    permit (
        principal in PetStoreApp::UserGroup::"ENTER_THE_USER_GROUP_HERE",
        action in
            [PetStoreApp::Action::"GET /pets",
             PetStoreApp::Action::"POST /pets",
             PetStoreApp::Action::"GET /pets/{petId}",
             PetStoreApp::Action::"PUT /pets/{petId}",
             PetStoreApp::Action::"DELETE /pets/{petId}"],
        resource
    );
    

    Note that if you specified an operationId in the OpenAPI specification, the action names defined in the Cedar Schema will use that operationId instead of the default <HTTP Method> /<PATH> format. In this case, make sure that the naming of your actions in your Cedar policies matches the naming of your actions in your Cedar schema.

    For example, if you want to call your action AddPet instead of POST /pets, you could set the operationId in your OpenAPI specification to AddPet. The resulting action in the Cedar policy would be PetStoreApp::Action::"AddPet"

    Create a third policy file called policy_3.cedar and then replace the contents of each file with the following policies. Replace <userpoolId> in each policy with the Cognito User Pool Id copied earlier.

    Note: In a real use case, consider renaming your Cedar policy files based on their contents, for example, allow_customer_group.cedar.

    // Defines permitted administrator user group actions
    permit (
        principal in PetStoreApp::UserGroup::"<userPoolId>|administrator",
        action,
        resource
    );
    

    // Defines permitted employee user group actions
    permit (
        principal in PetStoreApp::UserGroup::"<userPoolId>|employee",
        action in
            [PetStoreApp::Action::"GET /pets",
             PetStoreApp::Action::"POST /pets",
             PetStoreApp::Action::"GET /pets/{petId}",
             PetStoreApp::Action::"PUT /pets/{petId}"],
        resource
    );
    

    // Defines permitted customer user group actions
    permit (
        principal in PetStoreApp::UserGroup::"<userPoolId>|customer",
        action in
            [PetStoreApp::Action::"GET /pets",
             PetStoreApp::Action::"POST /pets",
             PetStoreApp::Action::"GET /pets/{petId}"],
        resource
    );
    

  2. The policies need to be formatted so that they work with the AWS CLI for Verified Permissions. The specific format is described in the AWS CLI Verified Permissions documentation. Run the following command to format the policies.
    ../scripts/convert_cedar_policies.sh
    

    Example successful command output:

    Converting policies/policy_1.cedar to policies/json/policy_1.json
    Created policies/json/policy_1.json
    Converting policies/policy_2.cedar to policies/json/policy_2.json
    Created policies/json/policy_2.json
    Converting policies/policy_3.cedar to policies/json/policy_3.json
    Created policies/json/policy_3.json
    Conversion complete. JSON policy files are in ../policies/json/
    

    The formatted policies will be output to the backend/policies/json/ directory.

  3. After formatting the policies, run the following three commands, one for each policy, to upload them to Verified Permissions. The policy store ID is returned after completing step 2. Replace <policy store id> with the actual policy store ID.
    aws verifiedpermissions create-policy  --definition file://policies/json/policy_1.json --policy-store-id <policy store id>
    aws verifiedpermissions create-policy  --definition file://policies/json/policy_2.json --policy-store-id <policy store id>
    aws verifiedpermissions create-policy  --definition file://policies/json/policy_3.json --policy-store-id <policy store id>
    

    Example successful command output:

    {
        "policyStoreId": "AAAAbbbbCCCCdddd",
        "policyId": "8AmzZYMw6Ux5DGBoX7w24m",
        "policyType": "STATIC",
        "principal": {
            "entityType": "PetStoreApp::UserGroup",
            "entityId": "<userPoolId>|administrator"
        },
        "createdDate": "2025-06-05T19:46:45.848602+00:00",
        "lastUpdatedDate": "2025-06-05T19:46:45.848602+00:00",
        "effect": "Permit"
    }
    

Alternatively, you can also copy and paste Cedar policies into Verified Permissions in the AWS Management Console.

Step 5: Connect the Verified Permissions policy store to your OIDC identity provider

By default, the Verified Permissions authorizer middleware reads a JSON Web Token (JWT) provided within the authorizationheader of the API request to get user information. Verified Permissions can validate the token in addition to performing authorization policy evaluation.

  1. To do this, create an identity source in Verified Permissions policy store. To simplify formatting in the AWS CLI command, we’ve defined the identity source configuration in identity-source-configuration.txtReplace the <userPoolArn> and <clientId> parameters in the following code block based on the outputs of running the setup-infrastructure.sh script in Step 2 of the prerequisites.
    // identity-source-configuration.txt
    {
        "cognitoUserPoolConfiguration": {
            "userPoolArn": "<userPoolArn>",
            "clientIds":["<clientId>"] ,
            "groupConfiguration": {
                  "groupEntityType": "PetStoreApp::UserGroup"
            }
        }
    }
    

  2. After you update the file, run the following command to update the Verified Permissions policy store. Replace <policy store id> with the actual policy store ID.
    aws verifiedpermissions create-identity-source --configuration file://identity-source-configuration.txt --policy-store-id <policy store id> --principal-entity-type PetStoreApp::User
    

Example successful command output:

{
    "createdDate": "2025-06-05T20:02:53.992782+00:00",
    "identitySourceId": "DTLvwdiKfdPmk2RWzSVfu2",
    "lastUpdatedDate": "2025-06-05T20:02:53.992782+00:00",
    "policyStoreId": "AAAAbbbbCCCCdddd"
}

Step 6: Update the application code to call Verified Permissions to authorize API access 

You now need to update the application to use the @verifiedpermissions/authorization-clients and @cedar-policy/authorization-for-expressjs dependencies. This will allow the application to call Verified Permissions to authorize the API requests.

  1. Add the dependencies and define the CedarAuthorizerMiddleware and AVPAuthorizer in the application by adding the following block of code to line 13 (directly after the import statements) of backend/app.ts. Replace <policystoreId> in the following code block with your actual Verified Permissions policy store ID.
    const { ExpressAuthorizationMiddleware } = require('@cedar-policy/authorization-for-expressjs');
    
    const { AVPAuthorizationEngine } = require('@verifiedpermissions/authorization-clients');
    
    const avpAuthorizationEngine = new AVPAuthorizationEngine({
        policyStoreId: <policyStoreId>,
        callType: 'identityToken'
    });
    
    const expressAuthorization = new ExpressAuthorizationMiddleware({
        schema: {
            type: 'jsonString',
            schema: fs.readFileSync(path.join(__dirname, '../v4.cedarschema.json'), 'utf8'),
        },
        authorizationEngine: avpAuthorizationEngine,
        principalConfiguration: { type: 'identityToken' },
        skippedEndpoints: [],
        logger: {
            debug: (s: any) => console.log(s),
            log: (s: any) => console.log(s),
        }
    });
    

  2. Configure the Express application to use the authorization middleware that you just defined. To do this, add the following line of code to the end of the block of app.use(..) statements that begin after the comment // Configure security and performance middleware (approximately line 48 depending on how you pasted the previous block of code).
    app.use(expressAuthorization.middleware);
    

You’ve now successfully set up authorization in your application by creating a Verified Permissions policy store, writing Cedar policies to define your authorization, and integrating your application with Verified Permissions.

Validating API security

You can use the frontend web application to verify that authorization has been applied to the APIs. In two separate terminals run the following commands in the /start directory

./scripts/run-backend-dev.sh
./scripts/run-frontend-dev.sh

In a browser navigate to http://localhost:3001 and sign in with one of the Amazon Cognito users you created earlier. Validate that the permissions policies are working as expected:

  • Administrators: Can view, create, update, and delete pets.
  • Employees: Can view, create, and update pets.
  • Customers: Can view pets and create new pets.

In the terminal for the Express application, you can see log output that provides additional details about the authorization decisions. For example, following an unauthorized action the terminal outputs the following:

Authorization result: {"type":"deny"}

Conclusion

The new @verifiedpermissions/authorization-clients-js package allows Express developers to integrate their application with Verified Permissions to decouple authorization logic from code. By decoupling your authorization logic and integrating your application with the Verified Permissions, you can improve developer productivity and simplify permissions and access audits.

To support analyzing and auditing permissions when writing cedar policies the open source Cedar project also recently open sourced the Cedar Analysis CLI to help developers perform policy analysis on their policies. You can learn more about this new tool in Introducing Cedar Analysis: Open Source Tools for Verifying Authorization Policies.

The framework packages are open source and available on GitHub under the Apache 2.0 license, with distribution through NPM. To learn more, see Amazon Verified Permissions and Cedar.

If you have feedback about this post, submit comments in the Comments section below.

Trevor Schiavone

Trevor Schiavone

Trevor is a Senior Solutions Architect at AWS. He works with customers to build secure, scalable, and innovative architectures. When not at work he’s usually out running, cycling, or travelling to new countries.

Rickard Lofstrom

Rickard Löfström

Ricard guides enterprises in building secure cloud environments as a Specialist Solution Architect in the AWS EMEA Security & Compliance team. He advises customers on implementing AWS security services, focusing on identity management, data protection, and infrastructure security controls. Rickard translates complex security requirements into technical solutions that enable organizations to meet their security objectives while maintaining operational efficiency.

The collective thoughts of the interwebz