At Computex 2026 Minisforum was showing off their upcoming S5 NAS, a mid-range all-flash NAS. With 5 M.2 SSD slots and 10GbE networking, the fanless NAS punches up
Upgrading Apache Spark applications across major versions means tracking down breaking changes, manually debugging failures from log files, and running repeated test cycles. This process can stretch across weeks for complex code bases.
In this post, we walk through a hands-on PySpark migration from Spark 3.5 to Spark 4.0 on Amazon EMR Serverless, using the AWS Spark Upgrade Agent. You’ll see how the agent iteratively validates your application on a live Amazon EMR Serverless application, automatically diagnosing and resolving failures from Amazon CloudWatch logs until the job succeeds. By the end, you have a multi-pipeline PySpark application running on Spark 4.0 with four distinct breaking changes resolved. The fixes include configuration key removals, codec renames, and stricter charset validation, all driven through natural language interaction in the Integrated Development Environment (IDE).
This is part 2 of a three-part series on how the AWS Spark Upgrade Agent can automate and simplify Spark upgrades.
In Part 1, we introduced the agent’s architecture and capabilities. This post walks through a complete PySpark migration from Spark 3.5 to Spark 4.0 on Amazon EMR Serverless.
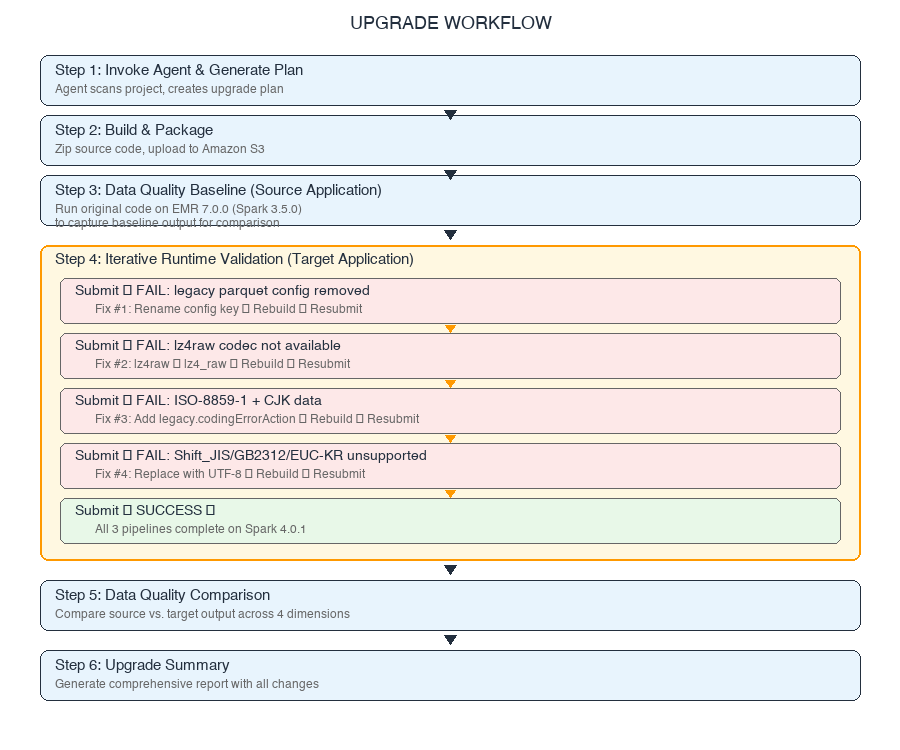
In the sections that follow, you will set up the prerequisites and infrastructure, explore the sample application, run the iterative validation workflow on EMR Serverless, review data quality results, and generate a comprehensive upgrade summary.
Note: Because this upgrade is performed using the AWS Spark Upgrade Agent Model Context Protocol (MCP) server, an agentic artificial intelligence (AI) system, the agent might take different paths to reach the same successful outcome. The workflow demonstrated here represents one successful upgrade path. The key takeaway is the end-to-end workflow: generating an upgrade plan, iteratively validating on Amazon EMR Serverless, and producing a comprehensive upgrade summary.
1. Prerequisites and setup
This section covers the tools, infrastructure, and IDE configuration you need before starting the upgrade. To follow along, you need an AWS account with an AWS Identity and Access Management (AWS IAM) user or role that has permissions to deploy AWS CloudFormation stacks, create AWS IAM roles and policies, and create Amazon EMR Serverless applications. Intermediate knowledge of AWS Command Line Interface (AWS CLI), AWS CloudFormation, and Python is helpful.
1.1 Install Kiro CLI and local tools
In this post, we use Kiro CLI to demonstrate the upgrade workflow. You can use an MCP-compatible IDE or framework. Examples include VS Code with Cline, Cursor, Windsurf, and Claude Desktop, among others. To follow along with Kiro CLI, install it on your workstation. For more details on the installation and setup, refer to Setup for Upgrade Agent:
curl -fsSL https://cli.kiro.dev/install | bash
Run the following command and use your builder ID to log in:
kiro-cli login --use-device-flow
With the Kiro CLI installed and logged in, rather than installing the remaining tools manually, use Kiro CLI to set up and verify your prerequisites with the following prompt:
kiro-cli chat
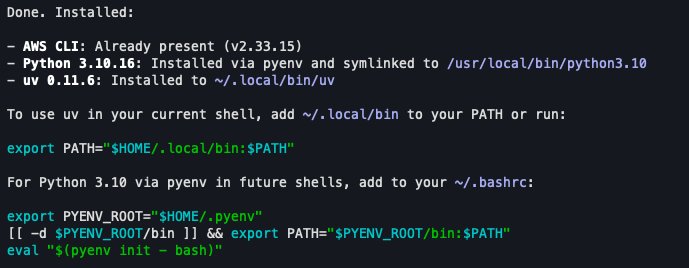
> Install AWS CLI, Python 3.10, and uv on my system if they are not already installed
Output of AWS CLI and local tools install step.
These tools are needed for the upgrade workflow:
AWS CLI: Configured with a profile that has permissions to assume the AWS Identity and Access Management (AWS IAM) role created following.
Python 3.10+: Required to match the EMR 8.0 runtime.
Two AWS CloudFormation stacks create the required resources: an AWS IAM role, an Amazon Simple Storage Service (Amazon S3) staging bucket, an Amazon EMR Serverless application (Spark 4.0.1), and its execution role.
Stack 1 – AWS IAM role and Amazon S3 staging bucket:
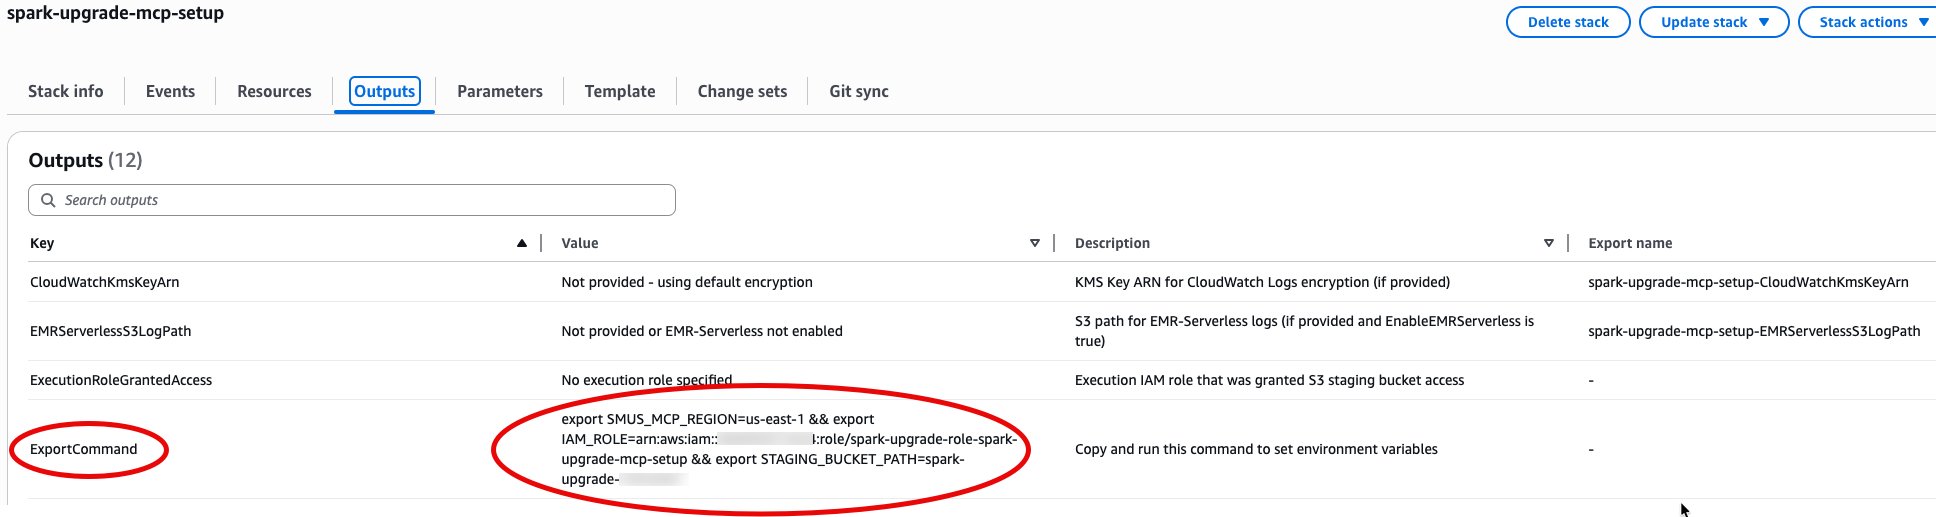
The spark-upgrade-mcp-setup template creates the AWS IAM role and Amazon S3 staging bucket required by the upgrade agent. Choose the Launch Stack button for your Region. For additional Regions, see the full region list.
After deployment, open the AWS CloudFormation Outputs tab, copy the ExportCommand value, and run it in your terminal. This sets SMUS_MCP_REGION, IAM_ROLE, and STAGING_BUCKET_PATH automatically.
aws configure set profile.spark-upgrade-profile.role_arn ${IAM_ROLE}
aws configure set profile.spark-upgrade-profile.source_profile default
aws configure set profile.spark-upgrade-profile.region ${SMUS_MCP_REGION}
This creates two Amazon EMR Serverless applications: a source (Spark 3.5.0) for data quality baseline and a target (Spark 4.0.1) for upgrade validation, with a shared execution role. Both applications auto-stop after 15 minutes of idle time, so there is no cost when not in use. To upgrade between different Spark versions, override SourceReleaseLabel and TargetReleaseLabel with your target Amazon EMR release labels.
After the stack completes deployment, note the outputs:
For other MCP clients, refer to your IDE’s MCP configuration documentation and use the same server parameters shown previously.
Verify the connection: Start Kiro CLI and confirm the spark-upgrade tools are loaded:
$ kiro-cli chat
...
spark-upgrade (MCP):
- generate_spark_upgrade_plan          * not trusted
- update_build_configuration           * not trusted
- fix_upgrade_failure                  * not trusted
- run_validation_job                   * not trusted
- check_job_status                     * not trusted
...
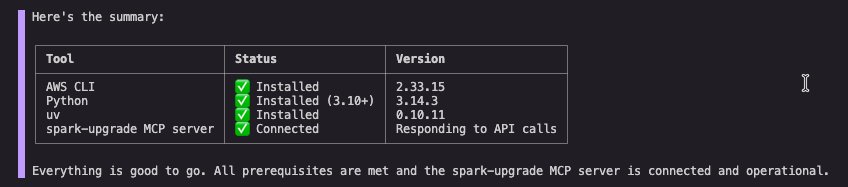
Tip: After Kiro CLI and the MCP server are configured, you can ask the agent to verify your setup. For example: “Check if I have AWS CLI, Python 3.10+, and uv installed, and confirm the spark-upgrade MCP server is connected.”
Output showing the status of each tool, AWS CLI, and MCP server.
Tip: Trust mode vs. confirm mode: When running the upgrade agent in Kiro CLI, you have two options:
Trust mode: Type t when prompted to approve a tool. The agent auto-approves subsequent uses of that tool without asking for confirmation. You can also use /tools trust-all to trust every tool at once for a fully autonomous experience.
Confirm mode: Type y for each individual tool invocation. This lets you review, verify, and approve every action before the agent runs it. If this is your first time using the agent, use confirm mode for full visibility.
2. Hands-on PySpark upgrade from Spark 3.5 to Spark 4.0
This section walks through the complete migration of a representative PySpark application from Amazon EMR Serverless 7.0.0 (Spark 3.5.0) to EMR Serverless with the emr-spark-8.0-preview release label (Spark 4.0.1), using the global_logistics_platform sample.
2.1 Sample project: global logistics platform
The sample application is a multi-domain PySpark data processing application with three pipelines:
Fleet management: Processes vehicle telemetry data (GPS tracking, fuel consumption, driver behavior scoring) using window functions, lag/lead operations, and statistical aggregations. Writes Parquet with lz4raw compression.
International shipping: Handles cross-border shipment documents with multi-language address standardization using character encoding functions (encode/decode with charsets like Shift_JIS, GB2312, EUC-KR), and processes carrier manifests with ISO-8859-1 encoding.
Historical compliance: Processes regulatory audit records spanning centuries (including pre-1582 Julian calendar dates), requiring legacy datetime rebasing for Parquet writes.
Before diving into the upgrade, here are the four specific breaking changes present in this code base that the agent discovers and resolves entirely through runtime validation:
#
Incompatibility
File(s)
1
Legacy Parquet configuration key removed:spark.sql.legacy.parquet.datetimeRebaseModeInWrite removed in Spark 4.0. Must use spark.sql.parquet.datetimeRebaseModeInWrite.
spark_config.py
2
Parquet compression codec rename:lz4raw codec renamed to lz4_raw in Spark 4.0.
telemetry_processor.py
3
Stricter charset encoding validation: Spark 4.0 tightened encode() behavior. Encoding CJK (Chinese, Japanese, Korean) characters to ISO-8859-1 now throws MALFORMED_CHARACTER_CODING. In Spark 3.x this silently replaced unmappable chars with ?. Restored via spark.sql.legacy.codingErrorAction.
spark_config.py
4
Character encoding restrictions:encode()/decode() in Spark 4.0 supports US-ASCII, ISO-8859-1, UTF-8, UTF-16BE, UTF-16LE, UTF-16, and UTF-32. Code uses Shift_JIS, GB2312, EUC-KR.
shipment_processor.py
The agent resolves each of these through iterative runtime validation on EMR Serverless: submitting the job, diagnosing failures from Amazon CloudWatch logs, applying fixes, and resubmitting until the job succeeds.
2.3 Step 1: Invoke the upgrade agent
Open the project in Kiro CLI and enter the following prompt:
Upgrade my Spark application in the current directory from EMR serverless version 7.0.0 to EMR serverless version 8.0.0.
Use Amazon EMR Serverless target app-id <YOUR-TARGET-APP-ID> and execution role
<YOUR-EXECUTION-ROLE-ARN> for validation.
Use source Amazon EMR Serverless app-id <YOUR-SOURCE-APP-ID> for data quality baseline.
Store artifacts at s3://${STAGING_BUCKET_PATH}/spark4-upgrade/python/
Enable data quality validation
Tip: The SourceApplicationId, TargetApplicationId, and ExecutionRoleArn are in the Outputs of the spark-emr-serverless-upgrade AWS CloudFormation stack you deployed in Section 1.2.
The agent invokes generate_spark_upgrade_plan, scans the project structure, identifies the Spark version mapping (EMR 7.0.0 → Spark 3.5.0, EMR 8.0.0 → Spark 4.0.1), and produces a structured upgrade plan with an Analysis ID for traceability.
The agent presents the plan and asks for confirmation. Type y to approve the tool invocation, or t to trust that tool for the rest of the session.
You have an option to save the plan as a local JSON file for future reference or to resume the upgrade at a later point, so go ahead and ask Kiro to save it locally. Provide the AWS CLI profile that you have configured on your system. Use the following prompt to provide these inputs:
Yes I would like to save the plan to a local file and use spark-upgrade-profile
2.4 Step 2: Build and package
The agent validates the Python project compiles successfully, then packages it for Amazon EMR Serverless deployment:
Runs py_compile on each .py file to verify syntax.
Creates src.zip containing the src/ directory (preserving the import structure used by from src.utils import ...).
Uploads src.zip, main.py, and sample input data to the Amazon S3 staging path.
# What the agent does behind the scenes:
zip -r src.zip src/
aws s3 cp main.py s3://<YOUR-BUCKET>/spark4-upgrade/python/<ANALYSIS-ID>/source/main.py
aws s3 cp src.zip s3://<YOUR-BUCKET>/spark4-upgrade/python/<ANALYSIS-ID>/source/src.zip
aws s3 cp data/sample/ s3://<YOUR-BUCKET>/spark4-upgrade/python/<ANALYSIS-ID>/input/ --recursive
No external dependencies (no requirements.txt), so no virtual environment is needed. If your project has external dependencies in a requirements.txt, the agent will package them into a virtual environment archive and include it in the EMR Serverless submission parameters.
2.5 Step 3: Data quality baseline on source application
Before migrating the code, the agent establishes a data quality baseline by running the original (pre-upgrade) code on the source Amazon EMR Serverless application (Spark 3.5.0 / EMR 7.0.0). This captures the expected output that the upgraded application must match.
The agent submits the job to the source application with data quality check enabled:
The agent monitors the source run via check_job_status until it completes successfully. This baseline output is stored for comparison after the target validation succeeds.
2.6 Step 4: Iterative runtime validation on target application
This is the core of the upgrade. The agent submits the unmodified application to the target Amazon EMR Serverless application (Spark 4.0.1), and every incompatibility is discovered, diagnosed, and fixed through runtime failures. The agent drives the entire fix cycle by submitting to EMR, reading errors from Amazon CloudWatch logs, applying fixes, rebuilding, and resubmitting.
The agent presents the proposed Amazon EMR Serverless job configuration for your review before each submission. Type y to approve.
The first submission fails immediately at SparkSession initialization:
org.apache.spark.sql.AnalysisException:
The SQL config 'spark.sql.legacy.parquet.datetimeRebaseModeInWrite' was removed
in the version 4.0.0. Use 'spark.sql.parquet.datetimeRebaseModeInWrite' instead.
The Historical Compliance pipeline configures spark.sql.legacy.parquet.datetimeRebaseModeInWrite for handling pre-1582 Julian calendar dates. Spark 4.0 removed the legacy. prefix from this configuration key.
The agent calls fix_upgrade_failure, which identifies the migration rule and recommends the fix:
File:src/utils/spark_config.py
# Before
.config("spark.sql.legacy.parquet.datetimeRebaseModeInWrite", "LEGACY")

# After
.config("spark.sql.parquet.datetimeRebaseModeInWrite", "LEGACY")
After applying the fix, the agent rebuilds src.zip, re-uploads to Amazon S3, and resubmits the job.
The resubmitted job fails with a new error, which confirms progress:
pyspark.errors.exceptions.captured.IllegalArgumentException:
[CODEC_NOT_AVAILABLE.WITH_AVAILABLE_CODECS_SUGGESTION]
The codec lz4raw is not available.
Available codecs are brotli, uncompressed, lzo, snappy, lz4_raw, none, zstd, lz4, gzip.
SQLSTATE: 56038
The Fleet Management pipeline’s telemetry_processor.py uses lz4raw as the Parquet compression codec. Spark 4.0 renamed this to lz4_raw (with an underscore).
org.apache.spark.SparkRuntimeException:
[MALFORMED_CHARACTER_CODING]
Invalid value found when performing `encode` with ISO-8859-1
SQLSTATE: 22000
The International Shipping pipeline’s process_carrier_manifests() method uses encode(..., 'ISO-8859-1') on data containing CJK (Chinese, Japanese, Korean) characters. Although ISO-8859-1 is in Spark 4.0’s supported charset list, it is a single-byte encoding that cannot represent CJK characters. In Spark 3.x, the Java charset encoder silently replaced unmappable characters with ?. Spark 4.0 tightened this behavior to throw MALFORMED_CHARACTER_CODING for unmappable characters.
The agent identifies the migration rule and adds a legacy compatibility configuration:
File:src/utils/spark_config.py
# Added to SparkSession builder
.config("spark.sql.legacy.codingErrorAction", "true")
This restores the Spark 3.x behavior where unmappable characters are silently replaced instead of throwing errors.
With the configuration added, the agent rebuilds and resubmits.
2.6.4 Fix 4: Character encoding restrictions (iteration 4)
The fourth submission fails with yet another encoding error:
org.apache.spark.SparkIllegalArgumentException:
[INVALID_PARAMETER_VALUE.CHARSET]
The value of parameter(s) `charset` in `encode` is invalid:
expects one of the iso-8859-1, us-ascii, utf-16, utf-16be, utf-16le, utf-32, utf-8,
but got Shift_JIS. SQLSTATE: 22023
The International Shipping pipeline’s standardize_addresses_with_charset() method uses Shift_JIS, GB2312, and EUC-KR charsets in encode()/decode() calls. Spark 4.0 restricts these functions to seven standard charsets. These regional charsets are not in the supported list.
The agent replaces the unsupported charsets with UTF-8:
The three pipelines (Fleet Management, International Shipping, and Historical Compliance) complete on EMR Serverless with the emr-spark-8.0-preview release label (Spark 4.0.1).
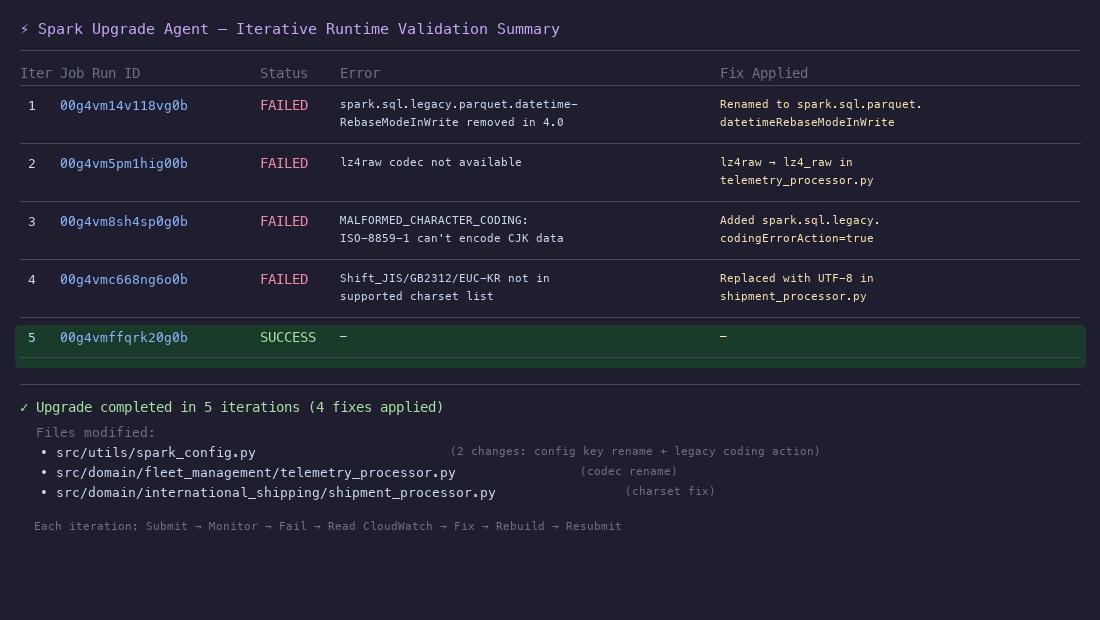
2.7 Summary of the iterative runtime validation
The runtime validation loop is the core value of the upgrade agent. Here’s the complete iteration history:
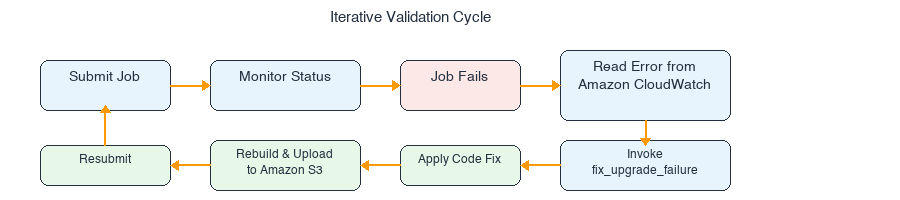
Each iteration follows the same cycle:
Failures that would normally require manual log analysis, root cause investigation, and code patching are resolved automatically by the agent in this workflow.
3. Data quality validation
With both the source baseline (Section 2.5) and the upgraded target run (Section 2.6) completed successfully, the agent performs data quality validation to verify the migration hasn’t changed your application’s output. This is the key advantage of including the source application in your upgrade prompt: the agent can compare outputs from both Spark versions side by side.
3.1 Data quality comparison
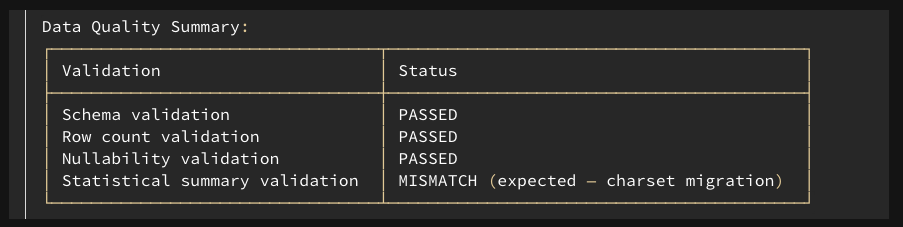
The agent invokes get_data_quality_summary to compare the outputs across four dimensions:
Schema validation: Confirms column names, data types, and column ordering match between source and target outputs.
Row count validation: Verifies no data loss or duplication during migration.
Nullability validation: Detects changes in null handling.
The preceding image shows the data quality summary.
Three of four checks pass cleanly. The statistical summary validation detects a mismatch in the shipper_address column of the customs_declarations output: the max and min summary values differ between source and target.
3.2 Understanding and resolving the mismatch
This mismatch is a direct consequence of Fix 4 (Section 2.6.4). The original code ran addresses through a Shift_JIS/GB2312/EUC-KR → UTF-8 roundtrip that produced garbled text, because the intermediate regional charset corrupted multi-byte UTF-8 characters. The upgraded code uses UTF-8 → UTF-8, preserving addresses faithfully. The mismatch reflects improved data quality, not a regression.
Schema, row counts, and nullability matched exactly: the difference is limited to string values that were previously garbled. No further action is needed. The upgraded application is production-ready.
Expected behavior: Character encoding migrations might change string values, although they preserve semantic meaning. When data quality validation reports mismatches, trace each one back to a specific code change. If the mismatch is explained by a required migration fix (as here), verify the new behavior is correct and document it. If a mismatch cannot be explained, investigate before promoting to production.
4. Upgrade summary
After the agent completes the entire upgrade workflow, it produces a comprehensive upgrade summary following a structured template. This summary lets you review the job configuration updates, code modifications with diffs and file references, relevant migration rules applied, and data quality validation status.
Here is the summary the agent produced for this upgrade:
Upgrade plan
Compile and build project with current Spark 3.5.0: validated that Python files compile successfully.
Run baseline validation on source EMR Serverless (00g4vhvt1lhtrs09) with Spark 3.5.0: established data quality baseline.
Run target validation on target EMR Serverless (00g4vhvt3np1bj09) with Spark 4.0.1: fixed 4 issues iteratively across 4 validation attempts.
Compare data quality between source and target runs: detected expected mismatch in shipper_address.
Generate and persist upgrade summary.
Upgrade result
Upgrade completed with data validation enabled. Data validation detected an expected mismatch in the shipper_address column because of the charset encoding migration from unsupported charsets (Shift_JIS, GB2312, EUC-KR) to UTF-8.
Dependency changes
No external dependencies were changed in this project (no requirements.txt).
Job configuration changes
Parquet datetime rebase configuration key renamed.
Migration rule: In Spark 4.0, the legacy datetime rebasing SQL configurations with the prefix spark.sql.legacy are removed. The SQL configuration spark.sql.legacy.parquet.datetimeRebaseModeInWrite was removed in the version 4.0.0. Use spark.sql.parquet.datetimeRebaseModeInWrite instead.
Legacy coding error action enabled.
Change: Added spark.sql.legacy.codingErrorAction set to true.
Migration rule: In Spark 4.0, the encode() and decode() functions raise MALFORMED_CHARACTER_CODING error when handling unmappable characters. In Spark 3.5 and earlier versions, these characters are replaced with garbled text. To restore the previous behavior, set spark.sql.legacy.codingErrorAction to true.
Error: [INVALID_PARAMETER_VALUE.CHARSET] charset in encode is invalid: expects one of iso-8859-1, us-ascii, utf-16, utf-16be, utf-16le, utf-32, utf-8, but got Shift_JIS.
Applied changes: src/domain/international_shipping/shipment_processor.py: Replaced Shift_JIS, GB2312, EUC-KR with UTF-8 for shipper and consignee address encoding.
Data mismatch: 1. The shipper_address column max summary value changed in customs_declarations output. This is expected because of the charset encoding migration from Shift_JIS/GB2312/EUC-KR to UTF-8. 2. The shipper_address column min summary value changed in customs_declarations output for the same expected cause.
5. Conclusion
The AWS Spark Upgrade Agent turns a traditionally time-consuming PySpark migration into an automated, iterative workflow. For the Global Logistics Platform sample, the agent identified and resolved four distinct Spark 4.0 breaking changes: legacy Parquet configuration key removal, compression codec renames, stricter charset encoding validation, and character encoding restrictions. Each fix was applied across three domain processors, through natural language interaction in the IDE.
Every incompatibility was discovered through runtime validation on Amazon EMR Serverless. The agent submitted the unmodified application to the target application, and each failure revealed the next breaking change:
The spark.sql.legacy.parquet.datetimeRebaseModeInWrite configuration removal, which crashes SparkSession initialization.
The lz4raw → lz4_raw codec rename, which fails when Parquet writes run.
ISO-8859-1 encoding of CJK characters: ISO-8859-1 is a valid Spark 4.0 charset, so the failure surfaces only when the code runs against real multi-language data, because Spark 4.0 tightened charset encoding validation to reject unmappable characters.
Shift_JIS/GB2312/EUC-KR charsets removed from Spark 4.0’s supported charset list entirely.
The agent diagnosed each error from Amazon CloudWatch logs, applied the fix, rebuilt, and resubmitted without manual intervention beyond approving each step. The data quality validation then confirmed that the upgraded application produces equivalent output on Spark 4.0.1: schema, row counts, and nullability matched exactly. The one difference, in the shipper_address column, resulted from the charset migration from regional encodings to UTF-8, which actually improved data quality by eliminating garbled text from incorrect encoding roundtrips. With each mismatch traced back to a specific, understood code change, the upgraded application is production-ready.
Today, AWS is announcing support for Spark Connect on Amazon EMR Serverless with EMR release 7.13 (Apache Spark 3.5.6) and later versions. You can now build and debug Spark applications from your preferred local environment while running full-scale Spark operations on EMR Serverless.
Previously, code that worked on a local machine might break in production because of environment mismatches, dependency conflicts, or unexpected data patterns. The only way to catch it was a deploy-and-check cycle. With the Spark Connect feature, you can develop Spark code from a supported local environment, such as an IDE (for example, VS Code or PyCharm), Jupyter notebooks, Amazon SageMaker Unified Studio (SMUS) Data Notebooks, Amazon Q Developer, or Kiro. There are no clusters to provision, no code to repackage, and no deploy-and-check loop. Your local Python session can stay local as usual while Spark operations are automatically routed to a remote Spark server for execution.
Each Spark Connect session has its own AWS resource with a unique ARN, enabling per‑session AWS Identity and Access Management (AWS IAM) permissions, tag‑based cost allocation, audit through AWS CloudTrail, and session-specific configuration overrides. This gives teams finer control over who runs what, at what cost. You also get real-time visibility through the Spark UI, persistent session history, and a dedicated interface to monitor and manage active and completed sessions.
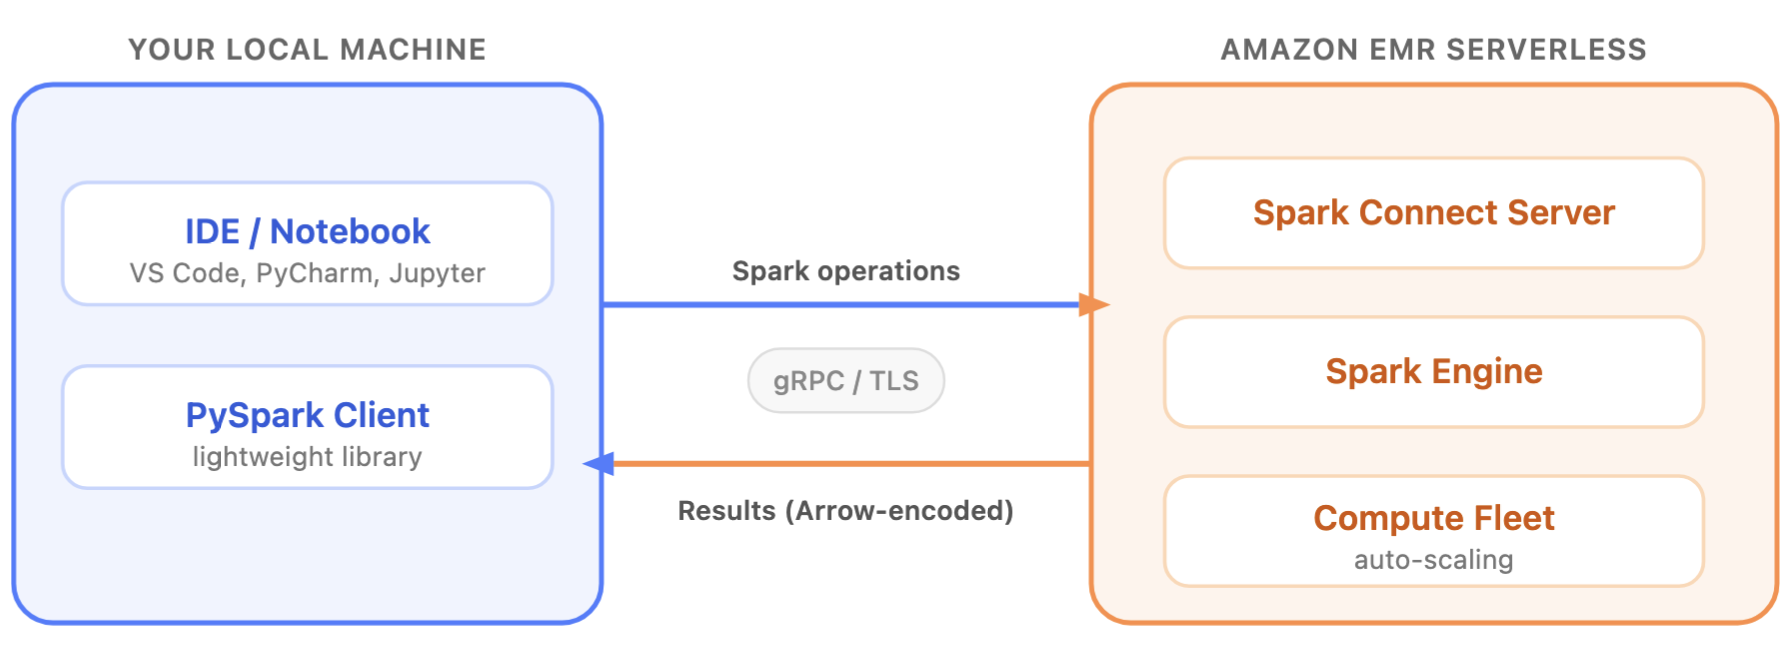
Spark Connect uses a client-server architecture that separates application code from the Spark engine. The client, a lightweight PySpark library running on a local environment, sends Spark operations over a secure gRPC/TLS connection to a Spark Connect server running on EMR Serverless. Then the server runs that Spark code on EMR Serverless as compute. Finally, it returns results to your local session.
Your local machine doesn’t need Spark installed, doesn’t need direct access to the data, and doesn’t need to be sized for the workload. Because the client is a compact library, you can embed Spark operations in your Python applications that support PySpark. This includes web services, dashboards, and automation scripts. For example, a development team can add Spark-powered analytics directly into a FastAPI backend or a Streamlit dashboard, treating Spark like a database driver rather than a separate batch system. These capabilities extend Spark Connect use cases beyond traditional notebook and IDE development, since the compute-intensive processing happens on the server – EMR Serverless side. This allows you to use pandas, matplotlib, and your team’s internal Python libraries on your laptop or in your embedded clients, without installing those libraries on EMR Serverless.
With Spark Connect server sessions running on EMR Serverless, you pay for compute only while your session is active. When inactive, you’re not paying. EMR Serverless automatically scales compute up and down based on workload demands through dynamic resource allocation (DRA), eliminating the need to predict capacity ahead of time. For teams that run Spark Connect sessions regularly, you can configure pre-initialized capacity on your EMR Serverless application for faster session startup times. Additionally, your Spark Connect sessions have access to the full suite of EMR Serverless features, including AWS Graviton processors for cost optimization and secure VPC connectivity to your data sources. You also get access to custom images with flexibility and integrated observability through Amazon CloudWatch and the Spark UI.
Getting started
Getting started with Spark Connect on EMR Serverless takes three steps: create an application, start a session, and connect from your IDE.
Note: The resources created in this quick start incur charges while active. Make sure to follow the cleanup steps at the end of this tutorial to avoid ongoing charges.
Prerequisites
In addition to the required job runtime IAM role, these additional permissions are needed: emr-serverless:StartSession, GetSession, GetSessionEndpoint, TerminateSession, GetResourceDashboard, and iam:PassRole on the runtime role.
An existing EMR Serverless application running emr-7.13.0 or later, with interactiveConfiguration.sessionEnabled = true.
boto3 version 1.43.0 or later to access the latest EMR Serverless session APIs.
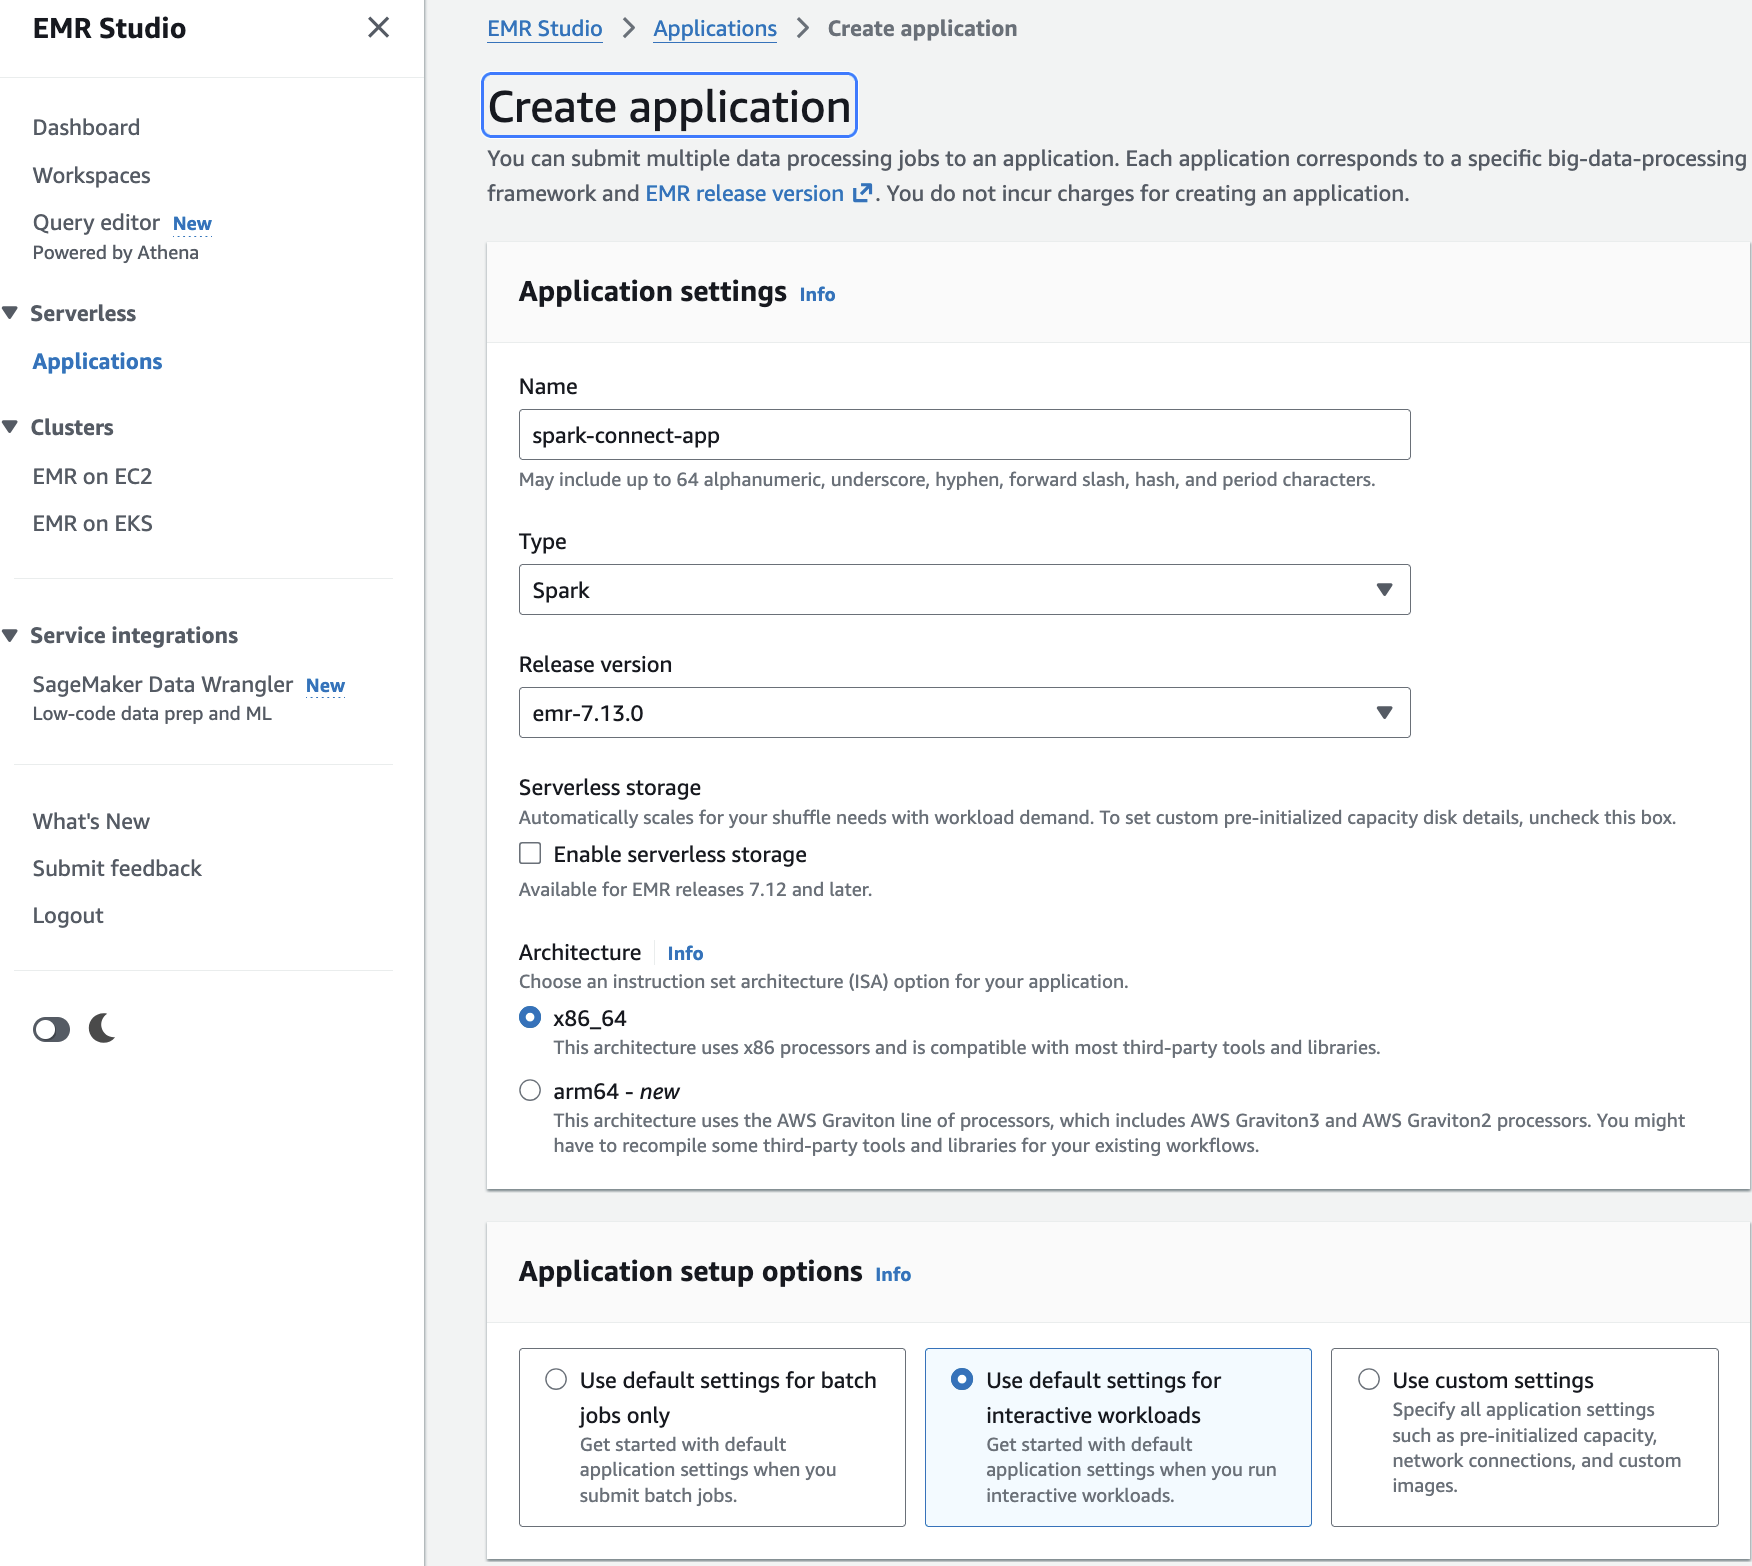
Step 1: Create an EMR Serverless application with Spark Connect enabled
Open the Amazon EMR console and navigate to EMR Serverless.
Choose Get started. A pop-up appears. Choose Create and launch EMR Studio.
This takes you to the Create application page.
Enter a Name for your application (for example, spark-connect-app).
For Type, select Spark.
For Release version, select emr-7.13.0 or later.
For Architecture, choose x86_64 (default). This is compatible with most third-party tools and libraries.
Under Application setup options, select Use default settings for interactive workloads. This automatically sets interactiveConfiguration.sessionEnabled = true.
Next, start a session and obtain the Spark Connect endpoint.
Provide an IAM execution role that grants the session access to your data, such as reading data from an Amazon S3 bucket or querying the AWS Glue Data Catalog. This is the same type of role used for EMR Serverless batch jobs.
# Start a session with your execution role
$ROLE_ARN="YOUR_ROLE" # example: arn:aws:iam::123456789012:role/EMRServerlessSessionRole
SESSION_ID=$(aws emr-serverless start-session \
  --application-id $APP_ID \
  --execution-role-arn $ROLE_ARN \
  --query sessionId \
  --output text)

# Get the session endpoint
aws emr-serverless get-session-endpoint \
  --application-id $APP_ID \
  --session-id $SESSION_ID
The get-session-endpoint response includes a secure endpoint URL and an authentication token. All communication between your local environment and EMR Serverless is encrypted using TLS. Treat the token as a sensitive credential. Consider using AWS Secrets Manager to store and retrieve tokens programmatically. The authentication token is time-limited to 1 hour, so for long-running sessions we recommend that you refresh it periodically.
Step 3: Connect from your local IDE
Use the returned endpoint URL and authentication token to connect to the Spark Connect server.
The connection URL uses the sc:// protocol, which is the Spark Connect standard. The use_ssl=true parameter supports encrypted communications over TLS, so your data and credentials are protected in transit.
from pyspark.sql import SparkSession

# Use the endpoint and auth token from get-session-endpoint
session_endpoint="<endpoint-from-get-session-endpoint>"
auth_token="<authToken-from-get-session-endpoint>"

spark_connect_url = (
    f"sc://{session_endpoint}:443/;use_ssl=true;x-aws-proxy-auth={auth_token}"
)

spark = SparkSession.builder \
    .remote(spark_connect_url) \
    .getOrCreate()

# Query data in your S3 data lake
df = spark.sql("SELECT * FROM my_catalog.my_database.my_table")
df.show()

# Run transformations at scale
df.groupBy("category").count().orderBy("count", ascending=False).show()
spark.stop()
Once connected, Spark operations you write in your IDE can be run on EMR Serverless. For debugging, you can pause the execution at breakpoints, inspect variables, and step through your transformations locally while EMR Serverless processes your data on remote, scalable infrastructure.
Sessions remain active for a configurable idle timeout (1 hour by default). If your connection drops, the session continues running, allowing you to reconnect without losing your work. You can also access the live Spark UI through the GetResourceDashboard API to monitor queries, stages, and executors in real time. After the session ends, the Spark History Server remains available for post-run analysis.
Clean up resources
If the 1-hour session idle timeout does not meet your needs, you can manually remove sessions to avoid ongoing costs. Note that terminating an active session will immediately stop you running Spark operations. Before doing that, verify all your critical data processing is completed, and results are saved.
# 1. Stop the active session
aws emr-serverless terminate-session \
  --application-id $APP_ID \
  --session-id $SESSION_ID

# 2. Stop the application
aws emr-serverless stop-application --application-id $APP_ID
Use cases
Spark Connect on EMR Serverless supports a wide range of development workflows. The following are some of the most popular use cases, including but not limited to:
Interactive ETL development — Build and test data pipelines interactively, validating transformations against full-scale datasets before promoting them to production as batch jobs.
SageMaker Unified Studio (SMUS)Data Notebooks — Run interactive PySpark sessions directly from SMUS Data Notebooks connected to EMR Serverless through Spark Connect.
Direct S3 and JDBC access without a catalog — Connect directly to S3 files and JDBC data sources without needing a metastore or catalog configuration.
Amazon S3 Tables with federated catalog — Access S3 Tables as a federated Glue Data Catalog source, combining Iceberg features with serverless Spark execution.
dbt-spark — Run dbt-spark adapter against EMR Serverless via Spark Connect, allowing analytics engineers to develop and test transformations locally with dbt framework while using EMR Serverless as the remote Spark engine.
Exploratory data analysis and feature engineering — Analyze production-scale data from your preferred notebook environment instead of using sampled subsets, helping you catch data quality issues earlier.
Compute standardization — Standardize EMR Serverless as the Spark backend while giving you the flexibility to use preferred local tools, version control, and CI/CD workflows.
These use cases work across multiple client surfaces: IDEs, Jupyter notebooks, dbt-spark, and AI coding agents. Because Spark Connect is an open Apache Spark standard, the same PySpark code typically works across different Spark backends by changing the connection endpoint.
Availability and pricing
Spark Connect on EMR Serverless is now available with Apache Spark 3.5.6 on Amazon EMR release 7.13 and higher in all AWS Regions where EMR Serverless is available. There is no additional charge for using Spark Connect. You pay for the EMR Serverless compute resources (vCPU, memory, and storage) consumed during your session, the same pricing model as EMR Serverless batch jobs.
Conclusion
Spark Connect on EMR Serverless bridges the gap between local development and production-scale execution. Build and debug PySpark applications from your preferred environment (IDE, notebook, dbt, or AI coding agent) while EMR Serverless handles automatic scaling, per-session cost visibility, and infrastructure management behind the scenes. With ARN-addressable sessions, fine-grained IAM permissions, tag-based cost allocation, and per-session configuration overrides, your team gets the controls they need without sacrificing flexibility.
Get started today with EMR release 7.13.0 (Spark 3.5.6). Follow the step-by-step tutorial in the EMR Serverless Developer Guide to create your first Spark Connect session and experience interactive, serverless PySpark development firsthand.
Apache Spark 4.0 represents a major milestone in stream processing, introducing new capabilities that fundamentally change how developers build stateful streaming applications. At the heart of these improvements is the transformWithState API – a new capability that enables first-class support for timers, automatic state management, and schema evolution to Spark Structured Streaming.
With Spark 4.0 now available on Amazon EMR Serverless, developers can build stateful streaming applications using the transformWithState API in a fully managed, serverless environment that automatically scales based on workload demands. This combination delivers the power of sophisticated stream processing without the operational overhead of cluster management.
In this post, we demonstrate how to build a production-ready IoT device monitoring system using Spark 4.0’s transformWithState API on Amazon EMR Serverless. This example showcases the key capabilities of stateful streaming and provides a template you can adapt for your own use cases.
Apache Spark 4.0: introducing transformWithState
Apache Spark 4.0’s latest streaming features solve common production challenges in stateful applications by introducing native timer support and advance state management capabilities for complex event processing workflows. The new transformWithState API provides:
Key features of transformWithState
Native timer support: Register timers that fire callbacks at specific times for use cases like heartbeat monitoring, session timeout detection, and SLA violation alerts.
Automatic state TTL (Time-To-Live): Configure automatic expiration policies to prevent state from growing indefinitely. This is useful for use cases like session state size control, clearing stale device telemetry, maintaining a recency cache, or tracking invalid logins within the last hour for fraud detection.
Schema evolution: Evolve state schema without restarting from a new checkpoint. Add optional fields, remove fields, or widen numeric types. This is particularly valuable for use cases where data structures are dynamic, and application downtime for schema migration is not acceptable, enabling more resilient and flexible real-time streaming applications.
Multiple state variables: Support for multiple independent state variables (ValueState, ListState, MapState) per key, well-suited for building complex, real-time applications that require sophisticated state management, such as storing a history of recent error codes, tracking counts of various alert types, or maintaining multiple dimensions of user activity within a single stateful operator.
State observability: Query application state mid-stream using the State Data Source Reader for debugging and monitoring. This is especially valuable in applications that require maintaining and evolving state through several steps, such as detection of sophisticated event patterns across multiple streams and over time, where visibility into state transitions is critical for troubleshooting and validation.
Operator chaining: Chain multiple stateful operators together for complex multi-stage processing pipelines.
These capabilities make Spark 4.0 ideal for applications that were previously difficult or impossible to implement efficiently, such as complex event processing, session analytics, anomaly detection, and real-time monitoring systems.
Use case: IoT heartbeat monitoring
Consider a fleet of 100,000 IoT sensors deployed across manufacturing facilities. Each sensor sends a heartbeat signal every 20 seconds to indicate it’s operational. Your operations team needs to be alerted within 30 seconds if any sensor goes offline, with repeat alerts every 60 seconds until the sensor comes back online.
This seemingly simple requirement presents several technical challenges. The application must maintain the last heartbeat timestamp for each of the 100,000 devices while independently managing timers to detect missed signals per device. It also needs to handle out-of-order heartbeats caused by network delays and clean up state for decommissioned devices to prevent unbounded memory growth. All of this must happen at scale, processing millions of events per minute with low latency, while recovering gracefully from failures without losing state.
To address the specific challenges of IoT heartbeat monitoring described above, we present a solution built on the transformWithState API in Spark 4.0. With its native timer support, automatic state management, and built-in fault tolerance, making it the ideal solution for IoT heartbeat monitoring at scale.
Solution overview
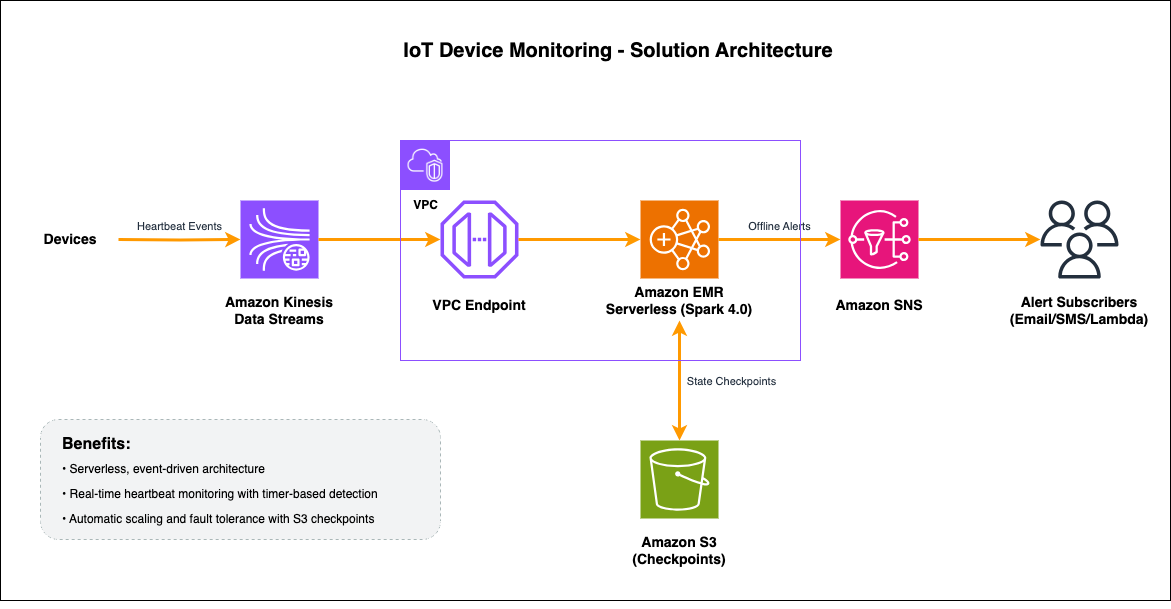
Our solution architecture follows a serverless, event-driven design:
IoT devices send heartbeat events to Amazon Kinesis Data Streams containing device ID, timestamp, and metadata (battery level, signal strength, firmware version).
Amazon EMR Serverless reads from Kinesis using the Spark aws-kinesis connector using VPC Endpoint for Kinesis, then parses JSON events into structured DataFrames and grouping by device_id.
transformWithState processes each device’s stream. On heartbeat arrival, it updates state and registers a 30-second timer; when the timer expires without a new heartbeat, it emits an offline alert.
State is automatically persisted to RocksDB locally and checkpointed to Amazon Simple Storage Service (Amazon S3), enabling fault-tolerant recovery and exactly-once processing semantics.
Alerts are delivered via Amazon Simple Notification Service (Amazon SNS) to configured subscribers (email, SMS, AWS Lambda, webhooks).
Prerequisites
Before implementing this solution, verify that you have:
AWS account: With permissions for EMR Serverless, Kinesis, SNS, S3, VPC, and IAM.
SNS topic: Created for sending alerts (for example, iot-alerts).
S3 bucket: For storing application code, dependencies, and checkpoints.
Step-by-step implementation
The following steps walk you through setting up an EMR Serverless application with Spark 4.0, configuring the stateful streaming processor, and deploying the IoT heartbeat monitoring solution.
Step 1: Create the EMR serverless application
Run the following command in your terminal using the AWS CLI. Replace the subnet and security group IDs with the values from your VPC setup.
The command returns a JSON response containing the application details. Note the applicationId value from the output, as you will need it in subsequent steps.
Step 2: Implement the heartbeat monitor
The core of our solution is the HeartbeatMonitor class that extends StatefulProcessor. This class demonstrates the key features of Spark 4.0’s transformWithState API. Download the full implementation script and upload it to your local S3 bucket for execution. Let’s walk through each component to understand how it works.
2.1 Initialize state variables
The init() method is called once when the processor is initialized. This is where we define and register our state variables.
In the init() method, we use StatefulProcessorHandle to define and initialize two per-key state variables, last_seen and device_info, using Spark’s StructType schemas and the getValueState() API. These state variables are automatically stored in RocksDB and checkpointed to S3, allowing for fault-tolerant state management across streaming micro-batches.
2.2 Handle incoming heartbeat events and register timers
The handleInputRows() method is called whenever new events arrive for a device. This is where we update state and register timers.
def handleInputRows(
    self, key: tuple, rows: Iterator[pd.DataFrame], timerValues
) -> Iterator[pd.DataFrame]:
    device_id = key[0]

    # Process incoming heartbeats - iterate through all rows to find latest
    latest_timestamp = None
    for pdf in rows:
        for _, row in pdf.iterrows():
            ts = row['timestamp']
            if pd.isna(ts):
                continue
            if latest_timestamp is None or ts > latest_timestamp:
                latest_timestamp = ts

    if latest_timestamp is None:
        yield pd.DataFrame()
        return

    # Check if we have existing state
    existing_timestamp = None
    if self.last_seen.exists():
        existing_state = self.last_seen.get()
        existing_timestamp = existing_state[0]

    # Update state only if new heartbeat is more recent
    if existing_timestamp is None or latest_timestamp > existing_timestamp:
        # Cancel existing timers (device is back online)
        for timer in self.handle.listTimers():
            self.handle.deleteTimer(timer)

        # Update state with new timestamp
        self.last_seen.update((latest_timestamp,))

        # Register timer for heartbeat deadline detection
        current_time_ms = timerValues.getCurrentProcessingTimeInMs()
        deadline_ms = current_time_ms + HEARTBEAT_INTERVAL_MS
        # 30 seconds from now
        self.handle.registerTimer(deadline_ms)

    yield pd.DataFrame()  # No output from input handling
The handleInputRows() method processes incoming heartbeat events for each device by extracting the latest timestamp, updating the last_seen state, and managing timers. It cancels existing ones and registering a new 30-second expiry timer to detect future inactivity. Because alerts are only emitted upon timer expiration, the method yields an empty dataframe during normal heartbeat processing.
2.3 Handle timer expiration and emit alerts
The handleExpiredTimer() method is called when a registered timer fires. This is where we detect offline devices and emit alerts.
def handleExpiredTimer(
    self, key: tuple, timerValues, expiredTimerInfo
) -> Iterator[pd.DataFrame]:
    device_id = key[0]
    current_time_ms = timerValues.getCurrentProcessingTimeInMs()

    # Verify state exists
    if not self.last_seen.exists():
        yield pd.DataFrame()
        return

    # Get last seen timestamp from state
    last_seen_state = self.last_seen.get()
    last_seen_timestamp = last_seen_state[0]

    if last_seen_timestamp is None or pd.isna(last_seen_timestamp):
        yield pd.DataFrame()
        return

    # Calculate how long device has been offline
    last_seen_ms = int(last_seen_timestamp.timestamp() * 1000)
    offline_duration_ms = current_time_ms - last_seen_ms
    offline_duration_seconds = offline_duration_ms / 1000.0

    # Create alert as a Pandas DataFrame
    alert_df = pd.DataFrame({
        "device_id": [device_id],
        "alert_type": ["DEVICE_OFFLINE"],
        "last_seen": [last_seen_timestamp],
        "offline_duration_seconds": [offline_duration_seconds],
        "alert_timestamp": [datetime.fromtimestamp(current_time_ms / 1000.0)]
    })

    # Register another timer for repeat alerts (every 60 seconds)
    next_alert_time = current_time_ms + ALERT_REPEAT_INTERVAL_MS
    self.handle.registerTimer(next_alert_time)

    yield alert_df  # Emit the alert
The handleExpiredTimer() method is triggered automatically when a device’s inactivity timer expires, retrieving the last_seen state to calculate the offline duration and yielding an alert dataframe to the output stream. It also registers a follow-up timer for repeat alerts every 60 seconds, which continues until a new heartbeat arrives and cancels the timer via handleInputRows().
There are several ways you could extend this solution for production use. You could implement exponential backoff for repeat alerts to reduce noise, for example, alerting after 60 seconds, then 2 minutes, then 5 minutes, and so on. Other improvements could include adding severity escalation based on offline duration, integrating with notification services like Amazon SNS for downstream alerting, or setting a maximum retry limit to stop alerts for permanently decommissioned devices.
2.4 Apply transformWithState to the streaming DataFrame
Now we connect everything together by applying our HeartbeatMonitor processor to the streaming data.
# Read and parse heartbeat events from Kinesis
parsed_df = kinesis_df \
    .selectExpr("CAST(data AS STRING) as json_data") \
    .select(from_json(col("json_data"), heartbeat_schema).alias("heartbeat")) \
    .select(
        col("heartbeat.device_id"),
        to_timestamp(col("heartbeat.timestamp")).alias("timestamp"),
        col("heartbeat.battery_level"),
        col("heartbeat.signal_strength"),
        col("heartbeat.firmware_version")
    )

# Apply transformWithState for stateful processing
alerts_df = parsed_df \
    .groupBy("device_id") \
    .transformWithStateInPandas(
        statefulProcessor=HeartbeatMonitor(),
        outputStructType=alert_output_schema,
        outputMode="append",
        timeMode="processingTime"
    )

# Write alerts to SNS
query = alerts_df.writeStream \
    .outputMode("append") \
    .foreachBatch(send_to_sns) \
    .option("checkpointLocation", CHECKPOINT_LOCATION) \
    .trigger(processingTime="10 seconds") \
    .start()

# Send to SNS for alerts
def send_to_sns(batch_df, batch_id):
    if batch_df.count() > 0:
        sns_client = boto3.client('sns', region_name=KINESIS_REGION)
        for row in batch_df.collect():
            message = {
                "device_id": row["device_id"],
                "alert_type": row["alert_type"],
                "last_seen": str(row["last_seen"]),
                "offline_duration_seconds": row["offline_duration_seconds"],
                "alert_timestamp": str(row["alert_timestamp"])
            }
            sns_client.publish(
                TopicArn=SNS_TOPIC_ARN,
                Message=json.dumps(message),
                Subject=f"Device Offline Alert: {row['device_id']}"
            )
The streaming pipeline parses JSON heartbeat events from Kinesis, partitions them by device_id, and applies the HeartbeatMonitor stateful processor using transformWithStateInPandas() with processing-time timers and append output mode. The resulting alert stream is written to SNS via foreachBatch() with checkpointing enabled for fault tolerance and micro-batches triggered every 10 seconds.
To summarize, implementing the heartbeat monitor requires just three methods. The init() method sets up your state variables, handleInputRows() processes incoming heartbeats and manages timers, and handleExpiredTimer() generates offline alerts. The transformWithState API handles the underlying complexity of state management, checkpointing, and timer scheduling automatically.
Step 3: Create IAM role for job execution
Create an IAM role that allows EMR Serverless to assume it for running your Spark job. For detailed instructions on creating an IAM role, see Creating an IAM role. Use the following trust policy for the role.
Attach a permissions policy that grants the role access to read from the Kinesis stream, write to the S3 bucket for checkpoints and application artifacts, and publish alerts to the SNS topic:
Step 4: Upload external dependencies required for executing the streaming job
In this step, you will download the required external dependencies and upload them to your S3 bucket to make them available for your EMR Serverless streaming job.
Spark-kinesis-connector.jar (download link) and copy to local S3 bucket s3://your-bucket/jars/spark-kinesis-connector.jar.
Protobuf Dependency (download link) and copy to local S3 bucket s3://your-bucket/pyfiles/protobuf_pkg.tar.gz.
Step 5: Submit the streaming job
Now that the application, IAM role, and dependencies are in place, you can submit the streaming job. This step configures the Spark job parameters and submits it to your EMR Serverless application in streaming mode. For more details on submitting jobs, see Starting a job run.
First, create a file named job-driver.json with the following content. Replace the S3 paths with the locations where you uploaded your script and dependencies in the previous steps.
Running transformWithState on Amazon EMR Serverless provides several operational advantages over self-managed Spark clusters. In streaming mode, the Spark driver remains alive between micro-batches, eliminating the overhead of repeatedly starting and stopping the application. You don’t need to provision or manage executors because EMR Serverless automatically scales compute resources up and down based on workload demands, so you only pay for what you use. Your IoT heartbeat monitor can handle traffic spikes, such as thousands of devices reconnecting simultaneously after a network outage, without manual intervention. EMR Serverless also provides built-in job resiliency, real-time monitoring, and enhanced log management, reducing the operational burden of running streaming applications in production.
Testing the solution
Now that our streaming application is deployed, let’s test it by sending heartbeat events and observing the offline detection behavior.
Step 1: Open AWS CloudShell
Open AWS CloudShell in your AWS account from the AWS Management Console.
Step 2: Send heartbeat events using CLI
Execute the following bash script to send heartbeat events every 10s.
Update the timestamp field to use the current time for each event or use a script to automate sending events at regular intervals.
Step 3: Observe normal operation
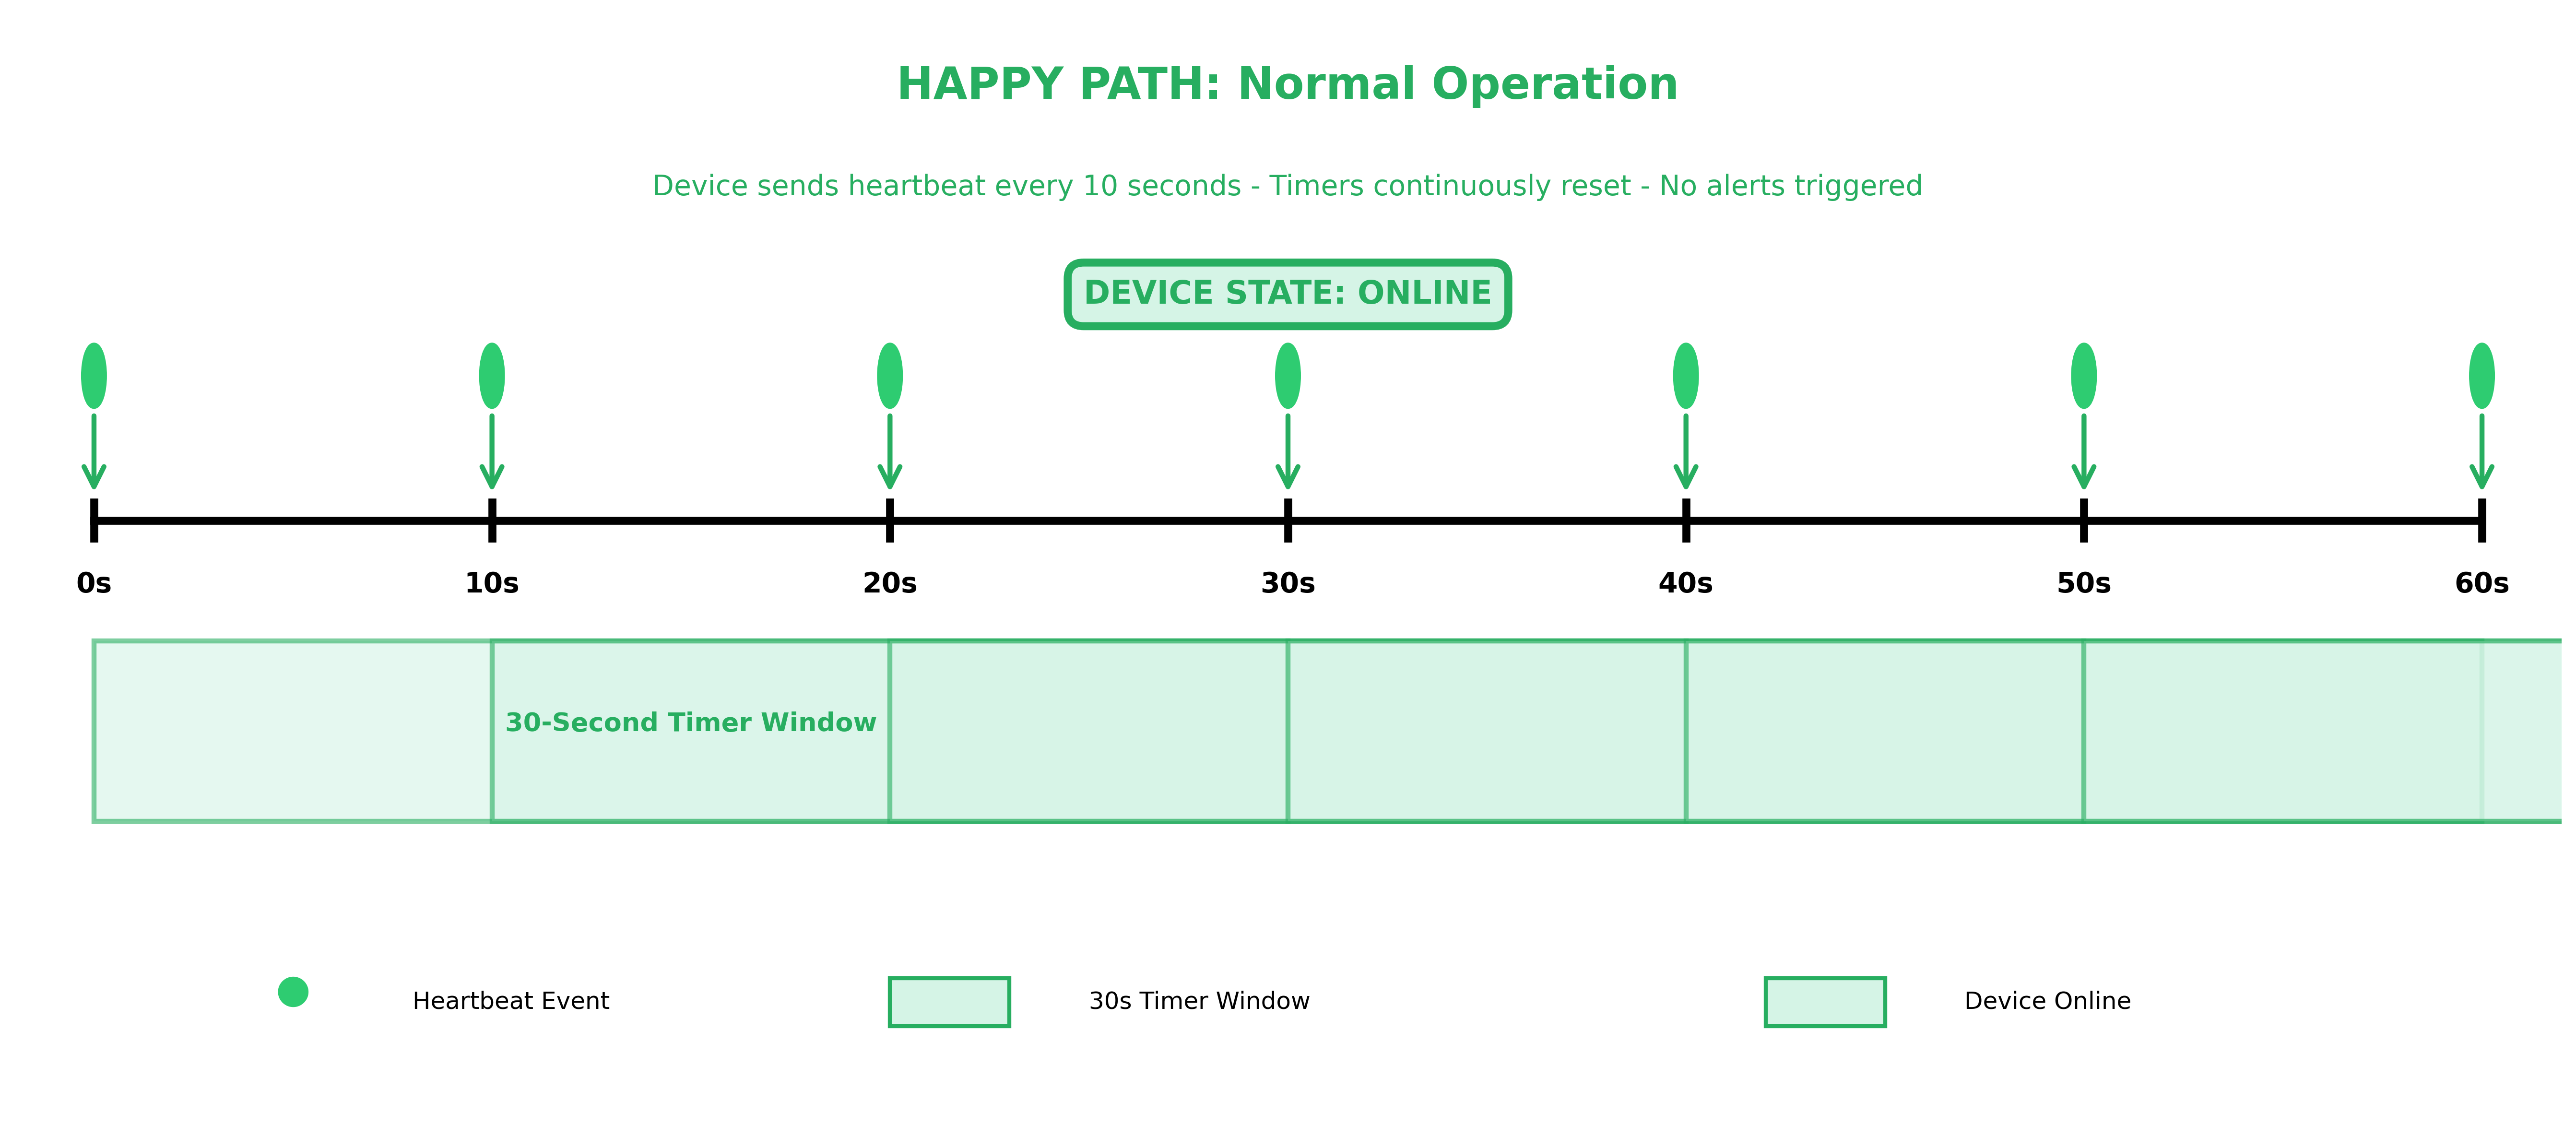
As you send heartbeat events every 10 seconds, the Spark application receives each event and updates the device’s state. A timer is then registered for 30 seconds in the future. Each new heartbeat cancels the existing timer and registers a new one, effectively resetting the countdown. As long as heartbeats continue to arrive within the 30-second window, no alerts are sent.
The above timeline diagram shows a 60-second window of normal device operation. Heartbeat events arrive every 10 seconds (at 0s, 10s, 20s, 30s, 40s, 50s, and 60s), each resetting the 30-second timer window. Because every heartbeat arrives well within the 30-second threshold, the timer never expires, the device state remains online, and no alerts are triggered.
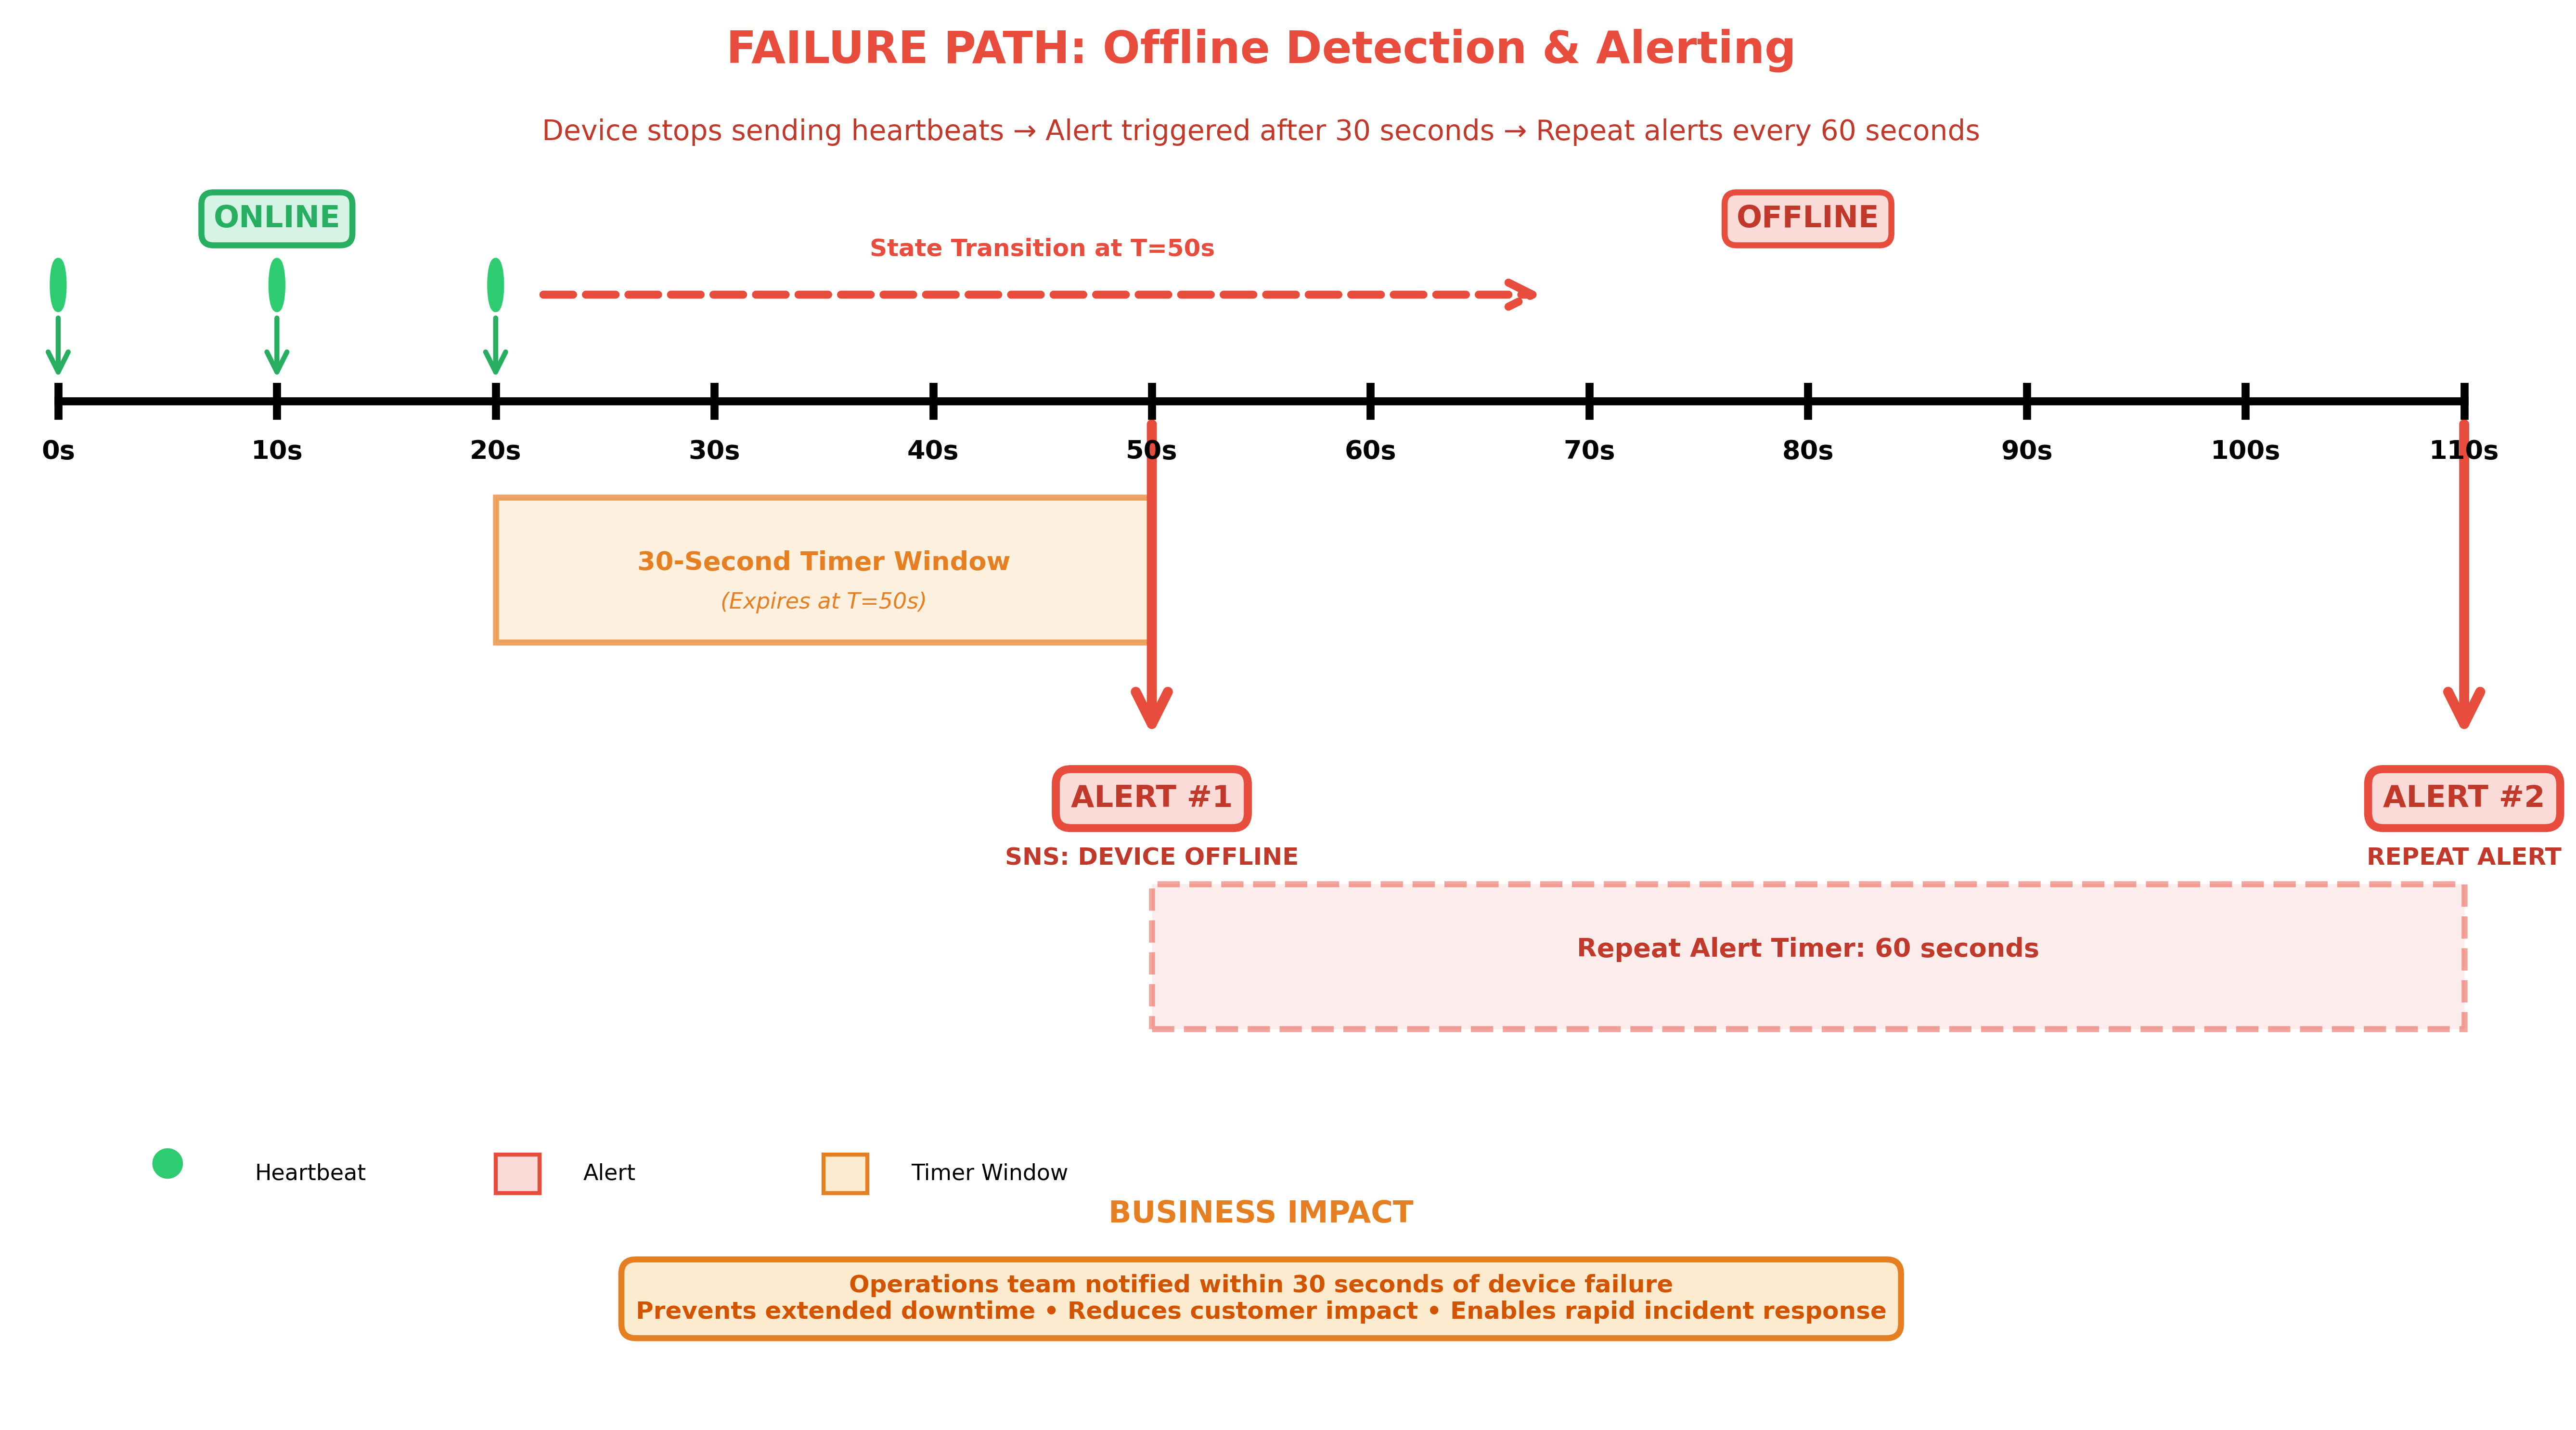
Step 4: Test offline detection
Stop sending heartbeat events for the device and wait 30 seconds. You should receive an SNS alert indicating the device is offline.
Timeline diagram showing offline detection over 110 seconds. Device sends heartbeats at 0s, 10s, and 20s before going offline. The 30-second timer expires at 50s triggering Alert #1 via SNS, followed by a repeat Alert #2 at 110s after a 60-second repeat timer.
If you continue to not send heartbeats, additional alerts will be sent every 60 seconds.
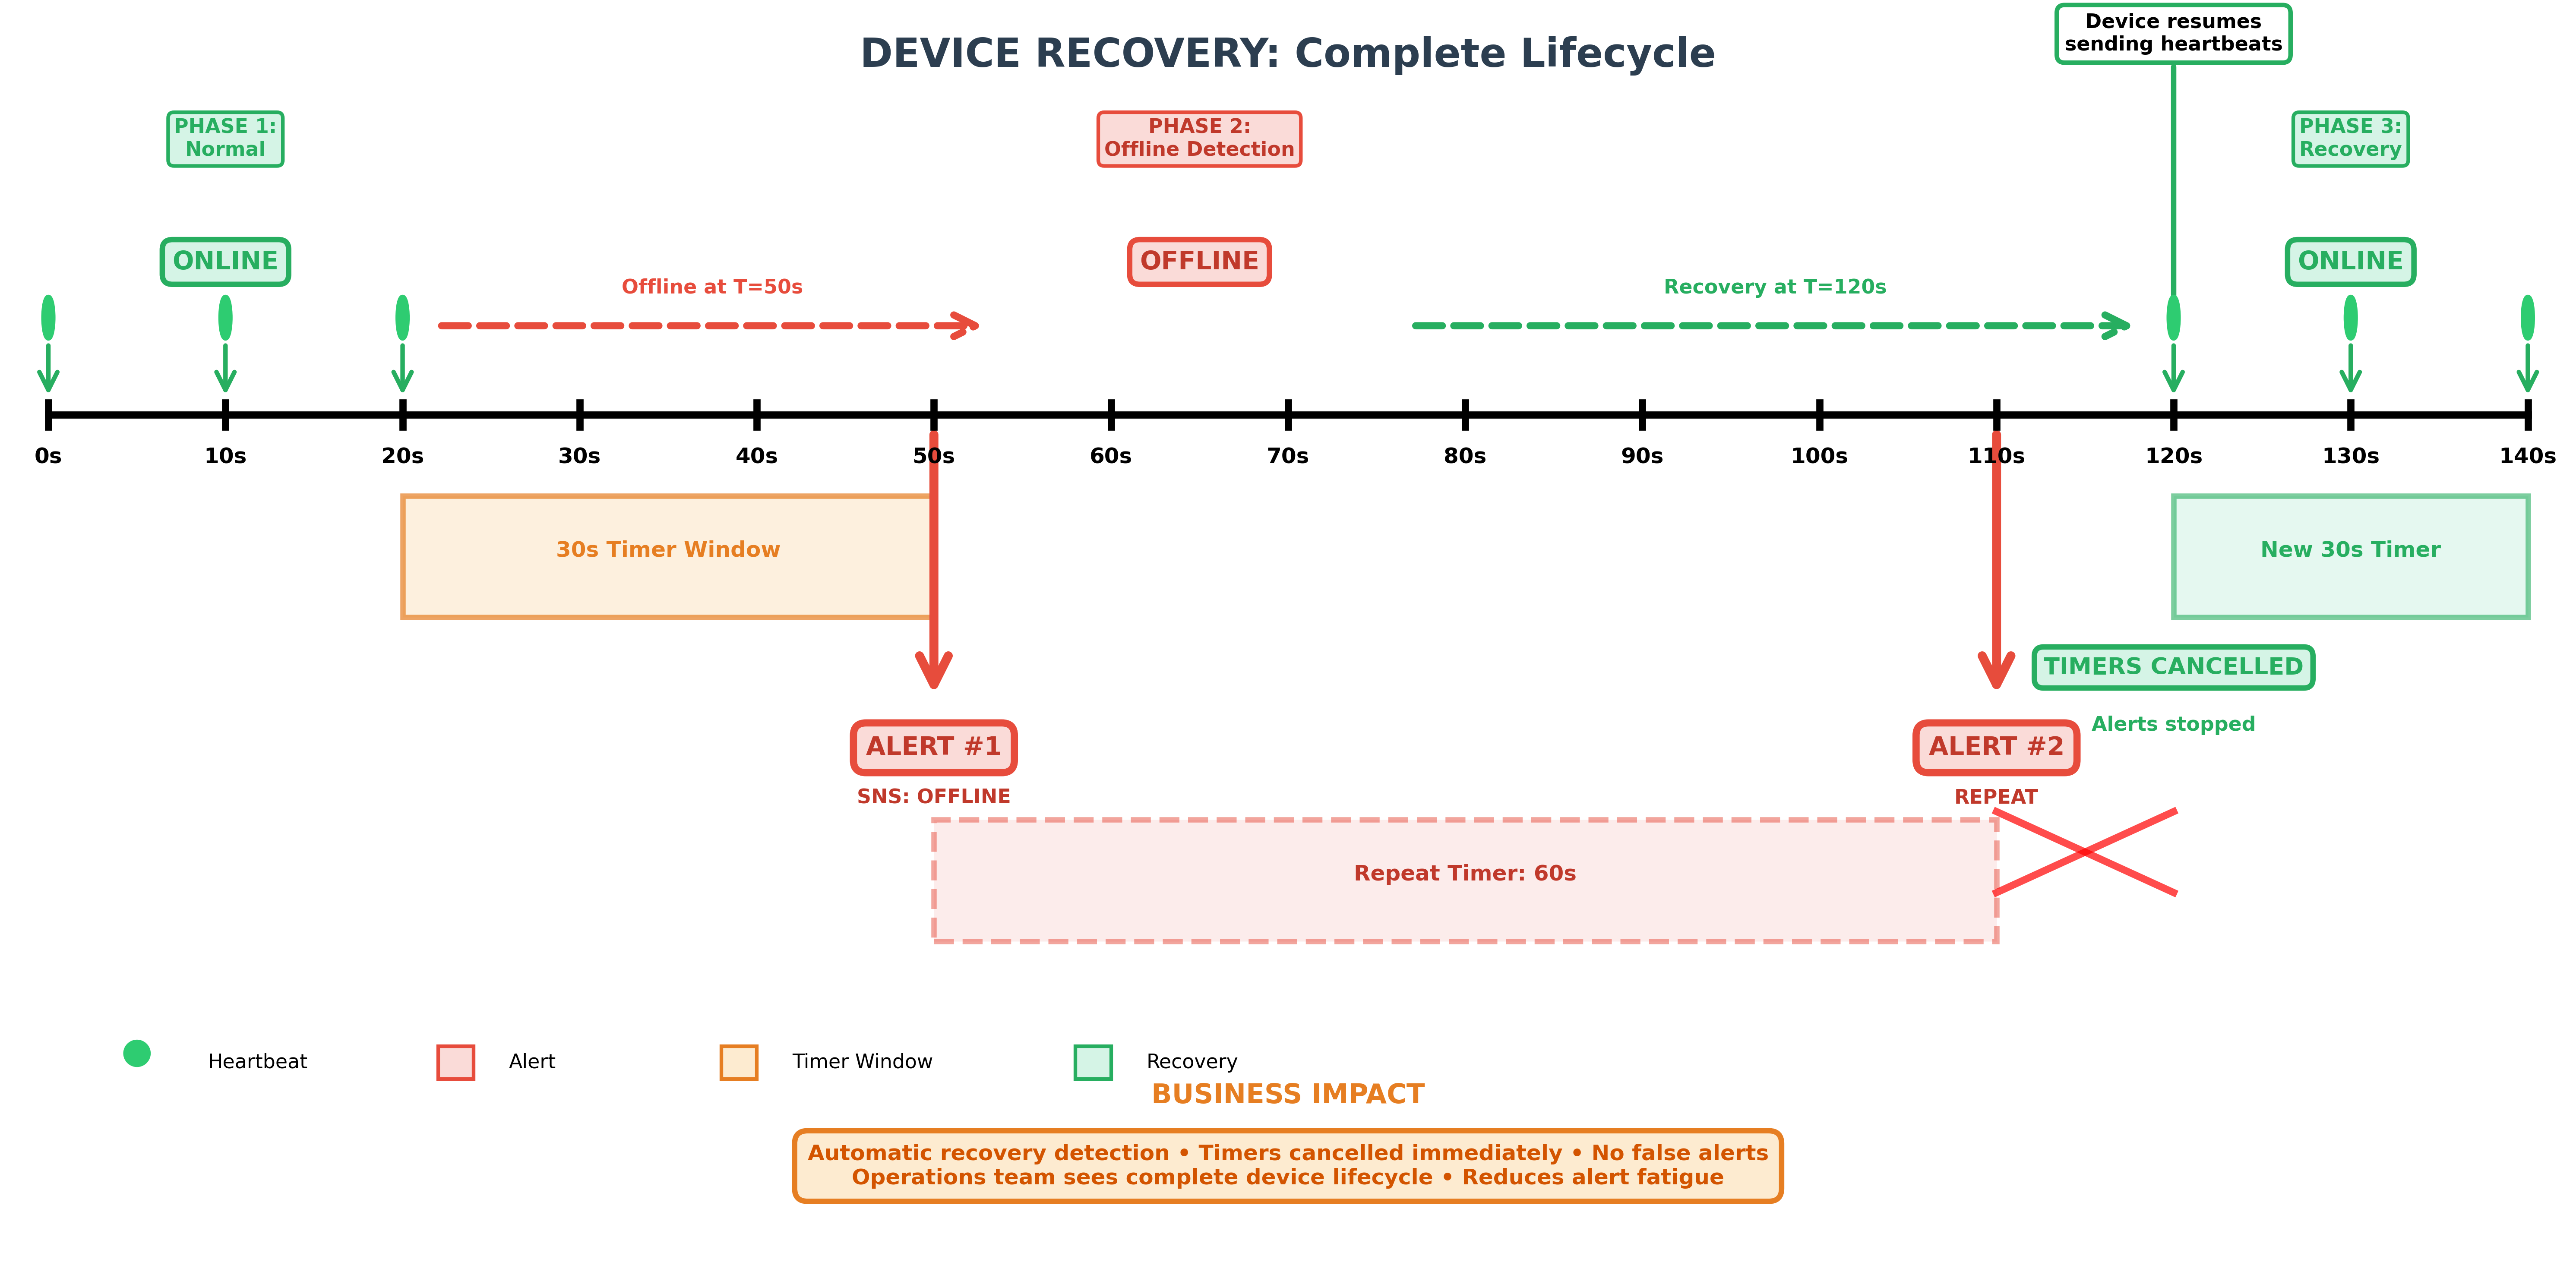
Step 5: Test device recovery
Resume sending heartbeat events using the same CLI command. The application will cancel all existing timers for the device and will stop sending SNS alerts.
Timeline diagram showing the complete device recovery lifecycle over 140 seconds across three phases: normal operation with heartbeats, offline detection with SNS alerts, and recovery where timers are canceled and the device returns to online state
Clean up
To avoid incurring ongoing charges, follow these steps to clean up the resources.
The transformWithState API enables developers to build sophisticated streaming applications that were previously difficult to implement. Here are a few examples of how it can be applied across industries.
Telecommunications and network monitoring: Telecom providers need to detect network anomalies and SLA violations as they happen across millions of concurrent sessions. With transformWithState, developers can maintain per-session state to track call detail records, compare real-time network metrics against established baselines, and trigger alerts the moment thresholds are breached. Automatic state TTL ensures that completed session records are cleaned up without manual intervention.
Financial services and fraud detection: Detecting fraud requires correlating multiple signals across a sequence of transactions in real time. With transformWithState, developers can maintain per-account state that tracks transaction histories, flags suspicious patterns like rapid purchases across geographies, and calculates rolling risk scores. Multiple state variables per key allow tracking different dimensions of activity, such as transaction velocity, location changes, and spending deviations, within a single stateful operator.
E-commerce and customer engagement: Understanding customer behavior in real time is critical for driving conversions. Using transformWithState, developers can build session-aware applications that track browsing and cart activity with timer-based state expiration, detecting cart abandonment after a configurable timeout and triggering personalized re-engagement notifications. The State Data Source Reader enables teams to inspect session state mid-stream, making it easier to debug and validate real-time customer journey logic.
Conclusion
Apache Spark 4.0’s transformWithState API represents a significant advancement in stateful stream processing, making it simpler to build complex real-time applications like IoT device monitoring. Combined with Amazon EMR Serverless, you get a fully managed platform that scales automatically and eliminates infrastructure management overhead.
This post demonstrates how to use the native timer support capability of transformWithState to build a real-time IoT device monitoring application. We encourage you to explore other capabilities such as Automatic State TTL, Schema Evolution, and Multiple State Variables on Amazon EMR Serverless to build more sophisticated streaming applications tailored to your needs.
As data volumes grow and pipelines become more complex, you need an engine that handles semi-structured data natively, supports streaming state without operational overhead, and allows you to develop interactively against production-scale compute. Spark 4.0 addresses these three challenges that slow modern data teams: wrangling semi-structured data, managing streaming state, and bridging the gap between interactive development and production-scale execution. With VARIANT data type, state-management improvements, and Spark Connect availability in Spark 4.0, you can now handle these workloads with less code, fewer operational trade-offs, and faster iteration cycles, all on Amazon EMR optimized runtime, which runs Spark workloads up to 4.5× faster than open-source Apache Spark.
With this general availability announcement, Spark 4.0 is now supported across Amazon EMR Serverless, Amazon EMR on EC2, and Amazon EMR on EKS deployment options. In this post, you’ll learn about key Spark 4.0 capabilities now available on Amazon EMR including Spark Connect, the Variant data type, SQL scripting, Python API improvements, and streaming enhancements, along with infrastructure changes in the new emr-spark-8.0 release.
New features in GA
Apache Spark 4.0 introduces several capabilities that are now generally available on Amazon EMR.
Spark Connect
Most Spark development is iterative and disconnected from production. You write code locally, test it against a sample, then package and deploy it to a cluster. It often fails due to data issues at scale, environment mismatches, or dependency conflicts. The feedback loop is slow, and the gap between development and production is where most time is lost.
Spark Connect closes that gap by introducing a decoupled client-server architecture that changes how your application communicates with Spark. In previous versions, your application code and the Spark driver ran inside the same JVM process, meaning issues in your application code could destabilize the Spark driver and disrupt the entire session. Your application runs as a lightweight client that submits logical plans to a Spark server over gRPC. The server handles execution independently. Your client doesn’t require a local Spark installation, a JVM, and doesn’t need to run on a cluster node. It only needs connectivity to the server endpoint.
With Amazon EMR, this means you can write PySpark from your preferred IDE (VS Code, PyCharm), Jupyter notebooks, Amazon SageMaker Unified Studio Data Notebooks, Amazon Q Developer, or Kiro, and Spark Connect routes your DataFrame transformations and SQL queries to Amazon EMR for execution over a secure connection.You can set breakpoints, inspect variables, and step through transformations while your data is processed on serverless compute, catching issues during development instead of after deployment. There are no clusters to provision, no code to repackage, and no infrastructure to manage.
This architecture also improves session resilience. A client-side failure doesn’t affect the Spark server, so other workloads continue to run without disruption. Spark Connect is an open Apache Spark standard. The same PySpark code works across different Spark backends by changing the connection endpoint.
For example, connecting to Amazon EMR Serverless from your local IDE takes minimal lines of spark code:
from pyspark.sql import SparkSession
spark = SparkSession.builder \
    .remote("sc://<endpoint>:443/;use_ssl=true;x-aws-proxy-auth=") \
    .getOrCreate()
df = spark.sql("SELECT * FROM my_catalog.my_database.my_table")
df.groupBy("category").count().show()
On Amazon EMR Serverless, start a session to retrieve your endpoint and auth token, then connect remotely using the standard sc:// protocol. Every Spark operation executes on Amazon EMR Serverless while your code stays local.
The following video showcases Spark Connect and Variant features together.
This section covers the VARIANT data type and Apache Iceberg V3 support. These two additions improve how you store and query semi-structured data.
Apache Iceberg V3 support
Amazon EMR has supported Apache Iceberg V3 since Amazon EMR release 7.x, introducing capabilities such as deletion vectors and row lineage. With Spark 4.0 on Amazon EMR, that support deepens unlocking capabilities that had a hard dependency on Spark 4.0 itself, including VARIANT column storage and unknown type handling. For teams running data lakehouse workloads, the table format underneath your data determines how efficiently it is stored, how reliably it evolves, and how safely multiple tools can read and write it simultaneously.
What this means for your workloads:
VARIANT and Iceberg working together: VARIANT columns can now be stored natively in Iceberg V3 tables, combining efficient semi-structured data storage with Iceberg’s schema evolution and time travel capabilities. This eliminates the pipeline complexity of upfront schema definitions.
More efficient partitioning: Multi-argument transforms accept multiple input columns in a single partition expression, such as range (order_date, product_category), giving you finer control over data layout. They produce a single composite key instead of separate columns whose cartesian product can explode partition count. The result is less data scanned, faster queries, and lower compute costs for high volume workloads.
Safer schema evolution: Unknown type handling ensures that older readers do not break when newer writers introduce new column types, reducing coordination overhead across teams and tools during upgrades.
Fine-grained access control (FGAC): Column-level and row-level permissions are now available through AWS Lake Formation, giving you governed access control at a granular level across your Iceberg tables, no custom access logic required.
Variant data type
The new VARIANT data type, supported through Apache Iceberg v3, brings native support for semi-structured JSON data directly into Spark SQL. This matters most when you don’t control the data being written because platform teams and shared services often receive data from partners and upstream teams with unpredictable or evolving structures.
Without VARIANT, handling semi-structured data meant accepting real tradeoffs: defining schemas upfront that broke when data evolved, storing everything as strings with heavy parsing costs on every read, or building wide tables with nullable columns that wasted storage on empty fields. The most realistic option was breaking nested structures apart into separate columns before running queries. This ETL step added latency, increased storage costs, and broke every time an upstream team added or removed fields from their data feed.
VARIANT eliminates the process entirely. Data stays nested and is queryable with variant_get(), without a separate ETL pipeline. You ingest without defining a schema first and apply structure at query time.
For example, querying nested fields is now a single expression:
SELECT
    variant_get(payload, '$.user.name') AS user_name,
    variant_get(payload, '$.event.type') AS event_type,
    variant_get(payload, '$.event.timestamp') AS event_timestamp
FROM VALUES
    (PARSE_JSON('{"user":{"name":"Alice"},"event":{"type":"click","timestamp":"2025-03-01"}}'))
AS t(payload)
WHERE variant_get(payload, '$.event.timestamp') > '2025-01-01';
Reduced pipeline fragility: Schema changes no longer break ingestion. Data lands as-is, and you apply structure at query time based on what each analysis needs, without upstream coordination.
Improved query performance: Optimized storage format enables efficient access to nested fields without parsing overhead, so queries run faster even on deeply nested payloads.
Better storage efficiency: Compact encoding eliminates the waste of NULL-heavy wide tables, reducing storage costs for semi-structured data at scale.
VARIANT is especially well-suited where schemas are unpredictable or evolving: IoT and sensor data with device-specific payloads, logging and telemetry with variable event structures, and API responses and webhooks from third-party services where the schema changes without notice.
SQL enhancements
You can now write and maintain Spark pipelines using the same standard SQL you already know, no Spark-specific functions or syntax required. Apache Spark 4.0 expands ANSI SQL compliance so that functions behave consistently, opening Spark to anyone who can write SQL rather than requiring Spark specialists.
Standard SQL syntax such as OFFSET, LIMIT ... OFFSET, and lateral column aliases now work as expected. For example:
-- Standard OFFSET syntax now supported
SELECT id, name
FROM VALUES (1, 'Alice'), (2, 'Bob'), (3, 'Carol'), (4, 'Dave') AS t(id, name)
ORDER BY id
LIMIT 2 OFFSET 1;

-- Lateral column aliases work inline
SELECT amount * 1.1 AS adjusted, adjusted * 0.08 AS tax
FROM VALUES (100.0), (200.0), (350.0) AS t(amount);
Beyond syntax, SQL scripting brings procedural logic directly into Spark SQL. You can now use variables, IF/ELSE conditionals, loops, and multi-statement blocks without switching to Python or JVM-based languages. Before SQL scripting, multi-step workflows (such as ETL logic with conditional branching or iterative data quality checks) required wrapping SQL statements in Python or Scala to handle control flow. SQL scripting removes that dependency. SQL-native teams can author and maintain these workflows entirely in SQL.
Key benefits:
Simplified ETL workflows: Multi-step transformation logic that previously required an external language can now live entirely in SQL, reducing code complexity and making pipelines easier to build and maintain.
Lower barrier for SQL-native teams: Teams that primarily work in SQL no longer need to context-switch into Python or Scala to implement conditional logic or iterative processing. The entire pipeline stays in SQL.
Python advances
Earlier versions of Spark required Python users to step outside Python at two key points: building custom data connectors required Java or Scala, and diagnosing UDF performance lacked built-in visibility. Spark 4.0 addresses both directly, removing the two biggest blockers for organizations where Python is the primary language.
Python Data Source API
With the Python Data Source API, you can build custom, reusable data connectors in Python without any JVM or Scala code. Custom connectors participate in Spark’s query optimization, including predicate pushdown and schema inference. This matters when your data system only has a Python client, or when your team does not have Java or Scala expertise: you can now wrap any custom format or external source as a Spark DataFrame source or sink without leaving Python.
Spark 4.0 also introduces polymorphic Python UDTFs (User-Defined Table Functions) that can return different schema shapes depending on input, with an analyze() method that produces a schema dynamically based on parameters. This is particularly useful for processing varying JSON schemas or splitting inputs into a variable set of outputs.
If you’re ingesting data from a REST API with a Python client, you can implement a custom Spark data source entirely in Python, register it, and use it directly in Spark SQL or the DataFrame API. What previously required a Scala developer and a custom JVM connector can now be built and maintained by your Python team running the pipeline.
Python UDF enhancement
Python UDF profiling provides built-in visibility into execution time, serialization overhead, and memory usage at the individual UDF level without external tooling. Additionally, it enables performance or memory profiling depending on what you need to diagnose.
Arrow-based vectorized UDF support reduces serialization overhead between Python and the JVM using a columnar format, replacing row-at-a-time processing with batch-oriented columnar exchange.
Together, these give you a complete optimization loop: build custom connectors in Python, profile your UDF performance, and optimize with confidence.
Practical benefits for Python teams:
Lower barrier for Python teams: Custom data connectors no longer require Java or Scala knowledge. If your data system has a Python client, you can build a production-grade Spark connector entirely in Python.
Flexible data transformation: Polymorphic UDTFs let your functions adapt to varying input schemas dynamically, reducing the need to write and maintain multiple transformation functions for different data shapes.
Faster UDF optimization: Built-in profiling surfaces exactly where execution time and memory are being spent at the UDF level, replacing guesswork with direct visibility and making performance tuning significantly faster.
Streaming enhancements
This section covers improvements to state management and observability in structured streaming workloads.
Queryable state for structured streaming
Structured streaming jobs maintain state continuously (running totals, session windows, aggregated counts). However, in earlier versions of Spark that state was locked inside the running job. Inspecting it meant stopping the stream or manually parsing checkpoint files. For production workloads, this created real operational risk: teams had no way to verify whether state was correct, corrupted, or drifting without taking the job down.
Time-sensitive applications faced an additional problem: timers in Spark streaming only fired when new data arrived, so a five-minute heartbeat timeout could silently miss its window if no data came in, making applications like heartbeat monitoring and session tracking unreliable by design.
Spark 4.0 changes this. The new transformWithState API provides deterministic timer execution because timers fire on schedule regardless of data arrival patterns. It also delivers automatic state TTL to prevent unbounded growth, schema evolution without restarting from a new checkpoint, and state observability for mid-stream debugging. External systems can now read live aggregated state from a running streaming job without interrupting it. State is accessible as a DataFrame, queryable during development, verifiable in unit tests, and inspectable during production incidents without touching the running stream.
This is backed by three improvements working together. First, the transformWithState operator replaces mapGroupsWithState from earlier Spark versions (which had limited timer support and no TTL-based cleanup). Second, the state data source reader exposes streaming state as a queryable DataFrame. Lastly, RocksDB changelog checkpointing improvements address throughput bottlenecks in high-volume stateful workloads.
Consider a fleet of 100,000 IoT sensors across manufacturing facilities, each requiring an alert within 30 seconds of going offline. The sensors track heartbeat state per device, managing independent timers, handling late data, and cleaning up decommissioned devices at scale had no clean solution in earlier Spark versions. The transformWithState operator handles all of this natively, and queryable state lets your operations team inspect live device state in real time without stopping the stream:
# Timers fire on schedule regardless of data arrival, making heartbeat monitoring reliable
alerts = events_df.groupBy("device_id").transformWithState(
    HeartbeatMonitor(),
    outputStructType=StructType([
        StructField("device_id", StringType()),
        StructField("alert", StringType())
    ]),
    outputMode="Append"
)
Combined with Amazon EMR Serverless, which scales compute automatically based on workload demands, you can deploy stateful streaming pipelines without managing clusters or predicting capacity.
Benefits:
Real-time operational visibility: Live streaming state is now accessible externally without interrupting the job, powering dashboards and monitoring systems that reflect current aggregations.
Faster debugging: State values can be queried directly as a DataFrame, making it significantly easier to diagnose production incidents and verify correctness during development.
Better performance at scale: RocksDB checkpointing improvements reduce bottlenecks in high-throughput stateful workloads, improving reliability for long-running streaming jobs.
What’s new in the emr-spark-8.0 release
Beyond the Spark 4.0 capabilities covered in the preceding sections, the emr-spark-8.0 release introduces infrastructure and runtime changes that simplify how you deploy, patch, and manage Amazon EMR workloads. The release focuses exclusively on Spark, reducing the surface area you need to patch and test.
Fewer components to patch and test
The emr-spark-8.0 release includes Apache Spark 4.0, Apache Iceberg 1.10, Apache Hudi 1.0.2, Delta Lake 4.0, and connectors for Amazon DynamoDB, Amazon Kinesis, Amazon Redshift, and Amazon Simple Storage Service (Amazon S3) (via the S3A connector). Apache Livy and JupyterEnterpriseGateway are available as opt-in components on Amazon EMR on EC2. If your workloads require Apache Flink, Trino, Presto, or other execution engines, you can continue to use Amazon EMR 7.x releases.
Simplified patch management
You can specify emr-spark-8.0.x when creating a cluster or application, and Amazon EMR will automatically select the latest patch version. For example, emr-spark-8.0.1, emr-spark-8.0.2, and so on as patches are released. This “.x” wildcard is supported through AWS APIs and AWS Command Line Interface (AWS CLI). On Amazon EMR on EKS and Amazon EMR Serverless, new jobs automatically run on the latest Amazon Linux patches, so you no longer need to track date-based version tags.
Latest Python, Java, and Scala runtimes
The release ships with modernized runtimes: Python 3.11 as the default, with support for Python 3.12 and 3.13. Java 17 is the default, with Java 21 also available. Both are provided through Amazon Corretto. Scala 2.13 is the supported Scala runtime.
If you are migrating from Spark 3.5 to Spark 4.0, the Apache Spark upgrade agent for Amazon EMR can accelerate your migration by analyzing existing applications and identifying changes needed for Spark 4.0 compatibility. For more information, see the upgrade guidance.
If your workflows use Apache Pig, Apache Oozie, JupyterHub, Apache Zeppelin, or Hue, you can continue to use Amazon EMR 7.x releases. These components are not included in emr-spark-8.0. For interactive Spark development, use Amazon EMR Studio, with Apache Livy and JupyterEnterpriseGateway available on Amazon EMR on EC2.
For the complete list of supported components and configurations, see the Amazon EMR release guide.
Get started
Spark 4.0 is now available across Amazon EMR on EC2, Amazon EMR on EKS, and Amazon EMR Serverless. To begin, choose your deployment model and follow the relevant getting started guide:
Spark 4.0 on Amazon EMR delivers improvements across query validation, semi-structured data handling, Python development, and streaming observability. ANSI SQL mode catches invalid operations at query time rather than silently propagating nulls downstream, and SQL scripting removes the need to context-switch between SQL and Python for complex ETL logic. The VARIANT data type eliminates parsing overhead for semi-structured JSON workloads and can now be stored natively in Iceberg V3 tables with fine-grained access control at the column and row level. Queryable streaming state gives you live visibility into running jobs without interruption, and Spark Connect lets you develop against Amazon EMR from Jupyter notebooks, Amazon SageMaker Unified Studio Data Notebooks, Amazon Q Developer, Kiro, or your preferred IDE without managing cluster connectivity.
The U.S. military has likely been quietly broadcasting codes for its global encryption network using public GPS for nearly 20 years, turning each satellite into a hidden “numbers station,” according to Steven Murdoch…
That means every device that uses GPS has been receiving hidden government information for years, and nobody outside the military knew it until now.
[…]
Murdoch discovered that this particular sentinel was transmitted by all 31 operational satellites within a window of a few hours on May 26, 2011, potentially heralding the activation of a new operational system. He confirmed that this timeline coincided with the rollout of the military’s Over-the-Air Distribution (OTAD) and the Over-the-Air Rekeying (OTAR) by cross-referencing declassified documents, including a 2015 presentation about the dates of the operation.
“There was a perfect match between the timeline and that presentation and the change points that were automatically identified from the data,” Murdoch said. “That was the smoking gun that made me think: This is what it’s for.”
These automated systems replaced the cumbersome manual distribution of cryptographic keying material, allowing military GPS receivers around the world to be rekeyed remotely through satellite broadcasts rather than through onsite procedures.
The Asahi Linux project,
which brings Linux support to Apple Arm-based Macs, has warned
its users not to upgrade to the macOS 27 “Golden Gate”
beta.
Apple has changed how the boot picker and Startup Disk applications
detect valid OS boot volumes. When using either from macOS 27, your
Asahi partition will not be visible! We believe this to be a bug, and
have filed a report (FB22994760).
If you have already upgraded to the beta and noticed that your
Asahi partition has disappeared, do not stress. Your Asahi partition
is still there, and you have not lost any data.
The Asahi Linux installer has been patched to prevent use with
macOS 27 for now, but any users already bitten by the change will
need to use macOS 26 to restore access to Asahi Linux.
The BPF verifier has, in the course of wrestling with the difficult problem of
statically analyzing loops, grown special support for many kinds of loops over its
history, but its fundamental approach to simple for loops has not
changed.
When it encounters a loop, it evaluates it, iteration by iteration, until reaching
an exit condition — a process that can cause the verifier to mistakenly hit the
limit on the number of allowed instructions where a better implementation
would not.
Eduard Zingerman
spoke at the 2026
Linux Storage, Filesystem, Memory-Management, and BPF Summit
about his in-progress work on improving the verifier’s treatment of loops, especially nested
loops.
Wade Woolwine is Senior Director, Product Security at Rapid7.
Rapid7 is excited to join Anthropic’s Project Glasswing, which includes access to Claude Mythos Preview, giving our teams the opportunity to explore how frontier AI can support legitimate, internal defensive security workflows led by experienced security practitioners. Anthropic has now expanded Project Glasswing from its initial cohort to a broader group of organizations, underscoring how quickly this conversation is moving from model capability to industry readiness.
This access comes at a critical moment for security operations. Attackers are moving faster, attack surfaces are expanding, and fragmented security data makes it harder for teams to correlate context and respond at scale. The industry is entering a period where powerful frontier AI models with advanced cyber capabilities require new operating norms, stronger safeguards, and better infrastructure for how vulnerabilities are verified, disclosed, fixed, and deployed.
Frontier AI will raise expectations for how quickly security teams can understand risk, make decisions, and prove that action has reduced exposure. Rapid7 has already been tracking what Project Glasswing means for security leaders: faster discovery is only part of the story, and the real test is how defenders handle everything that follows, from prioritization and remediation to validation, detection, and response. Rapid7’s involvement gives us another opportunity to help shape how advanced LLMs are evaluated and applied to real defensive security work.
The organizations best positioned to benefit from frontier AI will be those that pair advanced models with trusted security context, expert oversight, and mature operational workflows. That is the lens Rapid7 is bringing to our internal exploration of Claude Mythos Preview, and it reflects the same principle that guides our broader AI strategy: advanced technology delivers the most value when grounded in security expertise, operational context, and measurable outcomes.
Exploring Claude Mythos Preview inside Rapid7
In the first week of Rapid7’s access to Claude Mythos Preview , it has already given our researchers, security engineers, and analysts another way to explore how frontier AI can strengthen the security workflows we already rely on. Our use is internal and practitioner-led, with a focus on learning where these models can create defensive value, where human expertise remains essential, and where responsible guardrails are required.
Cybersecurity impact depends on more than model capability. A model may help identify a potential vulnerability and confirm exploitability, but reducing risk requires deeper operational work: understanding affected systems, mapping business context, prioritizing remediation, validating the fix, and ensuring detection coverage is in place. Anthropic’s latest Project Glasswing update reinforces that same shift: as AI makes discovery faster, the next challenge becomes helping the industry scale verification, disclosure, fixing, and deployment.
For more than 25 years, Rapid7 has helped organizations understand risk in real environments and take action against it. Access to Project Glasswing gives us another way to explore how LLMs can support that mission, while reinforcing the same principle that guides our broader AI strategy: advanced technology delivers the most value when grounded in security expertise, operational context, and measurable outcomes.
How Rapid7 is using Claude Mythos Preview internally
Our initial exploration is focused on internal defensive use cases that can help strengthen our product security, improve our research, and create better security outcomes overall. The goal is to understand how frontier AI can support highly specialized security work while helping us evaluate these capabilities with the discipline and caution they require.
In product security, we are exploring how Claude Mythos Preview can support assessment of our code and infrastructure, helping identify potential vulnerabilities, weaknesses, or risky patterns that traditional product security tools may miss. Used responsibly, this type of workflow can help engineering and product security teams reduce risk earlier in the development lifecycle.
We are also evaluating how frontier AI can support vulnerability validation and exploitation analysis in authorized environments. This includes exploring how models can help researchers reason across unfamiliar code, validate severity, build safe proof-of-concept exploit paths, and translate findings into practical remediation guidance.
Our work also includes zero-day research and frontier model evaluation. As models become more capable, security teams need a clear view of where they perform well, where they struggle, and how their outputs should be governed. Evaluating these models against vulnerability discovery and exploitation tasks helps Rapid7 understand their practical value, limitations, and safeguards.
We are also applying frontier AI to red-teaming, detection, and response research. As AI becomes more embedded in enterprise systems and security operations, it also needs to be tested adversarially. Frontier models can help practitioners explore attack paths, challenge assumptions, enrich investigations, reduce noise, and support faster decisions when paired with the right telemetry and human judgment.
Why frontier AI needs cybersecurity expertise
The industry conversation around frontier AI often starts with what models can find, especially as they become more capable at reasoning across large codebases and surfacing potential flaws. However, security teams reduce risk by knowing which findings matter, acting on them quickly, and proving that exposure has been reduced. As we’ve written before, the challenge is turning faster discovery into faster action, which requires teams to understand their environment well enough to apply emerging models with intent.
That is why expertise matters. AI can help accelerate parts of the workflow, but security impact comes from connecting discovery to validation, remediation, detection, and response. Without that connection, faster discovery can create more volume for teams that are already stretched. With the right context and operating model, it can help defenders move earlier and with more confidence.
This is the lens Rapid7 brings to Project Glasswing. Our teams are exploring these capabilities as practitioners who understand the real-world pressures customers face: incomplete asset visibility, fragmented ownership, growing vulnerability backlogs, expanding identity and cloud risk, and alert volumes that can outpace human-only workflows.
From frontier AI adoption to preemptive security
Rapid7’s broader strategy is focused on helping organizations move toward preemptive security, where exposure management, and detection and response work together to disrupt attackers before risk becomes impact. As AI accelerates both attacker activity and defender workflows, security teams need more than faster vulnerability discovery. They need rich contextual prioritization, trusted AI-driven decision making, and mitigations beyond patching so they can prioritize, validate, and respond at speed and scale.
The next phase of cybersecurity will require speed, scale, and consistency across the entire security lifecycle. The industry challenge is expanding from finding vulnerabilities to the harder operational work of verifying, disclosing, fixing, and deploying remediations. While vulnerability and alert volumes will increase, cyber resilience depends on what happens both before and after discovery. In a reality where vulnerabilities can be exploited or chained together quickly, teams need the ability to prioritize exposures that have real impact, investigate quickly with full context, and keep operating in the face of disruption.
Preemptive security also means mitigation must extend beyond patching. Timely patching at scale is not always practical, so security teams need the ability to intercept and disrupt exploit paths through virtual patching, controls management, and rapid response actions. That is why Rapid7 is approaching frontier AI through the lens of preemptive security. Our AI foundation is built around unified security data and shared operational context across exposures, assets, identities, behavior, and activity, and transparent AI decisions validated by experts and governed by policy-driven workflows.
Access to Claude Mythos Preview is another step in exploring how LLMs can help security teams move earlier, act faster, and build more resilient programs without losing the human expertise and accountability that effective security requires. Anthropic also unveiled Fable 5 today, its first publicly available Mythos-class model, which will only further underscore the importance of having an integrated, AI-ready security plan that can turn this new benchmark of visibility into meaningful security improvement.
The slightly more than a dozen talks were symbolically framed
between the opening keynote by systemd creator Lennart Poettering
and the closing talk by Jorge Castro, initiator of the Universal
Blue project, from which the modern Linux systems Bluefin and
Bazzite emerged. Both Castro and Poettering call for a fundamental
rethink of how Linux operating systems are delivered but pursue
different approaches.
When I first started working with Zabbix in banking and telecommunications over a decade ago, the workflow was always the same: something breaks, an alert fires, you open the dashboard, you diagnose, you fix. Every step required a human sitting in front of a screen reading charts and making decisions.
Then AI came along, and I started asking a simple question. What if I could just talk to my infrastructure and get answers? That question led me down a path from Telegram bots to WhatsApp integrations, and then from chatbots with custom modules to a full mobile application on the Google Play Store.
Along the way, I discovered that the real challenge is not connecting AI to Zabbix – it is defining how they should communicate. That is where protocols like MCP and WebMCP come in, and why they matter for anyone working in infrastructure monitoring today.
Phase 1: Just let me ask a question
The first thing I wanted was simple – to ask about my infrastructure in natural language and get a useful answer. Not parse JSON, not read raw metrics, just ask.
My early integrations used Telegram and WhatsApp as the interface. The AI (initially custom modules, later Gemini) would receive a question like “What alerts do I have right now?”, query the Zabbix API, and respond in plain language. It worked, but it was limited – the AI could only answer what I had explicitly programmed it to answer.
Phase 2: MCP gives AI a standard way to talk to Zabbix
The Model Context Protocol (MCP) developed by Anthropic solves a fundamental problem – how do you give an AI model structured access to external tools and data sources without reinventing the wheel every time?
Before MCP, every AI-to-Zabbix integration was custom. You wrote a script, parsed the API response, and formatted it for the model. If you wanted to switch from one AI provider to another, you started over. MCP standardizes this. You build an MCP server once, and any compatible AI client (Claude Desktop, Gemini CLI, or others) can use it.
The Zabbix community has already embraced this. There are now multiple open source MCP servers for Zabbix available on GitHub. You can request things like:
“Show me all unacknowledged problems with severity High or above”
“Create a maintenance window for host db-01 for 2 hours”
“What changed in the last 24 hours?”
Best of all, you can do it all through natural language and through a standardized protocol.
In my own environment, I set up a WebMCP server that connects a FastAPI backend to the Zabbix API, exposing structured endpoints for hosts, alerts, and problems. The server runs 24/7 alongside my Zabbix instance on a dedicated Proxmox node.
With a simple query to the WebMCP server, I can retrieve the full list of monitored hosts, check active problems, view recent alerts with their severity levels, and get a usage summary – all through clean, structured JSON responses that any AI client can consume.
The WebMCP server exposes structured endpoints for health monitoring, usage tracking, and Zabbix data.A live query to the WebMCP server returning real Zabbix alerts in structured JSON.
Phase 3: WebMCP becomes the interface
Looking ahead, WebMCP is a proposed browser standard (co-created by engineers at Google and Microsoft) that lets websites declare their capabilities as structured tools that AI agents can call directly in the browser.
Think about what this means for Zabbix. Today, the Zabbix frontend is a web application that humans navigate – click on hosts, drill into triggers, check graphs, acknowledge problems. An AI agent trying to use the Zabbix frontend would have to take screenshots, interpret the UI, and guess where to click slow, fragile, and expensive.
With WebMCP, the Zabbix frontend could declare: “Here is a tool called get_active_problems. It needs a severity filter. Call it and I will return structured results.” The AI agent calls the function, gets clean data, and acts on it. No screenshots, no DOM scraping, no guessing.
The key differences from traditional MCP:
WebMCP runs inside the browser tab, not on a separate server. No additional infrastructure to deploy.
It inherits the user’s existing session the same SSO, the same cookies, the same role-based permissions. No separate auth layer.
Tools are contextual on a problems page, the agent sees problem-related tools. On a host configuration page, it sees host tools.
Chrome 146 already ships WebMCP experimentally. Broader stable release in Chrome is expected by the end of 2026.
To explore this concept in practice, I set up a WebMCP server in my environment, connected to my Zabbix instance.
The server exposes Zabbix data through a browser-based interface, allowing agents to query hosts, alerts, and problems directly from the browser tab.
The server itself is monitored by Zabbix, so I can track its resource consumption and ensure it does not impact the rest of the infrastructure closing the loop between the tool and the platform it extends.
A WebMCP demo page displaying live Zabbix alerts fetched through the browser-based backend.A large selection of dashboard widgets enable Zabbix users to create Windows dashboards for different use cases
Why this matters for mobile monitoring
Today, if you want AI-assisted Zabbix monitoring on your phone, you need a dedicated app that connects to the Zabbix API, handles authentication, processes data, and presents it through an AI layer. That is what I built. It works, but it requires significant development effort.
WebMCP opens a different path. Imagine opening the Zabbix frontend in your mobile browser and having an AI assistant that can interact with it natively – no app required, no separate server, just the browser and the protocol. The assistant inherits your Zabbix session, sees only what your user role permits, and can help you triage incidents, assign tasks, and generate reports all through the same web interface you already use.
We are not there yet. WebMCP is still in early preview, and the Zabbix frontend needs to implement the protocol. But the architectural direction is clear. The web is becoming agent-ready, and monitoring tools will benefit enormously from this shift.
The practical roadmap
If you work with Zabbix and want to start integrating AI today, here is how I see the progression:
Right now: Use MCP servers to connect AI assistants to the Zabbix API. The open-source options are mature, support Zabbix 7.x (and experimentally 8.0), and work with multiple AI clients. Start with read-only mode to explore safely.
Near term: Build purpose-specific integrations. Whether it is a mobile app, a chatbot, or a custom dashboard, the Zabbix API combined with models like Gemini or Claude can deliver real value AI-generated weekly reports, intelligent alert triage, natural language infrastructure queries.
Coming soon: Keep an eye on WebMCP. As it matures and browsers ship stable support, it will become the lowest-friction way to add AI capabilities to any web-based monitoring tool. The sites that become agent-ready first will have a compounding advantage.
Closing thoughts
The infrastructure monitoring world is at an inflection point. We have been watching dashboards and reading alerts for decades. The protocols are now emerging – MCP for backend integrations, WebMCP for browser-native interactions that will let our infrastructure genuinely talk back to us.
If you are still running Zabbix 7.0 or previous, this is the year to migrate. Older versions are losing support, and the newer API capabilities in 7.0+ are what make these AI integrations possible. Zabbix offers certification programs through Zabbix Academy, and their partner network can assist with migrations.
Greg Kroah-Hartman has announced the release of the 7.0.12, 6.18.35, and 6.12.93 stable kernels. Each contains
important fixes throughout the tree. Users are advised to upgrade.
A few weeks ago, we wrote about Project Glasswing and what we observed when we pointed cyber frontier models at our own code. Since then, we’ve seen that the part of the post that has resonated most deeply is the argument that the architecture around the vulnerability matters more than the speed of the patch.
In the conversations we’ve had with CISOs and security teams since, the questions have been consistent: what does our architecture actually look like, what should we monitor for, where do we start, and how can Cloudflare help?
Before getting into the details: the architecture below is built almost entirely from Cloudflare’s own products, because Cloudflare security is customer zero for the security products we build. The Cloudflare stack already exists in front of our code, employees, and customer-facing applications. If you’re a Cloudflare customer, every layer below is available to you today. If you’re not, the principles still apply to whatever stack you’ve built.
What a cyber frontier model actually changes
In the previous post, we showed how a cyber frontier model like Mythos changes the attacker’s timeline. It can find vulnerabilities, reason through exploit chains, and generate working proofs faster than earlier models. While models like Mythos do not change the shape of an intrusion — reconnaissance, initial access, lateral movement, persistence, and exfiltration still have to happen — the difference is in the speed and scale. When pointed at the open web, a model can find and hit low-hanging fruit quickly. Against a hardened target, it still has to probe, and adapt, and it often produces more noise than a careful human operator would.
Discovery, exploit chain construction, and proof-of-concept generation used to be the gating constraints on producing a working attack. A frontier model handles all three in a fraction of the time. Work that used to be slow and methodical is now fast and indiscriminate.
While AI is accelerating how fast developer teams at Cloudflare and many other companies can ship code, the security team’s work has not compressed the same way. An attacker only needs one opening to get in, while security teams need to find and close them all. Writing a fix, regressing it, and shipping it without breaking the code around it has constraints that AI doesn’t remove. We learned this the hard way when we let an AI coding assistant write its own patches against our own bugs, as we described at the end of the previous post. Some of those patches fixed the original bug while quietly breaking something else the code depended on.
As these models become more competent and capable, our main focus from a threat standpoint comes down to three things. Each one shapes the architecture we walk through in the rest of this post.
The first is the speed of discovery. Frontier models make it easier to search large bodies of public code, including the open-source libraries that many companies depend on. That does not mean every bug in a library is exploitable, or that library bugs are where most vulnerabilities live. Exploitability still depends on how the code is used, whether attacker-controlled input can reach the vulnerable path, and the protections that sit around it. But widely used open-source libraries and frameworks give attackers a shared surface to study at scale. When a real, reachable vulnerability exists there, a model can help find it, reason about possible exploit paths, and generate proof-of-concept variants faster than maintainers and defenders can review every downstream use. The gap between when an attacker discovers a vulnerability and when defenders learn it exists is what worries us most. If you are not running these models against your own code, it is safe to assume someone else is.
The second is exploitvolume and adaptation. A model can produce thousands of variations of a single exploit and run reconnaissance at the same scale. All that volume gives an attacker an advantage, but it won’t necessarily get them past signature-based detections. Many of those iterations will have the same underlying signature, so a rule that catches the first one will catch the rest. Adaptation is how they will get past signature-based detections. Ask a model to show you a SQL injection, and it will return a textbook example. Tell it there is a WAF in the way, and it will start probing, learning what gets blocked, and rewriting the payload until it can slip past the rule blocking it.
The third is the impact when a vulnerability is inevitably exploited. No architecture catches everything. After the vulnerability is exploited, the question we ask ourselves is: where can the attacker get to with one identity, one path, or one credential, before something else stops them? If the answer is “anywhere they want,” the vulnerability was never the problem. The architecture around the vulnerability was.
Cloudflare’s superpower: visibility
We see roughly a fifth of the world’s web traffic and that traffic tells us, in real time, which payloads are mutating, which patterns are picking up, and where attacker tooling is moving next. Two teams turn that visibility into defense.
First is Cloudforce One, our threat intelligence, research, and operations team, which sits within the Cloudflare security organization. They turn what we see across the network into insights the rest of the stack can act on: tracked adversaries, emerging campaigns, and indicators of compromise (IOCs). The hard part of this work was never knowing what is malicious — it was the delay in mitigation. Knowledge of a new threat normally has to travel from a threat report, into a feed, and then into a company’s defense before it can be used to block anything. Attackers have learned to move faster than that. Our network closes that gap: Cloudflare customers can now use Cloudforce One threat intelligence directly within the WAF to block high-risk traffic.
Second is the team that owns the WAF engine that does the actual detecting: the managed rulesets that run in front of our own properties and are available to every Cloudflare customer, the machine learning behind WAF Attack Score, and the relationships that sometimes let us ship a rule before a CVE is publicly disclosed. The team is globally distributed and moves fast, releasing rules within hours of a proof-of-concept of an attack becoming known. Once a detection is deployed, it reaches our entire network, along with every Cloudflare customer, in under 30 seconds. React2Shell is a recent example: a managed WAF rule was protecting our own properties, and everyone else’s on Cloudflare, hours before the official advisory was published.
The scoring layer, the defenses we put in front of the application, and the containment around the vulnerability all build on what these two teams see.
Scores over signatures
Signature-based defenses were built for a world where novel exploits were scarce and variations took weeks. Cloudflare’s traditional SLA from a fresh proof-of-concept to a live, deployed rule has been 12 hours. With the advent of frontier models, this is not good enough anymore. Detections need to be in place before a CVE is discovered. This is why we layer ML-based detection in front of the traditional signature-based WAF.
The model is trained on a large body of past attack traffic, and it catches new variants of vulnerabilities before they’re publicly known. A novel SQL injection or remote code execution chain is almost always a rearrangement of attack shapes the model has seen before, even when the specific exploit is brand new. We run the model on every request and assign a WAF Attack Score between 1 and 99, based on how closely the request resembles those underlying shapes, not against a list of known-bad signatures. The lower the score, the more aggressively we treat the request. That score determines whether we let the request through. We apply a similar scoring methodology to AI prompts with AI Security for Apps: rather than check each prompt against a list of known malicious prompts, we score how closely a prompt resembles an actual attack.
The architecture around the vulnerability
Those capabilities only matter once they’re stacked in front of an application, and the first layer in our defense-in-depth approach is the WAF. Anything that matches a known-bad pattern gets dropped before it reaches the application, which clears the bulk of the obvious traffic and lets the more specialized layers below focus on what’s left.
On the API surface, we run a positive security model through API Shield. Instead of trying to anticipate every bad request, we describe what a valid request to each API looks like, either from the API’s own definition or learned from our real traffic, and anything that doesn’t fit doesn’t get through. This neutralizes the advantage of frontier AI models: because we only permit validated traffic, generating thousands of new attack variations fails to bypass the system.
Cloudflare’s layered architecture
Bot Management catches probing traffic on our network before frontier models can build a map. It scores every request on how likely it is to be automated, using the same signals across our whole network: how the client behaves, whether it looks like a real browser, and whether the connection matches a known-bad pattern. An attack only lands if it can find a soft spot.
Zero Trust Network Access is used for every internal application. The implicit trust of being inside the network is replaced with explicit per-request identity and policy for every employee accessing every tool. The value of this was clear when one of our engineers shipped a misconfigured tool. A flat network would have exposed everything on the same segment, but in our deployment, the exposure stopped at the tool itself. We built Require Access Protection afterwards so newly deployed or misconfigured applications can’t be reachable before an access policy is in place.
IdP Federation makes that secure by default posture easier to keep consistent across every Cloudflare account — which becomes even more necessary when more people are shipping internal tools quickly. Instead of asking each team to wire up SSO separately, we configure our identity provider (IdP) once and share it across the organization. New accounts get SSO automatically, recipient-side IdP connections are read-only, and Access policies in each account still evaluate the resulting identity as part of the normal request flow.
MCP Server Portal gives teams a controlled way to connect AI agents to enterprise systems. Agents access MCP servers that are centrally managed through a single portal, with every action logged. That way when an agent acts on someone’s behalf, we know what it did, what it touched, and whether it should have been allowed to. The full picture of how we built it is in our post on enterprise MCP.
AI Gateway runs in front of our internal AI tools the same way AI Security for Apps runs in front of customer-facing AI features, with the same scoring and the same visibility. Inside the company, the visibility piece is more useful than the blocking, because we needed to see what engineers were actually building before we could write meaningful policy on it.
Where your teams can start
Frontier models can help attackers find vulnerabilities, adapt payloads, and move faster, but they still have to pass through the layered defense you deploy in front of your application. That is where teams should start:
Put inspection in front of public applications.
Define what valid API traffic looks like.
Use bot detection to limit automated probing.
Require identity and access policy before any internal tool is reachable.
For AI and agentic systems:
Route model traffic through a gateway.
Keep agents connected through approved MCP servers.
Log what they do.
The goal is to make sure that when one layer misses, the next layer limits what the attacker can see, reach, or change.
That is the point of the architecture around the vulnerability: to limit the scope of an attack. The vulnerability may be what starts the attack, but the architecture determines how far it can go.
How do we know this approach works?
Plenty of security stacks look impenetrable on a whiteboard but fall over in practice. That is why we test ours continuously, both at the perimeter and inside our environment, with our red team involved across both.
At the perimeter, frontier models are one tool we use to test our application security stack as an adaptive attacker. These models sit alongside the rest of our red team and detection workflows including: manual testing, threat intelligence, observed traffic patterns, proof-of-concept analysis, and signals from our own network. Together, those inputs help us decide where to aim testing: newly launched products, recently changed surfaces, and the paths an attacker is most likely to probe first. The most important part is the process that follows. When something gets through, we identify the gap, use the right mix of tools to understand it, write the rule or mitigation, ship the update, and test again to make sure the gap is closed.
Inside the environment, our red team starts from the assumption that the perimeter has already failed. They look at what has changed, where sensitive systems carry risk, and whether one compromised identity, path, or credential can reach farther than it should. When we change the architecture based on what they find, they run the scenario again against the new version to confirm the gap is actually closed.
We confirm that this architecture is working by continuously testing its behavior during failures, rather than relying on the perfection of individual layers.
If your team is working on the same problems and would like to compare notes, reach out to us at [email protected].
This week, the AWS IoT Device SDK for Swift reached general availability. As a member of the Swift Server Workgroup (SSWG), this one caught my attention. The SDK brings production-ready MQTT 5 connectivity, Device Shadow, Jobs, and fleet provisioning to Swift developers on macOS, iOS, tvOS, and Linux.
I’m curious to see what you will build with it. Swift on the server has matured over the past few years, and now it reaches IoT devices too. This connects to a broader trend of running Swift at the edge. WendyOS, for example, is an open-source operating system for physical AI that offers first-class Swift support for deploying apps to NVIDIA Jetson and Raspberry Pi hardware. Between server-side Swift, IoT, and edge computing, the language is showing up in places that would have surprised most people a few years ago.
Now, let’s get into this week’s AWS news.
Headlines Amazon RDS for SQL Server supports Bring Your Own Media — Customers who migrate SQL Server applications from on-premises environments can now reuse their existing Microsoft SQL Server licenses, including Software Assurance, through Microsoft’s License Mobility program on Amazon RDS. BYOM is integrated with AWS License Manager for tracking license usage and compliance. Read more.
Amazon Cognito now supports multi-Region replication — You can now synchronize user and machine identity data, including credentials, user pool configurations, and federation setups, to a secondary user pool in a standby Region in near real-time. In the event of a disruption in the primary Region, signed-in users continue accessing their applications without re-authenticating, and registered users can sign in with their existing credentials. Multi-Region replication is available as an add-on for user pools in Essentials or Plus feature tiers across 16 Regions. Read more.
GPT-5.5, GPT-5.4, and Codex from OpenAI are now generally available on Amazon Bedrock — You can now use GPT-5.5 and GPT-5.4 in production workloads on Amazon Bedrock and build with Codex for AI-powered software development, with the same security, governance, and operational controls you already use across AWS. GPT-5.5 is the most capable model from OpenAI, excelling at agentic coding, data analysis, and multi-step autonomous tasks. Codex is available through the Codex App, the Codex CLI, and IDE integrations with Visual Studio Code, JetBrains, and Xcode. Pricing matches OpenAI first-party rates, and usage counts toward existing AWS commitments. Read more.
Last week’s launches Here are some launches and updates from this past week that caught my attention:
Amazon Bedrock adds CloudWatch metrics for OpenAI- and Anthropic-compatible APIs — You can now monitor inference traffic to the bedrock-mantle endpoint with CloudWatch metrics, including inference counts, input and output token totals, and client error counts at account, project, model, and project-and-model granularity.
AWS Step Functions adds AgentCore-powered agentic reasoning step — You can now add AI agent reasoning steps to your Step Functions workflows through an integration with the managed harness in Amazon Bedrock AgentCore. Run multiple agents in parallel or sequence, add human approval, and trace every agent decision.
Amazon EKS and Amazon EKS Distro now support Kubernetes version 1.36 — Kubernetes 1.36 promotes User Namespaces to GA, introduces Mutating Admission Policies, In-Place Pod-Level Resources Vertical Scaling, and Resource Health Status reporting. Available in all Regions where EKS is available.
Amazon Quick now supports VPC connectivity for MCP connections — Enterprise customers can now connect privately hosted Model Context Protocol (MCP) servers to Amazon Quick through VPC, enabling secure access to proprietary applications and internal tools without exposing them to the internet.
Read all about the latest AWS security features, compliance updates, and hands-on resources in our new, monthly digest posts. You’ll find expert blog posts, new service capabilities, code samples, and workshops.
AWS Security Blog posts
This month’s AWS Security Blog posts covered AI security, network protection, identity management, compliance frameworks, and supply chain security. Read on for practical guidance on securing agentic AI workflows, filtering network traffic by category, defending against supply chain attacks, and more.
Enabling AI sovereignty on AWS Author: Stéphane Israël | Published: May 12, 2026 Learn how AWS delivers control and choice across the AI stack to help customers meet digital and AI sovereignty requirements.
Securing open proxies in your AWS environment Author: Dodd Mitchell | Published: May 4, 2026 Learn to identify and secure open proxies in your AWS environment to prevent abuse, protect your IP reputation, and control costs.
Introducing AI traffic analysis dashboards for AWS WAF Authors: Christopher Jen, Eitav Arditti, Kaustubh Phatak | Published: May 5, 2026 A new dashboard providing visibility into AI bot and agent activity including bot identification, intent classification, and access pattern analysis.
Authors: Frank Phillis, Lawton Pittenger | May 28, 2026
Learn to migrate your centralized AWS Network Firewall deployment to a AWS Transit Gateway-attached model, eliminating the inspection Amazon VPC and enabling flexible cost allocation.
Announcing the ISO 31000:2018 Risk Management on AWS compliance guide Authors: Jesse McMahan, Akanksha Chaturvedi, Mayur Jadhav, Juan Rodriguez, Sana Rahman | Published: May 1, 2026 A compliance guide providing practical guidance for establishing a risk management program using ISO 31000:2018 principles in AWS environments.
New compliance guide available: ISO/IEC 42001:2023 on AWS Authors: Abdul Javid, Amber Welch, Muhammad Sharief, Jonathan Jenkyn, Satish Uppalapati | Published: May 6, 2026 A compliance guide providing practical guidance for designing and operating an Artificial Intelligence Management System (AIMS) using AWS services.
Governing infrastructure as code using pattern-based policy as code Authors: Guptaji Teegela, Paul Keastead | May 19, 2026 Learn to use Open Policy Agent (OPA) in CI/CD pipelines to validate AWS infrastructure changes before deployment using recurring control patterns.
Detecting and preventing crypto mining in your AWS environment Authors: Jason Palmer, Nadia Mahmood | May 13, 2026 Learn to use Amazon GuardDuty to identify and mitigate cryptocurrency mining threats in your AWS environment with a multi-layered defense strategy.
This month brings 8 new AWS samples spanning application security, data protection, infrastructure security, governance, and AI security. From AI-powered security agents on Amazon Bedrock AgentCore to centralized AWS Config monitoring at scale, these repositories help you implement security best practices across your AWS environment.
Security review assistant Learn to deploy a multi-agent system on Amazon Bedrock AgentCore that automates Deliverable Security Reviews by combining architecture analysis, IaC code review, ASH vulnerability scanning, and compliance assessment into a single pipeline.
AWS Security Agent Recorder Learn to use a cross-browser extension that records the unique domains your web app contacts and auto-fills them into the AWS Security Agent penetration test configuration.
Data Protection
KMS access audit Learn to resolve and report who can use your AWS Key Management Service (KMS) keys across IAM policies, key policies, and grants, with IAM Identity Center resolution to identify the humans behind SSO roles.
Centralized AWS Config CI monitoring with Amazon CloudWatch Learn to centrally monitor AWS Config Configuration Item recording across all accounts in an AWS Organization using CloudWatch Cross-Account Observability, with dashboards showing top resource types, per-account volume, and conformance pack compliance.
CloudFormation Guard security analyzer Learn to deploy an AI agent powered by Amazon Bedrock AgentCore that scans CloudFormation resource documentation, identifies security-critical properties with risk levels, and generates ready-to-use cfn-guard 3.x rules for your CI/CD pipeline.
This month brings 1 new AWS Labs repository focused on governance, helping research institutions deploy secure, tagged infrastructure with self-service access and multi-account controls.
May 2026 shows AI security maturing from model-level controls to full-stack protection of agentic workflows. The posts and samples provide patterns for policy-based authorization with Cedar, network traffic filtering by category, and cross-account compliance monitoring. The security bulletins address vulnerabilities in SDKs, drivers, and developer tooling. Each resource includes deployment steps or runnable code so you can validate in your own environment before adopting. Subscribe to the AWS Security Blog RSS feed to receive updates as they publish, and revisit this digest monthly for a consolidated view of what changed and what to act on.
If you have feedback about this post, submit comments in the Comments section below.
To provide the best experiences, we use technologies like cookies to store and/or access device information. Consenting to these technologies will allow us to process data such as browsing behavior or unique IDs on this site. Not consenting or withdrawing consent, may adversely affect certain features and functions.
Functional
Always active
The technical storage or access is strictly necessary for the legitimate purpose of enabling the use of a specific service explicitly requested by the subscriber or user, or for the sole purpose of carrying out the transmission of a communication over an electronic communications network.
Preferences
The technical storage or access is necessary for the legitimate purpose of storing preferences that are not requested by the subscriber or user.
Statistics
The technical storage or access that is used exclusively for statistical purposes.The technical storage or access that is used exclusively for anonymous statistical purposes. Without a subpoena, voluntary compliance on the part of your Internet Service Provider, or additional records from a third party, information stored or retrieved for this purpose alone cannot usually be used to identify you.
Marketing
The technical storage or access is required to create user profiles to send advertising, or to track the user on a website or across several websites for similar marketing purposes.