We’ve been thinking deeply about enterprise security. The operating model that served us for the past decade (collect telemetry, store it, query it, build dashboards to watch it) is no longer keeping pace. We need to shift to the new world: telemetry, context, reasoning, and actions. An approach that produces outcomes. The latest cybersecurity frontier models further made this shift urgent. Models like Claude Mythos can now find software vulnerabilities and reason through complex attack paths at machine-speed, leading to an exponentially increasing backlog of vulnerabilities.
Introducing AWS Continuum for code vulnerabilities
Today, we’re announcing AWS Continuum for code vulnerabilities, now available in gated preview. Continuum for code vulnerabilities addresses the full lifecycle of a code vulnerability at machine speed: from discovery through actions. It reasons over your environment, confirms what is real, and drives toward resolution. It’s model agnostic, using multiple frontier models where each performs best, and is built to incorporate the latest and most capable models as they emerge.
Continuum is built on lessons learned from running security across AWS and Amazon.com. Securing businesses that operate in different industries required a system that understands business context rather than applying generic rules uniformly.
How it works
Continuum for code vulnerabilities reasons over your full environment. This context includes structured data already living in Amazon Web Service (AWS) (your infrastructure, permissions, network topology, code) and the unstructured data that captures how your organization operates and your risk profile (your documents, communications, business priorities).
Continuum for code vulnerabilities operates in four continuous phases.
Discovery: Security teams tackle a backlog of vulnerabilities, and many are already using frontier models to find more. Continuum starts by ingesting that existing backlog and performing its own vulnerability scan of your environment. This creates a more comprehensive view of vulnerabilities and the associated attack paths.
Prioritization: Continuum uses context to evaluate, enrich, and prioritize every finding. Is the affected component deployed, is it reachable, is it in a production path, and what would the business impact be if exploited? The result is an evidence-backed list of priorities, allowing Continuum and your team to focus on what’s most important.
Validation: Continuum validates findings to surface false positives before they waste your team’s time. It contextualizes vulnerabilities against your environment. It then constructs working exploit examples in a sandboxed environment that provide concrete, reproducible evidence of the issue.
Mitigation and remediation: Continuum assesses existing defenses around a validated issue, including blocking and compensating controls along with detection mechanisms. It then draws on its understanding of the codebase, context, and findings to recommend mitigation or remediation of the vulnerability with a network change, policy change, or code patch. The patch recommendation is validated using the same system that confirmed the vulnerability. It also provides blast radius visibility and rollback paths where feasible.
This is just the beginning. We’re starting with code (1st and 3rd party) and then expanding to other aspects of security.
Trust is graduated
Continuum starts in learn mode with a human in the loop. Every recommendation includes the reasoning behind it. As you gain confidence, you can graduate Continuum to enforce mode, enabling remediation that can be increasingly automated based on categories and risk profiles you define.
Continuum capabilities
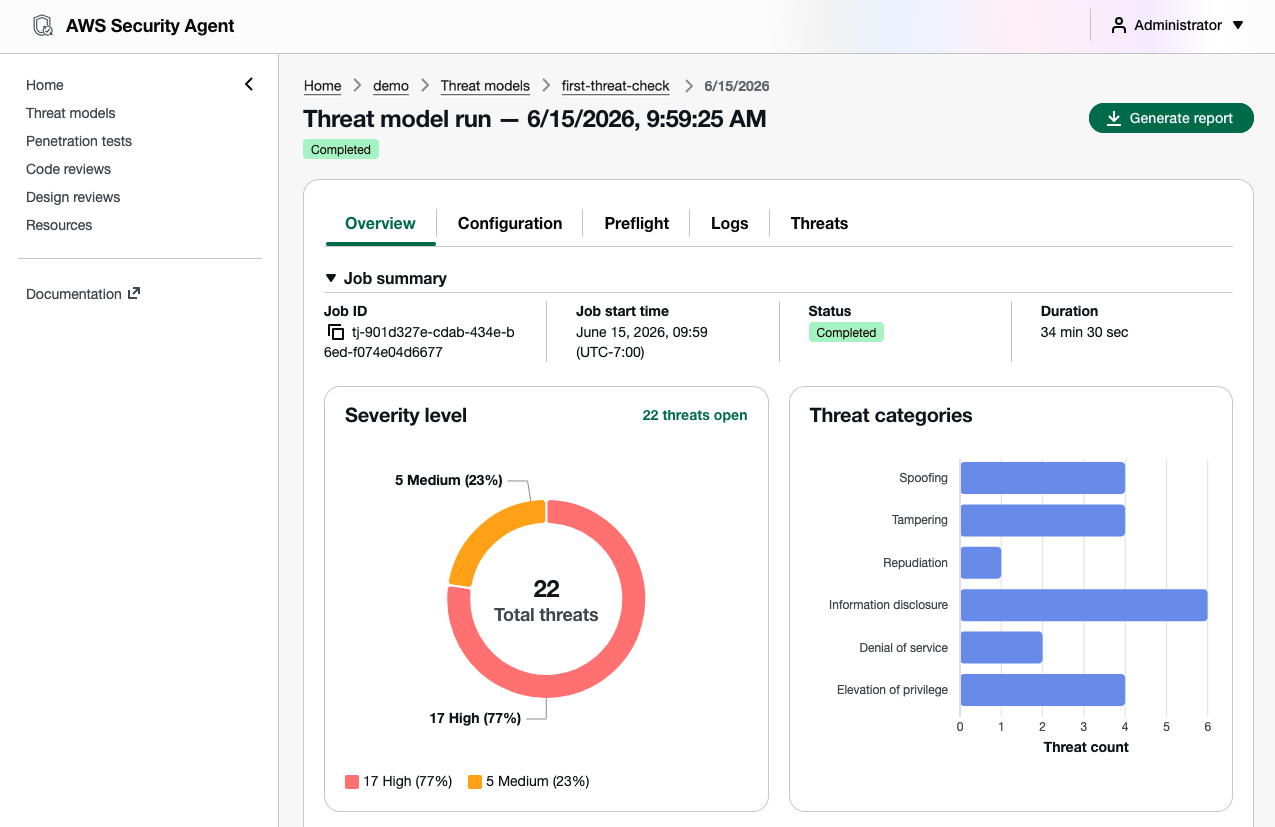
In addition to Continuum for code vulnerabilities, Continuum includes capabilities you might already know. The AWS Security Agent penetration testing and code scanning functionality is now part of Continuum as Continuum pen testing and Continuum code scanning (Preview). We’re also launching Continuum threat modeling in preview, which automatically generates comprehensive threat models from design documents or source code and outputs results in STRIDE format. These capabilities serve as detection and analysis sources that feed into the broader Continuum loop of discovery, prioritization, validation, and remediation.
Getting started
We’re working with customers across financial services, automotive, and technology to shape AWS Continuum. Customer feedback confirms the direction: security teams want tools that earn trust and take action.
AWS Continuum for code vulnerabilities is available in gated preview. Sign up to request access at AWS Continuum.
If you have feedback about this post, submit comments in the Comments section below.
The Python Software Foundation blog has a post
with a summary of the security-related content at PyCon US 2026 with links to
slides from important sessions. The recordings will be published to
the PyCon US channel on
YouTube, and the post will be updated with links to those videos as
they are made available.
Today, we’re announcing Amazon Bedrock Managed Knowledge Base, a new set of capabilities that enables developers to build enterprise-grade generative AI applications with their proprietary data in minutes. Organizations building agentic AI applications need secure, reliable, and up-to-date access to enterprise-wide data to deliver accurate, fast, and trusted outcomes. Managed Knowledge Base abstracts away the complexity of building and managing retrieval-augmented generation (RAG) pipelines, allowing developers to focus on business outcomes rather than infrastructure management.
Developers building knowledge bases for their agents face three key challenges today:
Connecting to enterprise data – Enterprise knowledge lives across disparate systems with different content types, access control lists, and document formats. Building and maintaining custom connectors for each source adds complexity that slows down development.
Optimizing RAG accuracy – Best practices for retrieval-augmented generation keep evolving. Developers need to experiment with different parsing strategies, chunking approaches, embedding models, and agentic retrieval behaviors to get accurate answers from their data.
Managing infrastructure at scale – Organizations need to serve large knowledge bases with millions of documents, or manage thousands of smaller knowledge bases across teams. Both patterns require reliable infrastructure, security enforcement, and cost control.
These challenges require developers to repeatedly perform undifferentiated work instead of focusing on their applications.
Amazon Bedrock Managed Knowledge Base addresses these challenges by abstracting away the multiple infrastructure components developers traditionally have to assemble and maintain themselves (storage, retrieval, embeddings, re-ranking, and foundation model selection) into a single managed primitive. By default, the service automatically selects and manages a default embeddings model, re-ranker model, and foundational model on your behalf, so you can get up to speed quickly without needing to pick or maintain one yourself. On top of this managed foundation, three core innovations further improve ease of use and accuracy:
Native data connectors – Six pre-built ingestion connectors that natively pull enterprise data and permissions from SaaS applications, eliminating the overhead developers face in managing application-specific requirements. At launch, we support Amazon S3, SharePoint, Confluence, Web Crawler, Google Drive, and OneDrive.
Smart Parsing – Different content types and sources require different approaches to achieve accurate retrieval. Smart Parsing handles this complexity automatically, selecting the right parsing strategy for each data type and connector to provide the highest accuracy for your agents.
Agentic Retriever – Optimized for complex queries that require multiturn, multihop retrieval within a single knowledge base or across multiple knowledge bases. Agentic Retriever automatically infers end-user intent and draws relevant context from institutional knowledge spread across data sources and modalities.
With just a few lines of code, Amazon Bedrock Managed Knowledge Base automatically manages and scales the end-to-end RAG pipeline that powers your enterprise knowledge agents. For agent builders, it’s available as a pre-built target type in Amazon Bedrock AgentCore Gateway, reducing integration to a few lines of code, auto-generating role-based permissions, and providing observability and evaluation metrics in the AgentCore Observability dashboard.
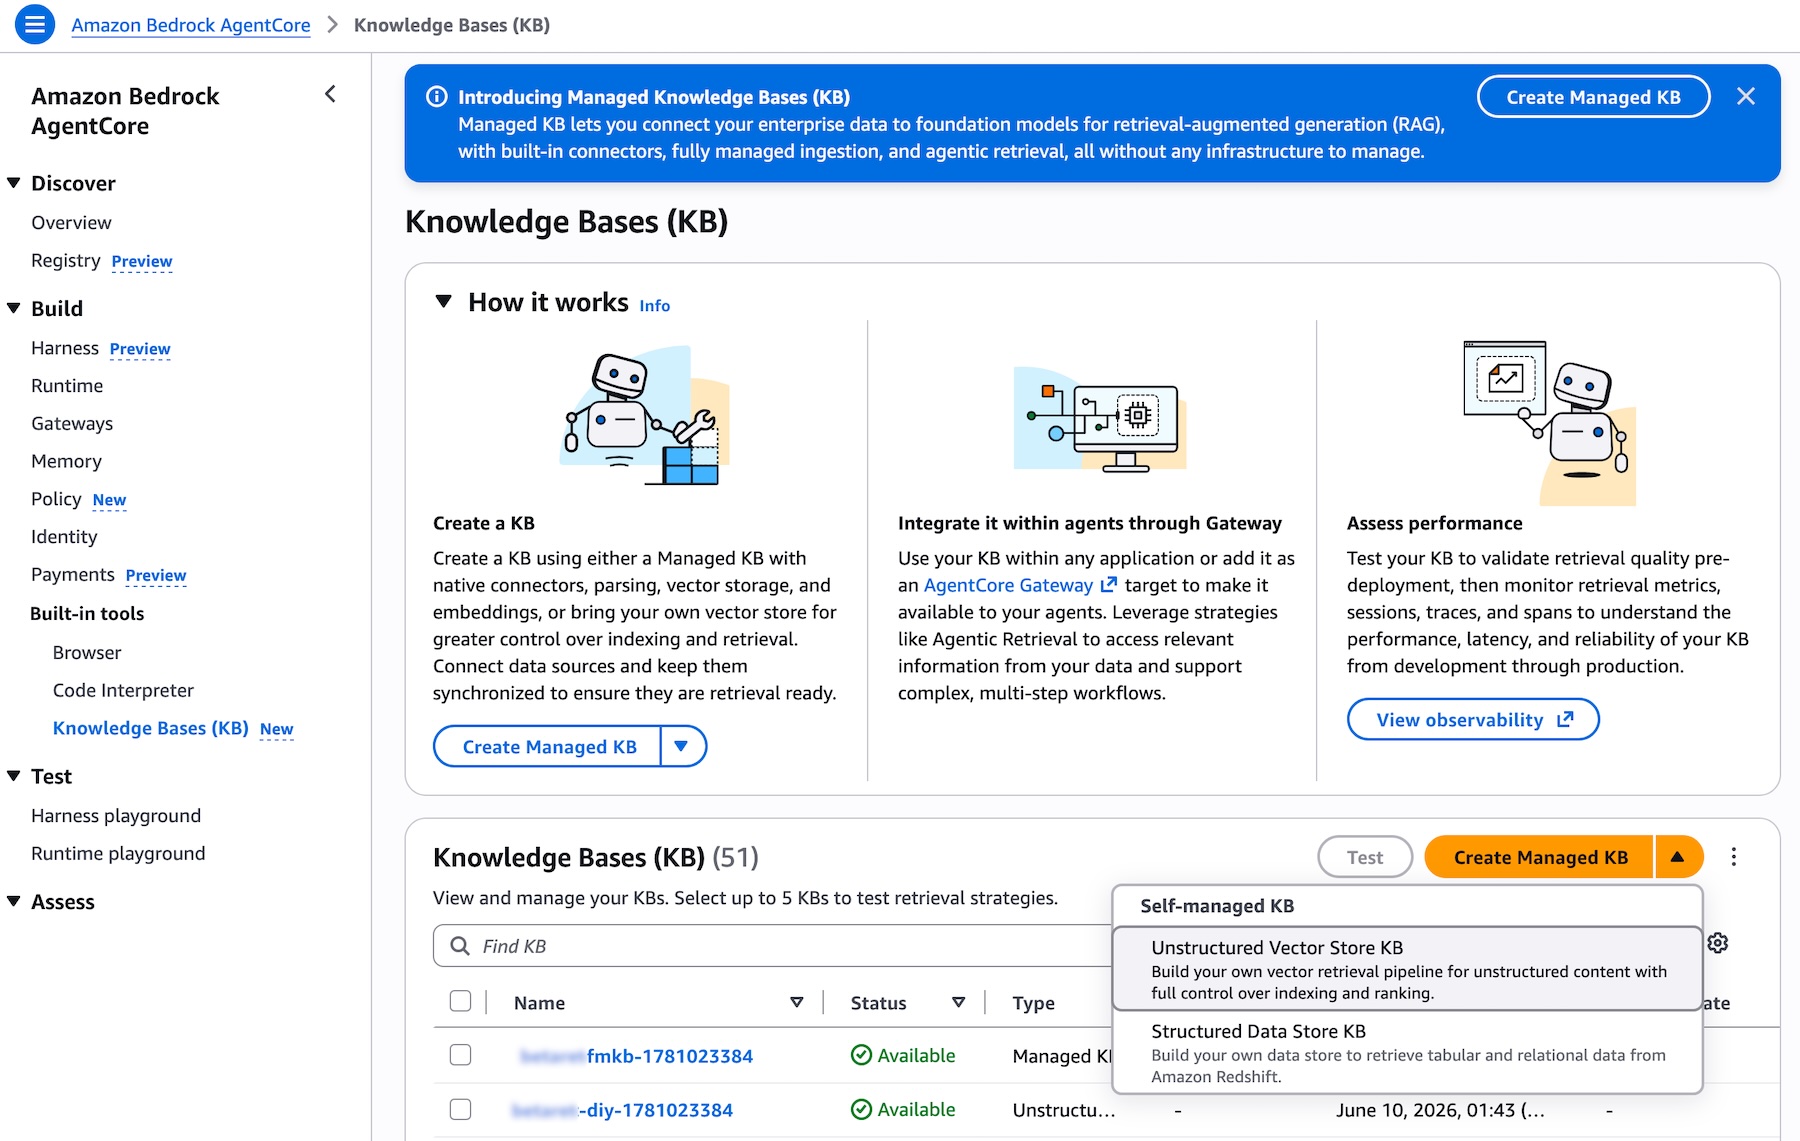
Getting started with Amazon Bedrock Managed Knowledge Base Creating a Managed Knowledge Base is straightforward. Navigate to the Amazon Bedrock AgentCore console or the Amazon Bedrock console, open the Knowledge Bases page, and choose Create Managed KB. The experience is the same in both consoles. You will see that Unstructured Vector Store KB is now available as the recommended option, alongside the other knowledge base types you may already be familiar with:
Picture 1 – Knowledge Bases list page in the Amazon Bedrock AgentCore console showing the Type column with different KB types and the Create Managed KB button
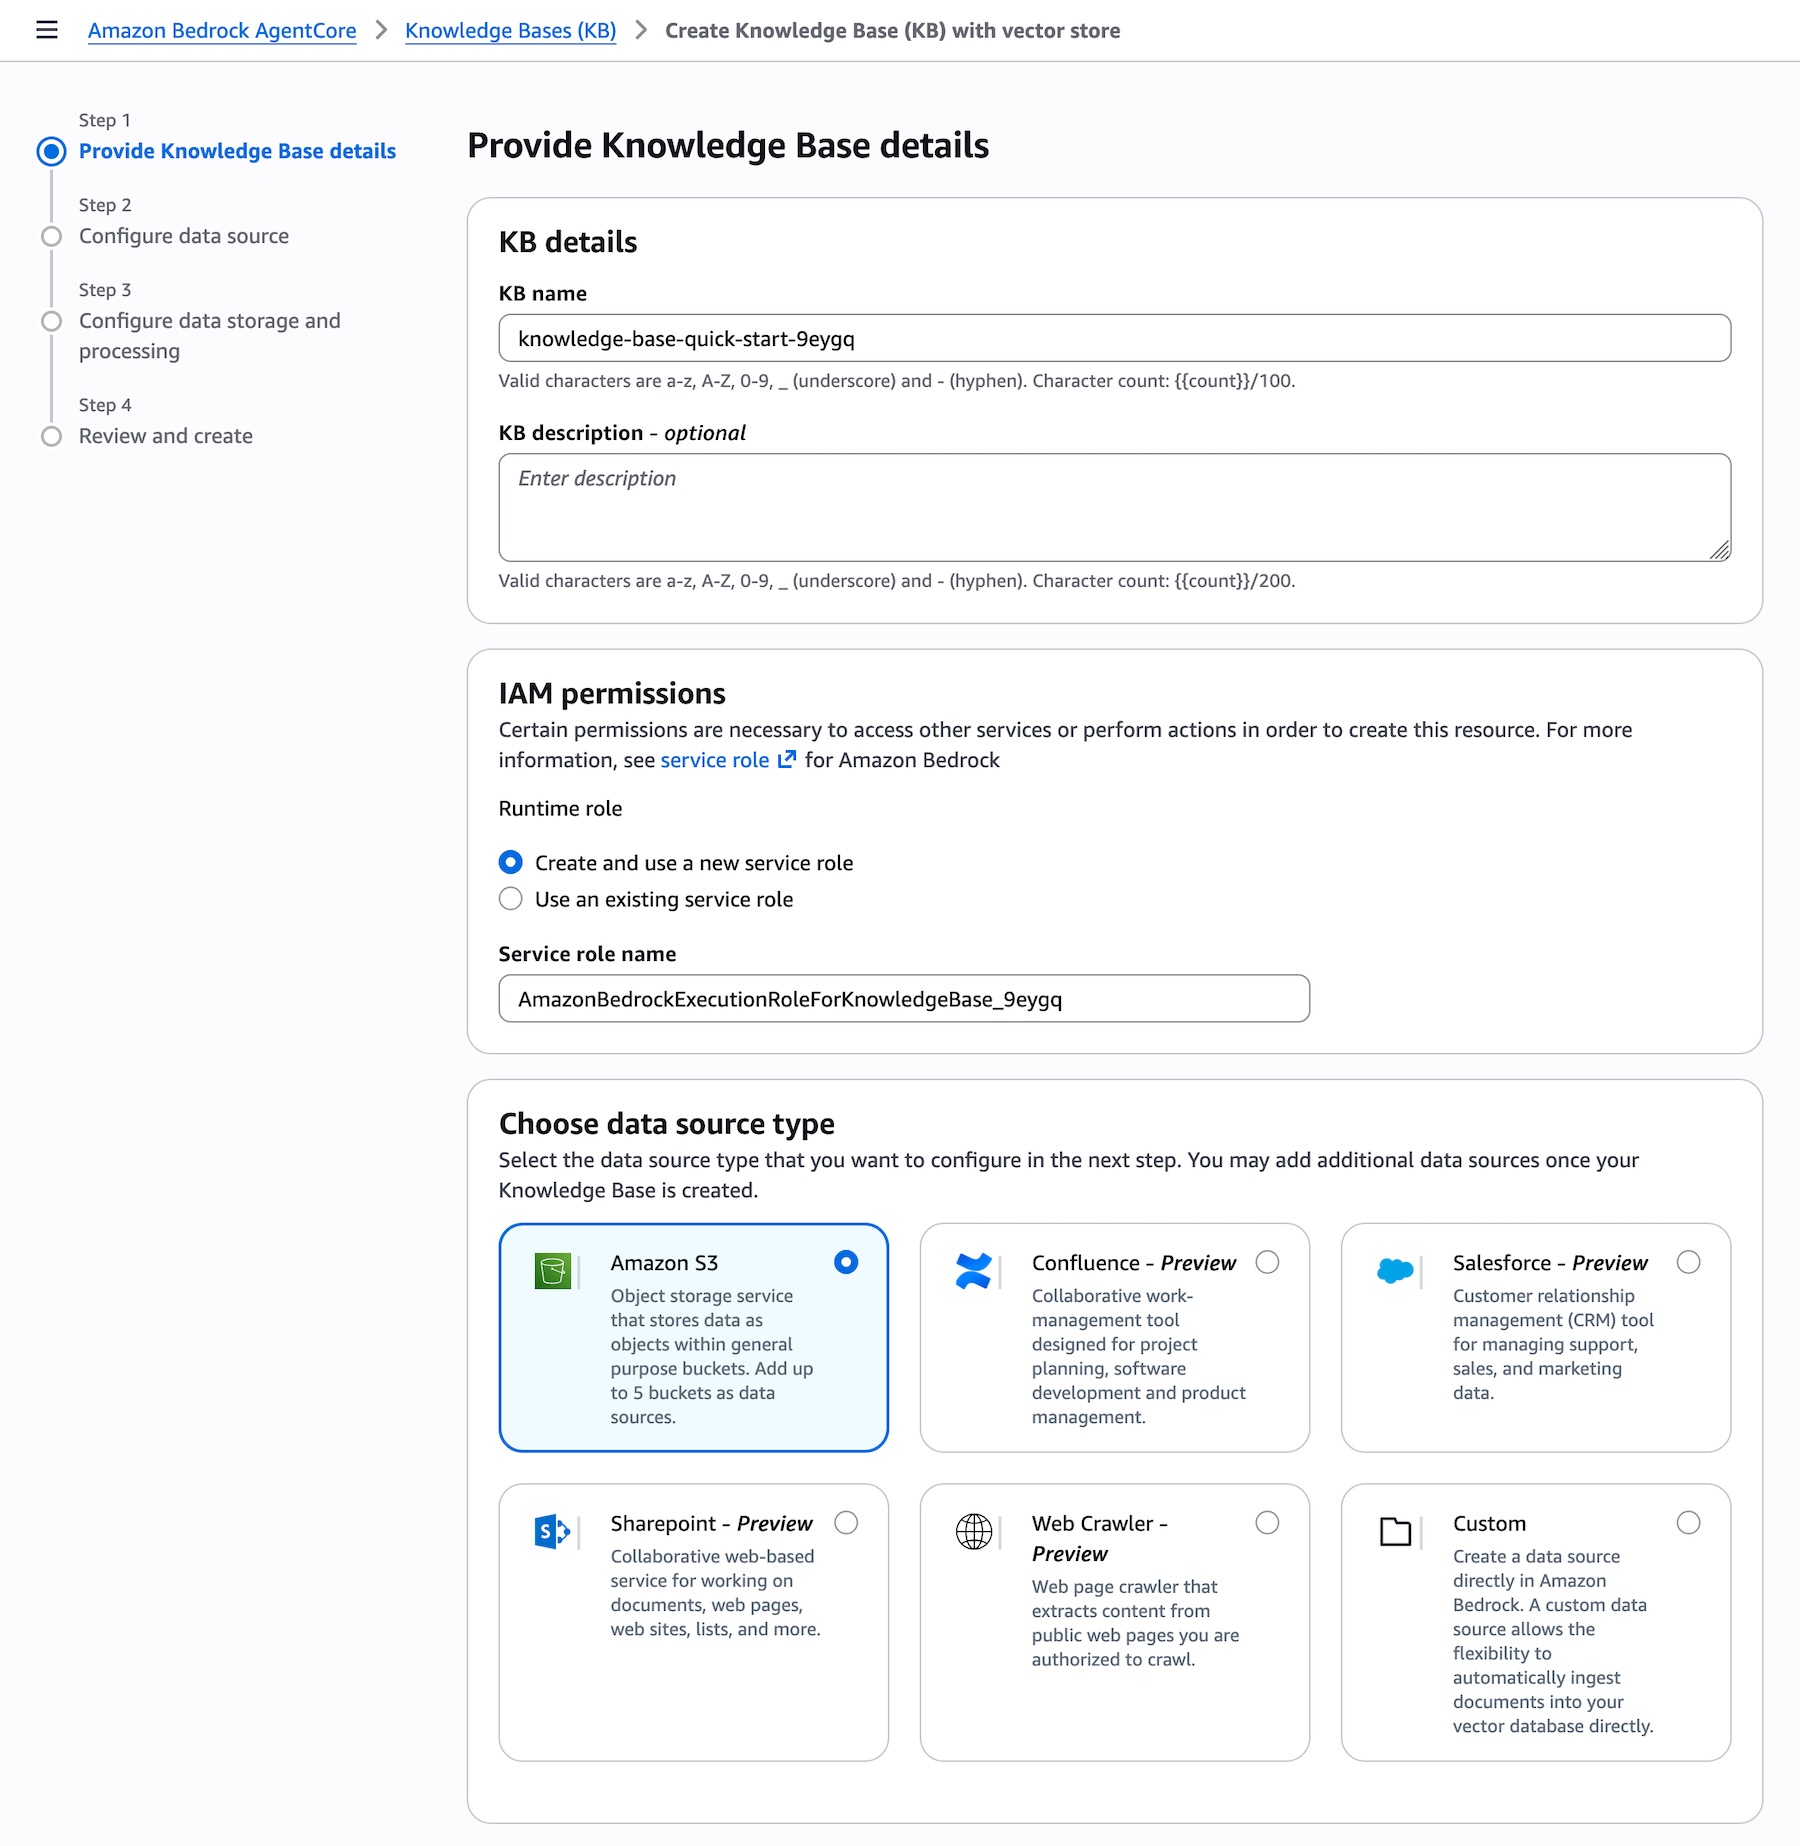
When creating a new Knowledge Bases, you can connect to your enterprise data sources by choosing from the list of supported connectors directly from a dropdown. AWS Identity and Access Management (IAM) roles are automatically created, and you can choose to edit these permissions if needed:
Picture 2 – Create Knowledge Base page showing the Data source dropdown expanded with all supported connectors: Amazon S3, Confluence, Custom, Google Drive, One Drive, SharePoint, and Web Crawler
An optimized set of defaults will be presented, allowing you to create your knowledge base in just a few clicks. Once the data is synced, you can integrate the knowledge base with your agent or provide it as a tool for your foundation model and start querying.
Smart Parsing for accurate data ingestion One of the key challenges in building knowledge bases is preparing diverse data types for accurate retrieval. Once you point Managed Knowledge Base at your data sources, Smart Parsing automatically determines the optimal parsing strategy for each data type and connector, no extra configuration is required.
Smart Parsing combines multiple techniques:
Connector-specific data models – Optimized handling for each data source. For example, the Web Crawler connector preserves HTML structure including embedded images and tables, ensuring rich content is not dropped during ingestion. SharePoint connectors maintain document hierarchy and relationships between files.
Multimodal processing – Automatic detection and processing of different content types within documents. The system identifies bounding boxes in documents, then sends them to foundation models for data extraction, captioning, and scene description in video files.
Optimized chunking – Smart Parsing leverages foundation models to understand document structure and extract meaningful content, ensuring that complex documents with mixed formats are properly indexed. Intelligent defaults balance retrieval accuracy with performance based on document type and content structure, while advanced users can customize chunking strategies when needed.
This automated approach eliminates weeks of experimentation typically required to achieve production-quality retrieval accuracy, while still preserving the flexibility to customize when needed.
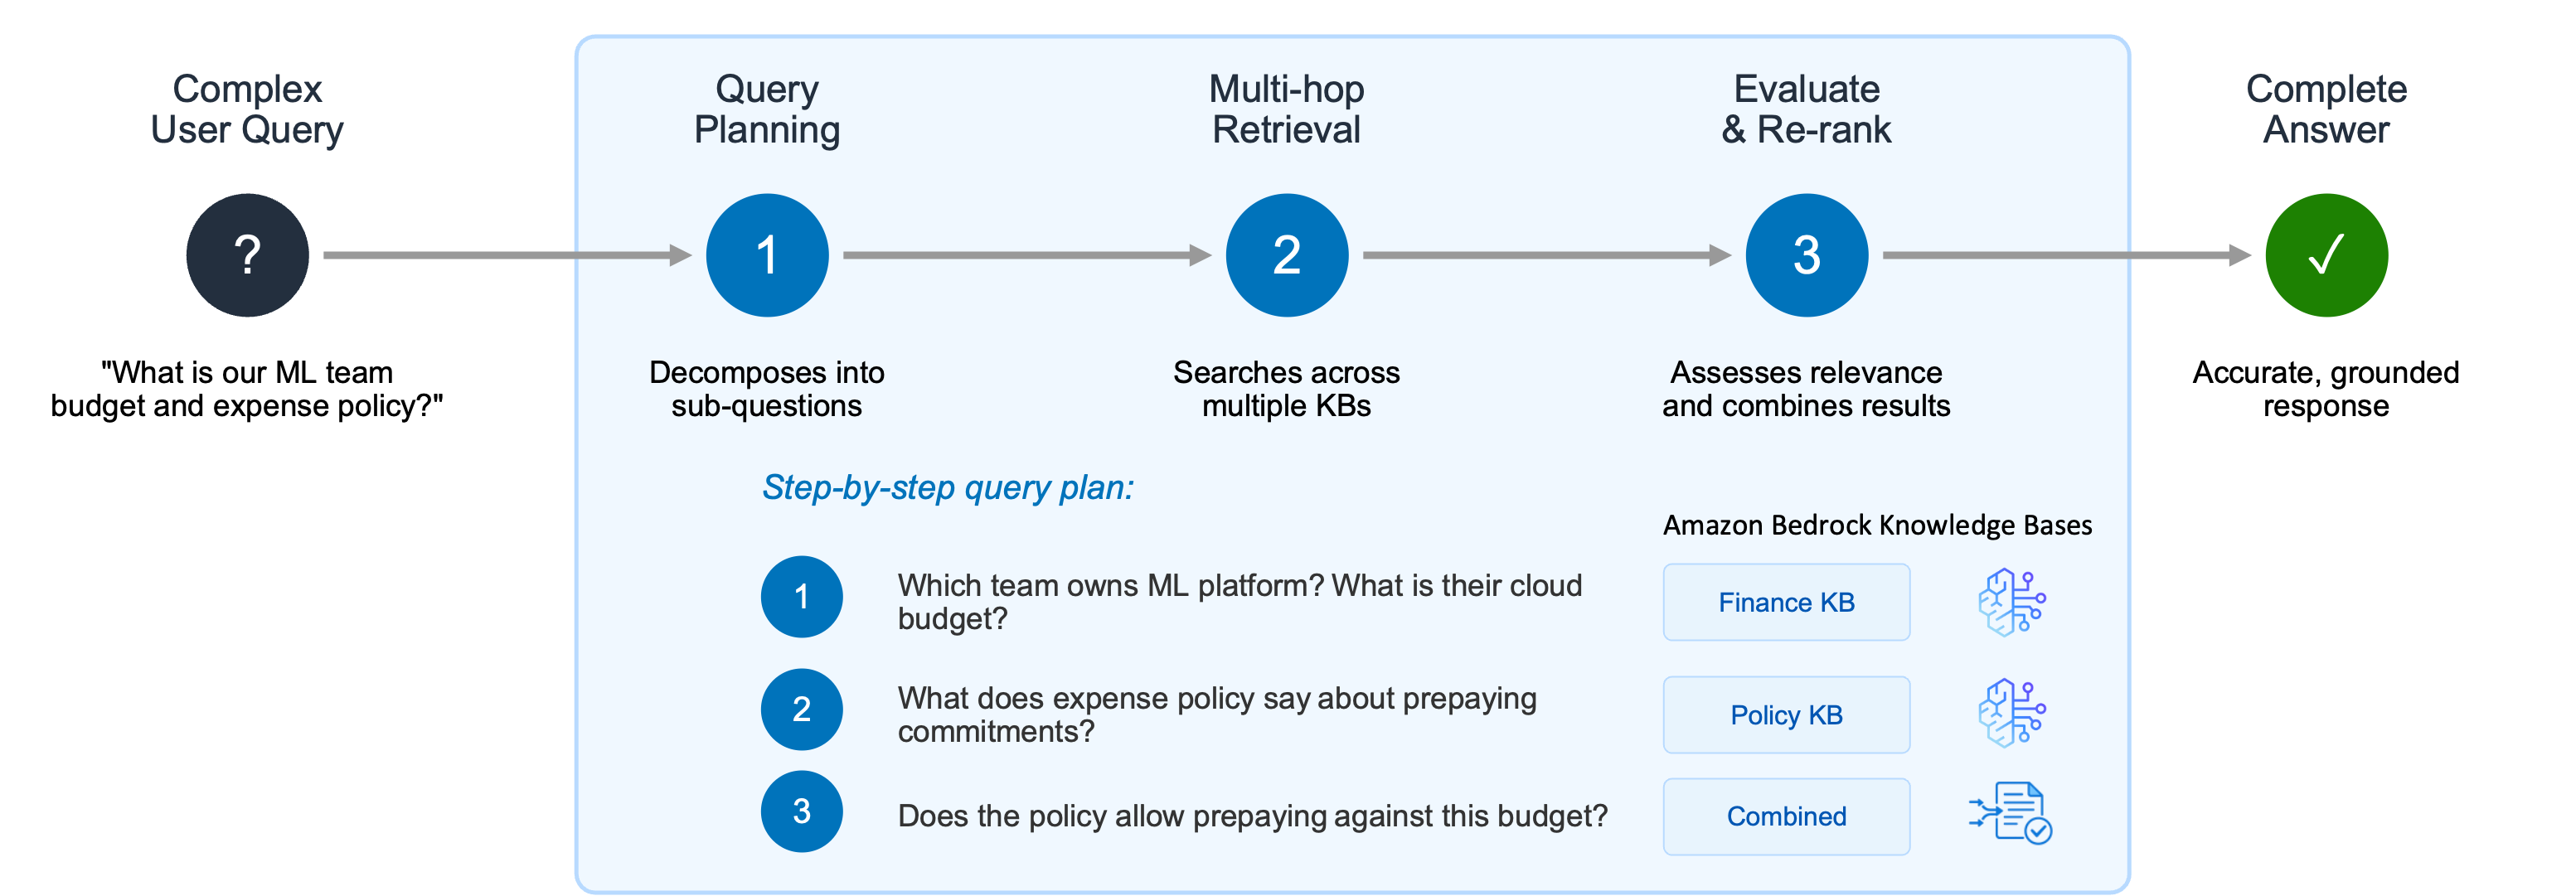
Using Agentic Retriever for complex queries After your data is ingested, you can start querying your knowledge base. Generative AI applications often struggle with complex user queries that require reasoning, recursive multi-step retrieval, and intermediate evaluations of results. Consider a user asking two related questions: “What is the cloud infrastructure budget for the ML platform team?” and “Does our expense policy allow prepaying annual commitments?” A single retrieval step might surface documents about the ML platform team but fail to connect the budget information with the expense policy needed to fully answer the question.
Picture 3 – Agentic Retriever decomposes complex user queries into a step-by-step plan, performing multi-hop retrieval across multiple knowledge bases and combining results to deliver accurate, grounded responses
Agentic Retriever solves this by creating a step-by-step query plan: 1. Which team owns the ML platform, and what is their cloud infrastructure budget? 2. What does the expense policy say about prepaying annual commitments? 3. Does the policy allow the ML platform team to prepay against this budget?
The system performs multi-hop retrieval and reasoning at each step, and once it has gathered sufficient relevant passages, it stops the search process and returns the top results. By abstracting away the complexity of building a separate multi-hop reasoning pipeline, this approach dramatically improves accuracy for complex queries while letting developers focus on their agentic search applications instead of orchestration logic.
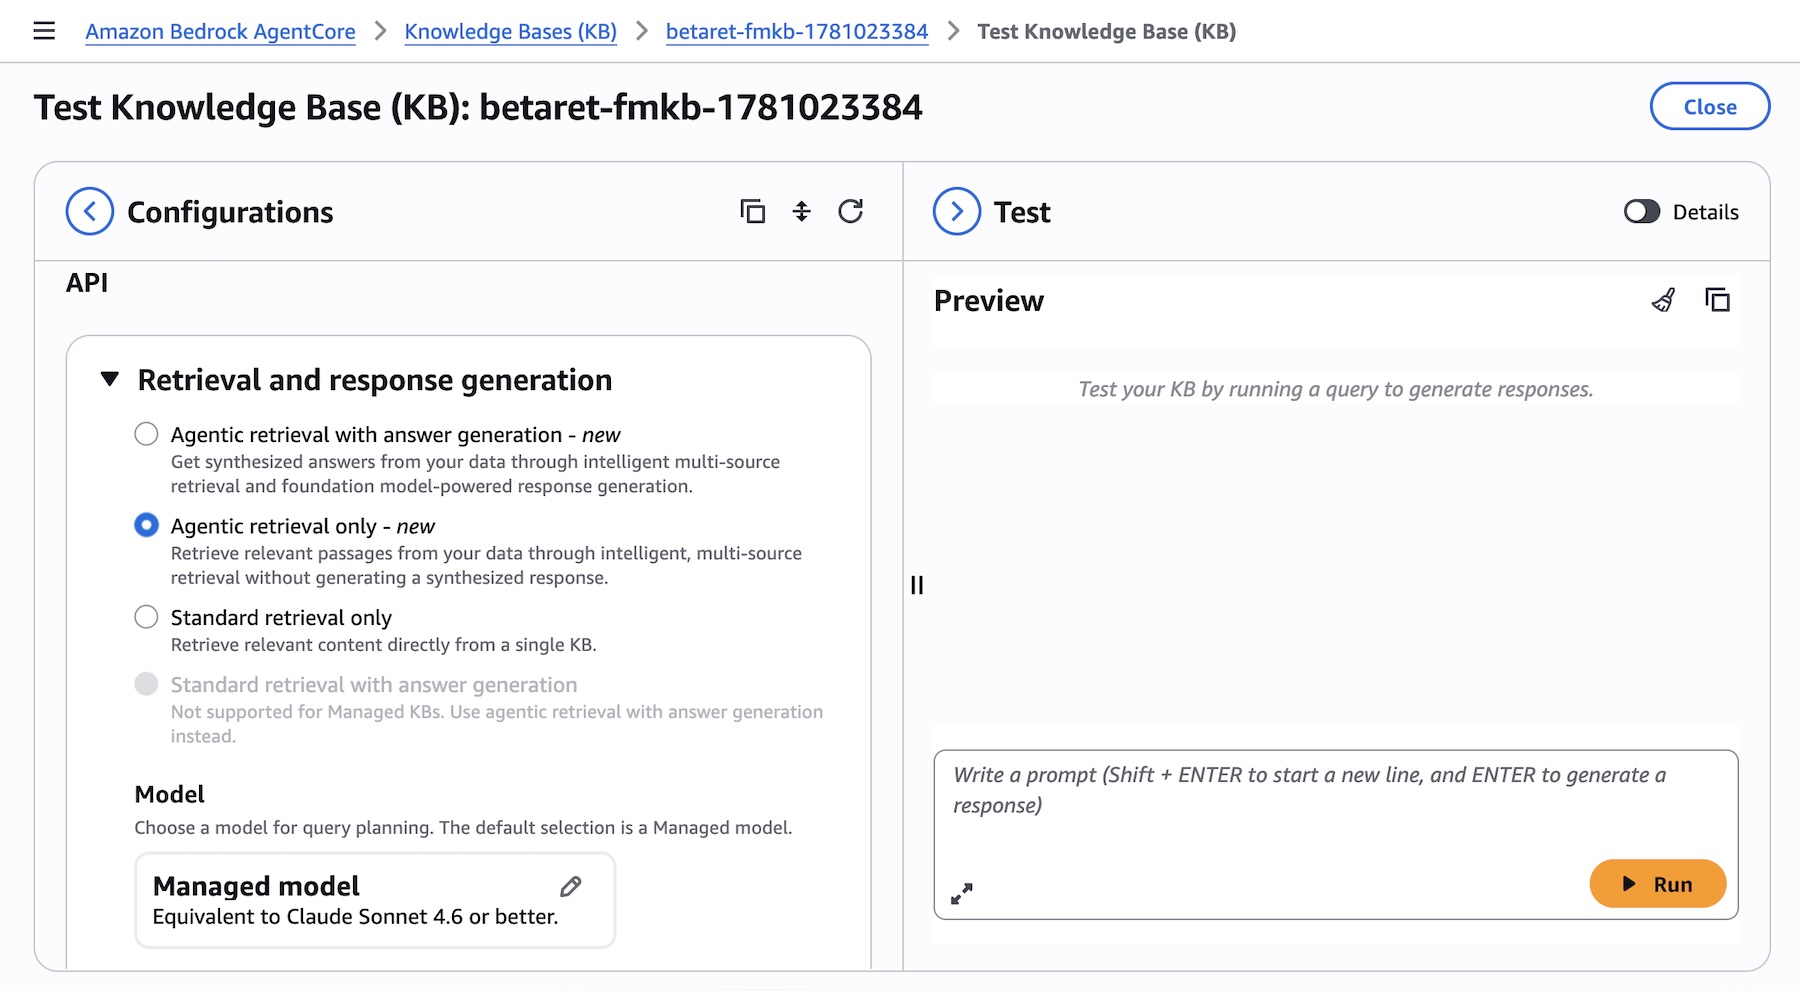
You can try Agentic Retriever directly from the test panel of your knowledge base in the Amazon Bedrock AgentCore console. Select Agentic retrieval only as the retrieval type to let the system automatically plan and execute multi-step queries across your knowledge bases:
Picture 4 – Test Knowledge Base panel showing Agentic retrieval with answer generation selected as the retrieval type, with model selection and maximum agentic iterations options
Enabling MCP with Bedrock AgentCore Amazon Bedrock Managed Knowledge Base seamlessly integrates with AgentCore Gateway as a native target type. This integration eliminates the need for manual integration and provides built-in observability, policy enforcement, and automatic permission management.
You can navigate to the Amazon Bedrock AgentCore console or SDK and create an AgentCore Gateway or select an existing one. When adding targets to your gateway, you will find Knowledge Base as a new pre-built target type alongside other options such as MCP server, Lambda ARN, REST API, and other integrations. Simply select your knowledge base ID to expose it through the gateway:
Picture 5 – Add targets page in AgentCore Gateway showing Knowledge Base as a new pre-built target type, with the knowledge base ID selector and runtime retrieval mode options
Add targets page in AgentCore Gateway showing Knowledge Base as a new pre-built target type, with the knowledge base ID selector and runtime retrieval mode options
Gateway exposes the standard Model Context Protocol (MCP), so the knowledge base tools are automatically discovered by clients from any MCP-compatible framework, including Strands Agents, LangChain, CrewAI, LlamaIndex, and LangGraph. No custom integration code is required.
Model choice and flexibility Amazon Bedrock Managed Knowledge Base preserves the flexibility developers expect from Amazon Bedrock. Every foundation model available on Bedrock can power the generation step, and developers can select from different embedding and re-ranking models to optimize retrieval for their specific use case, enabling teams to fine-tune accuracy and cost-performance without changing infrastructure.
Unlike managed solutions that lock you into specific model providers, Amazon Bedrock Managed Knowledge Base separates the infrastructure management (connectors, parsing, storage, retrieval orchestration) from model selection. This means you can:
Take advantage of the latest models – Adopt the latest embedding, re-ranking, and foundation models as they become available to improve accuracy, latency, and cost for your application without rebuilding your RAG pipeline.
Optimize for price-performance – Choose smaller, faster models for simple queries and more capable models for complex reasoning tasks, all using the same knowledge base infrastructure.
Use Bedrock embedding models – While Smart Parsing provides optimized defaults, you can configure Bedrock embedding models when your domain requires specialized semantic understanding.
Maintain consistency with existing applications – If you’re already using Bedrock Knowledge Bases APIs (Retrieve, StartIngest, StopIngest, IngestKnowledgeBaseDocuments), Managed Knowledge Base uses the same APIs, so migration requires no code changes, just point to the new knowledge base ID.
This approach ensures you can spend time on your generative AI application without losing the ability to change models based on evolving requirements or new model capabilities.
Get started today Amazon Bedrock Managed Knowledge Base is available today in the US East (N. Virginia), US West (Oregon), Asia Pacific (Sydney, Tokyo), Europe (Dublin, Frankfurt, London), and AWS GovCloud (US-West) Regions. For Regional availability and future roadmap, visit AWS Capabilities by Region.
With Bedrock Managed Knowledge Base, you pay for what you use with no upfront commitments. Pricing is based on two dimensions: the size of indexed data stored and the number of retrievals performed (on-demand). For detailed pricing information, visit the Amazon Bedrock pricing page. Bedrock is also a part of the AWS Free Tier that new AWS customers can use to get started at no cost and explore key AWS services.
These capabilities work with any open source framework such as CrewAI, LangGraph, LlamaIndex, and Strands Agents, and with any foundation model. Bedrock services can be used together or independently, and you can get started using your favorite AI-assisted development environment with the AgentCore open source MCP server.
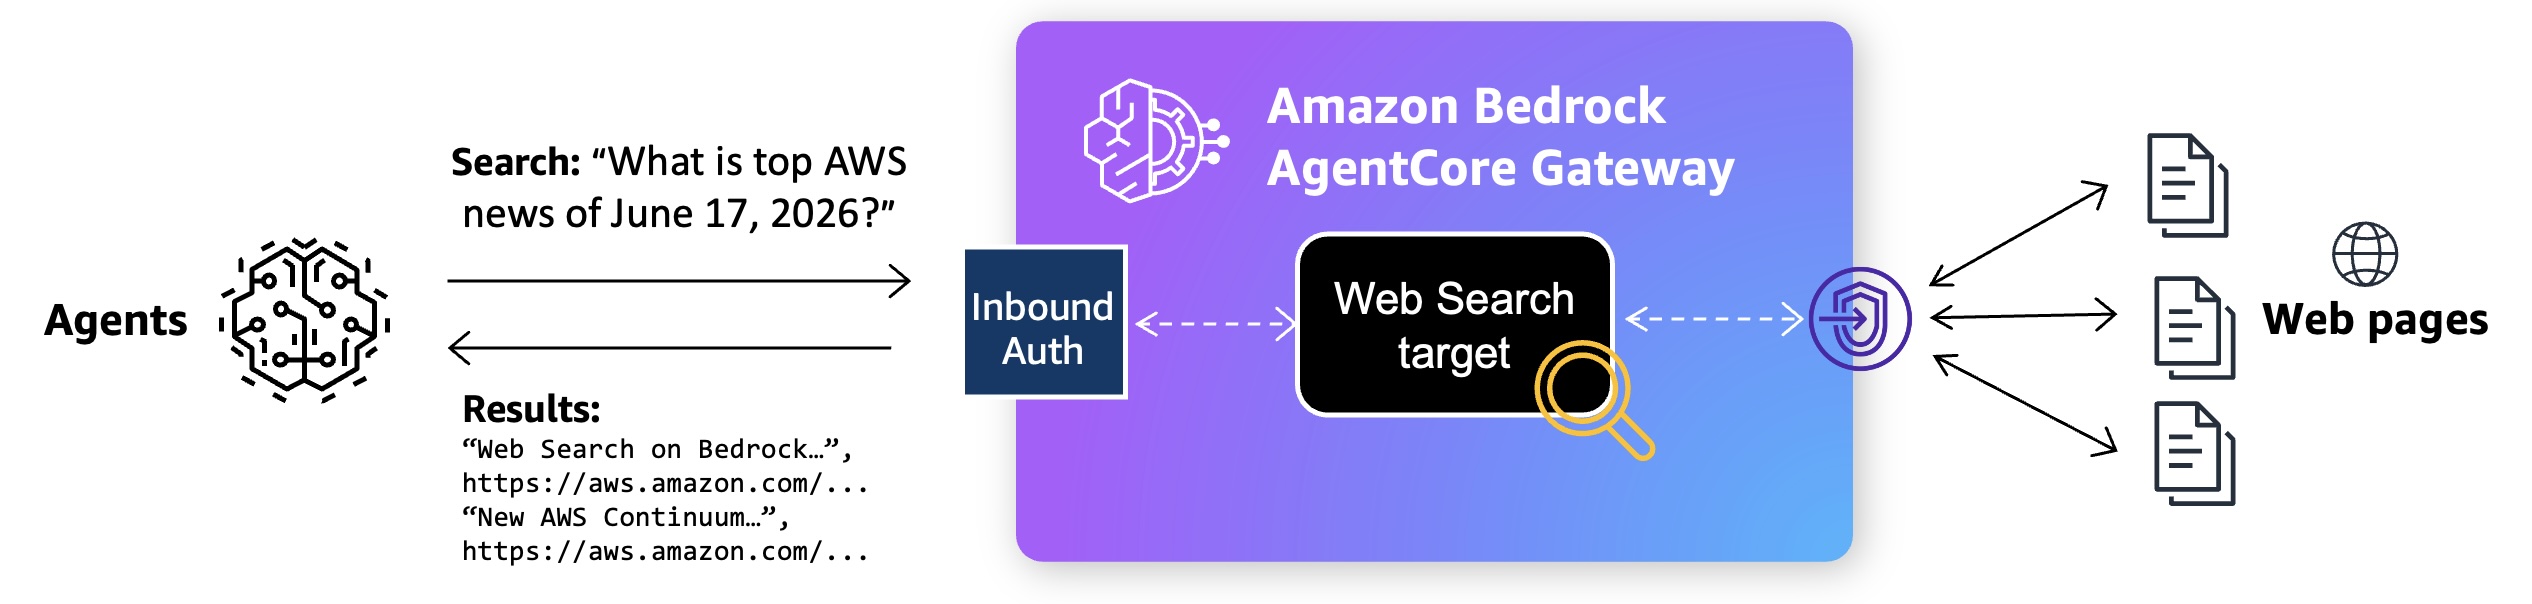
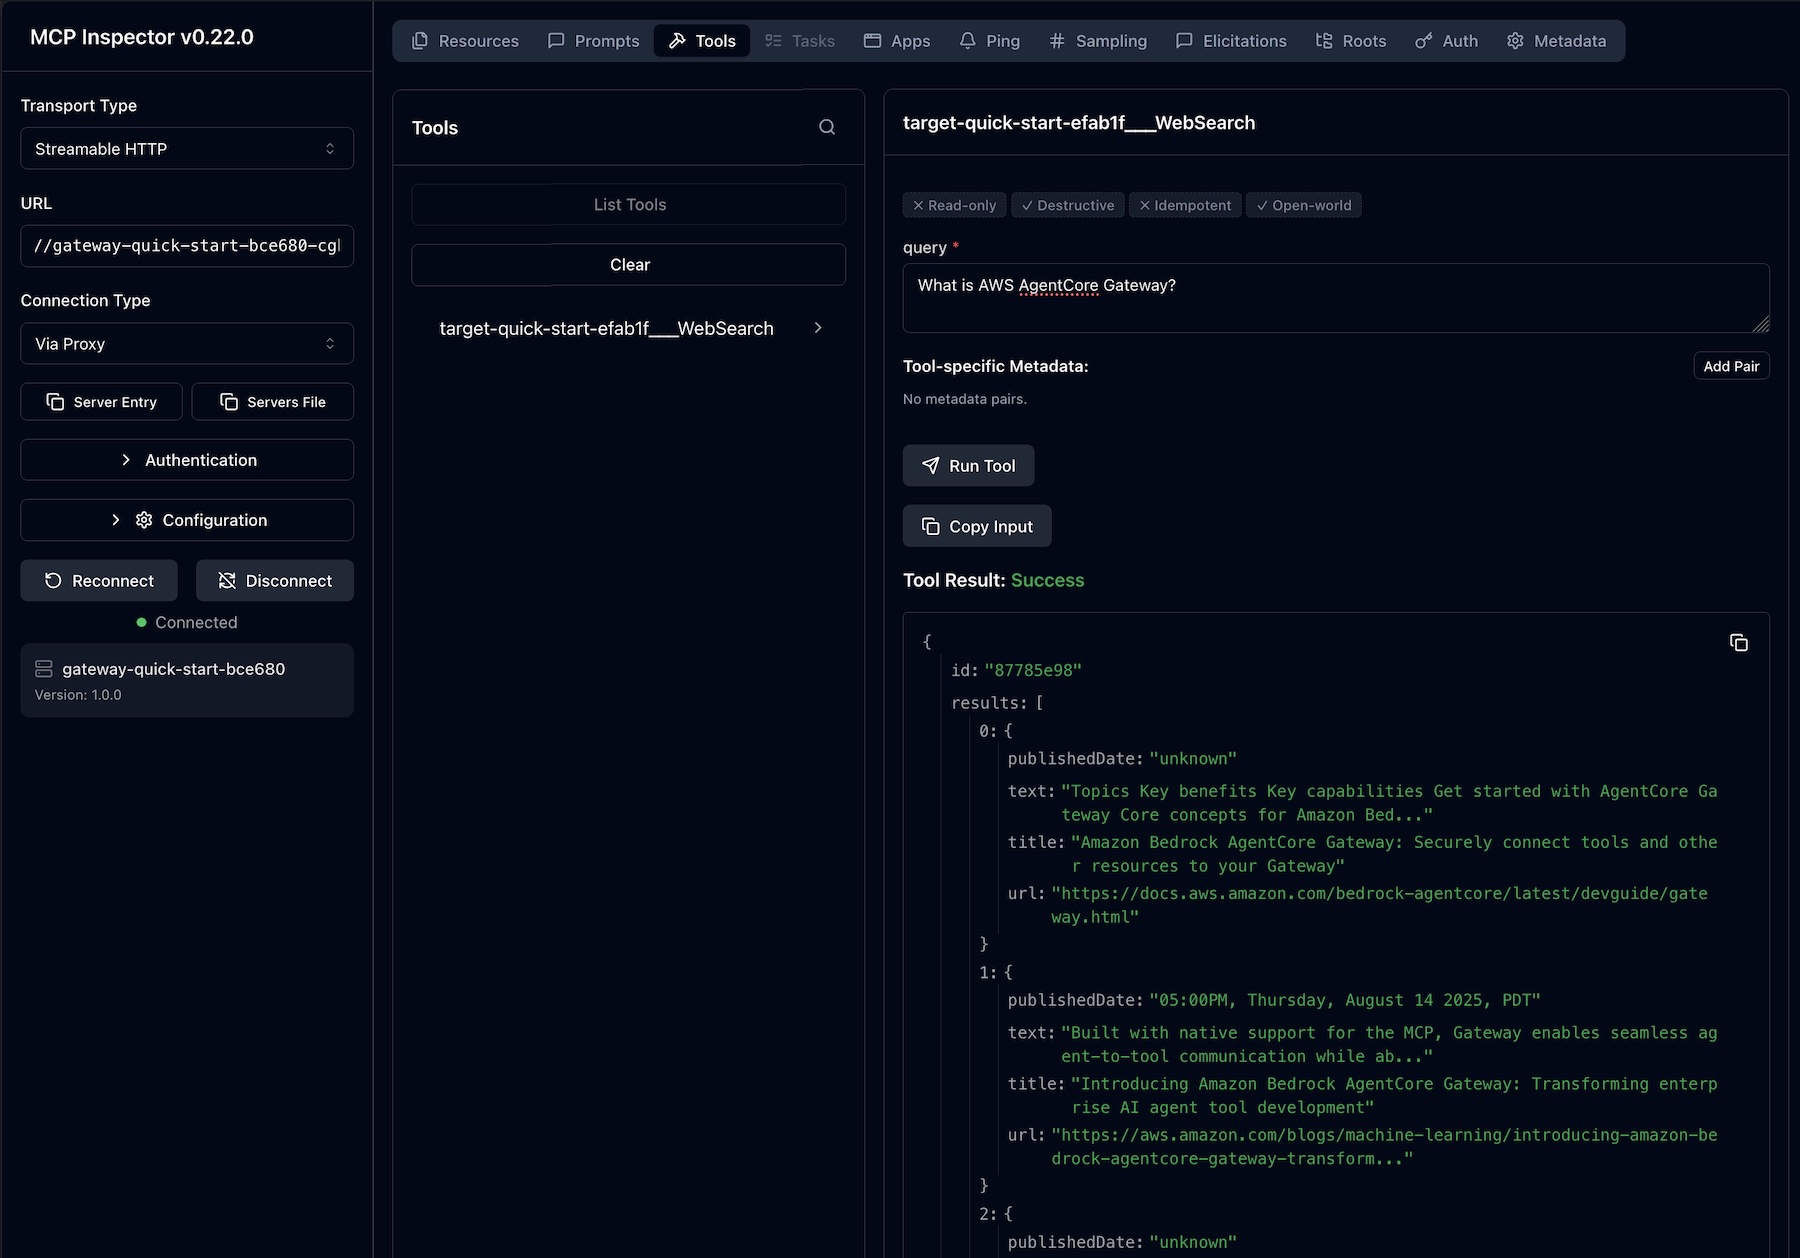
Today, we’re announcing the general availability of Web Search on Amazon Bedrock AgentCore, a fully managed tool that enables agents to ground responses in current, cited web knowledge with zero data egress from customer’s secured AWS environment.
Web Search uses a built-in connector target on Bedrock AgentCore Gateway using the Model Context Protocol (MCP). Your agent sends a natural-language query, and Web Search returns most relevant snippets, source URLs, titles, and publication dates that the model can reason over to produce a grounded response.
It is built on Amazon’s search infrastructure, informed by years of experience powering agentic search experiences across Alexa+, Amazon Quick, and Kiro. It uses a multi-source grounding approach that combines Amazon’s web index with structured knowledge graph data. Beyond standard web results, this gives agents access to Amazon Knowledge Graph with verified facts, helping them retrieve more relevant and accurate responses than traditional web search alone.
With this launch, you can focus on building agents instead of manually adding web search to agents on Bedrock AgentCore and managing its infrastructure. Your AI agent looks at user question, retrieves the latest facts, and then takes any necessary action grounded in current developments beyond a model’s training data. You can also meet enterprise governance policies without sending user prompts and retrieval queries to external search API providers outside of AWS.
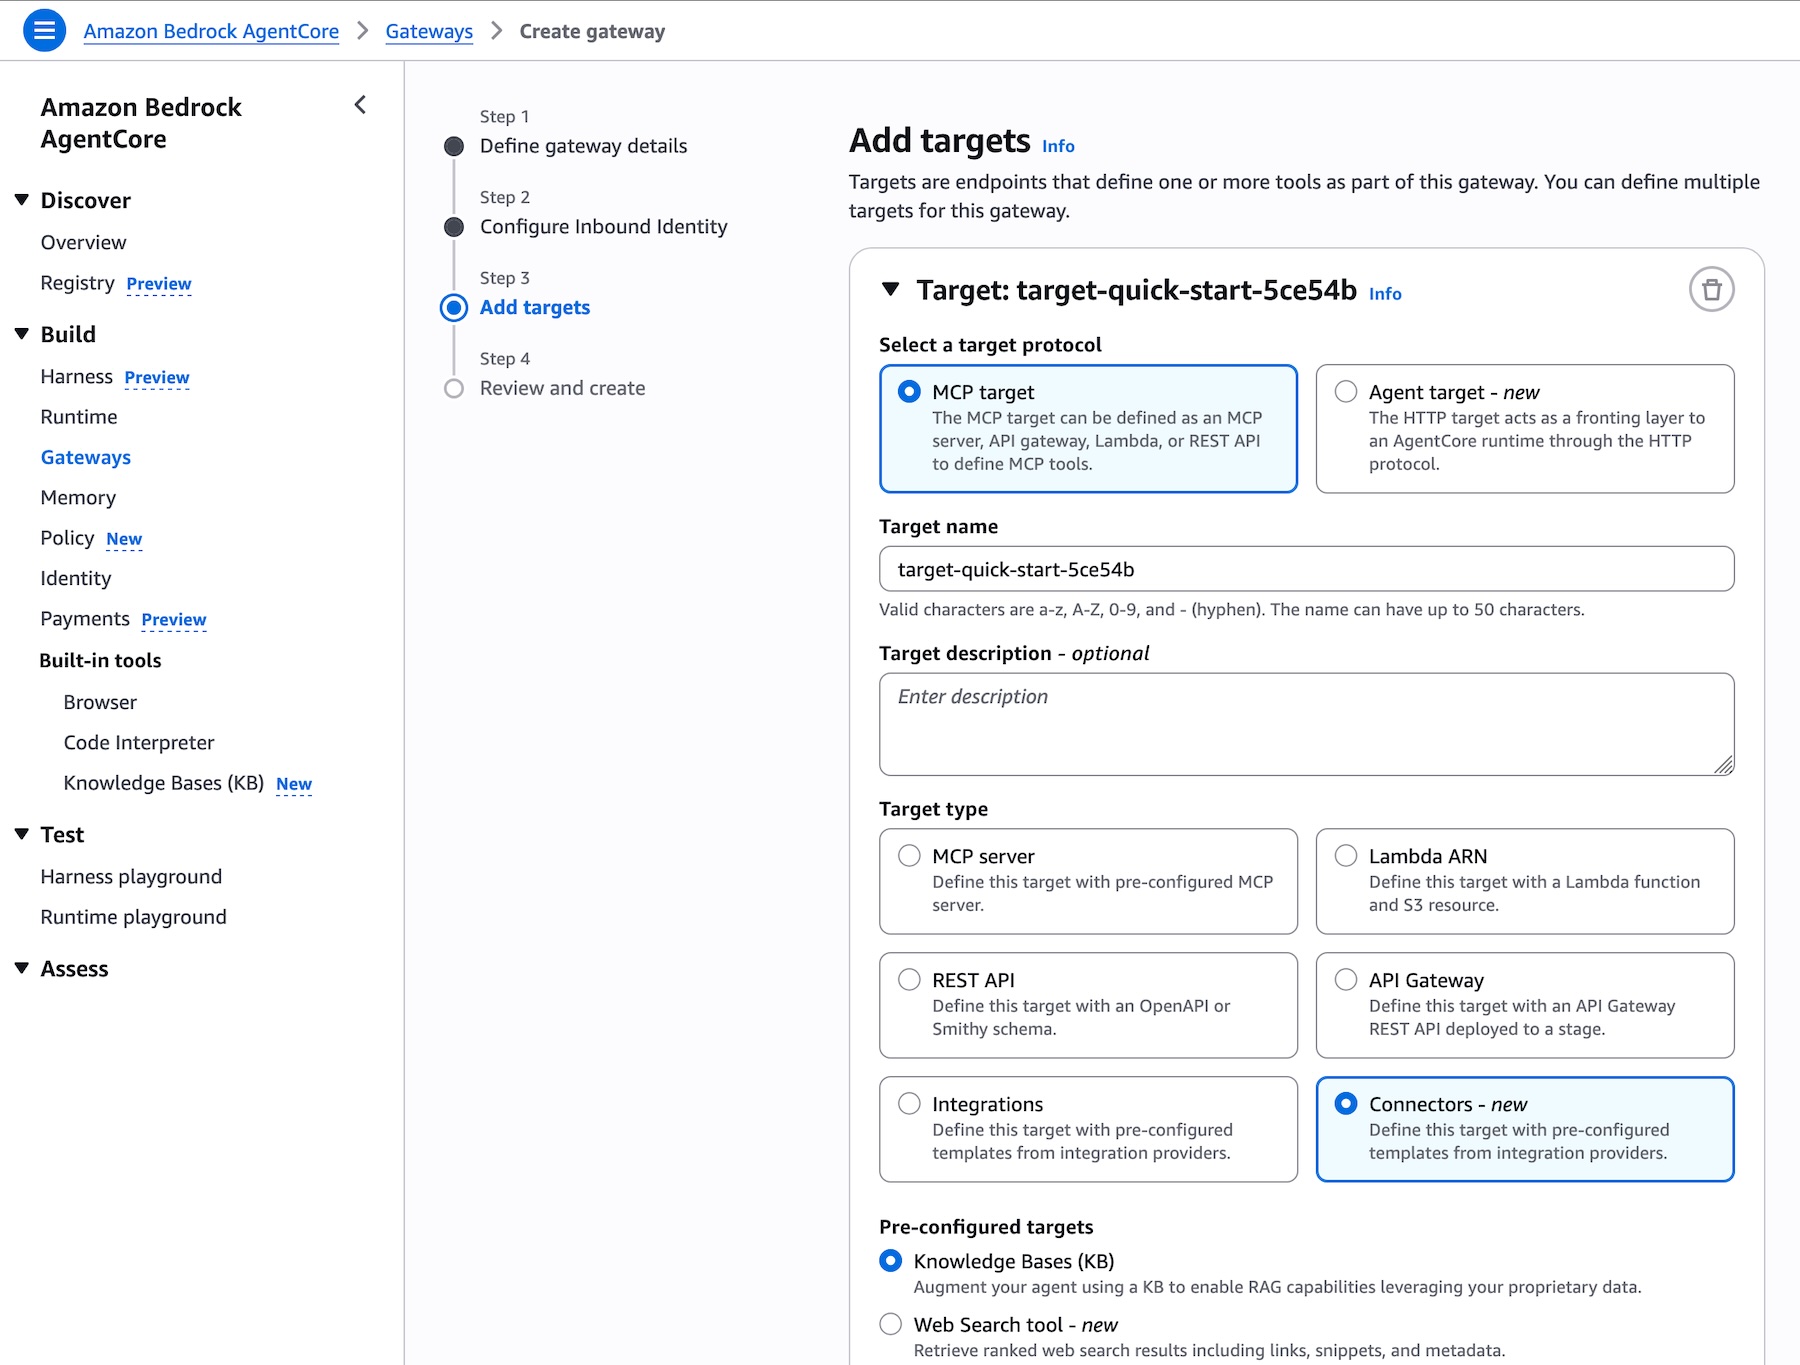
Web Search on Bedrock AgentCore in action To get started, create the Bedrock AgentCore Gateway with Web Search tool target in the Bedrock AgentCore console. When the Gateway URL is created, you can interact with API call, Command Line Interface (CLI), or MCP Inspector.
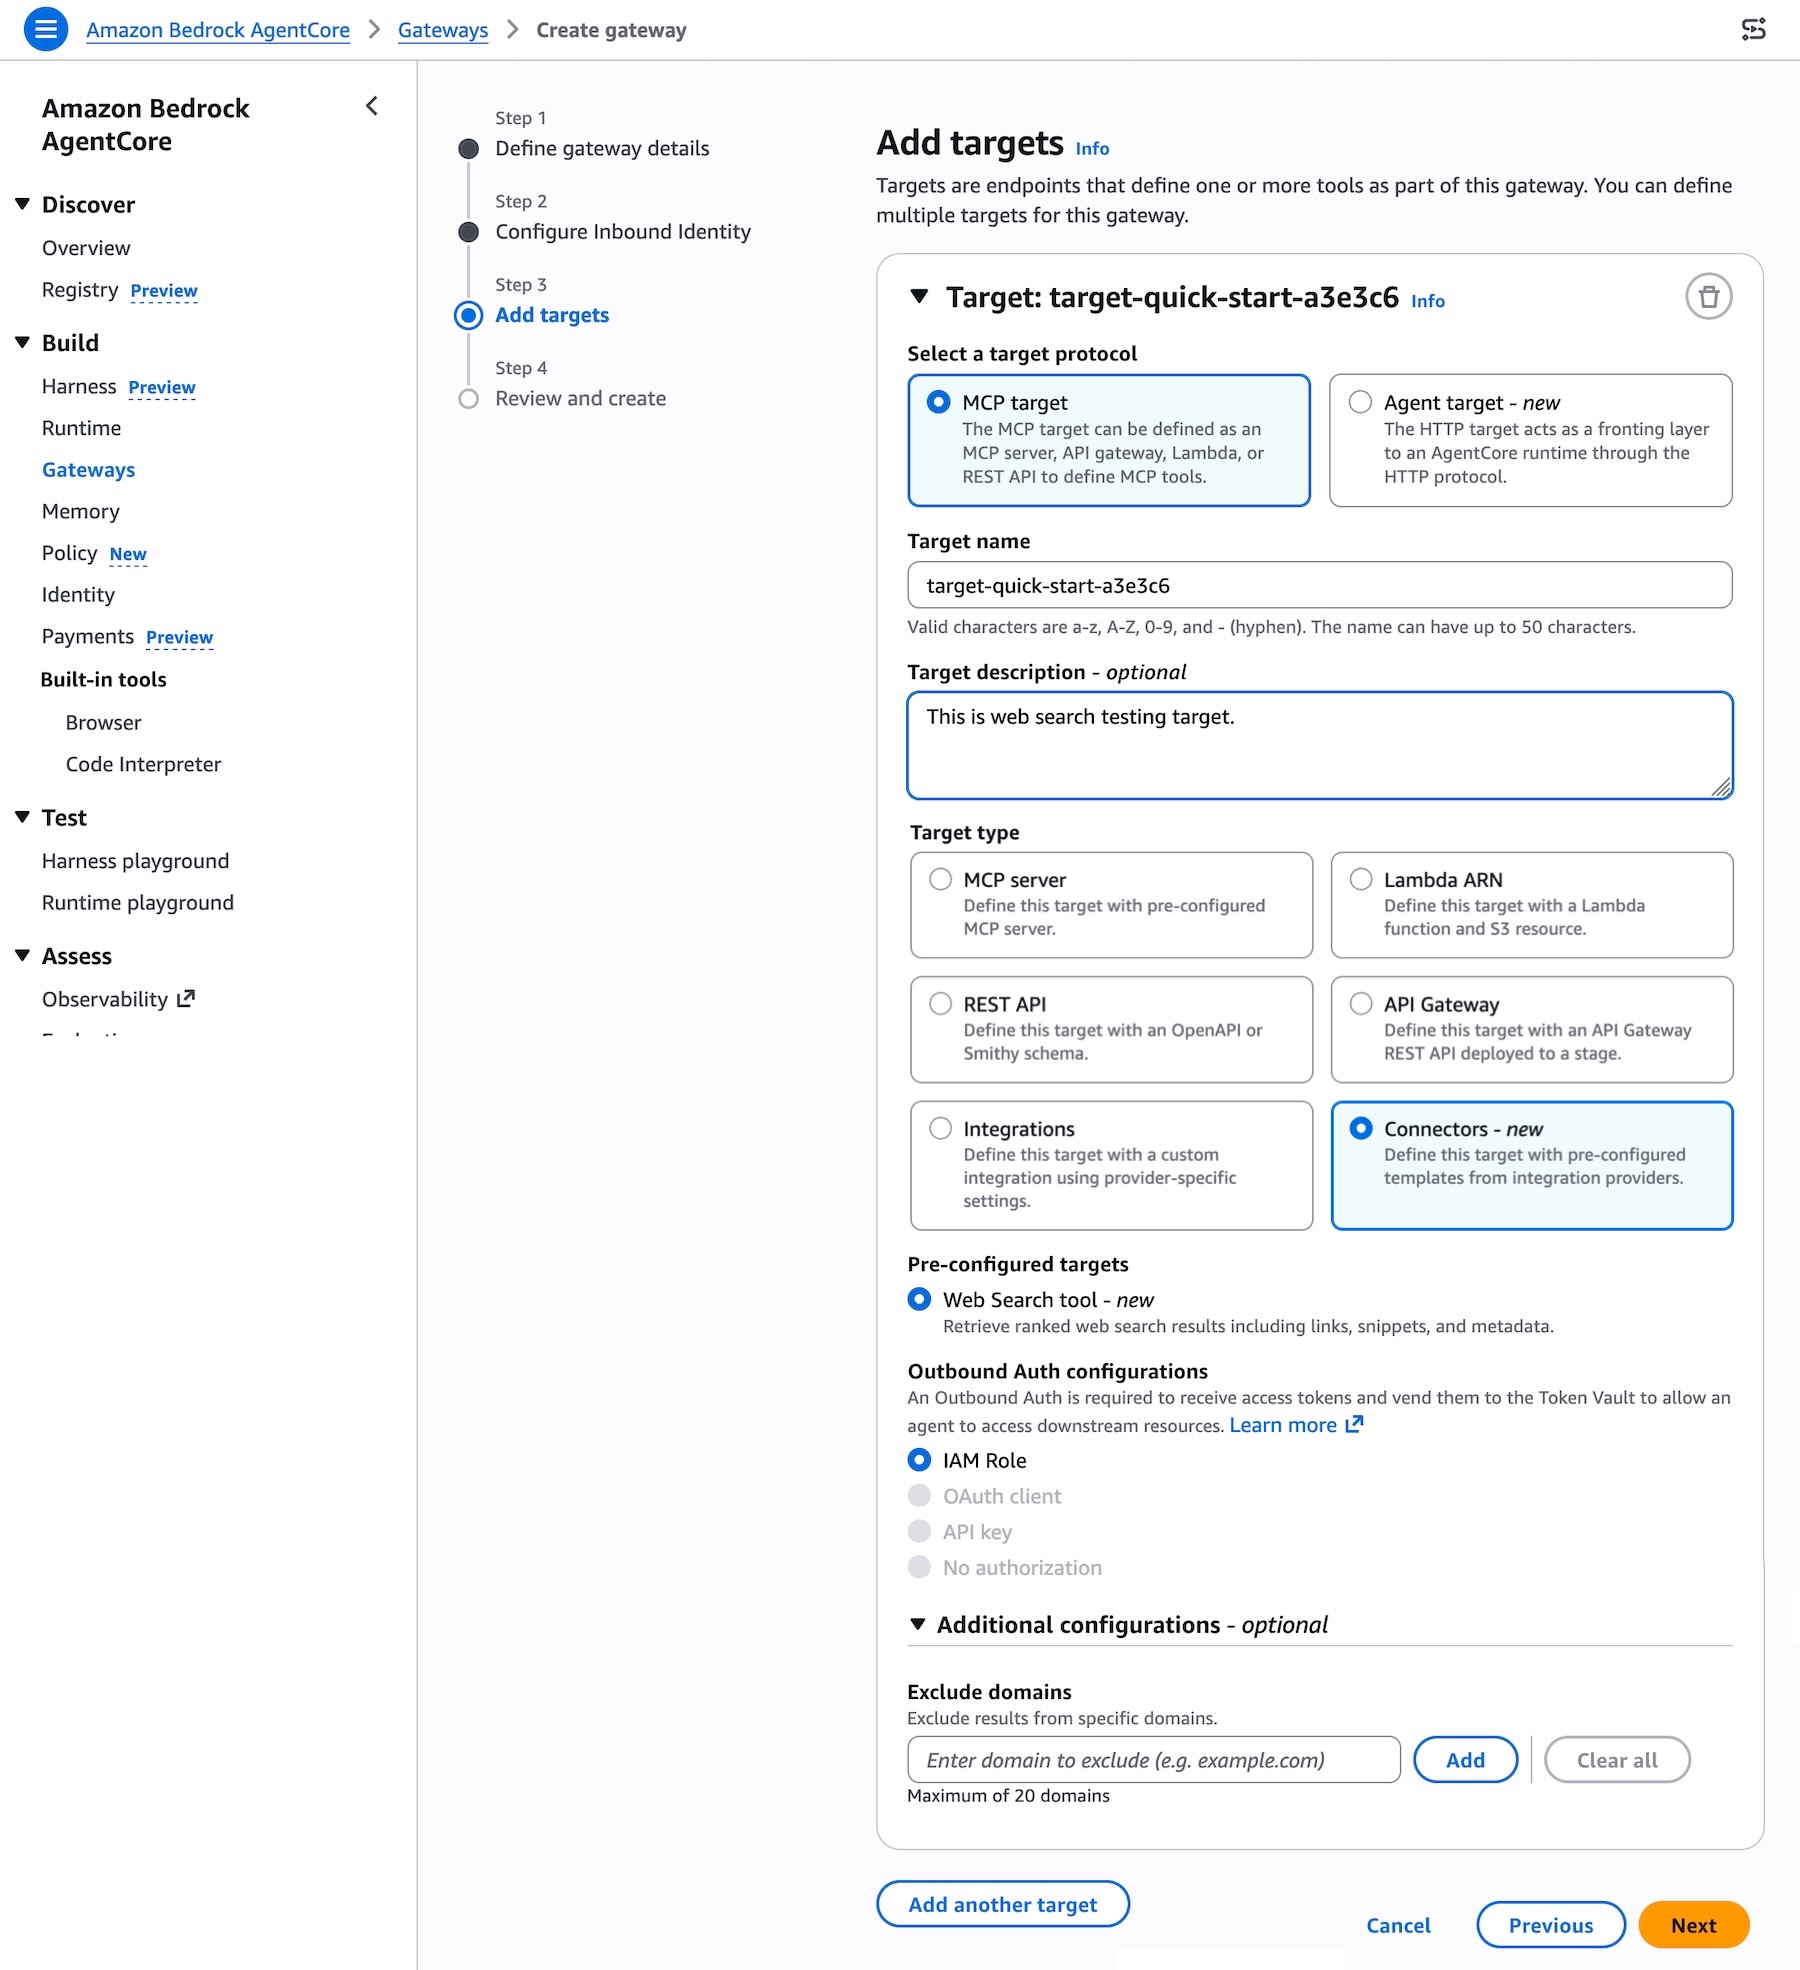
To add Web Search tool target when creating the Gateway, choose MCP target as a target protocol and Connectors as a target type. You can select the Web Search tool as a preconfigured target to retrieve most relevant web search results including links, snippets, and metadata.
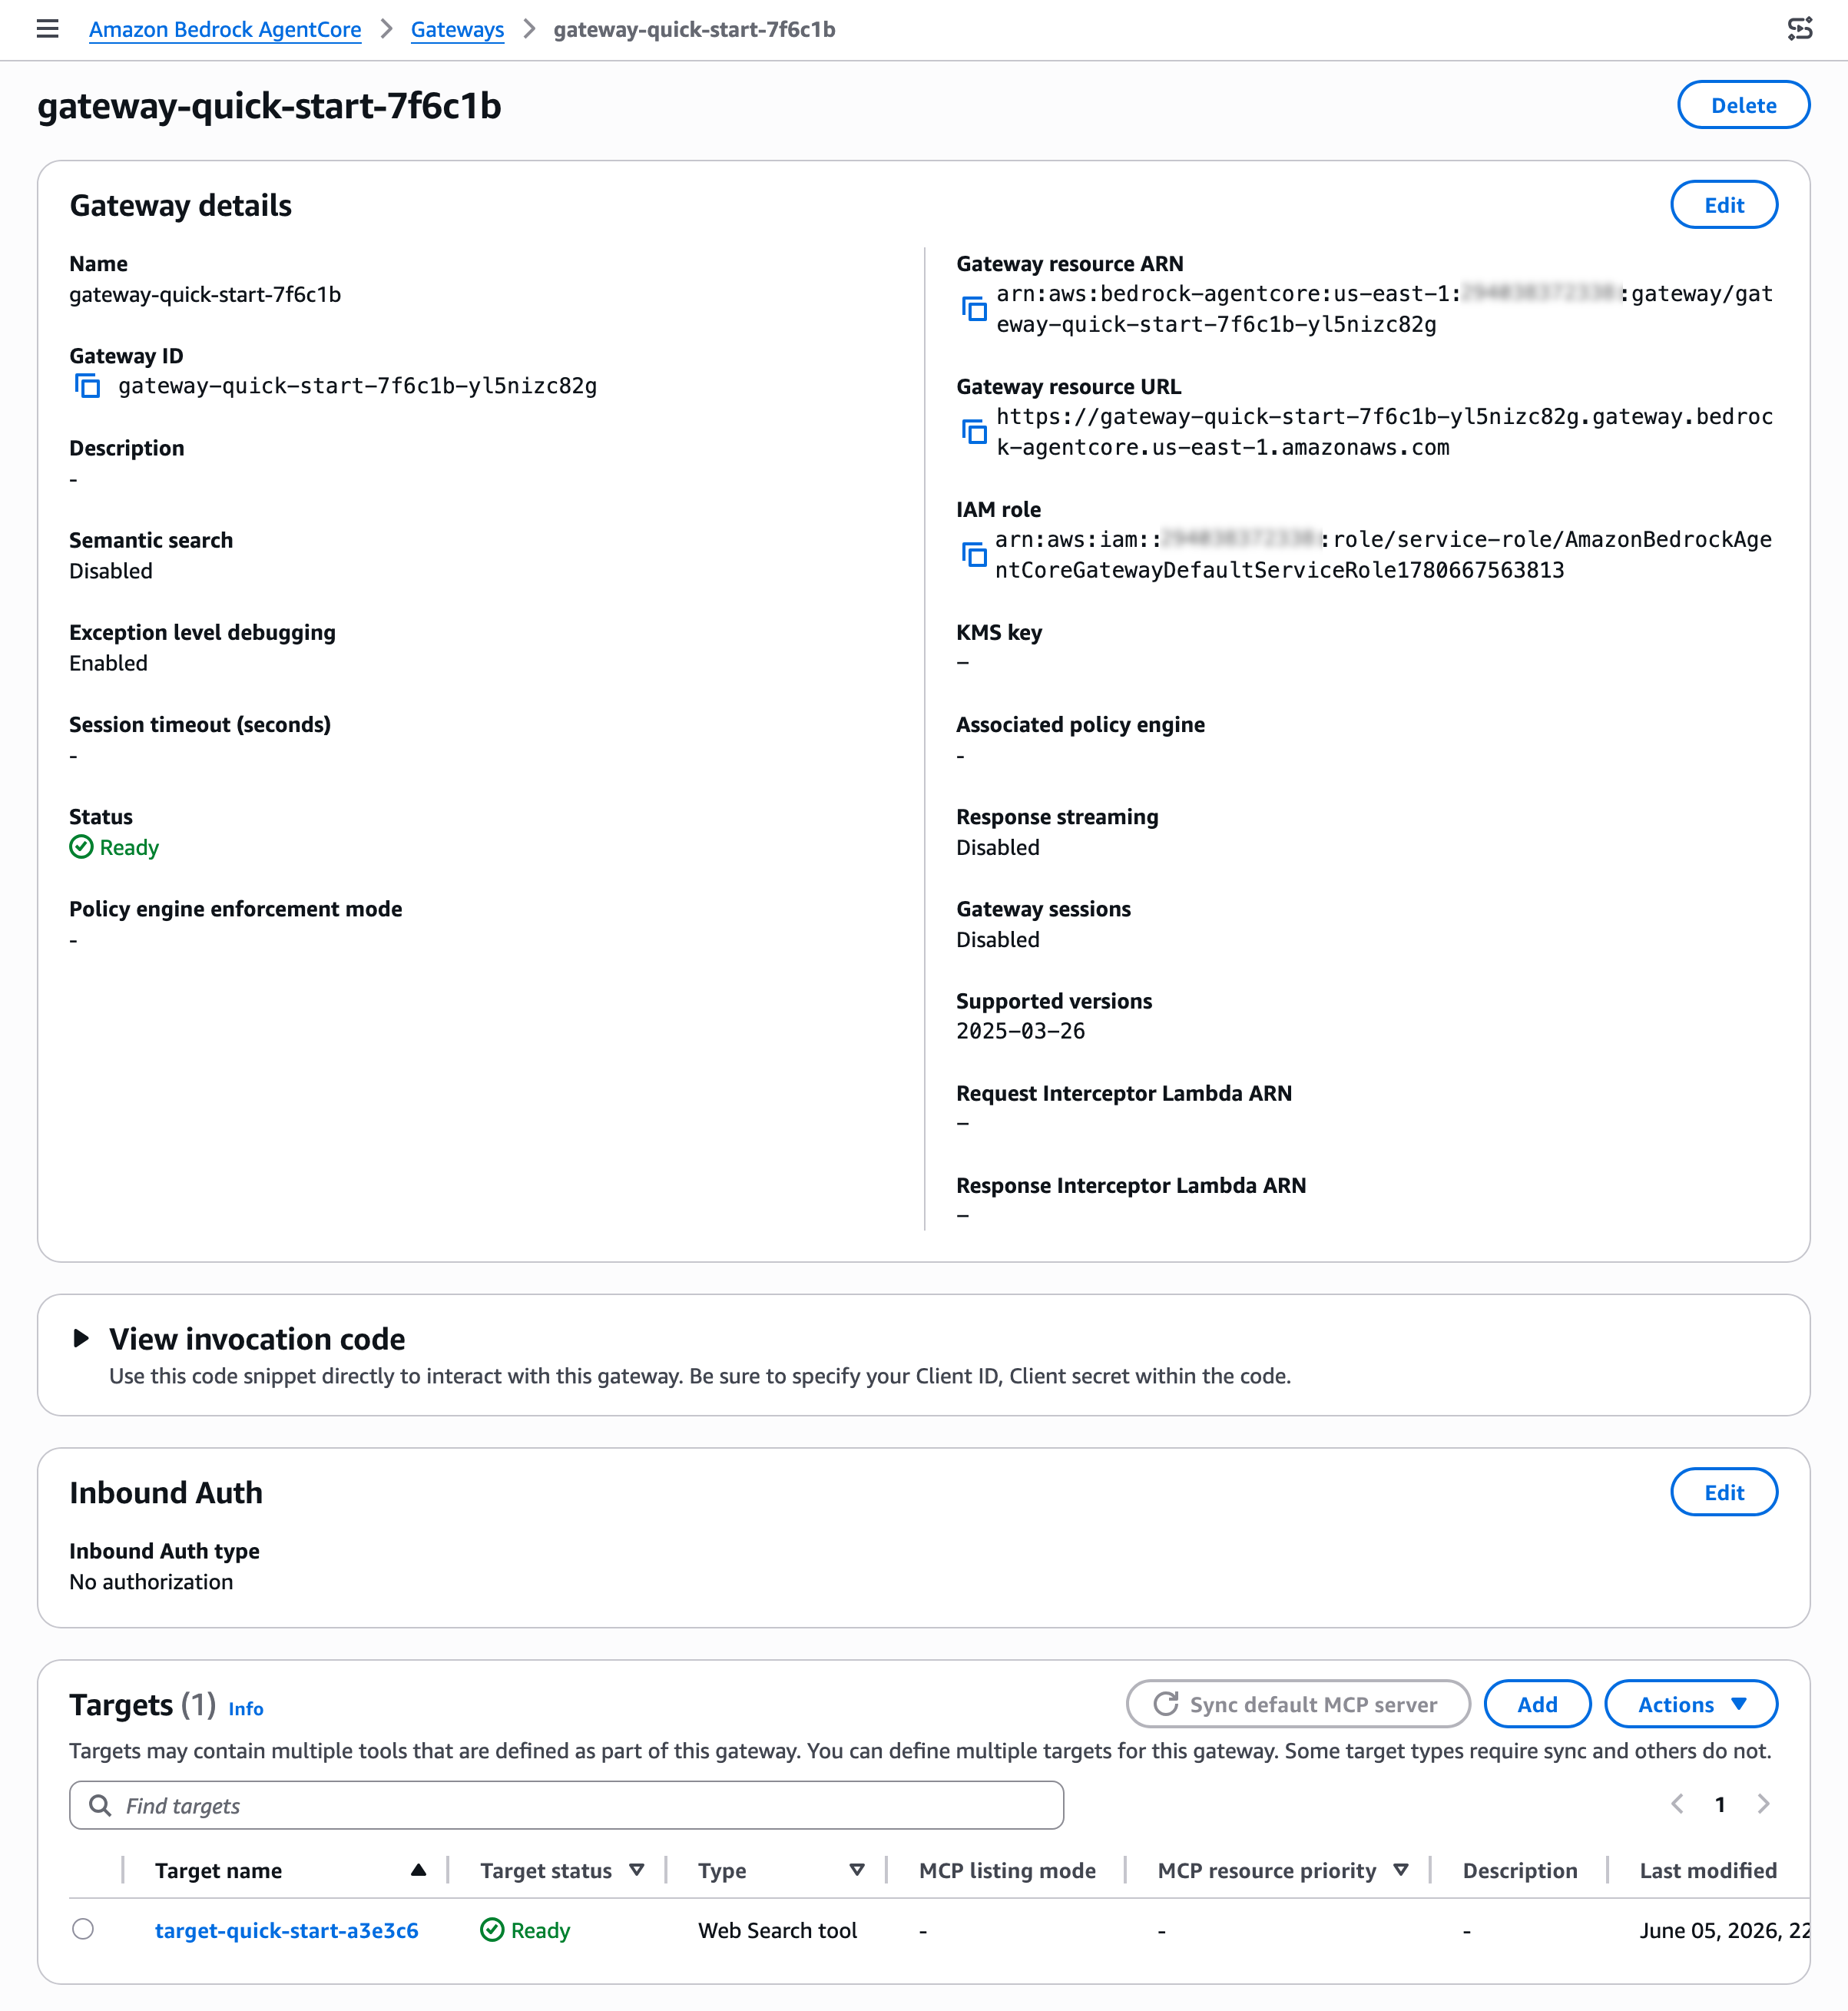
After creating your gateway, you can find the Web Search tool target on the detail page of your gateway. You can also add a new Web Search tool target to an existing gateway.
To interact with Web Search tool, use the sample invocation code in the View invocation code section. You can use code snippets through Python codes with API requests, MCP Python SDK, Strands MCP Client, and MCP Inspector.
For example, you can interact with the MCP Inspector, an interactive developer tool for testing and debugging MCP servers. When you connect to the MCP server through the Gateway resource URL, you will find a Web Search tool for each connector target on the Gateway. Enter input the web search query and choose Run Tool to get the results.
Customer voices Some of our customers had early access to this new feature. This is what they shared with us:
Benchling helps scientists accelerate R&D, making it easy to centralize scientific data, collaborate across teams, and access insights. Nicholas Larus-Stone, Head of AI Agents at Benchling shared “Scientists using Benchling AI can now ask about a target they’re actively working on and get answers grounded in both their institutional data in Benchling and published literature. The result is more complete science, and hypothesis generation done right. Because we’re using the Web Search tool on Amazon Bedrock AgentCore, customers have a secure, governed environment to bring that high quality published data into their workflows without compromising how they manage their data.”
Gen Digital leads consumer and small business cyber safety, offering antivirus, antimalware, identity and privacy protection, virtual private networks, and cloud backup. Iskander Sanchez-Rola, Senior Director of AI & Innovation, Gen Digital shared “With the Web Search tool on Amazon Bedrock AgentCore, Norton Revamp helps professionals build their online reputation with current, grounded content ideas shaped by what’s actually happening in the world today. What we value most is that AWS uses its own search index and keep queries within our trusted AWS environment.”
Now available Web Search on Amazon Bedrock AgentCore is generally available today in the US East (N. Virginia) Region. For Regional availability and a future roadmap, visit the AWS Capabilities by Region.
You can get started with Web Search on Bedrock AgentCore at no additional cost. You pay only for the data transfer charges you use for the Gateway. New AWS customers also receive up to $200 in Free Tier credits. To learn more, visit the Amazon Bedrock AgentCore pricing page.
Today, we’re announcing AWS Transform – continuous modernization (preview), a new capability of AWS Transform for continuous, autonomous tech debt analysis and remediation at scale. AWS Transform already helps enterprises migrate out of data centers, modernize mainframe and Windows applications, and handle the undifferentiated work of software maintenance: upgrading Java versions, swapping deprecated frameworks, and updating AWS Lambda runtimes before they reach end of life. This new experience builds on this. Customers get full visibility into the state of their codebase across thousands of repositories, prioritized findings, and the pull requests that make the fixes.
Engineering organizations typically consume up to 30% of IT budgets. Customers stitch together point tools: one to detect dependency issues, another to flag vulnerabilities, another for code quality. But no existing tool detects, prioritizes, and remediates tech debt continuously and at scale. The result is a manual, app-by-app cycle that drains engineering capacity. Leaders fall back on self-reported team status that lags reality and hides regressions. AI-assisted development makes this worse: as coding agents accelerate the pace of change, tech debt accumulates faster than developers can keep up. Customers need a capability that detects, prioritizes, and remediates tech debt continuously, autonomously, and at scale.
Continuous analysis To address the visibility challenge, this new capability within AWS Transform automatically scans your code repositories against configurable baselines and generates findings in hours, not weeks. Out of the box, AWS Transform – continuous modernization includes policies for detecting end of life dependencies, deprecated frameworks, and other common sources of technical debt. You can also extend these with your own remediation patterns specific to your organization, including approved libraries, internal coding standards, or tech debt policies your platform team already enforces. For example, if your team has deprecated an internal library or prefers a particular logging pattern, you can codify that as a policy and run it across all your repositories continuously.
Unlike periodic manual efforts, continuous analysis provides ground truth directly from your code. When a repository falls behind your baseline, you know immediately, showing which components are behind and by how much, regardless of how the team chooses to address it. This eliminates the need for status check-ins and manual compliance tracking, giving platform teams an always current view of their technical debt landscape.
Autonomous remediation at scale Once you’ve identified and prioritized findings, you can configure autonomous remediations that generate pull requests for affected repositories automatically. This new AWS Transform capability provides out-of-the-box remediation transformations for common scenarios such as Java version upgrades, SDK migrations, and library updates. You can also create custom transformations for organization-specific patterns.
When you launch a remediation, the continuous modernization capability creates pull requests for each affected repository, notifying the owning team with a message like: “This repository is behind on your organization’s baseline for this dependency. Here’s a PR that resolves it.” Teams can review and merge the PR, or choose to remediate using their own approach. Either way, continuous analysis detects when the fix is in place, providing ground truth without requiring manual confirmation.
AWS Transform – continuous modernization integrates with AWS Security Agent to detect and remediate security vulnerabilities at the source-code level, so security findings flow into the same prioritized list and pull-request workflow as other tech debt.
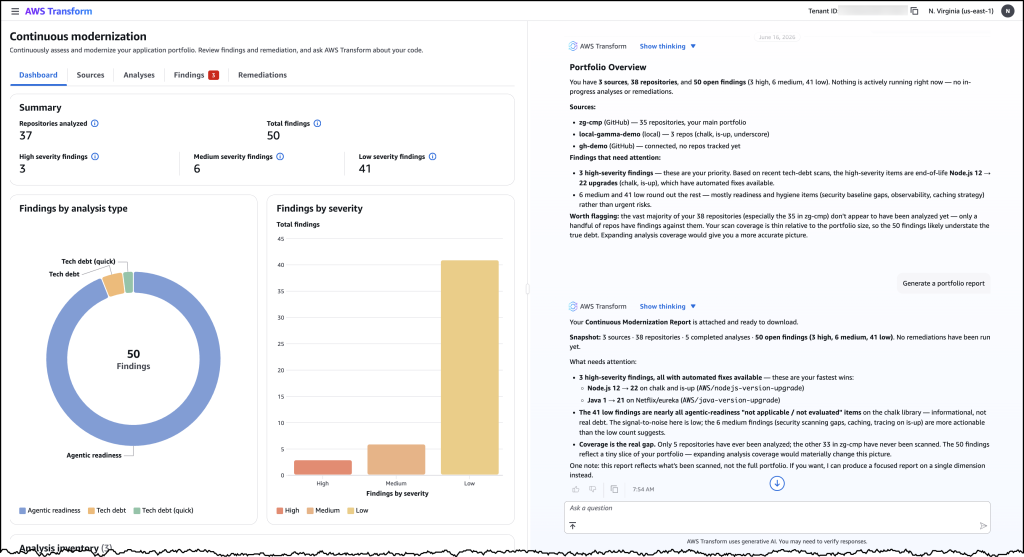
Let’s try it out To get started with, I navigated to the AWS Transform web application. From the dashboard, I can see an overview of my organization’s repositories and their current status against my configured baselines.
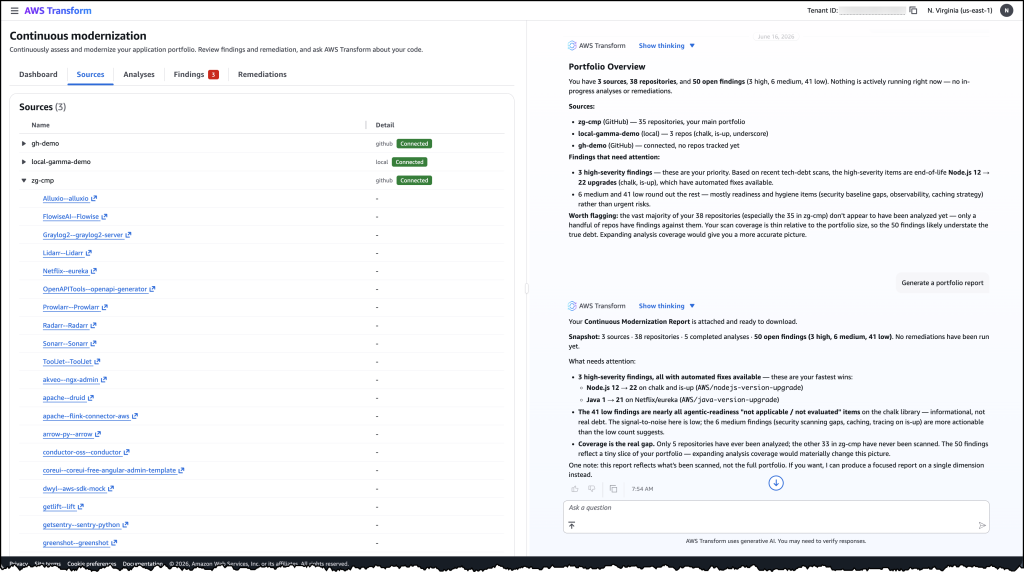
First, I connected my source control system and initiated an analysis against my specified policies. Within hours, the analysis returned findings across my repositories, showing which ones were behind the baseline and by how much. I could see the severity, the number of affected files, and the specific tech debt patterns detected.
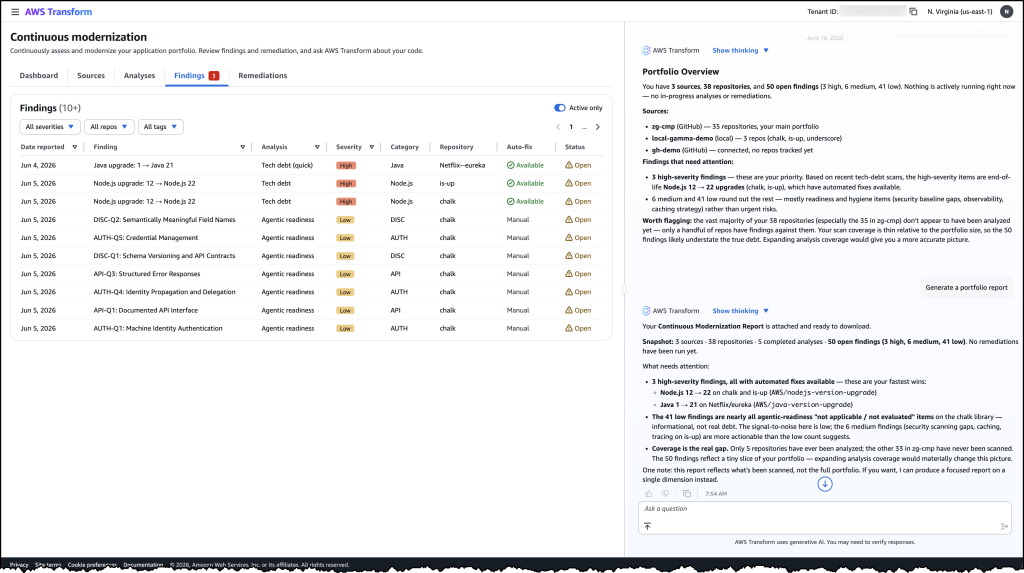
From here, I selected a group of high-priority findings and launched a remediation campaign. AWS Transform – continuous modernization generated pull requests for each affected repository. I could monitor the campaign’s progress in real time, seeing which PRs were created, which were merged, and which repositories returned to compliance.
Image 1: AWS Transform – continuous modernization dashboard showing a portfolio overview of your technical debt findings across all connected repositories.
Image 2: The detailed findings view listing individual tech debt items by severity, category, and repository with their available remediation options.
Image 3: The sources view showing connected repositories from GitHub and local environments that continuous modernization is tracking for analysis.
Faster ways to modernize These capabilities support two distinct approaches to code modernization. In continuous mode, you can use continuous modernization to keep your codebases current as baselines evolve. Think of this as the day-to-day work of upgrading libraries, applying security patches, and enforcing coding standards across your organization.
For larger modernization projects, such as migrating from one framework to another or upgrading a major runtime version across hundreds of applications, you can use campaign mode for targeted, project-based modernization. AWS Transform custom continues to provide the flexible primitive for these larger efforts. AWS Transform – continuous modernization is purpose-built for the recurring, high-volume work that platform teams manage every day.
Now available AWS Transform – continuous modernization (preview) is available today. You can get started through the AWS Transform web application, via the AWS Transform Kiro Power, or through MCP and skills for integration with your existing coding agents. To learn more, visit the AWS Transform documentation.
Today, we’re announcing a new release management capability in AWS DevOps Agent that is now available in preview. AWS DevOps Agent is your always-available teammate that spans software changes and operations across AWS, multicloud, and on-premises environments. The practice of DevOps aims to make software change and operations smooth and increasingly autonomous, and AWS DevOps Agent delivers on both by leveraging its deep understanding of your environment, your services, their dependencies, and how they behave in production. Already generally available for post-deployment operations, it autonomously investigates incidents, provides root cause analysis and mitigation steps, and delivers targeted recommendations to prevent recurring issues. With today’s preview, AWS DevOps Agent adds release readiness review of code changes and autonomous release testing. These new features verify every change against the natural language standards you give to the DevOps Agent and run change-specific tests in production-like environments. AWS DevOps Agent now supports teams from code creation to production, helping reviewers and testers keep pace with the volume of AI-generated code.
As development teams adopt AI coding tools, the volume of pull requests moving through delivery pipelines has increased faster than review and testing processes can handle. When teams are under pressure to keep up, reviews are approved without thorough examination, and test environments drift from production. The value that coding agents generate sits waiting in review queues instead of reaching end users. At the same time, AI models are increasingly capable of catching functional and security issues that human reviewers might miss under time pressure, making speedy and safe delivery a requirement rather than a tradeoff.
The release readiness review feature evaluates every code change against production requirements, dependency safety, and the standards and best practices you provide to the DevOps Agent. The agent checks cross-repository dependency risks that could affect other services, access control changes against AWS Well-Architected Framework best practices, and compliance with any standards you have defined. When no standards are provided, the agent applies general best practices. As part of the review, the agent also runs your software in an AWS-managed isolated environment, executing lightweight user journey tests to verify the software builds, runs, and passes basic functional checks before the change enters the pipeline. Findings appear in the AWS DevOps Agent console and as comments on pull requests in GitHub or GitLab. You can also invoke reviews directly from your IDE through the Kiro power or Claude Code plugin, so developers can identify and fix dependency risks, standards violations, and access control issues before the change is committed to version control.
The autonomous release testing feature goes further, generating and running change-specific test plans for web and API-based applications in customer-provisioned, production-like environments before the change merges. Rather than running a static test suite, the agent reasons about what the change does and constructs tests tailored to it, covering functional correctness, behavioral regressions, and integration scenarios that a manually maintained test plan might not anticipate. Every test run produces structured artifacts including metrics, logs, traces, and an execution summary, giving reviewers a consistent record of what was tested and what the results were.
Getting started with AWS DevOps Agent release management This walkthrough shows how to run an on-demand release readiness review using the AWS DevOps Agent web app. Before you begin, confirm that you have at least one GitHub or GitLab repository connected to your Agent Space. Once your repositories are connected, AWS DevOps Agent will index your code and build a knowledge graph of cross-repository and cloud dependencies.
To open the web app, navigate to the AWS DevOps Agent console, select your Agent Space, and choose the Web app tab. Choose Operator access to open the web app.
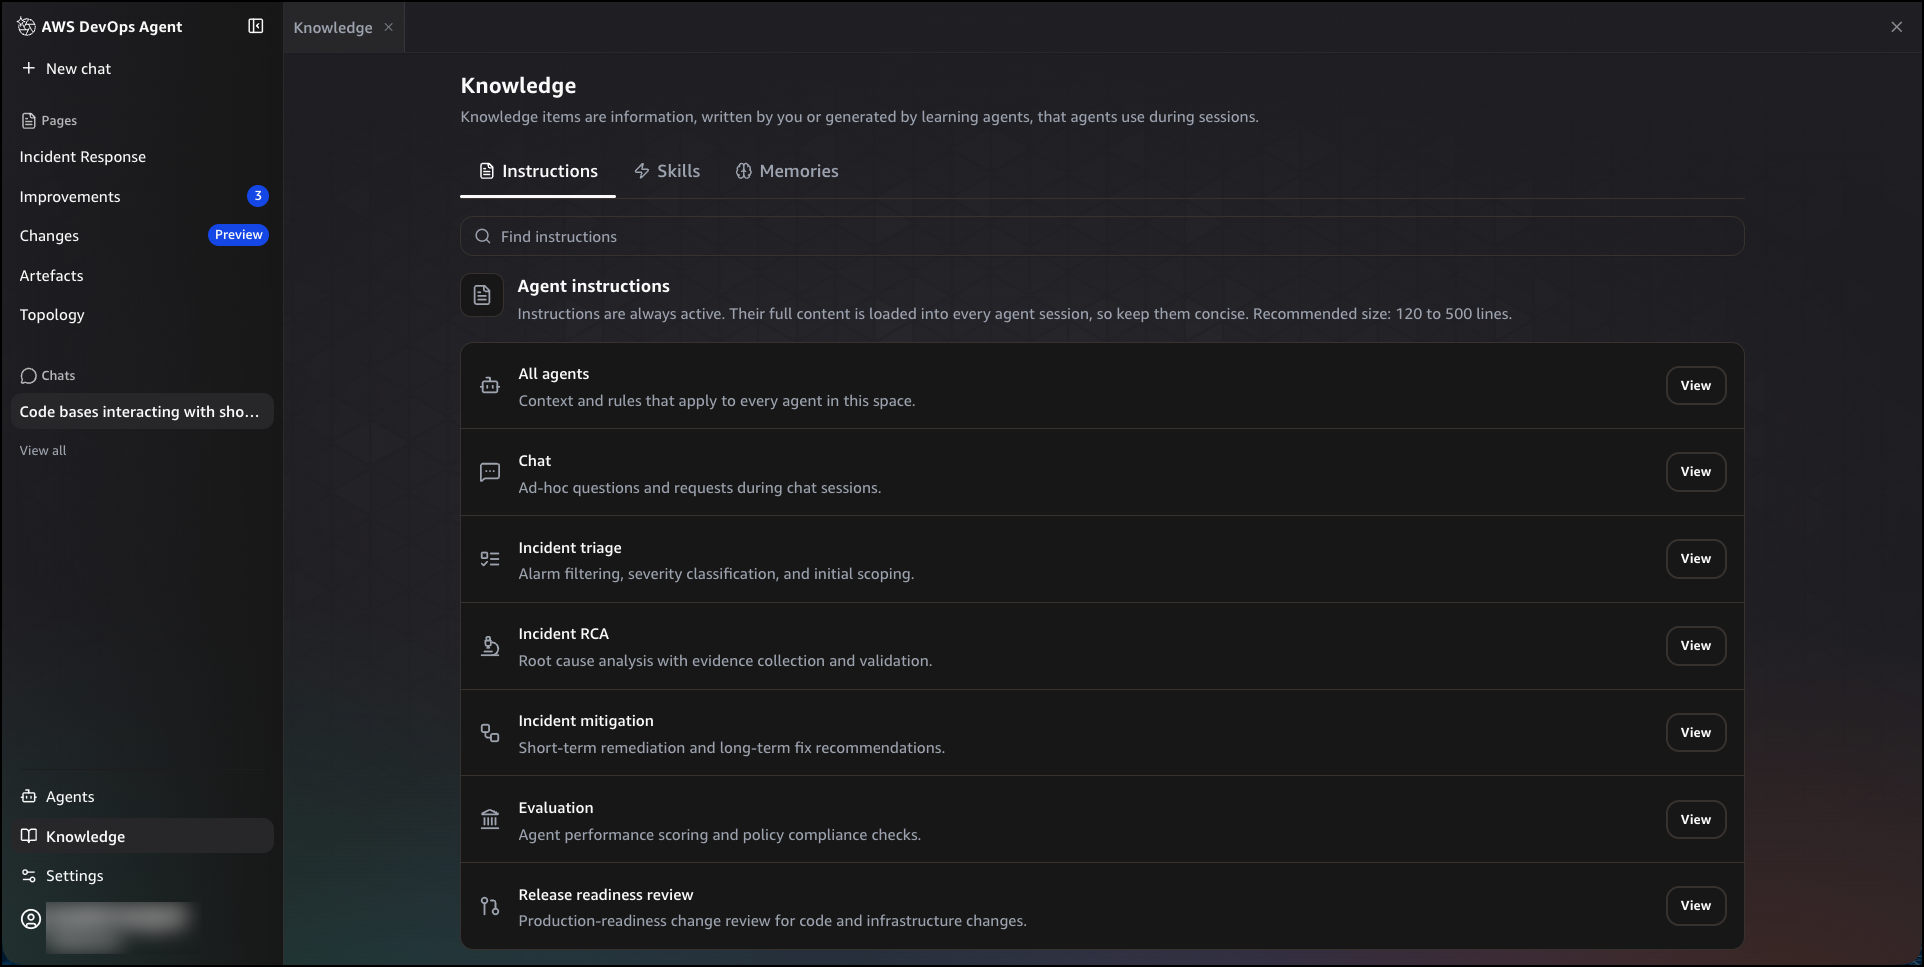
Without standards configured, the agent applies general best practices. To tailor reviews to your internal standards, navigate to Knowledge, then choose the Instructions tab. You will see a list of instruction sets, each scoped to a specific agent or task. Choose View next to Release readiness review to edit the instructions for production-readiness change review. Write your internal standards in plain English. For example, you can define infrastructure and data standards on encryption or network access rules, best practices that warn without blocking such as logging and observability requirements, and sensitive data classification best practices that identify applications or resources requiring higher security measures. To apply instructions across all agents in your space, choose View next to All agents.
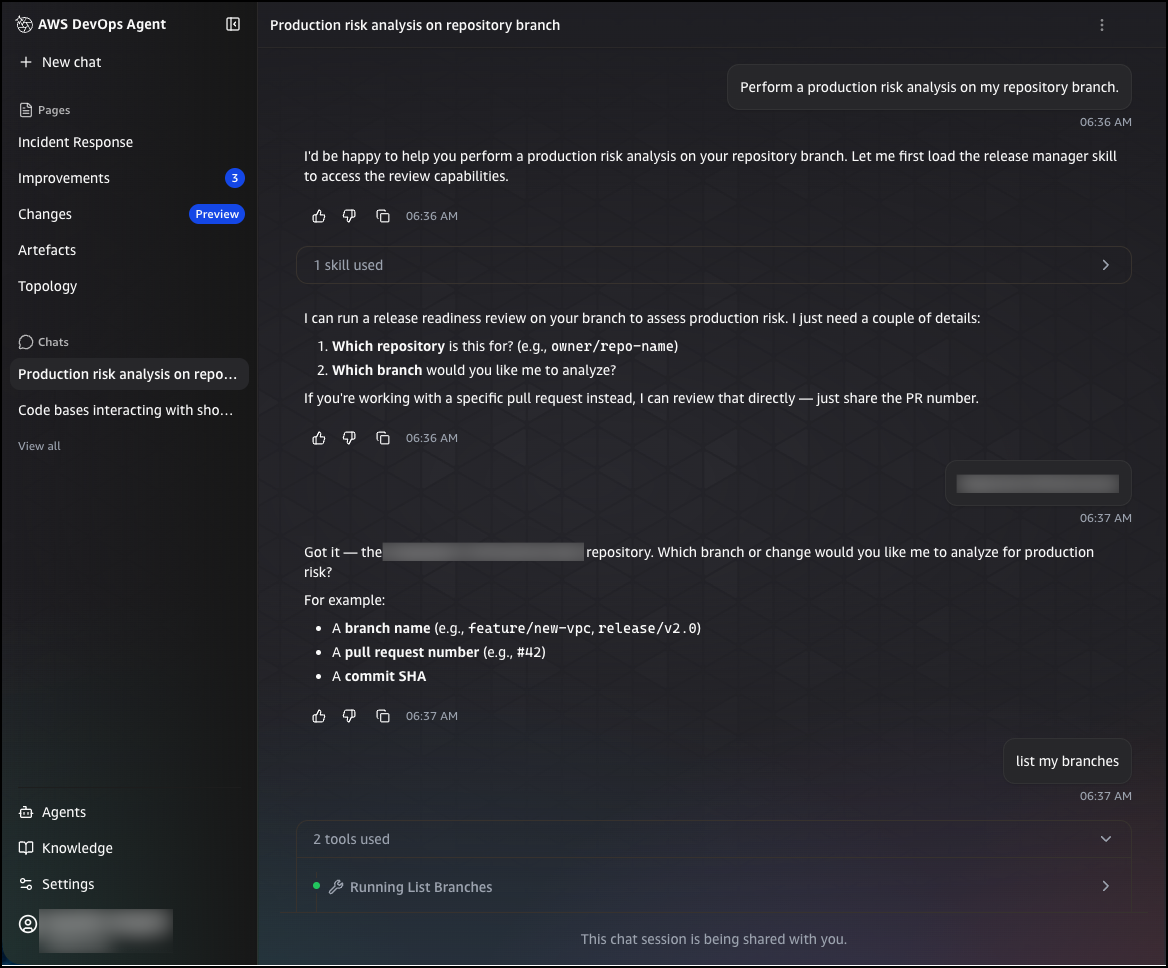
You can trigger a release readiness review in two ways: by submitting a pull request to a connected repository, or by entering an on-demand query in the chat interface. To run an on-demand review from chat, choose New chat and enter a request such as:
Perform a production risk analysis on my repository branch
The agent will ask for the repository and branch you want to analyze. You can provide a branch name, a pull request number, or a commit SHA. Once you confirm your selection, the agent queues the review and analyzes the change for production risks, including infrastructure impacts, configuration changes, and potential issues.
After the review completes, you can ask follow-up questions directly in the chat to explore the findings in more detail. For example, you can ask which downstream consumers a change affects, and the agent will return a structured breakdown of in-repository and cross-repository consumers that will break, the specific files and line numbers affected, and the recommended steps to resolve the issue before deployment.
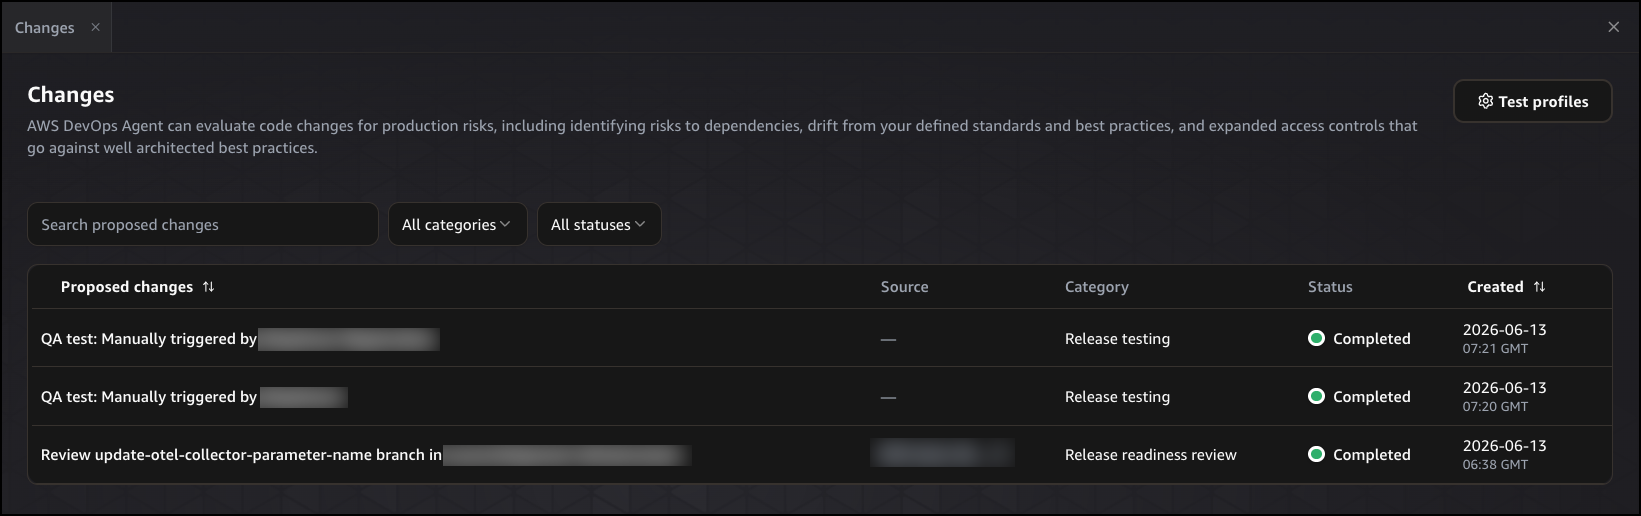
After submitting a review request, navigate to Changes in the left navigation pane. The Proposed changes table shows each review that has run, including the proposed change description, its source, category, status, and when it was created. You can filter by category or status to find specific reviews, or search by name using the search bar. Choose any entry to open the full execution detail.
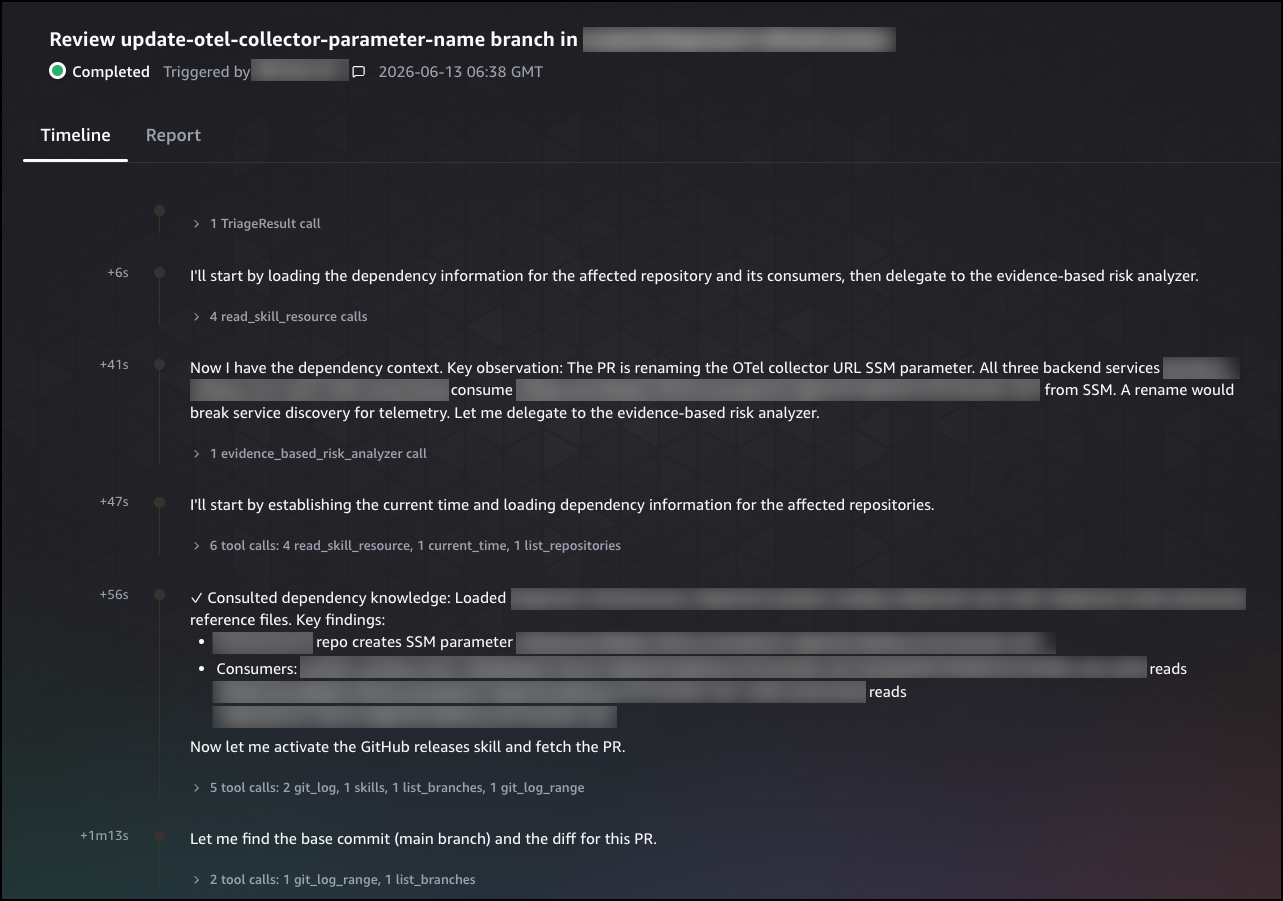
The Timeline tab shows the agent’s step-by-step reasoning process, including the tools it called, the dependencies it consulted, and the observations it made at each step. Each entry is timestamped, giving you a complete record of how the agent built its understanding of the change and reached its conclusion.
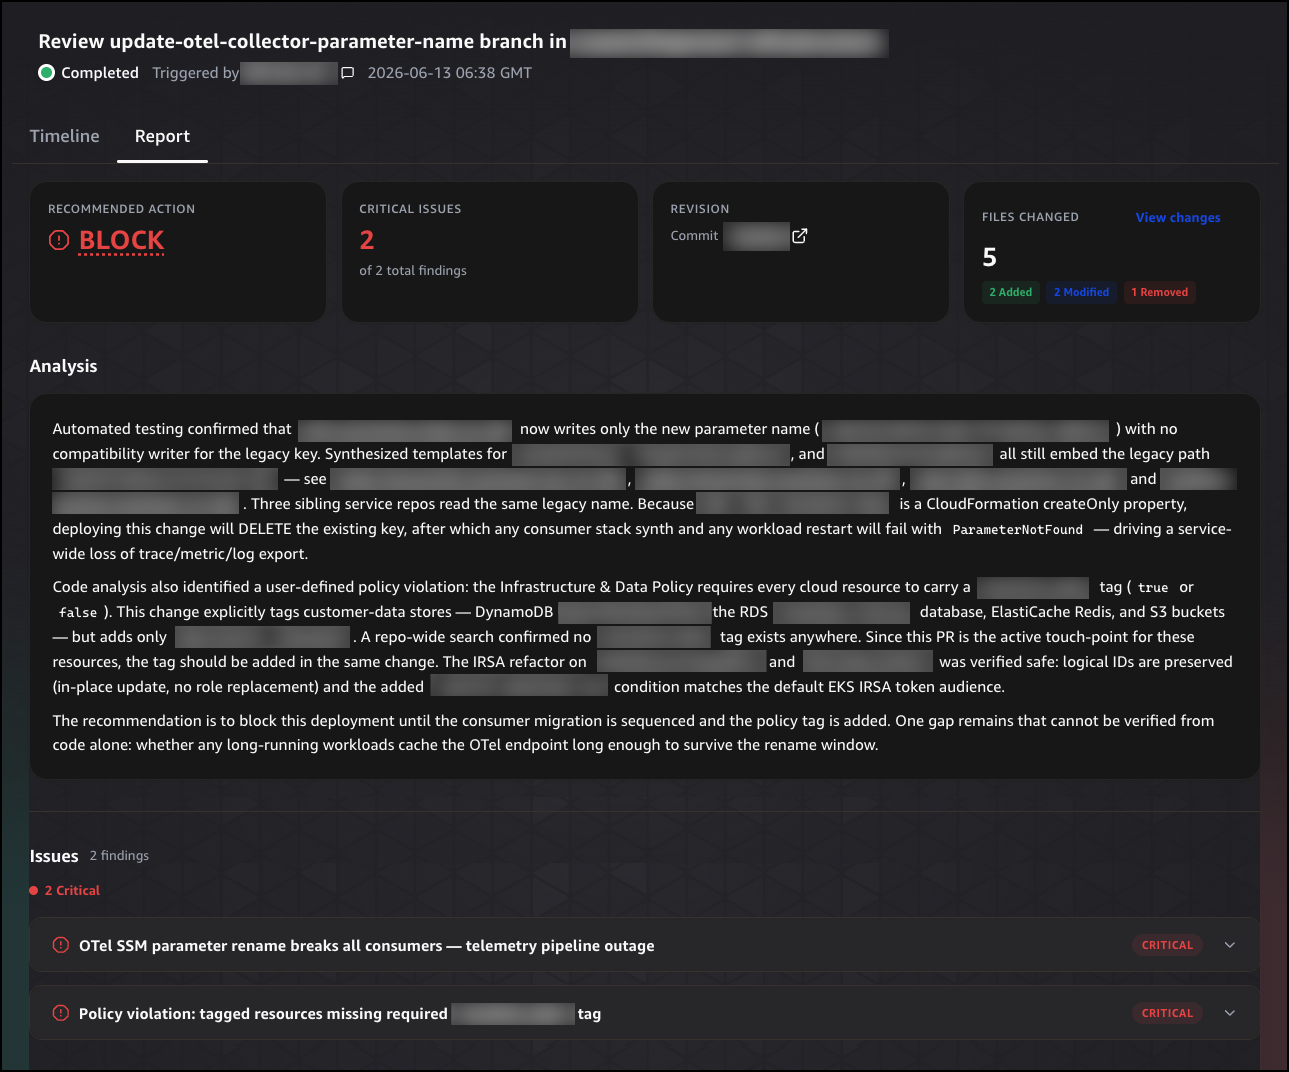
Choose the Report tab to see the final recommendation. The report opens with a summary header showing the recommended action, the number of critical issues found, the commit revision, and the number of files changed. The recommended action is either BLOCK, Proceed with Caution, or Safe to Release.
Below the summary header, the Analysis section explains why the recommendation was made, citing specific risks and the evidence the agent found to support its conclusion. The Issues section lists each finding by severity, giving you a prioritized view of what needs to be addressed before the change can proceed. The Recommendations section provides specific, actionable steps the developer can take to resolve each issue. Finally, the Changes section lists each file that was modified, with the type of change, the category it falls under, and a description of what was changed, so reviewers have a complete picture of what the change does before it merges.
You can also invoke the autonomous release testing feature directly from the chat interface. To run an autonomous release test on a web or API-based application, choose New chat and enter a query such as:
Run a release test on my application deployed at [application URL]
The agent generates a change-specific test plan and executes it in your provisioned environment. Results appear in Changes, where you can review the execution steps and a structured summary of what was tested.
Get started today The release readiness review and autonomous release testing features for AWS DevOps Agent are available in preview. These features are available at no additional cost during preview in the US East (N. Virginia) Region. For pricing information on other AWS DevOps Agent features, visit the AWS DevOps Agent pricing page.
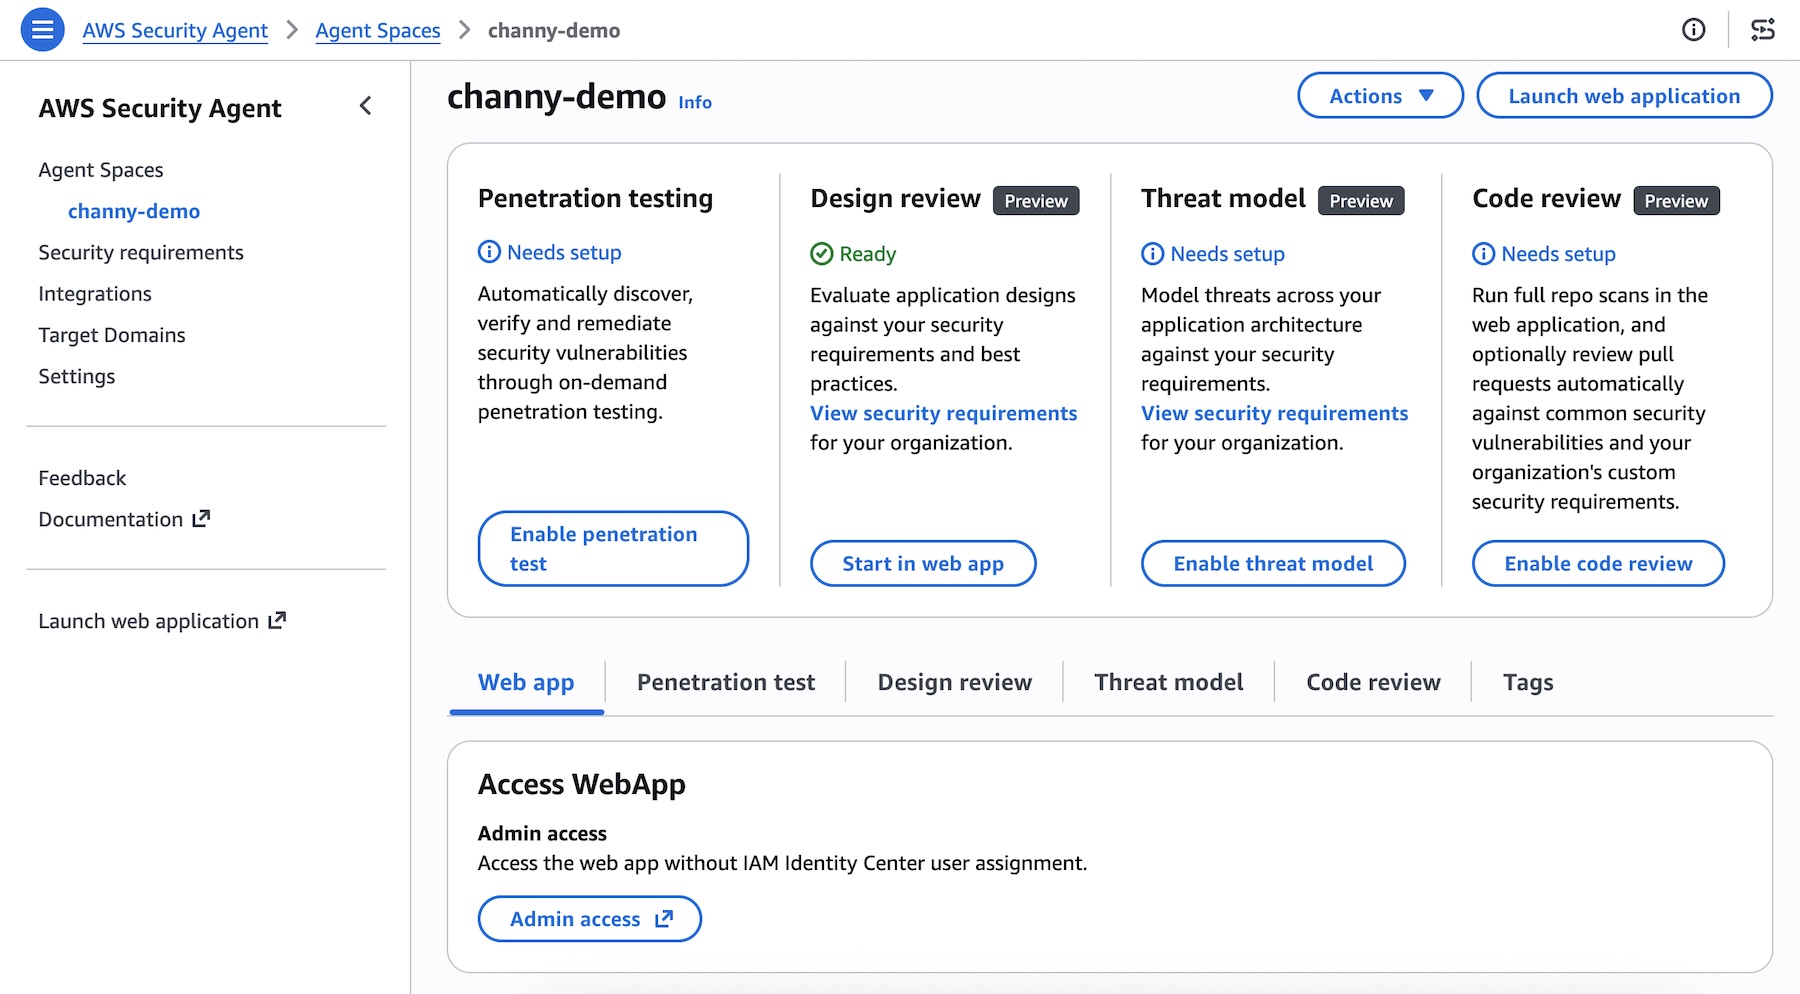
At re:Invent 2025, we previewedAWS Security Agent (now part of AWS Continuum), a frontier agent that proactively secures your applications throughout the development lifecycle across all your environments. You can perform on-demand penetration testing customized to your application, discovering and reporting security risks verified through exploitability testing.
Today, we’re introducing more features based on customer feedback:
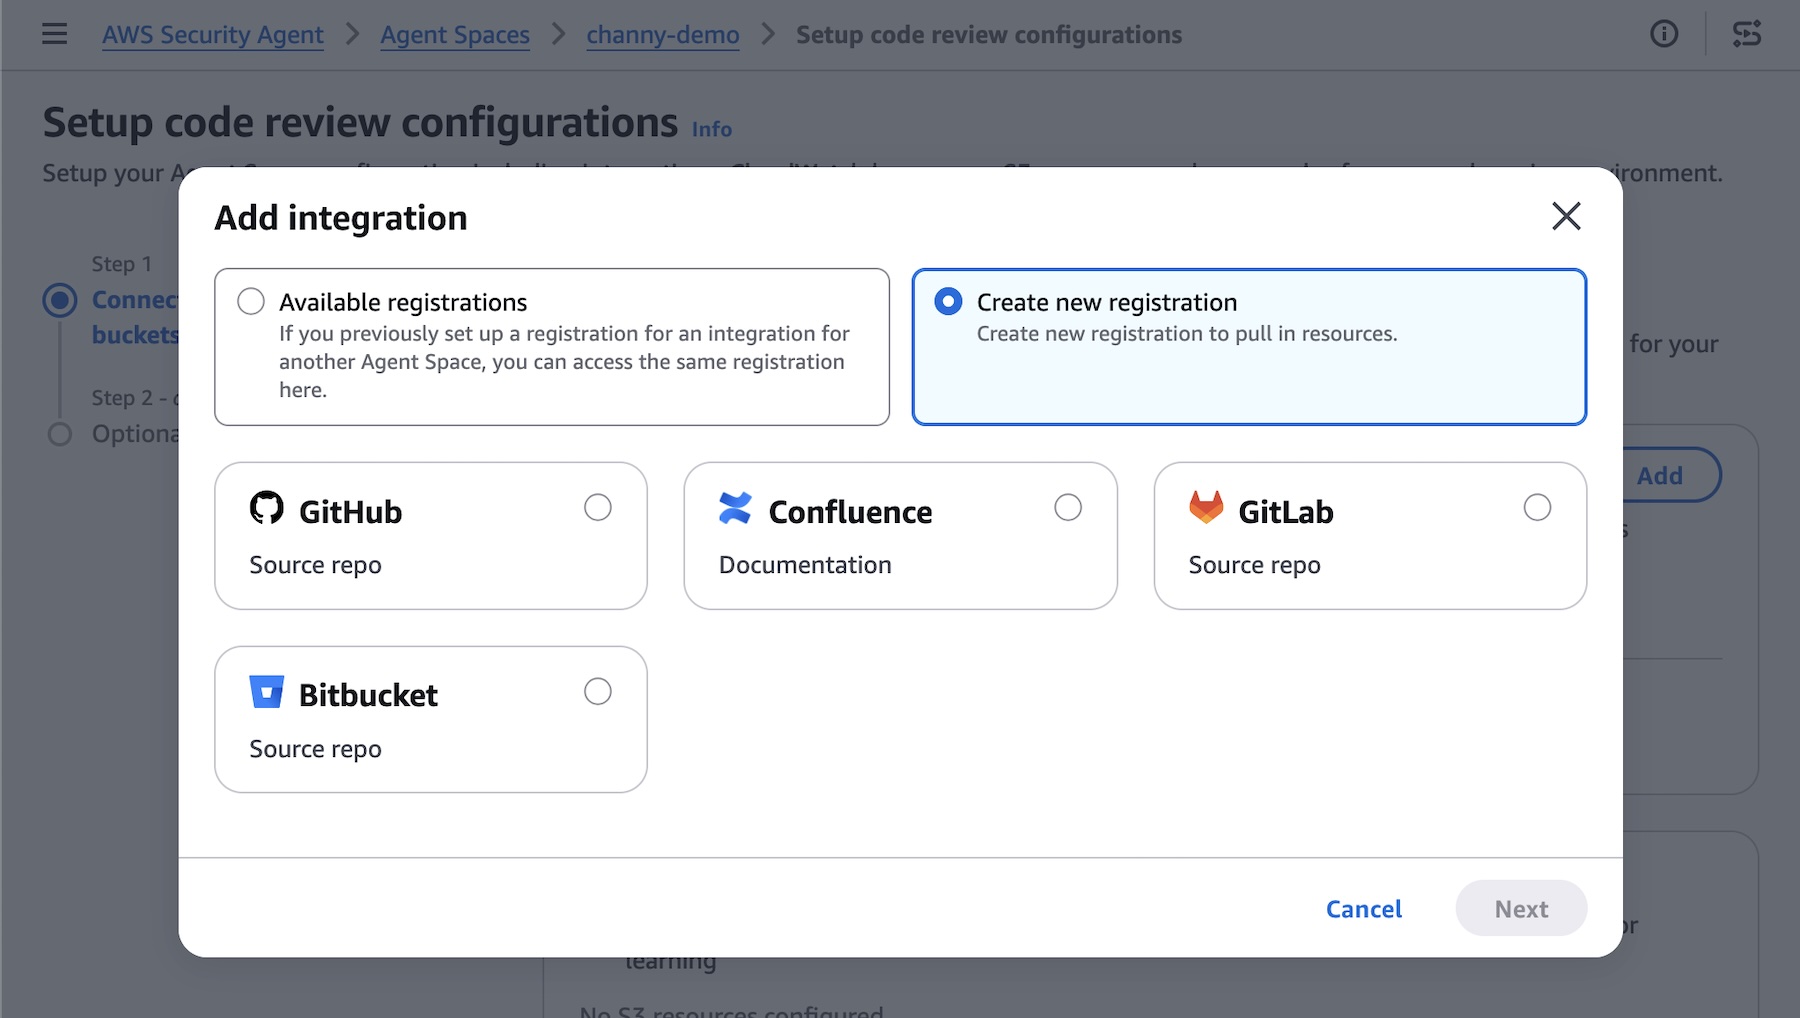
Code review updates (Preview) — You can now use pull request scanning with remediation, security requirements packs, and simulated validation. New integrations support GitHub, GitLab, Bitbucket, and Confluence.
Threat modeling (Preview) — AWS Security Agent analyzes your design documents or application source code, understands the full context of your application architecture and identifies threats with recommended mitigations using the STRIDE framework.
Kiro power, Claude Code plugin, and MCP integration — You can run code reviews, generate threat models, and remediate findings directly from your IDE, CLI, or any AI-powered IDE through an open MCP integration, with results surfacing inline without any context switching.
Let’s take a closer look at each launch!
Code review updates You can now connect to GitLab and Bitbucket in addition to GitHub— supporting both SaaS and self-hosted versions, so you can trigger scans regardless of where code lives. You can also integrate Confluence to reference your existing documentation as context for reviews.
To get started, choose Enable code review or update your code review setting in the Security Agent console.
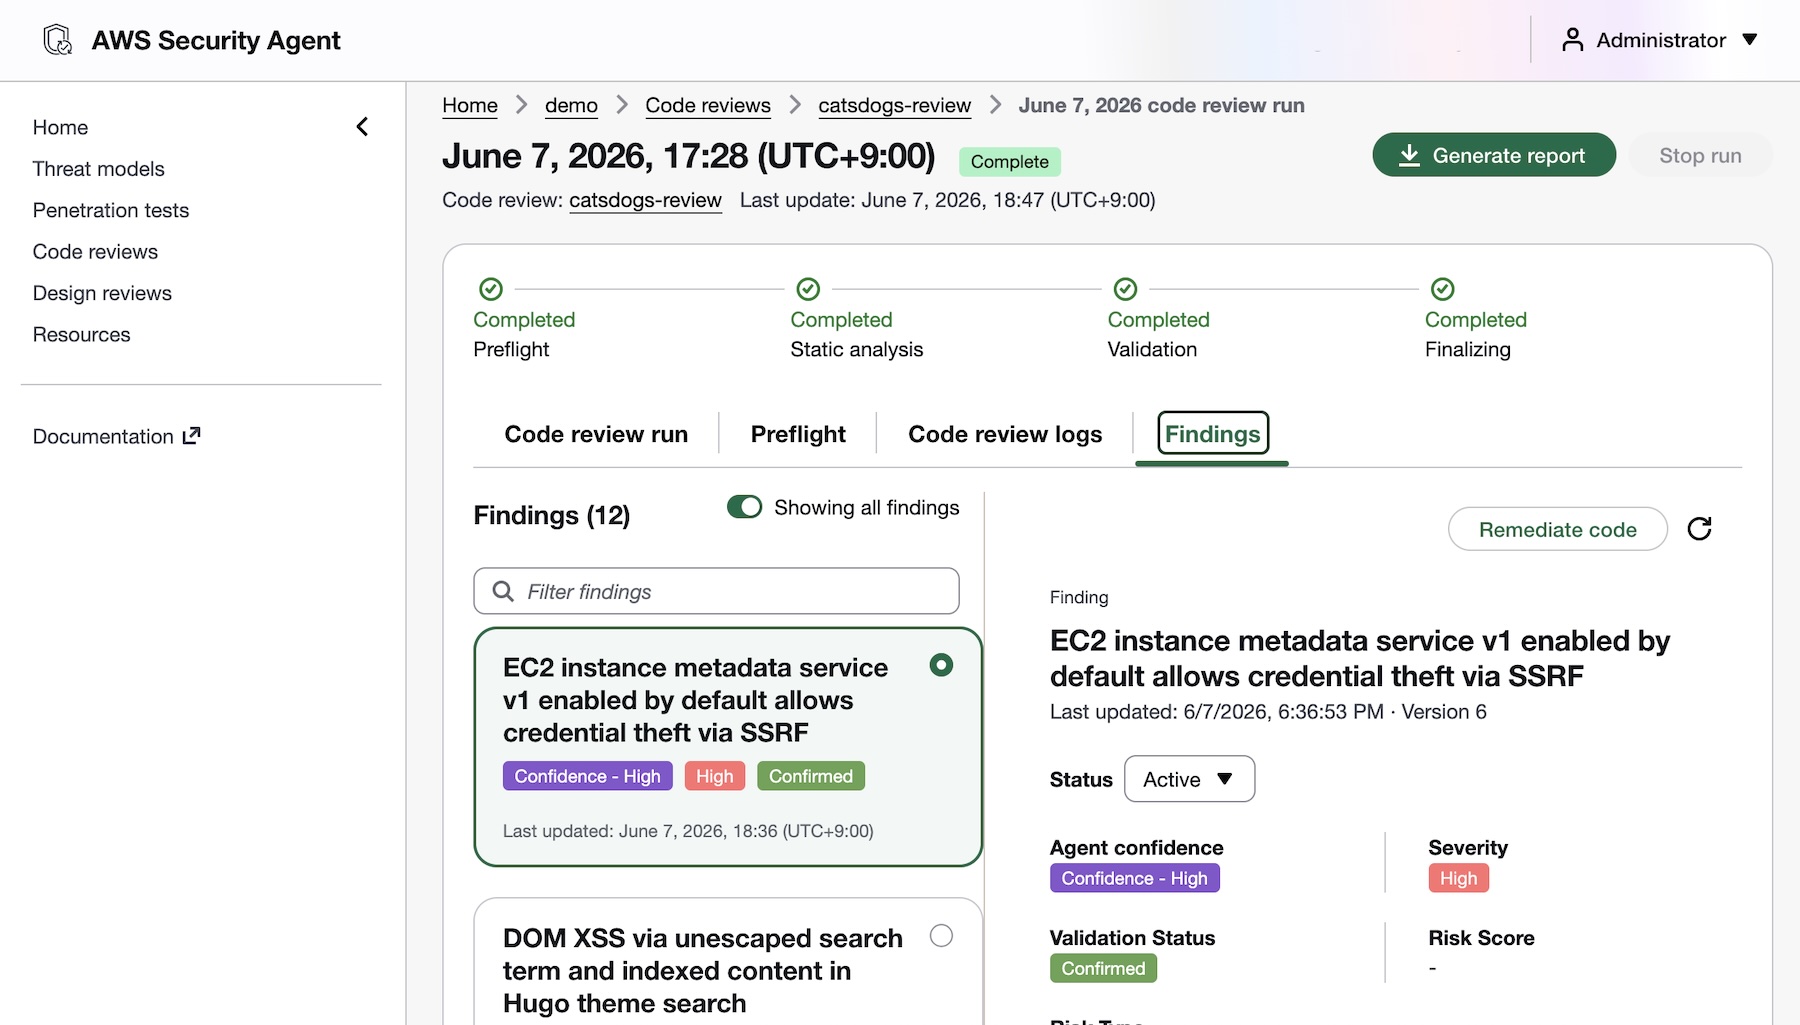
AWS Security Agent introduces deep, reasoning-based analysis on every pull request as well as full repository to identify complex vulnerabilities that go beyond pattern-matching. It checks against your organizational security requirements and common security risks to catch what other tools can’t. To get started, access the Security Agent web application and run your code review.
You’ll receive fix commits and remediation guidance directly in your GitHub, GitLab, or Bitbucket workflow, while your security teams configure the repositories to be monitored and intervene on critical issues. AWS Security Agent validates findings in simulated environments to demonstrate proof of exploitability. This embeds security expertise across all repositories, reducing security-related delays in the development pipeline.
To learn more about new code review features, visit Create a code review in the AWS Security Agent User Guide.
Design review updates You can continuously validate your security requirements across every design and code review with managed compliance packs: AWS WAF, NIST CSF, PCI DSS, and AWS best practices, or import your own organizational requirements directly from internal documents or Confluence. Every finding maps back to your compliance posture, so teams stay audit-ready as they build.
Threat modeling AWS Security Agent generates threat models based on your design documentation or code repository, creates and build context about the application, including data flows, architecture, and trust boundaries. It maps out all components of your application, identifies potential threat actors and attack vectors, determines where weaknesses may exist, and prioritizes threats so you know what to address first.
To get started, choose Enable threat model and Connect source code repository in the Security Agent console.
Kiro power and Claude Code plugin for Security Agent AWS Security Agent introduces a new Kiro power and Claude Code plugin (coming soon) and can be integrated with any AI IDE through an open MCP integration to secure your applications. You can trigger threat models and code reviews directly from your IDE, with results surfacing inline without any context switching.
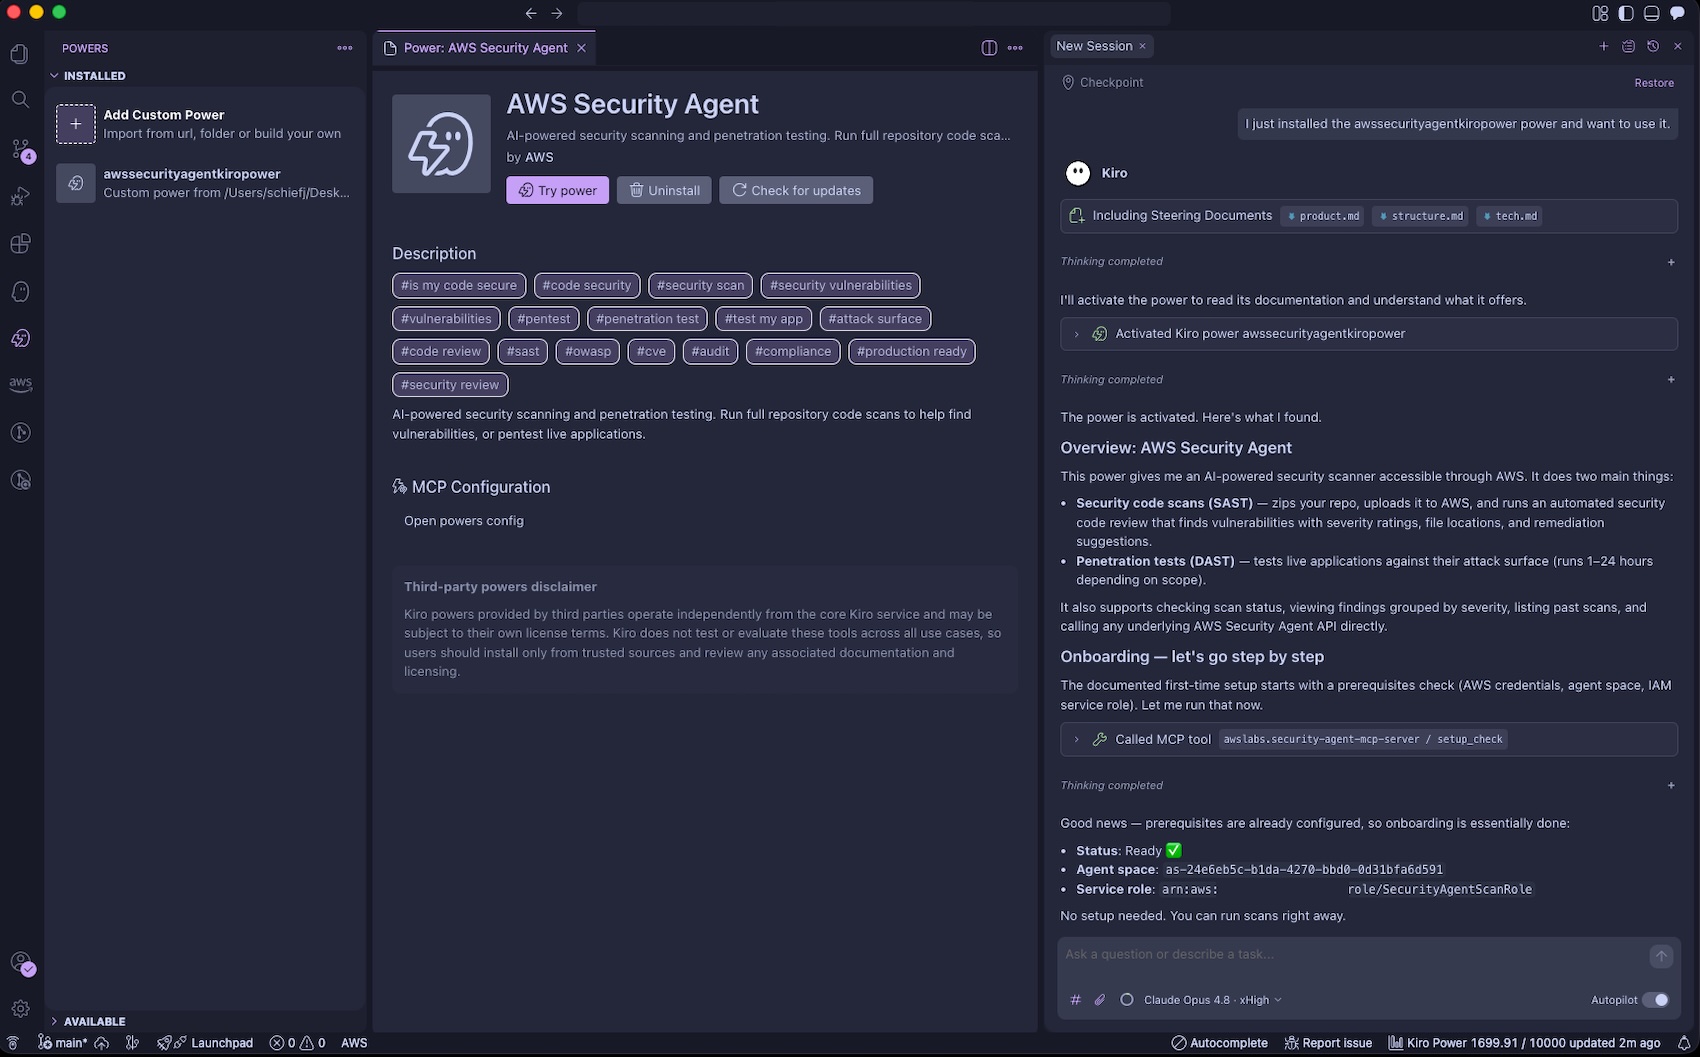
To get started, install the Kiro power, and run your prompts. The Kiro power uses the AWS Security Agent MCP server. You can get started with the power by asking “Set up AWS Security Agent“. Kiro will check if you have an Agent Space and ask if you would like to use the existing one or create a new one.
With the Kiro power for Security Agent, you can catch vulnerabilities on every pull request as you build and scan an entire repository to surface accumulated risk by asking “Run a full security scan on this repo“. The Security Agent power includes an Agent hook to evaluate if a code review diff scan should be started after the Kiro agent has completed its turn. Before deploying to production, you can run a penetration test from your CLI to find what most scanners miss. Security Agent closes the loop by validating every finding and generating ready-to-implement code fixes.
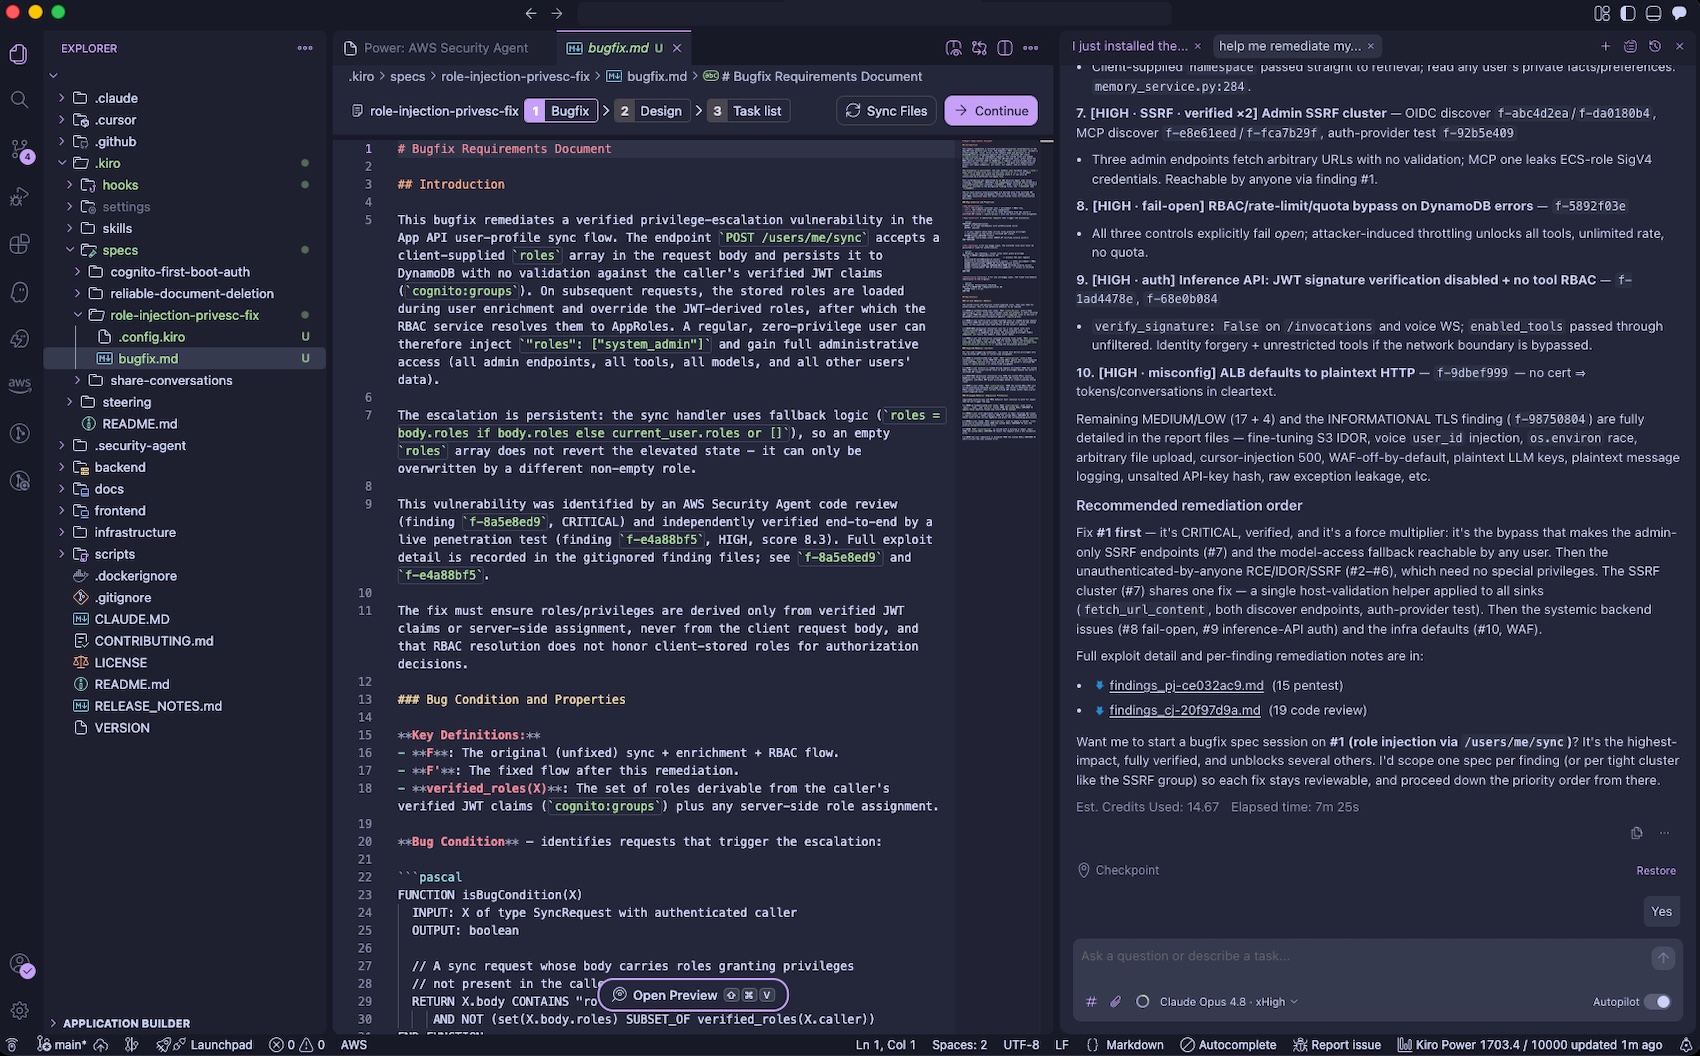
You can pull the findings back into your development environment by asking “help me remediate my findings“. The Kiro power for AWS Security Agent will download findings to your local workspace, prioritize the most critical finding, and offer to start a bugfix spec session. You can iterate on fixing the findings using their familiar IDE with their existing tooling, steering, powers, and MCP servers.
You can also run threat models through the Kiro power in the IDE by asking “Build a threat model for this application“. The generated threat model is saved to .security-agent/threat_model.md.
Now available AWS Security Agent understands the full security context across your software development lifecycle by covering design-time security (design reviews and threat modeling in preview), development-time security (code review in preview), and deployment-time security (penetration testing in GA), in a single, unified agentic offering. To learn more, visit the AWS Security Agent product page and the technical documentation.
These features are now available in AWS commercial Regions where AWS Security Agent is available. For Regional availability and the future roadmap, visit the AWS Capabilities by Region. For detailed pricing information and to access our 2-month free trial offer, please visit the AWS Security Agent pricing page.
Jan Kara has been working
on cleaning up how buffer
heads are used by some kernel filesystems. In a short
filesystem-track session at the 2026 Linux Storage,
Filesystem, Memory Management, and BPF Summit, he gave an update on
that work and where it is headed. Topics included generic infrastructure
to track buffer heads for metadata, a buffer-head cleanup for the Amiga
filesystem, and some planned locking fixes.
User authentication remains one of the most targeted touchpoints in application security. With the industrialization of fraud threats by generative AI, cybercrime costs are expected to reach $23 trillion in 2027, an increase of 175 percent from 2022. 20 percent of fraud is attributed to synthetic identity and authentication exploits, with account takeover (ATO) surging 141 percent since 2021.
But the damage goes beyond security. SMS One-time passcodes (OTPs) achieve only approximately 80 percent conversion on authentication flows, meaning 1 in 5 legitimate users is lost at the point of verification. Enterprises absorb hundreds of thousands of password recovery helpdesk tickets annually, representing significant support costs tied to OTP-based verification. Every abandoned authentication attempt today represents an opportunity to maximize your conversion rates across checkout, account recovery, and onboarding flows. The industry has long assumed that stronger security requires more user friction. That isn’t a law of physics. It’s a limitation of the tools available. Mobile operator network data removes that constraint and provides stronger identity assurance and a smoother experience, not one at the expense of the other.
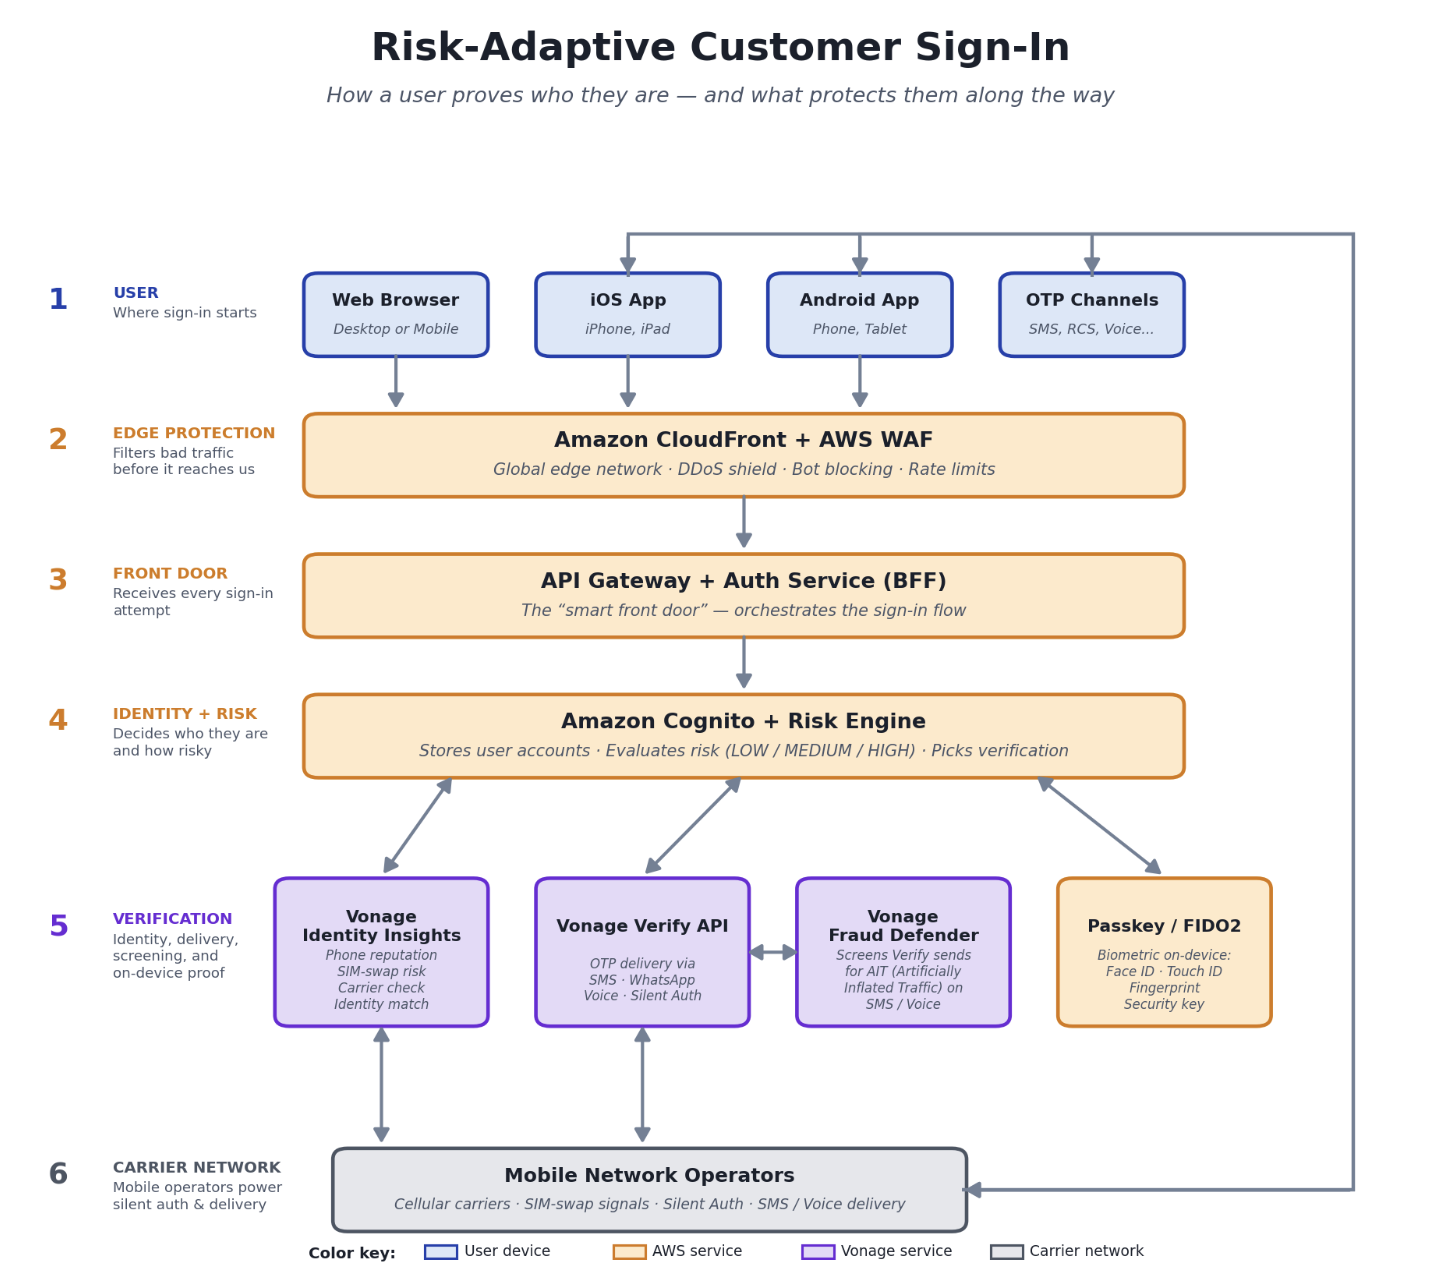
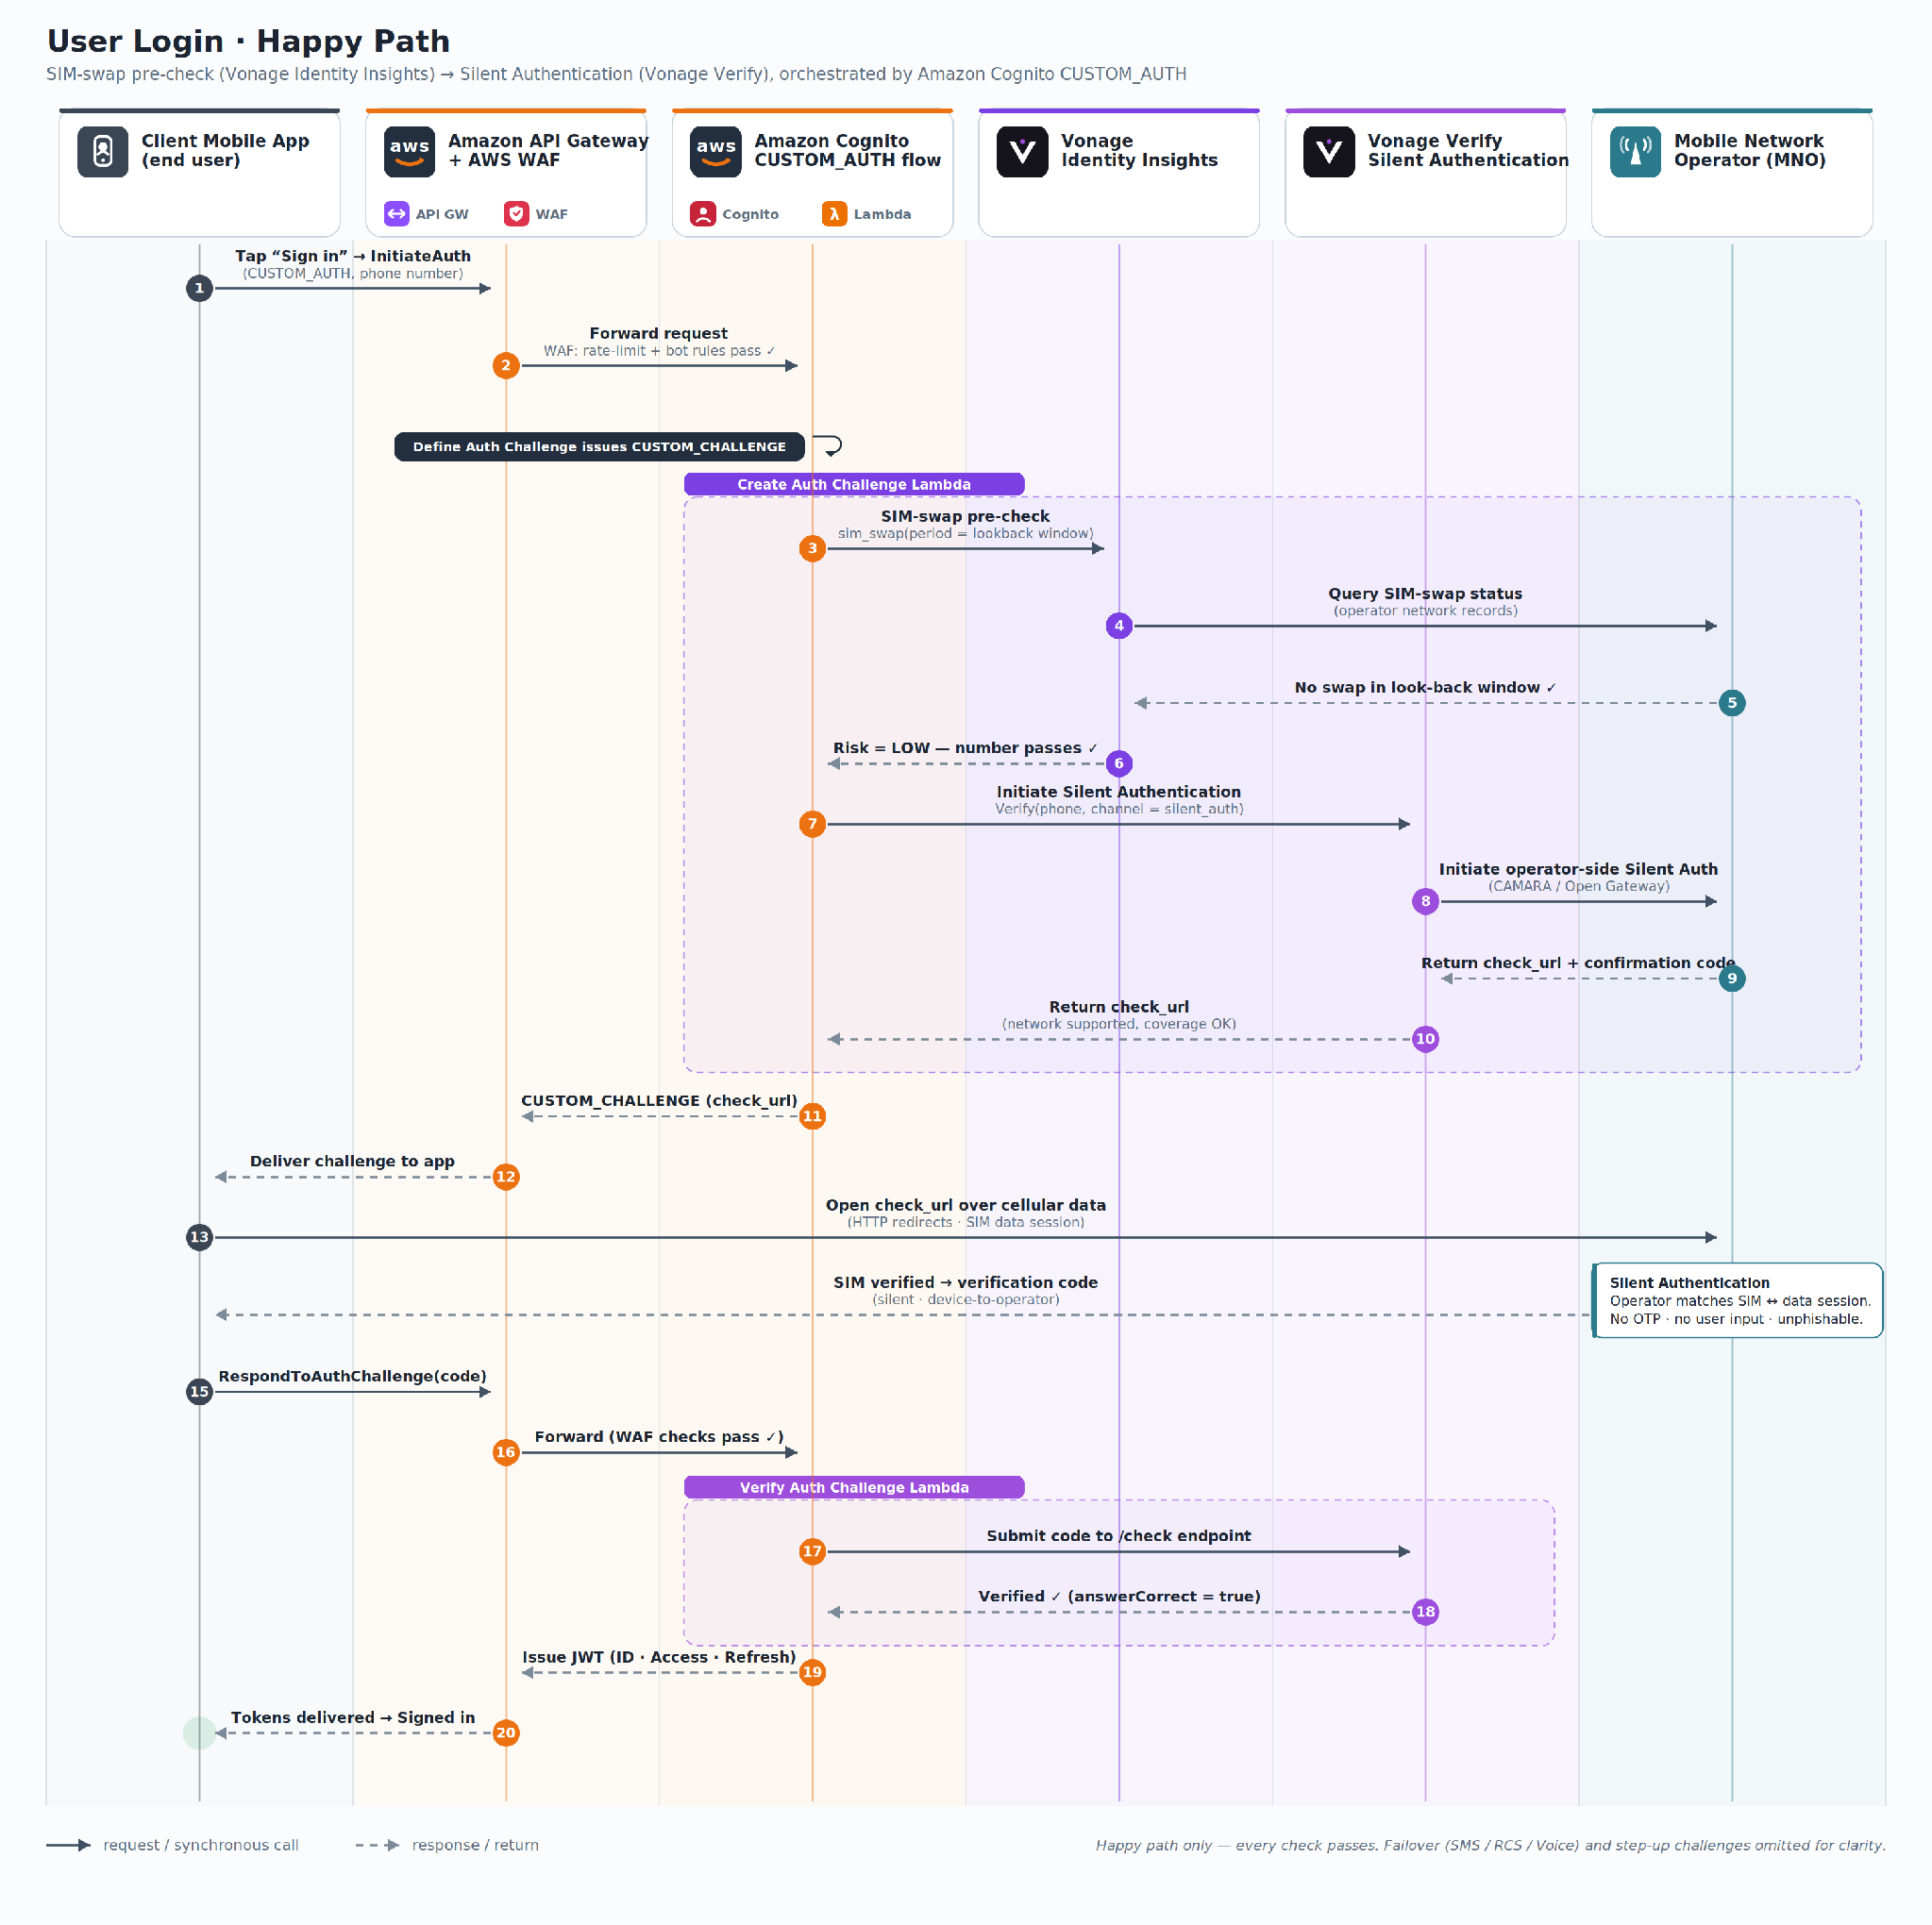
In this post, we show how Vonage network-powered solutions work with Amazon Cognito to enhance many mobile-first use cases with network-level identity verification. Vonage network-powered solutions are a composable stack of real-time mobile operator intelligence, silent authentication, and integrated fraud protection, which uses the CUSTOM_AUTH flow to complete identity verification in under 5 seconds, with zero user interaction.
About Vonage
Vonage, part of Ericsson, is an AWS Partner with multiple AWS Marketplace listings. The company provides enterprise and CIAM deployments with cloud-based access to mobile operator network APIs, including real-time mobile identity and authentication across key regions. These complement Vonage’s global communications, voice, and video APIs backed by Ericsson’s global telecommunications infrastructure.
What network-powered means and why it matters
Before diving into architecture, it’s worth being precise about what separates Vonage’s network-powered solutions from the identity and fraud tools enterprises already have in their stack.
Most identity verification signals today are derived from aggregated, cached, or behavioral data. Traditional phone number lookup services query static databases that may be days or weeks out of date. Device fingerprinting analyzes browser characteristics that might be spoofed. Behavioral biometrics builds models from historical sessions. This is useful, but a lagging indicator by definition.
Enterprise customers who implement Vonage’s network-powered solutions operate from a fundamentally different layer: real-time data sourced directly from mobile network operators (MNOs). When you query whether a SIM was recently swapped, you’re querying the network that performed the swap. When Silent Authentication verifies a user, the proof of possession is the cellular data session itself. This session can’t be phished, intercepted, or socially engineered.
In fraud scenarios where SIM swaps are weaponized for account takeover (ATO), “recently” means minutes or hours, not days. Static databases refreshed weekly are not detecting these events. They’re logging them after the fact. Real-time operator queries close that window entirely.
The three pillars: Identity Insights, Verify, and Fraud Defender
Vonage network-powered solutions combine three API service components into a composable security stack that integrates with Amazon Cognito through the CUSTOM_AUTH flow:
Identity Insights runs before verification channels are initiated, surfacing real-time operator signals that are directly actionable in authentication policy decisions. The following list shows a representative set of JSON elements that might be returned by a request. Customers have the option to select which data is most valuable given a specific authentication use case and industry combination.
format and network_type: Filters invalid numbers, VoIP, landline, and premium-rate numbers used in synthetic account creation and bot-driven fraud.
sim_swap: Detects SIM swaps within a configurable look-back window, a leading indicator of ATO events in progress.
subscriber_match: Compares subscriber identity (name, address) against operator Know Your Customer (KYC) records.
device_swap: A recent change in the mobile device associated with a phone number signals that a bad actor might have taken control of the SIM card. (coming soon)
recycled_number: Numbers previously deactivated and reassigned to a new subscriber can trigger false identity matches in onboarding flows, creating risk in account creation. (coming soon)
These pre-checks trigger your defined risk policy: step-up challenge, hard block, or silent logging. Critically, fraudulent attempts are identified and blocked before a single OTP is sent, before verification costs are incurred, and before fraud processing overhead is generated.
2. Verify with Silent Authentication: Alleviating the friction tax
Every additional step a user must finish during authentication carries a measurable cost: abandoned sign-ups, failed conversions, and support tickets from users who don’t receive or mistyped a code. We call this cumulative loss the friction tax. For SMS OTP flows with approximately 80 percent completion rates, the friction tax means roughly 20 percent of legitimate users drop off before they ever reach your application.
After a number passes the risk pre-checks, the Verify API delivers the authentication challenge. The primary authentication method is Silent Authentication.
When a user initiates sign-in from a mobile device, Vonage routes an HTTP request through the user’s cellular data connection. The mobile operator confirms that the SIM registered to the phone number matches the session making the request. The exchange happens in the background, in seconds. The user doesn’t see, type, copy, or enter any code.
If Silent Authentication can’t finish or is unavailable, Verify automatically falls back to traditional SMS, RCS, Voice, WhatsApp, or email, remaining transparent to the user.
Key benefit: Silent Authentication alleviates the three primary exploit vectors against SMS OTP: SIM swap (bad actor receives the code), SS7 interception (message diverted in transit), and social engineering (user tricked into sharing the code). All without additional input from the end user.
3. Fraud Defender: Protecting the verification channel
Fraud Defender addresses a threat familiar to enterprise finance teams: artificially inflated traffic (AIT) and SMS pumping. Automated systems trigger high volumes of OTPs sent to premium-rate numbers that bad actors control. At enterprise verification volumes, these events can run undetected for extended periods.
Fraud Defender provides real-time traffic monitoring and intelligent blocking at the point of outbound delivery, intercepting these malicious events before costs accumulate. The financial impact is immediate and measurable. Fraud Defender typically absorbs its own cost in toll fraud prevention within the first billing cycle. For most enterprises, it quickly becomes a net revenue-positive investment. Vonage customers have collectively saved over $3M in SMS-related fraud costs since deployment. The savings continue to compound as the blocking algorithm evolves to counter new exploit patterns. For Verify customers, the value is even more compelling: Fraud Defender activates automatically with the Vonage Verify API at no additional cost. This makes it one of the highest-ROI fraud protections available.
Prerequisites
To implement this solution, you need:
An AWS account with permissions to create and manage Amazon Cognito, AWS Lambda, AWS Secrets Manager, Amazon CloudWatch, and AWS WAF resources.
An Amazon Cognito user pool (existing or new).
A Vonage API account with access to Identity Insights and Verify APIs.
AWS Command Line Interface (AWS CLI) or AWS Serverless Application Model (AWS SAM) CLI installed and configured.
For client integration: the Vonage Silent Authentication SDK for your mobile platform (iOS/Android).
Solution architecture with Amazon Cognito
Enterprise customers that integrate the Vonage solution use the Amazon Cognito CUSTOM_AUTH flow, which uses three AWS Lambda functions that orchestrate the solution stack without changing your existing user pool configuration or downstream service integrations.
Architecture components
The solution connects five layers, each handling a distinct step in the authentication flow:
Client app (mobile/web) – Initiates the CUSTOM_AUTH flow with the Vonage Silent Authentication SDK, follows check_url redirects over the cellular network, and submits the verification code back to Amazon Cognito.
Amazon Cognito user pool – Orchestrates the CUSTOM_AUTH challenge flow and issues JWT tokens upon successful verification.
Vonage Network APIs – Identity Insights pre-check, Verify with Silent Auth and OTP (built-in failover), and Fraud Defender (automatic).
Mobile network operators – SIM-level identity verification through CAMARA/Open Gateway APIs.
Authentication flow
The following steps represent an authentication workflow sequence between Amazon Cognito and Vonage network-powered solutions:
The client calls InitiateAuth with CUSTOM_AUTH, passing the user’s phone number.
The Define Auth Challenge Lambda function instructs Amazon Cognito to issue a CUSTOM_CHALLENGE.
The Create Auth Challenge Lambda function calls Identity Insights for pre-verification risk assessment. If the number passes pre-checks, Lambda calls Vonage Verify to initiate Silent Authentication and returns the check_url to the client.
Upon receiving the check_url, the client opens an HTTPS connection to it, triggering HTTP redirects to the mobile carrier’s network for direct mobile-device-to-mobile-network-operator verification. Upon completion, the client receives a verification code from the operator.
The client calls RespondToAuthChallenge with the code.
The Verify Auth Challenge Lambda function submits the code to Vonage’s check endpoint. On success, it returns answerCorrect = true and Amazon Cognito issues the appropriate session token.
Coexistence and phased rollout
A critical design principle: zero disruption to existing infrastructure. The Vonage Network API plugs into the Amazon Cognito CUSTOM_AUTH flow without changes to your existing user pool, app client configurations, or downstream service integrations. Deployment requires a single sam deploy command.
This design approach allows for a phased rollout. Start with the highest-risk journeys (password recovery, high-value transactions) where security ROI is clearest, then expand to daily login and onboarding as you measure impact. Traditional SMS, RCS, and Voice OTP remain options for lower-risk flows during the transition.
Risk-aware workflows by journey type
The strategic value of combining Vonage’s network-powered solutions with the Amazon Cognito policy-driven CUSTOM_AUTH flow is context-aware authentication calibrated to actual risk. CRITICAL journeys are recommended for the first phase of implementation as they aim to meaningfully mitigate synthetic identity and account takeover. The following table describes risk-aware workflows by journey type.
Journey
Risk
Vonage Workflow
New account signup
CRITICAL
Identity Insights filters invalid/non-mobile numbers + Subscriber Match validates KYC → Silent Auth for zero-tap onboarding
Daily login
MEDIUM
SIM swap recency + device consistency check → Silent Auth passively, step-up only on elevated signals
Mandatory SIM swap hard-check (tight lookback window) + Subscriber Match → Silent Auth required, no passive bypass
High-value transaction
CRITICAL
Full signal stack (line type, SIM swap, subscriber match) → Silent Auth + secondary challenge if risk elevated
Low-risk actions (for example, viewing account details, browsing content, or checking order history) generate no friction and no unnecessary verification cost. High-risk actions trigger the full assurance stack. The calibration is policy-driven and configurable per journey.
Implementation considerations
Configuring Amazon Cognito starts with setting up the user pool to allow the CUSTOM_AUTH authentication flow and accept phone numbers as the primary sign-in attribute. After the user pool is in place, associate the three required Lambda functions with their corresponding Amazon Cognito trigger hooks and store your Vonage API credentials in AWS Secrets Manager.
Layer in security from the start, following the AWS Well-Architected Security Pillar. Scope each Lambda function’s AWS Identity and Access Management (IAM) role to only what it needs: Amazon Cognito trigger invocations and AWS Secrets Manager access. Enforce TLS 1.2+ on all communication for encryption in transit. For observability, turn on Amazon CloudWatch logging on each Lambda function and turn on AWS CloudTrail to capture Amazon Cognito API audit trails. Finally, deploy AWS WAF with rate-limiting rules in front of the authentication endpoint to protect against brute-force attempts.
To configure the solution, follow these steps:
Set up the Amazon Cognito user pool to allow the CUSTOM_AUTH authentication flow.
Configure the user pool to accept phone numbers as the primary sign-in attribute.
Associate the three required Lambda functions with their corresponding Amazon Cognito trigger hooks.
Store your Vonage API credentials in AWS Secrets Manager.
Important: This solution creates AWS resources that incur charges. These include Amazon Cognito (per monthly active user), AWS Lambda (per invocation), AWS Secrets Manager (per secret per month), Amazon CloudWatch Logs, AWS CloudTrail, and AWS WAF (per rule and request). See the pricing page for each service and delete resources when no longer needed.
Privacy and compliance
The architecture is designed so that PII doesn’t leave the mobile operator. Subscriber Match performs a comparison within the operator’s environment and returns only a match score. The underlying subscriber data isn’t transmitted. Silent Authentication operates without PII exchange. The cellular session is the credential.
GDPR: Only match scores are returned. No subscriber PII is stored or transmitted, supporting GDPR data minimization.
PSD2 / Open Banking: Silent Authentication qualifies as a possession-factor for Strong Customer Authentication (SCA).
HIPAA: Subscriber Match supports identity assurance for healthcare applications.
CCPA: Same data-minimization architecture as GDPR.
Production results: Lydia Solutions
Lydia Solutions, one of Europe’s fastest-growing mobile financial services applications, deployed Vonage Verify with Silent Authentication in October 2024. The results demonstrate the real-world impact at scale, including up to 50 percent reduction in latency when compared to Lydia Solutions’s previous authentication services.
“Vonage Verify with Silent Authentication has been a real innovation for us. The solution has elevated our ability to deliver a simpler, seamless and more secure user experience while protecting against increasingly sophisticated threats and fraud patterns.”
— William Brulin, Senior VP, Lydia Solutions
Lydia’s results sit at the high end of outcomes observed. Across deployments in ecommerce, digital banking, and consumer services, conversion improvements of 2–8.5 percent compared to SMS-only are the norm, with authentication journey latency reductions of 50–75 percent.
Conclusion
This is where mobile operator data shifts the approach. Rather than applying identical verification friction to every session, enterprises can use real-time network signals to make adaptive authentication decisions. Verify silently when conditions are right, step up when risk indicators appear, and block when fraud is detected.
Enterprise implementation of the offering makes those risk signals and authentication methods accessible through a composable API layer. The combination of Identity Insights for pre-verification intelligence, Verify for network-layer authentication, and Fraud Defender for channel protection delivers risk-proportionate authentication that’s in production at scale today.
The solution deploys with minimal changes to your existing Amazon Cognito user pool. Start with high-risk journeys, measure impact, and expand. Vonage Verify API is available across over 700 MNOs in over 200 countries and territories, and the integration requires only three Lambda functions.
When downsizing an Amazon Elastic Compute Cloud (Amazon EC2) instance, teams often evaluate CPU and memory utilization but overlook the instance’s Amazon Elastic Block Store (Amazon EBS) performance limits for throughput and IOPS. Smaller Amazon EBS-optimized instance types have lower baselines and rely on burst credits to handle peaks. If your workload’s I/O pattern drains those credits faster than the instance can refill them, the instance will throttle your workload to baseline. This post applies to burstable EBS-optimized instances with baselines below their maximum.
This post shows how to pull your instance’s Amazon EBS metrics from Amazon CloudWatch, simulate the burst credit balance against a target instance type’s limits, and help evaluate whether the downsize might be appropriate before making the change.
Solution overview
The analysis compares your workload’s actual I/O pattern against the target instance type’s Amazon EBS limits.
Measure your current Amazon EBS usage. Pull instance-level throughput and IOPS from Amazon CloudWatch at 5-minute granularity. You need at least two weeks of data to capture weekly patterns. Four weeks is better if your workload has monthly cycles. While you pull data, check whether your current instance already hits its Amazon EBS-optimized performance limits.
Compare against the target instance’s limits. Look up the baseline and burst ceiling for your target instance type. Simulate the burst credit balance across your observation window: for each 5-minute interval, calculate whether credits are draining or refilling, and track whether the balance ever hits zero. If it does, you will experience throttling on the smaller instance.
Monitor after the move. Watch InstanceEBSThroughputExceededCheck and InstanceEBSIOPSExceededCheck for immediate throttle detection. Track EBSByteBalance% and EBSIOBalance% to gauge how much headroom remains for workload growth.
Note: These balance metrics are only available on burstable instance sizes where the baseline is lower than the maximum.
Prerequisites
An AWS account with permissions for cloudwatch:GetMetricData and ec2:DescribeInstanceTypes. The instance must be Amazon EBS-optimized (AWS enables EBS-optimization by default on most current-generation instance types).
Note: AWS doesn’t provide these instance-level Amazon CloudWatch metrics in AWS Outposts, AWS Local Zones, or AWS Wavelength Zones.
Pulling instance-level Amazon EBS metrics from Amazon CloudWatch
Amazon CloudWatch provides Amazon EBS metrics at the instance level in the AWS/EC2 namespace, using the InstanceId dimension. Here are the metrics that you need:
Metric
What it measures
EBSReadBytes
Total read bytes in the period
EBSWriteBytes
Total write bytes in the period
EBSReadOps
Total read operations in the period
EBSWriteOps
Total write operations in the period
EBSIOBalance%
IOPS burst credit balance (0-100%)
EBSByteBalance%
Throughput burst credit balance (0-100%)
InstanceEBSIOPSExceededCheck
1 if instance hit IOPS limit, 0 otherwise
InstanceEBSThroughputExceededCheck
1 if instance hit throughput limit, 0 otherwise
The first four metrics are the inputs for the simulation. The rest are useful context:
EBSIOBalance% and EBSByteBalance% show how much of the burst credit pool remains, as a percentage. On the current (larger) instance, these should sit at or near 100 percent. If they’re dipping, the workload is already consuming burst credits at the current size, and a downsize will make it worse.
Note: These metrics only appear on instances where the baseline is lower than the maximum.
InstanceEBSIOPSExceededCheck and InstanceEBSThroughputExceededCheck are binary: 1 means the instance hit its EBS-optimized performance limit within the last minute. If either is firing on the current instance, the workload is already throttling and should be addressed before considering a downsize.
Pull these at 5-minute granularity for at least two weeks (four if your workload has monthly cycles). Amazon CloudWatch retains 5-minute data points for 63 days, so that’s your upper bound. You can retrieve the data through the AWS Command Line Interface (AWS CLI) (GetMetricData API), the Amazon CloudWatch console, or any AWS SDK. The metrics live in the AWS/EC2 namespace with your InstanceId as the dimension.
Use the Maximum statistic for the four I/O metrics and Minimum for the balance percentages. Maximum captures the highest 1-minute data point within each 5-minute window, which is the conservative choice for the simulation inputs. The Sum statistic gives a more precise total for each interval, but Maximum is the intentionally conservative choice. It assumes the peak 1-minute rate held for the full 5-minute window, which overstates actual consumption. Minimum on the balance metrics captures the lowest point the balance hit within each window, so you see the actual dips rather than averaging them away. For the ExceededCheck metrics, use Maximum (you want to know if the limit was hit at any point in the window).
Combine read and write values to get totals per interval. To convert to per-second rates:
The division by 60 (not by the period length) is intentional. The Maximum statistic for a 5-minute period returns the highest 1-minute aggregate within that window, not a 5-minute total. Dividing by 60 converts that 1-minute peak to a per-second rate. The additional divisions by 1,024 convert bytes to mebibytes to match the units in describe-instance-types.
Comparing actual usage against target limits
From the Amazon EBS-optimized instances documentation, find the baseline and maximum (burst ceiling) for both IOPS and throughput on your target instance type. You can also pull these programmatically:
This returns the baseline and maximum bandwidth (MB/s) and IOPS for the instance type. Note that BandwidthInMbps is megabits per second (network-style units), while ThroughputInMBps is megabytes per second. The throughput values are what you compare against your Amazon CloudWatch data.
BaselineThroughputInMBps is the sustained rate the instance can deliver indefinitely. MaximumThroughputInMBps is the burst ceiling, the absolute maximum the instance can deliver while it has burst credits. Same relationship for IOPS. IOPS and throughput have separate burst budgets, tracked by EBSIOBalance% and EBSByteBalance% respectively.
How burst credits work
The instance maintains a credit pool for each budget (IOPS and throughput). The pool capacity is:
credit_pool = (burst_ceiling - baseline) * 1800
The 1800 comes from 30 minutes (1800 seconds) of burst at the maximum rate, which AWS provisions as the pool size for burstable Amazon EBS-optimized instances. Credits drain when usage exceeds baseline and refill when usage is below baseline, at a rate of baseline – effective_usage per second, where effective_usage is min(actual_usage, burst_ceiling). The instance cannot deliver more than the ceiling regardless of credit balance, so credits drain at the ceiling rate, not the requested rate. The pool is capped at its maximum and floored at zero. When credits hit zero, your workload is throttled to baseline performance. AWS resets the pool to full every 24 hours, giving you at least 30 minutes of burst capacity per day.
With the time series data and the target limits, you can simulate what the credit balance would look like on the smaller instance. For each 5-minute interval in your observation window:
Where interval_seconds is 300 for 5-minute data or 60 for 1-minute data.
When actual usage is below baseline, credits accumulate. When above, they drain. Run this across the full observation window, resetting the pool to full at the start of each 24-hour period to model the AWS top-off guarantee. Start each day with a full pool, then drain and refill through the day’s intervals. If the balance hits zero on any day, the workload will throttle on the smaller instance.
Run the simulation twice: once for IOPS, once for throughput. Throttling happens if either pool hits zero.
A Python script that pulls Amazon CloudWatch data for a given instance ID, looks up the target instance type’s Amazon EBS limits, and runs this simulation end-to-end is available at sample-ec2-ebs-burst-analyzer repository.
This simulation is an approximation
It models credit behavior at 5-minute (or 1-minute) granularity using Amazon CloudWatch aggregates, not the actual per-second I/O stream. Two factors make the simulation more conservative than reality, and two can make reality worse than the simulation.
The Maximum statistic returns the highest 1-minute total within each 5-minute window. The simulation applies that peak rate across the full 300-second interval. This overestimates credit drain by up to 5x for any given interval, because the other 4 minutes likely had lower usage. The tradeoff is intentional. If the simulation says the workload fits, the result is reliable. If it says the workload doesn’t fit, the actual situation might be better than predicted. In that case, re-run with the Average statistic for a less conservative check, or pull 1-minute data (available for the most recent 15 days in Amazon CloudWatch) for higher fidelity.
Working in the other direction, two things can make the real situation worse than the simulation predicts. If the downsize also reduces memory, database workloads (SQL Server buffer pool, PostgreSQL shared_buffers, Oracle SGA) will generate more disk I/O than what you measured because the smaller cache forces more page reads from Amazon EBS. Account for this by including additional headroom in the burst credit budget. And I/O spikes that last milliseconds don’t show up in 5-minute Amazon CloudWatch data. If EBSByteBalance% or EBSIOBalance% are trending down on the current instance but your throughput metrics look fine, the workload is microbursting.
What to look for in the results
The simulation produces two outputs per budget (IOPS and throughput): the low-water mark (lowest credit balance across the observation window) and the number of intervals where the balance hit zero.
IOPS credit balance (EBSIOBalance%) – If the simulated low-water mark stays well above zero, the workload’s IOPS pattern fits within the target’s burst budget. A low-water mark of 90 percent means the workload barely touches the IOPS burst pool. A low-water mark of 40 percent means it fits today but has limited room for IOPS growth.
Throughput credit balance (EBSByteBalance%) – Same logic for throughput. Check this independently because a workload can be comfortable on IOPS but tight on throughput, or the reverse.
Intervals at zero – If either balance hits zero on any day, the workload will throttle to baseline on this instance type.
Peak usage vs. burst ceiling – The ceiling is the absolute maximum regardless of credit balance. If your peak throughput exceeds MaximumThroughputInMBps or peak IOPS exceeds MaximumIops, the instance will cap I/O at the ceiling rate during those intervals. This doesn’t mean the workload doesn’t fit overall (credits might still be fine), but the application will experience reduced I/O during those peaks. A handful of brief spikes may be acceptable. Sustained ceiling breaches are a stronger signal to size up.
Throttled intervals – The most direct measure of impact. A throttled interval is one where the credit balance is at zero and usage exceeds baseline. During these intervals, the instance cannot deliver what the workload is asking for. A few throttled intervals during a nightly batch may be tolerable. Dozens per day during business hours is a problem.
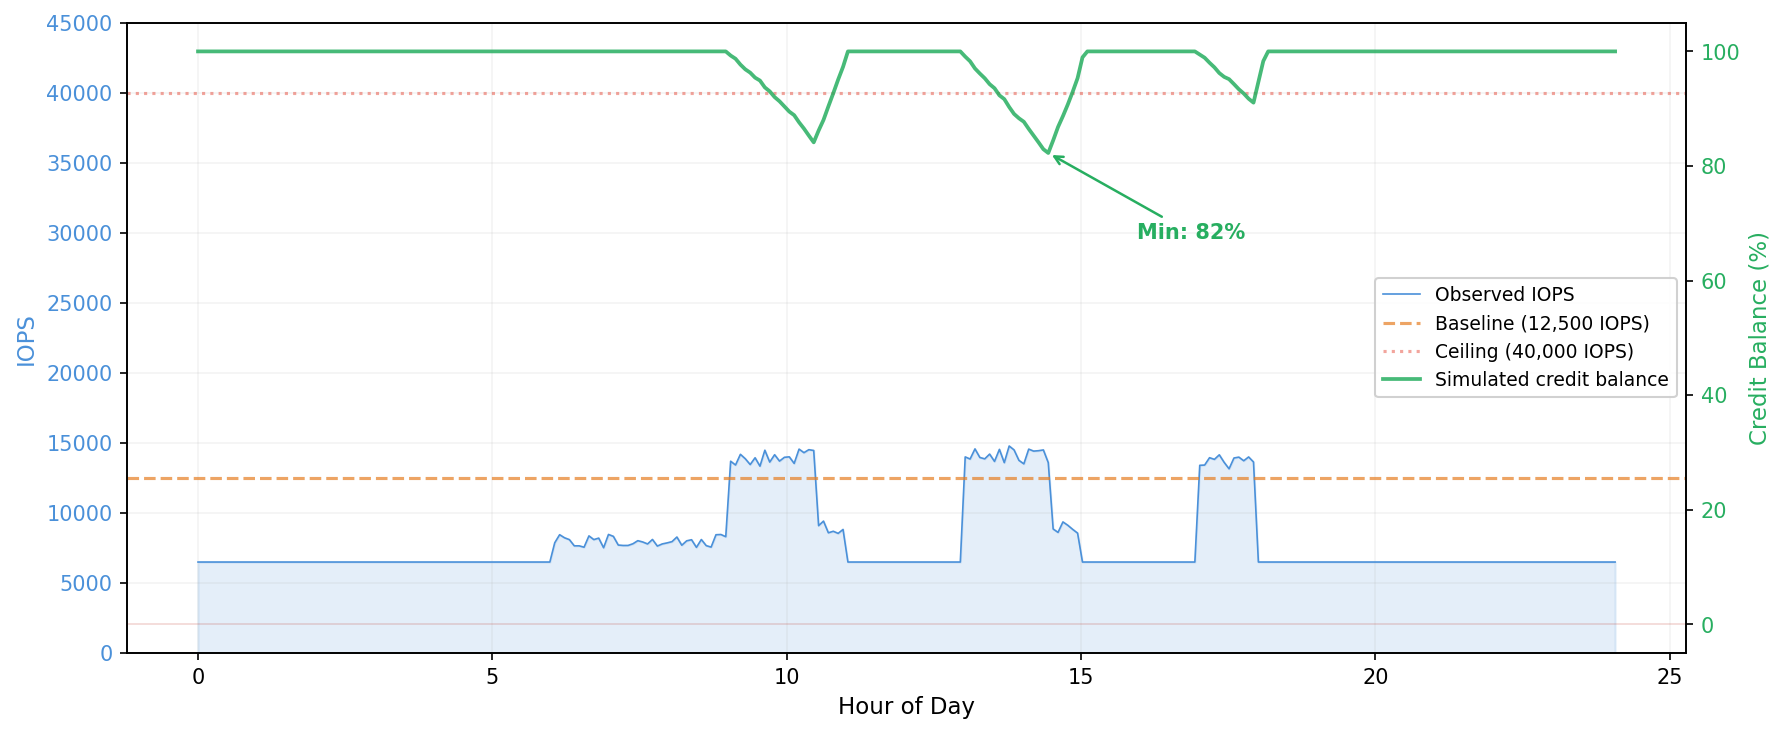
The following two figures show what these outcomes look like. In the first, the workload bursts above baseline during business hours but credits never fully deplete. The minimum balance stays at 82 percent, well above zero. This workload is safe to downsize.
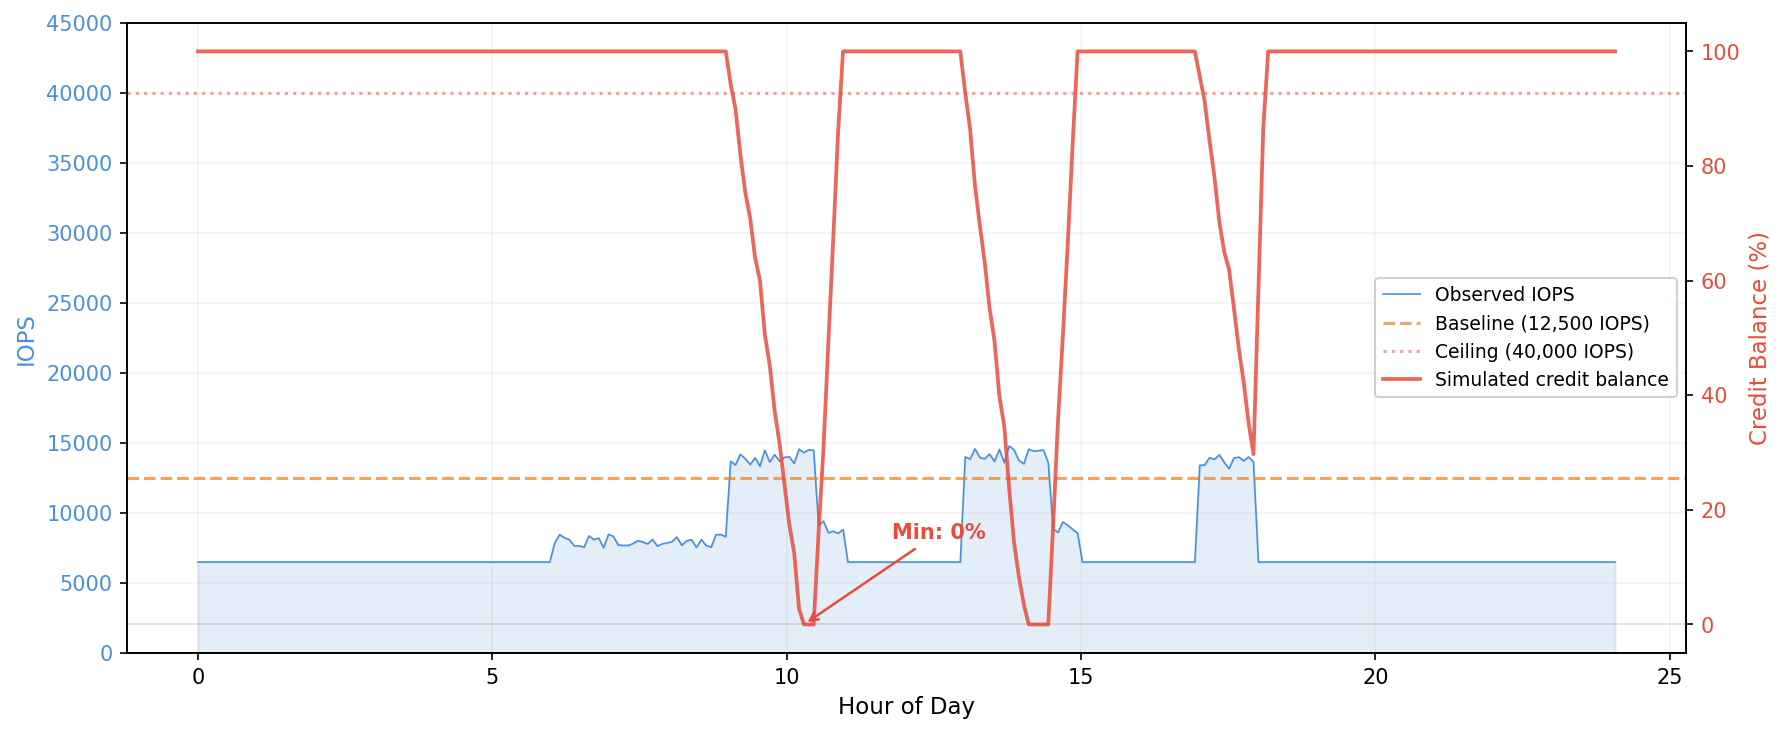
In the second figure, the same workload runs on a smaller instance type with a lower burst pool. Credits deplete within the first burst window and stay near zero for most of the business day. This workload would throttle on the smaller instance.
The following servers are from a customer running SQL Server on EC2. We simulated the burst credit balance for each against the proposed target instance type, using 28 days of Amazon CloudWatch data at 5-minute granularity with the Maximum statistic.
Server A: fits comfortably (current: c6in.4xlarge; proposed: r6i.large)
Simulating the credit balance across 28 days with a daily pool reset:
IOPS
Throughput
Credit pool
65,520,000
2,103,750 MB
Low-water mark
52,084,325 (79.5%)
1,656,415 MB (78.7%)
Intervals at zero
0
0
On the worst day for throughput, here’s what the simulation looks like during the evening burst window, showing how credits drain and recover interval by interval:
Time
Throughput (MB/s)
Net credit change
Balance
Balance %
22:00
154.25
-21,900
1,854,076
88.1%
22:05
22.57
+17,603
1,871,679
89.0%
22:10
452.16
-111,273
1,760,406
83.7%
22:15
427.89
-103,991
1,656,415
78.7%
22:20
30.99
+15,077
1,671,492
79.5%
At 22:10 and 22:15, throughput spiked above 400 MB/s, well above the 81.25 MB/s baseline but still under the 1,250 MB/s burst ceiling. Each interval drained roughly 100,000 credits. The pool hit its low-water mark of 78.7 percent at 22:15, then immediately began recovering as throughput dropped. By 23:55, the pool was back to 100 percent.
Assessment: fits, with roughly 20 percent headroom on the worst day.
Server B: fits but tight (same workload as Server A; proposed: r5.large)
Same workload, same burst pattern, but the r5.large has a smaller credit pool, so the same spikes drain a larger percentage. The throughput low-water mark drops from 78.7 percent to 51.5 percent. The same evening burst window that used 20 percent of the r6i.large pool now consumes nearly half the r5.large pool:
Time
Throughput (MB/s)
Net credit change
Balance
Balance %
22:00
154.25
-21,900
672,826
72.9%
22:05
22.57
+17,603
690,429
74.8%
22:10
452.16
-111,273
579,156
62.8%
22:15
427.89
-103,991
475,165
51.5%
22:20
30.99
+15,077
490,242
53.1%
This still fits, but with limited margin. Any workload growth (more users, larger databases, additional backup jobs) could push the balance toward zero. Separately, a single IOPS interval reached 20,226, exceeding the r5.large burst ceiling of 18,750. The instance can only deliver up to the ceiling while credits remain, so the application received 18,750 IOPS during that interval. That single spike would not cause sustained throttling, but combined with the tight throughput margins, it confirms this workload is at the boundary of what r5.large can handle.
Assessment: fits today, but not a safe long-term choice.
Server C: ceiling breach (current: c6in.4xlarge; proposed: r6i.xlarge)
Peak throughput: 1,502.94 MB/s. This exceeds the 1,250 MB/s burst ceiling. During those peak intervals, the instance would cap throughput at 1,250 MB/s while credits remain. If credits are exhausted, throughput drops to the 156.25 MB/s baseline. The credit simulation might still show the workload fits (credits never hit zero), but the application would experience reduced I/O during those peaks. For this customer, the peaks coincided with production SQL Server activity, so even brief throttling wasn’t acceptable, and a larger instance type was needed.
Assessment: workload will be throttled during peak intervals. Whether that’s acceptable depends on the application’s sensitivity to I/O latency.
Monitoring after the resize
The pre-migration analysis uses historical data from the larger instance. After you resize, real metrics replace the simulation. Monitor the following three layers:
InstanceEBSThroughputExceededCheck and InstanceEBSIOPSExceededCheck = 1 means the instance is actively throttling. This is the definitive signal. Alarm on Sum > 0 over 3 consecutive 1-minute periods to filter out single-second spikes that resolve on their own.
EBSByteBalance% and EBSIOBalance% trending downward over days or weeks means the workload is growing into the instance’s limits. You’re not throttling yet, but you’re on a trajectory. An instance that dips to 90 percent nightly and recovers is in a different position than one that dips to 40 percent and barely recovers before the next burst. Neither instance is throttling, but the first has headroom while the second doesn’t.
EBSByteBalance% and EBSIOBalance% stay at 100 percent means the workload never exceeds baseline. The instance has unused capacity, and you might even be able to go smaller.
If the workload has weekly patterns, allow at least one full week of data before drawing conclusions.
Conclusion
In this post, we showed how to simulate the EBS-optimized instance burst credit balance against a target instance type’s limits before downsizing an Amazon EC2 instance. The approach pulls Amazon CloudWatch metrics at 5-minute granularity, compares actual throughput and IOPS against the target’s baseline and burst ceiling, and tracks whether the credit balance would hit zero during the observation window.
This covers the Amazon EBS dimension of a right-sizing decision. A complete evaluation also considers CPU utilization, memory usage, and network throughput against the target instance’s limits. For workloads where Amazon EBS utilization is well below baseline, the burst credit simulation might not be necessary.
Version
2.0 of the FairScan document-scanning app for Android has been
released. The headline feature for this release is the addition of
optical-character-recognition (OCR) support using Tesseract to produce PDFs
with searchable text from scans. FairScan developer Pierre-Yves
Nicolas has written a detailed
blog about adding the feature and explaining why it had not been added
previously.
That looks nice, so why didn’t FairScan have it before? That’s
because FairScan wasn’t ready for it: I wouldn’t be comfortable if
FairScan was giving you wrong text half of the time. To get good
results from an OCR engine, you need to provide it a readable
image. If it’s hard to read for a human, it’s certainly also hard to
read for an OCR engine.
Over the past year, I worked on different parts of FairScan’s
automatic processing to transform photos of documents into PDFs that
are easy for humans to read:
document detection
perspective correction
shadow reduction
brightness and contrast enhancement
All this work on image processing helped FairScan produce clean
PDFs and can now also contribute to making text recognition effective.
Adopting or migrating to a Zero Trust network architecture can be a daunting task. Before a single policy changes, teams have to recall how their network is actually built: which applications exist, their authentication and authorization constructs, how traffic flows between them, and any assumptions the current architecture makes. This hands-on process requires practitioners to decode the intent behind every security and routing policy in place.
Today, we’re releasing the Cloudflare One stack, a set of skills you give to your agent to configure, deploy, and manage your Zero Trust environment for you. This toolkit is designed to help automate the process of learning an entirely new security suite and mapping your existing one into Cloudflare.
Cloudflare has worked with thousands of customers through exactly this process. That repetition built expertise on where migrations stall, what questions come up every time, and what it takes to move forward. The Cloudflare One stack packages that expertise and makes it more accessible than ever.
The agent gap in network security
Teams are already using agents to write code, triage alerts, and automate workflows. Organizations are increasingly asking for Cloudflare-provided tooling to help agents execute on security workflows. On their own, agents are not trained on the nuances of an organization’s specific network topology or vendor configurations.
By providing prescriptive and authoritative guidance, organizations can layer this context into their existing toolkit to make better use of the security products they are already deploying.
Cloudflare has long been the easiest-to-deploy SASE vendor in the market. The stack extends that philosophy to agents: it gives them the context, tools, and structured reasoning they need to operate on your security infrastructure.
What is the Cloudflare One stack?
The Cloudflare One stack is a collection of skills that can be used with any agent. As with any skill, you can use them standalone, layer in your own context, or build tooling on top. It was purpose-built to help security practitioners across the entire lifecycle of evaluating, deploying, and managing Cloudflare One.
The stack was built by synthesizing hand-curated knowledge from employees with tens of thousands of hours of experience working with customers on Cloudflare One products. It contains tools for planning, managing, and implementing your user and agent security infrastructure on Cloudflare. It also contains handpicked logic for migrating from legacy vendors like Zscaler and Palo Alto Networks.
When used in conjunction with the Cloudflare code mode MCP server, the stack gives agents a typed interface to the Cloudflare API. Agents can query your live account, inspect configurations, and make changes through a curated set of Cloudflare-recommended workflows rather than ad-hoc API calls.
What’s in the stack?
The Cloudflare One stack ships as two lightweight skill files: cloudflare-one and cloudflare-one-migration. Together they cover migrating to, building an implementation for, managing, and troubleshooting your Cloudflare One deployment:
Remote access and VPN replacement with Cloudflare Access
User, network, device, and data security with Cloudflare Gateway
Connectivity with Cloudflare Tunnel, Cloudflare Mesh, and Cloudflare WAN
Migration guidance with explicit detail for moving from other SASE vendors
Network diagram interpretation and generation, so you can visualize proposed changes to your network in a way that is easy for you and your team to understand
Vendor concept translation, which maps concepts between SASE vendors to reduce the barrier to evaluating and switching providers
Troubleshooting and operations, with the Digital Experience Monitoring (DEX) toolkit and automated rule recommendations
How it works
The stack is available in the Cloudflare Skills repository. Each skill file contains structured knowledge, decision trees, and tool definitions that agents load automatically when the context matches. Give this to your agent and let it help you set up, configure, and manage your Zero Trust environment:
The cloudflare-one skill covers general product guidance. For example, if you ask an agent for the best way to replace your VPN infrastructure with Cloudflare Tunnel or Cloudflare Mesh, the skill knows how to:
Inventory your existing VPN applications and identify which connectivity model each requires
Map each application to the appropriate Cloudflare primitive — self-hosted Access application, Tunnel-connected service, or Mesh-connected network segment
Generate a recommended deployment sequence that minimizes disruption during cutover
Produce a configuration summary your team can review before making any changes
The cloudflare-one-migration skill covers vendor-to-vendor translation. For example, if you ask an agent to migrate your Zscaler Private Access applications to Cloudflare Access, the skill knows how to:
Map Zscaler application definitions to Cloudflare Access application definitions
Transform Zscaler user groups and policies into Cloudflare Access policies
Use the Cloudflare API to create the equivalent resources in your account
Generate a summary of what was migrated and what requires manual review
The migration logic in the stack is the same logic used in Cloudflare’s Descaler and Deskope programs. Those programs have already moved enterprise customers from Zscaler and Netskope to Cloudflare One in hours rather than months. The stack makes that capability available to any customer or partner, at any time, without waiting for a scheduled engagement.
More ways to use the stack
The Cloudflare One stack can also:
Recommend security rules based on traffic seen in your live account
Automatically migrate your existing Zscaler Private Access applications into self-hosted Cloudflare Access applications
Investigate anomalies in your secure web gateway HTTP logs and build rules to resolve issues users are seeing
Report on user stability with the DEX toolkit and take actions to improve user latency in key scenarios
Whether you are loading the skill from an agent or building custom tooling on top, the Cloudflare One stack handles all of these use cases and more.
For partners, too
While this simplifies ongoing management for customers who have already adopted the Cloudflare One product suite, it is also a tool for the Cloudflare partner network. Partners can use it to help their customers deploy faster, manage more effectively, troubleshoot with increased accuracy, and drive issues to resolution.
What’s next
You can start using the Cloudflare One stack today. To get the most out of the stack, pair it with the Cloudflare code mode MCP server. The MCP server gives your agent live access to the Cloudflare API through a single, compressed interface that keeps authentication credentials out of the model context.
The Cloudflare One stack will continue to expand as Cloudflare One products evolve. New skills for additional migration sources and more advanced troubleshooting workflows are already in development.
As we learn more about how customers and partners utilize these skills files, we plan to build more robust tooling around these skills. If you are a customer or partner and want to share feedback on what the stack should handle next, reach out through your account team or open an issue in the repository.
Кое е първо – кокошката или яйцето? В контекста на настоящата поредица този въпрос звучи така: кое е първо – качествените публични политики за детски палиативни грижи или качественият разговор и разбирането по темата?
В момента в България липсват и двете. Омагьосаният кръг се затваря, от една страна, от нормативна рамка, в която детските палиативни грижи се споменават инцидентно и свенливо, и от друга – от публично говорене, в което понятието съществува, но е изпразнено от съдържание.
А като не говорим за качеството на живот на децата с тежки диагнози, сме по-склонни да забравяме за тях и семействата им.
Съвременните палиативни грижи не са „медицински грижи в края на живота“, както все още често се смята в България, а комплексен подход, чиято роля е да направи живота на хората с тежко заболяване по-хубав, каквато и да е неговата продължителност.
Според актуалната дефиниция на Световната здравна организация палиативните грижи включват набор от услуги от редица професионалисти – лекари, медицински сестри, психолози, социални работници, парамедици, фармацевти, рехабилитатори, духовни лица, дори доброволци. Всички те са еднакво важни и имат роля в подкрепата както на пациента, така и на неговото семейство. Да, част от работата им е да облекчават болката и клиничните симптоми. Но също и да се грижат за психологическата подкрепа, за решаването на казусите от всекидневието и дори за дреболии като това кой ще сготви днес и кой ще заведе здравото дете в семейството на футбол например.
Фокусът на палиативните грижи такива, каквито ги разбира съвременната грижа за деца със съкращаващи живота заболявания и състояния, е какво може да се направи, за да живеят тези деца и семействата им възможно най-нормално и да имат в живота си всички достъпни за състоянието им възможности да изпитват радост.
Детските палиативни грижи в публичните политики
Да има „публична политика“ за детските палиативни грижи означава да има ред, по който всяко дете, нуждаещо се от такива грижи, и неговото семейство да могат да ги получат навременно и с гарантирано качество. В момента в България има редица дефицити, заради които можем с чиста съвест да кажем, че публични политики в сферата липсват. Подробна аргументация на това твърдение може да се намери в правния анализ на адв. Мария Шаркова в доклада „Готови ли сме за детски хоспис в България“, публикуван от „Ида – фондация за палиативни грижи за деца“.
Юристката посочва, че сред най-сериозните дефицити в законодателството е рамката, според която палиативните грижи включват само медицински дейности, извършвани в болници, и то на пациенти в терминален стадий. Това лишава от грижи много пациенти, които са подходящи за палиативни грижи, но не са в терминален стадий, се обяснява в анализа.
Освен това, както се е случвало неведнъж и в други сфери, палиативните грижи за деца, оказва се, на хартия могат да бъдат извършвани и в дома на детето. На практика обаче нито е регламентиран ред как това да се прави, нито е определено финансиране за самата грижа или за специфични апарати, медицински изделия и други средства, които да подпомогнат близките в грижата за детето (например кислородни концентратори, апарати за аспирация и др.). Медицинското образование също не включва достатъчна подготовка по темата, а в българската номенклатура на медицинските специалности липсва такава по палиативни грижи (и в частност – палиативни грижи за деца).
В нормативните документи на българското Министерство на здравеопазването за грижа за деца с тежки увреждания или хронични заболявания се говори за комплексно обслужване. То се осигурява в специално създадени Центрове за комплексно обслужване на деца с увреждания и хронични заболявания, които ще срещнете навсякъде като ЦКОДУХЗ. Много от тези центрове се създават на мястото на закритите домове за деца с увреждания от времената на социализма, като идеята им на хартия е да предоставят различен, по-съвременен и хуманен модел на грижа.
„Комплексното обслужване“ кореспондира с английския термин complex care (комплексни грижи). Разликата между palliative care и complex care обаче сама по себе си е голяма, а между „комплексно обслужване“ и „палиативни грижи“ нараства допълнително.
В англоезичния си вариант терминът „комплексни грижи“ обхваща целия набор мултидисциплинарни медицински грижи за хора с тежки и хронични страдания и се отнася до откликването на различните нужди, които специфичното състояние изисква.
Палиативните грижи от своя страна са свързани с начините да бъде повишено качеството на живота на болното дете и семейството му. Замяната на „грижа“ с „обслужване“ в българското наименование допълнително дехуманизира децата, които имат нужда от тази грижа. Наред с това в ЦКОДУХЗ въобще не е предвидена възможност за присъствие на близките, а само стаи за срещи, и то при спазване на строги правила.
В какъв смисъл „качество на живот“?
Това състояние на публичните политики означава, че макар да се търсят варианти да бъдат посрещнати физическите нужди на едно дете с тежки проблеми, не се търсят отговори на въпросите за качеството на живота – и неговия, и на семейството му. Иначе казано,
някъде по света съществуват системи, които се занимават не само с това дали едно болно дете е нахранено, преобуто и медикирано, а се интересуват дали и доколко то успява да живее щастливо със своето семейство.
Една от причините този въпрос да не е засегнат в публичните политики е, че той изобщо много рядко ни хрумва. Родители, минали през това, споделят, че усещат определено очакване на обществото от тях – сякаш ако в едно семейство има тежко болно дете, и то, и близките му са длъжни да са страдащи и угрижени денонощно и без почивка. Това субективно усещане се потвърждава и при по-системно наблюдение на начина, по който се говори публично по темата.
Анализ на публикации, включващи понятието „детски палиативни грижи“, показва, че идеята, че тежко болните деца и семействата им трябва да имат качествен живот, напълно липсва от публичния ни наратив. Проучването обхваща 180 публикации в български дигитални медии в периода 2023–2024 г. и е изготвенo с подкрепата на Нов български университет и Медийна агенция „Персептика“.
От анализа става ясно, че езикът и съдържанието, описващи качеството на живот на едно дете, практически липсват в публикациите, свързани с детските палиативни грижи, както липсват и ключовите хора в разказа на една такава история.
КОЙ говори за детските палиативни грижи в България?
По данни на медийна агенция „Персептика“ в дигиталните медии в България за две години са публикувани 180 материала, в които става дума за детски палиативни грижи. Най-голям интерес към темата са показали специализираните уебсайтове за здравна информация (45 публикации) и дигиталните информационни медии с национален профил (43 публикации). В сайтовете на трите национални телевизии има общо две публикации по темата – по една в БНТ и Нова телевизия, и нито една в bTV.
Електронните медии с национален обхват продължават да играят важна роля в информираността на широката аудитория в България както през уебсайтовете си, така и чрез ефирните си програми и затова липсата на интерес у тях по темата означава и ниско познаване от аудиторията им. В същото време националните телевизии и радиостанции имат не само по-широка аудитория, но и нормативно определени задължения за отразяване на обществено значими теми, особено когато са свързани с уязвими групи, като тежко болни деца и техните семейства.
Анализът на говорителите, присъстващи в публикациите по темата за детските палиативни грижи, показва, че най-често това са медицински специалисти – лекари, свързани с педиатричната грижа и системата на общественото здраве (д-р Благомир Здравков, д-р Бояна Петкова, проф. Иван Литвиненко са най-често срещаните имена), които представят темата от гледна точка на клиничните нужди, липсата на структурирани услуги и необходимостта от системно решение.
Значително е и участието на експерти по медицинско и здравно право (адв. Мария Шаркова), граждански активисти и др. Приблизително в 47% от публикациите (85 бр.) са цитирани говорители, свързани с една гражданска организация – „Ида – фондация за палиативни грижи за деца“, в други 25% (45 бр.) са цитирани лекари от СБАЛДБ „Проф. д-р Иван Митев“ и в още 14,4% (26 бр.) – министри на здравеопазването и на труда и социалната политика. На практика се вижда, че публичният разказ се създава от една гражданска инициатива и една болница, което отново говори за липса на системност и широк дебат.
КАК се говори за детските палиативни грижи в България?
Често срещани думи в изследваните публикации
Среща ли се в публикацията следната дума или нейна производна
Брой публикации, в които се открива думата
Болница
139
Семейство
78
Терминално
51
Смърт
34
Умиращ
17
Приятели
16
Достойнство
13
Учене
9
Радост
3
Игра
0
Проследяването на ключовите думи в изследваните публикации сочи, че понятието „детски палиативни грижи“ почти винаги върви ръка за ръка с понятието „болница“, а в около половината от случаите – и с производни на думата „смърт“. За сметка на това обаче липсват думи, които биха описали качеството на живот на децата и техните семейства, каквито са например „учене“, „игра“ и „радост“.
Липсва и етично обоснован личен и емоционално ангажиран език за смъртта. Децата, за които се говори, не са личности с преживявания и собствен глас, а абстрактни фигури. Това лишава разговора за детските палиативни грижи от хуманност, а именно хуманността е в сърцевината на съвременното разбиране за този тип грижи. Сравнително честото присъствие на думата „семейство“ (в 78 публикации), съчетано с пълна липса на родители или братя и сестри като реални говорители в публикациите, разкрива интересен парадокс.
Сходно е положението с думата „приятели“. Формално тя се среща в 16 публикации, но съдържателният ѝ анализ показва, че социалната среда на детето – извън семейството – практически отсъства от медийния разказ за палиативните грижи.
Въпросът с „достойнството“ на децата, нуждаещи се от палиативни грижи, също остава необговорен – думата присъства, но в нито една публикация не се коментира какво на практика означава за едно тежко болно дете и семейството му да живеят „с достойнство“.
Първо политиките или първо разказът?
Изследвания сочат, че начинът, по който говорим по дадена тема, може да промени много – да ни научи, да ни преведе през чужди истории, да променя закони и нагласи. И ако в публичния разговор за „палиативни грижи“ се обсъжда „качество на живота“, „радост“ и „игра“, вместо „болница“ и „смърт“, ако историите се разказват от главните им герои, това ново послание рано или късно ще достигне до правилните си адресати.
А дотогава думите, които избираме да не включим в този разговор, всъщност ще са думите, които показват в коя посока сме решили да гледаме като общество и какво остава извън полезрението ни.
Настоящата публикация е създадена по проект „Да говорим с грижа: Палиативните грижи за деца през погледа на медиите“. Проектът се осъществява благодарение на най-голямата социално отговорна инициатива на Лидл България „Ти и Lidl“, в партньорство с Фондация „Работилница за граждански инициативи“, Български дарителски форум и Асоциация на европейските журналисти. Отговорността за съдържанието е на журналистката Надежда Цекулова и по никакъв начин не отразява официалните позиции на финансиращите организации.
Rapid7 researchers have identified a sophisticated malware campaign attributed to the threat actor “Dropping Elephant,” characterized by the use of a China-themed decoy document to deliver a heavily reworked, in-memory remote access trojan (RAT). This campaign demonstrates advanced evasion techniques, including DLL side-loading with a legitimate Microsoft binary (Fondue.exe) and the use of “Donut” shellcode to map the RAT directly into memory, effectively bypassing traditional disk-based security controls.
The revamped RAT significantly complicates detection by using control-flow flattening, runtime API reconstruction, and hardened C2 communications. Despite these modifications, Rapid7’s deep analysis confirms this activity is a direct evolution of Dropping Elephant’s tradecraft, based on shared beaconing patterns, screenshot logic, and command-handler structures. This discovery underscores the importance of proactive threat hunting and memory-level visibility in detecting modern, low-footprint implants.
Rapid7 is actively monitoring the infrastructure and tradecraft associated with this actor so we can provide comprehensive protection and intelligence to our customers.
Defenders should not rely on the IOCs alone. The most durable detection opportunities in this campaign are the behaviors: a shortcut file spawning PowerShell, files staged in C:\Users\Public\, a scheduled task named GoogleErrorReport executing every minute, and Fondue.exe loading APPWIZ.cpl from C:\Users\Public\ rather than a legitimate Windows directory.
Because the final RAT is loaded directly into memory through Donut, defenders should also review whether their endpoint tooling can detect memory-resident payloads and security-control patching within a process, including AMSI, WLDP, and ETW tampering.
Overview
During a proactive threat hunt, Rapid7 identified a malicious Windows shortcut that matched activity previously associated with Dropping Elephant. The shortcut used a China energy-sector contract lure and led to a payload chain that shared the family’s delivery patterns but ended in a substantially reworked RAT.
The decoy document was a contract completion and acceptance notice for the GRES-3 project and referenced delivery of industrial seawater circulation pump systems. Because the final payload differed significantly from known samples, Rapid7 analyzed the chain from the initial shortcut through the final in-memory RAT.
Luckily, during the analysis, the staging server was active which allowed us to download all attack artifacts. The recovered files use Fondue.exe, a legitimate Microsoft binary, to side-load a malicious loader. The loader decrypts an AES-wrapped payload stored on disk. The decrypted payload contains a Donut shellcode loader that embeds the final RAT and uses Chaskey block cipher as part of its payload protection scheme. Donut then decrypts the final 32-bit native RAT, maps it, and executes it in memory.
We found that the final RAT differs significantly from older Dropping Elephant RAT samples. The malware uses control-flow flattening, runtime API reconstruction, and static CRT linking to complicate analysis. It also hardens C2 communications through HTTPS transport, Salsa20-protected C2 fields, and additional environment checks. Despite these changes, code-level comparison still identifies shared lineage with a Dropping Elephant RAT reference sample through command-handler structure, screenshot capture logic, WININET request flow, beaconing patterns, and repeated buffer constants.
Technical analysis and observed attacker behavior
Figure 1: Full delivery chain from LNK to in-memory RAT
⠀
Stage 1: GRES3001.lnk
The attack starts when a user executes GRES3001.lnk, a malicious Windows shortcut disguised as a PDF. When opened, the shortcut spawns an obfuscated PowerShell downloader using conhost.exe. The PowerShell uses basic string-splitting obfuscation (e.g., iw”r, g”c”i, r”e”n, c”p”i, and &(g”cm sch*)) to evade keyword detection.
The downloader connects to the staging server chinagreenenergy[.]organd retrieves the decoy GRES3001.pdf along with additional malware files. It immediately opens the China energy-sector lure document to distract the victim while staging the remaining payloads in the background.
Figure 3: GRES-3 contract completion decoy document used as victim lure
⠀
Stage 2: Payload staging
Several payload files are downloaded with junk extensions such as .ezxzez, .cypyly, and .dzlzlz, then renamed by stripping filler characters to reconstruct Fondue.exe, APPWIZ.cpl, msvcp140.dll, and vcruntime140.dll in C:\Users\Public\. The encrypted payload editor.dat is written to the C:\Windows\Tasks\ folder.
After staging the files, the script creates a scheduled task named GoogleErrorReport, configured to run Fondue.exe every minute. It then deletes the original shortcut, leaving the scheduled task to trigger the next execution stage through the Fondue.exe side-loading chain.
Figure 4: Scheduled task creation command using gcm sch* obfuscation
Stage 3: DLL side-loading
The Fondue.exe loads the malicious APPWIZ.cpl staged alongside it in the C:\Users\Public\ directory. The side-loaded APPWIZ.cpl exports RunFODW, the function expected by Fondue.exe. RunFODW serves as the loader entry point and continues the payload chain by reading and decrypting editor.dat.
Stage 4: Encrypted payload and Donut loader
APPWIZ.cpl sha256: 914da75a4ad6d70db856a2bc318d8828f28894622f017ee78d470b4794faafa6, original name for the metadata is bluetooth_callback.dll.
Figure 5: APPWIZ.cpl PE metadata showing original filename bluetooth_callback.dll
⠀
It reads editor.dat, Base64-decodes it, and decrypts the result with AES-256-CBC via Windows CNG (bcrypt.dll). The 32-byte key and 16-byte IV are assembled on the stack from immediate mov operands:
The loader maps the shellcode into an RWX memory region using VirtualAlloc followed by memcpy call. Then it transfers execution indirectly by passing the shellcode address as the callback argument to EnumUILanguagesW.
Figure 6: EnumUILanguagesW callback proxy transferring execution to Donut shellcode
⠀
The decrypted output is a Donut shellcode blob, not the final RAT. Donut uses Chaskey-CTR to protect the embedded PE, maps it in memory, resolves imports, applies relocations, and transfers execution without writing the RAT to disk. Before running the payload, Donut patches AMSI, WLDP, and ETW inside the current process, reducing in-memory scanning, code-integrity checks, and event telemetry for the unpacked RAT.
The final payload is a native 32-bit C++ implant SHA 7099c33933716c00c1f4bdb0281c230b981c76b23d7d1c83abc6f58968267d54. It runs entirely in memory after the Donut stage maps it. At startup, the RAT first calls FreeConsole() to detach from any console so nothing shows up on screen. After that, it resolves its required APIs dynamically through a LoadLibrary / GetProcAddress loop. After API resolution, the RAT stages its crypto and builds C2 hostname, gcl-power[.]org. The cipher is Salsa20, and the key material is hardcoded. It is a 32-byte key tn9905083tfbsxqrxs7qe4ryw1nif8h1 with 8-byte nonce lPvymwIk. Next, it calls sub_40F4A0 subroutine which walks the running process list and checks each entry against a built-in list of debuggers, sandbox tools, and VM artifacts. During debugging, we observed the process scan, however, the implant continued normally, without killing security processes.
Both the process scan and public-IP geolocation check executed during dynamic testing without triggering self-termination. The RAT still reported the full process list in the mkeoldkf beacon field, exposing debuggers, sandbox tools, and other analysis artifacts to the operator.
After process scan, the malware creates a mutex “kshdkfhskdfjkhsdkfhsjkdfhkj” to prevent reinfection and reduce duplicate-process noise.
Finally, the RAT fingerprints the host, derives its bot ID, and enters sub_415750(), where it begins polling for commands from the C2 server. Unfortunately, during the analysis the C2 was already down.
Host fingerprinting
Before beaconing, the RAT collects seven fields describing the victim host and packs them into the registration POST body:
Field
Meaning
umnome
Username
pmjodf
Computer name
idkdfjej
Bot ID / cid
vrjdmej
OS version
ndlpeip
Public IP and country
cokenme
Country
mkeoldkf
Full running-process list
Table 2: RAT registration beacon fields and their meaning
During fingerprinting, the RAT makes a one-time call to api.ipify.org to learn the host’s own public IP, then passes that IP to ip2c.org to resolve the country. The user-agent used in the recon phase is Mozilla/5.0 (Windows NT 10.0; Win64; x64)AppleWebKit/537.36 (KHTML, like Gecko) Chrome/123.0.0.0 Safari/537.36.The bot ID is not hardcoded. It is derived at runtime from the host and submitted in the idkdfjej field. Each field is independently wrapped as base64url(Salsa20(base64url(value))).
Command and control
The RAT periodically sends HTTPS POST requests to the C2 server on port 443 (INTERNET_FLAG_SECURE). It uses a 23-character token, RRn926EmIRfm9IlJyP1yVO2 for C2 traffic to gcl-power[.]org. Each beacon loop iteration follows the same pattern:
POSTs dine=<cid> to the command-poll endpoint /prjozifvkpkfhkr/gedhagammgjvvva/;
blocks on InternetReadFile while waiting for a task;
treats MMMMM==YYYYY as the idle sentinel, sleeps for approximately three seconds, and re-polls;
C2 tasks are wrapped in <>()*delimiters. The RAT strips these characters and decodes the payload back to the original command using base64url(Salsa20(base64url(value))) again.
Figure 7: RAT beacon loop showing connectivity check, command poll, and idle sentinel handling
⠀
Each cycle, the RAT first confirms the host is actually online by quietly pinging google.com, yahoo.com, and cloudflare.com. Only if that succeeds does it beacon to its C2. When all’s well it checks in every 10 seconds and if a check-in fails it retries every 2 seconds, until it recovers.
Operator capabilities
During our analysis we confirmed 5 command handlers.
Token
Capability
Behavior
fl
Directory listing
Recursively enumerates files
dw
Download and execute
Fetches a file, writes it to disk, and runs it
sc
Screenshot
Captures the virtual screen with BitBlt, encodes it with WIC, and exfiltrates it to a dedicated endpoint. This behavior is command-gated, not periodic.
cmx
Shell execution
Runs cmd.exe /c chcp 65001 | <cmd> and captures stdout
uf
File upload
Exfiltrates a specified file
Table 3: Confirmed RAT command handlers with dispatch tokens and behavior
The RAT identifies tasks by looking for command tokens in the C2 response. Each token is followed by the delimiter ==zz==oo==pp==. For example, fl==zz==oo==pp== tells the RAT to run the file-listing handler.
Anti-analysis
The RAT uses several anti-analysis techniques, including control-flow flattening, opaque predicates, dynamic API resolution, stack-built strings, static CRT linking, process blacklist checks, CPUID hypervisor checks, VM artifact checks, and public-IP geolocation checks.
Figure 8: Control-flow flattening dispatcher skeleton in decompiler output
⠀
During dynamic testing, the process scan and public-IP geolocation checks are executed without triggering self-termination. The RAT built its registration beacon with the full process list in the mkeoldkf field and attempted to send it to gcl-power[.]org. The connection returned HTTP 522, so the beacon did not reach the origin server during testing. Based on this run, we can confirm the environment checks and reporting behavior. Unfortunately, we cannot determine whether the operator would have killed the session, continued tasking, or taken another action after receiving the process list. The full list of processes and security tools cancould be found in the IOCs section below.
Attribution
To test whether the RAT delivered by Donut was related to Dropping Elephant, we compared it with a known family sample documented by Arctic Wolf in July 2025: SHA-256 8b6acc087e403b913254dd7d99f09136dc54fa45cf3029a8566151120d34d1c2. That report provides the family context for the reference sample.
BinDiff produced low signal, with 8.6% overall similarity. We do not treat this as evidence against shared lineage. The new sample uses control-flow flattening, which changes the control-flow graph structure that BinDiff depends on. Therefore we also compared the samples with Diaphora, using pseudocode and AST-level features less affected by control-flow flattening.
Diaphora identified four function-level overlaps that pointed to a shared code usage.
Functionality
Shared traits
Command execution
Similar allocation, encoding, formatting, and POST structure; repeated use of the 0x2710 buffer constant
Screenshot handling
Same GDI screenshot pattern, including GetSystemMetrics values 78 and 79 and BitBlt with 0xCC0020; the newer sample uses WIC instead of GDI+ for encoding
C2 connection
Same WININET request flow: open, connect, open request, send request, read response; the newer sample moves from HTTP to HTTPS with INTERNET_FLAG_SECURE
Shell execution
Shared hidden-window execution and cmd.exe /c chcp 65001 output-capture pattern
Table 4: Code-level overlaps between editor.extracted.exe and old_rat.exe identified by Diaphora
The LNK lure and delivery chain also resemble prior Dropping Elephant reporting, including PowerShell staging, legitimate binary abuse, scheduled task persistence, extension manipulation during downloads, and DLL side-loading. These overlaps supported the initial hypothesis, but the payload comparison provides the primary evidence for the lineage assessment.
Mitigation guidance
MITRE ATT&CK techniques
Tactic
Technique
Observable
Initial Access
Phishing: Spearphishing Attachment [T1566.001]
Malicious GRES3001.lnk used as the initial lure artifact; no email artifact recovered
Execution
User Execution: Malicious File [T1204.002]
User opens GRES3001.lnk
Execution
Command and Scripting Interpreter: PowerShell [T1059.001]
LNK launches conhost.exe, which starts the PowerShell downloader
Execution
Command and Scripting Interpreter: Windows Command Shell [T1059.003]
RAT cmx handler runs cmd.exe /c chcp 65001 | <cmd>
Persistence
Scheduled Task/Job: Scheduled Task [T1053.005]
GoogleErrorReport runs C:\Users\Public\Fondue.exe every minute
Geolocation lookup used during host fingerprinting
Conclusion
The campaign analyzed in this blog demonstrates continued Dropping Elephant operational investment and tooling development. The actor reused recognizable delivery patterns, including a China-themed lure, PowerShell-based staging, scheduled task persistence, shortcut-based execution, and DLL side-loading through a trusted Microsoft binary. At the same time, it evolved the final payload into a more evasive, memory-resident implant.
The final RAT represents a notable evolution from previously documented Dropping Elephant tooling. It executes entirely in memory, patches AMSI, WLDP, and ETW before running, and incorporates additional obfuscation and anti-analysis techniques that make detection and analysis more difficult.
For defenders, the practical takeaway is that Dropping Elephant’s tooling may be changing faster than its operational approach. Hashes, filenames, and infrastructure are likely to change across campaigns, but the path into execution still creates opportunities to detect and disrupt the activity before the final implant runs.
On 14 April, the Trump administration quietly acknowledged the widespread use of AI to automate government processes. The office of management and budget (OMB) disclosed a staggering 3,611 active or planned use cases for AI across the federal government. The list has ballooned by 70% from the one published in the final year of the Biden administration, and includes many disturbing-seeming plans to hand over sensitive governmental functions to AI.
Scanning this list, many readers may find many causes for alarm. It represents a transfer of decision processes from human to machine on a massive scale over matters of individual freedom, public health and well-being, nuclear reactor safety and more.
Consider these examples. The Health and Human Services’ (HHS) office of administration for children and families hired the world’s “scariest AI company,” Palantir—notorious for its work on behalf of the military, the CIA and ICE—to scan all grant applications to flag those not ideologically aligned with the administration’s dictates. The Federal Bureau of Prisons is developing an AI system to assess the “potential for misconduct for newly admitted inmates,” routing people into high-security confinement before they have actually done anything wrong in their custody. These read like programs fit for a Philip K Dick or George Orwell novel.
Other use cases insert AI into life-and-death decision making. The Department of Veterans Affairs is developing an AI that will listen in on calls to the veterans crisis line, and then gather information from external databases to assess the mental state and suicide risk of the caller.
The Department of Energy is testing the use of AI to control nuclear reactors, targeting a way to autonomously respond to potential nuclear safety incidents. Here’s one that’s disturbing for its retirement, rather than its deployment: the state department has ended a program to use AI to forecast mass civilian killings, which had been intended to aid conflict prevention.
While it’s easy to raise questions about these and similar uses of AI, the reality is that any of these programs could be implemented responsibly. In some cases, like the HHS system, the AI might be enforcing alignment to a policy prescription that opponents abhor. But that concern is more about the policy itself rather than the idea that agencies should comply with executive orders.
In other cases, there may even be bipartisan agreement on the goal, like taking urgent action to help veterans at risk of self-harm. Lots of work and validation is needed to prove AI safe and effective for these use cases and convince the public it is appropriate, but the idea is plausible.
In other cases, a scary-sounding AI use may not even be new. The use of predictive methods and statistics to assign prisoner security classifications goes back decades, even if such systems are often biased and ineffective.
Using autonomous systems for model predictive control (MPC) of nuclear reactors is a well studied, and a widely applied aspect of nuclear plant management. And the recently disclosed addition of AI was initiated under the Biden administration.
But anyone reviewing the 2025 inventory could be forgiven for leaping to severe conclusions. What matters are the details of how the AI system is used, and here the inventory is severely lacking.
The disclosures carry minimal information, and lack the context necessary to understand their purpose and approach. The descriptions are typically just a sentence, and rarely more than a paragraph.
And while the process theoretically involves some form of public consultation, in reality there is generally none. It would take an eagle-eyed citizen to even come across this disclosure. Unless you read FedScoop regularly, or watch the OMB’s federal chief information officer’s GitHub account, you probably missed it.
Only one of the examples cited above (the DoJ) even proposes to involve the public. Under the administration’s policy, it’s not required for the rest because they are not classified as “high impact” use cases—a label that is applied inconsistently across agencies.
We wrote a book surveying applications of AI to democratic processes worldwide, including executive agencies as well as the courts, legislatures and politics. Our conclusion was that, while there are inappropriate applications of AI in governance that should be resisted, an urgent need to reform the economics of AI, and an imperative for renovating the democratic systems it is being unleashed on, there are also valuable and beneficial use cases for AI in government.
Machine translation is a good example. Customs and Border Protection (CBP) has deployed an AI translation system to help officers when human interpreters are not available. The idea that CBP, an agency under heavy scrutiny for reported abuses of human rights, would direct people to talk to a machine instead of a person may strike many as inhumane.
It’s true that human interpreters have very real advantages when it comes to understanding nuance from physical cues and social context. But an officer with a competent AI translator available immediately is better than one who cannot communicate with the person in front of them.
The Trump administration’s AI use case inventory has 70 such translation use cases, up from 58 in the Biden administration’s 2024 disclosure.
Disclosure of AI use cases could be a means to build public confidence and trust, but only if paired with consistent, meaningful public consultation. Washington DC and California are actively engaging the public to determine where and how it’s appropriate to use AI in government processes, or for government to regulate AI use in society.
Both have held public deliberations on this topic at a wide scale, using AI platforms. These examples demonstrate the potential for capturing broad-based public input to steer AI policy.
The international gold standard was arguably set by the French in 2016, via their Digital Republic Act. The law, itself informed by an online citizen consultation, requires all algorithms used to automate government administrative decisions to be subject to public records requests, to be appealable to a human reviewer, and to have mandatory notification of the use of automation to those affected by the decisions.
Canada offers another example of what more rigorous and participatory disclosure might look like. In 2025, they launched an AI use case registry, not unlike the US inventory. However, Canada also has a federal directive mandating a transparent risk-scoring and impact assessment process for automated systems that make administrative decisions about citizens.
That longstanding directive requires a detailed explanation of risks and benefits as well as consultation with certain stakeholders from the conception of the AI use case. The Canadian system could be improved; it could require a public comment period and an obligation for agencies to respond substantively to feedback before engaging in sensitive uses of AI.
AI offers real potential to improve the efficacy, efficiency and accessibility of government. But, equally, there is legitimate reason for public concern and distrust that can only be addressed through transparency and dialog. The US should adopt, at the federal and state level, algorithmic impact risk assessment procedures and public comment processes to facilitate a safe, trusted, equitable transformation of government agencies to take advantage of modern technology.
This essay was written with Nathan E. Sanders, and originally appeared in The Guardian.
The collective thoughts of the interwebz
Manage Consent
To provide the best experiences, we use technologies like cookies to store and/or access device information. Consenting to these technologies will allow us to process data such as browsing behavior or unique IDs on this site. Not consenting or withdrawing consent, may adversely affect certain features and functions.
Functional
Always active
The technical storage or access is strictly necessary for the legitimate purpose of enabling the use of a specific service explicitly requested by the subscriber or user, or for the sole purpose of carrying out the transmission of a communication over an electronic communications network.
Preferences
The technical storage or access is necessary for the legitimate purpose of storing preferences that are not requested by the subscriber or user.
Statistics
The technical storage or access that is used exclusively for statistical purposes.The technical storage or access that is used exclusively for anonymous statistical purposes. Without a subpoena, voluntary compliance on the part of your Internet Service Provider, or additional records from a third party, information stored or retrieved for this purpose alone cannot usually be used to identify you.
Marketing
The technical storage or access is required to create user profiles to send advertising, or to track the user on a website or across several websites for similar marketing purposes.