Post Syndicated from Debu Panda original https://aws.amazon.com/blogs/big-data/integrate-tableau-and-okta-with-amazon-redshift-using-aws-iam-identity-center/
This blog post is co-written with Sid Wray and Jake Koskela from Salesforce, and Adiascar Cisneros from Tableau.
Amazon Redshift is a fast, scalable cloud data warehouse built to serve workloads at any scale. With Amazon Redshift as your data warehouse, you can run complex queries using sophisticated query optimization to quickly deliver results to Tableau, which offers a comprehensive set of capabilities and connectivity options for analysts to efficiently prepare, discover, and share insights across the enterprise. For customers who want to integrate Amazon Redshift with Tableau using single sign-on capabilities, we introduced AWS IAM Identity Center integration to seamlessly implement authentication and authorization.
IAM Identity Center provides capabilities to manage single sign-on access to AWS accounts and applications from a single location. Redshift now integrates with IAM Identity Center, and supports trusted identity propagation, making it possible to integrate with third-party identity providers (IdP) such as Microsoft Entra ID (Azure AD), Okta, Ping, and OneLogin. This integration positions Amazon Redshift as an IAM Identity Center-managed application, enabling you to use database role-based access control on your data warehouse for enhanced security. Role-based access control allows you to apply fine grained access control using row level, column level, and dynamic data masking in your data warehouse.
AWS and Tableau have collaborated to enable single sign-on support for accessing Amazon Redshift from Tableau. Tableau now supports single sign-on capabilities with Amazon Redshift connector to simplify the authentication and authorization. The Tableau Desktop 2024.1 and Tableau Server 2023.3.4 releases support trusted identity propagation with IAM Identity Center. This allows users to seamlessly access Amazon Redshift data within Tableau using their external IdP credentials without needing to specify AWS Identity and Access Management (IAM) roles in Tableau. This single sign-on integration is available for Tableau Desktop, Tableau Server, and Tableau Prep.
In this post, we outline a comprehensive guide for setting up single sign-on to Amazon Redshift using integration with IAM Identity Center and Okta as the IdP. By following this guide, you’ll learn how to enable seamless single sign-on authentication to Amazon Redshift data sources directly from within Tableau Desktop, streamlining your analytics workflows and enhancing security.
Solution overview
The following diagram illustrates the architecture of the Tableau SSO integration with Amazon RedShift, IAM Identity Center, and Okta.

Figure 1: Solution overview for Tableau integration with Amazon Redshift using IAM Identity Center and Okta
The solution depicted in Figure 1 includes the following steps:
- The user configures Tableau to access Redshift using IAM Identity Center authentication
- On a user sign-in attempt, Tableau initiates a browser-based OAuth flow and redirects the user to the Okta login page to enter the login credentials.
- On successful authentication, Okta issues an authentication token (id and access token) to Tableau
- Redshift driver then makes a call to Redshift-enabled IAM Identity Center application and forwards the access token.
- Redshift passes the token to Identity Center and requests an access token.
- Identity Center verifies/validates the token using the OIDC discovery connection to the trusted token issuer and returns an Identity Center generated access token for the same user. In Figure 1, Trusted Token Issuer (TTI) is the Okta server that Identity Center trusts to provide tokens that third-party applications like Tableau uses to call AWS services.
- Redshift then uses the token to obtain the user and group membership information from IAM Identity Center.
- Tableau user will be able to connect with Amazon Redshift and access data based on the user and group membership returned from IAM Identity Center.
Prerequisites
Before you begin implementing the solution, make sure that you have the following in place:
Walkthrough
In this walkthrough, you build the solution with following steps:
- Set up the Okta OIDC application
- Set up the Okta authorization server
- Set up the Okta claims
- Setup the Okta access policies and rules
- Setup trusted token issuer in AWS IAM Identity Center
- Setup client connections and trusted token issuers
- Setup the Tableau OAuth config files for Okta
- Install the Tableau OAuth config file for Tableau Desktop
- Setup the Tableau OAuth config file for Tableau Server or Tableau Cloud
- Federate to Amazon Redshift from Tableau Desktop
- Federate to Amazon Redshift from Tableau Server
Set up the Okta OIDC application
To create an OIDC web app in Okta, you can follow the instructions in this video, or use the following steps to create the wep app in Okta admin console:
Note: The Tableau Desktop redirect URLs should always use localhost. The examples below also use localhost for the Tableau Server hostname for ease of testing in a test environment. For this setup, you should also access the server at localhost in the browser. If you decide to use localhost for early testing, you will also need to configure the gateway to accept localhost using this tsm command:
tsm configuration set -k gateway.public.host -v localhost
In a production environment, or Tableau Cloud, you should use the full hostname that your users will access Tableau on the web, along with https. If you already have an environment with https configured, you may skip the localhost configuration and use the full hostname from the start.
- Sign in to your Okta organization as a user with administrative privileges.
- On the admin console, under Applications in the navigation pane, choose Applications.
- Choose Create App Integration.
- Select OIDC – OpenID Connect as the Sign-in method and Web Application as the Application type.
- Choose Next.
- In General Settings:
- App integration name: Enter a name for your app integration. For example,
Tableau_Redshift_App.
- Grant type: Select Authorization Code and Refresh Token.
- Sign-in redirect URIs: The sign-in redirect URI is where Okta sends the authentication response and ID token for the sign-in request. The URIs must be absolute URIs. Choose Add URl and along with the default URl, add the following URIs.
http://localhost:55556/Callbackhttp://localhost:55557/Callbackhttp://localhost:55558/Callbackhttp://localhost/auth/add_oauth_token
- Sign-out redirect URIs: keep the default value as
http://localhost:8080.
- Skip the Trusted Origins section and for Assignments, select Skip group assignment for now.
- Choose Save.

Figure 2: OIDC application
- In the General Settings section, choose Edit and select Require PKCE as additional verification under Proof Key for Code Exchange (PKCE). This option indicates if a PKCE code challenge is required to verify client requests.
- Choose Save.

Figure 3: OIDC App Overview
- Select the Assignments tab and then choose Assign to Groups. In this example, we’re assigning awssso-finance and awssso-sales.
- Choose Done.

Figure 4: OIDC application group assignments
For more information on creating an OIDC app, see Create OIDC app integrations.
Set up the Okta authorization server
Okta allows you to create multiple custom authorization servers that you can use to protect your own resource servers. Within each authorization server you can define your own OAuth 2.0 scopes, claims, and access policies. If you have an Okta Developer Edition account, you already have a custom authorization server created for you called default.
For this blog post, we use the default custom authorization server. If your application has requirements such as requiring more scopes, customizing rules for when to grant scopes, or you need more authorization servers with different scopes and claims, then you can follow this guide.

Figure 5: Authorization server
Set up the Okta claims
Tokens contain claims that are statements about the subject (for example: name, role, or email address). For this example, we use the default custom claim sub. Follow this guide to create claims.

Figure 6: Create claims
Setup the Okta access policies and rules
Access policies are containers for rules. Each access policy applies to a particular OpenID Connect application. The rules that the policy contains define different access and refresh token lifetimes depending on the nature of the token request. In this example, you create a simple policy for all clients as shown in Figure 7 that follows. Follow this guide to create access policies and rules.

Figure 7: Create access policies
Rules for access policies define token lifetimes for a given combination of grant type, user, and scope. They’re evaluated in priority order and after a matching rule is found, no other rules are evaluated. If no matching rule is found, then the authorization request fails. This example uses the role depicted in Figure 8 that follows. Follow this guide to create rules for your use case.

Figure 8: Access policy rules
Setup trusted token issuer in AWS IAM Identity Center
At this point, you switch to setting up the AWS configuration, starting by adding a trusted token issuer (TTI), which makes it possible to exchange tokens. This involves connecting IAM Identity Center to the Open ID Connect (OIDC) discovery URL of the external OAuth authorization server and defining an attribute-based mapping between the user from the external OAuth authorization server and a corresponding user in Identity Center. In this step, you create a TTI in the centralized management account. To create a TTI:
- Open the AWS Management Console and navigate to IAM Identity Center, and then to the Settings page.
- Select the Authentication tab and under Trusted token issuers, choose Create trusted token issuer.
- On the Set up an external IdP to issue trusted tokens page, under Trusted token issuer details, do the following:
- For Issuer URL, enter the OIDC discovery URL of the external IdP that will issue tokens for trusted identity propagation. The administrator of the external IdP can provide this URL (for example,
https://prod-1234567.okta.com/oauth2/default).
To get the issuer URL from Okta, sign in as an admin to Okta and navigate to Security and then to API and choose default under the Authorization Servers tab and copy the Issuer URL
Figure 9: Authorization server issuer
- For Trusted token issuer name, enter a name to identify this trusted token issuer in IAM Identity Center and in the application console.
- Under Map attributes, do the following:
- For Identity provider attribute, select an attribute from the list to map to an attribute in the IAM Identity Center identity store.
- For IAM Identity Center attribute, select the corresponding attribute for the attribute mapping.
- Under Tags (optional), choose Add new tag, enter a value for Key and optionally for Value. Choose Create trusted token issuer. For information about tags, see Tagging AWS IAM Identity Center resources.
This example uses Subject (sub) as the Identity provider attribute to map with Email from the IAM identity Center attribute. Figure 10 that follows shows the set up for TTI.

Figure 10: Create Trusted Token Issuer
Setup client connections and trusted token issuers
In this step, the Amazon Redshift applications that exchange externally generated tokens must be configured to use the TTI you created in the previous step. Also, the audience claim (or aud claim) from Okta must be specified. In this example, you are configuring the Amazon Redshift application in the member account where the Amazon Redshift cluster or serverless instance exists.
- Select IAM Identity Center connection from Amazon Redshift console menu.

Figure 11: Amazon Redshift IAM Identity Center connection
- Select the Amazon Redshift application that you created as part of the prerequisites.
- Select the Client connections tab and choose Edit.
- Choose Yes under Configure client connections that use third-party IdPs.
- Select the checkbox for Trusted token issuer which you have created in the previous section.
- Enter the aud claim value under section Configure selected trusted token issuers. For example,
okta_tableau_audience.
To get the audience value from Okta, sign in as an admin to Okta and navigate to Security and then to API and choose default under the Authorization Servers tab and copy the Audience value.
Figure 12: Authorization server audience
Note: The audience claim value must exactly match with IdP audience value otherwise your OIDC connection with third part application like Tableau will fail.
- Choose Save.

Figure 13: Adding Audience Claim for Trusted Token Issuer
Setup the Tableau OAuth config files for Okta
At this point, your IAM Identity Center, Amazon Redshift, and Okta configuration are complete. Next, you need to configure Tableau.
To integrate Tableau with Amazon Redshift using IAM Identity Center, you need to use a custom XML. In this step, you use the following XML and replace the values starting with the $ sign and highlighted in bold. The rest of the values can be kept as they are, or you can modify them based on your use case. For detailed information on each of the elements in the XML file, see the Tableau documentation on GitHub.
Note: The XML file will be used for all the Tableau products including Tableau Desktop, Server, and Cloud.
<?xml version="1.0" encoding="utf-8"?>
<pluginOAuthConfig>
<dbclass>redshift</dbclass>
<oauthConfigId>custom_redshift_okta</oauthConfigId>
<clientIdDesktop>$copy_client_id_from_okta_oidc_app</clientIdDesktop>
<clientSecretDesktop>$copy_client_secret_from_okta_oidc_app</clientSecretDesktop>
<redirectUrisDesktop>http://localhost:55556/Callback</redirectUrisDesktop>
<redirectUrisDesktop>http://localhost:55557/Callback</redirectUrisDesktop>
<redirectUrisDesktop>http://localhost:55558/Callback</redirectUrisDesktop>
<authUri>https://$copy_okta_host_value.okta.com/oauth2/default/v1/authorize</authUri>
<tokenUri>https://$copy_okta_host_value.okta.com/oauth2/default/v1/token</tokenUri>
<scopes>openid</scopes>
<scopes>email</scopes>
<scopes>profile</scopes>
<scopes>offline_access</scopes>
<capabilities>
<entry>
<key>OAUTH_CAP_FIXED_PORT_IN_CALLBACK_URL</key>
<value>true</value>
</entry>
<entry>
<key>OAUTH_CAP_PKCE_REQUIRES_CODE_CHALLENGE_METHOD</key>
<value>true</value>
</entry>
<entry>
<key>OAUTH_CAP_REQUIRE_PKCE</key>
<value>true</value>
</entry>
<entry>
<key>OAUTH_CAP_SUPPORTS_STATE</key>
<value>true</value>
</entry>
<entry>
<key>OAUTH_CAP_CLIENT_SECRET_IN_URL_QUERY_PARAM</key>
<value>true</value>
</entry>
<entry>
<key>OAUTH_CAP_SUPPORTS_GET_USERINFO_FROM_ID_TOKEN</key>
<value>true</value>
</entry>
</capabilities>
<accessTokenResponseMaps>
<entry>
<key>ACCESSTOKEN</key>
<value>access_token</value>
</entry>
<entry>
<key>REFRESHTOKEN</key>
<value>refresh_token</value>
</entry>
<entry>
<key>id-token</key>
<value>id_token</value>
</entry>
<entry>
<key>access-token-issue-time</key>
<value>issued_at</value>
</entry>
<entry>
<key>access-token-expires-in</key>
<value>expires_in</value>
</entry>
<entry>
<key>username</key>
<value>preferred_username</value>
</entry>
</accessTokenResponseMaps>
</pluginOAuthConfig>
The following is an example XML file:
<?xml version="1.0" encoding="utf-8"?>
<pluginOAuthConfig>
<dbclass>redshift</dbclass>
<oauthConfigId>custom_redshift_okta</oauthConfigId>
<clientIdDesktop>ab12345z-a5nvb-123b-123b-1c434ghi1234</clientIdDesktop>
<clientSecretDesktop>3243jkbkjb~~ewf.112121.3432423432.asd834k</clientSecretDesktop>
<redirectUrisDesktop>http://localhost:55556/Callback</redirectUrisDesktop>
<redirectUrisDesktop>http://localhost:55557/Callback</redirectUrisDesktop>
<redirectUrisDesktop>http://localhost:55558/Callback</redirectUrisDesktop>
<authUri>https://prod-1234567.okta.com/oauth2/default/v1/authorize</authUri>
<tokenUri>https://prod-1234567.okta.com/oauth2/default/v1/token</tokenUri>
<scopes>openid</scopes>
<scopes>email</scopes>
<scopes>profile</scopes>
<scopes>offline_access</scopes>
<capabilities>
<entry>
<key>OAUTH_CAP_FIXED_PORT_IN_CALLBACK_URL</key>
<value>true</value>
</entry>
<entry>
<key>OAUTH_CAP_PKCE_REQUIRES_CODE_CHALLENGE_METHOD</key>
<value>true</value>
</entry>
<entry>
<key>OAUTH_CAP_REQUIRE_PKCE</key>
<value>true</value>
</entry>
<entry>
<key>OAUTH_CAP_SUPPORTS_STATE</key>
<value>true</value>
</entry>
<entry>
<key>OAUTH_CAP_CLIENT_SECRET_IN_URL_QUERY_PARAM</key>
<value>true</value>
</entry>
<entry>
<key>OAUTH_CAP_SUPPORTS_GET_USERINFO_FROM_ID_TOKEN</key>
<value>true</value>
</entry>
</capabilities>
<accessTokenResponseMaps>
<entry>
<key>ACCESSTOKEN</key>
<value>access_token</value>
</entry>
<entry>
<key>REFRESHTOKEN</key>
<value>refresh_token</value>
</entry>
<entry>
<key>id-token</key>
<value>id_token</value>
</entry>
<entry>
<key>access-token-issue-time</key>
<value>issued_at</value>
</entry>
<entry>
<key>access-token-expires-in</key>
<value>expires_in</value>
</entry>
<entry>
<key>username</key>
<value>preferred_username</value>
</entry>
</accessTokenResponseMaps>
</pluginOAuthConfig>
Install the Tableau OAuth config file for Tableau Desktop
After the configuration XML file is created, it must be copied to a location to be used by Amazon Redshift Connector from Tableau Desktop. Save the file from the previous step as .xml and save it under Documents\My Tableau Repository\OAuthConfigs.
Note: Currently this integration isn’t supported in macOS because the Redshift ODBC 2.X driver isn’t supported yet for MAC. It will be supported soon.
Setup the Tableau OAuth config file for Tableau Server or Tableau Cloud
To integrate with Amazon Redshift using IAM Identity Center authentication, you must install the Tableau OAuth config file in Tableau Server or Tableau Cloud
- Sign in to the Tableau Server or Tableau Cloud using admin credentials.
- Navigate to Settings.
- Go to OAuth Clients Registry and select Add OAuth Client
- Choose following settings:
- Connection Type: Amazon Redshift
- OAuth Provider: Custom_IdP
- Client ID: Enter your IdP client ID value
- Client Secret: Enter your client secret value
- Redirect URL: Enter
http://localhost/auth/add_oauth_token. This example uses localhost for testing in a local environment. You should use the full hostname with https.
- Choose OAuth Config File. Select the XML file that you configured in the previous section.
- Select Add OAuth Client and choose Save.

Figure 14: Create an OAuth connection in Tableau Server or Tableau Cloud
Federate to Amazon Redshift from Tableau Desktop
Now you’re ready to connect to Amazon Redshift from Tableau through federated sign-in using IAM Identity Center authentication. In this step, you create a Tableau Desktop report and publish it to Tableau Server.
- Open Tableau Desktop.
- Select Amazon Redshift Connector and enter the following values:
- Server: Enter the name of the server that hosts the database and the name of the database you want to connect to.
- Port: Enter 5439.
- Database: Enter your database name. This example uses
dev.
- Authentication: Select OAuth.
- Federation Type: Select Identity Center.
- Identity Center Namespace: You can leave this value blank.
- OAuth Provider: This value should automatically be pulled from your configured XML. It will be the value from the element
oauthConfigId.
- Select Require SSL.
- Choose Sign in.

Figure 15: Tableau Desktop OAuth connection
- Enter your IdP credentials in the browser pop-up window.

Figure 16: Okta Login Page
- When authentication is successful, you will see the message shown in Figure 17 that follows.

Figure 17: Successful authentication using Tableau
Congratulations! You’re signed in using IAM Identity Center integration with Amazon Redshift and are ready to explore and analyze your data using Tableau Desktop.

Figure 18: Successfully connected using Tableau Desktop
Figure 19 is a screenshot from the Amazon Redshift system table (sys_query_history) showing that user Ethan from Okta is accessing the sales report.

Figure 19: User audit in sys_query_history
After signing in, you can create your own Tableau Report on the desktop version and publish it to your Tableau Server. For this example, we created and published a report named SalesReport.
Federate to Amazon Redshift from Tableau Server
After you have published the report from Tableau Desktop to Tableau Server, sign in as a non-admin user and view the published report (SalesReport in this example) using IAM Identity Center authentication.
- Sign in to the Tableau Server site as a non-admin user.
- Navigate to Explore and go to the folder where your published report is stored.
- Select the report and choose Sign In.

Figure 20: Tableau Server Sign In
- To authenticate, enter your non-admin Okta credentials in the browser pop-up.

Figure 21: Okta Login Page
- After your authentication is successful, you can access the report.

Figure 22: Tableau report
Clean up
Complete the following steps to clean up your resources:
- Delete the IdP applications that you have created to integrate with IAM Identity Center.
- Delete the IAM Identity Center configuration.
- Delete the Amazon Redshift application and the Amazon Redshift provisioned cluster or serverless instance that you created for testing.
- Delete the IAM role and IAM policy that you created for IAM Identity Center and Amazon Redshift integration.
- Delete the permission set from IAM Identity Center that you created for Amazon Redshift Query Editor V2 in the management account.
Conclusion
This post covered streamlining access management for data analytics by using Tableau’s capability to support single sign-on based on the OAuth 2.0 OpenID Connect (OIDC) protocol. The solution enables federated user authentication, where user identities from an external IdP are trusted and propagated to Amazon Redshift. You walked through the steps to configure Tableau Desktop and Tableau Server to integrate seamlessly with Amazon Redshift using IAM Identity Center for single sign-on. By harnessing this integration of a third party IdP with IAM Identity Center, users can securely access Amazon Redshift data sources within Tableau without managing separate database credentials.
Listed below are key resources to learn more about Amazon Redshift integration with IAM Identity Center
About the Authors
 Debu Panda is a Senior Manager, Product Management at AWS. He is an industry leader in analytics, application platform, and database technologies, and has more than 25 years of experience in the IT world.
 Sid Wray is a Senior Product Manager at Salesforce based in the Pacific Northwest with nearly 20 years of experience in Digital Advertising, Data Analytics, Connectivity Integration and Identity and Access Management. He currently focuses on supporting ISV partners for Salesforce Data Cloud.
 Adiascar Cisneros is a Tableau Senior Product Manager based in Atlanta, GA. He focuses on the integration of the Tableau Platform with AWS services to amplify the value users get from our products and accelerate their journey to valuable, actionable insights. His background includes analytics, infrastructure, network security, and migrations.
 Jade Koskela is a Principal Software Engineer at Salesforce. He has over a decade of experience building Tableau with a focus on areas including data connectivity, authentication, and identity federation.
 Harshida Patel is a Principal Solutions Architect, Analytics with AWS.
 Maneesh Sharma is a Senior Database Engineer at AWS with more than a decade of experience designing and implementing large-scale data warehouse and analytics solutions. He collaborates with various Amazon Redshift Partners and customers to drive better integration.
Ravi Bhattiprolu is a Senior Partner Solutions Architect at Amazon Web Services (AWS). He collaborates with strategic independent software vendor (ISV) partners like Salesforce and Tableau to design and deliver innovative, well-architected cloud products, integrations, and solutions to help joint AWS customers achieve their business goals.


 Nihar Sheth is a Senior Product Manager at Amazon Web Services. He is passionate about developing intuitive product experiences that solve complex customer problems and enable customers to achieve their business goals.
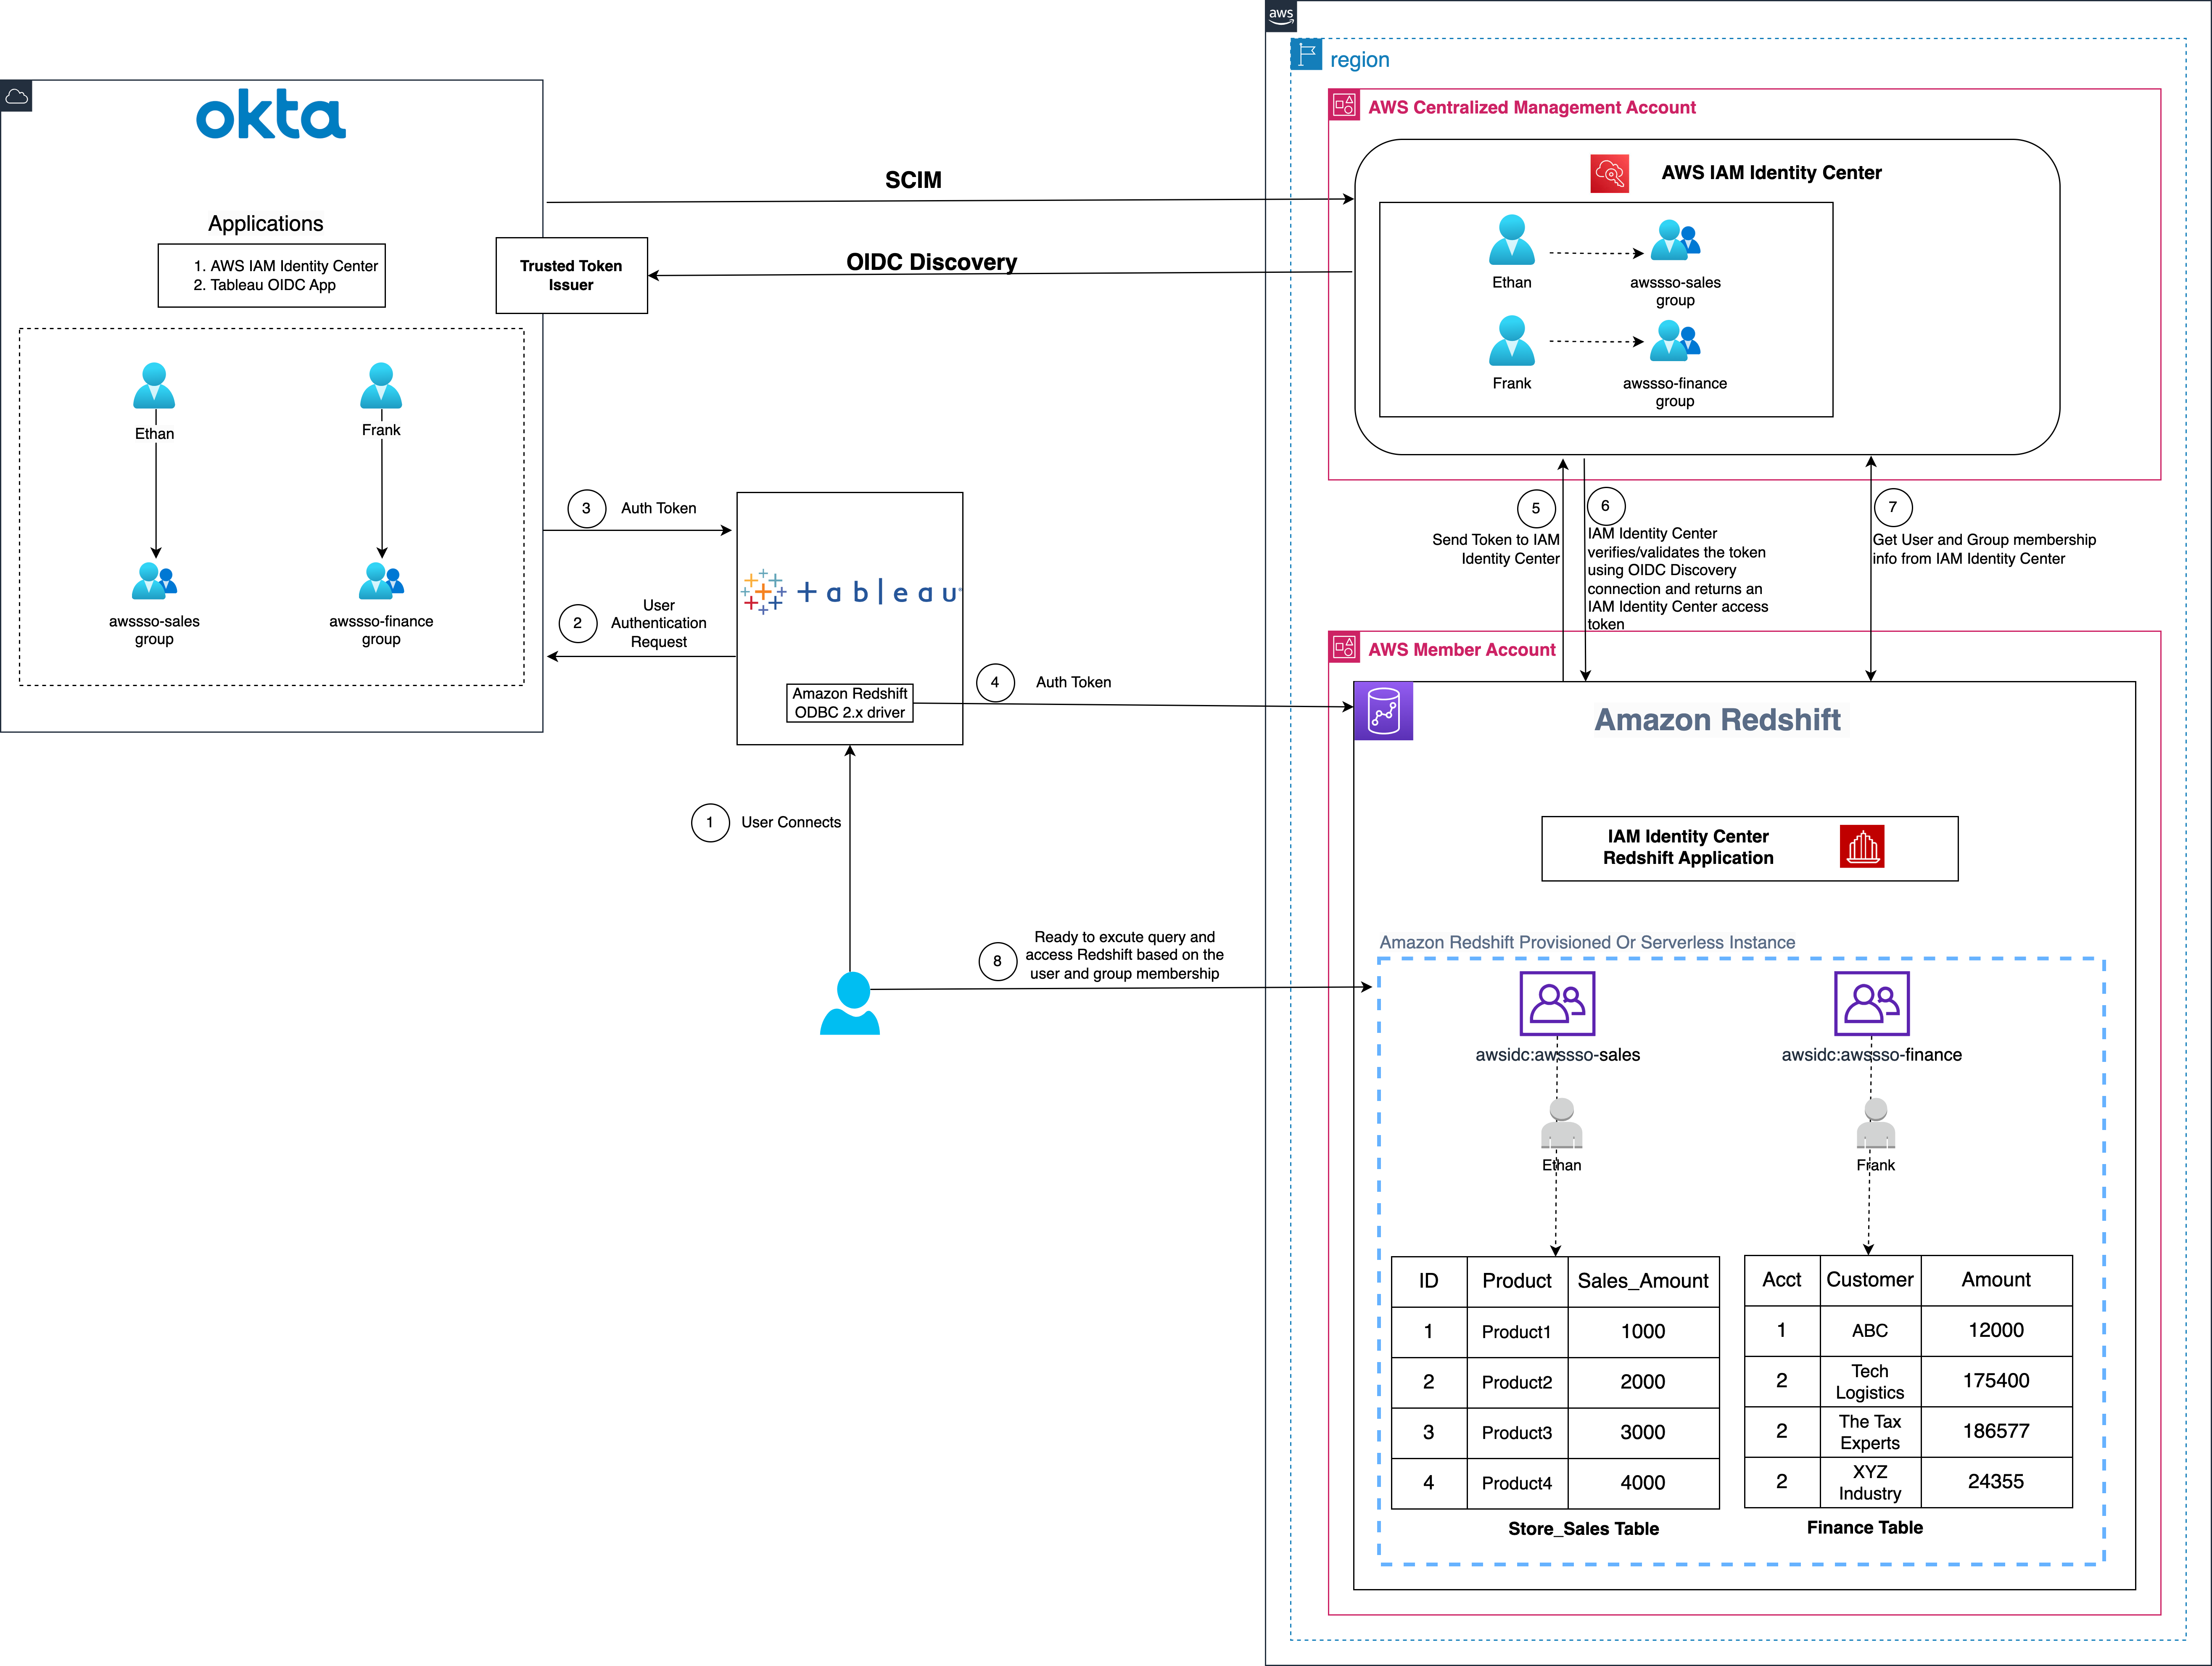


 Sid Wray is a Senior Product Manager at Salesforce based in the Pacific Northwest with nearly 20 years of experience in Digital Advertising, Data Analytics, Connectivity Integration and Identity and Access Management. He currently focuses on supporting ISV partners for Salesforce Data Cloud.
 Jade Koskela is a Principal Software Engineer at Salesforce. He has over a decade of experience building Tableau with a focus on areas including data connectivity, authentication, and identity federation.


 Life is not always happy, there are difficult times. However, we can share our joys and sufferings with those we work with. The AWS Community is no exception.