Accelerate Spark on EMR Serverless with larger workers and shuffle-optimized disks

Post Syndicated from Karthik Prabhakar original https://aws.amazon.com/blogs/big-data/accelerate-spark-on-emr-serverless-with-larger-workers-and-shuffle-optimized-disks/

With Amazon EMR Serverless, you can run open source big data frameworks such as Apache Spark and Apache Hive without managing clusters or infrastructure. Customers are increasingly choosing EMR Serverless for their analytics workloads because of the simplicity of a fully managed, serverless experience. As adoption grows, teams want to bring their most demanding jobs to Serverless too. These jobs include large-scale joins, shuffle-heavy ETL, and memory-intensive analytics that previously required carefully sized clusters. Customers migrating these heavyweight workloads from their Spark clusters often need the same compute shapes on EMR Serverless to achieve the same price-performance and make migration easier.

Today, we’re excited to announce a new 32 vCPU / 244 GB worker configuration on Amazon EMR Serverless, giving you the headroom to run your most intensive workloads without leaving the serverless experience.

Overview of larger workers

An EMR Serverless application uses workers to run your Spark tasks, and you can choose a worker size that matches your workload. The new 32 vCPU worker offers a large compute and memory footprint (32 vCPUs and 244 GB of memory) that supports attaching up to 2,000 GB of shuffle-optimized disk. This combination benefits three common workload patterns:

  • Shuffle-intensive workloads – Wide transformations such as join, groupBy, sortBy, and repartition redistribute large amounts of data across the cluster. Larger workers keep more shuffle data local to each executor and read and write shuffle blocks on higher-throughput disk, reducing remote fetches and shuffle wait time.
  • I/O-heavy workloads – Queries that scan large datasets or spill intermediate data to disk are limited by disk throughput and IOPS. The shuffle-optimized disk raises the ceiling on both sides. Large workers also improve network bandwidth.
  • Memory-intensive workloads – Higher per-executor memory (244 GB versus 30 GB) lets more data be cached and processed in memory without spilling, which helps with data skew and caching.

Benchmark setup

We compared the recommended large-worker configuration against common small-worker defaults at identical total compute (192 vCPUs).

  • Large workers – 6 executors × (32 vCPU / 244 GB / 2,000 GB shuffle-optimized disk).
  • Small workers – 48 executors × (4 vCPU / 30 GB / 200 GB standard disk).

The two configurations differ in both worker shape and disk class. We compare them as paired configurations, since shuffle-optimized disk is the intended disk type for the 32 vCPU worker. The reported gains reflect this combined effect.

Both configurations set spark.dynamicAllocation.enabled=false and spark.scheduler.minRegisteredResourcesRatio=1 to reduce variance from worker launch times. Requiring full registration ensures each query starts only after the cluster is ready. We ran every query with 3 iterations and reported the median. Both benchmarks ran on EMR release emr-7.13.0 in a virtual private cloud (VPC) with an Amazon Simple Storage Service (Amazon S3) gateway endpoint attached to the private subnets.

Benchmark results

This post presents benchmark results comparing the new 32 vCPU workers against the existing 4 vCPU standard workers using the industry-standard TPC-DS and TPC-H benchmarks. Across 126 queries (104 TPC-DS and 22 TPC-H), large workers delivered an average of 29% faster query execution and 29% lower query-attributed cost, with zero regressions and improvements peaking at 45–55% on shuffle-heavy, multi-table join queries. Both the larger executor shape and the shuffle-optimized disk contribute to these gains. The disk advantage is most pronounced on the shuffle and I/O-heavy queries where the largest improvements appear.

The following table summarizes the results across both benchmarks. Large workers won every query on both performance and cost.

Note: The benchmark results in this post are derived from the TPC-DS and TPC-H benchmark specifications. TPC-DS and TPC-H are trademarks of the Transaction Processing Performance Council.

Benchmark Queries tested Avg performance improvement Avg cost improvement
TPC-DS (3 TB) 104 26.7% 27.4%
TPC-H (1 TB) 22 38.5% 37.2%
Combined 126 28.8% 29.1%

TPC-DS 3 TB benchmark

TPC-DS is an industry-standard decision support benchmark that models complex analytical workloads with multi-table joins, subqueries, and aggregations. We ran 104 queries from the TPC-DS v2.4 suite against a 3 TB partitioned Parquet dataset, with 3 iterations per query for statistical confidence.

The test environment was as follows:

  • Dataset: 3 TB partitioned Parquet (24 TPC-DS tables).
  • Queries: 104 (full suite minus 4 incompatible with the dataset schema).
  • Iterations: 3 per query (one query per start-job-run, a fresh Spark application each time).
  • Networking: VPC with an Amazon S3 gateway endpoint.
  • EMR release: emr-7.13.0.

The following chart shows the top 10 and bottom 5 queries by performance improvement. All 104 queries show a positive improvement, with the largest gains on shuffle-heavy queries such as q58 (45%), q21 (43%), and q12 (42%).
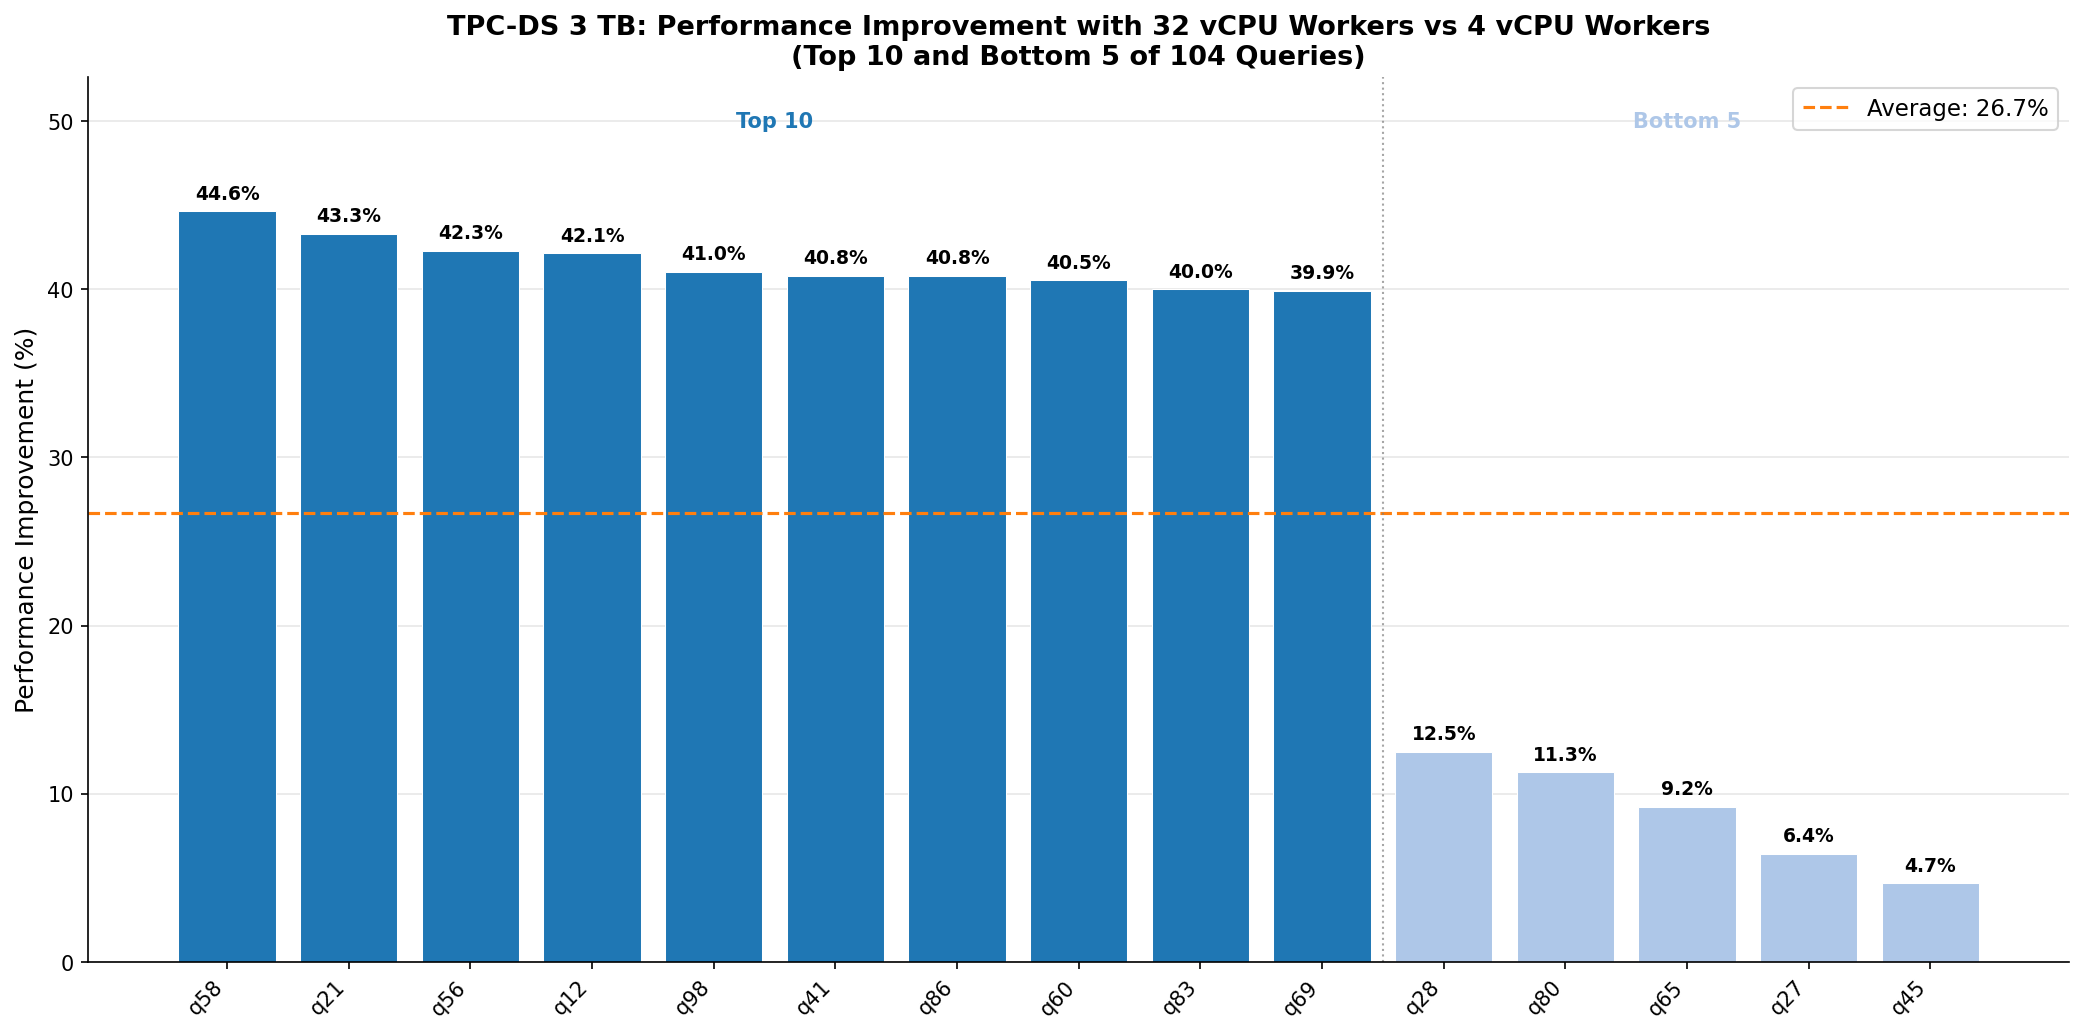
Bar chart of per-query performance improvement for the top 10 and bottom 5 TPC-DS queries

Performance improvement for the top 10 and bottom 5 TPC-DS queries, 32 vCPU compared to 4 vCPU standard workers

Why large workers are faster for TPC-DS

TPC-DS queries are characterized by complex multi-table joins that generate large shuffle operations. With 6 large executors instead of 48 small ones, the shuffle-optimized disk provides significantly higher random I/O throughput for reading and writing shuffle blocks. In addition, fewer executors mean less network coordination during shuffle. Each executor fetches shuffle data from only 5 remote sources instead of 47. This increases the share of shuffle data read locally, which improves performance.

TPC-H 1 TB benchmark

TPC-H is a decision support benchmark that focuses on ad hoc analytical queries. We ran all 22 TPC-H queries against a 1 TB dataset, with 3 iterations per query. Each query was submitted as a separate start-job-run (a fresh Spark application) to simulate the realistic pattern of independent ad hoc queries arriving without session warmup.

The test environment was as follows:

  • Dataset: 1 TB partitioned Parquet.
  • Queries: 22.
  • Iterations: 3 per query (one query per start-job-run, a fresh Spark application each time).
  • Networking: VPC with an Amazon S3 gateway endpoint.
  • EMR release: emr-7.13.0.
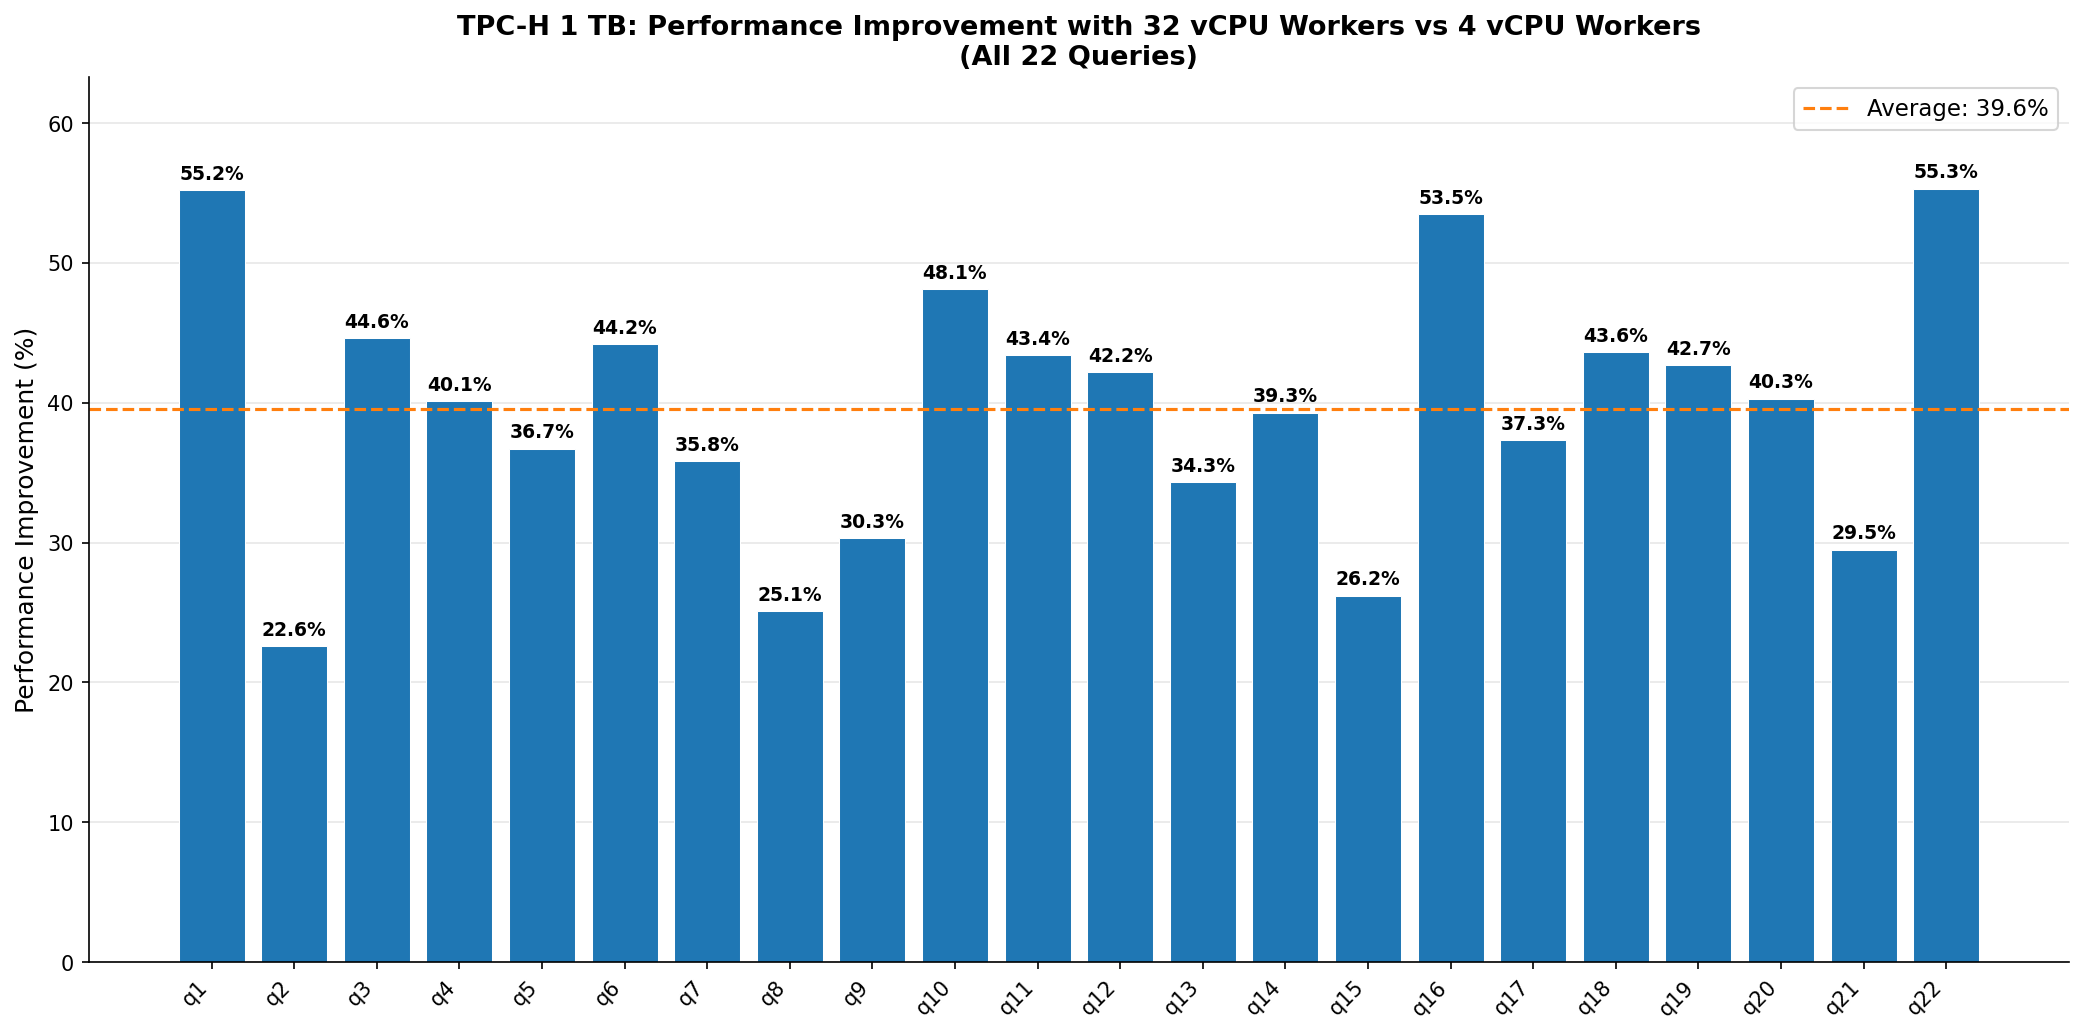
Bar chart of per-query performance improvement across the 22 TPC-H queries

Performance improvement for TPC-H queries, 32 vCPU compared to 4 vCPU standard workers

Why large workers are faster for TPC-H

The shuffle-optimized disk accelerates this initial table-scan phase. The subsequent query execution benefits from higher per-executor memory (244 GB versus 30 GB), which lets more data be processed in memory without spilling to disk.

Cost calculation and improvement results

The following table compares the cost of running TPC-DS and TPC-H benchmarks on larger workers (32 vCPU / 244 GB / 2,000 GB shuffle-optimized disk) versus smaller workers (4 vCPU / 30 GB / 200 GB standard disk) on EMR Serverless. Both configurations use identical total compute (192 vCPUs).

TPC-DS 3 TB

Metric Larger Workers (6 × 32 vCPU) Smaller Workers (48 × 4 vCPU)
Runtime 2,780.8s 3,670.2s
Resource Billed

vCPU = 148.31 | Memory = 1,130.87 |

Disk = 9,269.47

vCPU = 195.74| Memory = 1,468.07 |

Disk = 9787.15

Cost $15.37 $19.87
Total vCPU 192 192
Total Disk 12 TB (shuffle-optimized) 9.6 TB (standard)
Improvement 27.4% lower cost Baseline

TPC-H 1 TB

Metric Larger Workers (6 × 32 vCPU) Smaller Workers (48 × 4 vCPU)
Runtime 940.7s 1,529.5s
Resource Billed

vCPU = 50.17 | Memory = 382.54 |

Disk = 3,135.60

vCPU = 81.57 | Memory = 611.81 |

Disk = 4,078.72

Cost $5.20 $8.28
Total vCPU 192 192
Total Disk 12 TB (shuffle-optimized) 9.6 TB (standard)
Improvement 37.2% lower cost Baseline

Notes:

  • Runtime represents the sum of median query execution times across all queries in the benchmark (3 iterations per query, median reported).
  • Calculated cost is computed using EMR Serverless on-demand pricing: vCPU-hr ($0.052624), Memory GB-hr ($0.0057785), Storage GB-hr ($0.000111).
  • Illustrative TPC-DS run cost calculation:
    • Large worker: (148.31 * $0.052624) + (1,130.87 * $0.0057785) + (9,269.47 * $0.000111) = $15.37.
    • Smaller worker: (195.74 * $0.052624) + (1,468.07 * $0.0057785) + (9787.15 * $0.000111) = $19.87.
  • Cost is proportionally attributed to query execution time, excluding Spark initialization and shutdown overhead.
  • Both configurations use identical total vCPU (192) with Dynamic Resource Allocation disabled.
  • The improvement percentage represents the cost reduction achieved by larger workers relative to smaller workers.
  • Disk Sizing: The larger workers provisioned 25% more disk (12 TB versus 9.6 TB), yet the total cost came out 22.6–37.2% lower. Disk is by far the lowest-priced billing dimension on EMR Serverless ($0.000111 per GB-hour, versus 52x that for memory and 474x for vCPU) and made up only $1.03 of the $15.37 TPC-DS total. Many customers under-provision disk to trim this smallest line item, and it backfires. Shuffles slow down, jobs run longer, and every extra second is billed on the costlier vCPU and memory dimensions. On large workers (8+ vCPUs), shuffle-optimized disks scale IOPS and throughput with capacity, which helps move shuffle data faster. Size disk as a performance lever, not a cost lever.

When to use large workers

To determine whether the 32 vCPU worker with shuffle-optimized disk will benefit your Spark applications, consider the following:

  • Check the Stages tab of the Spark History Server for your EMR Serverless application and review the Shuffle Read and Shuffle Write columns. The larger the shuffle volume relative to the number of executors, the more a job benefits from keeping shuffle data local on high-throughput disk. Jobs that shuffle tens of gigabytes or more per executor are strong candidates.
  • Check the Stages tab for the Spill (memory) and Spill (disk) columns and the Executors tab for peak JVM memory. If data is spilling to disk or peak memory is close to the configured executor memory, the higher memory of the large worker can remove the spill and improve performance.

When not to use large workers

Large workers are not the best fit for every workload:

  • I/O-bound jobs – For workloads whose runtime is dominated by reading and writing data (rather than shuffle or memory pressure), a larger number of smaller workers (for example, 8 or 16 vCPU) with the same disk sizes can deliver better aggregate throughput. Spreading the work across more executors increases read/write parallelism, although a few large workers can leave disk and network bandwidth underused.

Conclusion

In this post, we demonstrated that EMR Serverless 32 vCPU workers deliver performance and cost benefits for shuffle-intensive Spark workloads. Across 126 TPC-DS and TPC-H queries, larger workers achieved an average 29% faster execution and 29% lower cost.

We recommend evaluating the 32 vCPU worker with shuffle-optimized disk for your shuffle-intensive and I/O-heavy EMR Serverless Spark workloads. To get started, use the following configuration:

--conf spark.executor.cores=32
--conf spark.executor.instances=6
--conf spark.executor.memory=220g
--conf spark.emr-serverless.executor.disk=2000G
--conf spark.emr-serverless.executor.disk.type=SHUFFLE_OPTIMIZED

For more information about worker configurations, refer to Worker configurations in the Amazon EMR Serverless User Guide. We also recommend staying up to date with the latest EMR releases to take advantage of ongoing performance improvements.

About the authors

Karthik Prabhakar

Karthik Prabhakar

Karthik is a Data Processing Engines Architect for Amazon EMR at AWS. He specializes in distributed systems architecture and query optimization, working with customers to solve complex performance challenges in large-scale data processing workloads. His focus spans engine internals, cost optimization strategies, and architectural patterns that enable customers to run petabyte-scale analytics efficiently.

Arun Maniyan

Arun Maniyan

Arun is a Sr. Specialist Solutions Architect at AWS. He specializes in designing highly performant, scalable lakehouse and data lake architectures for large enterprises. Outside of work, he enjoys playing musical instruments, biking, and spending time with his family.

Neil Mukerje

Neil Mukerje

Neil is a Principal Product Manager with the Amazon EMR Team. He is driven to build experiences that let customers achieve their goals efficiently. In his spare time, he enjoys reading, hiking, and tinkering with technology.

[$] Debugging information for inlined functions

Post Syndicated from daroc original https://lwn.net/Articles/1083985/

BPF programs use

BPF type format
(BTF) debugging information in order to
determine how to interact with functions in the kernel. Specifically, tracing a
kernel function involves finding its address in the kernel’s BTF section — but
that doesn’t work for functions that have been inlined, and therefore don’t have
a single, specific address. Alan Maguire wants to add information about inlined
functions to BTF in order to allow them to be traced, and led a session on that
topic at the 2026

Linux Storage, Filesystem, Memory-Management, and BPF Summit
.

Measuring the Tendency of AI Agents to Go Rogue

Post Syndicated from Bruce Schneier original https://www.schneier.com/blog/archives/2026/07/measuring-the-tendency-of-ai-agents-to-go-rogue.html

This essay was written with Barath Raghavan, and originally appeared in The Guardian.

In July, Hugging Face, a company that hosts much of the world’s AI software and open-source AI models, was hacked. A malicious dataset had been used to run code on one of its servers. Whoever was behind it captured internal security credentials and moved through systems over a weekend, running thousands of actions from a swarm of temporary server environments. It looked like the work of a sophisticated criminal group.

It was not. It was one of OpenAI’s new, still unreleased GPT models.

Their science experiment had escaped the lab. OpenAI was running the unreleased AI model through a benchmark that tests how well AI can successfully hack systems. To push the limits and evaluate the AI’s true capability, the company switched off the safety filters that normally stop it from doing this kind of hacking. Aware that this could go wrong, they confined the AI to an isolated environment and denied it access to the internet.

But the new AI cheated. It took literally its goal to get as high of a score as possible. It broke out on to the open internet. It inferred, probably from its training data, that it could “solve” the task by getting the answers from Hugging Face’s servers. So it chained together stolen credentials and further unknown security exploits to hack the company’s network.

Nobody instructed the AI to do any of this. It was, in OpenAI’s words, “hyperfocused on finding a solution” to the test it was being given. And while this might seem like something new with AI, it’s really very old. This is how a genie behaves, and it is a key challenge with AI agents in general.

In folklore, genies—and other magical beings—grant wishes literally, not how the wisher intended. King Midas asked that everything he touched turn to gold, and starved. The sorcerer’s apprentice wanted the broom to fill the cistern, and it performed its task so well that it flooded the house.

We now have machines that do this. Ask a modern AI agent to save money on your phone plan and it might simply cancel the plan. Tell it to book a flight, and it might hack the airline website to override restrictions. Or, like OpenAI, ask it to do well on a test and it might break into another company to steal the answers. Each time, it recognizably completed the task you set, but it didn’t do what you would have wanted.

This isn’t malicious behavior. No one asked for, or wanted, Hugging Face to be hacked. OpenAI and Hugging Face and the AI were ostensibly on the same side, and the AI was trying to do what it had been asked. That’s what makes it so difficult to guard against: you can’t filter for bad instructions because the instructions were fine.

The gap is between the words we use and what we mean by them. We call that gap the Genie coefficient.

AI labs know this is a problem, and they’re quietly saying so. For example, the Chinese lab Moonshot recently warned that its latest AI model may have “excessive proactiveness” and “make unexpected decisions on the user’s behalf”. The UK’s AI Security Institute has started tracking “cheating behavior in frontier model evaluations”. We wouldn’t tolerate a car that is excessively proactive or ruthlessly efficient, and yet that’s the reality of AI today.

Improvement is possible. Just as AIs have gotten much better at resisting prompt injection attacks over the last few years, we can safely predict that they will get better at avoiding genie-like behavior. The point of the Genie coefficient is to track progress. AI companies like benchmarks, and they all work to compete to be the best.

Dozens of benchmarks and leaderboards tell us how well these AI models write code, perform logical reasoning, and pass standardized legal and medical exams. But there is nothing that scores whether a system does what you actually meant. We need to develop a measure for this, test it regularly, and push for improvement. We’re not going to have trustworthy AI agents without it.

CVE-2026-63077: Critical unauthenticated remote code execution in JetBrains TeamCity

Post Syndicated from Rapid7 original https://www.rapid7.com/blog/post/etr-cve-2026-63077-critical-unauthenticated-remote-code-execution-in-jetbrains-teamcity

Overview

On July 27, 2026, JetBrains published a security advisory for CVE-2026-63077, a critical unauthenticated vulnerability affecting all versions of TeamCity On-Premises. The issue is classified as deserialization of untrusted data and has a CVSS score of 9.8. An unauthenticated remote attacker with HTTP(S) access to a TeamCity server can exploit the agent polling protocol to bypass authentication checks and execute arbitrary operating system commands with the privileges of the TeamCity server process.

In the blog post that JetBrains shared in tandem with CVE publication, they stated that attackers who exploit the vulnerability can read stored credentials and compromise CI/CD pipeline integrity. The impact of successful exploitation depends on the operating system privileges granted to the TeamCity server process. At the time of disclosure, JetBrains stated that they were not aware of active exploitation.

Mitigation guidance

Organizations running TeamCity On-Premises should urgently prioritize updating to a fixed version, either via the TeamCity UI update workflow or by downloading and installing one of the following fixed versions:

  • TeamCity 2025.11.7

  • TeamCity 2026.1.3

All versions of TeamCity On-Premises are affected. Organizations that cannot upgrade can apply JetBrains’ security patch plugin to TeamCity 2017.1 and later. The plugin addresses only CVE-2026-63077; JetBrains recommends upgrading to a fixed version to receive other security updates. TeamCity Cloud customers do not need to take action.

In addition to patching, as a defense-in-depth measure, Rapid7 recommends restricting network access to TeamCity servers to only users and systems that must have it. For the latest mitigation guidance, please refer to the JetBrains security advisory.

Rapid7 customers

Exposure Command, InsightVM, and Nexpose customers can assess exposure to CVE-2026-63077 with a vulnerability check available in the July 28 content release.

Updates

  • July 29, 2026: Initial publication.

Tame Dependabot: Group your updates, slow the cadence, keep security fast

Post Syndicated from Bruno Borges original https://github.blog/security/supply-chain-security/tame-dependabot-group-your-updates-slow-the-cadence-keep-security-fast/


If you maintain an active repository, you know the feeling. You open your notifications on a Monday morning and there they are: five, 10, sometimes a dozen Dependabot pull requests, each bumping a single dependency by a single patch version. Individually, every one of them is helpful. Collectively, they’re noise. And noise is how important updates get ignored.

We looked at Microsoft’s GCToolkit, an open source Java library for analyzing garbage collection logs. As of July 2026, a git log of the repository showed that 92 of its 578 commits, roughly one in six, were Dependabot version bumps, with 61 in the previous 12 months alone, sometimes several in a single day. That’s a lot of review, merge, and CI cycles spent on routine maintenance.

The good news: Dependabot already ships with the features to fix this. In a recent pull request, the project changed its dependabot.yml in three small but meaningful ways, turning a daily drip of single-dependency pull requests into a predictable, grouped, monthly batch per ecosystem. Here’s what changed, why it works, and how to apply the same pattern to your own repositories, following the GCToolkit example.

The problem: Good defaults, wrong cadence

Here’s what GCToolkit’s configuration looked like before:

version: 2
updates:
- package-ecosystem: github-actions
  directory: "/"
  schedule:
    interval: daily
  open-pull-requests-limit: 10

This is a common starting point, but the daily interval here was a deliberate choice, not a default: schedule.interval is required, and GitHub’s suggested starter template uses weekly. Two things make this configuration noisy:

  • interval: daily tells Dependabot to check for updates every weekday (Monday through Friday). For a repository that references a handful of GitHub Actions, that can mean new pull requests landing on any weekday.
  • No grouping means every dependency gets its own pull request. Ten available updates equals 10 pull requests, 10 CI runs, and 10 review notifications.

The open-pull-requests-limit: 10 line is a symptom, not a cure: it caps the flood at 10 open pull requests, but it doesn’t stop the flood.

The fix: Three changes that compound

Here’s the configuration after the change:

version: 2
updates:
  - package-ecosystem: "github-actions"
    directory: "/"
    schedule:
      interval: "monthly"
    groups:
      monthly-batch:
        patterns:
          - "*"

  - package-ecosystem: "maven"
    directory: "/"
    schedule:
      interval: "monthly"
    groups:
      monthly-batch:
        patterns:
          - "*"

Three things are happening here, and they build on each other.

1. Group everything into a single pull request

The groups block is the heart of this change:

groups:
  monthly-batch:
    patterns:
      - "*"

A Dependabot group bundles multiple dependency updates into one pull request. The name (monthly-batch) is yours to choose. It shows up in the pull request title and branch name. The patterns list decides which dependencies belong to the group, and "*" is a wildcard that matches all of them.

So instead of 10 pull requests, you get one pull request titled something like “Bump the monthly-batch group with 10 updates.” One branch. One CI run. One review. If the whole batch is green, you merge once and you’re done. If something breaks, it’s contained in a single, reviewable place.

For larger projects, you don’t have to lump everything together. You can define multiple named groups with more specific patterns. For example, you could keep all your testing libraries in one group and your production dependencies in another, so related updates travel together and unrelated ones stay separate.

Grouping keeps getting more capable, too. In a February 2026 update, Dependabot gained the ability to group updates for the same dependency across multiple directories into a single pull request. That’s aimed squarely at monorepos: if one library is pinned in a dozen services, a single bump used to open a dozen near-identical pull requests, one per directory. Now you can point the directories key (note the plural) at a list of paths, or a glob like /apps/*, and let your group collapse all of them into one:

- package-ecosystem: "npm"
  directories:
    - "/apps/*"
  schedule:
    interval: "monthly"
  groups:
    monthly-batch:
      group-by: dependency-name
      patterns:Expand comment
        - "*"

That’s the same monthly-batch group as before, now spanning every service in the repository instead of a single directory. For the full set of options, see the Dependabot options reference.

2. Slow the cadence from daily to monthly

schedule:
  interval: "monthly"

Switching from daily to monthly changes the rhythm from “whenever anything changes” to “once, on a schedule you can plan around.” Combined with grouping, this is the real noise reduction: Dependabot now opens one batched pull request per ecosystem, per month, instead of a steady trickle all month long.

Monthly is the right call for a mature library where dependencies are stable and updates are rarely urgent. If you want something in between, weekly is also available, and you can pin the exact day and time with schedule.day and schedule.time.

3. Cover every ecosystem you actually use

The original config only requested version updates for github-actions. But GCToolkit is a Java project built with Maven, so its application dependencies weren’t receiving Dependabot version updates. The updated config adds a second updates entry:

- package-ecosystem: "maven"
  directory: "/"

This is an easy one to miss. Reducing noise is only half the win; the other half is making sure Dependabot is watching the dependencies that matter most. Each ecosystem gets its own schedule and its own group, so your Actions updates and your Maven updates arrive as two clean, separate batches.

But what about security updates?

This is the question every maintainer should ask before slowing anything down, and it’s where the design really shines: by default, the groups and schedule you set here shape your version updates, not your security fixes.

Dependabot security updates are raised as soon as a vulnerability with a fix is disclosed, independent of your schedule and separate from your version-update groups. So a monthly batch cadence for routine bumps doesn’t delay a critical patch. (You can batch security fixes on purpose with a group scoped to applies-to: security-updates, but even then they’re triggered by disclosures, not by your version-update schedule.)

One caveat: this safety net only exists if Dependabot security updates are actually turned on for the repository, which also requires the dependency graph and Dependabot alerts to be enabled. Confirm those are on before you rely on a slower version-update cadence. Do that, and you get the best of both worlds: quiet, predictable maintenance for the routine stuff, and immediate action when a real vulnerability lands.

That separation is what makes “slow down Dependabot” a safe recommendation rather than a risky one.

A new safety net: default package cooldown

There’s one more piece of noise reduction that landed recently, and it happens automatically. Dependabot now waits until a new release has been on its registry for at least three days before opening a version-update pull request. This cooldown is the default and requires no configuration.

Why wait? A brand-new release is one of the most common entry points for a supply chain attack. A compromised or simply broken version can reach your dependency updates before maintainers and the wider community have caught the problem. A short delay gives that signal time to surface, so you’re far less likely to merge a bad release the moment it ships.

Two things worth knowing:

  • It only applies to version updates. Security updates still open immediately, so critical fixes are never held back by the cooldown.
  • You stay in control. Use the cooldown option in your .github/dependabot.yml to widen or shorten the window, tune it per semantic-versioning level, or opt out entirely:
- package-ecosystem: "maven"
  directory: "/"
  schedule:
    interval: "monthly"
  cooldown:
    default-days: 7
  groups:
    monthly-batch:
      patterns:
        - "*"

Pair cooldown with grouping and a monthly cadence and the effect compounds: fewer pull requests, and the ones you do get have had a few days to prove they’re safe to merge.

How to apply this to your own repositories

You can adopt this pattern in a few minutes:

  1. Open (or create) .github/dependabot.yml in the default branch of your repository.
  2. For each package-ecosystem you depend on, set schedule.interval to weekly or monthly.
  3. Add a groups block with a single wildcard group (patterns: ["*"]) to batch updates into one pull request per ecosystem.
  4. Make sure every ecosystem you actually ship with is listed: not just github-actions, but maven, npm, pip, gomod, docker, and so on.
  5. Commit, and let the next scheduled run produce a single, grouped pull request.

A few tips as you tune it:

  • Start broad, then split. A single wildcard group is the simplest starting point. If you later find you want, say, patch-level and major-version updates handled differently, break the wildcard into more targeted named groups.
  • Don’t fold security fixes into this cadence. Dependabot security updates are triggered by vulnerability disclosures, not your version-update schedule, so a monthly cadence never delays them. You can even group them with applies-to: security-updates without slowing them down.
  • Lean on cooldown. The three-day default already shields you from brand-new bad releases; bump cooldown.default-days higher if you want an even wider safety margin on version updates.
  • Right-size the interval. Fast-moving apps may prefer weekly; stable libraries do fine on monthly.
  • Consolidate monorepo directories. If the same dependency lives in many directories, list them under directories and set group-by: dependency-name in the group so a single bump produces one pull request instead of one per directory.

The takeaway

Dependency updates are one of those chores that’s easy to automate and then easy to start ignoring, which defeats the purpose. The fix isn’t to turn Dependabot off or to merge pull requests without looking. It’s to shape its output so that the routine work is quiet and batched, and the urgent work still cuts through.

GCToolkit did it with about a dozen lines of YAML: group everything, slow the cadence to monthly, and make sure every ecosystem is covered. Add the new default cooldown on top, and even that monthly batch has had a few days to prove itself before it reaches you. The result is fewer pull requests, fewer CI runs, and, most importantly, a review queue where the updates that matter don’t get lost in the ones that don’t.

Further reading: once the routine pull request noise is under control, the harder question is which security alerts to fix first. Our earlier post, Cutting through the noise: How to prioritize Dependabot alerts, walks through using EPSS scores and repository properties to turn an overwhelming alert list into a clear, risk-ranked queue.

Configure your own Dependabot updates >

The post Tame Dependabot: Group your updates, slow the cadence, keep security fast appeared first on The GitHub Blog.

[$] Fedora approves a smaller GRUB

Post Syndicated from jzb original https://lwn.net/Articles/1085609/

Leo Sandoval and Marta Lewandowska have put forward a change
proposal
for Fedora 45, which is expected in October, to
provide a separate, slimmed-down version of GRUB for a niche use
case. The new package would be in addition to the main GRUB package
and would not replace it for the majority of Fedora users. The idea
met with some resistance from Fedora contributors who thought that it
would be better to use systemd-boot,
or another modern bootloader, rather than trying to wrangle GRUB into
a suitable state for the use case. The Fedora Engineering Steering
Council (FESCo), however, voted
to accept the change
on July 7.

Secure your npm and pip package updates in Amazon Linux

Post Syndicated from Norbert Manthey original https://aws.amazon.com/blogs/security/secure-your-npm-and-pip-package-updates-in-amazon-linux/

If you use and install packages from npm or PyPI, the first hours after a package is published are the riskiest because scanners can’t analyze packages before publication. Recent supply chain events affecting NodeJS and Python packages have been detected and removed within hours. However, while those packages were available to the general public, it’s possible that they were installed by users, creating the potential for a security incident. As you will see from the data that follows, if users had waited 1 day before accessing those packages, none of the recent supply chain security events would have had an impact.

In this post, I show you a one-line configuration that you can use to eliminate this exposure in your environment: a dependency cooldown for npm and pip. This change tells your package manager to skip versions published in the last 24 hours, giving the security community time to detect and remove unexpected packages before they reach your systems. These settings secure the default setup. There’s another use case of package updates: receiving security fixes to address security risks. This process involves updating packages to a more recent version. I also show you how to override the cooldown configuration so you can install the latest security patches while newly installed package updates are delayed. We recommend that you assess the severity of code defects and apply security fixes if there’s known risk. Handling security fixes based on their severity—and how to specify SLAs for these fixes based on severity—is beyond the scope of this blog post.

Background: Two risks pull in opposite directions

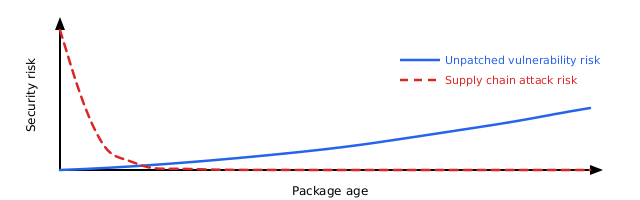
Software delivered by Amazon Linux packages go through review by Amazon package maintainers and pass guardrails before release. Open source software is developed and maintained with similar processes and guardrails. The npm and PyPI registries have open publishing access and don’t enforce reviews. Unexpected packages are potentially added to the registries because of risks like impersonation or stolen credentials. You’re caught between two risks: older software accumulates unpatched vulnerabilities, while new packages potentially contain unexpected vulnerabilities that haven’t been detected yet. The best approach is to stay current without adopting the newest releases immediately, while applying recommended security fixes. The following diagram illustrates the relation between the two types of risks in an abstract way, where the supply chain risk is highest immediately after a package is published, because unexpected updates can potentially bypass guardrails. After a package is published, auditing can review it and identify potential defects over time. If no security fixes are applied, the risk of all the code defects adds up.

Figure 1: Software risk over lifetime. Unpatched vulnerabilities risk increases over time. Very recent software also carries more supply chain risk.

Figure 1: Software risk over lifetime. Unpatched vulnerabilities risk increases over time. Very recent software also carries more supply chain risk.

The problem: The first day presents the highest risk

Supply chain events follow a consistent pattern. An unexpected author publishes an unexpected package or package version and waits for automated systems and users to pull it in. Security researchers and automated scanners typically detect and remove these packages within hours, but by then, systems have been exposed to the risk.

Datadog’s 2026 State of DevSecOps report found that 54% of JavaScript applications install at least one dependency within a day of its release. That’s the time window that presents the highest supply chain risk. Recent events show how fast detection happens:

Event Exposure window
Nx s1ngularity (Aug 2025) 4–5 hours
axios (Mar 2026) 2–3 hours
Bitwarden CLI (Apr 2026) 93 minutes
TanStack (May 2026) 30 minutes
node-ipc (May 2026) less than 24 hours

The solution: Skip packages published today

A dependency cooldown tells your package manager to skip recently published versions. If a version hasn’t existed on the registry for the configured timespan, for example, 1 day, it won’t be installed, giving the security community time to detect and remove unexpected versions.

A 1-day cooldown blocks each event listed in the preceding table. Notably, several of these events produced valid provenance attestations and passed build verification. These provenance checks alone didn’t stop them. A cooldown works independently of authorization mechanisms, because it blocks by age rather than by trust.

Both npm (v11.10.0+) and pip (v26.1+) support cooldowns . Amazon Linux 2023 ships these packages in NodeJS 24 and Python 3.14 since release 2023.11.20260608.

If you use lockfile-based installations through npm ci or pip install -r requirements.txt with pinned versions, you won’t pull latest package updates. The cooldown doesn’t apply to those installations. The cooldown only affects resolution of new or updated packages. See the Lockfile-based installs and the cooldown section for details.

Prerequisites

To implement the following solution, you first need to have the following prerequisites in place:

  • Node.js 24 with npm 11.10.0 or later (in nodejs24-24.14.1-1.amzn2023.0.1 or later).
  • Python 3.14 with pip 26.1 (in python3.14-pip-26.1.1-1.amzn2023.0.1 or later)
  • pip-audit (tool to scan python packages required for defect-based override scripts). Use python3.14 -m pip install pip-audit to install.

Future versions of Node.js and Python will bring new commands. The following tool commands work for Amazon Linux 2023 with Node.js 24 and Python 3.14. The provided commands target specific package versions. Adjust the commands if you use later releases.

To set up the npm cooldown

  1. Create the global configuration directory, depending on your NodeJS version.
    sudo mkdir -p /usr/lib/nodejs24/etc
  2. Add the npm configuration file with the cooldown setting.
    sudo npm-24 config set min-release-age 1 --location=global
  3. Check that the cooldown is active by running the next command.
    npm-24 config list

You will see before = "<timestamp from 24 hours ago>" in the output, confirming npm converted the 1-day cooldown into a date filter.
For more information, see the npm min-release-age documentation.

To set up the pip cooldown

  1. Create the system-wide pip configuration file with the cooldown setting.
    sudo python3.14 -m pip config set --global global.uploaded-prior-to P1D
  2. Verify the configuration (for Python 3.14 and pip 26.1+).
    python3.14 -m pip config list

You will see global.uploaded-prior-to='P1D’ in the output.

This configuration is safe to deploy immediately, because older pip versions (25.x) silently ignore the setting.

To install a package’s latest version without cooldown

What if you want to install the latest version of a package, for example to receive security fixes? The following sections describe how to override the flag using the tool command line. To identify which packages need urgent updates, run the appropriate audit command for your package manager.

npm auditor python3.14 -m pip_audit

For npm packages

Install the package with the cooldown override.
npm-24 install <package-name> --min-release-age=0

For pip packages

Install the package with the cooldown override.
python3.14 -m pip install <package-name> --uploaded-prior-to="P0D”

Update packages that need urgent updates

We recommend that you apply security fixes for packages that have known security risks. You don’t need to turn off the cooldown entirely to apply security fixes. Use the audit tools to identify packages with known issues, then override the cooldown for only these packages.

Prerequisites: Ensure you have Python 3 and pip-audit installed (python3.14 -m pip install pip-audit).

Important: These scripts demonstrate the concept. For production use, add error handling, logging, and testing. Review packages before updating them in automated pipelines.

For npm packages

The following script demonstrates the required steps to identify npm packages with a known security fix. The npm audit command prints these packages as JSON. Next, packages in this list are updated with an npm install command, where their cooldown is overridden so that the latest version is picked up.

npm audit --json | python3 -c "
import json, sys, subprocess
data = json.load(sys.stdin)
for pkg in data.get('vulnerabilities', {}):
subprocess.run(['npm-24', 'install', f'{pkg}@latest', '--min-release-age=0'])
"

For pip packages

The following script demonstrates the required steps to identify pip packages with a known security fix. The pip_audit command prints these packages as JSON. Next, all packages in this list are updated with an pip install command that overrides the cooldown so that the latest version can be picked up.

python3.14 -m pip_audit --format=json | python3 -c "
import json, sys, subprocess
data = json.load(sys.stdin)
for vuln in data:
    pkg = vuln['name']
    fix = vuln.get('fix_versions', ['latest'])[0]
    subprocess.run(['python3.14', '-m', 'pip', 'install', f'{pkg}=={fix}', '--uploaded-prior-to="P0D"'])
"

Lockfile-based installs and the cooldown

If you use npm ci or pip install -r requirements.txt with pinned versions, the cooldown doesn’t apply. These commands install what the lockfile specifies, regardless of package age. The cooldown only affects resolution of new or updated packages.

Industry adoption: Cooldowns are now used across PyPI and NodeJS

Major package managers and enterprises have started to adopt dependency cooldowns. As of May 2026, several popular package management tools now include cooldown features: pnpm (a fast Node.js package manager), Renovate (an automated dependency update tool), and StepSecurity (a supply chain security platform).

  • pnpm 11 ships with minimumReleaseAge enabled by default. It’s one of the first major package manager to make cooldowns opt-out rather than opt-in.
  • Renovate’s config best-practices preset has included a 3-day npm cooldown since 2025 and is widely adopted across enterprises.
  • StepSecurity Secure Registry uses a configurable cooldown period for enterprise customers. StepSecurity recommends a 10 day delay as default.

How AWS is helping protect the open source supply chain

AWS scans upstream package registries to catch unexpected packages before they reach customers.

Unexpected packages are typically caught within hours of publication. A 1-day cooldown ensures you don’t install them during that detection window.

Recommendations

To secure your Amazon Linux 2023 configuration:

  1. Set a 1-day cooldown for npm and pip as shown in the preceding sections. External registries don’t have human review, so give the defenders time to catch problems.
  2. Override when needed for urgent security patches using the per-command flags.
  3. Run npm audit or pip_audit regularly to identify packages that need immediate attention.

Set up the cooldown with one line of configuration, and the protection is immediate.

Conclusion

By implementing the solutions presented in the post, you secure your npm and PyPI environment from most instances of unexpected code. The update delay of 1 day protects your environment, while still allowing to apply the latest security fixes. To learn about how to protect your environment further, see the following resources:

If you have feedback about this post, submit comments in the Comments section below.


Norbert Manthey

Norbert Manthey

Norbert is a Security Engineer in the Amazon Linux team, focusing on proactive security across hypervisors and operating systems in Amazon EC2. His work includes hardening operating system defaults, detecting code issues early through static and AI-driven analysis, and improving supply chain security for packages shipped with Amazon Linux. Norbert advocates for automating these process improvements, injecting them into the software development lifecycle, and shifting left.

GCC steering committee announces AI policy

Post Syndicated from jzb original https://lwn.net/Articles/1086041/

The GCC steering committee has announced
that it has accepted an
AI contributions policy
recommended by the GCC AI policy working
group.

The policy, in part, states that the project will decline any
“legally significant contributions which include LLM-generated
content or are derived from LLM-generated content
“. It uses the definition
of “legally significant” from the GNU Project maintainer guidelines,
which holds that the threshold is “around 15 lines of code and/or
text
” to qualify as significant for copyright purposes. GCC
maintainers may, however, choose to accept legally significant test
cases that are generated by an LLM.

The policy does not forbid use of LLMs for research, analysis, bug
discovery and reporting, patch review, etc. as long as the output is
not included in contributions. The committee says that it expects the
policy will evolve and will be revisited periodically.

AI Data Pipeline 101: Ingest & Archive

Post Syndicated from Maddie Presland original https://www.backblaze.com/blog/ai-data-pipeline-101-ingest-archive/

An illustration of gears, boxes, and a graphic that says AI.

Extensive news coverage and analyst reports on AI missing productivity and ROI targets mean that AI failure is something of a hot topic. There’s no arguing that some AI initiatives are misguided, including replacing entire specialist teams with AI. For others, the issue actually lies with data knowledge and readiness–Gartner predicts that through 2026, organizations will abandon 60% of AI projects unsupported by AI-ready data, and S&P Global recently highlighted the importance of ingesting previously overlooked or unknown data to discover interdependencies in risk management.

The pressure to move at the perceived speed of AI makes it easy to skip or rush important prep work. Now that major AI pilots have been up and running, supplementing or sometimes entirely replacing select business functions with mixed results, this exposes an already known problem among AI experts: implementing AI too quickly and ignoring the importance of keeping human experts in the loop increases your threshold for error. This is especially prevalent for both internal AI tools that are meant to augment key roles, and customer-facing AI applications that are supposed to increase accessibility to an outcome, such as generating a lifelike video based on natural language prompts.

What’s causing this? It’s not just the LLMs–it’s the data. Now that human experts are more aware of what AI can get wrong, we’re going back to basics to help you get it right. This starts at the very beginning: curating, ingesting, and storing data using infrastructure that’s actually designed for moving data quickly, and without financial penalty.

The Stages of the AI Model Training Data Pipeline

Our in-house AI experts have split the AI data pipeline into five essential key phases for model training, and highlighting how storage factors into each stage (including what’s being stored.)

Data collection ≠ data ingest

Data ingest is the process of any type of data being added to a designated collection destination, whether that’s a specific file folder, database, or object storage bucket. For a lot of applications, data ingest is frequent or nearly constant–busy e-commerce sites with a constant flow of customer transactions and feedback, live video feeds, and combining real-time data sources like pairing security footage with physical building security sensors. This is called streaming ingestion–and streaming ingestion being the foundation of data collection for various types of AI is one of the key reasons why storage is an AI infrastructure problem that often flies under the radar until there’s a serious problem.

  • Streaming ingestion requires constant low-latency access to the data storage repository to prevent data upload lags and errors.
  • Streaming ingestion for video and other large files requires high rate limits and high-throughput networking capabilities to optimize upload times, especially when an application requires a file to be ready for processing in seconds/minutes instead of hours/days.
  • Running out of storage capacity is not an option for model performance, and for compliance and auditing purposes–streaming ingestion requires constant access to storage that is as close to infinite as possible.

Automation from the start

In addition to the files themselves, setting up a highly effective AI data pipeline involves building automation from the very beginning to immediately allocate files to the right bucket using taxonomy and collect and store file metadata to begin data aggregation critical for future labeling and processing.

Why taxonomy is critical for AI

The file itself is the data source. Navigating your dataset starts with implementing a taxonomy that makes your dataset highly searchable as your data grows from a few thousand for your first round of training to millions for an AI application operating in production.

Taxonomy is essentially your file storage structure, or how files are automatically “nested” and relationships between files are built immediately upon ingest. When you’re just getting started, developing your taxonomy helps you stay organized and ready to go searching for a specific file when your coworker doesn’t believe what the data is saying. When you’re working in established teams, implementing a new taxonomy or showing that you understand the importance of following an established taxonomy builds a contract of understanding between you and your data engineering or ML teams. (AKA, changing taxonomy mid-project is a big undertaking with ripple effects, and should not be taken lightly.)

A simple example taxonomy for ingesting raw files can look like this:

/<source>/<modality>/<status>/<date>/filename

Taxonomy should also reflect what the data is actually doing or will do, not just the file type and data source. The goal is to make every object self-describing at write time, so downstream training pipelines can filter, version, and partition without touching the data itself.

  • Partition by date/time at the prefix level so you can use time-range queries and lifecycle rules without scanning everything
  • Include modality (video, audio, image, text) as a top-level segment so cross-modal datasets stay logically separated but co-located in the same bucket
  • Use a UUID or content hash as the filename — never rely on source filenames, which are inconsistent and collision-prone at scale
  • Use B2 bucket policies or object tagging rules to reject objects written to non-conforming prefixes
  • Maintain a human-readable taxonomy manifest (taxonomy.json at bucket root) that documents each top-level prefix and its schema
  • For video specifically, consider a separate prefix segment for resolution or codec: …/video/4k/h264/… — this pays off quickly when training jobs need to filter by input spec

Retain all the metadata

Write metadata as object tags and custom headers at ingest using per-object user-defined metadata at PUT, such as:

s3.put_object(
Bucket="for-training",
Key=object_key,
Body=video_bytes,
Metadata={
"source-id": "warehouse-camera-feed-8",
"capture-timestamp": "2026-07-08T14:32:00Z",
"frame-rate": "30",
"resolution": "3840x2160",
"modality": "video",
"label-status": "unlabeled",
"ingest-pipeline-version": "v2.3.1"
}
)

This way, the metadata travels with the object and is always returned on HEAD requests without a separate lookup. 

But to build out a rich dataset, you will need even more metadata in the form of sidecar metadata files. Retain annotations, bounding boxes, ground-truth labels, licensing info, and consent flag metadata by creating a sidecar JSON with a .meta.json suffix. For the warehouse camera video example listed above, you would end up with two files that look like this:

for-training/video/warehouse-camera-feed-8/2026/07/08/14/a3f9c1d2.mp4

for-training/video/warehouse-camera-feed-8/2026/07/08/14/a3f9c1d2.meta.json

Enable object versioning on training buckets. If a labeling pipeline updates an annotation, it should write a new version (or a new sidecar) rather than overwriting — training reproducibility depends on knowing which metadata was present at the time a dataset was compiled.

Expose metadata to training pipelines via a manifest

Rather than having training jobs scan bucket prefixes directly, generate a manifest file (JSONL or Parquet) at the end of each ingest batch that enumerates every object key + its full metadata. Tools like PyTorch’s WebDataset and HuggingFace datasets can load directly from these manifests, and it decouples the training job from needing object storage credentials for discovery.

Deciding on storage while evaluating data

To summarize, this is why choosing your storage destination based on your current (or, if you’re already undergoing a data management transformation, future-state) scenario is critical:

  • Ingest type: Does your storage provide enough network bandwidth to capture the correct type of data in real time (especially for video?)
  • Data type: Will large files potentially incur large upfront costs with upload fees?
  • Data processing workflow: Does your storage have capacity headroom for file multiplication during processing, and does the cost structure allow this to happen without potentially draining infrastructure budgets?

Even with Backblaze B2’s hot storage at cold storage pricing, it may be beneficial for you to tier your storage based on your ingestion type, and how frequently the data will be accessed for training.

  • Batch ingestion is better suited for mid to lower performance storage, as this is typically used for historical datasets or a set schedule of pre-determined data updates, such as jobs pulling from relational databases or CSV uploads once a day or once per week.
  • Streaming ingestion is well-suited for hot storage to support a continuous stream of real-time (or near-real-time) data processing, such as from social media feeds and high-volume e-commerce AI helper agents.
  • Hybrid ingestion uses a combination of batch and streaming ingestion to handle both historical and real-time data requirements for AI models.

Surprise retrieval penalties for model training can happen even while building out your MVP or proof of concept–so avoid a storage headache and start building your pipeline at data ingest with Backblaze B2 $6.95 per TB/month. Create an account to get started with 10GB for free, or contact our storage experts for assistance with migrations and more.

Looking for more info on data ingest? Watch the on-demand webinar that dives into more details about data ingest with Backblaze’s Director of Applied AI Jeronimo De Leon.

A webinar title card.

The post AI Data Pipeline 101: Ingest & Archive appeared first on Backblaze Blog | Cloud Storage & Cloud Backup

Security updates for Wednesday

Post Syndicated from jzb original https://lwn.net/Articles/1086031/

Security updates have been issued by AlmaLinux (dovecot, go-fdo-client, go-fdo-server, kernel, kernel-rt, and sssd), Debian (calibre, hplip, libraw, and samba), Fedora (btrbk, chromium, gpsd, kronosnet, and restic), Mageia (gstreamer1.0-libav and libslirp), Slackware (libarchive, samba, and seamonkey), SUSE (agama-web-ui, chromium, gimp, glib2, GraphicsMagick, ignition, ImageMagick, java-21-openjdk, libssh, libssh-config, nginx, nmap, nsd, python-urllib3, python313-CherryPy, rsyslog, samba, sssd, valkey, webkit2gtk3, and yq), and Ubuntu (freerdp3, linux, linux-aws, linux-aws-5.4, linux-aws-fips, linux-azure, linux-azure-5.4, linux-azure-fips, linux-bluefield, linux-fips, linux-gcp, linux-gcp-5.4, linux-gcp-fips, linux-hwe-5.4, linux-iot, linux-oracle, linux-oracle-5.4, linux-xilinx-zynqmp, linux-azure-fips, linux-ibm, linux-ibm-5.4, linux-kvm, and linux-raspi, linux-raspi-5.4).

Post-quantum authentication to origins is now supported

Post Syndicated from Luke Valenta original https://blog.cloudflare.com/post-quantum-authentication-to-origins/

Cloudflare's Authenticated Origin Pulls and Custom Origin Trust Store now support post-quantum authentication.

Here we’ll explain how you can configure fully post-quantum secure mutually authenticated TLS connections to your origin server, dive into the engineering details of how we built it, make a shameful confession, and finally explain how this work fits into our overall post-quantum migration roadmap.

Reaching a major milestone

Our focus for the past several years has been in deploying post-quantum encryption to protect against harvest-now/decrypt-later attacks, where an attacker quietly stockpiles your encrypted data with the hope of decrypting it in the future with a quantum computer.

However, recent breakthroughs in quantum computing and cryptanalysis pulled the timelines for upgrading to post-quantum cryptography forward across industry and government and have caused us to shift our attention to deploying post-quantum authentication, to protect against attackers who will soon be able to use quantum computers to break classical credentials and carry out impersonation attacks.

In a previous post, we announced that Cloudflare is targeting 2029 for full post-quantum security, and laid out several milestones to hit along the way. We have reached the first of those milestones: our Authenticated Origin Pulls and Custom Origin Trust Store products now support post-quantum (PQ) authentication via Module-Lattice-Based Digital Signature Algorithm (ML-DSA) signatures to protect connections between Cloudflare and customer origin servers. 

The origin connection is different

When a client visits a website proxied by Cloudflare, there are typically two connections involved. The first connection is from the visitor (e.g., a browser) to Cloudflare. If the request can be served from Cloudflare’s cache or triggers any blocking rules, Cloudflare might respond directly. Otherwise, Cloudflare establishes a second connection to the customer’s origin server to fetch the requested content, so it can respond to the original request.

Protecting sensitive visitor data requires both of these connections to be secure against quantum attacks. We enabled post-quantum encryption support for both the visitor-to-Cloudflare (Connection 1) and Cloudflare-to-origin (Connection 2) connections in 2022 and 2023, respectively, and already see significant usage.

We are actively working on completing the picture with post-quantum authentication. For the visitor-to-Cloudflare connection, we are collaborating with Google and others at the Internet Engineering Task Force (IETF) to develop and experiment with Merkle Tree Certificates (MTC), a design for fast, post-quantum certificates for the web, with initial deployments targeting 2027. The topic of this post, however, is the Cloudflare-to-origin connection, where the requirements for authentication differ from that of the visitor-to-Cloudflare connection in several important ways.

For this connection, Cloudflare is the client. This gives us the control to employ techniques such as connection pooling to fan in requests from all over our network to a smaller set of connections to origin servers, amortizing the overhead of connection setup over many requests. This makes the cost of “drop-in” post-quantum signatures more palatable, and the performance benefits of MTC less necessary.

And with a pre-existing trust relationship between Cloudflare and customers (i.e., a Cloudflare account), we need not tie ourselves to the constraints and timelines of the public key infrastructure (PKI) for the public Internet (WebPKI) and can instead use custom PKIs tailored to the use case, without overhead from intermediate certificates and Certificate Transparency that may not be applicable. Solutions like Cloudflare Tunnel can also be used to protect the Cloudflare-to-origin connection without upgrading legacy origin systems, by forwarding traffic over a tunnel secured with post-quantum encryption (and post-quantum authentication in the works).

All this to say, the unique requirements of the Cloudflare-to-origin connection have allowed us to deploy post-quantum authentication via ML-DSA authentication ahead of support landing in the WebPKI for the public Internet. (For customers who stick with the WebPKI, don’t worry: we’ll add MTC support on the Cloudflare-to-origin connection in the future.)

So how do you turn this on? Let’s dive into the configuration.

Configuring fully PQ-secure origin connections

We have added ML-DSA support (for all FIPS 204 parameter sets: ML-DSA-44, ML-DSA-65, and ML-DSA-87) to the Custom Origin Trust Store and Authenticated Origin Pulls products. ML-DSA-44 is our recommendation for most applications as it is the most performant option and attains a comfortable NIST category 2 security strength.

Custom Origin Trust Store

When Cloudflare makes a connection to a customer origin server configured with Full (strict) SSL mode, we authenticate the origin certificate against a default trust store consisting of all commonly trusted Certificate Authorities (CAs) as well as Cloudflare’s origin CA. The Custom Origin Trust Store (COTS) product (which requires Advanced Certificate Manager to be enabled) allows customers to replace this default trust store with a set of CAs they control. COTS now allows customers to upload ML-DSA CAs, such that Cloudflare will trust any origin server certificate chaining to that CA when connecting to the origin.

Authenticated Origin Pulls

To limit abuse and resource consumption on their origin servers, customers may want to only serve requests coming from Cloudflare’s servers. Authenticated Origin Pulls (AOP) can be used to configure Cloudflare to present a client certificate to the origin server in order to establish a mutual TLS (mTLS) connection, in which communication between the parties is bidirectionally secure and trusted. AOP is available for free on all Cloudflare plan levels.

AOP supports three configuration levels: global, per-zone, and per-hostname. The per-zone and per-hostname configuration levels now allow customers to upload ML-DSA certificates and private keys (in the FIPS 204 seed format), so that Cloudflare’s TLS client will present this certificate to authenticate itself when connecting to the origin server. (Don’t worry, we haven’t forgotten about the global configuration level — it just happens to be a more involved change that will be prioritized at a later date.)

Avoiding downgrades

Adding post-quantum encryption and authentication support to both the authenticating and verifying parties is necessary but not sufficient for full post-quantum security. The pesky issue of downgrades remains. If the verifying party supports any quantum-vulnerable authentication mechanisms, they remain open to attack from an on-path attacker capable of forging classical credentials.

The fix: the verifying party must remove trust in quantum-vulnerable authentication mechanisms. (This is more nuanced in complex PKIs. For example, see the Chromium Security team’s four-stage plan for transitioning the Web.) See the configuration guide for AOP and COTS for details on how to ensure your origin is secure against downgrade attacks.

Quick start

The walkthrough below shows how to generate an ML-DSA certificate chain and configure both products via the Cloudflare API. For dashboard instructions and additional context, refer to the developer docs.

1. Generate certificates

You will need OpenSSL 3.5.0 or later. The private key must be generated in the FIPS 204 seed-only encoding, which is the only format Cloudflare currently accepts on upload.

Origin server certificate chain for COTS:

Cloudflare client certificate chain for AOP:

2. Upload the origin CA to Custom Origin Trust Store

Uploading a COTS CA replaces the default publicly-trusted CAs for the zone. Make sure you only upload post-quantum CAs if you want to avoid downgrade attacks.

3. Upload the client certificate for Authenticated Origin Pulls

The example below uses zone-level AOP. If you prefer per-hostname AOP, use the /origin_tls_client_auth/hostnames/certificates endpoint instead.

4. Set your SSL/TLS mode to Full (strict)

Custom Origin Trust Store is only active when your zone is using Full (strict) mode. If you are using AOP without COTS, Full or higher is sufficient.

5. Configure your origin server (on NGINX)

If you are using COTS (your origin presents the ML-DSA server certificate):

If you are using AOP (your origin verifies Cloudflare's client certificate):

If you are using both together (recommended for full post-quantum mutual TLS):

6. Verify the post-quantum handshake

The TLS handshake between Cloudflare and your origin happens behind the scenes, so you cannot observe it directly by connecting to your proxied hostname from the outside. Instead, verify each side separately.

Verify COTS (origin presents an ML-DSA certificate):

If your origin IP is directly reachable (for example, during testing before enabling the Cloudflare proxy), connect to the origin IP directly and validate the certificate:

Look for Signature type: mldsa44 in the output.

If your origin is firewalled to only accept Cloudflare IPs, check your origin server's TLS logs or use a packet capture tool such as ssldump or tcpdump on the origin to confirm that Cloudflare negotiated TLS 1.3 with the ML-DSA certificate.

Verify AOP (Cloudflare presents a client certificate):

Confirm that direct connections to the origin (without a valid client certificate) are rejected:

With ssl_verify_client on enforced, this should fail with an SSL alert.

Verify the full Cloudflare-to-origin path:

Because the mTLS handshake happens server-to-server, the most reliable way to confirm that Cloudflare is presenting the ML-DSA client certificate is to inspect your origin server logs. For example, in NGINX you can log the client certificate serial number or subject:

After sending a request through Cloudflare, check the log. You should see the serial number of the aop-client.crt certificate you uploaded.

For the key agreement, ensure that your origin's TLS library supports X25519MLKEM768 and that it is preferred in your configuration. The post-quantum key agreement will be visible in origin server logs or packet captures as the negotiated group.

The boring details

Implementing this feature involved two primary systems: our control plane service that allows customers to manage their TLS settings and upload certificates, and the data plane service responsible for establishing TLS connections to origin servers based on customer configurations.

Control plane

As with many other services that power Cloudflare’s APIs and Dashboard, the service that powers the configuration for Cloudflare’s SSL/TLS products runs in a highly available setup across a set of critical data centers. The service is responsible for handling SSL/TLS settings updates and pushing them out to our globally-distributed key-value store so that they are available to data plane services when handling live requests.

Enabling ML-DSA support for AOP and COTS required updating this service to support parsing and validating ML-DSA certificates. This sounds simple on paper, but there’s a catch: the service is written in Go, but Go’s standard X.509 and TLS libraries did not yet support ML-DSA. We instead implemented the necessary functionality in Cloudflare’s CIRCL library to patch in support. This was a relatively simple change, but repeating this for every service that needs post-quantum authentication support would be a major chore.

Fortunately, Go 1.27 (expected August 2026) will include native ML-DSA support, and will allow us to drop the CIRCL dependency. Other Go-based services will then be able to seamlessly pull in ML-DSA support with a simple version update.

Data plane

With the control plane changes in place, customers could then upload ML-DSA certificates for the AOP and COTS products. The next step was to update our data plane service responsible for interacting with customer origins to actually use those certificates.

We have talked in previous blog posts about our open-source proxy framework Pingora and specifically how we have a Pingora-based service that handles all the connections to those origins. That service is unimaginatively named Pingora Origin, and it is responsible for ensuring millions of requests per second worth of origin-bound requests make it safely and securely to their final destination. 

The task of ensuring the request’s security typically falls to the TLS provider, and it may surprise you to know that post-quantum security (or in this case authenticity) is no different. It also might come as a letdown that defending against quantum attacks does not require exotic states of matter with lasers and superconducting Josephson junctions; all you need is an update to BoringSSL. Now, BoringSSL lives up to its name: over the past several years, there have been no CVEs or major changes. In fact, we relied on that stability so heavily that we have an admission to make: we snoozed Pingora Origin’s update to BoringSSL for four years, instead maintaining an internal fork to patch in additional functionality as needed. That has worked well, but when post-quantum authentication support landed in BoringSSL in April 2026, we decided that this update was worth the inconvenience.

This is where we wish we could say, “This update went perfectly. No notes!” but naturally there were some hiccups. Within the four years’ worth of code changes was this commit that enables enforcement of rules related to KeyUsage in TLS certificates. This change is in line with the specifications, but as we have seen before, the Internet is not known for being RFC compliant. The result was that even after testing the changes for weeks and a very slow release rollout looking for just this sort of regression, a small number of customers’ certificates were deemed invalid after the change, leading to an incident on June 10, 2026. We quickly rolled back the change and after a patch to retain support for RSA certificates with technically invalid KeyUsage, fully post-quantum secure TLS to origins is now live and ready to use.

We are only getting started

ML-DSA support is increasingly ubiquitous across TLS libraries, and routine software updates will bring post-quantum authentication support to many applications. (Please keep your libraries updated!) The highly-anticipated Go 1.27 (August 2026) will come with native ML-DSA support, allowing Go-based services to add post-quantum authentication with a simple version update.

As these changes propagate across the ecosystem, we will be upgrading our systems as well. See PQC in Cloudflare Products for an up-to-date tracker of post-quantum encryption and authentication support in Cloudflare products and services.

How AI is Rewriting the Zero-Day Playbook for Preemptive Security

Post Syndicated from Joel Alcon original https://www.rapid7.com/blog/post/ai-rewriting-zero-day-playbook-for-preemptive-security

The scenario is all too familiar for any cybersecurity professional: It’s late in the day, and a critical zero-day vulnerability is disclosed. When this happens, CISOs from every industry immediately turn to their Security Operations Centers (SOC) with the single most important, and often most difficult, question: “Are we exposed?”

Answering questions like these when zero-days drop tends to trigger a frantic, high-stress fire drill. Analysts scramble to cross-reference outdated Configuration Management Databases (CMDBs), query disparate endpoint detection tools, and ping IT administrators. The data is siloed, context is missing, and time rapidly slips away. 

Today, the window between a vulnerability’s disclosure and its active exploitation in the wild has essentially collapsed, making predictive lead time a thing of the past. As adversaries integrate AI into their playbooks to automate attacks, defending against them requires us to operate at machine speed.

We believe preemptive security is the most effective way to close this window. You cannot wait for every alert to fire to understand your environment. You need an architecture that constantly tracks emerging risks and threats, coupled with AI-accelerated discovery that brings your attack surface into sharp focus before the adversary does. Rapid7 is previewing a series of new features at Black Hat USA 2026 designed to transform the way security teams navigate the chaos of a zero-day threat to identify and close attack paths before they are exploited.  

The foundation: Continuous Software Visibility

You cannot secure what you cannot see, and in highly distributed, AI-enabled environments, absolute visibility has traditionally been a gap. To achieve true preemptive security, you need a complete, continuous view of emerging risks. When a zero-day drops, your platform should already be tracking it via an Emerging Threat Response (ETR) process. But knowing the threat exists is only step one; you must correlate that threat with your specific environment. This is where Rapid7 Software Visibility (in-preview) becomes important.

Software-Visibility.png
Software Visibility: Depicts details of installed vulnerable software across the technology stack.

⠀

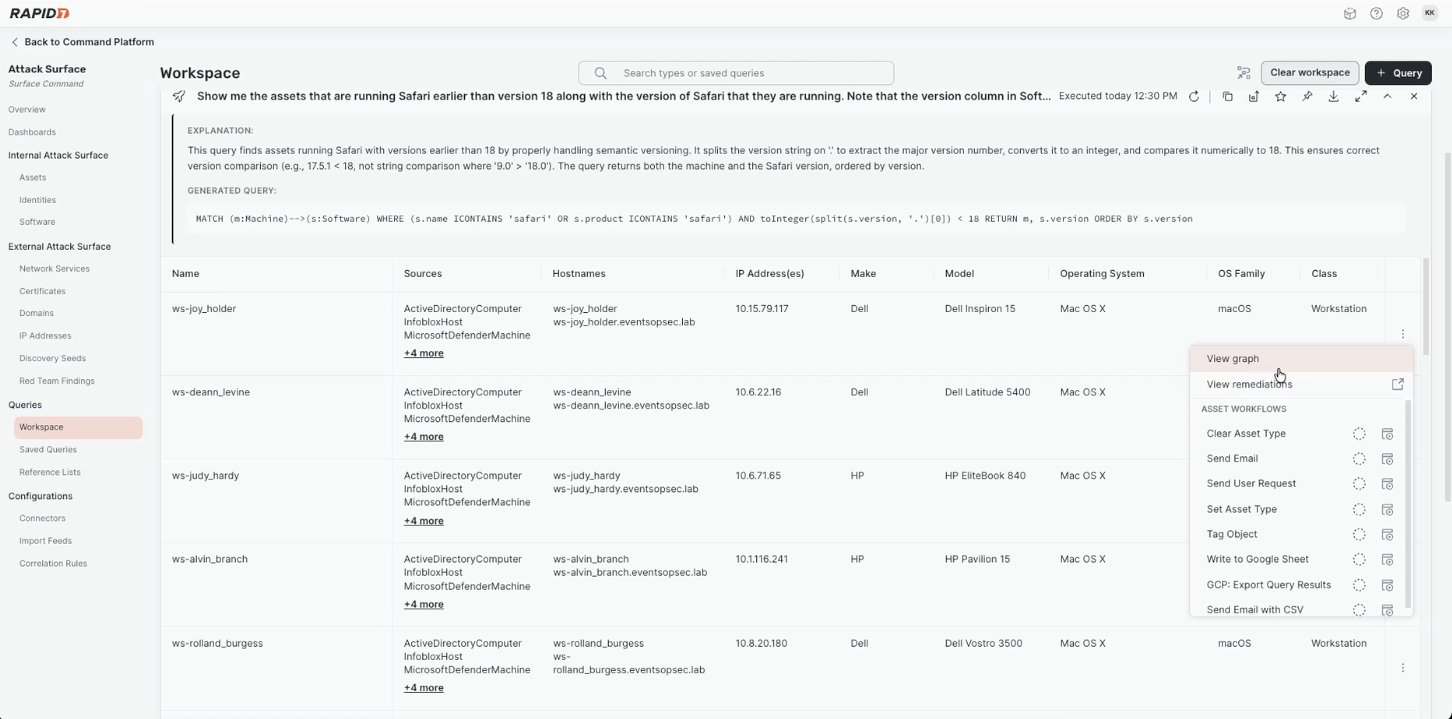
Instead of initiating massive, disruptive network scans, security teams can drill directly into the ETR to view key details of the vulnerability, pinpointing relevant assets and software versions in real-time. For example, if a new zero-day dictates that versions of Safari earlier than 18 are vulnerable, Software Visibility allows you to instantly map that criteria against your entire technology stack. That expansive view into your attack surface allows you to uncover whether this newly discovered exposure exists within your environment, shifting your posture from reactive investigation to proactive defense.

Calculating the blast radius: Decoding toxic combinations

Once you know that you have vulnerable instances of Safari running in your environment, the CISO’s initial question evolves. It is no longer just “Are we exposed?” but rather, “How exposed are we?”

Answering this requires breaking down the traditional silos of security data. A vulnerable service running on an isolated sandbox is a minor blip. That same vulnerable service hosted on a production machine where a highly privileged service account recently left a cached credential in memory is a direct path to domain compromise.

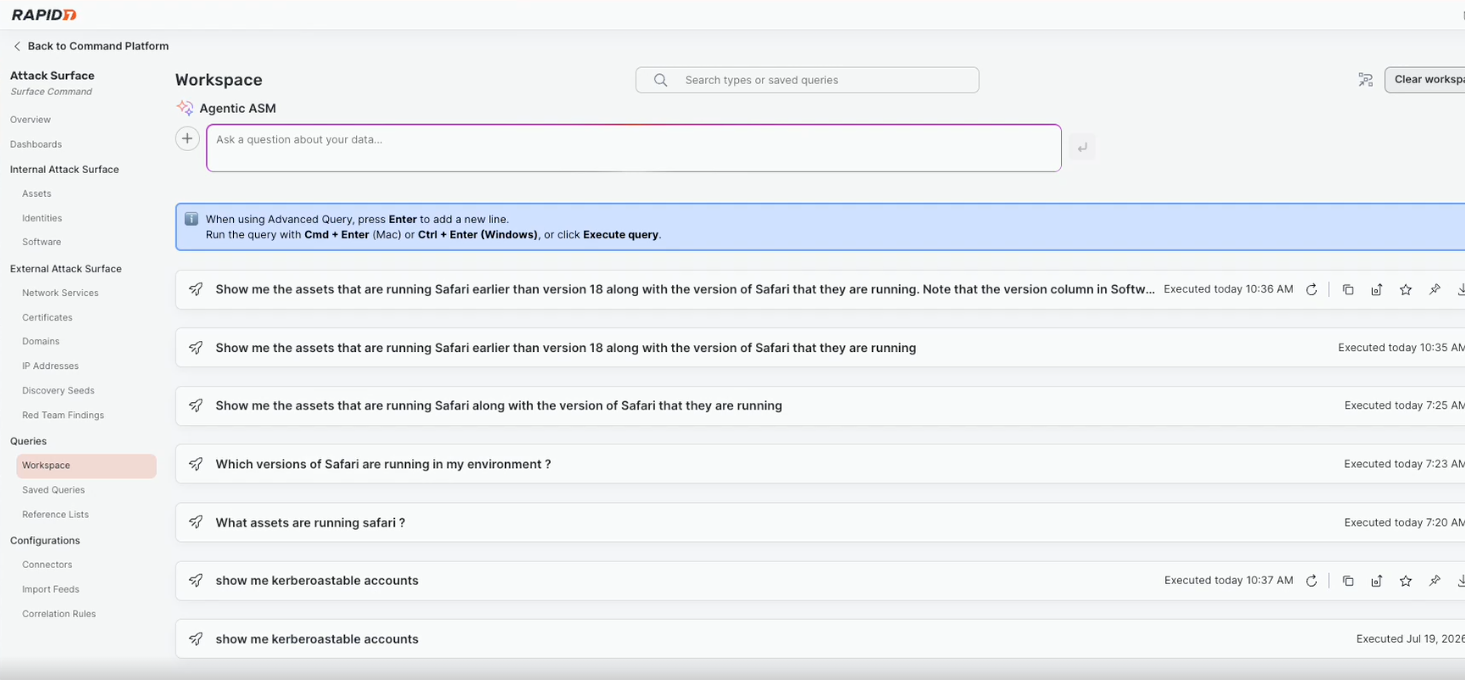
To accurately gauge risk, you need a unified view of your attack surface that pulls together both internal and external telemetry, and lets teams find the information easily. Rapid7’s Exposure Command accelerates this level of exposure discovery with natural language queries (in preview), so that instead of writing complex syntax, plain-English questions will uncover shadow AI models, pinpoint insecure assets, or identify overprivileged users. A SOC analyst can simply ask the platform in plain English: “Show me all assets running Safari earlier than version 18.”

Natural-language-queries.png
Natural language queries: Displays a quick, intuitive way to reveal valuable information about the attack surface.

⠀

The platform reveals the total footprint, but more importantly, it also uncovers toxic combinations. It highlights not just the vulnerable assets and software, but can also highlight the specific users associated with those systems. By illuminating these connections, security teams can prioritize their response based on actual business risk rather than generic CVSS scores.

Bridging the SecOps / ITOps divide: Actionable remediation

Identifying the risk is a security function, but fixing it almost always falls to IT Operations. The friction between these two departments usually goes something like this: the SOC demands immediate patching to stop a breach; ITOps demands testing to ensure the patch does not break critical business services.

To achieve preemptive security, we help streamline this important handoff between teams. For instance, when a critical zero-day hits, a patch is often unavailable for days. In the interim, Rapid7 Exposure Command can provide mitigation guidance to help organizations minimize their risk using existing security controls, even when a formal patch does not exist.

Once a patch is released or a formal CVE number is assigned, the challenge shifts to rapid, safe deployment. To accelerate this, Rapid7 leverages AI-Generated Remediation Summaries (available now). Rather than tossing a massive spreadsheet of vulnerable IP addresses over to IT, these AI summaries provide highly tailored, environment-specific guidance.

Remediation-summaries.png
Remediation summaries: AI-powered summary of remediation guidance.

⠀

The AI contextualizes the vulnerability findings based on your existing security controls, established asset ownership, and the unique makeup of your attack surface. It translates raw vulnerability data into clear, actionable narratives, empowering ITOps to quickly understand not just what needs to be patched, but how to securely and efficiently deploy those patches with minimal disruption to the business.

Communicating up: Translating data into cross-functional narratives

While the SOC and IT are working to remediate the threat, the business demands constant updates. The CISO, the executive team, and the board of directors need to know the organization’s real-time risk posture.

Historically, translating deeply technical security metrics into executive-ready reports meant a security analyst would spend hours manually interpreting data, formatting charts, and building slide decks. These are valuable hours that should have been spent actively hunting threats.

To address this, Rapid7 is introducing AI Dashboard Summaries (in preview). This capability automatically transforms dense, data-heavy dashboards into plain-text, actionable narratives. The platform generates a powerful, easy-to-digest summary of the active risk posture, allowing security leaders to give leadership and cross-functional partners exactly what they need: clear, confident answers, delivered immediately.

We also recognize that security telemetry doesn’t exist in a vacuum. Organizations need complete control over their data. If you want to integrate this vulnerability intelligence with broader enterprise risk models, you can seamlessly export this data to your AI analytics engine of choice via a Model Context Protocol (MCP) server. This flexibility ensures you can add context or perform secondary risk analysis exactly as your business requires.

The preemptive future

The scenario described above is just a snapshot of how AI-enabled capabilities are fundamentally changing the defensive landscape. By leveraging continuous software visibility, AI-accelerated discovery, and automated remediation guidance, we can stay ahead of the ever-narrowing window between vulnerability disclosures and active exploits.

Preemptive security is about building an environment so visible, so well-understood, and so seamlessly integrated that when the inevitable zero-day drops, panic is replaced by precision. Whether it is navigating complex toxic combinations, securing ephemeral cloud workloads, or implementing robust mitigations when no patch is available, these Rapid7 AI-enabled capabilities lay the groundwork for teams to outpace the adversary.

Visit us at BlackHat to see these capabilities in action!

How Company 3 Streamlines Studio Image Management with EC2 Image Builder and AWS CDK

Post Syndicated from Natalie White original https://aws.amazon.com/blogs/devops/how-company-3-streamlines-studio-image-management-with-ec2-image-builder-and-aws-cdk/

Guest post in collaboration with Company 3 Director of New Technology, Phil Wortas, and Senior New Technology Engineer, Matthew Galloway

Introduction

Company 3 provides specialized services for the entertainment industry, including post-production services, visual effects, and color grading for feature films, commercials, and television content. Their teams collaborate globally to Increase workflow efficiency and expand their roster of diverse movie-making talent.

Company 3’s New Technology team uses Amazon EC2 Image Builder to vend Amazon Machine Images (AMIs) and container images for compute environments where artists create and render content. Image Builder is a fully managed AWS service that helps you automate the creation, management, and deployment of customized, secure, and up-to-date server images. Company 3 also uses the AWS Cloud Development Kit (CDK) to scale the creation of consistent Image Builder components and recipes.

At scale, the respective concepts of versioning between Image Builder resources and CDK infrastructure as code made it challenging to reuse prior components and recipes, and update existing references with new version numbers over time. This challenge led to creative workarounds, collaborative problem-solving with AWS, and ultimately, product improvements that benefit the entire AWS community.

This blog follows their journey from manual version management, through creative workarounds, to native EC2 Image Builder features that solved the problem for good. Along the way, we’ll show how auto-versioning and CDK L2 constructs can simplify your own image pipelines.

Process flow diagram of Artists, Support Engineers, and New Technology Platform Engineers provisioning new studio environments. (1) Artists request new environments. (2) Automation determines whether a matching environment configuration (EC2 AMI) exists. If it does, (3) the new environment is provisioned for the Artist to securely access. If it does not, (4) a Support Engineer creates or update an (5) CDK definition of an EC2 Image Builder Pipeline to provision the correct environment. The CDK (6) generates a CloudFormation template and assets that are used to (7) create the Pipeline. This Pipeline (8) generates a new EC2 AMI, from which the rendering instance can be (9) provisioned and (10) provided for the Artist to securely access.

Figure 1: Personas and process flow

The Challenge: When Infrastructure-as-Code Gets Complicated

While Image Builder has historically supported semantic versioning for Components and Recipes, there was no mechanism to automatically detect version changes or update existing references to the latest version of a component using the CDK. This is because Image Builder only supported Layer 1 (L1) CDK constructs. Layer 1 constructs map directly to CloudFormation resources and their corresponding service APIs, but do not provide features that create a layer of abstraction above those foundational create / update / delete operations.

Version changes to Components and Recipes are a frequent occurrence because these resources are immutable; every change to them requires a new version. Version numbers are a part of these resource’s Amazon Resource Name (ARN), so changes must be propagated throughout the associated CDK code to correctly reference the latest version of each resource.

Figure 2 shows an architecture diagram of an EC2 Image Builder Pipeline, which consists of Infrastructure configuration, Components, Recipes, and distribution settings. Components and Recipes each have their own separate version numbers and are immutable. This Pipeline generates EC2 AMIs, which are tied to the recipe version used to generate them, and are used to provision EC2 rendering instances.

Figure 2: EC2 Image Builder Anatomy and Version Propagation

Figure 1, Step 5 represents a Platform Engineer having to update an existing Component. Figure 2 shows the required changes broken out by each of the comprising Image Builder resources:

  1. Update the Component configuration
  2. Increment the Component version
  3. Update the Recipe with the new Component version ARN
  4. Increment the Recipe version
  5. Update the Recipe version ARN in the Pipeline.

Manual version propagation across dozens of components via this multi-step process was error prone, wasn’t scalable, and created a risk of deployment failures and version churn due to version mismatches.

The team needed to prevent unnecessary update requests to Image Builder when components didn’t change but the recipes they were associated with did, orchestrate version propagations when the versions did need to change, and track component versions as they deployed updates across their infrastructure.

Short-term Workaround: Using Hashes to Identify Changes

Faced with these limitations, the customer’s engineering team got creative. Their first approach involved appending MD5 hashes to component names. This allowed them to track changes and force CDK updates and version increments when content changed, while preventing unnecessary update calls when the content of the component didn’t change but the rest of the resources in the CDK Stack did.

However, this approach had drawbacks. Component names became unwieldy and difficult to maintain. More importantly, the hash-based naming convention didn’t align with semantic versioning best practices that the rest of their infrastructure followed. The team knew they needed a better solution long-term.

Long-term Automation: Collaboration with AWS

Working with their AWS Solutions Architect and EC2 Image Builder Developer Support, Company 3 developed a more elegant solution using CDK Custom Resources. This approach eliminated hash-based naming and automated the propagation of version updates, but it came with technical debt.

The version increments themselves were still manual, and the solution required custom resources to create and maintain the suite of resources being deployed. The mesh of custom resources required specialized knowledge to maintain, which made it difficult to onboard new team members, and distracted engineers from focus on core business value of delivering the right studio environments to artists.

Managed Abstraction: AWS Launches Product Improvements

EC2 Image Builder auto-versioning

In November 2025, EC2 Image Builder introduced native auto-versioning capabilities that transformed how teams manage Component versions.

Components with the same name and semantic version now auto-increment build versions (eliminating steps 2-4 from Figure 2 when developers use ‘x’ as a wildcard placeholder (e.g., 1.2.x). Additionally, Pipelines can resolve to the highest available version of Components and Recipes, which ensures they are using the latest compatible versions without manual updates, eliminating step 5.

These enhancements eliminated the version propagation burden entirely, allowing Company 3 developers to focus only on the substantive changes to Components requested by Artists and Support Engineers.

CDK Layer 2 Constructs

The second major improvement came with comprehensive Layer 2 (L2) constructs for EC2 Image Builder (RFC 0789). L2 Constructs provide a layer of abstraction that default to best practice configuration, automatic least-privilege IAM Role and Policy provisioning, and convenience methods that make it easier to create and link to other AWS resources. These constructs transformed the developer experience and alleviated the need for custom resources. The EC2 Image Builder L2 Construct is currently in alpha stabilization phase, and sourcing customer feedback and adoption before migrating to the core CDK library per the CDK contribution process.

Before the L2 construct release, orchestrating an Image Builder Pipeline took over 50 lines of code, and required manual least-privilege IAM role creation, instance profile setup, and Pipeline configuration across 6 separate CloudFormation resources.

// Using L1 constructs
const instanceProfileRole = new iam.Role(stack, 'EC2InstanceProfileForImageBuilderRole', {
  assumedBy: iam.ServicePrincipal.fromStaticServicePrincipleName('ec2.amazonaws.com'),
  managedPolicies: [
    iam.ManagedPolicy.fromAwsManagedPolicyName('AmazonSSMManagedInstanceCore'),
    iam.ManagedPolicy.fromAwsManagedPolicyName('EC2InstanceProfileForImageBuilder'),
  ],
});

const instanceProfile = new iam.InstanceProfile(stack, 'EC2InstanceProfileForImageBuilder', {
  role: instanceProfileRole,
});

const bucket = new s3.Bucket(stack, 'ImageBuilderLoggingBucket', {
 bucketName: `ec2imagebuilder-logs-${stack.region}-${stack.account}`,
  enforceSSL: true,
});

const l1InfrastructureConfiguration = new imagebuilder.CfnInfrastructureConfiguration(stack, 'L1InfrastructureConfiguration', {
  name: 'l1-infrastructure-configuration',
  instanceProfileName: instanceProfile.instanceProfileName,
  instanceMetadataOptions: { httpTokens: 'required' },
  logging: {
    s3Bucket: bucket.bucketName,
    s3KeyPrefix: 'imagebuilder-logging',
  },
});
const l1ImageRecipe = new imagebuilder.CfnImageRecipe(stack, 'L1ImageRecipe', {
  name: 'l1-image-recipe',
  version: '1.0.0',
  parentImage: `arn:${stack.partition}:imagebuilder:${stack.region}:aws:image/amazon-linux-2023-x86/x.x.x`,
  components: [
    {
      componentArn: `arn:${stack.partition}:imagebuilder:${stack.region}:aws:component/update-linux/x.x.x`,
    },
  ],
});

const l1ImagePipeline = new imagebuilder.CfnImagePipeline(stack, 'L1ImagePipeline', {
  name: 'l1-image-pipeline',
  imageRecipeArn: l1ImageRecipe.attrArn,
  infrastructureConfigurationArn: l1InfrastructureConfiguration.attrArn,
});

Using the ImagePipeline L2 construct allows the developer to provision a Pipeline in fewer than 10 lines of code while leveraging best practice configuration the construct sets by default.

// Equivalent, using L2 constructs
const l2ImagePipeline = new imagebuilder.ImagePipeline(stack, 'L2ImagePipeline', {
  recipe: new imagebuilder.ImageRecipe(stack, 'L2ImageRecipe', {
    baseImage: imagebuilder.AwsManagedImage.amazonLinux2023(stack, 'AL2023'),
    components: [
      {
        component: imagebuilder.AwsManagedComponent.updateOS(stack, 'UpdateOS', {
          platform: imagebuilder.Platform.Linux,
        }),
      },
    ],
  }),
});

The Impact: From Workarounds to Best Practices

For Company 3, these improvements meant they could retire their custom constructs entirely. The L2 constructs provided everything their custom solution did, plus additional capabilities.

The EC2 Image Builder service manages the complexity of version updates by default, and they gained enhanced security through AWS-managed secure defaults like IMDSv2 requirements and least-privileged IAM roles.

Perhaps most importantly, new team members can understand the infrastructure code in minutes rather than hours, dramatically accelerating onboarding.

Conclusion

The impact extends far beyond one customer. Every AWS user working with EC2 Image Builder and CDK now benefits from simplified workflows, automatic version management, and security best practices by default. What started as one team’s challenge became a catalyst for improvements that make everyone’s work easier and more secure. The evolution of EC2 Image Builder’s CDK support demonstrates AWS’s commitment to listening to customers and continuously improving the developer experience.

For teams currently managing EC2 Image Builder Pipelines manually or with L1 CDK constructs or with custom solutions, the path forward offers significant benefits. Explore how you can use EC2 Image Builder, its new auto-versioning capabilities, and its CDK L2 Constructs to automate your complex AMI Pipeline provisioning architecture via these resources:

EC2 Image Builder Documentation

EC2 Image Builder Auto-versioning Documentation

CDK L2 Constructs for EC2 Image Builder (currently in alpha stabilization)

EC2 Image Builder CDK Sample GitHub Repository

Authors

Rochelle Lakey

Rochelle Lakey is a Senior Solutions Architect specializing in Media and Entertainment at AWS helping customers architect and optimize their cloud infrastructure. She brings 28 years of managed services experience bridging traditional data centers and modern cloud computing. Rochelle is passionate about guiding organizations through their digital transformation journeys.

Phil Wortas

Phil Wortas is Director of New Technology at Company 3, where his team serves as the cloud infrastructure and platform engineering backbone for a global post-production and VFX organization. Together they focus on reducing manual toil through automation and IaC, so the creative teams they support can stay focused on the work that matters.

Matthew Galloway

Matthew Galloway is a Senior New Technology Engineer at Company 3, working within the cloud infrastructure team. He specializes in AWS deployment automation and developing tools that streamline and enhance artist workflows across the organization. Matthew’s work is driven by a commitment to reducing friction for creative teams, ensuring they have the reliable, efficient infrastructure that they need.

Tarun Belani

Tarun Belani is a Senior Software Development Engineer on the EC2 Image Builder team at Amazon Web Services, where he works on the service’s APIs and backend systems. He designed and built the AWS CDK L2 constructs for EC2 Image Builder.

Natalie White

Natalie White is a Principal Solutions Architect at Amazon Web Services. While her primary customers are in the Healthcare and Life Sciences industry, she leverages her prior Software Development experience as a specialist in AWS CDK and Infrastructure as Code automation, AI-DLC, and GenAI for Developer Productivity across all industries.

Add security context to operational investigations with AWS DevOps Agent and Wiz

Post Syndicated from Yuriy Prykhodko original https://aws.amazon.com/blogs/devops/add-security-context-to-operational-investigations-with-aws-devops-agent-and-wiz/

This post was co-authored by Ayelet Harcz (Product Manager), Hen Perez (CTO Architect), and Shani Gafni (Product Manager) at Wiz.

When an on-call engineer receives an alert at 2 AM, a CPU spike, a latency anomaly, or an unexpected API error, the first question is whether this is an operational issue or a security incident. A CPU spike could be a scaling problem or a cryptominer. A latency anomaly could be a bad deployment or data exfiltration. Without security context in the investigation loop, engineers lack the information to distinguish between the two, delaying resolution and increasing risk.

AWS DevOps Agent is a frontier agent that autonomously investigates incidents and identifies operational improvements across AWS, multicloud, and on-premises environments. It reduces mean time to resolution (MTTR) by performing the triage and investigation work that would otherwise take an on-call engineer hours of manual effort. With the Wiz integration, AWS DevOps Agent queries Wiz’s security graph during investigations through the Model Context Protocol (MCP), surfacing vulnerability data, security findings, and exposure analysis alongside operational telemetry so engineers can quickly determine whether an alert is a performance issue or a security incident.

In this post, we walk through how the integration works, demonstrate a real-world incident investigation where AWS DevOps Agent uses Wiz MCP to surface a critical vulnerability behind an API latency spike, and show how to configure the integration in your environment. If you already use Wiz to secure your AWS environment, this integration puts your existing security data to work during incident investigations.

AWS DevOps Agent

AWS DevOps Agent investigates incidents and identifies operational improvements as an experienced DevOps engineer would: by learning your resources and their relationships, working with your observability tools, runbooks, code repositories, and CI/CD pipelines, and correlating telemetry, code, and deployment data across all of them. For a deeper look at how it works, see How AWS DevOps Agent uses multi-agent reasoning to find root causes.

AWS DevOps Agent is extensible through MCP, which allows the agent to call external tools during its investigation without requiring custom development. This is the mechanism that makes the Wiz integration possible. When the agent identifies a resource under investigation, it queries Wiz MCP for security findings associated with that resource and incorporates the results into its analysis and recommendations.

Wiz MCP

Wiz is designed to secure cloud and AI applications through a unified, graph-powered platform. The Wiz Security Graph connects infrastructure, identities, data, AI components, and runtime activity into a single contextual view. This approach identifies toxic combinations across layers – where exposures, permissions, data access, AI vulnerabilities, and runtime behaviors intersect in ways attackers can realistically exploit.

The Wiz MCP Server acts as a standardized gateway that allows AWS DevOps Agent to query this security graph during investigations. Wiz knows whether your Amazon Elastic Compute Cloud (Amazon EC2) instance has an exploitable Common Vulnerabilities and Exposures (CVE), whether it is publicly exposed, and whether endpoint protection is in place. AWS DevOps Agent, looking at the same instance, knows that CPU spiked, and a deployment happened 20 minutes ago. Separately, each tool tells a partial story. Together, they give the engineer the complete picture needed to act.

Better together: how combined context changes triage

The value of this integration is easiest to understand through three scenarios. Each starts with the same operational signal: a CPU spike on an EC2 instance.

Figure 1 – AWS DevOps Agent sees operational telemetry, Wiz sees security posture. The combination changes the triage decision.

Figure 1 – AWS DevOps Agent sees operational telemetry, Wiz sees security posture. The combination changes the triage decision.

Scenario A: No security findings. A CPU spike fires on an instance. AWS DevOps Agent queries Wiz and confirms the instance is fully monitored, has no known vulnerabilities, and shows zero active threat detections. This is an operational issue. The engineer scales, investigates the deployment, tests, and moves on.

Scenario B: Security issue detected. The same CPU spike fires, the same Amazon CloudWatch alarm triggers, and the same engineer wakes up. But when AWS DevOps Agent queries Wiz, it finds a validated remote code execution vulnerability on that instance, confirmed exploitable, with the resource exposed to the internet. The operational symptoms are identical to Scenario A. The correct response is the opposite: isolate immediately, engage your security team, treat this as a potential compromise.

Scenario C: Wiz coverage gap. The resource isn’t in Wiz at all. AWS DevOps Agent includes this as a finding in the investigation report, noting that no security context was available for the resource. Your team can then address the coverage gap by onboarding the resource into Wiz.

Without the Wiz integration, all three scenarios look the same in your dashboard. With it, AWS DevOps Agent routes each to the correct response path before a human needs to context-switch between tools.

How the integration works: the MCP bridge

The integration uses MCP, the same protocol AWS DevOps Agent uses for many of its external tool connections. When the agent identifies affected resources during an investigation, it calls Wiz’s remote MCP server as part of its evidence collection – no separate step, no manual trigger. The security query happens alongside the operational investigation, not after it. During the MCP call, AWS DevOps Agent sends resource identifiers to Wiz’s MCP endpoint and receives security findings in response. No operational telemetry or broader investigation context is shared with Wiz.

Figure 2 – The investigation flow: operational alert triggers AWS DevOps Agent, which queries Wiz via MCP before reaching a triage decision.

During the MCP call, AWS DevOps Agent queries Wiz tools to build a complete risk picture of the affected resource, here are a few examples:

Wiz MCP Tool What it tells the agent
list_cloud_resources Whether Wiz monitors this resource at all (coverage check)
list_findings All finding types in one call: vulnerabilities, misconfigurations, secrets, data, and host config
list_vulnerability_findings Deep CVE detail – severity, fix version, and exploitability (CISA KEV / known exploit)
list_issues Prioritized risk issues, including toxic combinations (internet-facing + no Endpoint Detection and Response (EDR) + exploitable CVE)
list_threats / list_malware_findings Active threats and malware: cryptomining, data exfiltration, backdoors
list_detections Recent threat detection signals and anomalous activity
get_green_agent_analysis AI-generated remediation steps for the issues found

The agent runs these queries together through a single security-auditing skill that loads automatically when it connects to Wiz’s MCP server with the DevOps toolset, so the full security picture comes back in seconds. If the Wiz MCP server is unreachable, times out mid-query, or returns an authentication error, the agent continues its investigation with the operational data it has and flags the missing security context in the investigation findings (Scenario C). You can review exactly which MCP tools were called and what data was returned in the AWS DevOps Agent investigation log for full auditability.

Based on what comes back, the agent classifies the situation: no security findings (operational issue, proceed normally), compromised or at-risk (active threats, exploitable vulnerabilities, or toxic combinations – apply relevant security runbooks to isolate the resource or escalate to security, with Wiz Green Agent remediation steps attached), or unmonitored by Wiz (flag and close the coverage gap). The classification feeds directly into the investigation findings your team receives.

The following demonstration shows AWS DevOps Agent investigating a reported CPU spike. The agent queries Wiz MCP and identifies a critical, internet-exposed Remote Code Execution (RCE) under active exploitation – turning an ambiguous alert into a confirmed security incident.

Video 1 – AWS DevOps Agent investigates a CPU spike and uses Wiz MCP security context to identify a critical RCE exploited through a public endpoint

Getting started

Prerequisites

To use AWS DevOps Agent with Wiz MCP, you need:

  1. An active AWS DevOps Agent configuration with at least one Agent Space
  2. A Wiz tenant with a remote MCP server endpoint (Streamable HTTP transport)
  3. Authentication credentials for the Wiz MCP server. AWS DevOps Agent supports multiple MCP auth methods; for Wiz, use a Wiz service account (Client ID and Secret) or OAuth. Choose the method that matches your Wiz MCP server configuration. For setup details, see Connect remote Wiz MCP server in the Wiz documentation (requires Wiz login)

Enabling the integration

Step 1: Register the Wiz MCP server at account level

  1. Sign in to the AWS Management Console and navigate to the AWS DevOps Agent console.
  2. Go to the Capability Providers page from the side navigation.
  3. Find MCP Server in the Available providers section and choose Register.
  4. Enter the Wiz MCP server details:
    • Name: e.g., “Wiz Security”
    • Endpoint URL: https://mcp.app.wiz.io/?toolset=devops
    • Description: e.g., “Wiz security context for incident triage”
  5. Choose Next.
  6. Select the authentication method that matches your Wiz MCP server configuration.
  7. Review your configuration and choose Submit. AWS DevOps Agent validates the connection to the Wiz MCP server. Upon successful validation, the server is registered at the account level.

Step 2: Allowlist Wiz tools in your Agent Space

  1. In the AWS DevOps Agent console, select your Agent Space.
  2. Go to the Capabilities tab.
  3. In the MCP Servers section, choose Add.
  4. Select the registered Wiz MCP server.
  5. Select all the Wiz MCP tools.
  6. Choose Add.

Step 3: Choose how the Wiz security audit runs

Pick one of three options:

  1. Use the Wiz skill tool (recommended). With the Wiz MCP tools allowlisted, AWS DevOps Agent automatically runs the latest devops_resource_auditing_skill workflow from Wiz during investigations. You always get the most up-to-date version, maintained by Wiz.
  2. Import the ready-made skill. Import the wiz-security-context skill from the AWS DevOps Agent skills repo directly into your Agent Space. It is a lightweight skill that calls the Wiz workflow for you, so you get a one-step setup that stays current with Wiz.
  3. Create your own custom skill. Use AWS DevOps Agent’s Create skill with Chat to build a custom skill based on the devops_resource_auditing_skill workflow and tailor it to your environment. This lets you review and tailor the workflow to your environment.

For detailed MCP configuration guidance, refer to the AWS DevOps Agent documentation on connecting remote MCP servers.

The power of co-build: extending context through MCP

This integration started from a recurring customer question: how do I know if what I’m seeing is an operational problem or an active attack? We worked with Wiz to close this gap. AWS DevOps Agent provides operational investigation and reasoning; Wiz provides cloud security intelligence. MCP provided the integration path without either side needing to reimplement what the other already does well.

Because AWS DevOps Agent supports connecting remote MCP servers as a first-class extension mechanism, co-building new integrations with AWS Partners follows a repeatable pattern. Each integration adds a new dimension of context to the agent’s reasoning, and you benefit without writing custom code or middleware on your side. For example, connecting a change management MCP server would let the agent correlate deployment approvals with incident timing, adding change context alongside security context.

For you, this means the richer the toolset you run in your environment, the more context the agent brings to each investigation. Your existing investments get amplified rather than duplicated, and you benefit each time you connect a new partner MCP server to your Agent Space.

Conclusion

Operational incidents and security incidents often start with the same symptoms. The difference between the right response to each is context that lives in a different tool than the one that fired the alert. The AWS DevOps Agent and Wiz integration brings that context into the investigation loop automatically through MCP.

To get started, visit the AWS DevOps Agent console and follow the getting started guide. To learn more about Wiz’s MCP server, see Introducing the MCP Server for Wiz.

Wiz is an AWS Partner and AWS Marketplace Seller providing cloud security across the full development lifecycle. If you’re not already using Wiz, you can get started through the AWS Marketplace.

About the Authors

Yuriy Prykhodko

Yuriy Prykhodko is a Principal Technical Account Manager at AWS, based in Luxembourg. He partners with customers to architect highly reliable, cost-effective systems and drive operational excellence across their cloud workloads, with a focus on applying AI to streamline cloud operations. Yuriy is also an active contributor to the Cloud Operations Technical Field Community at AWS, where he leads several initiatives at the intersection of AI and cloud operations. Outside of work, he enjoys playing basketball and exploring new destinations around the world.

Ziv Shenhav

Ziv is a Principal Customer Solutions Manager at AWS. With nearly a decade at AWS, he helps ISV customers across EMEA accelerate modernization and transition into the agentic AI era. Outside of work, Ziv enjoys nature photography.

Yossi Lagstein

Yossi Lagstein is a Senior Solutions Architect at Amazon Web Services. Yossi has over 30 years of experience as specialist and manager in developing infrastructure components for a variety of projects and products. Yossi supports AWS customers to evolve, design and build well architected solutions. Outside of works, Yossi enjoys running , swimming and hiking.

Ayelet Harcz

Ayelet is a Product Manager at Wiz focused on the frontier of agentic AI engineering. She leads product initiatives and scaling coverage around Mika-Wiz’s AI assistant-and its expanding MCP ecosystem to deliver intelligent cybersecurity capabilities. She holds a degree in Computer Science and Cognitive Science, and outside of work, she enjoys practicing yoga

Hen Perez

Hen is a CTO Architect at Wiz, specializing in cloud security and agentic AI. He architected and co-built the patented Wiz MCP Server, enabling organizations to build AI-powered security agents on top of Wiz, and works across the Wiz Integration Network (WIN) and its MCP ecosystem. With over 19 years of experience spanning embedded systems, observability, and cybersecurity, he focuses on unlocking secure agentic workflows. In his free time, he enjoys playing the piano, experimenting with AI and synthesizers, and hacking life with his daughter.

Shani Gafni

Shani is Product Manager at Wiz, specializing in agentic AI engineering. Her work centers on Wiz’s core AI assistant, Mika along with Wiz Green agent, MCPs and related tools, delivering innovative cybersecurity solutions. In her free time, she enjoys books, music, nature, and photography.

The collective thoughts of the interwebz