Build and deploy custom connectors for Amazon Redshift with Amazon Lookout for Metrics

Post Syndicated from Chris King original https://aws.amazon.com/blogs/big-data/build-and-deploy-custom-connectors-for-amazon-redshift-with-amazon-lookout-for-metrics/

Amazon Lookout for Metrics detects outliers in your time series data, determines their root causes, and enables you to quickly take action. Built from the same technology used by Amazon.com, Lookout for Metrics reflects 20 years of expertise in outlier detection and machine learning (ML). Read our GitHub repo to learn more about how to think about your data when setting up an anomaly detector.

In this post, we discuss how to build and deploy custom connectors for Amazon Redshift using Lookout for Metrics.

Introduction to time series data

You can use time series data to measure and monitor any values that shift from one point in time to another. A simple example is stock prices over a given time interval or the number of customers seen per day in a garage. You can use these values to spot trends and patterns and make better decisions about likely future events. Lookout for Metrics enables you to structure important data into a tabular format (like a spreadsheet or database table), to provide historical values to learn from, and to provide continuous values of data.

Connect your data to Lookout for Metrics

Since launch, Lookout for Metrics has supported providing data from the following AWS services:

It also supports external data sources such as Salesforce, Marketo, Dynatrace, ServiceNow, Google Analytics, and Amplitude, all via Amazon AppFlow.

These connectors all support continuous delivery of new data to Lookout for Metrics to learn to build a model for anomaly detection.

Native connectors are an effective option to get started quickly with CloudWatch, Amazon S3, and via Amazon AppFlow for the external services. Additionally, these work great for your relational database management system (RDBMS) data if you have stored your information in a singular table, or you can create a procedure to populate and maintain that table going forward.

When to use a custom connector

In cases where you want more flexibility, you can use Lookout for Metrics custom connectors. If your data is in a state that requires an extract, transform, and load (ETL) process, such as joining from multiple tables, transforming a series of values into a composite, or performing any complex postprocessing before delivering the data to Lookout for Metrics, you can use custom connectors. Additionally, if you’re starting with data in an RDBMS and you wish to provide a historical sample for Lookout for Metrics to learn from first, you should use a custom connector. This allows you to feed in a large volume of history first, bypassing the coldstart requirements and achieving a higher quality model sooner.

For this post, we use Amazon Redshift as our RDBMS, but you can modify this approach for other systems.

You should use custom connectors in the following situations:

  • Your data is spread over multiple tables
  • You need to perform more complex transformations or calculations before it fits to a detector’s configuration
  • You want to use all your historical data to train your detector

For a quicker start, you can use built-in connectors in the following situations:

  • Your data exists in a singular table that only contains information used by your anomaly detector
  • You’re comfortable using your historical data and then waiting for the coldstart period to elapse before beginning anomaly detection

Solution overview

All content discussed in this post is hosted on the GitHub repo.

For this post, we assume that you’re storing your data in Amazon Redshift over a few tables and that you wish to connect it Lookout for Metrics for anomaly detection.

The following diagram illustrates our solution architecture.

Solution Architecture

At a high level, we start with an AWS CloudFormation template that deploys the following components:

  • An Amazon SageMaker notebook instance that deploys the custom connector solution.
  • An AWS Step Functions workflow. The first step performs a historical crawl of your data; the second configures your detector (the trained model and endpoint for Lookout for Metrics).
  • An S3 bucket to house all your AWS Lambda functions as deployed (omitted from the architecture diagram).
  • An S3 bucket to house all your historical and continuous data.
  • A CloudFormation template and Lambda function that starts crawling your data on a schedule.

To modify this solution to fit your own environment, update the following:

  • A JSON configuration template that describes how your data should look to Lookout for Metrics and the name of your AWS Secrets Manager location used to retrieve authentication credentials.
  • A SQL query that retrieves your historical data.
  • A SQL query that retrieves your continuous data.

After you modify those components, you can deploy the template and be up and running within an hour.

Deploy the solution

To make this solution explorable from end to end, we have included a CloudFormation template that deploys a production-like Amazon Redshift cluster. It’s loaded with sample data for testing with Lookout for Metrics. This is a sample ecommerce dataset that projects roughly 2 years into the future from the publication of this post.

Create your Amazon Redshift cluster

Deploy the provided template to create the following resources in your account:

  • An Amazon Redshift cluster inside a VPC
  • Secrets Manager for authentication
  • A SageMaker notebook instance that runs all the setup processes for the Amazon Redshift database and initial dataset loading
  • An S3 bucket that is used to load data into Amazon Redshift

The following diagram illustrates how these components work together.

Production Redshift Setup

We provide Secrets Manager with credential information for your database, which is passed to a SageMaker notebook’s lifecycle policy that runs on boot. Once booted, the automation creates tables inside your Amazon Redshift cluster and loads data from Amazon S3 into the cluster for use with our custom connector.

To deploy these resources, complete the following steps:

  1. Choose Launch Stack:
  2. Choose Next.
    Setup step described by text
  3. Leave the stack details at their default and choose Next again.Setup step described by text
  4. Leave the stack options at their default and choose Next again.Setup step described by text
  1. Select I acknowledge that AWS CloudFormation might create IAM resources, then Choose Create stack.Setup step described by text

The job takes a few minutes to complete. You can monitor its progress on the AWS CloudFormation console.

CloudFormation Status

When the status changes to CREATE_COMPLETE, you’re ready to deploy the rest of the solution.

Stack Complete

Data structure

We have taken our standard ecommerce dataset and split it into three specific tables so that we can join them later via the custom connector. In all probability, your data is spread over various tables and needs to be normalized in a similar manner.

The first table indicates the user’s platform, (what kind of device users are using, such as phone or web browser).

ID Name
1 pc_web

The next table indicates our marketplace (where the users are located).

ID Name
1 JP

Our ecommerce table shows the total values for views and revenue at this time.

ID TS Platform Marketplace Views Revenue
1 01/10/2022 10:00:00 1 1 90 2458.90

When we run queries later in this post, they’re against a database with this structure.

Deploy a custom connector

After you deploy the previous template, complete the following steps to deploy a custom connector:

  1. On the AWS CloudFormation console, navigate to the Outputs tab of the template you deployed earlier.
    Outputs Link
  2. Note the value of RedshiftCluster and RedshiftSecret, then save them in a temporary file to use later.
    Output Values
  3. Choose Launch stack to deploy your resources with AWS CloudFormation:
  4. Choose Next.
    CloudFormation Setup
  5. Update the value for the RedshiftCluster and RedshiftSecret with the information you copied earlier.
  6. Choose Next.CloudFormation Setup
  7. Leave the stack options at their default and choose Next.Cloudformation Setup
  8. Select I acknowledge that AWS CloudFormation might create IAM resources, then choose Create stack.Cloudformation Setup

The process takes 30–40 minutes to complete, after which you have a fully deployed solution with the demo environment.

View your anomaly detector

After you deploy the solution, you can locate your detector and review any found anomalies.

  1. Sign in to the Lookout for Metrics console in us-east-1.
  2. In the navigation pane, choose Detectors.Lookout for Metrics Detectors Link

The Detectors page lists all your active detectors.

  1. Choose the detector l4m-custom-redshift-connector-detector.

Now you can view your detector’s configuration, configure alerts, and review anomalies.

To view anomalies, either choose Anomalies in the navigation page or choose View anomalies on the detector page.
View Anomalies Link

After a period of time, usually no more than a few days, you should see a list of anomalies on this page. You can explore them in depth to view how the data provided seemed anomalous. If you provided your own dataset, the anomalies may only show up after an unusual event.

Anomalies List

Now that you have the solution deployed and running, let’s discuss how this connector works in depth.

How a custom connector works

In this section, we discuss the connector’s core components. We also demonstrate how to build a custom connector, authenticate to Amazon Redshift, modify queries, and modify the detector and dataset.

Core components

You can run the following components and modify them to support your data needs:

When you deploy ai_ops/l4m-redshift-solution.yaml, it creates the following:

  • An S3 bucket for storing all Lambda functions.
  • A role for a SageMaker notebook that has access to modify all relevant resources.
  • A SageMaker notebook lifecycle config that contains the startup script to clone all automation onto the notebook and manage the params.json file. And runs the shell script (ai_ops/deploy_custom_connector.sh) to deploy the AWS SAM applications and further update the params.json file.

ai_ops/deploy_custom_connector.sh starts by deploying ai_ops/template.yaml, which creates the following:

  • An S3 bucket for storing the params.json file and all input data for Lookout for Metrics.
  • An S3 bucket policy to allow Lookout for Metrics to communicate with Amazon S3.
  • A Lambda function that is invoked on the bucket when the params.json file is uploaded and starts the Step Functions state machine.
  • An AWS Identity and Access Management (IAM) role to run the state machine.
  • A shared Lambda layer of support functions.
  • A role for Lookout for Metrics to access data in Amazon S3.
  • A Lambda function to crawl all historical data.
  • A Lambda function to create and activate a Lookout for Metrics detector.
  • A state machine that manages the flow between creating that historical dataset and the detector.

After ai_ops/deploy_custom_connector.sh creates the first batch of items, it updates the params.json file with new relevant information from the detector and the IAM roles. It also modifies the Amazon Redshift cluster to allow the new role for Lookout for Metrics to communicate with the cluster. After sleeping for 30 seconds to facilitate IAM propagation, the script copies the params.json file to the S3 bucket, which invokes the state machine deployed already.

Then the script deploys another AWS SAM application defined in l4m-redshift-continuous-crawl.yaml. This simple application defines and deploys an event trigger to initiate the crawling of live data on a schedule (hourly for example) and a Lambda function that performs the crawl.

Both the historical crawled data and the continuously crawled data arrives in the same S3 bucket. Lookout for Metrics uses the information first for training, then as inference data, where it’s checked for anomalies as it arrives.

Each Lambda function also contains a query.sql file that provides the base query that is handed to Amazon Redshift. Later the functions append UNLOAD to each query and deliver the data to Amazon S3 via CSV.

Build a custom connector

Start by forking this repository into your own account or downloading a copy for private development. When making substantial changes, make sure that the references to this particular repository in the following files are updated and point to publicly accessible endpoints for Git:

  • README.md – This file, in particular the Launch stack buttons, assumes you’re using the live version you see in this repository only
  • ai_ops/l4m-redshift-solution.yaml – In this template, a Jupyter notebook lifecycle configuration defines the repository to clone (deploys the custom connector)
  • sample_resources/redshift/l4m-redshift-sagemakernotebook.yaml – In this template, a Amazon SageMaker Notebook lifecycle configuration defines the repository to clone (deploys the production Amazon Redshift example).

Authenticate to Amazon Redshift

When exploring how to extend this into your own environment, the first thing to consider is the authentication to your Amazon Redshift cluster. You can accomplish this by using the Amazon Redshift Data API and by storing the credentials inside AWS Secrets Manager.

In Secrets Manager, this solution looks for the known secret name redshift-l4mintegration and contains a JSON structure like the following:

{
  "password": "DB_PASSWORD",
  "username": "DB_USERNAME",
  "dbClusterIdentifier": "REDSHIFT_CLUSTER_ID",
  "db": "DB_NAME",
  "host": "REDSHIFT_HOST",
  "port": 8192
}

If you want to use a different secret name than the one provided, you need to update the value in ai_ops/l4m-redshift-solution.yaml. If you want to change the other parameters’ names, you need to search for them in the repository and update their references accordingly.

Modify queries to Amazon Redshift

This solution uses the Amazon Redshift Data API to allow for queries that can be run asynchronously from the client calling for them.

Specifically, it allows a Lambda function to start a query with the database and then let the DB engine manage everything, including the writing of the data in a desired format to Amazon S3. Because we let the DB engine handle this, we simplify the operations of our Lambda functions and don’t have to worry about runtime limits. If you want to perform more complex transformations, you may want to build out more Step Functions-based AWS SAM applications to handle that work, perhaps even using Docker containers over Lambda.

For most modifications, you can edit the query files stored in the two Lambda functions provided:

Pay attention to the continuous crawl to make sure that the date ranges coincide with your desired detection interval. For example:

select ecommerce.ts as timestamp, ecommerce.views, ecommerce.revenue, platform.name as platform, marketplace.name as marketplace
from ecommerce, platform, marketplace
where ecommerce.platform = platform.id
	and ecommerce.marketplace = marketplace.id
    and ecommerce.ts < DATEADD(hour, 0, getdate())
    and ecommerce.ts > DATEADD(hour, -1, getdate())

The preceding code snippet is our demo continuous crawl function and uses the DATEADD function to compute data within the last hour. Coupled with the CloudWatch Events trigger that schedules this function for hourly, it allows us to stream data to Lookout for Metrics reliably.

The work defined in the query.sql files is only a portion of the final computed query. The full query is built by the respective Python files in each folder and appends the following:

  • IAM role for Amazon Redshift to use for the query
  • S3 bucket information for where to place the files
  • CSV file export defined

It looks like the following code:

unload ('select ecommerce.ts as timestamp, ecommerce.views, ecommerce.revenue, platform.name as platform, marketplace.name as marketplace
from ecommerce, platform, marketplace
where ecommerce.platform = platform.id
	and ecommerce.marketplace = marketplace.id
    and ecommerce.ts < DATEADD(hour, 0, getdate())
    and ecommerce.ts > DATEADD(hour, -1, getdate())') 
to 's3://BUCKET/ecommerce/live/20220112/1800/' 
iam_role 'arn:aws:iam::ACCOUNT_ID:role/custom-rs-connector-LookoutForMetricsRole-' header CSV;

As long as your prepared query can be encapsulated by the UNLOAD statement, it should work with no issues.

If you need to change the frequency for how often the continuous detector function runs, update the cron expression in ai_ops/l4m-redshift-continuous-crawl.yaml. It’s defined in the last line as Schedule: cron(0 * * * ? *).

Modify the Lookout for Metrics detector and dataset

The final components focus on Lookout for Metrics itself, mainly the detector and dataset configurations. They’re both defined in ai_ops/params.json.

The included file looks like the following code:

{
  "database_type": "redshift",  
  "detector_name": "l4m-custom-redshift-connector-detector",
    "detector_description": "A quick sample config of how to use L4M.",
    "detector_frequency": "PT1H",
    "timestamp_column": {
        "ColumnFormat": "yyyy-MM-dd HH:mm:ss",
        "ColumnName": "timestamp"
    },
    "dimension_list": [
        "platform",
        "marketplace"
    ],
    "metrics_set": [
        {
            "AggregationFunction": "SUM",
            "MetricName": "views"
        },
        {
            "AggregationFunction": "SUM",
            "MetricName": "revenue"
        }
    ],
    "metric_source": {
        "S3SourceConfig": {
            "FileFormatDescriptor": {
                "CsvFormatDescriptor": {
                    "Charset": "UTF-8",
                    "ContainsHeader": true,
                    "Delimiter": ",",
                    "FileCompression": "NONE",
                    "QuoteSymbol": "\""
                }
            },
            "HistoricalDataPathList": [
                "s3://id-ml-ops2-inputbucket-18vaudty8qtec/ecommerce/backtest/"
            ],
            "RoleArn": "arn:aws:iam::ACCOUNT_ID:role/id-ml-ops2-LookoutForMetricsRole-IZ5PL6M7YKR1",
            "TemplatedPathList": [
                    ""
                ]
        }
    },
    "s3_bucket": "",
    "alert_name": "alerter",
    "alert_threshold": 1,
    "alert_description": "Exports anomalies into s3 for visualization",
    "alert_lambda_arn": "",
    "offset": 300,
    "secret_name": "redshift-l4mintegration"
}

ai_ops/params.json manages the following parameters:

  • database_type
  • detector_name
  • detector_description
  • detector_frequency
  • timestamp_column and details
  • dimension_list
  • metrics_set
  • offset

Not every value can be defined statically ahead of time; these are updated by ai_ops/params_builder.py:

  • HistoricalDataPathList
  • RoleArn
  • TemplatedPathList
  • s3_bucket

To modify any of these entities, update the file responsible for them and your detector is modified accordingly.

Clean up

Follow the steps in this section to clean up all resources created by this solution and make sure you’re not billed after evaluating or using the solution.

  1. Empty all data from the S3 buckets that were created from their respective templates:
    1. ProductionRedshiftDemoS3ContentBucket
    2. CustomRedshiftConnectorS3LambdaBucket
    3. custom-rs-connectorInputBucket
  2. Delete your detector via the Lookout for Metrics console.
  3. Delete the CloudFormation stacks in the following order (wait for one to complete before moving onto the next):
    1. custom-rs-connector-crawl
    2. custom-rs-connector
    3. CustomRedshiftConnector
    4. ProductionRedshiftDemo

Conclusion

You have now seen how to connect an Amazon Redshift database to Lookout for Metrics using the native Amazon Redshift Data APIs, CloudWatch Events, and Lambda functions. This approach allows you to create relevant datasets based on your information in Amazon Redshift to perform anomaly detection on your time series data in just a few minutes. If you can draft the SQL query to obtain the information, you can enable ML-powered anomaly detection on your data. From there, your anomalies should showcase anomalous events and help you understand how one anomaly may be caused or impacted by others, thereby reducing your time to understanding issues critical to your business or workload.


About the Authors

Chris King is a Principal Solutions Architect in Applied AI with AWS. He has a special interest in launching AI services and helped grow and build Amazon Personalize and Amazon Forecast before focusing on Amazon Lookout for Metrics. In his spare time he enjoys cooking, reading, boxing, and building models to predict the outcome of combat sports.

Alex Kim is a Sr. Product Manager for Amazon Forecast. His mission is to deliver AI/ML solutions to all customers who can benefit from it. In his free time, he enjoys all types of sports and discovering new places to eat.

Query and visualize Amazon Redshift operational metrics using the Amazon Redshift plugin for Grafana

Post Syndicated from Sergey Konoplev original https://aws.amazon.com/blogs/big-data/query-and-visualize-amazon-redshift-operational-metrics-using-the-amazon-redshift-plugin-for-grafana/

Grafana is a rich interactive open-source tool by Grafana Labs for visualizing data across one or many data sources. It’s used in a variety of modern monitoring stacks, allowing you to have a common technical base and apply common monitoring practices across different systems. Amazon Managed Grafana is a fully managed, scalable, and secure Grafana-as-a-service solution developed by AWS in collaboration with Grafana Labs.

Amazon Redshift is the most widely used data warehouse in the cloud. You can view your Amazon Redshift cluster’s operational metrics on the Amazon Redshift console, use AWS CloudWatch, and query Amazon Redshift system tables directly from your cluster. The first two options provide a set of predefined general metrics and visualizations. The last one allows you to use the flexibility of SQL to get deep insights into the details of the workload. However, querying system tables requires knowledge of system table structures. To address that, we came up with a consolidated Amazon Redshift Grafana dashboard that visualizes a set of curated operational metrics and works on top of the Amazon Redshift Grafana data source. You can easily add it to an Amazon Managed Grafana workspace, as well as to any other Grafana deployments where the data source is installed.

This post guides you through a step-by-step process to create an Amazon Managed Grafana workspace and configure an Amazon Redshift cluster with a Grafana data source for it. Lastly, we show you how to set up the Amazon Redshift Grafana dashboard to visualize the cluster metrics.

Solution overview

The following diagram illustrates the solution architecture.

Architecture Diagram

The solution includes the following components:

  • The Amazon Redshift cluster to get the metrics from.
  • Amazon Managed Grafana, with the Amazon Redshift data source plugin added to it. Amazon Managed Grafana communicates with the Amazon Redshift cluster via the Amazon Redshift Data Service API.
  • The Grafana web UI, with the Amazon Redshift dashboard using the Amazon Redshift cluster as the data source. The web UI communicates with Amazon Managed Grafana via an HTTP API.

We walk you through the following steps during the configuration process:

  1. Configure an Amazon Redshift cluster.
  2. Create a database user for Amazon Managed Grafana on the cluster.
  3. Configure a user in AWS Single Sign-On (AWS SSO) for Amazon Managed Grafana UI access.
  4. Configure an Amazon Managed Grafana workspace and sign in to Grafana.
  5. Set up Amazon Redshift as the data source in Grafana.
  6. Import the Amazon Redshift dashboard supplied with the data source.

Prerequisites

To follow along with this walkthrough, you should have the following prerequisites:

  • An AWS account
  • Familiarity with the basic concepts of the following services:
    • Amazon Redshift
    • Amazon Managed Grafana
    • AWS SSO

Configure an Amazon Redshift cluster

If you don’t have an Amazon Redshift cluster, create a sample cluster before proceeding with the following steps. For this post, we assume that the cluster identifier is called redshift-demo-cluster-1 and the admin user name is awsuser.

  1. On the Amazon Redshift console, choose Clusters in the navigation pane.
  2. Choose your cluster.
  3. Choose the Properties tab.

Redshift Cluster Properties

To make the cluster discoverable by Amazon Managed Grafana, you must add a special tag to it.

  1. Choose Add tags. Redshift Cluster Tags
  2. For Key, enter GrafanaDataSource.
  3. For Value, enter true.
  4. Choose Save changes.

Redshift Cluster Tags

Create a database user for Amazon Managed Grafana

Grafana will be directly querying the cluster, and it requires a database user to connect to the cluster. In this step, we create the user redshift_data_api_user and apply some security best practices.

  1. On the cluster details page, choose Query data and Query in query editor v2.Query Editor v2
  2. Choose the redshift-demo-cluster-1 cluster we created previously.
  3. For Database, enter the default dev.
  4. Enter the user name and password that you used to create the cluster.
  5. Choose Create connection.Redshift SU
  6. In the query editor, enter the following statements and choose Run:
CREATE USER redshift_data_api_user PASSWORD '&lt;password&gt;' CREATEUSER;
ALTER USER redshift_data_api_user SET readonly TO TRUE;
ALTER USER redshift_data_api_user SET query_group TO 'superuser';

The first statement creates a user with superuser privileges necessary to access system tables and views (make sure to use a unique password). The second prohibits the user from making modifications. The last statement isolates the queries the user can run to the superuser queue, so they don’t interfere with the main workload.

In this example, we use service managed permissions in Amazon Managed Grafana and a workspace AWS Identity and Access Management (IAM) role as an authentication provider in the Amazon Redshift Grafana data source. We create the database user redshift_data_api_user using the AmazonGrafanaRedshiftAccess policy.

Configure a user in AWS SSO for Amazon Managed Grafana UI access

Two authentication methods are available for accessing Amazon Managed Grafana: AWS SSO and SAML. In this example, we use AWS SSO.

  1. On the AWS SSO console, choose Users in the navigation pane.
  2. Choose Add user.
  3. In the Add user section, provide the required information.

SSO add user

In this post, we select Send an email to the user with password setup instructions. You need to be able to access the email address you enter because you use this email further in the process.

  1. Choose Next to proceed to the next step.
  2. Choose Add user.

An email is sent to the email address you specified.

  1. Choose Accept invitation in the email.

You’re redirected to sign in as a new user and set a password for the user.

  1. Enter a new password and choose Set new password to finish the user creation.

Configure an Amazon Managed Grafana workspace and sign in to Grafana

Now you’re ready to set up an Amazon Managed Grafana workspace.

  1. On the Amazon Grafana console, choose Create workspace.
  2. For Workspace name, enter a name, for example grafana-demo-workspace-1.
  3. Choose Next.
  4. For Authentication access, select AWS Single Sign-On.
  5. For Permission type, select Service managed.
  6. Chose Next to proceed.AMG Workspace configure
  7. For IAM permission access settings, select Current account.AMG permission
  8. For Data sources, select Amazon Redshift.
  9. Choose Next to finish the workspace creation.Redshift to workspace

You’re redirected to the workspace page.

Next, we need to enable AWS SSO as an authentication method.

  1. On the workspace page, choose Assign new user or group.SSO new user
  2. Select the previously created AWS SSO user under Users and Select users and groups tables.SSO User

You need to make the user an admin, because we set up the Amazon Redshift data source with it.

  1. Select the user from the Users list and choose Make admin.
  2. Go back to the workspace and choose the Grafana workspace URL link to open the Grafana UI.AMG workspace
  3. Sign in with the user name and password you created in the AWS SSO configuration step.

Set up an Amazon Redshift data source in Grafana

To visualize the data in Grafana, we need to access the data first. To do so, we must create a data source pointing to the Amazon Redshift cluster.

  1. On the navigation bar, choose the lower AWS icon (there are two) and then choose Redshift from the list.
  2. For Regions, choose the Region of your cluster.
  3. Select the cluster from the list and choose Add 1 data source.Choose Redshift Cluster
  4. On the Provisioned data sources page, choose Go to settings.
  5. For Name, enter a name for your data source.
  6. By default, Authentication Provider should be set as Workspace IAM Role, Default Region should be the Region of your cluster, and Cluster Identifier should be the name of the chosen cluster.
  7. For Database, enter dev.
  8. For Database User, enter redshift_data_api_user.
  9. Choose Save & Test.Settings for Data Source

A success message should appear.

Data source working

Import the Amazon Redshift dashboard supplied with the data source

As the last step, we import the default Amazon Redshift dashboard and make sure that it works.

  1. In the data source we just created, choose Dashboards on the top navigation bar and choose Import to import the Amazon Redshift dashboard.Dashboards in the plugin
  2. Under Dashboards on the navigation sidebar, choose Manage.
  3. In the dashboards list, choose Amazon Redshift.

The dashboard appear, showing operational data from your cluster. When you add more clusters and create data sources for them in Grafana, you can choose them from the Data source list on the dashboard.

Clean up

To avoid incurring unnecessary charges, delete the Amazon Redshift cluster, AWS SSO user, and Amazon Managed Grafana workspace resources that you created as part of this solution.

Conclusion

In this post, we covered the process of setting up an Amazon Redshift dashboard working under Amazon Managed Grafana with AWS SSO authentication and querying from the Amazon Redshift cluster under the same AWS account. This is just one way to create the dashboard. You can modify the process to set it up with SAML as an authentication method, use custom IAM roles to manage permissions with more granularity, query Amazon Redshift clusters outside of the AWS account where the Grafana workspace is, use an access key and secret or AWS Secrets Manager based connection credentials in data sources, and more. You can also customize the dashboard by adding or altering visualizations using the feature-rich Grafana UI.

Because the Amazon Redshift data source plugin is an open-source project, you can install it in any Grafana deployment, whether it’s in the cloud, on premises, or even in a container running on your laptop. That allows you to seamlessly integrate Amazon Redshift monitoring into virtually all your existing Grafana-based monitoring stacks.

For more details about the systems and processes described in this post, refer to the following:


About the Authors

Sergey Konoplev is a Senior Database Engineer on the Amazon Redshift team. Sergey has been focusing on automation and improvement of database and data operations for more than a decade.

Milind Oke is a Data Warehouse Specialist Solutions Architect based out of New York. He has been building data warehouse solutions for over 15 years and specializes in Amazon Redshift.

Build a serverless pipeline to analyze streaming data using AWS Glue, Apache Hudi, and Amazon S3

Post Syndicated from Nikhil Khokhar original https://aws.amazon.com/blogs/big-data/build-a-serverless-pipeline-to-analyze-streaming-data-using-aws-glue-apache-hudi-and-amazon-s3/

Organizations typically accumulate massive volumes of data and continue to generate ever-exceeding data volumes, ranging from terabytes to petabytes and at times to exabytes of data. Such data is usually generated in disparate systems and requires an aggregation into a single location for analysis and insight generation. A data lake architecture allows you to aggregate data present in various silos, store it in a centralized repository, enforce data governance, and support analytics and machine learning (ML) on top of this stored data.

Typical building blocks to implement such an architecture include a centralized repository built on Amazon Simple Storage Service (Amazon S3) providing the least possible unit cost of storage per GB, big data ETL (extract, transform, and load) frameworks such as AWS Glue, and analytics using Amazon Athena, Amazon Redshift, and Amazon EMR notebooks.

Building such systems involves technical challenges. For example, data residing in S3 buckets can’t be updated in-place using standard data ingestion approaches. Therefore, you must perform constant ad-hoc ETL jobs to consolidate data into new S3 files and buckets.

This is especially the case with streaming sources, which require constant support for increasing data velocity to provide faster insights generation. An example use case might be an ecommerce company looking to build a real-time date lake. They need their solution to do the following:

  • Ingest continuous changes (like customer orders) from upstream systems
  • Capture tables into the data lake
  • Provide ACID properties on the data lake to support interactive analytics by enabling consistent views on data while new data is being ingested
  • Provide schema flexibility due to upstream data layout changes and provisions for late arrival of data

To deliver on these requirements, organizations have to build custom frameworks to handle in-place updates (also referred as upserts), handle small files created due to the continuous ingestion of changes from upstream systems (such as databases), handle schema evolution, and compromise on providing ACID guarantees on its data lake.

A processing framework like Apache Hudi can be a good way solve such challenges. Hudi allows you to build streaming data lakes with incremental data pipelines, with support for transactions, record-level updates, and deletes on data stored in data lakes. Hudi is integrated with various AWS analytics services, like AWS Glue, Amazon EMR, Athena, and Amazon Redshift. This helps you ingest data from a variety of sources via batch streaming while enabling in-place updates to an append-oriented storage system such as Amazon S3 (or HDFS). In this post, we discuss a serverless approach to integrate Hudi with a streaming use case and create an in-place updatable data lake on Amazon S3.

Solution overview

We use Amazon Kinesis Data Generator to send sample streaming data to Amazon Kinesis Data Streams. To consume this streaming data, we set up an AWS Glue streaming ETL job that uses the Apache Hudi Connector for AWS Glue to write ingested and transformed data to Amazon S3, and also creates a table in the AWS Glue Data Catalog.

After the data is ingested, Hudi organizes a dataset into a partitioned directory structure under a base path pointing to a location in Amazon S3. Data layout in these partitioned directories depends on the Hudi dataset type used during ingestion, such as Copy on Write (CoW) and Merge on Read (MoR). For more information about Hudi storage types, see Using Athena to Query Apache Hudi Datasets and Storage Types & Views.

CoW is the default storage type of Hudi. In this storage type, data is stored in columnar format (Parquet). Each ingestion creates a new version of files during a write. With CoW, each time there is an update to a record, Hudi rewrites the original columnar file containing the record with the updated values. Therefore, this is better suited for read-heavy workloads on data that changes less frequently.

The MoR storage type is stored using a combination of columnar (Parquet) and row-based (Avro) formats. Updates are logged to row-based delta files and are compacted to create new versions of columnar files. With MoR, each time there is an update to a record, Hudi writes only the row for the changed record into the row-based (Avro) format, which is compacted (synchronously or asynchronously) to create columnar files. Therefore, MoR is better suited for write or change-heavy workloads with a lesser amount of read.

For this post, we use the CoW storage type to illustrate our use case of creating a Hudi dataset and serving the same via a variety of readers. You can extend this solution to support MoR storage via selecting the specific storage type during ingestion. We use Athena to read the dataset. We also illustrate the capabilities of this solution in terms of in-place updates, nested partitioning, and schema flexibility.

The following diagram illustrates our solution architecture.

Create the Apache Hudi connection using the Apache Hudi Connector for AWS Glue

To create your AWS Glue job with an AWS Glue custom connector, complete the following steps:

  1. On the AWS Glue Studio console, choose Marketplace in the navigation pane.
  2. Search for and choose Apache Hudi Connector for AWS Glue.
  3. Choose Continue to Subscribe.

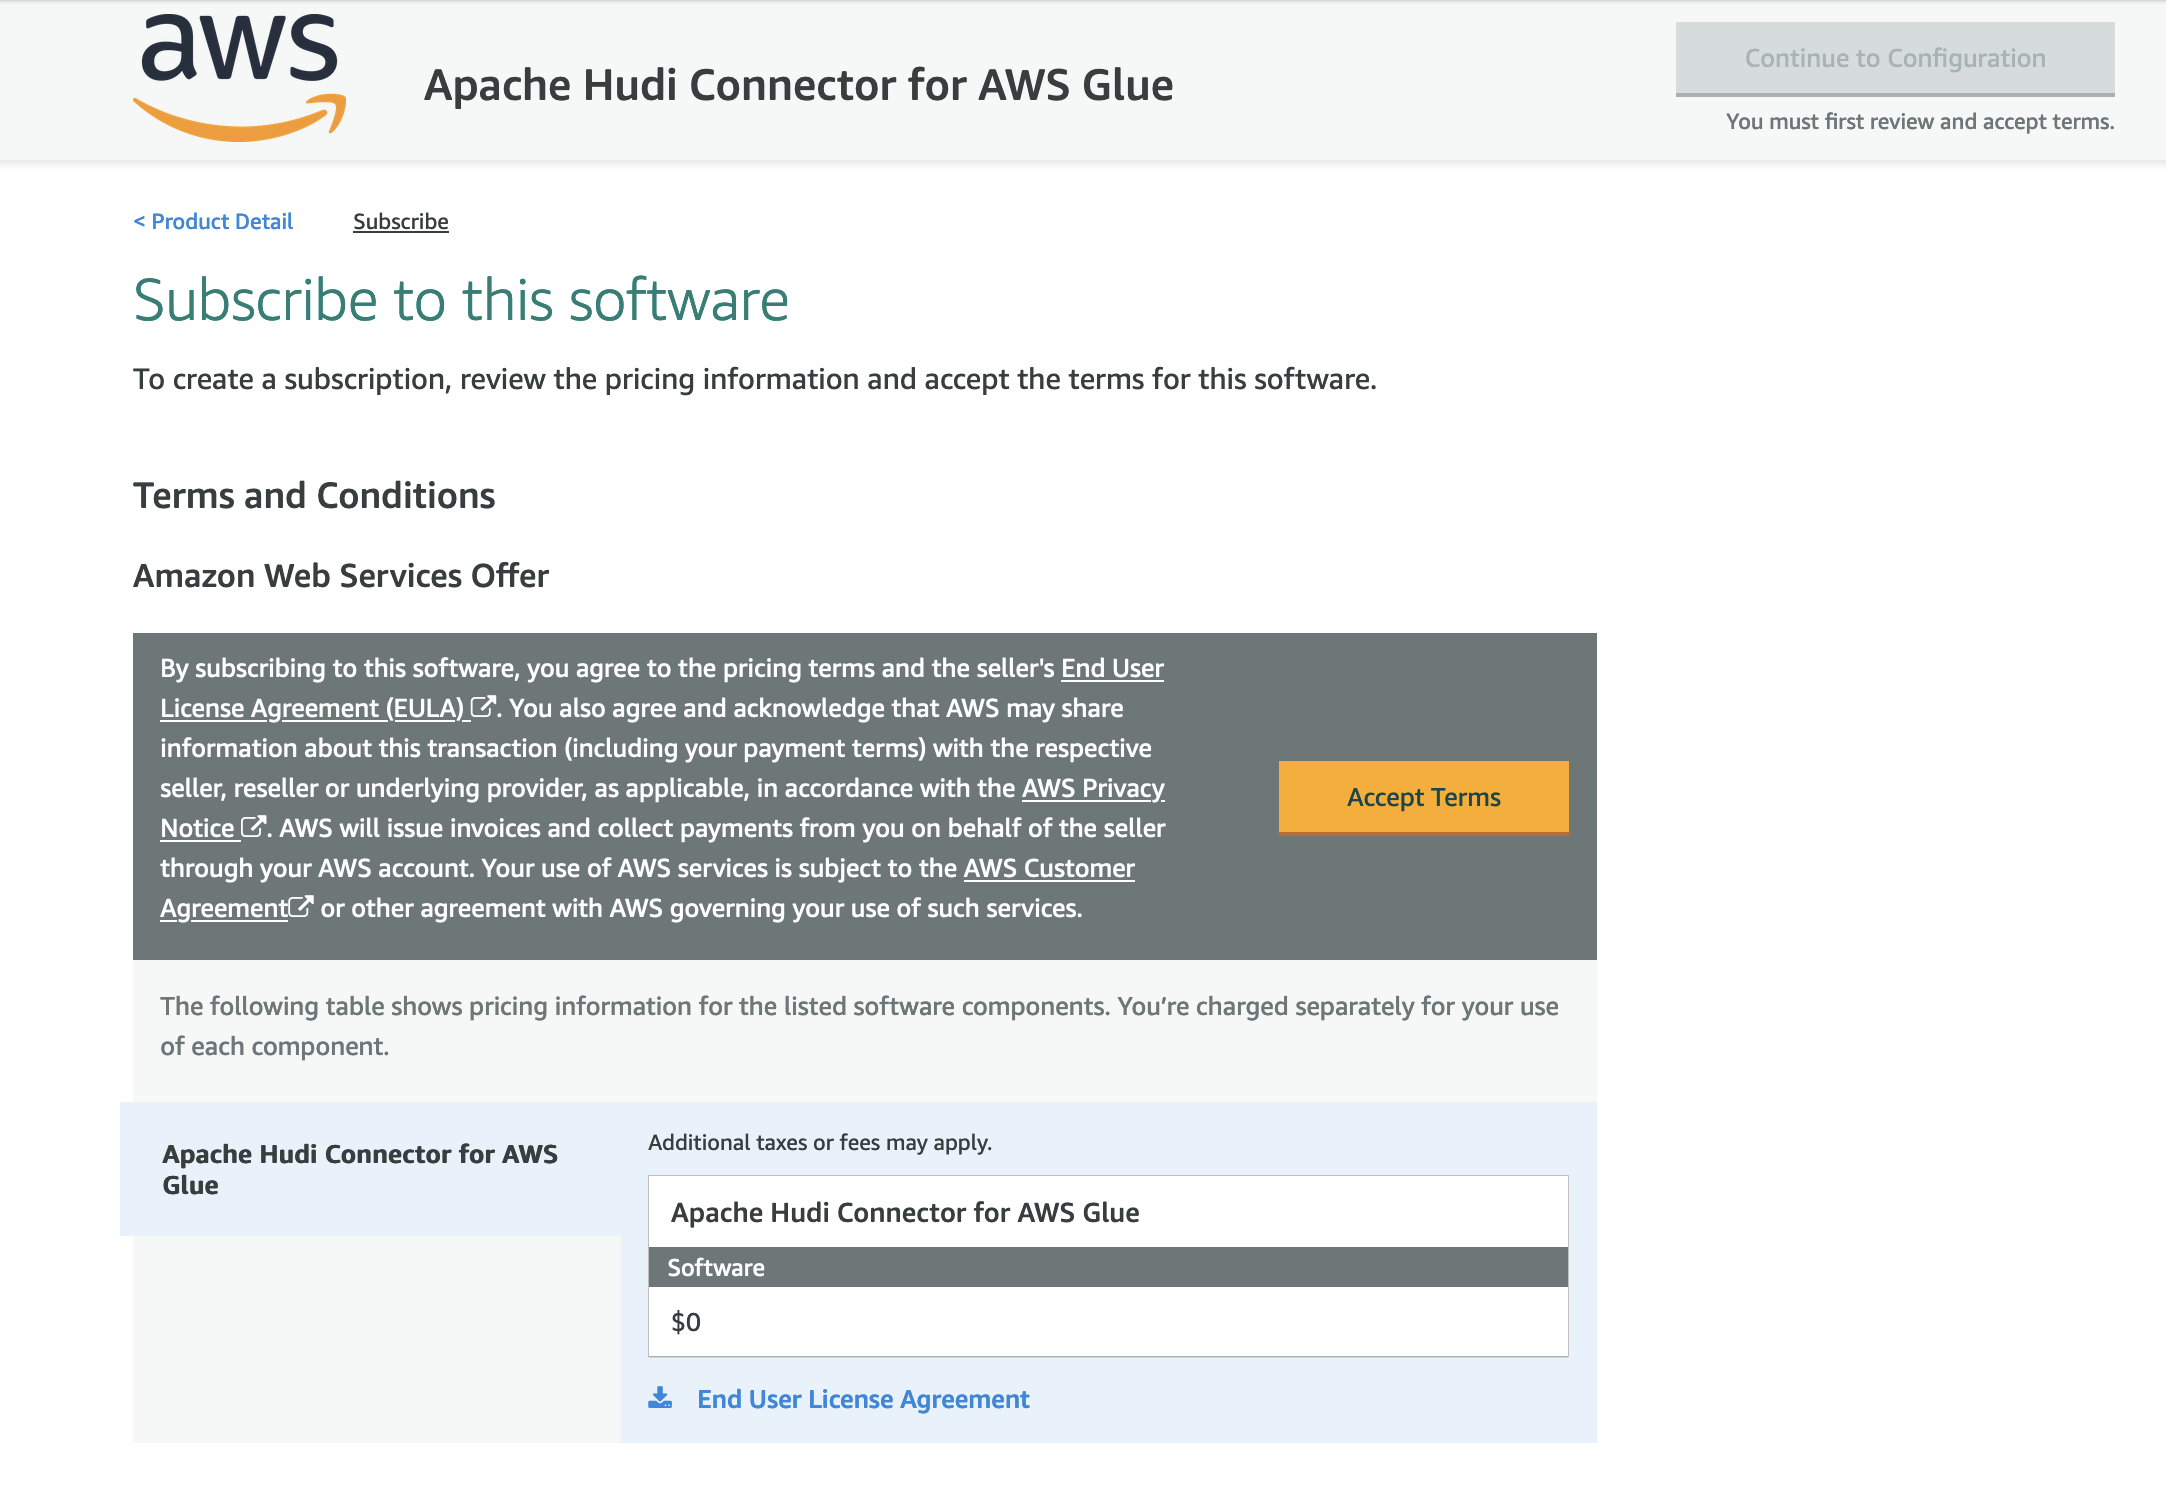
  4. Review the terms and conditions and choose Accept Terms.
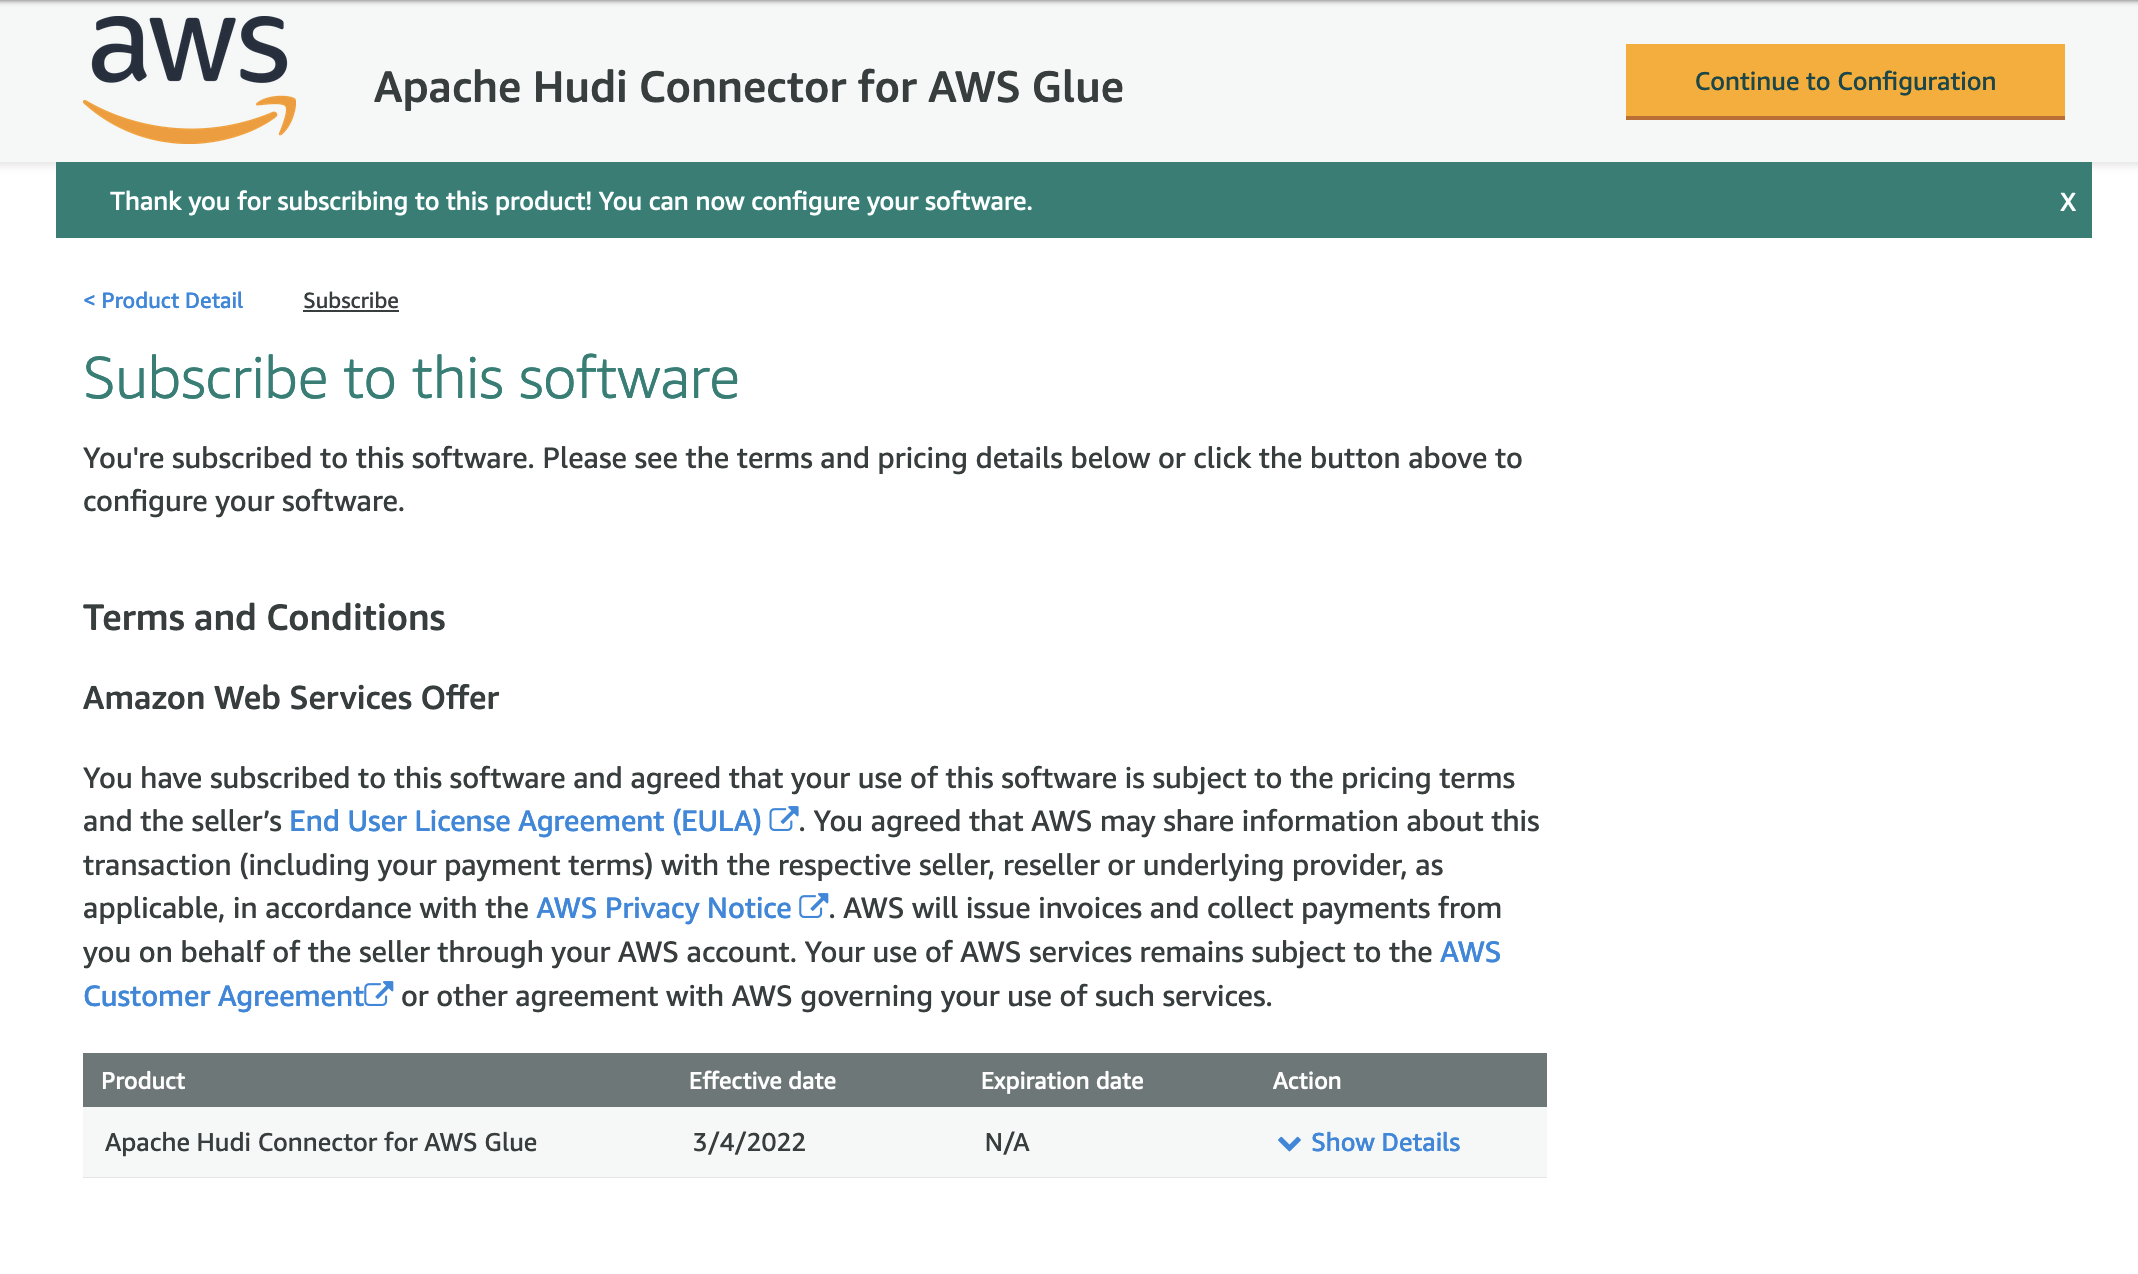
  5. Make sure that the subscription is complete and you see the Effective date populated next to the product, then choose Continue to Configuration.
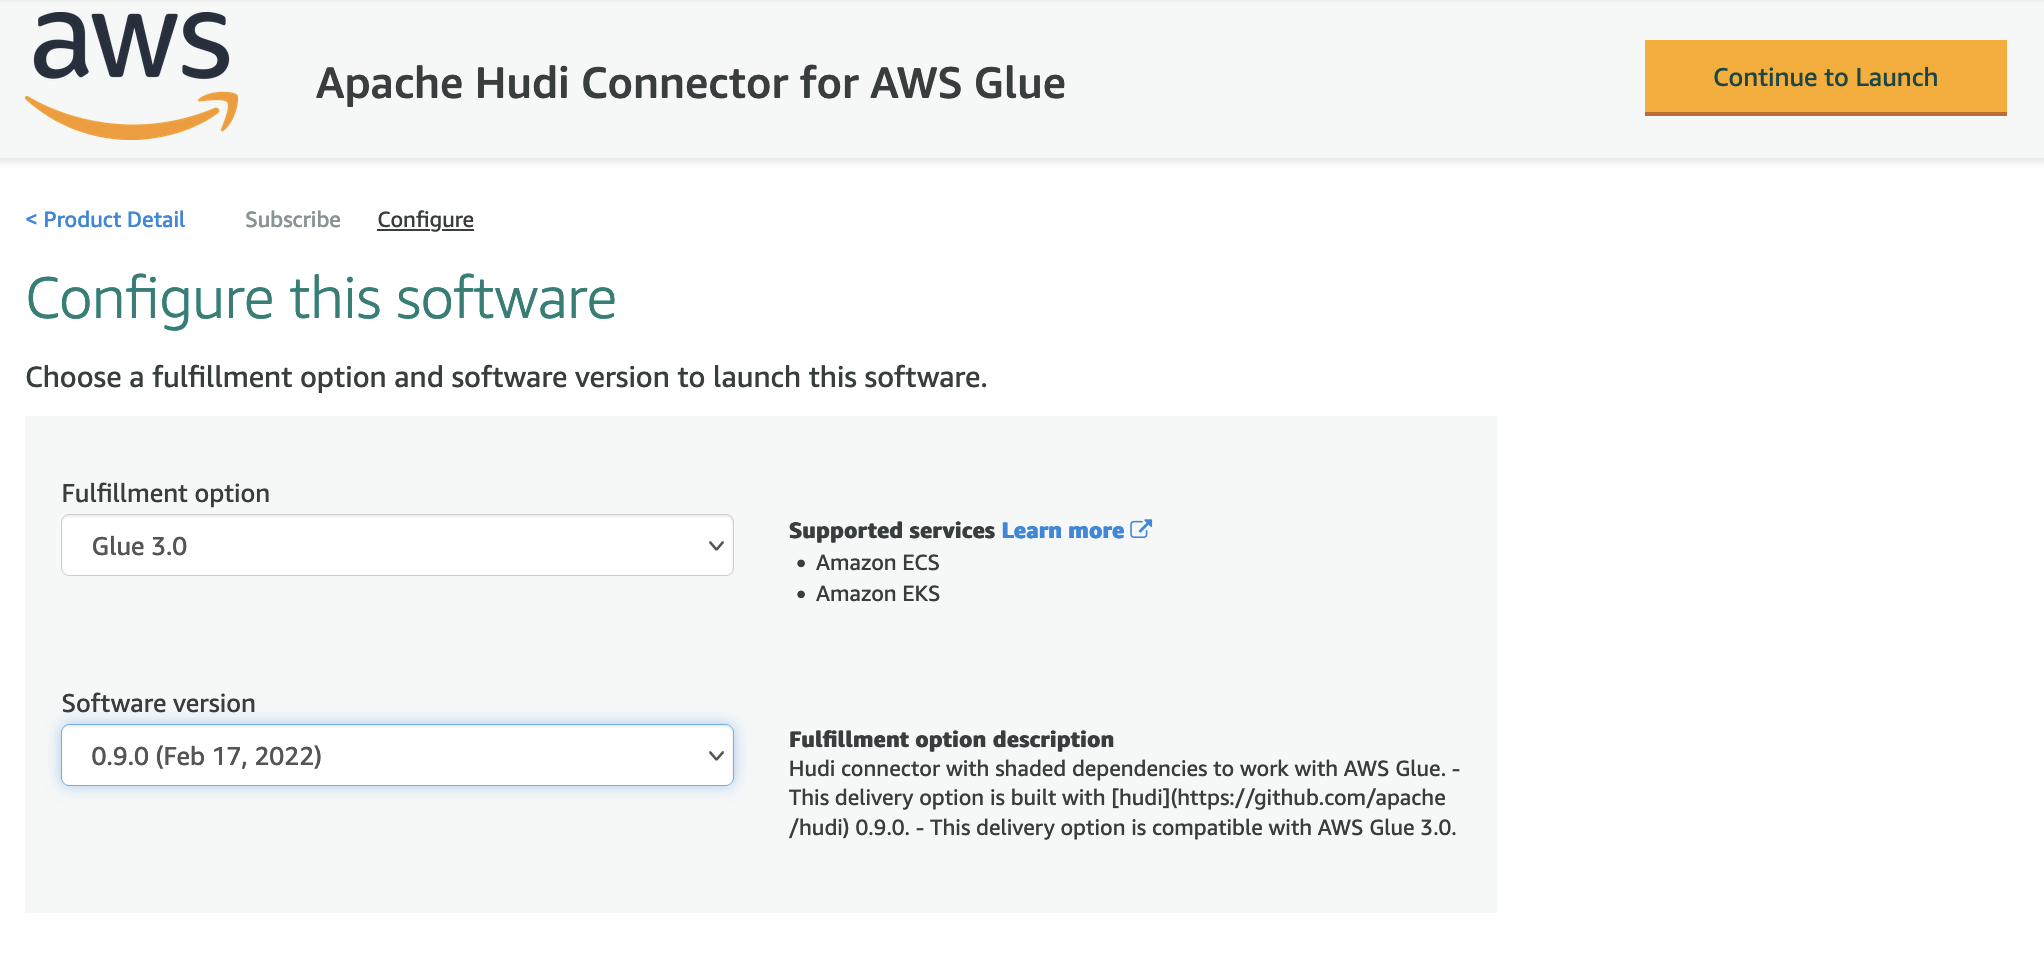
  6. For Delivery Method, choose Glue 3.0.
  7. For Software Version, choose the latest version (as of this writing, 0.9.0 is the latest version of the Apache Hudi Connector for AWS Glue).
  8. Choose Continue to Launch.
  9. Under Launch this software, choose Usage Instructions and then choose Activate the Glue connector for Apache Hudi in AWS Glue Studio.

You’re redirected to AWS Glue Studio.

  1. For Name, enter a name for your connection (for example, hudi-connection).
  2. For Description, enter a description.
  3. Choose Create connection and activate connector.

A message appears that the connection was successfully created, and the connection is now visible on the AWS Glue Studio console.

Configure resources and permissions

For this post, we provide an AWS CloudFormation template to create the following resources:

  • An S3 bucket named hudi-demo-bucket-<your-stack-id> that contains a JAR artifact copied from another public S3 bucket outside of your account. This JAR artifact is then used to define the AWS Glue streaming job.
  • A Kinesis data stream named hudi-demo-stream-<your-stack-id>.
  • An AWS Glue streaming job named Hudi_Streaming_Job-<your-stack-id> with a dedicated AWS Glue Data Catalog named hudi-demo-db-<your-stack-id>. Refer to the aws-samples github repository for the complete code of the job.
  • AWS Identity and Access Management (IAM) roles and policies with appropriate permissions.
  • AWS Lambda functions to copy artifacts to the S3 bucket and empty buckets first upon stack deletion.

To create your resources, complete the following steps:

  1. Choose Launch Stack:
  2. For Stack name, enter hudi-connector-blog-for-streaming-data.
  3. For HudiConnectionName, use the name you specified in the previous section.
  4. Leave the other parameters as default.
  5. Choose Next.
  6. Select I acknowledge that AWS CloudFormation might create IAM resources with custom names.
  7. Choose Create stack.

Set up Kinesis Data Generator

In this step, you configure Kinesis Data Generator to send sample data to a Kinesis data stream.

  1. On the Kinesis Data Generator console, choose Create a Cognito User with CloudFormation.

You’re redirected to the AWS CloudFormation console.

  1. On the Review page, in the Capabilities section, select I acknowledge that AWS CloudFormation might create IAM resources.
  2. Choose Create stack.
  3. On the Stack details page, in the Stacks section, verify that the status shows CREATE_COMPLETE.
  4. On the Outputs tab, copy the URL value for KinesisDataGeneratorUrl.
  5. Navigate to this URL in your browser.
  6. Enter the user name and password provided and choose Sign In.

Start an AWS Glue streaming job

To start an AWS Glue streaming job, complete the following steps:

  1. On the AWS CloudFormation console, navigate to the Resources tab of the stack you created.
  2. Copy the physical ID corresponding to the AWS::Glue::Job resource.
  3. On the AWS Glue Studio console, find the job name using the physical ID.
  4. Choose the job to review the script and job details.
  5. Choose Run to start the job.
  6. On the Runs tab, validate if the job is successfully running.

Send sample data to a Kinesis data stream

Kinesis Data Generator generates records using random data based on a template you provide. Kinesis Data Generator extends faker.js, an open-source random data generator.

In this step, you use Kinesis Data Generator to send sample data using a sample template using the faker.js documentation to the previously created data stream created at one record per second rate. You sustain the ingestion until the end of this tutorial to achieve reasonable data for analysis while performing the remaining steps.

  1. On the Kinesis Data Generator console, for Records per second, choose the Constant tab, and change the value to 1.
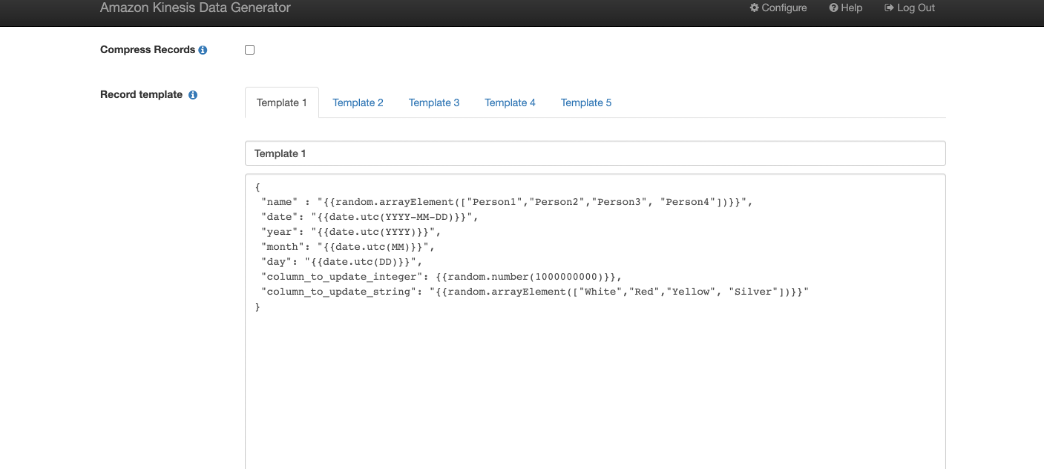
  2. For Record template, choose the Template 1 tab, and enter the following code sample into the text box:
    {
     "name" : "{{random.arrayElement(["Person1","Person2","Person3", "Person4"])}}",  
     "date": "{{date.utc(YYYY-MM-DD)}}",
     "year": "{{date.utc(YYYY)}}",
     "month": "{{date.utc(MM)}}",
     "day": "{{date.utc(DD)}}",
     "column_to_update_integer": {{random.number(1000000000)}},
     "column_to_update_string": "{{random.arrayElement(["White","Red","Yellow", "Silver"])}}" 
    }

  3. Choose Test template.
  4. Verify the structure of the sample JSON records and choose Close.
  5. Choose Send data.
  6. Leave the Kinesis Data Generator page open to ensure sustained streaming of random records into the data stream.

Continue through the remaining steps while you generate your data.

Verify dynamically created resources

While you’re generating data for analysis, you can verify the resources you created.

Amazon S3 dataset

When the AWS Glue streaming job runs, the records from the Kinesis data stream are consumed and stored in an S3 bucket. While creating Hudi datasets in Amazon S3, the streaming job can also create a nested partition structure. This is enabled through the usage of Hudi configuration properties hoodie.datasource.write.partitionpath.field and hoodie.datasource.write.keygenerator.class in the streaming job definition.

In this example, nested partitions have been created by name, year, month, and day. The values of these properties are set as follows in the script for the AWS Glue streaming job.

For further details on how CustomKeyGenerator works to generate such partition paths, refer to Apache Hudi Key Generators.

The following screenshot shows the nested partitions created in Amazon S3.

AWS Glue Data Catalog table

A Hudi table is also created in the AWS Glue Data Catalog and mapped to the Hudi datasets on Amazon S3. See the following code in the AWS Glue streaming job.

The following table provides more details on the configuration options.

hoodie.datasource.hive_sync.enable Indicates if the table is synced to Apache Hive Metastore.
hoodie.datasource.hive_sync.sync_as_datasource Avoids breaking changes introduced with HUDI-1415 (JIRA).
hoodie.datasource.hive_sync.database The database name for your Data Catalog.
hoodie.datasource.hive_sync.table The table name in your Data Catalog.
hoodie.datasource.hive_sync.use_jdbc Uses JDBC for Hive synchronization. For more information, see the GitHub repo.
hoodie.datasource.write.hive_style_partitioning Creates partitions with <partition_column_name>=<partition_value> format.
hoodie.datasource.hive_sync.partition_extractor_class Required for nested partitioning.
hoodie.datasource.hive_sync.partition_fields Columns in the table to use for Hive partition columns.

The following screenshot shows the Hudi table in the Data Catalog and the associated S3 bucket.

Read results using Athena

Using Hudi with an AWS Glue streaming job allows us to have in-place updates (upserts) on the Amazon S3 data lake. This functionality allows for incremental processing, which enables faster and more efficient downstream pipelines. Apache Hudi enables in-place updates with the following steps:

  1. Define an index (using columns of the ingested record).
  2. Use this index to map every subsequent ingestion to the record storage locations (in our case Amazon S3) ingested previously.
  3. Perform compaction (synchronously or asynchronously) to allow the retention of the latest record for a given index.

In reference to our AWS Glue streaming job, the following Hudi configuration options enable us to achieve in-place updates for the generated schema.

The following table provides more details of the highlighted configuration options.

hoodie.datasource.write.recordkey.field Indicates the column to be used within the ingested record for the Hudi index.
hoodie.datasource.write.operation Defines the nature of operation on the Hudi dataset. In this example, it’s set to upsert for in-place updates.
hoodie.datasource.write.table.type Indicates the Hudi storage type to be used. In this example, it’s set to COPY_ON_WRITE.
hoodie.datasource.write.precombine.field When two records have the same key value, Apache Hudi picks the one with the largest value for the precombined field.

To demonstrate an in-place update, consider the following input records sent to the AWS Glue streaming job via Kinesis Data Generator. The record identifier highlighted indicates the Hudi record key in the AWS Glue configuration. In this example, Person3 receives two updates. In first update, column_to_update_string is set to White; in the second update, it’s set to Red.

The streaming job processes these records and creates the Hudi datasets in Amazon S3. You can query the dataset using Athena. In the following example, we get the latest update.

Schema flexibility

The AWS Glue streaming job allows for automatic handling of different record schemas encountered during the ingestion. This is specifically useful in situations where record schemas can be subject to frequent changes. To elaborate on this point, consider the following scenario:

  • Case 1 – At time t1, the ingested record has the layout <col 1, col 2, col 3, col 4>
  • Case 2 – At time t2, the ingested record has an extra column, with new layout <col 1, col 2, col 3, col 4, col 5>
  • Case 3 – At time t3, the ingested record dropped the extra column and therefore has the layout <col 1, col 2, col 3, col 4>

For Case 1 and 2, the AWS Glue streaming job relies on the built-in schema evolution capabilities of Hudi, which enables an update to the Data Catalog with the extra column (col 5 in this case). Additionally, Hudi also adds an extra column in the output files (Parquet files written to Amazon S3). This allows for the querying engine (Athena) to query the Hudi dataset with an extra column without any issues.

Because Case 2 ingestion updates the Data Catalog, the extra column (col 5) is expected to be present in every subsequent ingested record. If we don’t resolve this difference, the job fails.

To overcome this and achieve Case 3, the streaming job defines a custom function named evolveSchema, which handles the record layout mismatches. The method queries the AWS Glue Data Catalog for each to-be-ingested record and gets the current Hudi table schema. It then merges the Hudi table schema with the schema of the to-be-ingested record and enriches the schema of the record before exposing with the Hudi dataset.

For this example, the to-be-ingested record’s schema <col 1, col 2, col 3, col 4> is modified to <col 1, col 2, col 3, col 4, col 5>, where the value of the extra col 5 is set to NULL.

To illustrate this, we stop the existing ingestion of Kinesis Data Generator and modify the record layout to send an extra column called new_column:

{
 "name" : "{{random.arrayElement(["Person1","Person2","Person3", "Person4"])}}",  
 "date": "{{date.utc(YYYY-MM-DD)}}",
 "year": "{{date.utc(YYYY)}}",
 "month": "{{date.utc(MM)}}",
 "day": "{{date.utc(DD)}}",
 "column_to_update_integer": {{random.number(1000000000)}},
 "column_to_update_string": "{{random.arrayElement(["White","Red","Yellow", "Silver"])}}",
 "new_column": "{{random.number(1000000000)}}" 
}

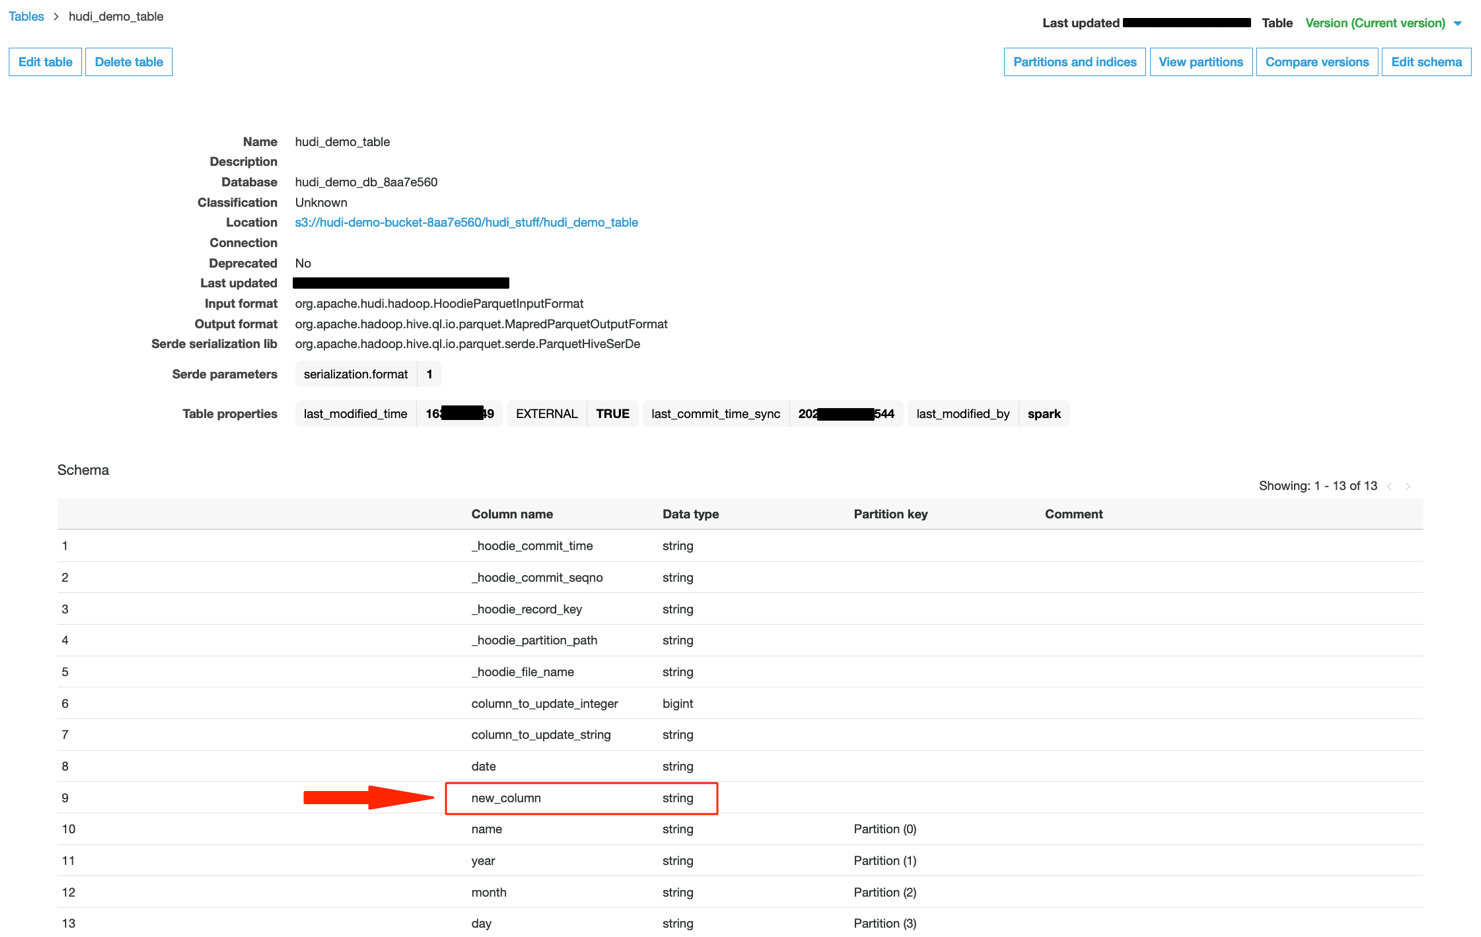
The Hudi table in the Data Catalog updates as follows, with the newly added column (Case 2).

When we query the Hudi dataset using Athena, we can see the presence of a new column.

We can now use Kinesis Data Generator to send records with an old schema—without the newly added column (Case 3).

In this scenario, our AWS Glue job keeps running. When we query using Athena, the extra added column gets populated with NULL values.

If we stop Kinesis Data Generator and start sending records with a schema containing extra columns, the job keeps running and the Athena query continues to return the latest values.

Clean up

To avoid incurring future charges, delete the resources you created as part of the CloudFormation stack.

Summary

This post illustrated how to set up a serverless pipeline using an AWS Glue streaming job with the Apache Hudi Connector for AWS Glue, which runs continuously and consumes data from Kinesis Data Streams to create a near-real-time data lake that supports in-place updates, nested partitioning, and schema flexibility.

You can also use Apache Kafka and Amazon Managed Streaming for Apache Kafka (Amazon MSK) as the source of a similar streaming job. We encourage you to use this approach for setting up a near-real-time data lake. As always, AWS welcomes feedback, so please leave your thoughts or questions in the comments.


About the Authors

Nikhil Khokhar is a Solutions Architect at AWS. He joined AWS in 2016 and specializes in building and supporting data streaming solutions that help customers analyze and get value out of their data. In his free time, he makes use of his 3D printing skills to solve everyday problems.

Dipta S Bhattacharya is a Solutions Architect Manager at AWS. Dipta joined AWS in 2018. He works with large startup customers to design and develop architectures on AWS and support their journey on the cloud.

Let’s Architect! Tools for Cloud Architects

Post Syndicated from Luca Mezzalira original https://aws.amazon.com/blogs/architecture/lets-architect-tools-for-cloud-architects/

This International Women’s Day, we’re featuring more than a week’s worth of posts that highlight female builders and leaders. We’re showcasing women in the industry who are building, creating, and, above all, inspiring, empowering, and encouraging everyone—especially women and girls—in tech.


A great way for cloud architects to learn is to experiment with the tools that our teams are using or could consider for the future. This allows us to learn new technologies, become familiar with the latest trends, and understand the entire cycle of our solutions.

Amazon Web Services (AWS) provides several tools for architects, including resources that can analyze your environment for creating a visual diagram and a community of builders who can answer your technical questions.

Today we’re excited to share  tools and methodologies that you should be aware of. In honor of the Architecture Blog’s International Women’s Day, half of these tools have been developed with and by women.

AWS Perspective

One of the main challenges for every architect is making sure their documentation is up to date. Recently, we’ve seen the rise of “architecture as code” tools for deriving architecture diagrams directly from the code in production.

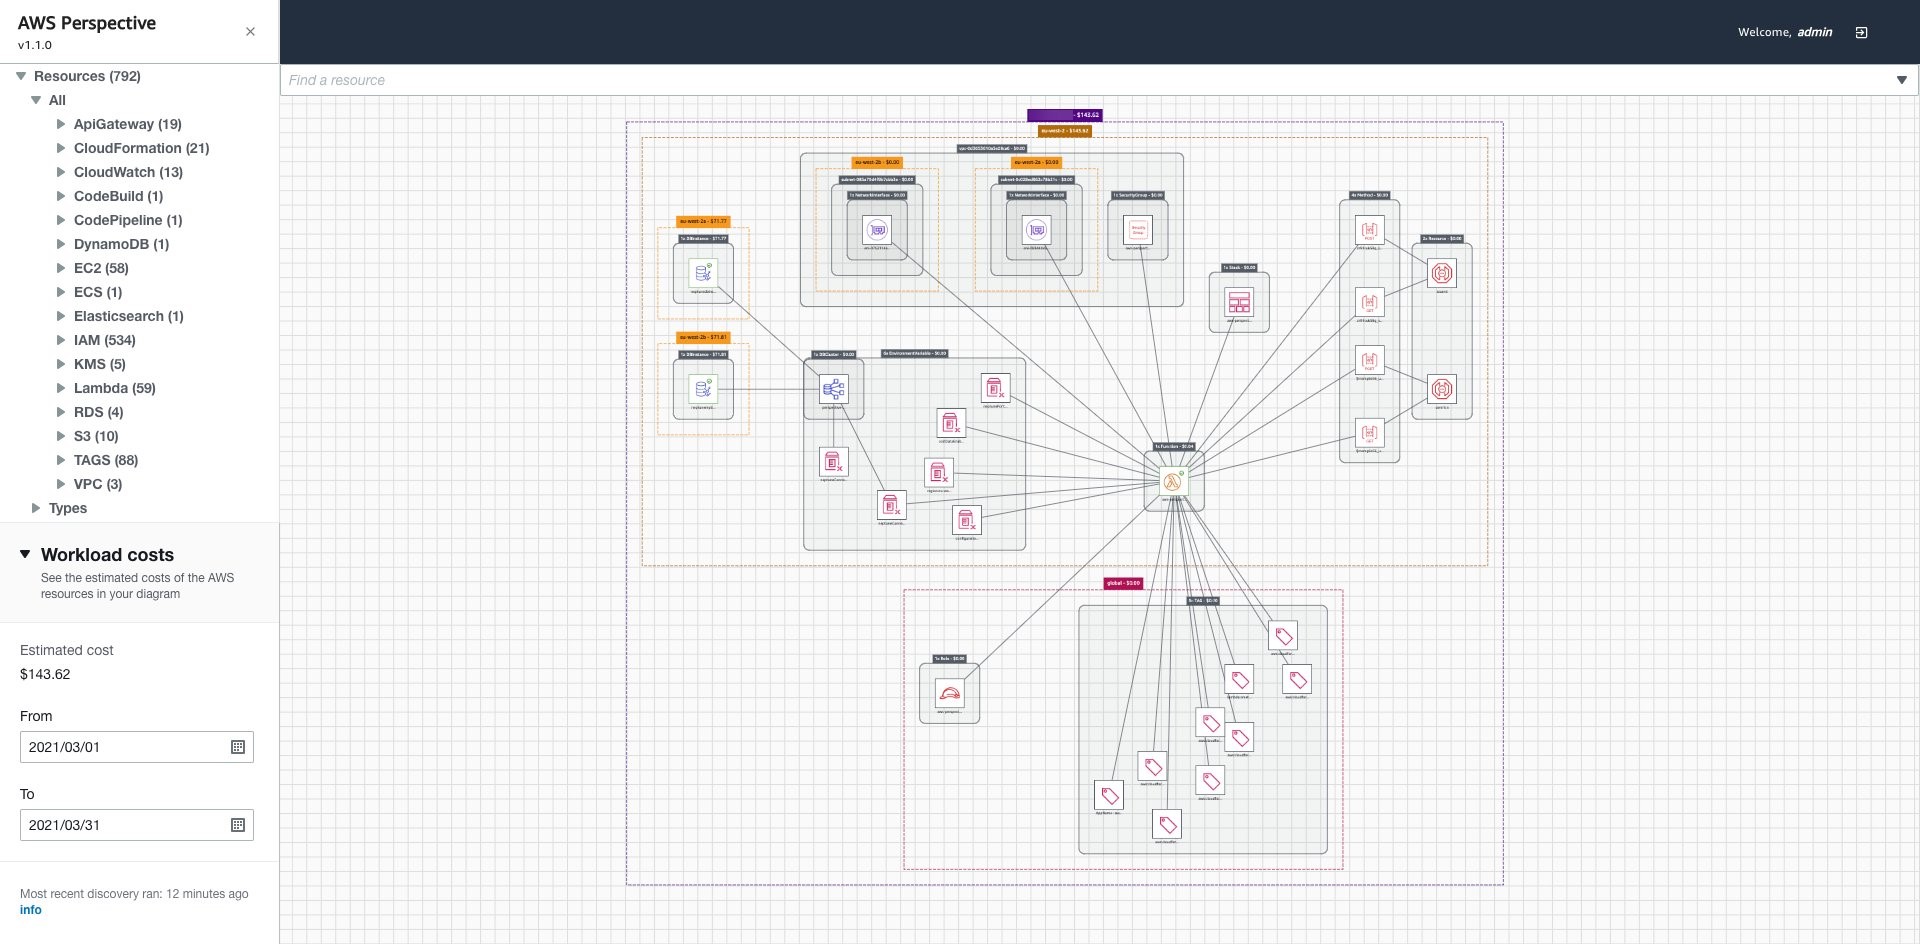
In that vein, AWS developed AWS Perspective, a diagramming tool solution that helps you represent your live workload.

AWS Perspective analyzes your environment and creates a diagram with all your cloud components

AWS Perspective analyzes your environment and creates a diagram with all your cloud components

Chaos Testing with AWS Fault Injection Simulator and AWS CodePipeline

Chaos engineering is the process of testing a distributed computing system to ensure that it can withstand unexpected disruptions.

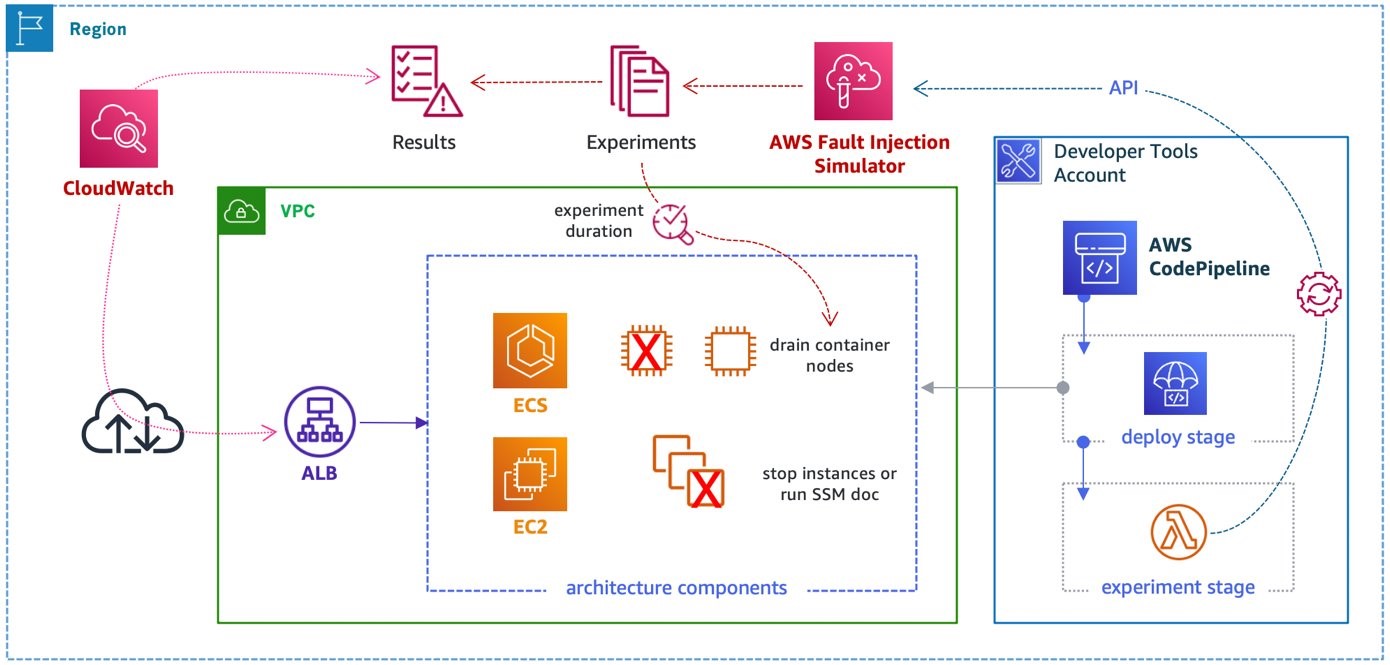
This blog post shows an architecture pattern for automating chaos testing as part of your continuous integration/continuous delivery (CI/CD) process. By automating the implementation of chaos experiments inside CI/CD pipelines, complex risks and modeled failure scenarios can be tested against application environments with every deployment

This high-level architecture shows how to automate chaos engineering in your environment

This high-level architecture shows how to automate chaos engineering in your environment

AWS re:Post – A Reimagined Q&A Experience for the AWS Community

Often when architecting we run into different design choices, issues, and roadblocks. What service should you use? What is the best way to implement this? Who do you ask?

AWS re:Post is a new question-and-answer service (think Stack Overflow specifically for AWS). It is monitored by the community who answers your questions, and then employees and official partners review these answers to ensure accuracy.

AWS re:Post is public. There is a wide community of AWS experts ready to answer your questions

AWS re:Post is public. There is a wide community of AWS experts ready to answer your questions

Establishing Feedback Loops Based on the AWS Well-Architected Framework Review

In 2018, AWS released the Well-Architected Framework, a mechanism for reviewing and/or improving your workloads that provides recommendations based on best practices in different areas such as security, costs optimization, or reliability. This article shows you how to improve iteratively your systems in the cloud using the Well-Architected Framework.

Creating a healthy feedback loop will enhance your architecture over time

Creating a healthy feedback loop will enhance your architecture over time

See you next time!

Thanks for reading! If you’re looking for more ways tools to architect your workload, check out the AWS Architecture Center.

See you in a couple of weeks when we discuss blockchain!

Other posts in this series

3 Reasons to Join Rapid7’s Cloud Security Summit

Post Syndicated from Ben Austin original https://blog.rapid7.com/2022/03/09/3-reasons-to-join-rapid7s-cloud-security-summit/

3 Reasons to Join Rapid7’s Cloud Security Summit

The world of the cloud never stops moving — so neither can cloud security. In the face of rapidly evolving technology and a constantly changing threat landscape, keeping up with all the latest developments, trends, and best practices in this emerging practice is more vital than ever.

Enter Rapid7’s third annual Cloud Security Summit, which we’ll be hosting this year on Tuesday, March 29. This one-day virtual event is dedicated to cloud security best practices and will feature industry experts from Rapid7, as well as Amazon Web Services (AWS), Snyk, and more.

While the event is fully virtual and free, we know that the time commitment can be the most challenging part of attending a multi-hour event during the workday. With that in mind, we’ve compiled a short list of the top reasons you’ll definitely want to register, clear your calendar, and attend this event.

Reason 1: Get a sneak peak at some original cloud security research

During the opening session of this year’s summit, two members of Rapid7’s award-winning security research team will be presenting some never-before-published research on the current state of cloud security operations, the most common misconfigurations in 2021, Log4j, and more.

Along with being genuinely interesting data, this research will also give you some insights and benchmarks that will help you evaluate your own cloud security program, and prioritize the most commonly exploited risks in your organization’s environment.

Reason 2: Learn from industry experts, and get CPE credits

Along with a handful of team member’s from Rapid7’s own cloud security practice, this year’s summit includes a host of subject matter experts from across the industry. You can look forward to hearing from Merritt Baer, Principal in the Office of the CISO at Amazon Web Services; Anthony Seto, Field Director for Cloud Native Application Security at Snyk; Keith Hoodlet, Code Security Architect at GitHub; and more. And that doesn’t even include the InsightCloudSec customers who will be joining to share their expert perspectives as well.

While learning and knowledge gain are clearly the most important aspects here, it’s always great to have something extra to show for the time you devoted to an event like this. To help make the case to your management that this event is more than worth the time you’ll put in, we’ve arranged for all attendees to earn 3.5 continuing professional education (CPE) credits to go toward maintaining or upgrading security certifications, such as CISSP, CISM, and more.

Reason 3: Be the first to hear exciting Rapid7 announcements

Last but not least, while the event is primarily focused on cloud security research, strategies, and thought leadership, we are also planning to pepper in some exciting news related to InsightCloudSec, Rapid7’s cloud-native security platform.

We’ll end the day with a demonstration of the product, so you can see some of our newest capabilities in action. Whether you’re already an InsightCloudSec customer, or considering a new solution for uncovering misconfigurations, automating cloud security workflows, shifting left, and more, this is the best way to get a live look at one of the top solutions available in the market today.  

So what are you waiting for? Come join us, and let’s dive into the latest and greatest in cloud security together.

Join our 2022 Cloud Security Summit

Register Now

Additional reading

Today’s Spectre variant: branch history injection

Post Syndicated from original https://lwn.net/Articles/887326/

A few days prior to the expected 5.17 release, the mainline kernel has just
received a series of Spectre mitigations for the x86 and ARM architectures.
The vulnerability this time is called “branch history injection”; it has
been deemed CVE-2022-0001 and CVE-2022-0002. Some information can be found
in this
Intel disclosure
, this
ARM advisory
, and this VUSec page:

Branch History Injection (BHI or Spectre-BHB) is a new flavor of
Spectre-v2 in that it can circumvent eIBRS and CSV2 to simplify
cross-privilege mistraining. The hardware mitigations do prevent
the unprivileged attacker from injecting predictor entries for the
kernel. However, the predictor relies on a global history to select
the target entries to speculatively execute. And the attacker can
poison this history from userland to force the kernel to mispredict
to more “interesting” kernel targets (i.e., gadgets) that leak
data.

According to a
documentation patch
merged into the mainline, the only known way to
exploit this problem is via unprivileged BPF.

Composing AWS Step Functions to abstract polling of asynchronous services

Post Syndicated from James Beswick original https://aws.amazon.com/blogs/compute/composing-aws-step-functions-to-abstract-polling-of-asynchronous-services/

This post is written by Nicolas Jacob Baer, Senior Cloud Application Architect, Goeksel Sarikaya, Senior Cloud Application Architect, and Shukhrat Khodjaev, Engagement Manager, AWS ProServe.

AWS Step Functions workflows can use the three main integration patterns when calling AWS services. A common integration pattern is to call a service and wait for a response before proceeding to the next step.

While this works well with AWS services, there is no built-in support for third-party, on-premises, or custom-built services running on AWS. When a workflow integrates with such a service in an asynchronous fashion, it requires a primary step to invoke the service. There are additional steps to wait and check the result, and handle possible error scenarios, retries, and fallbacks.

Although this approach may work well for small workflows, it does not scale to multiple interactions in different steps of the workflow and becomes repetitive. This may result in a complex workflow, which makes it difficult to build, test, and modify. In addition, large workflows with many repeated steps are more difficult to troubleshoot and understand.

This post demonstrates how to decompose the custom service integration by nesting Step Functions workflows. One basic workflow is dedicated to handling the asynchronous communication that offers modularity. It can be re-used as a building block. Another workflow is used to handle the main process by invoking the nested workflow for service interaction, where all the repeated steps are now hidden in multiple executions of the nested workflow.

Overview

Consider a custom service that provides an asynchronous interface, where an action is initially triggered by an API call. After a few minutes, the result is available to be polled by the caller. The following diagram shows a basic workflow interacting with this custom service that encapsulates the service communication in a workflow:

Workflow diagram

  1. Call Custom Service API – calls a custom service, in this case through an API. Potentially, this could use a service integration or use AWS Lambda if there is custom code.
  2. Wait – waits for the service to prepare a result. This depends on the service that the workflow is interacting with, and could vary from seconds to days to months.
  3. Poll Result – attempts to poll the result from the custom service.
  4. Choice – repeats the polling in case the result was not available yet, move on to failed or success state if result was retrieved. In addition, a timeout should be in place here in case the result is not available within the expected time range. Otherwise, this might lead to an infinite loop.
  5. Fail – fails the workflow if a timeout or a threshold for the number of retries with error conditions is reached.
  6. Transform Result – transforms the result or adds additional meta information to provide further information to the caller (for example, runtime or retries).
  7. Success – finishes the workflow successfully.

If you build a larger workflow that interacts with this custom service in multiple steps in a workflow, you can reduce the complexity by using the Step Functions integration to call the nested workflow with a Wait state.

An illustration of this can be found in the following diagram, where the nested stack is called three times sequentially. Likewise, you can build a more complex workflow that adds additional logic through more steps or interacts with a custom service in parallel. The polling logic is hidden in the nested workflow.

Nested workflow

Walkthrough

To get started with AWS Step Functions and Amazon API Gateway using the AWS Management Console:

  1. Go to AWS Step Functions in the AWS Management Console.
  2. Choose Run a sample project and choose Start a workflow within a workflow.
    Defining state machine
  3. Scroll down to the sample projects, which are defined using Amazon States Language (ASL).
    Definition
  4. Review the example definition, then choose Next.
  5. Choose Deploy resources. The deployment can take up to 10 minutes. After deploying the resources, you can edit the sample ASL code to define steps in the state machine.
    Deploy resources
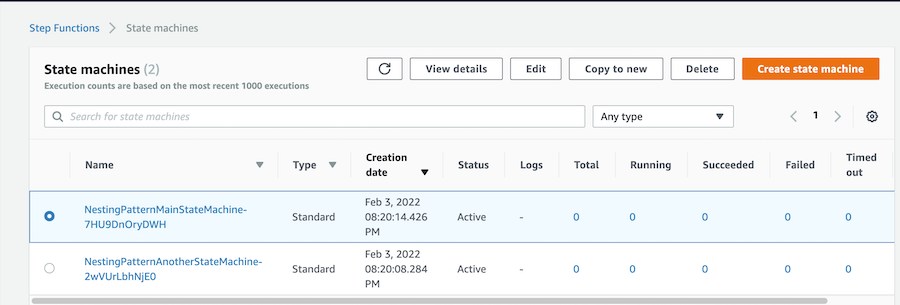
  6. The deployment creates two state machines: NestingPatternMainStateMachine and NestingPatternAnotherStateMachine. NestingPatternMainStateMachine orchestrates the other nested state machines sequentially or in parallel.
    Two state machines
  7. Select a state machine, then choose Edit to edit the workflow. In the NestingPatternMainStateMachine, the first state triggers the nested workflow NestingPatternAnotherStateMachine. You can pass necessary parameters to the nested workflow by using Parameters and Input as shown in the example below with Parameter1 and Parameter2. Once the first nested workflow completes successfully, the second nested workflow is triggered. If the result of the first nested workflow is not successful, the NestingPatternMainStateMachine fails with the Fail state.
    Editing state machine
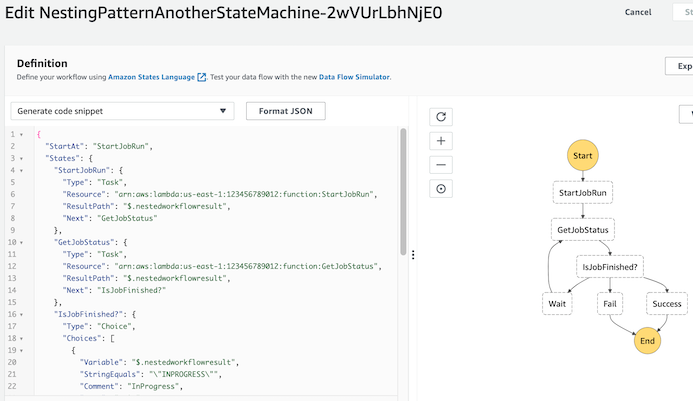
  8. Select nested workflow NestingPatternAnotherStateMachine, and then select Edit to add AWS Lambda functions to start a job and poll the state of the jobs. This can be any asynchronous job that needs to be polled to query its state. Based on expected job duration, the Wait state can be configured for 10-20 seconds. If the workflow is successful, the main workflow returns a successful result.
    Edited next state machine

Use cases and limitations

This approach allows encapsulation of workflows consisting of multiple sequential or parallel services. Therefore, it provides flexibility that can be used for different use cases. Services can be part of distributed applications, part of automated business processes, big data or machine learning pipelines using AWS services.

Each nested workflow is responsible for an individual step in the main workflow, providing flexibility and scalability. Hundreds of nested workflows can run and be monitored in parallel with the main workflow (see AWS Step Functions Service Quotas).

The approach described here is not applicable for custom service interactions faster than 1 second, since it is the minimum configurable value for a wait step.

Nested workflow encapsulation

Similar to the principle of encapsulation in object-oriented programming, you can use a nested workflow for different interactions with a custom service. You can dynamically pass input parameters to the nested workflow during workflow execution and receive return values. This way, you can define a clear interface between the nested workflow and the parent workflow with different actions and integrations. Depending on the use-case, a custom service may offer a variety of different actions that must be integrated into workflows that run in Step Functions, but can all be combined into a single workflow.

Debugging and tracing

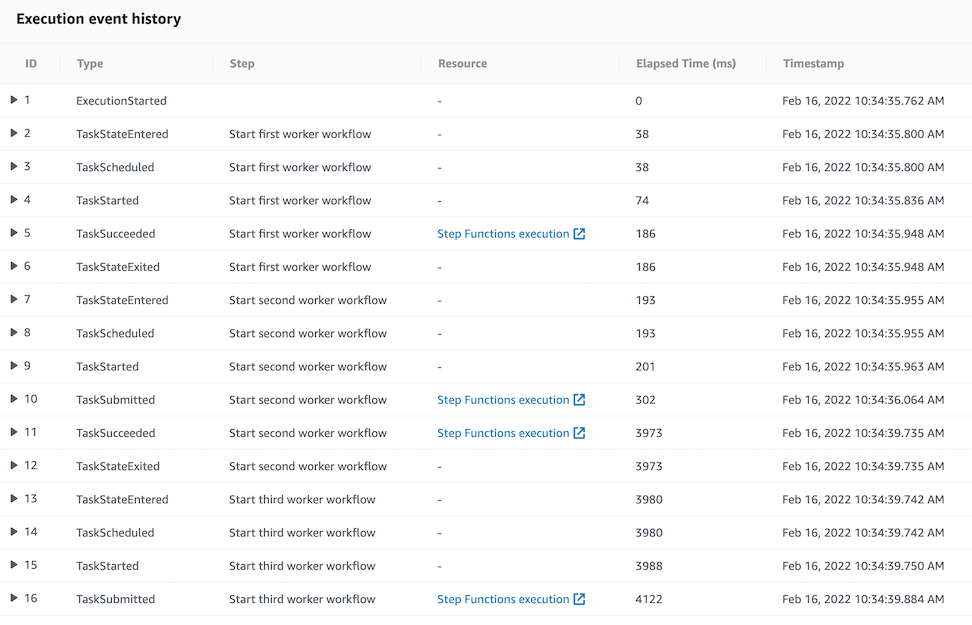
Additionally, debugging and tracing can be done through Execution Event History in the State Machine Management Console. In the Resource column, you can find a link to the executed nested step function. It can be debugged in case of any error in the nested Step Functions workflow.

Execution event history

However, debugging can be challenging in case of multiple parallel nested workflows. In such cases, AWS X-Ray can be enabled to visualize the components of a state machine, identify performance bottlenecks, and troubleshoot requests that have led to an error.

To enable AWS X-Ray in AWS Step Functions:

  1. Open the Step Functions console and choose Edit state machine.
  2. Scroll down to Tracing settings, and Choose Enable X-Ray tracing.

Tracing

For detailed information regarding AWS X-Ray and AWS Step Functions please refer to the following documentation: https://docs.aws.amazon.com/step-functions/latest/dg/concepts-xray-tracing.html

Conclusion

This blog post describes how to compose a nested Step Functions workflow, which asynchronously manages a custom service using the polling mechanism.

To learn more about how to use AWS Step Functions workflows for serverless microservices orchestration, visit Serverless Land.

2 New Mozilla Firefox 0-Day Bugs Under Active Attack (The Hacker News)

Post Syndicated from original https://lwn.net/Articles/887316/

According to this
report on The Hacker News
, there are a couple of recent Firefox
vulnerabilities that are currently being exploited.

Tracked as CVE-2022-26485 and CVE-2022-26486, the zero-day flaws
have been described as use-after-free issues impacting the
Extensible Stylesheet Language Transformations (XSLT) parameter
processing and the WebGPU inter-process communication (IPC)
Framework.

Updating seems like a good idea.

Security updates for Wednesday

Post Syndicated from original https://lwn.net/Articles/887309/

Security updates have been issued by Debian (kernel, linux-4.19, spip, and thunderbird), Fedora (cyrus-sasl and libxml2), Mageia (firefox and thunderbird), openSUSE (buildah and tcpdump), Red Hat (cyrus-sasl, kernel, kernel-rt, and kpatch-patch), Slackware (kernel), SUSE (buildah, kernel, libcaca, and tcpdump), and Ubuntu (linux, linux-aws, linux-aws-5.13, linux-azure, linux-azure-5.13, linux-gcp, linux-gcp-5.13, linux-hwe-5.13, linux-kvm, linux-oem-5.14, linux-oracle, linux-oracle-5.13, linux-raspi, linux, linux-aws, linux-aws-5.4, linux-azure, linux-azure-5.4, linux-azure-fde, linux-bluefield, linux-gcp, linux-gcp-5.4, linux-gke, linux-gke-5.4, linux-gkeop, linux-gkeop-5.4, linux-hwe-5.4, linux-ibm, linux-ibm-5.4, linux-kvm, linux-oracle, linux-oracle-5.4, linux-raspi, linux-raspi-5.4, and linux, linux-aws, linux-aws-hwe, linux-azure, linux-azure-4.15, linux-dell300x, linux-gcp, linux-gcp-4.15, linux-hwe, linux-kvm, ilinux-lts-xenial, linux-oracle, linux-raspi2, linux-snapdragon).

Fraud on Zelle

Post Syndicated from Bruce Schneier original https://www.schneier.com/blog/archives/2022/03/fraud-on-zelle.html

Zelle is rife with fraud:

Zelle’s immediacy has also made it a favorite of fraudsters. Other types of bank transfers or transactions involving payment cards typically take at least a day to clear. But once crooks scare or trick victims into handing over money via Zelle, they can siphon away thousands of dollars in seconds. There’s no way for customers — and in many cases, the banks themselves — to retrieve the money.

[…]

It’s not clear who is legally liable for such losses. Banks say that returning money to defrauded customers is not their responsibility, since the federal law covering electronic transfers — known in the industry as Regulation E ­– requires them to cover only “unauthorized” transactions, and the fairly common scam that Mr. Faunce fell prey to tricks people into making the transfers themselves. Victims say because they were duped into sending the money, the transaction is unauthorized. Regulatory guidance has so far been murky.

When swindled customers, already upset to find themselves on the hook, search for other means of redress, many are enraged to find out that Zelle is owned and operated by banks.

[…]

The Zelle network is operated by Early Warning Services, a company created and owned by seven banks: Bank of America, Capital One, JPMorgan Chase, PNC, Truist, U.S. Bank and Wells Fargo. Early Warning, based in Scottsdale, Ariz., manages the system’s technical infrastructure. But the 1,425 banks and credit unions that use Zelle can customize the app and add their own security settings.

DNSSEC issues take Fiji domains offline

Post Syndicated from David Belson original https://blog.cloudflare.com/dnssec-issues-fiji/

DNSSEC issues take Fiji domains offline

DNSSEC issues take Fiji domains offline

On the morning of March 8, a post to Hacker News stated that “All .fj domains have gone offline”, listing several hostnames in domains within the Fiji top level domain (known as a ccTLD) that had become unreachable. Commenters in the associated discussion thread had mixed results in being able to reach .fj hostnames—some were successful, while others saw failures. The fijivillage news site also highlighted the problem, noting that the issue also impacted Vodafone’s M-PAiSA app/service, preventing users from completing financial transactions.

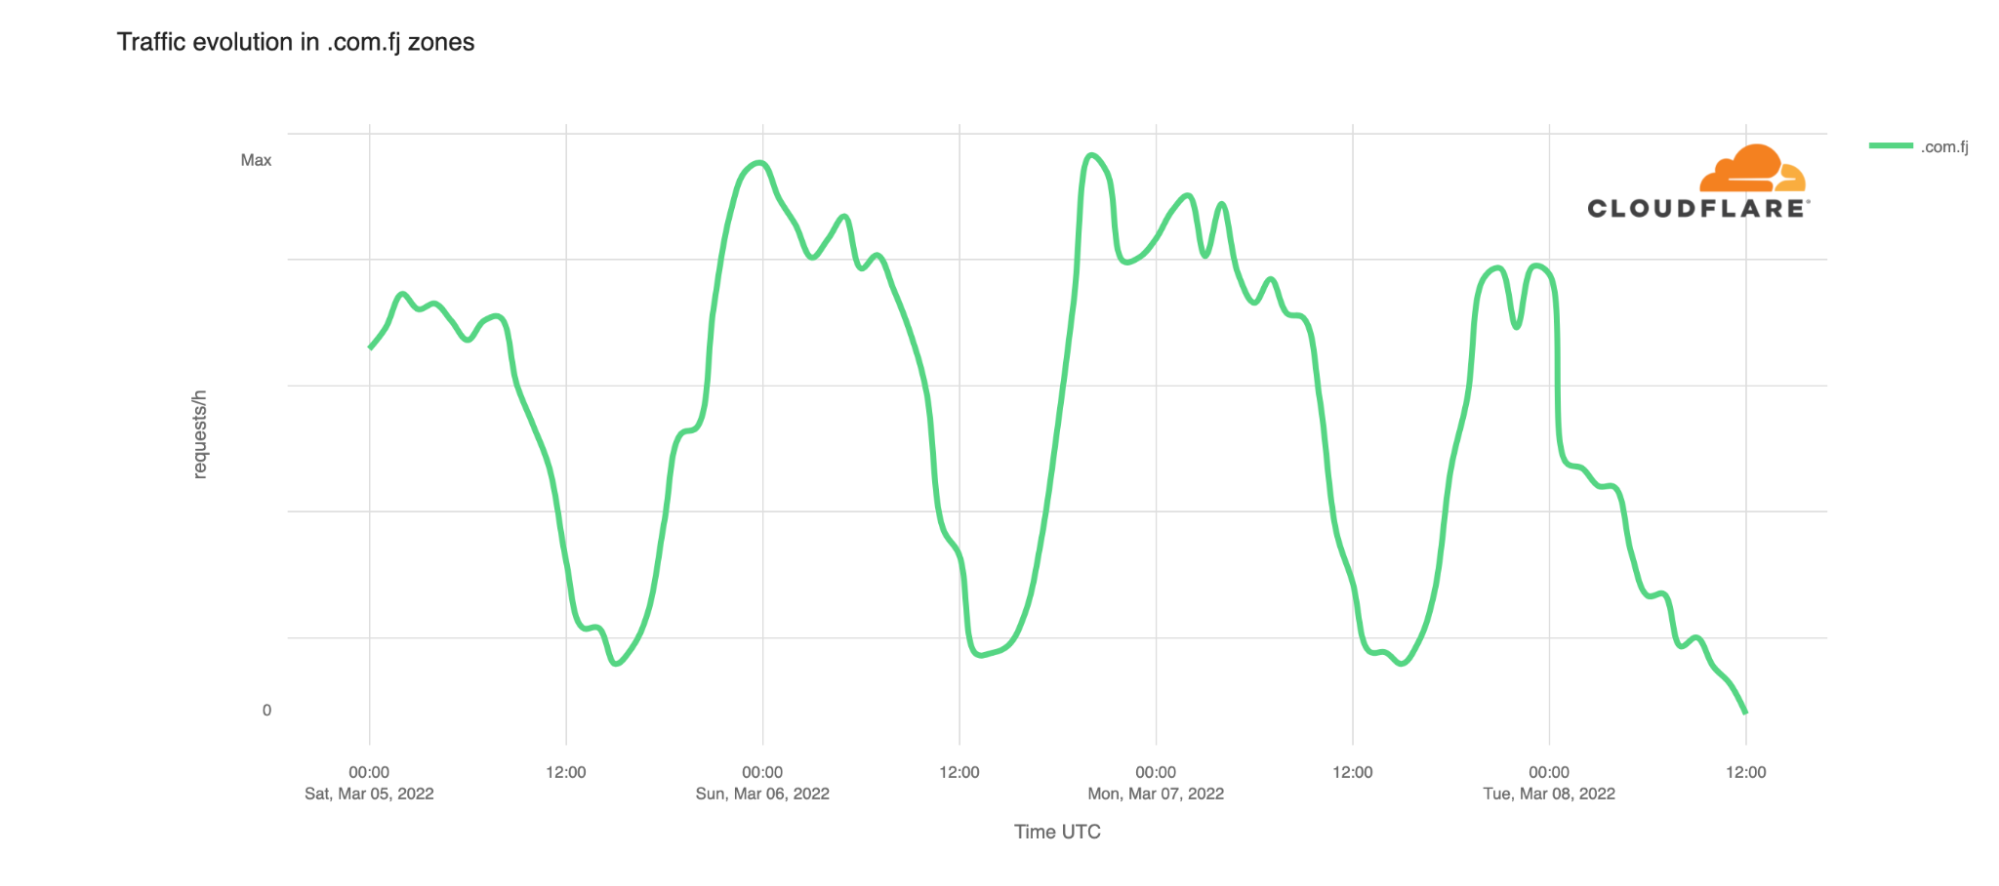
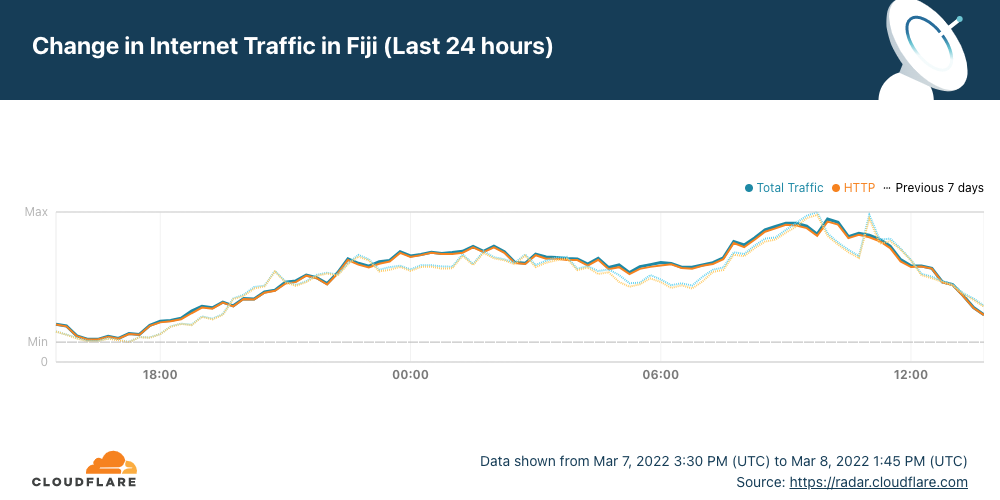
The impact of this issue can be seen in traffic to Cloudflare customer zones in the .com.fj second-level domain. The graph below shows that HTTP traffic to these zones dropped by approximately 40% almost immediately starting around midnight UTC on March 8. Traffic volumes continued to decline throughout the rest of the morning.

DNSSEC issues take Fiji domains offline

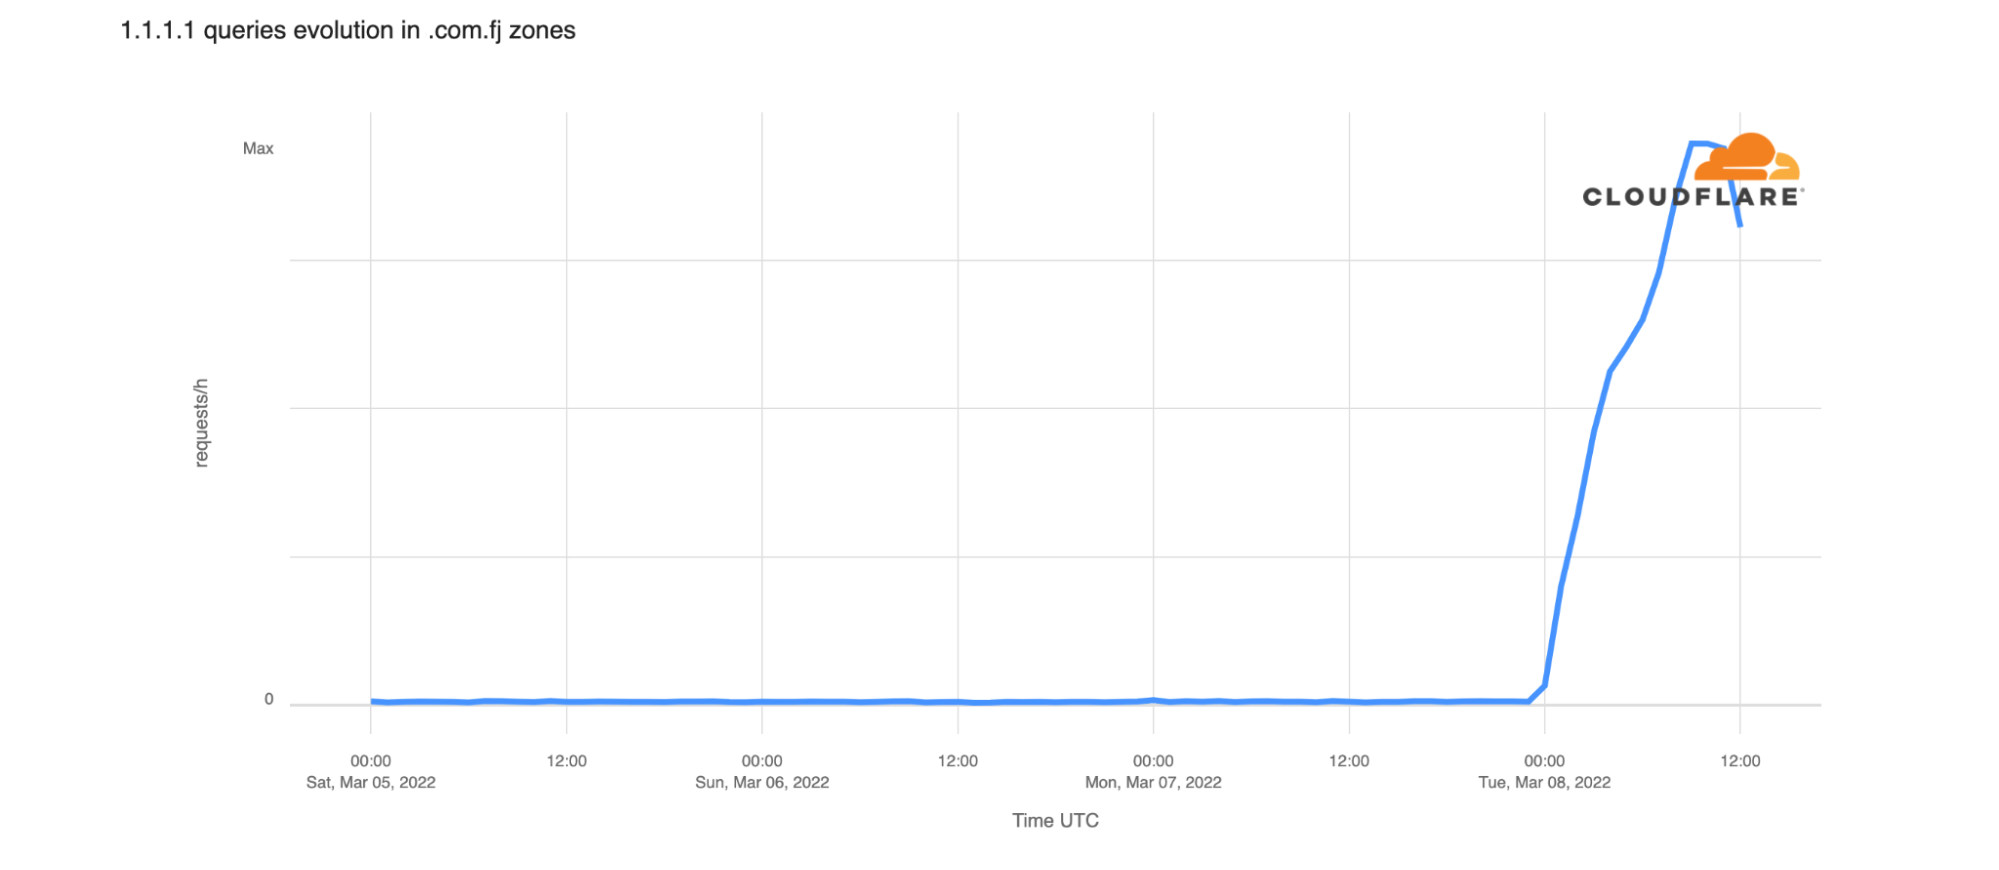
Looking at Cloudflare’s 1.1.1.1 resolver data for queries for .com.fj hostnames, we can also see that error volume associated with those queries climbs significantly starting just after midnight as well. This means that our resolvers encountered issues with the answers from .fj servers.

DNSSEC issues take Fiji domains offline

This observation suggests that the problem was strictly DNS related, rather than connectivity related—Cloudflare Radar does not show any indication of an Internet disruption in Fiji coincident with the start of this problem.

DNSSEC issues take Fiji domains offline

It was suggested within the Hacker News comments that the problem could be DNSSEC related. Upon further investigation, it appears that may be the cause. In verifying the DNSSEC record for the .fj ccTLD, shown in the dig output below, we see that it states EDE: 9 (DNSKEY Missing): 'no SEP matching the DS found for fj.'

kdig fj. soa +dnssec @1.1.1.1 
;; ->>HEADER<<- opcode: QUERY; status: SERVFAIL; id: 12710
;; Flags: qr rd ra; QUERY: 1; ANSWER: 0; AUTHORITY: 0; ADDITIONAL: 1
 
;; EDNS PSEUDOSECTION:
;; Version: 0; flags: do; UDP size: 1232 B; ext-rcode: NOERROR
;; EDE: 9 (DNSKEY Missing): 'no SEP matching the DS found for fj.'
 
;; QUESTION SECTION:
;; fj.                          IN      SOA
 
;; Received 73 B
;; Time 2022-03-08 08:57:41 EST
;; From 1.1.1.1@53(UDP) in 17.2 ms

Extended DNS Error 9 (EDE: 9) is defined as “A DS record existed at a parent, but no supported matching DNSKEY record could be found for the child.” The Cloudflare Learning Center article on DNSKEY and DS records explains this relationship:

The DS record is used to verify the authenticity of child zones of DNSSEC zones. The DS key record on a parent zone contains a hash of the KSK in a child zone. A DNSSEC resolver can therefore verify the authenticity of the child zone by hashing its KSK record, and comparing that to what is in the parent zone’s DS record.

Ultimately, it appears that around midnight UTC, the .fj zone started to be signed with a key that was not in the root zone DS, possibly as the result of a scheduled rollover that happened without checking that the root zone was updated first by IANA, which updates the root zone. (IANA owns contact with the TLD operators, and instructs the Root Zone Publisher on the changes to make in the next version of the root zone.)

DNSSEC problems as the root cause of the observed issue align with the observation in the Hacker News comments that some were able to access .fj websites, while others were not. Users behind resolvers doing strict DNSSEC validation would have seen an error in their browser, while users behind less strict resolvers would have been able to access the sites without a problem.

Conclusion

Further analysis of Cloudflare resolver metrics indicates that the problem was resolved around 1400 UTC, when the DS was updated. When DNSSEC is improperly configured for a single domain name, it can cause problems accessing websites or applications in that zone. However, when the misconfiguration occurs at a ccTLD level, the impact is much more significant. Unfortunately, this seems to occur all too often.

(Thank you to Ólafur Guðmundsson for his DNSSEC expertise.)

България и киберсигурността: Готови ли сме за предизвикателствата на XXI век? 

Post Syndicated from Йоанна Елми original https://toest.bg/delyan-delchev-interview-cybersecurity/

Няколко дни след началото на руската инвазия в Украйна министърът на електронното управление Божидар Божанов обяви, че съвместно с ГДБОП са предприети действия за „филтриране или преустановяване на трафика от над 45 000 интернет адреса, от които са извършвани опити за зловредна намеса в електронни системи“. Същевременно от януари насам са осъществени редица кибератаки срещу Украйна, като мишени са от държавни институции до банки. Много от тези атаки са приписвани на Русия. Вземайки предвид активната информационна война в България и геополитическите интереси на Русия в региона, Йоанна Елми разговаря с Делян Делчев – телекомуникационен инженер и експерт по информационни технологии с познания и опит в сферата на киберсигурността. 


Г-н Делчев, често говорим за „хибридна война“, за която имаше предупреждения и във връзка с инвазията в Украйна. Струва ми се обаче, че има разминаване в схващането на термина. Какво да разбират читателите под този етикет? 

По принцип терминът означава динамично и/или едновременно комбиниране на конвенционални и неконвенционални военни действия, дипломация и кибервойна, в т.ч. и информационна (или както си я наричахме ние – пропаганда). Но подобно на други термини, с времето оригиналният смисъл се загубва и днес по-скоро имаме предвид основно електронната пропаганда, понякога подпомагана от хакерство, търсещо сензация.

Може ли да кажем грубо, че хибридната война включва два елемента: комуникационен, например пропаганда, и технически – кибератаки срещу ключова инфраструктура? 

Да. Но обръщам внимание, че това, с което асоциираме термина в последно време, е предимно пропагандата по интернет, а всички други съпътстващи действия по-скоро целят нейното подпомагане.

Съществуват ли кибератаки, които са особено популярни? Какви са практиките? 

Светът на хакерството е интересен и много по-различен от това, което виждате по телевизията. Доминиращото количество хора, занимаващи се с тези дейности, не са войници, професионалисти или пък гении. Това са най-обикновени хора, например тийнейджъри, събрани в малки приятелски банди, които пробват неща, за които са прочели тук и там, в повечето случаи – без да ги разбират в дълбочина. Те се радват на тръпката от потенциален успех, дори той да е малък, на емоцията да правиш нещо забранено, да получиш същия адреналин като при екстремните спортове.

Има всякакви хора – някои са мотивирани и от възможностите за малки или големи печалби или просто за събиране на информация, която те си мислят, че може да е тайна – да разкрият нещо ново, някоя голяма конспирация. И тези хора са напълно случайно разпръснати по света и са удивително много. Само в Китай има милиони тийнейджъри (т.нар. script kiddies), които отварят за първи път някоя книжка или по-скоро онлайн хакерски документ и веднага искат да си пробват късмета, да видят какво ще стане. Паралелно има и неструктуриран черен пазар: малките банди си взаимодействат и си помагат с услуги, скриптове, достъп, поръчки, плащат си с пари, (крадени) стоки, услуги, програмен код, ресурси и криптовалута. Където има хора и търсене, има и пари, и награди.

Държавните „киберармии“ всъщност се възползват от тези хакери и големия им брой. Те им спускат поръчки чрез подставени лица, посредници или приятели и съответно ги награждават, ако някъде постигнат успех. Същото правят и обикновени престъпници, частни фирми, детективи и какви ли не други. Ако използваме аналогия от спагети уестърните: обявена е парична награда за главата на някого и всички ловци на глави се втурват да се пробват. Няма никакви гаранции за успех, а заниманието е времеемко, защото реалността не е като по телевизията – идва хакер, оплаква се от нещо, после трака пет секунди на клавиатурата и казва: „Вътре съм.“ В реалния живот дори малки пробиви може да отнемат години и се правят на малки стъпки. Затова и когато бъдат разкрити, пораженията са вече големи, защото пробивът може да не е бил от вчера, а да е отворена порта с години.

Тъй като повечето хакери не разбират занаята в дълбочина, често някои държави или фирми, които са специализирани в областта на сигурността и разполагат с интелигентни и способни ресурси, предоставят готови инструменти, непознати хакове или вътрешна информация на хакерските банди. Понякога дори начеват процеса и подготвят обстановката, а после оставят хакерите да довършат нещата. Хакерите са, един вид, мулета и дори някой да ги уличи, директната връзка с поръчителя е много трудна.

А има ли специфичен почерк според държавата, извършваща кибератака?

Индивидуалните банди се специализират в различни направления – във флууд (от англ. flood, „наводняване“– претоварване на интернет връзки, което води например до блокиране на достъпа до уебсайтове); сриване на ресурси, затрудняване на работоспособността на инфраструктури; хакване, вземане на контрол; създаване и събиране на бот мрежи (които после се ползват за прикриване на хакове и флууд)*; кражби на идентификация, пароли, лична информация, данни за кредитни карти и за криптовалути; рансъмуер (зловреден софтуер, който криптира информацията на заразения компютър и изнудва потребителя да му плати откуп, за да получи ключ за дешифриране) и т.н.

Трудно е от пръв поглед да се каже кой какъв е и дали поведението му е самопородено от хаоса, или има частен интерес, или някой му дърпа конците и го е мотивирал, без значение дали това е станало знайно, или незнайно за извършителя. Но светът е малък и има модели на поведение, които са специфичен стил на различните групи и мотиватори. Има и много улики. В действителност в интернет нищо не е наистина анонимно. Така чрез различни техники може да се идентифицира кой кой е и дали е под влиянието на поръчители от една или друга държава. Киберсигурността се развива и на обикновените хакери им е все по-трудно да откриват нови слаби звена. Това го могат основно хора, които имат познания, специфичен достъп до информация (например сорскод на WindowsMicrosoft го предоставя под различни програми на няколко държави, сред които са и Русия, и Китай), разузнаване, възможности за събиране и мотивиране на съмишленици или помагачи, работещи в различни компании.

В скандала Solarwinds например пакетът от хакове съдържаше инструмент с компонент, написан от хакерите, но подписан така, сякаш идва от Microsoft. Този компонент води до лесното и невидимо инсталиране на код, който позволява отдалечено управление на Windows. Това не може да бъде направено от обикновени хакери, тези ключове и процесът по подписването с тях трябва да са тайна. От Microsoft и досега изследват как хакерите са направили пробива. Съвсем вероятно е да е станало по описания по-горе начин – през програмите, по които Microsoft работи директно с някои правителства, и е сериозен сигнал за правителствено участие. Хакерските банди нямат тези възможности, а дори да ги имаха, всичко това щеше да се появи публично и светът щеше да е залят с подобни подписани компоненти. Сега обаче същите инструменти и ключ ненадейно се появиха в няколко хакерски кампании за изземване на украински ИТ системи, което очевидно уличава руски правителствени интереси.

Китайските държавни хакери, както и американските, и руските, имат своя колекция от хакерски инструменти, които разработват тайно, не са публични, но понякога биват предоставени на близки банди (някои често съдействат на всички служби, държави или частни компании едновременно). Така и по инструментите може да се познае кой стои зад атаката. Или по наградите. Или по „мулетата“. Или по начина на плащане. Или дори по пропагандните изрази, които използват (и които издават с кого си комуникират). Макар хаотичните банди да стоят на преден план, отзад понякога се виждат сенките на по-сериозни професионалисти и организатори на кампании. Все още обаче над 99% от кибератаките са изцяло хаотични и не са свързани с държавни „киберармии“.

Как се наказват кибератаките? Съществува ли в света ефективно разработена рамка, която да ги третира като престъпления?

Има опити, но не мисля, че са ефективни. Проблемът е, че обикновено се наказват тийнейджъри, които са на практика невинни или пък малолетни и неопитни както в живота, така и в това, което правят, и всъщност заради това ги хващат. В огромната си част по-опитните хакери или пък техните поръчители, ако има такива, си остават недосегаеми. Не мисля, че е възможно при тази „екосистема“ въобще да има начин да изхвърлим мръсната вода, без да изхвърлим и бебето. Обществените реакции ще са тежки. Затова ако нещо се прави по темата, е епизодично и според мен никой не се опитва сериозно да се занимава с наказания, поне в свободния свят.

Друг проблем е, че видимите хакери са често разпръснати между много държави и просто няма как да хванеш един и после чрез него да намериш и хванеш друг, а чрез него – трети, без подкрепата на тези държави. А това е трудно и понякога невъзможно. Ето защо и никой не иска да прави нещо наистина сериозно и масово, когато не става въпрос за финансови престъпления. От известно време съответните полицейски служби се опитват – под предлог за борба с детската порнография – да разработят по-координирана комуникация между различни държави и често правят масови транснационални кампании. Създадената инфраструктура автоматично впоследствие може да се използва за всякакви киберпрестъпления – от най-големите до примерно нарушаване на авторски права (изтеглили сте някакъв филм от интернет). Но засега тази координация е в процес на подготовка и се фокусира върху детската порнография като общо безспорно припознат проблем от службите.

За мен това, че има куп младежи, които искат да се научат „на хакерство“, не е проблем. Така се натрупва познание. Ако някой хакер е намерил как да влезе в пощата или сървъра ви, не е чак такава беда в повечето случаи, защото загубите са най-често малки. Може да се възползвате от това, за да се учите да се пазите по-добре. Защото ако хакери, които не са държавно спонсорирани, могат да пробият системите ви, то държавно спонсорираните вероятно отдавна се разхождат там необезпокоявано.

Образът на руския хакер е почти фикционален, като на филм. В действителност има ли Русия особена роля в сферата на кибератаките? 

Има, но не и по този романтичен начин, по който повечето хора си го представят. „Руските хакери“ всъщност са всякакви хакери, с всякаква националност. Има немалко българи сред тях например. Има и американци, китайци, западноевропейци, какви ли не. И тези хора нямат задължително идеология, нито правят това от любов към Путин; мнозина дори не знаят, че са спонсорирани от Москва чрез посредници. Просто техните банди, приятелски кръгове и контакти ги поставят в позиция да получават, понякога през десетки посредници, възможности за поръчки, които са спуснати от руски поръчители или са в техен интерес.

За разлика от САЩ, които като цяло избягват да използват бандите (с малки изключения) и имат голям собствен и невидим ресурс, напълно отделен от хакерската общност, Русия е много по-прагматична и грубо казано, излиза на свободния пазар. Така тя разчита и на по-нискоквалифицирани хакери, които съответно повече се излагат и биват хващани, защото използват по-видими и груби подходи. Спокойно можем да определим руската практика като „слон в стъкларски магазин“. Но това работи за тях, защото те се радват на пропагандния ефект и на името, което си създават. Тази практика е и по-евтина и по-лесна, тъй като не се налага обучение на хора, нито създаване и развиване на специални държавни структури със специфично познание.

Но тук-там се виждат и по-прецизни руски изпълнения с директно въвличане на по-интелигентни участници от масовите хакери. Solarwinds, както и двете последни кампании в Украйна са добри примери и много служби осъзнаха, че Русия също започва да натрупва и такъв потенциал.

Показаха ли нагледно случаи като теча в НАП, че България е неподготвена в сферата на киберсигурността? Обществеността не се трогна много от изтичането на данни – защо? И как трябва да се обясни на хората, че проблемът ги засяга лично? 

Първо, повечето от хакванията, за които съм чул, че се случват в България, и по-специално това в НАП, са породени от небрежност и вероятно от незаинтересованост, често граничеща с глупост. Но основният проблем на България е, че работим след събитията – чакаме нещо да се случи, за да действаме. После работим на парче, докато следващото събитие не дойде да ни накара да действаме отново. Киберсигурността постоянно се променя. С единични действия не може да се постигне нищо. Трябва постоянно да следиш и да реагираш на това, което става или за което чуваш като възможни рискове в други държави. Дори хипотетично в момента да имаш най-добрата защита на света, след няколко месеца вече няма да е така. Държавата трябва да има процедури (а не само стратегии) и тези процедури активно да се изпълняват, а на киберсигурността трябва да се гледа много сериозно.

Усещането ми е, че киберхигиената в държавните ни институции не е на ниво и едва ли не още сричаме азбуката. Смешно е да слушаме изказвания как в НАП са си мислили, че имали сигурност, защото са минали обучение и са направили опит да се сертифицират по ISO27000. Както видяхме, това не е помогнало. Смешно е също някои други институции да си мислят, че като криптират нещо, то автоматично става защитено.

Разглеждайки внимателно как е разработвано хакването на някои от финансовите и държавните институции в Украйна, ще видим, че ако сме били ние на мушка, нито една от простите ни представи как да бъдем или да се чувстваме защитени, не би ни предпазила. Има големи разлики в изграждането на хигиена в киберсигурността на индивидуално или корпоративно ниво и на ниво държава, държавни институции и организации от сферата на сигурността. Ние засега се опитваме да покрием поне корпоративните стандарти – и дори в това нямаме големи успехи.

Гражданите няма как да следят какви пробиви се появяват в киберсигурността, нито пък ще се занимават постоянно с поддържането на киберхигиена, ако тя е трудна и неразбираема. Всяко нещо, което ти създава дискомфорт, скоро бива игнорирано, все едно никога не го е имало. Класически пример за това са изискванията за много сложни пароли – на пръв поглед трябва да се минимизира рискът някой хакер да ги познае, но пък така потребителят е принуден или да използва една и съща парола навсякъде, или да си ги записва и евентуално да ги оставя на публични места. Така вместо да се подобри сигурността с това правило, всъщност тя спада, както показва статистиката.

Киберсигурността трябва да се възприема сериозно отгоре надолу в държавата, а не обратното, от гражданите към властта. Решенията и процесите трябва да са прости и органични, в най-добрия случай невидими за крайните потребители, да не им пречат, и така всичко ще бъде разумно ефективно, дори да не е перфектно. Хората трябва да знаят, че никога нищо в киберсигурността не е перфектно, но може да е достатъчно добро, за да минимизира рисковете и експозицията. За пример: ако в НАП спазваха поне основните принципи на GPDR за съхраняване на личните данни, уязвимостта нямаше да е толкова голяма. Дали дори сега в НАП ги спазват? Или си мислят, че ако не публикуват бекъпите си в интернет достъпни сървъри, те ще са защитени? Предвид наблюдаваното напоследък, това е много измамно усещане.

А по въпроса как киберсигурността ни засяга лично: представете си, че всички електронни блага, които имате днес – банкови карти, пари, интернет, смартфони, лична информация, усещане за личен живот, – може да се загубят и/или да ги получи някой друг, а вие бъдете пренесен, метафорично казано, обратно в 70-те като ниво на комуникация. Ако тази мисъл ви създава дискомфорт, значи трябва да се отнасяте сериозно към киберхигиената си.

Мрежи от ботове се създават, като чрез вирус или по друг начин се заразят множество компютри, на които след това се инсталира софтуер (бот). Когато е нужно да се извърши атака, контролиращият мрежата активира тези ботове отдалечено и те започват координирано да атакуват конкретни сървъри. Така изглежда, че атаката идва от множество компютри по целия свят и е трудна за овладяване, а истинският извършител остава скрит зад своята армия от ботове. – Б.р.
Заглавна снимка: Michael Geiger / Unsplash

Източник

Detecting security issues in logging with Amazon CodeGuru Reviewer

Post Syndicated from Brian Farnhill original https://aws.amazon.com/blogs/devops/detecting-security-issues-in-logging-with-amazon-codeguru-reviewer/

Amazon CodeGuru is a developer tool that provides intelligent recommendations for identifying security risks in code and improving code quality. To help you find potential issues related to logging of inputs that haven’t been sanitized, Amazon CodeGuru Reviewer now includes additional checks for both Python and Java. In this post, we discuss these updates and show examples of code that relate to these new detectors.

In December 2021, an issue was discovered relating to Apache’s popular Log4j Java-based logging utility (CVE-2021-44228). There are several resources available to help mitigate this issue (some of which are highlighted in a post on the AWS Public Sector blog). This issue has drawn attention to the importance of logging inputs in a way that is safe. To help developers understand where un-sanitized values are being logged, CodeGuru Reviewer can now generate findings that highlight these and make it easier to remediate them.

The new detectors and recommendations in CodeGuru Reviewer can detect findings in Java where Log4j is used, and in Python where the standard logging module is used. The following examples demonstrate how this works and what the recommendations look like.

Findings in Java

Consider the following Java sample that responds to a web request.

@RequestMapping("/example.htm")
public ModelAndView handleRequest(HttpServletRequest request, HttpServletResponse response) {
    ModelAndView result = new ModelAndView("success");
    String userId = request.getParameter("userId");
    result.addObject("userId", userId);

    // More logic to populate `result`.
     log.info("Successfully processed {} with user ID: {}.", request.getRequestURL(), userId);
    return result;
}

This simple example generates a result to the initial request, and it extracts the userId field from the initial request to do this. Before returning the result, the userId field is passed to the log.info statement. This presents a potential security issue, because the value of userId is not sanitized or changed in any way before it is logged. CodeGuru Reviewer is able to identify that the variable userId points to a value that needs to be sanitized before it is logged, as it comes from an HTTP request. All user inputs in a request (including query parameters, headers, body and cookie values) should be checked before logging to ensure a malicious user hasn’t passed values that could compromise your logging mechanism.

CodeGuru Reviewer recommends to sanitize user-provided inputs before logging them to ensure log integrity. Let’s take a look at CodeGuru Reviewer’s findings for this issue.

A screenshot of the AWS Console that describes the log injection risk found by CodeGuru Reviewer

An option to remediate this risk would be to add a sanitize() method that checks and modifies the value to remove known risks. The specific process of doing this will vary based on the values you expect and what is safe for your application and its processes. By logging the now sanitized value, you have mitigated those risks that could impact on your logging framework. The modified code sample below shows one example of how this could be addressed.

@RequestMapping("/example.htm")
public ModelAndView handleRequestSafely(HttpServletRequest request, HttpServletResponse response) {
    ModelAndView result = new ModelAndView("success");
    String userId = request.getParameter("userId");
    String sanitizedUserId = sanitize(userId);
    result.addObject("userId", sanitizedUserId);

    // More logic to populate `result`.
    log.info("Successfully processed {} with user ID: {}.", request.getRequestURL(), sanitizedUserId);
    return result;
}

private static String sanitize(String userId) {
    return userId.replaceAll("\\D", "");
}

The example now uses the sanitize() method, which uses a replaceAll() call that uses a regular expression to remove all non-digit characters. This example assumes the userId value should only be digit characters, ensuring that any other characters that could be used to expose a vulnerability in the logging framework are removed first.

Findings in Python

Now consider the following python code from a sample Flask project that handles a web request.

from flask import app, current_app, request

@app.route('/log')
def getUserInput():
    input = request.args.get('input')
    current_app.logger.info("User input: %s", input)

    # More logic to process user input.

In this example, the input variable is assigned the input query string value from a web request. Then, the Flask logger records its value as an info level message. This has the same challenge as the Java example above. However this time rather than changing the value, we can instead inspect it and choose to log it only when it is in a format we expect. A simple example of this could be where we expect only alphanumeric characters in the input variable. The isalnum() function can act as a simple test in this case. Here is an example of what this style of validation could look like.

from flask import app, current_app, request

@app.route('/log')
def safe_getUserInput():
    input = request.args.get('input')    
    if input.isalnum():
        current_app.logger.info("User input: %s", input)        
    else:
        current_app.logger.warning("Unexpected input detected")

Getting started

While log sanitization implementation is a long journey for many, it is a guardrail for maintaining your application’s log integrity. With CodeGuru Reviewer detecting log inputs that are neither sanitized nor validated, developers can use these recommendations as a guide to reduce risks related to log injection attacks. Additionally, you can provide feedback on recommendations in the CodeGuru Reviewer console or by commenting on the code in a pull request. This feedback helps improve the precision of CodeGuru Reviewer, so the recommendations you see get better over time.

To get started with CodeGuru Reviewer, you can leverage AWS Free Tier without any cost. For 90 days, you can review up to 100K lines of code in onboarded repositories per AWS account. For more information, please review the pricing page.

About the authors

Brian Farnhill

Brian Farnhill is a Software Development Engineer in the Australian Public Sector team. His background is in building solutions and helping customers improve DevOps tools and processes. When he isn’t working, you’ll find him either coding for fun or playing online games.

Jia Qin

Jia Qin is part of the Solutions Architect team in Malaysia. She loves developing on AWS, trying out new technology, and sharing her knowledge with customers. Outside of work, she enjoys taking walks and petting cats.

The collective thoughts of the interwebz

By continuing to use the site, you agree to the use of cookies. more information

The cookie settings on this website are set to "allow cookies" to give you the best browsing experience possible. If you continue to use this website without changing your cookie settings or you click "Accept" below then you are consenting to this.

Close