Detecting zero-days before zero-day

Post Syndicated from Michael Tremante original http://blog.cloudflare.com/detecting-zero-days-before-zero-day/

Detecting zero-days before zero-day

Detecting zero-days before zero-day

We are constantly researching ways to improve our products. For the Web Application Firewall (WAF), the goal is simple: keep customer web applications safe by building the best solution available on the market.

In this blog post we talk about our approach and ongoing research into detecting novel web attack vectors in our WAF before they are seen by a security researcher. If you are interested in learning about our secret sauce, read on.

This post is the written form of a presentation first delivered at Black Hat USA 2023.

The value of a WAF

Many companies offer web application firewalls and application security products with a total addressable market forecasted to increase for the foreseeable future.

In this space, vendors, including ourselves, often like to boast the importance of their solution by presenting ever-growing statistics around threats to web applications. Bigger numbers and scarier stats are great ways to justify expensive investments in web security. Taking a few examples from our very own application security report research (see our latest report here):

Detecting zero-days before zero-day

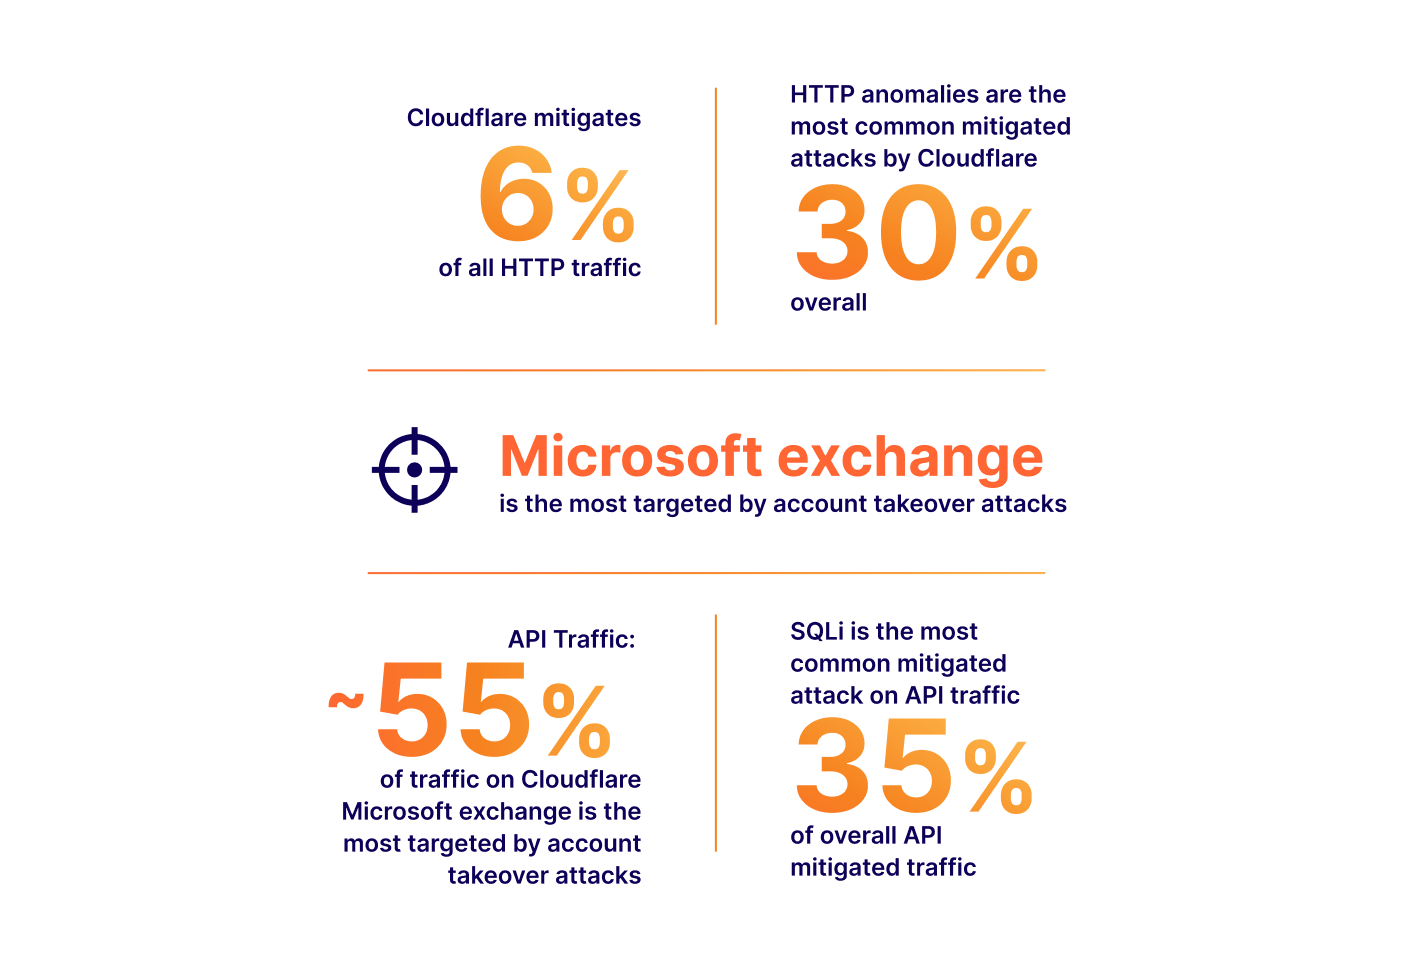
The numbers above all translate to real value: yes, a large portion of Internet HTTP traffic is malicious, therefore you could mitigate a non-negligible amount of traffic reaching your applications if you deployed a WAF. It is also true that we are seeing a drastic increase in global API traffic, therefore, you should look into the security of your APIs as you are likely serving API traffic you are not aware of. You need a WAF with API protection capabilities. And so on.

There is, however, one statistic often presented that hides a concept more directly tied to the value of a web application firewall:

Detecting zero-days before zero-day

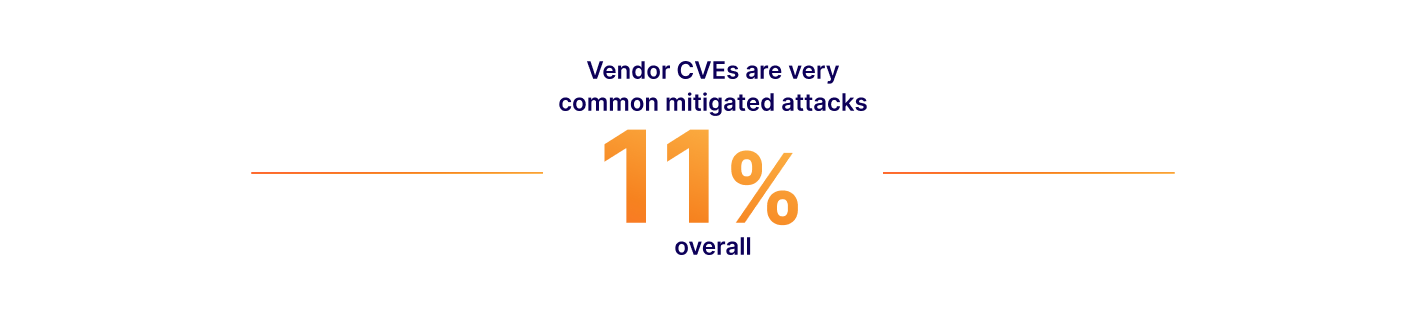
This brings us to zero-days. The definition of a zero-day may vary depending on who you ask, but is generally understood to be an exploit that is not yet, or has very recently become, widely known with no patch available. High impact zero-days will get assigned a CVE number. These happen relatively frequently and the value can be implied by how often we see exploit attempts in the wild. Yes, you need a WAF to make sure you are protected from zero-day exploits.

But herein hides the real value: how quickly can a WAF mitigate a new zero-day/CVE?

By definition a zero-day is not well known, and a single malicious payload could be the one that compromises your application. From a purist standpoint, if your WAF is not fast at detecting new attack vectors, it is not providing sufficient value.

The faster the mitigation, the better. We refer to this as “time to mitigate”. Any WAF evaluation should focus on this metric.

How fast is fast enough?

24 hours? 6 hours? 30 minutes? Luckily we run one of the world's largest networks, and we can look at some real examples to understand how quickly a WAF really needs to be to protect most environments. I specifically mention “most” here as not everyone is the target of a highly sophisticated attack, and therefore, most companies should seek to be protected at least by the time a zero-day is widely known. Anything better is a plus.

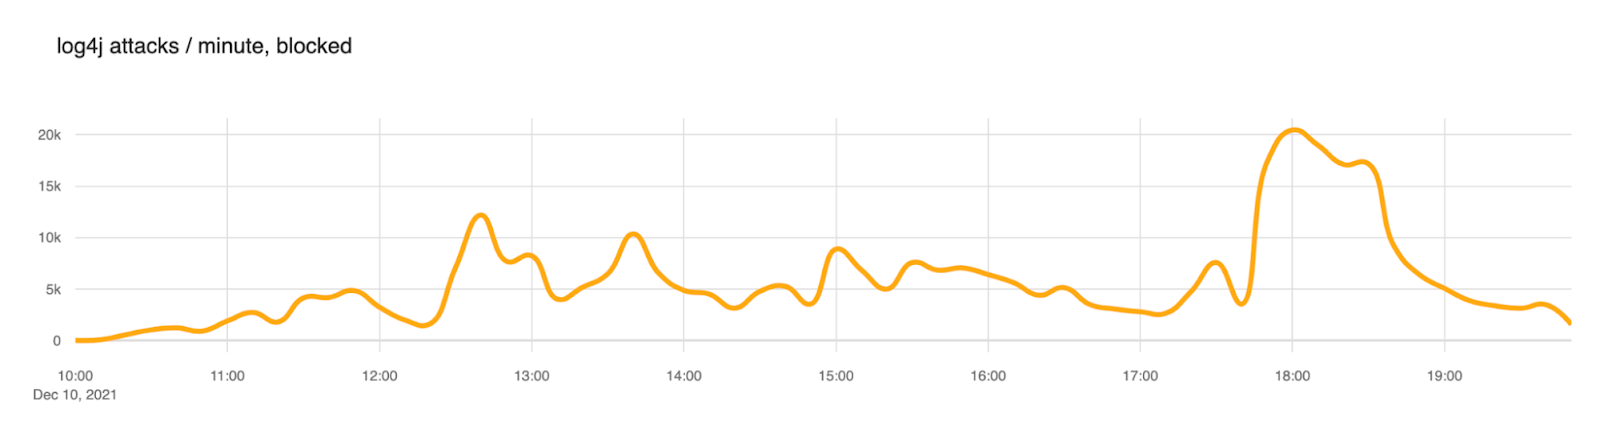
Our first example is Log4Shell (CVE-2021-44228). A high and wide impacting vulnerability that affected Log4J, a popular logging software maintained by the Apache Software Foundation. The vulnerability was disclosed back in December 2021. If you are a security practitioner, you have certainly heard of this exploit.

The proof of concept of this attack was published on GitHub on December 9, 2021, at 15:27 UTC. A tweet followed shortly after. We started observing a substantial amount of attack payloads matching the signatures from about December 10 at 10:00 UTC. That is about ~19 hours after the PoC was published.

Detecting zero-days before zero-day

We blogged extensively about this event if you wish to read further.

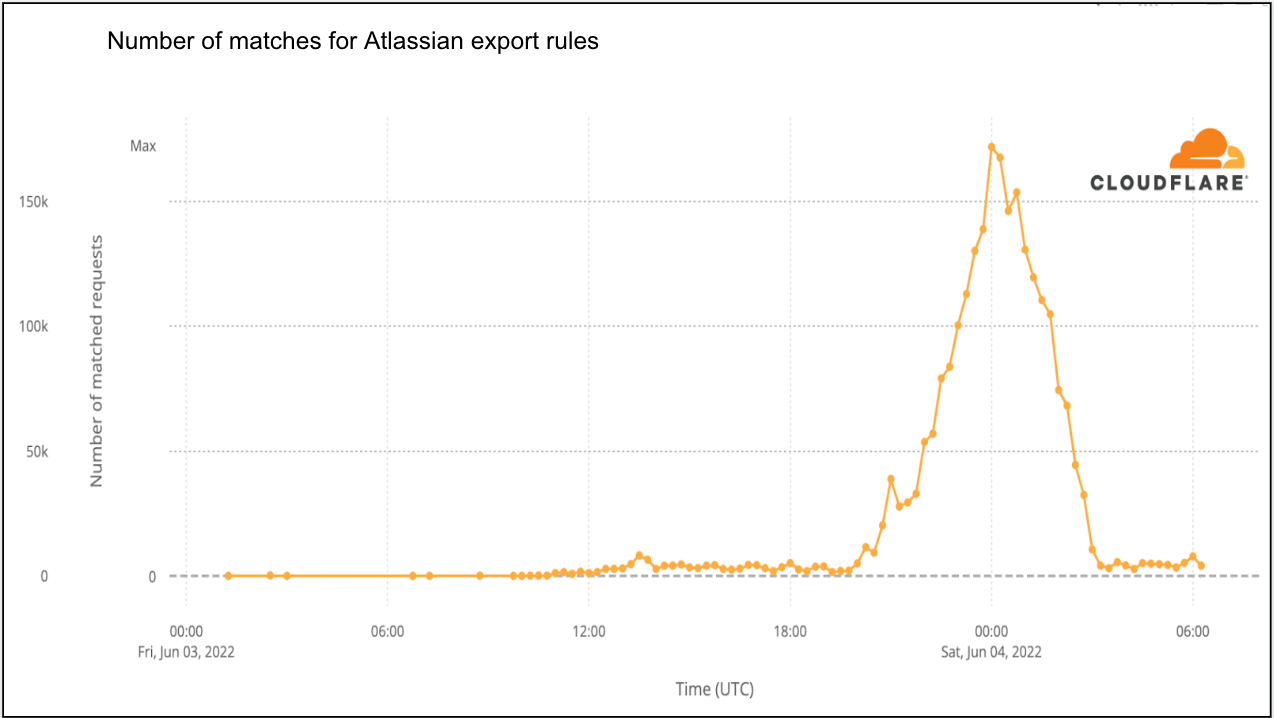
Our second example is a little more recent: Atlassian Confluence CVE-2022-26134 from June 2, 2022. In this instance Atlassian published a security advisory pertaining to the vulnerability at 20:00 UTC. We were very fast at deploying mitigations and had rules globally deployed protecting customers at 23:38 UTC, before the four-hour mark.

Detecting zero-days before zero-day

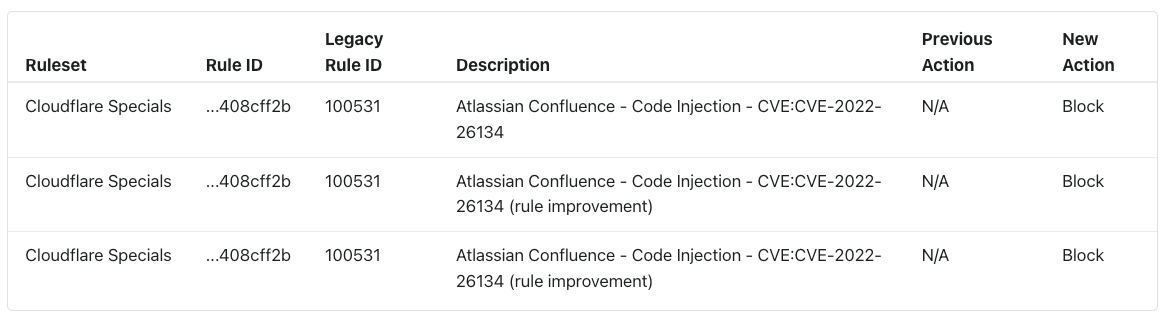
Although potentially matching payloads were observed before the rules were deployed, these were not confirmed. Exact matches were only observed on 2022-06-03 at 10:30 UTC, over 10 hours after rule deployment. Even in this instance, we provided our observations on our blog.

Detecting zero-days before zero-day

The list of examples could go on, but the data tells the same story: for most, as long as you have mitigations in place within a few hours, you are likely to be fine.

That, however, is a dangerous statement to make. Cloudflare protects applications that have some of the most stringent security requirements due to the data they hold and the importance of the service they provide. They could be the one application that is first targeted with the zero-day well before it is widely known. Also, we are a WAF vendor and I would not be writing this post if I thought “a few hours” was fast enough.

Zero (time) is the only acceptable time to mitigate!

Signatures are not enough, but are here to stay

All WAFs on the market today will have a signature based component. Signatures are great as they can be built to minimize false positives (FPs), their behavior is predictable and can be improved overtime.

We build and maintain our own signatures provided in the WAF as the Cloudflare Managed Ruleset. This is a set of over 320 signatures (at time of writing) that have been fine-tuned and optimized over the 13 years of Cloudflare’s existence.

Signatures tend to be written in ModSecurity, regex-like syntax or other proprietary language. At Cloudflare, we use wirefilter, a language understood by our global proxy. To use the same example as above, here is what one of our Log4Shell signatures looks like:

Detecting zero-days before zero-day

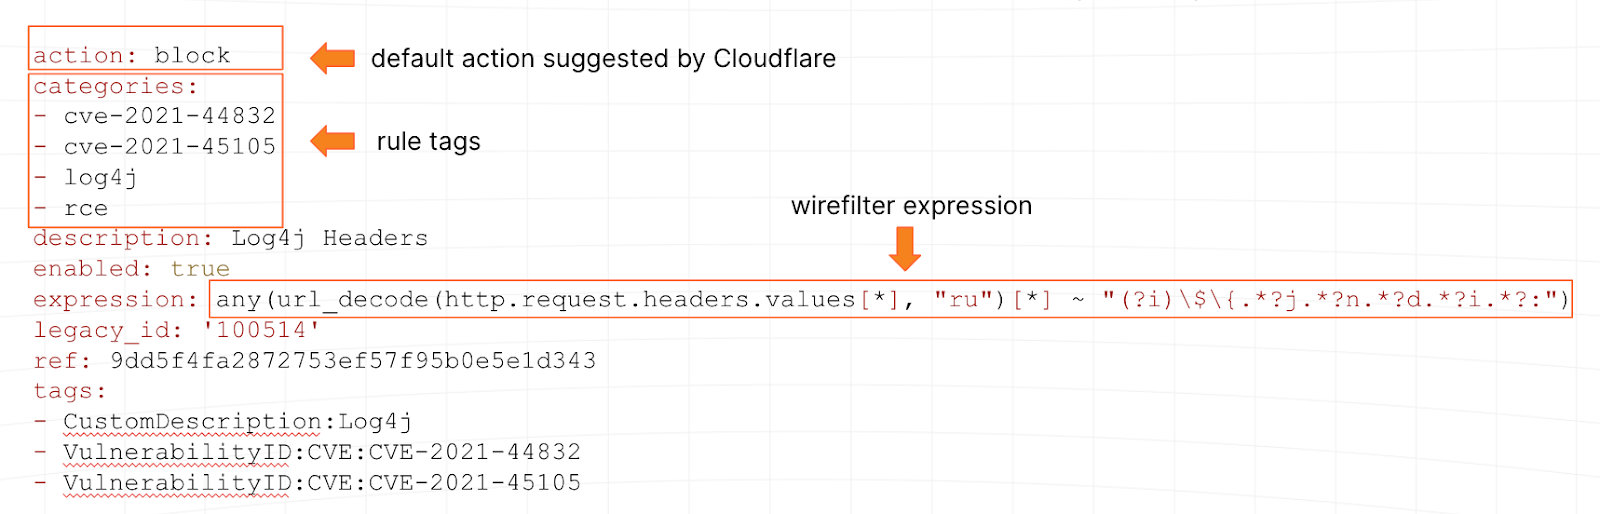
Our network, which runs our WAF, also gives us an additional superpower: the ability to test new signatures (or updates to existing ones) on over 64M HTTP/S requests per second at peak. We can tell pretty quickly if a signature is well written or not.

But one of their qualities (low false positive rates), along with the fact that humans have to write them, are the source of our inability to solely rely on signatures to reach zero time to mitigate. Ultimately a signature is limited by the speed at which we can write it, and combined with our goal to keep FPs low, they only match things we know and are 100% sure about. Our WAF security analyst team is, after all, limited by human speed while balancing the effectiveness of the rules.

The good news: signatures are a vital component to reach zero time to mitigate, and will always be needed, so the investment remains vital.

Getting to zero time to mitigation

To reach zero time to mitigate we need to rely on some machine learning algorithms. It turns out that WAFs are a great application for this type of technology especially combined with existing signature based systems. In this post I won’t describe the algorithms themselves (subject for another post) but will provide the high level concepts of the system and the steps of how we built it.

Step 1: create the training set

It is a well known fact in data science that the quality of any classification system, including the latest generative AI systems, is highly dependent on the quality of the training set. The old saying “garbage in, garbage out” resonates well.

And this is where our signatures come into play. As these were always written with a low false positive rate in mind, combined with our horizontal WAF deployment on our network, we essentially have access to millions of true positive examples per second to create what is likely one of the best WAF training sets available today.

We also, due to customer configurations and other tools such as Bot Management, have a pretty clear idea of what true negatives look like. In summary, we have a constant flow of training data. Additionally due to our self-service plans and the globally distributed nature of Cloudflare’s service and customer base, our data tends to be very diverse, removing a number of biases that may otherwise be present.

It is important to note at this point that we paid a lot of effort to ensure we anonymised data, removed PII, and that data boundary settings provided by our data localization suite were implemented correctly. We’ve published previously blog posts describing some of our strategies for data collection in the context of WAF use cases.

Step 2: enhance the training set

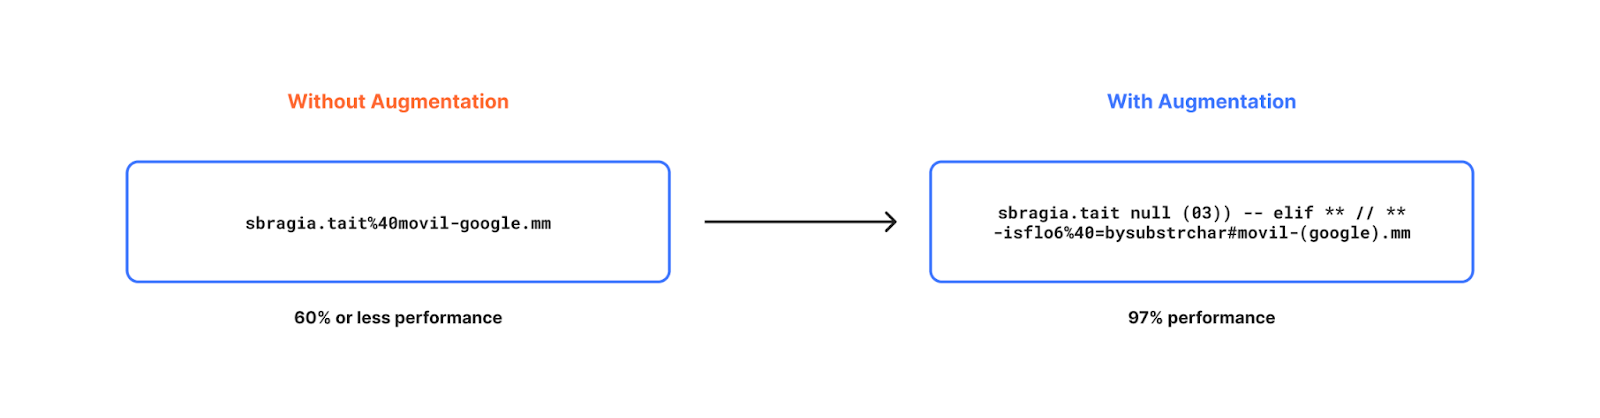
Simply relying on real traffic data is good, but with a few artificial enhancements the training set can become a lot better, leading to much higher detection efficacy.

In a nutshell we went through the process of generating artificial (but realistic) data to increase the diversity of our data even further by studying statistical distribution of existing real-world data. For example, mutating benign content with random character noise, language specific keywords, generating new benign content and so on.

Detecting zero-days before zero-day

Some of the methods adopted to improve accuracy are discussed in detail in a prior blog post if you wish to read further.

Step 3: build a very fast classifier

One restriction that often applies to machine learning based classifiers running to inline traffic, like the Cloudflare proxy, is latency performance. To be useful, we need to be able to compute classification “inline” without affecting the user experience for legitimate end users. We don’t want security to be associated with “slowness”.

This required us to fine tune not only the feature set used by the classification system, but also the underlying tooling, so it was both fast and lightweight. The classifier is built using TensorFlow Lite.

Detecting zero-days before zero-day

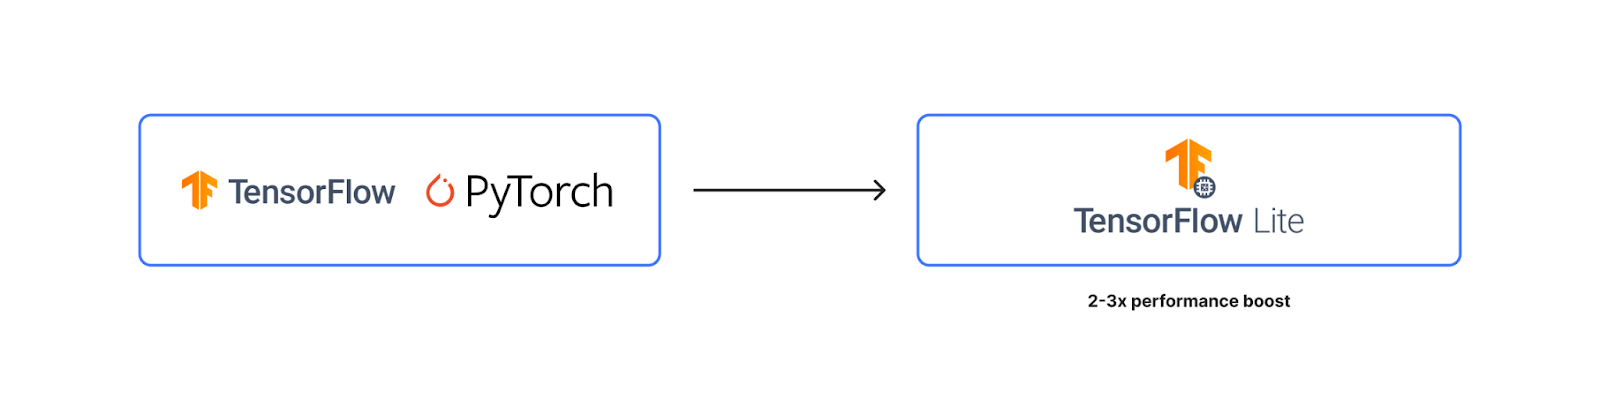
At time of writing, our classification model is able to provide a classification output under 1ms at 50th percentile. We believe we can reach 1ms at 90th percentile with ongoing efforts.

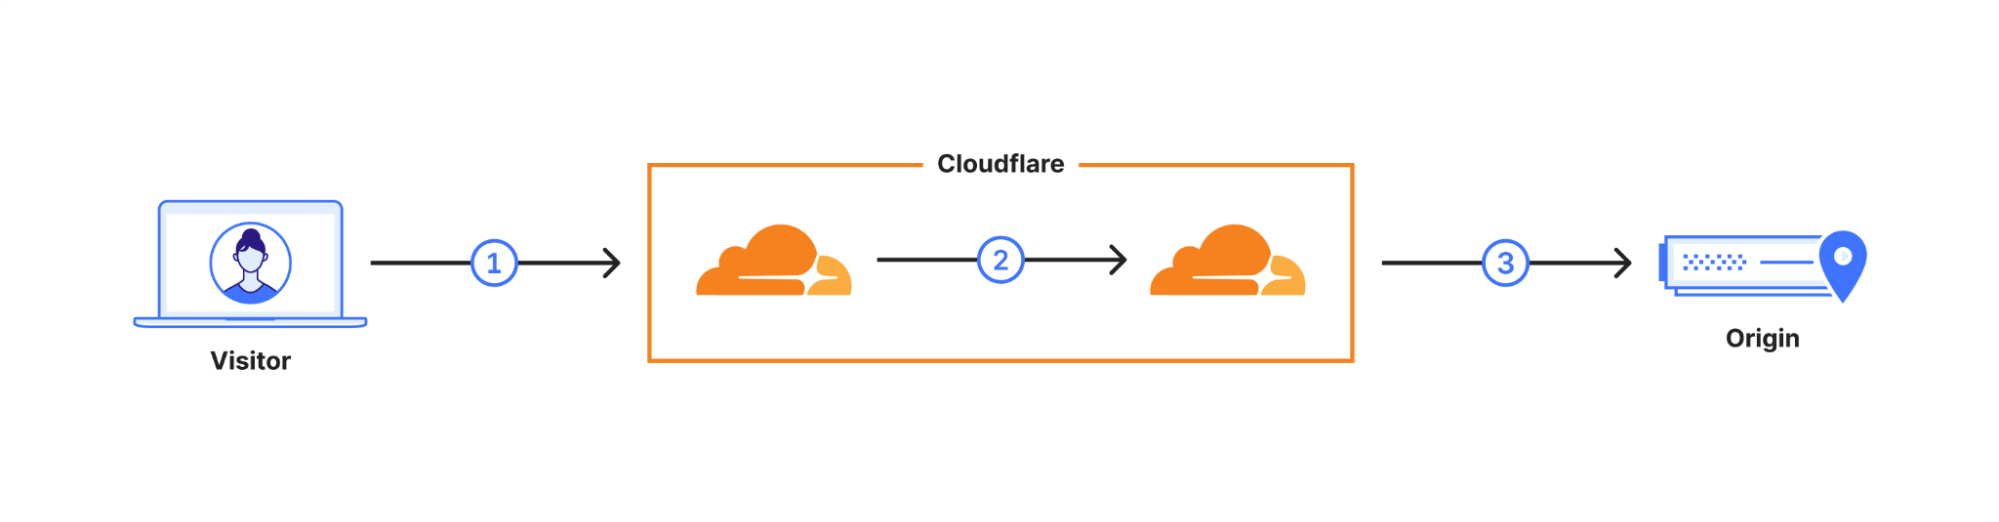
Step 4: deploy on the network

Once the classifier is ready, there is still a large amount of additional work needed to deploy on live production HTTP traffic, especially at our scale. Quite a few additional steps need to be implemented starting from a fully formed live HTTP request and ending with a classification output.

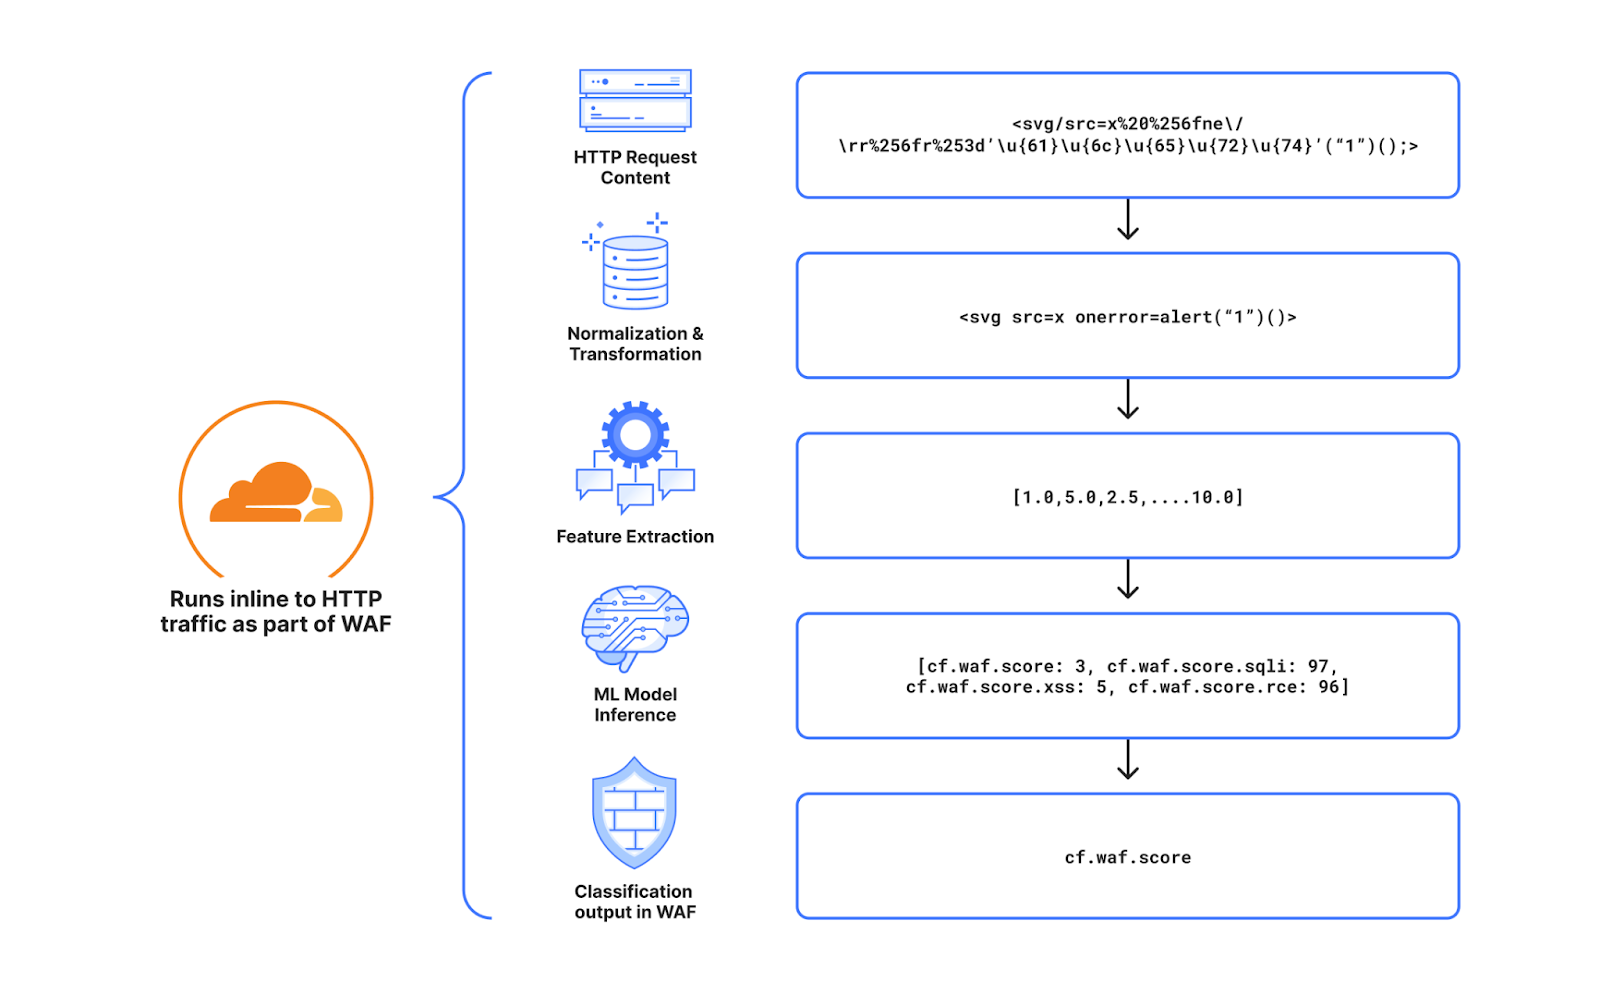
The diagram below is a good summary of each step. First and foremost, starting from the raw HTTP request, we normalize it, so it can easily be parsed and processed, without unintended consequences, by the following steps in the pipeline. Second we extract the relevant features found after experimentation and research, that would be more beneficial for our use case. To date we extract over 6k features. We then run inference on the resulting features (the actual classification) and generate outputs for the various attack types we have trained the model for. To date we classify cross site scripting payloads (XSS), SQL injection payloads (SQLi) and remote code execution payloads (RCE). The final step is to consolidate the output in a single WAF Attack Score.

Detecting zero-days before zero-day

Step 5: expose output as a simple interface

To make the system usable we decided the output should be in the same format as our Bot Management system output. A single score that ranges from 1 to 99. Lower scores indicate higher probability that the request is malicious, higher scores indicate the request is clean.

There are two main benefits of representing the output within a fixed range. First, using the output to BLOCK traffic becomes very easy. It is sufficient to deploy a WAF rule that blocks all HTTP requests with a score lower than $x, for example a rule that blocks all traffic with a score lower than 10 would look like this:

cf.waf.score < 10 then BLOCK

Secondly, deciding what the threshold should be can be done easily by representing the score distributions on your live traffic in colored “buckets”, and then allowing you to zoom in where relevant to validate the correct classification. For example, the graph below shows an attack that we observed against blog.cloudflare.com when we initially started testing the system. This graph is available to all business and enterprise users.

Detecting zero-days before zero-day

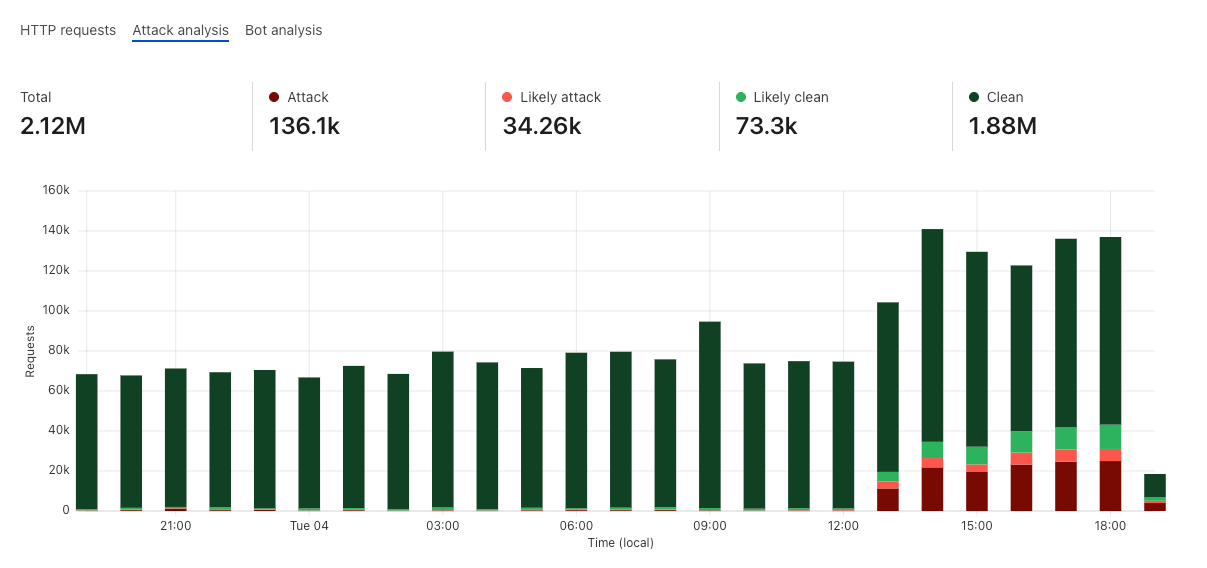
All that remains, is to actually use the score!

Success in the wild

The classifier has been deployed for just over a year on Cloudflare’s network. The main question stated at the start of this post remains: does it work? Have we been able to detect attacks before we’ve seen them? Have we achieved zero time to mitigate?

To answer this we track classification output for new CVEs that fail to be detected by existing Cloudflare Managed Rules. Of course our rule improvement work is always ongoing, but this gives us an idea on how well the system is performing.

And the answer: YES. For all CVEs or bypasses that rely on syntax similar to existing vulnerabilities, the classifier performs very well, and we have observed several instances of it blocking valid malicious payloads that were not detected by our signatures. All of this, while keeping false positives very low at a threshold of 15 or below. XSS variations, SQLi CVEs, are in most cases, a problem fully solved if the classifier is deployed.

One recent example is a set of Sitecore vulnerabilities that were disclosed in June 2023 listed below:

CVE Date Score Signature match Classification match (score less than 10)
CVE-2023-35813 06/17/2023 9.8 CRITICAL Not at time of announcement Yes
CVE-2023-33653 06/06/2023 8.8 HIGH Not at time of announcement Yes
CVE-2023-33652 06/06/2023 8.8 HIGH Not at time of announcement Yes
CVE-2023-33651 06/06/2023 7.5 HIGH Not at time of announcement Yes

The CVEs listed above were not detected by Cloudflare Managed Rules, but were correctly detected and classified by our model. Customers that had the score deployed in a rule in June 2023, would have been protected in zero time.

This does not mean there isn’t space for further improvement.

The classification works very well for attack types that are aligned, or somewhat similar to existing attack types. If the payload implements a brand new never seen before syntax, then we still have some work to do. Log4Shell is actually a very good example of this. If another zero-day vulnerability was discovered that leveraged the JNDI Java syntax, we are confident that our customers who have deployed WAF rules using the WAF Attack Score would be safe against it.

We are already working on adding more detection capabilities including web shell detection and open redirects/path traversal.

The perfect feedback loop

I mentioned earlier that our security analyst driven improvements to our Cloudflare Managed Rulesets are not going to stop. Our public changelog is full of activity and there is no sign of slowing down.

There is a good reason for this: the signature based system will remain, and likely eventually be converted to our training set generation tool. But not only that, it also provides an opportunity to speed up improvements by focusing on reviewing malicious traffic that is classified by our machine learning system but not detected by our signatures. The delta between the two systems is now one of the main focuses of attention for our security analyst team. The diagram below visualizes this concept.

Detecting zero-days before zero-day

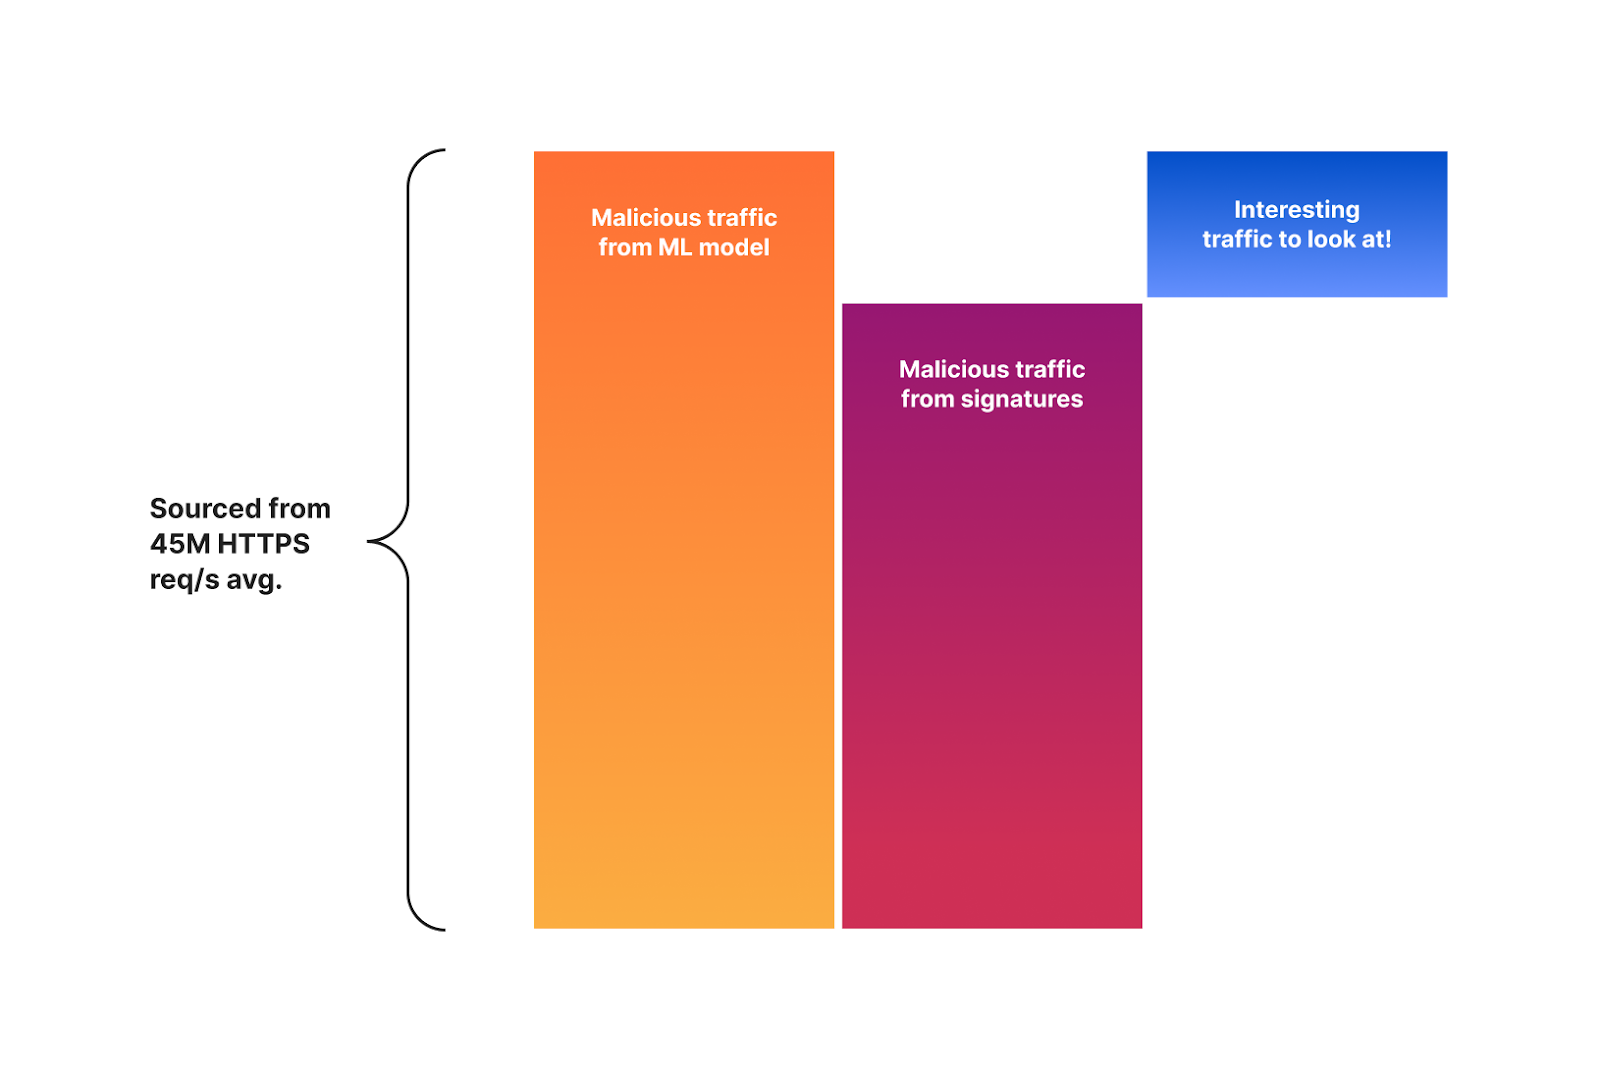
It is this delta that is helping our team to further fine tune and optimize the signatures themselves. Both to match malicious traffic that is bypassing the signatures, and to reduce false positives. You can now probably see where this is going as we are starting to build the perfect feedback loop.

Detecting zero-days before zero-day

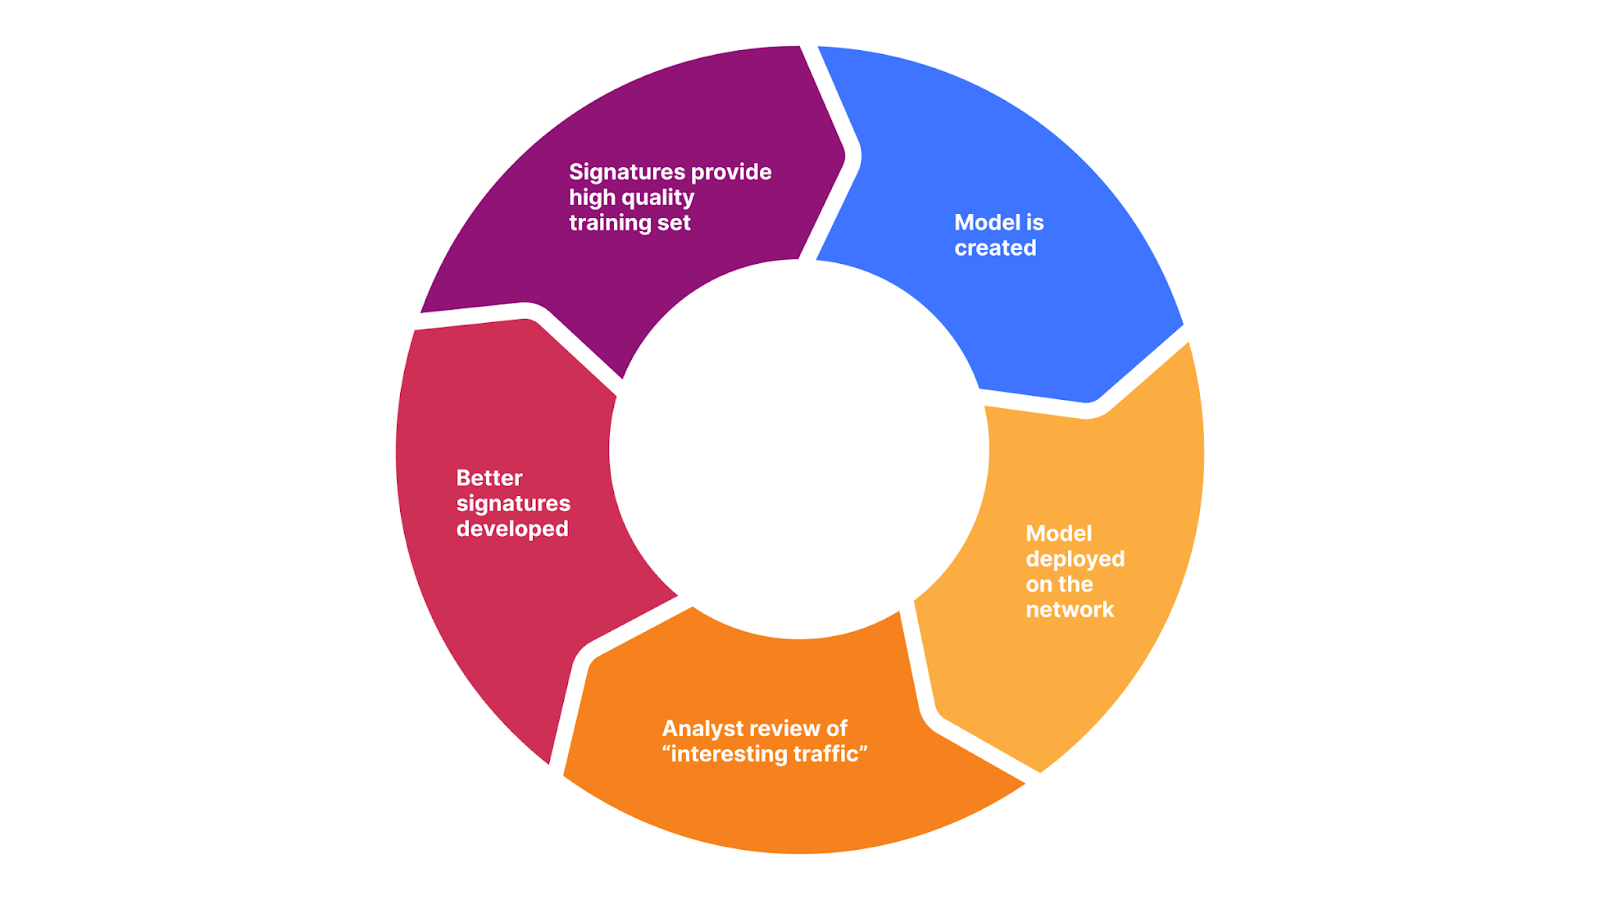
Better signatures provide a better training set (data). In turn, we can create a better model. The model will provide us with a more interesting delta, which, once reviewed by humans, will allow us to create better signatures. And start over.

We are now working to automate this entire process with the goal of having humans simply review and click to deploy. This is the leading edge for WAF zero-day mitigation in the industry.

Summary

One of the main value propositions of any web application security product is the ability to detect novel attack vectors before they can cause an issue, allowing internal teams time to patch and remediate the underlying codebase. We call this time to mitigate. The ideal value is zero.

We’ve put a lot of effort and research into a machine learning system that augments our existing signature based system to yield very good classification results of new attack vectors the first time they are seen. The system outputs a score that we call the WAF Attack Score. We have validated that for many CVEs, we are indeed able to correctly classify malicious payloads on the first attempt and provide Sitecore CVEs as an example.

Moving forward, we are now automating a feedback loop that will allow us to both improve our signatures faster, to then subsequently iterate on the model and provide even better detection.

The system is live and available to all our customers in the business or enterprise plan. Log in to the Cloudflare dashboard today to receive instant zero-day mitigation.

Post-quantum cryptography goes GA

Post Syndicated from Wesley Evans original http://blog.cloudflare.com/post-quantum-cryptography-ga/

Post-quantum cryptography goes GA

Post-quantum cryptography goes GA

Over the last twelve months, we have been talking about the new baseline of encryption on the Internet: post-quantum cryptography. During Birthday Week last year we announced that our beta of Kyber was available for testing, and that Cloudflare Tunnel could be enabled with post-quantum cryptography. Earlier this year, we made our stance clear that this foundational technology should be available to everyone for free, forever.

Today, we have hit a milestone after six years and 31 blog posts in the making: we’re starting to roll out General Availability1 of post-quantum cryptography support to our customers, services, and internal systems as described more fully below. This includes products like Pingora for origin connectivity, 1.1.1.1, R2, Argo Smart Routing, Snippets, and so many more.

This is a milestone for the Internet. We don't yet know when quantum computers will have enough scale to break today's cryptography, but the benefits of upgrading to post-quantum cryptography now are clear. Fast connections and future-proofed security are all possible today because of the advances made by Cloudflare, Google, Mozilla, the National Institutes of Standards and Technology in the United States, the Internet Engineering Task Force, and numerous academic institutions

Post-quantum cryptography goes GA

What does General Availability mean? In October 2022 we enabled X25519+Kyber as a beta for all websites and APIs served through Cloudflare. However, it takes two to tango: the connection is only secured if the browser also supports post-quantum cryptography. Starting August 2023, Chrome is slowly enabling X25519+Kyber by default.

The user’s request is routed through Cloudflare’s network (2). We have upgraded many of these internal connections to use post-quantum cryptography, and expect to be done upgrading all of our internal connections by the end of 2024. That leaves as the final link the connection (3) between us and the origin server.

We are happy to announce that we are rolling out support for X25519+Kyber for most inbound and outbound connections as Generally Available for use including origin servers and Cloudflare Workers fetch()es.

Plan Support for post-quantum outbound connections
Free Started roll-out. Aiming for 100% by the end of the October.
Pro and business Aiming for 100% by the end of year.
Enterprise Roll-out begins February 2024. 100% by March 2024.

For our Enterprise customers, we will be sending out additional information regularly over the course of the next six months to help prepare you for the roll-out. Pro, Business, and Enterprise customers can skip the roll-out and opt-in within your zone today, or opt-out ahead of time using an API described in our companion blog post. Before rolling out for Enterprise in February 2024, we will add a toggle on the dashboard to opt out.

If you're excited to get started now, check out our blog with the technical details and flip on post-quantum cryptography support via the API!

What’s included and what is next?

With an upgrade of this magnitude, we wanted to focus on our most used products first and then expand outward to cover our edge cases. This process has led us to include the following products and systems in this roll out:

1.1.1.1
AMP
API Gateway
Argo Smart Routing
Auto Minify
Automatic Platform Optimization
Automatic Signed Exchange
Cloudflare Egress
Cloudflare Images
Cloudflare Rulesets
Cloudflare Snippets
Cloudflare Tunnel
Custom Error Pages
Flow Based Monitoring
Health checks
Hermes
Host Head Checker
Magic Firewall
Magic Network Monitoring
Network Error Logging
Project Flame
Quicksilver
R2 Storage
Request Tracer
Rocket Loader
Speed on Cloudflare Dash
SSL/TLS
Traffic Manager
WAF, Managed Rules
Waiting Room
Web Analytics

If a product or service you use is not listed here, we have not started rolling out post-quantum cryptography to it yet. We are actively working on rolling out post-quantum cryptography to all products and services including our Zero Trust products. Until we have achieved post-quantum cryptography support in all of our systems, we will publish an update blog in every Innovation Week that covers which products we have rolled out post-quantum cryptography to, the products that will be getting it next, and what is still on the horizon.

Products we are working on bringing post-quantum cryptography support to soon:

Cloudflare Gateway
Cloudflare DNS
Cloudflare Load Balancer
Cloudflare Access
Always Online
Zaraz
Logging
D1
Cloudflare Workers
Cloudflare WARP
Bot Management

Why now?

As we announced earlier this year, post-quantum cryptography will be included for free in all Cloudflare products and services that can support it. The best encryption technology should be accessible to everyone – free of charge – to help support privacy and human rights globally.

As we mentioned in March:

“What was once an experimental frontier has turned into the underlying fabric of modern society. It runs in our most critical infrastructure like power systems, hospitals, airports, and banks. We trust it with our most precious memories. We trust it with our secrets. That’s why the Internet needs to be private by default. It needs to be secure by default.”

Our work on post-quantum cryptography is driven by the thesis that quantum computers that can break conventional cryptography create a similar problem to the Year 2000 bug. We know there is going to be a problem in the future that could have catastrophic consequences for users, businesses, and even nation states. The difference this time is we don’t know how the date and time that this break in the computational paradigm will occur. Worse, any traffic captured today could be decrypted in the future. We need to prepare today to be ready for this threat.

We are excited for everyone to adopt post-quantum cryptography into their systems. To follow the latest developments of our deployment of post-quantum cryptography and third-party client/server support, check out pq.cloudflareresearch.com and keep an eye on this blog.

***

1We are using a preliminary version of Kyber, NIST’s pick for post-quantum key agreement. Kyber has not been finalized. We expect a final standard to be published in 2024 under the name ML-KEM, which we will then adopt promptly while deprecating support for X25519Kyber768Draft00.

Découvrez les menaces qui se dissimulent dans votre boîte aux lettres Office 365 avec Cloudflare Email Retro Scan

Post Syndicated from Ayush Kumar original http://blog.cloudflare.com/fr-fr/threats-lurking-office-365-cloudflare-email-retro-scan-fr-fr/


Nous annonçons maintenant la possibilité pour les clients de Cloudflare d’analyser les anciens messages dans leurs boîtes de réception Office 365 afin de détecter les menaces. Le service Retro Scan vous permet de revenir sept jours en arrière, afin d’identifier les menaces qui n’ont pas été détectées par votre outil de sécurité actuel.

Pourquoi exécuter le service Retro Scan

Lorsque nous échangeons avec nos clients, ces derniers nous apprennent souvent qu’ils n’ont pas connaissance de l’état des boîtes aux lettres de leur entreprise. Les entreprises disposent d’un outil de sécurité des e-mails, ou elles utilisent la protection intégrée de Microsoft, mais elles ne sont pas en mesure de comprendre l’efficacité de leur solution actuelle. Nous constatons que les filtres de ces outils laissent souvent passer des e-mails malveillants, augmentant le risque de compromission de données au sein des entreprises.

Conformément à notre engagement de contribuer à bâtir un Internet meilleur, nous permettons désormais aux clients de Cloudflare d’utiliser Retro Scan pour analyser les messages dans leurs boîtes de réception à l’aide de nos modèles d’apprentissage automatique avancés – et ce, gratuitement. Notre service Retro Scan détectera et mettra en évidence toutes les menaces que nous identifions, afin de permettre aux clients d’éliminer les menaces contenues dans leurs boîtes de réception en remédiant directement à celles-ci depuis leurs comptes de messagerie. Avec ces informations, les clients peuvent également mettre en œuvre des contrôles supplémentaires, tels que l’utilisation de Cloudflare ou de la solution de leur choix, afin d’éviter que des menaces similaires ne parviennent leurs boîtes aux lettres à l’avenir.

Exécuter le service Retro Scan

Les clients peuvent accéder au tableau de bord de Cloudflare ; l’option Retro Scan se trouve sous l’onglet Area 1 :

Pour permettre à Cloudflare d’accéder aux messages à analyser, vous devez autoriser l’analyse des messages par l’application. Pour démarrer ce processus, accordez à Cloudflare les autorisations nécessaires pour exécuter l’analyse des messages. Une deuxième autorisation est nécessaire pour permettre à l’application Cloudflare d’accéder à Active Directory, afin de déterminer quels utilisateurs font partie de l’entreprise, ainsi que les groupes auxquels ils appartiennent ; ceci permet à nos algorithmes de mieux évaluer le caractère malveillant d’un message.

Une fois toutes les autorisations accordées, il reste une dernière étape : sélectionnez les domaines que vous souhaitez analyser, puis fournissez les informations requises concernant les autres fournisseurs de solutions de sécurité des e-mails utilisées pour protéger vos boîtes de réception.

Enfin, les clients peuvent cliquer sur « Generate Retro Scan » ; la solution de sécurité des e-mails Cloudflare Area 1 commencera alors à analyser les anciens messages. Puisque ce processus demande du temps, nous vous informerons par e-mail lorsque l’analyse sera terminée.

Analyse des résultats

Le service vous fournira une analyse rapide des menaces que nous avons détectées dans les boîtes de réception de votre entreprise. La section supérieure présente toutes les détections par type, indiquant le nombre de messages correspondant à chacune de ces catégories : Malicious (malveillants), Suspicious (suspects), Spoof (imitation), Spam (indésirables) et Bulk (envoi en masse). Nous mettons également en évidence les détections les plus importantes, qui requièrent votre attention, sous la catégorie Phish (phishing). Vous pouvez à tout moment cliquer sur le bouton Search (Rechercher) pour obtenir plus d’informations sur les e-mails portant ces intitulés.

Le rapport présente également les employés les plus fréquemment ciblés, ainsi que les endroits d’où proviennent le plus souvent les menaces. Toutes ces statistiques sont destinées à vous permettre de mieux comprendre ce qui se passe dans la boîte de réception de votre entreprise.

Comment s’inscrire ?

Le service Retro Scan est actuellement proposé en version bêta fermée. Si vous souhaitez exécuter le service Retro Scan sur vos domaines de messagerie Office 365, veuillez contacter votre interlocuteur chez Cloudflare, et nous ajouterons le service à votre compte.

Après avoir exécuté le service Retro Scan et examiné les résultats, vous pouvez choisir d’acheter la solution Cloudflare Area 1 afin d’empêcher les menaces futures d’atteindre votre boîte de réception ou choisir de mettre en place une évaluation du risque lié au phishing, qui propose un essai gratuit pendant 30 jours du produit Area 1. Si le service Retro Scan est un excellent outil pour détecter les menaces latentes, l’évaluation des risques liés au phishing peut vous aider à acquérir une meilleure visibilité de l’ensemble des outils que nous proposons pour protéger les boîtes aux lettres.

Pour commencer, vous pouvez cliquer sur le bouton Request Trial (Demander un essai) en bas du rapport Retro Scan, puis renseigner le formulaire correspondant ; un collaborateur de Cloudflare vous contactera alors, ou vous pouvez contacter directement votre interlocuteur Cloudflare.

Sehen Sie, welche Bedrohungen in Ihrem Office 365 lauern – mit dem Retro Scan von Cloudflare für E-Mails

Post Syndicated from Ayush Kumar original http://blog.cloudflare.com/de-de/threats-lurking-office-365-cloudflare-email-retro-scan-de-de/


Ab sofort können Cloudflare-Kunden alte Nachrichten in ihren Office 365-Postfächern auf Bedrohungen hin scannen. Mit dem Retro Scan können Sie jeweils die vergangenen sieben Tage überprüfen, um zu sehen, welche Bedrohungen Ihrem aktuellen E-Mail-Sicherheitstool entgangen sind.

Gründe für den Einsatz eines Retro Scan

Kunden berichten uns oft, dass sie nicht wissen, in welchem Zustand die E-Mail-Postfächer ihrer Unternehmen sind. Firmen nutzen ein E-Mail-Sicherheitstool oder den bei Microsoft integrierten Schutz. Oft ist wissen sie aber nicht, wie effektiv ihre aktuelle Lösung tatsächlich arbeitet. Wir haben festgestellt, dass schädliche E-Mails von diesen Werkzeugen oft nicht herausgefiltert werden, wodurch sich das Risiko einer Kompromittierung innerhalb des Unternehmens erhöht.

Im Rahmen unserer Bemühungen, ein besseres Internet zu schaffen, stellen wir Cloudflare-Kunden nun einen Retro Scan zur Verfügung. Mit diesem können sie Nachrichten in ihren Postfächern unter Einsatz fortschrittlicher Machine Learning-Modelle kostenlos scannen. Unser Retro Scan erkennt Bedrohungen und weist auf diese hin, sodass Kunden ihre Postfächer durch eine Behebung innerhalb ihrer E-Mail-Konten bereinigen können. Mit diesen Informationen sind sie außerdem in der Lage, herkömmliche Kontrollen zu implementieren. Sie können also Cloudflare oder ihre bevorzugte Lösung einsetzen, um vergleichbare Bedrohungen in Zukunft daran zu hindern, ihre Postfach überhaupt erst zu erreichen.

Einsatz des Retro Scan

Kunden finden im Cloudflare-Dashboard unter der Registerkarte Area 1 die Option „Retro Scan“:

Um zum Scannen auf die Nachrichten zugreifen zu können, benötigt Cloudflare eine entsprechende Berechtigung. Diese müssen Sie zunächst erteilen.Eine zweite Autorisierung erlaubt der Cloudflare-Anwendung den Zugriff auf Active Directory. Das ist notwendig, um in Erfahrung zu bringen, welche Nutzer zu dem Unternehmen gehören und welchen Gruppen sie angehören. Dies erleichtert es unseren Algorithmen, eine Einschätzung dazu zu treffen, ob eine Nachricht schädlich ist.

Nachdem alle Genehmigungen erteilt wurden, bleibt noch ein letzter Schritt: Sie müssen auswählen, welche Domains gescannt werden und uns Informationen zu den anderen E-Mail-Sicherheitsdiensten zukommen lassen, die Ihre Postfächer schützen.

Zu guter Letzt können Kunden per Klick auf „Generate Retro Scan“ die E-Mail-Sicherheitslösung Cloudflare Area 1 dazu veranlassen, mit dem Scan älterer Nachrichten zu beginnen. Da dieser Vorgang eine gewisse Zeit in Anspruch nimmt, werden die Kunden per E-Mail vom Abschluss des Scans informiert.

Analyse der Ergebnisse

Ihnen wird ein kurzer Überblick über die in den Postfächern Ihres Unternehmens aufgespürten Bedrohungen angezeigt. Im obersten Abschnitt werden alle ermittelten Bedrohungen nach Typ in Kategorien unterteilt. Hier sehen sie, wie viele schädliche, verdächtige und gefälschte Nachrichten sowie Spam- und Massennachrichten Sie jeweils erhalten haben. Unter „Phish emails“ heben wir die Nachrichten hervor, die die größte Aufmerksamkeit verdienen. Sie können sich jederzeit mit einem Klick auf das Suchfeld weitere Informationen über die entsprechend gekennzeichneten E-Mails anzeigen lassen.

In dem Bericht werden auch die Mitarbeitenden herausgehoben, die am stärksten zur Zielscheibe geworden sind, sowie die häufigsten Ursprünge von Bedrohungen. Diese Statistiken sollen Ihnen eine klarere Vorstellung davon vermitteln, was in den Postfächern Ihres Unternehmens vor sich geht.

Sie möchten sich registrieren? So funktioniert’s

Der Retro Scan ist zurzeit als Closed Beta-Version verfügbar. Falls Sie daran interessiert sind, ihn bei Ihren Office 365-E-Mail-Domains einzusetzen, wenden Sie sich gern an Ihre Ansprechpartnerin oder Ihren Ansprechpartner bei Cloudflare. Wir schalten diese Funktion dann für Ihr Konto frei.

Nachdem Sie einen Retro Scan durchgeführt und die Ergebnisse in Augenschein genommen haben, können Sie entweder zur Abschirmung Ihres Postfachs vor künftigen Bedrohungen Cloudflare Area 1 erwerben oder eine Phishing-Risikowertung vornehmen lassen, wobei es sich um eine 30-tägige kostenlose Probeversion des Area 1-Produkts handelt. Der Retro Scan ist ein großartiges Werkzeug zur Ermittlung latenter Bedrohungen. Eine Phishing-Risikobewertung hilft Ihnen dabei, sich einen besseren Überblick über alle Tools zu verschaffen, mit denen wir dafür sorgen, dass Postfächer nicht infiziert werden.

Zum Einstieg können Sie auf die Schaltfläche „Request Trial“ am Ende des Retro Scan-Berichts klicken und das daraufhin angezeigte Formular ausfüllen. Einer bzw. eine unserer Mitarbeitenden wird sich dann mit Ihnen in Verbindung setzen. Sie können sich aber auch direkt an Ihren Ansprechpartner bzw. Ihre Ansprechpartnerin bei Cloudflare wenden.

Veja quais ameaças estão escondidas no seu Office 365 com o Cloudflare Email Retro Scan

Post Syndicated from Ayush Kumar original http://blog.cloudflare.com/pt-br/threats-lurking-office-365-cloudflare-email-retro-scan-pt-br/


Agora anunciamos a possibilidade de os clientes da Cloudflare verificarem mensagens antigas em suas caixas de entrada do Office 365 em busca de ameaças. Este Retro Scan permitirá que você analise sete dias atrás e veja quais ameaças sua ferramenta de segurança de e-mail atual deixou passar.

Por que executar um Retro Scan

Conversando com os clientes, ouvimos frequentemente que eles não sabem o estado das caixas de entrada de suas organizações. As organizações possuem uma ferramenta de segurança de e-mail ou usam a proteção integrada da Microsoft, mas não entendem a eficácia de sua solução atual. Descobrimos que essas ferramentas muitas vezes permitem que e-mails maliciosos passem por seus filtros, aumentando o risco de comprometimento dentro da empresa.

Em nossa busca para ajudar a construir uma internet melhor, disponibilizamos para os clientes da Cloudflare o uso do Retro Scan para verificar mensagens em suas caixas de entrada usando nossos modelos avançados de aprendizado de máquina gratuitamente. Nosso Retro Scan detecta e destaca quaisquer ameaças que encontrarmos, assim os clientes podem limpar suas caixas de entrada tratando-as em suas contas de e-mail. Com essas informações, os clientes também podem implementar controles adicionais, como usar a Cloudflare ou sua solução preferida, para evitar que ameaças semelhantes cheguem às suas caixas de entrada no futuro.

Executar um Retro Scan

Os clientes podem navegar até o painel da Cloudflare, onde verão na guia Area 1 a opção Retro Scan:

Para poder acessar as mensagens, a Cloudflare precisa de autorização para poder verificar as mensagens. Você inicia esse processo fornecendo à Cloudflare as permissões apropriadas para verificar as mensagens. A segunda autorização permite que o aplicativo da Cloudflare acesse o Active Directory. Isso é necessário para entender quais usuários estão dentro da organização e a quais grupos eles pertencem, o que ajuda nossos algoritmos a avaliar melhor se uma mensagem é maliciosa.

Depois que todas as autorizações forem concedidas, você terá uma etapa final que é escolher quais domínios vamos verificar e nos fornecer informações sobre outros fornecedores de segurança de e-mail que estão protegendo suas caixas de entrada.

Por fim, os clientes podem clicar em “Gerar Retro Scan”, o que fará com que o Cloudflare Area 1 Email Security comece a verificar as mensagens mais antigas. Como esse processo é demorado, fornecemos aos clientes um alerta por e-mail quando a verificação estiver concluída.

Analise dos resultados

O que vai ser apresentado a você é uma rápida análise das ameaças que encontramos nas caixas de entrada de e-mail de sua organização. A seção superior divide todas as nossas detecções por tipo. Aqui você pode encontrar a contagem de mensagens maliciosas, suspeitas, falsas, spam e em massa. Também destacamos aquelas mais importantes a serem observadas nos e-mails de phishing. A qualquer momento você pode clicar no botão Pesquisar para obter mais informações sobre os e-mails com esses marcadores.

O relatório também mostra os principais funcionários visados, bem como os locais mais comuns de origem das ameaças. Todas essas estatísticas têm como objetivo fornecer uma melhor compreensão do que está acontecendo na caixa de entrada da sua empresa.

Como faço para me cadastrar

O Retro Scan está atualmente em beta fechado. Se você tiver interesse em executar uma verificação retroativa em seus domínios de e-mail do Office 365, fale com seu contato da Cloudflare e nós o adicionaremos à sua conta.

Depois de executar o Retro Scan e ver os resultados, você pode optar por adquirir o Cloudflare Area 1 para evitar que ameaças futuras cheguem à sua caixa de entrada ou optar por configurar uma avaliação de risco de phishing, que é uma avaliação gratuita de 30 dias do produto Area 1. Embora o Retro Scan seja uma ótima ferramenta para ver quais ameaças latentes existem, uma avaliação de risco de phishing pode ajudá-lo a obter melhor visibilidade sobre todas as ferramentas que temos para manter as caixas de entrada limpas.

Para começar, você pode clicar no botão “Solicitar avaliação” na parte inferior do relatório Retro Scan, preencher o formulário correspondente e alguém da Cloudflare entrará em contato ou você pode falar diretamente com seu contato da Cloudflare.

Descubre qué amenazas acechan tu buzón de correo de Office 365 con Cloudflare Email Retro Scan

Post Syndicated from Ayush Kumar original http://blog.cloudflare.com/es-es/threats-lurking-office-365-cloudflare-email-retro-scan-es-es/


Ahora los clientes de Cloudflare pueden analizar viejos mensajes de sus bandejas de entrada de Office 365 en busca de amenazas. Retro Scan te permitirá observar qué amenazas ha pasado por alto tu actual herramienta de seguridad del correo electrónico en los últimos siete días.

Por qué ejecutar Retro Scan

Al hablar con los clientes, solemos escuchar que no conocen el estado de los buzones de correo de sus organizaciones. Las organizaciones tienen una herramienta de seguridad para correo electrónico o usan la protección integrada de Microsoft, pero no entienden qué nivel de efectividad tiene la actual solución. A menudo, descubrimos que estas herramientas permiten el paso de correos electrónicos maliciosos a través de sus filtros, lo que aumenta el riesgo en la empresa.

En nuestra búsqueda de ayudar a crear un mejor servicio de Internet, permitimos a los clientes de Cloudflare el uso de Retro Scan para analizar mensajes en sus buzones de entrada con nuestros modelos de aprendizaje automático avanzados, ¡gratis! Nuestro Retro Scan detecta y resalta las amenazas que encontramos para que los clientes puedan limpiar sus buzones de entrada y gestionarlas dentro de sus cuentas de correo electrónico. Con esta información, los clientes también pueden implementar controles adicionales, como el uso de Cloudflare o las soluciones que prefieran, para evitar que amenazas similares lleguen a sus casillas de correo en el futuro.

Cómo ejecutar Retro Scan

Los clientes pueden ir al panel de Cloudflare y allí verán debajo de la pestaña Área 1 la opción de Retro Scan:

Para poder tener acceso a los mensajes, Cloudflare necesita tener autorización para analizarlos. Para comenzar este proceso, debes brindar a Cloudflare los permisos correspondientes para analizar los mensajes. La segunda autorización permitirá que la aplicación de Cloudflare acceda al directorio activo. Eso es necesario para comprender qué usuarios están en la organización y a qué grupos pertenecen, lo que ayuda a que nuestros algoritmos evalúen mejor si un mensaje es malicioso.

Una vez que se conceden todas las autorizaciones, queda un último paso que consiste en elegir qué dominios queremos analizar y se nos facilita información sobre los demás proveedores de seguridad de correo electrónico que protegen tus bandejas de entrada.

Por último, los clientes pueden hacer clic en “Generar Retro Scan” que hará que Cloudflare Area 1 Email Security comience a analizar los mensajes más antiguos.Como este proceso lleva tiempo, avisamos a los clientes por correo electrónico cuando finaliza el análisis.

Cómo analizar los resultados

Se te brindará un detalle de las amenazas que encontramos en las bandejas de entrada de correo electrónico de tu organización.La sección superior muestra todas las detecciones por tipo. Aquí puedes encontrar el recuento de mensajes maliciosos, sospechosos, con suplantación de identidad, spam y mensajes masivos. También destacamos los más importantes a tener en cuenta en los correos electrónicos de phishing. En cualquier momento, puedes hacer clic en el botón Buscar para obtener más información sobre los correos electrónicos con esas etiquetas.

El informe también muestra los empleados que han recibido la mayor cantidad de ataques y los lugares más comunes de donde provienen las amenazas. Todas estas estadísticas sirven para comprender mejor lo que ocurre en la bandeja de entrada de tu empresa.

Cómo registrarse

El Retro Scan se encuentra actualmente en fase beta cerrada.Si te interesa ejecutar Retro Scan en tus dominios de correo electrónico de Office 365, comunícate con tu contacto de Cloudflare y lo incorporaremos a tu cuenta.

Después de ejecutar Retro Scan y ver los resultados, puedes optar por comprar Cloudflare Area 1 para evitar que futuras amenazas lleguen a tu bandeja de entrada o configurar una evaluación de riesgos de phishing, que es una prueba gratuita de 30 días del producto Área 1. Si bien Retro Scan es una excelente herramienta para ver qué amenazas latentes existen, una evaluación del riesgo de phishing puede ayudarte a obtener una mejor visibilidad de todas las herramientas que tenemos para mantener limpios los buzones de correo.

Para empezar, puedes hacer clic en el botón “Solicitar prueba” de la parte inferior del informe de Retro Scan, completar el formulario correspondiente y una persona de Cloudflare se pondrá en contacto contigo, o puedes comunicarte directamente con tu contacto de Cloudflare.

클라우드, 네트워크, 애플리케이션 및 사용자를 연결하고 보호하는 현대적인 방법인 클라우드 연결성으로 여러분을 모십니다

Post Syndicated from Jen Taylor original http://blog.cloudflare.com/ko-kr/welcome-to-connectivity-cloud-ko-kr/


Welcome to connectivity cloud: the modern way to connect and protect your clouds, networks, applications and users

우리가 근무하면서 가장 좋아하는 부분은 Cloudflare 고객과 대화하는 시간입니다. 고객의 IT 및 보안 문제에 대하여 항상 새롭고 흥미로운 사실을 알게 됩니다.

최근 이러한 대화에 변화가 있었습니다. 고객이 언급하는 가장 큰 문제를 쉽게 정의할 수 없는 경우가 점점 더 많아집니다. 그리고 이러한 문제는 개별 제품이나 주요 기능으로 대처할 수 없는 것입니다.

더 정확히 말하면 IT 및 보안 팀에서는 디지털 환경에 대한 제어 능력을 잃고 있다고 이야기합니다.

제어 능력 상실은 다양한 형태를 띱니다. 고객은 호환성이 걱정되므로 필요성은 알지만 새로운 기능을 채택하는 것을 꺼리는 모습을 보일 수 있습니다. 아니면 비교적 단순한 변경 사항을 적용하는 데 시간과 노력이 많이 들며, 이러한 변경 사항 때문에 더 큰 영향력이 있을 작업에 투입할 시간을 빼앗기고 있다고 언급할 수도 있습니다. 고객이 느끼는 감정을 요약하자면 “팀이나 예산의 규모가 아무리 크더라도 비즈니스를 완벽하게 연결하고 보호하는 데는 절대 충분하지 않다”는 것입니다.

익숙하게 느껴지는 부분이 있으신가요? 그런 부분이 있다 해도 여러분 혼자 그렇게 느끼는 건 아닙니다.

제어 능력을 상실하는 이유

IT 및 보안이 바뀌는 속도는 빨라지고 있으며 무섭도록 복잡해지고 있습니다. IT 및 보안 팀에서는 과거에 비해 더 다양한 기술 도메인을 책임지고 있습니다. 최근 Forrester 연구에서 확인된 변화에 따르면 사내, 원격, 하이브리드 근무자를 보호할 책임이 있는 팀의 52%만이 지난 5년 동안 이러한 책임을 맡았습니다. 한편 46%는 해당 기간 동안 퍼블릭 클라우드 애플리케이션을 관리하고 보호할 책임이 생겼습니다. 그리고 53%는 규제 준수로 인한 어려운 문제를 떠맡았습니다.

IT 및 보안 팀에는 엄청난 과제가 생겼습니다. 원격 팀, 온프레미스 팀 및 인프라, 다양한 클라우드 환경, SaaS 앱 등을 연결하여 이들 모두가 안전한 단일 환경처럼 작동하게 만들어야 했습니다. 하지만 이 작업은 다양한 이유로 쉽지 않습니다.

  • 대부분의 기업에서는 전용 인프라, 고유한 규제 준수 요구, 준호환성 프로세스 및 구성으로 인해 클라우드, SaaS 앱, 웹 앱, 온프레미스 인프라를 연결하는 것이 어렵습니다. 간단히 말하자면 이들 도메인은 쉽고 안전하게 함께 작동하도록 구축되지 않았습니다.
  • 콘웨이의 법칙에 따르면 시스템은 조직의 커뮤니케이션 구조와 일치하는 경향이 있습니다. 팀 자체의 잘못은 아니지만, 수많은 IT 및 보안 팀이 상당히 단절되어 있습니다.

IT 및 보안은 언제 차선책과 복잡하게 얽힌 상호 의존성에 발목을 잡혀도 이상하지 않습니다.

다행히 Cloudflare에서는 전향적인 방법을 찾아냈습니다.

클라우드 연결성에 오신 것을 환영합니다

흔히 고객과의 대화에서 중요한 것은 행간을 읽는 능력입니다. 고객은 제어 능력 상실을 언급할 때, 명시하지는 않지만, 존재하지 않는다고 생각하는 무언가를 원하는 것처럼 보입니다. 고객은 IT 및 보안에서 담당하는 모든 것을 위한 연결 조직을 원합니다. 즉, 환경의 모든 것을 다루고, 모든 곳에서 제공되며, 필요한 모든 보안, 네트워킹, 개발 기능을 수행하여 복잡성을 줄이는 무언가를 필요로 합니다.

추가 연구 결과 우리의 짐작이 확신으로 바뀌었습니다. IT 및 보안 리더를 대상으로 진행한 설문조사에서는 이들 중 72%가 안전한 “모든 용도에 사용 가능한” 클라우드 플랫폼을 높이 평가하는 것으로 확인되었습니다. 그리고 이들은 전체 IT 및 보안 예산에서 평균 16%를 이러한 플랫폼에 투자할 의향이 있음을 밝혔습니다.

따라서 Cloudflare에서는 이런 클라우드 플랫폼이 정확히 어떤 모습일지 생각하기 시작했습니다. 그 플랫폼에서 필요한 모든 작업을 어떻게 수행할 수 있을까요?

우리가 찾은 해답을 공유합니다. 바로 클라우드 연결성입니다.

클라우드 연결성은 디지털 환경을 보호하고 연결하기 위해 기업에서 필요로 하는 다양한 서비스를 제공하는 새로운 접근법입니다. 클라우드 연결성은 프로그래밍 가능한 클라우드 네이티브 서비스의 통합 인텔리전스 플랫폼으로, 모든 네트워크(엔터프라이즈 및 인터넷), 클라우드 환경, 애플리케이션, 사용자 사이에 모든 용도에 사용 가능한 연결을 가능하게 해줍니다. 클라우드 연결성에는 수많은 보안, 성능, 개발자 서비스가 포함됩니다. 그 주안점은 모든 것을 모든 장소에서 대체하는 기능이 아니라, 필요한 장소에 탑재하고 중요한 여러 서비스를 단일 플랫폼으로 통합하는 능력입니다.

클라우드 연결성은 4가지 기본 원칙에 따라 구축되었습니다.

  1. 심층 통합 — 조직에서는 인터넷에 의존하여 디지털 환경의 다양한 요소를 근무자, 파트너, 고객과 연결합니다. 클라우드 연결성은 인터넷 및 엔터프라이즈 네트워크와 기본적으로 통합되므로 모든 사용자, 애플리케이션, 인프라 간에 안전하고 대기 시간이 짧으며 무한히 확장 가능한 연결이 가능합니다. 클라우드 연결성은 인터넷만큼 빠르고 직관적이면서도 위험이나 불확실성은 없습니다.
  2. 프로그래밍 가능성 — 모든 엔터프라이즈 디지털 환경에는 독점 인프라, 다양한 클라우드, 고유 규제 준수 요구, 그리고 기타 전용 툴링, 프로세스, 구성이 존재합니다. 클라우드 연결성의 아키텍처는 한계가 없는 상호 운용성과 사용자 지정 가능한 네트워킹을 제공하므로 일관된 사용자 경험 및 효율적인 관리가 가능하며 고유한 요구에 적응할 수 있습니다.
  3. 플랫폼 인텔리전스 — 조직에서는 디지털 환경에서 모든 것을 연결하고 보호하기 위해 다양한 서비스를 필요로 합니다. 하지만 모든 것을 통합하는 것은 부담스러운 일이며 모두 관리하려고 하면 비효율적이고 보안에 구멍이 생깁니다. 잘 설계된 클라우드 연결성에는 기본적으로 다양한 서비스가 구축되어 있으며 자동으로 인텔리전스 모델을 업데이트하기 위해 매우 높은 볼륨의 다양한 트래픽을 분석합니다.
  4. 단순성 — IT 및 보안 서비스가 너무 많으면 대시보드도 너무 많아집니다. 이로 인해 비효율적이 되고, 가시성이 낮아지며, 알림으로 인해 피곤해집니다. 단일 플랫폼으로 100% 통합하는 것이 해답은 아니지만, 클라우드 연결성은 단일 제어판에서 IT 환경의 훨씬 더 많은 부분을 관리하므로 무분별하게 확장되는 도구와 대시보드 과부하가 크게 줄어듭니다.

이러한 특징을 지닌 클라우드 연결성으로 더 많은 제어 능력을 잃지 않는 채로 디지털 환경에 새로운 서비스를 추가할 수 있습니다. 이미 보유하고 있는 서비스에 대한 제어 능력을 다시 확보하는 데도 도움이 됩니다.

Cloudflare의 클라우드 연결성

우리가 이러한 4가지 특성을 특히 중시하는 성향이 있음을 인정합니다. Cloudflare에서는 처음부터 통합, 프로그래밍 가능성, 플랫폼 인텔리전스, 단순성이라는 원칙을 기반으로 서비스를 구축했습니다. 현재 Cloudflare의 전체 포트폴리오는 충분히 포괄적이어서 고객이 수많은 보안 및 IT 요구를 해결할 때 이러한 이점을 누릴 수 있습니다.

이러한 접근법 덕분에 Cloudflare가 세계 최초 클라우드 연결성임이 되었음을 자랑스레 말씀드릴 수 있습니다.

우리가 주장하는 것을 직접 확인해 보세요. 다음은 Cloudflare의 지원으로 제어 능력 문제를 해결한 고객 사례입니다.

Conrad Electric: 전 세계에 걸쳐 분산된 인력의 액세스 보호

클라우드 연결성에서는 프로그래밍 가능성, 심층 네트워크 통합, 기본 제공 인텔리전스를 제공하므로 기업 리소스에 안전한 액세스를 보장하는 데 이상적입니다.

전자제품 소매업체인 Conrad Electronic에서는 “직원을 온라인 상태로 유지하는 것만으로도 다양한 관리 병목 현상이 발생했습니다”라고 이야기합니다. 이 회사에 근무하는 2,300명의 직원 중 절반 가까이가 원격으로 기업 애플리케이션에 액세스해야 하며 이러한 액세스를 활성화는 것은 쉽지 않았습니다. 이를 위해 각 사용자를 대상으로 VPN 클라이언트를 배포하고 구성해야 했으니까요.

Conrad Electronic에서는 이제 Cloudflare의 클라우드 연결성을 이용하여 수백 개의 기업 애플리케이션에 안전한 원격 액세스를 제공합니다. 관리 부담이 크게 줄어들었으며 웹 운영을 개선하는 데 이제 매달 훨씬 더 많은 시간을 투자할 수 있다고 담당자는 이야기합니다. 또한 보안 상태도 개선되었습니다. “한 번의 클릭으로 특정 개인을 제한하거나 중요한 영역을 보호할 수 있습니다. 1,000개의 VPN 프로필을 유지할 필요가 없으므로 보안이 개선되고 시간과 비용이 절약됩니다.”

Carrefour: 고객이 직접 사용하며 신뢰할 수 있는 애플리케이션 제공 및 관리

클라우드 연결성을 이용하면 위협 인텔리전스, 네트워크 통합, 통합 인터페이스로 보안 간극을 훌륭하게 메꿀 수 있으며 전 세계에 걸쳐 애플리케이션을 안전하게 제공할 수 있습니다.

다국적 소매 및 도매 기업인 Carrefour는 호황을 누리며 빠른 성장세를 구가하고 있는 전자 상거래 업체입니다. 그러나 사이버 공격이 늘어났을 때 단순히 보안 스택을 늘리는 것은 도움이 되지 않았습니다. Carrefour 보안 팀 관계자는 “다양한 도구를 바꿔가며 사용하다 보니 아키텍처 조정과 제어가 어려웠습니다… 또한, 여러 도구를 아우르는 통합 기능이 없어 보안 및 성능 문제를 조사하고 해결하는 것이 복잡했고 시간이 오래 걸렸습니다”라고 이야기합니다.

폭넓은 보안 기능 변경의 일환으로 Carrefour에서는 Cloudflare의 클라우드 연결성을 채택하여 웹 악용, zero-day 위협, 악의적 봇 공격을 차단했습니다. 이를 통해 각기 다른 벤더에서 제공하는 5개의 보안 도구를 대체할 수 있었습니다. 그 이후로 Carrefour에서는 사고 해결 시간이 75% 단축되었습니다.

Canva: 혁신적인 애플리케이션 구축

마지막으로 클라우드 연결성의 프로그래밍 가능성과 네트워크 통합은 거의 모든 상황에서 혁신적인 개발을 지원하는 데 도움이 됩니다.

글로벌 설계 대기업인 Canva가 그 좋은 예입니다. 전에 이 회사에서는 다양한 개발자 플랫폼을 이용하여 네트워크 에지에서 사용자 지정 코드를 실행했습니다. 하지만 이러한 서비스를 사용하려면 시간이 너무 오래 걸렸고, 혁신에 방해가 되는 한계에 부딪혀야 했습니다.

Cloudflare의 클라우드 연결성은 “우리 소프트웨어의 중요한 부분”이 되었습니다. Canva에서는 클라우드 연결성의 개발자 서비스를 사용하여 사용자 지정 코드를 작성하고 실행하며 SEO 및 시간 제한 콘텐츠 액세스를 위해 페이지 제공을 최적화합니다. 최근 Canva의 관계자는 우리에게 “당사는 Cloudflare 덕분에 플랫폼이 신속하고 안정적이며 안전하다는 확신을 갖고 제품의 성장과 신규 시장으로의 확장에 집중할 수 있습니다”라고 이야기했습니다.

또한 Canva의 경험은 안전한 액세스 및 애플리케이션 제공을 위해 Cloudflare 제품을 채택하는 것으로 이어졌습니다. 이는 클라우드 연결성을 100% 활용하여 운영하는 경우의 예시를 아주 잘 보여줍니다.

클라우드 연결성에 대해 자세히 알아보세요

고객 덕분에 우리는 혁신을 이룰 수 있으며 클라우드 연결성의 비전도 예외가 아닙니다. 모든 것을 더 쉽고, 빠르며, 안전하고, 연결된 상태로 만들기 위해 노력하고 있습니다. 클라우드 연결성 덕분에 복잡성이 줄어들고 보안이 개선되는 모습을 보게 되어 정말 기쁩니다.

여기에서 클라우드 연결성에 대해 자세히 알아볼 수 있습니다. 하지만 이는 시작일 뿐이라고 생각해 주시면 좋겠습니다. 질문이 있거나 제안할 것이 있으면 Cloudflare로 연락해 주시기 바랍니다. 안전하고 연결된 여정에서 고객을 계속해서 도울 방법을 찾기 위한 대화를 계속할 수 있을 것으로 기대합니다.

Unlock Broader Detections and Forensics with Velociraptor in Rapid7 XDR

Post Syndicated from Shanna Battaglia original https://blog.rapid7.com/2023/09/29/unlock-broader-detections-forensics-with-velociraptor-in-rapid7-xdr/

Unlock Broader Detections and Forensics with Velociraptor in Rapid7 XDR

Nearly 70% of companies that are breached are likely to get breached again within twelve months (CPO). Effective remediation and addressing attacks at the root is key to staying ahead of threats and recurring breaches on the endpoint. Strong Digital Forensics and Incident Response (DFIR) ready to go when any incident occurs is a critical piece of a security team’s toolkit and drives successful response and remediation.

With this in mind, we’re excited to announce the integration of Velociraptor, Rapid7’s leading open-source DFIR framework, into the Insight Platform for InsightIDR Ultimate users — all with no additional deployment or configurations required. Already utilized in the field by our Incident Response experts on behalf of Managed Detection and Response (MDR) customers, InsightIDR Ultimate users can now experience the power of Velociraptor, from daily threat monitoring and hunting to swift threat response.

Key benefits of Velociraptor in InsightIDR:

  • Hunt for threats and vulnerabilities on single endpoints or across the entire fleet conveniently within InsightIDR, enabling faster identification and remediation.
  • Leverage the latest security researcher and practitioner-contributed Artifacts (structured YAML files containing queries) from Velociraptor’s Exchange. This ensures you always have up-to-date coverage across the current threat landscape.
  • Monitor for threat activity as it occurs on the endpoint, and forward matching events to InsightIDR for in-depth investigations into potential threats.
  • Efficiently analyze all of your Velociraptor data inside of InsightIDR with the flexibility of custom Notebooks (used to track and post process hunts or collaborate on an investigation) or the visual navigation of the Virtual File System (a server side cache of the files on the endpoint).
  • Unlock expanded threat detection capabilities – like EVTX or ETW watcher plug-ins to monitor Windows event sources – with Velociraptor’s Client Monitoring feature and forward alert investigations into InsightIDR.
  • Get to the bottom of new threats quickly with the most up-to-date detections thanks to Velociraptor’s expressive query language (rather than code) that makes it faster and easier for teams to share custom detections with the open-source community.

Let’s walk through a potential scenario with InsightIDR and Velociraptor

Jo is a SOC analyst on a team that uses Rapid7 Insight products to monitor and respond to security incidents in a fleet of a few thousand endpoints. This morning, an email notification for a new InsightIDR investigation grabs Jo’s full attention – an endpoint just triggered an alert from a usually quiet detection rule named “Velociraptor – Alert.Windows.ETW.Powershell”, and the data in the preview immediately looks suspicious to Jo.

Jo jumps into InsightIDR to begin their investigation. The endpoint in question has only triggered this single alert so far. It was forwarded from Velociraptor, a recent addition to Jo’s toolset within the Rapid7 Insight Platform. The artifact was one of several they’d deployed to endpoints for continuous monitoring. While InsightIDR and the Sysmon integration could already detect suspicious Powershell commands when included in Process Start commandline arguments, this artifact adds visibility into Windows Powershell ETW provider for logged events.

Jo follows the link to Velociraptor, provided in the InsightIDR Investigation. The link goes directly to the Alert.Windows.ETW.Powershell event page for the endpoint that triggered the investigation. From here, Jo starts a KAPE triage collection on this endpoint. Then they start a hunt across the entire fleet for the indicators of compromise they’ve gathered so far.

Data from Jo’s collection flows into the UI for review. After noticing an unfamiliar grandparent for Powershell in the process list, Jo decides to quarantine the endpoint. They go back to their InsightIDR tab, search for the affected endpoint, and toggle its Quarantine flag. Now that endpoint can only communicate with the Rapid7 Platform, which now includes Velociraptor.  

Among the hundreds in the hunt’s scope, a handful of endpoints return matches for Jo’s initial queries. Jo recruits a few of their teammates to help triage the results and begin deeper investigation. Between Velociraptor’s powerful DFIR capabilities and the skills of Jo’s team, the intruder will be thwarted before completing their mission.  

After the incident response concludes, Jo reviews the new Velociraptor Artifacts they created to detect this new malicious activity. They decide that a few of these will be useful submissions to the Artifact Exchange. They also take the opportunity to browse other recent additions from the DIFR community and deploy a few to their Velociraptor instance.  

With Rapid7’s platform-hosted Velociraptor service, Jo’s team was able to skip another lengthy deployment process and leap right into monitoring and hunting for threats. They were also welcomed to the wider open-source Velociraptor community to share knowledge, threat intel, and DFIR techniques with the practitioners who help Velociraptor thrive.

Learn more about Velociraptor and our expanded endpoint protection.

Easily manage AI crawlers with our new bot categories

Post Syndicated from Reid Tatoris original http://blog.cloudflare.com/ai-bots/

Easily manage AI crawlers with our new bot categories

Easily manage AI crawlers with our new bot categories

Today, we’re excited to announce that any Cloudflare user, on any plan, can choose specific categories of bots that they want to allow or block, including AI crawlers.

As the popularity of generative AI has grown, content creators and policymakers around the world have started to ask questions about what data AI companies are using to train their models without permission. As with all new innovative technologies, laws will likely need to evolve to address different parties' interests and what’s best for society at large. While we don’t know how it will shake out, we believe that website operators should have an easy way to block unwanted AI crawlers and to also let AI bots know when they are permitted to crawl their websites.

The good news is that Cloudflare already automatically stops scraper bots today. But we want to make it even easier for customers to be sure they are protected, see how frequently AI scrapers might be visiting their sites, and respond to them in more targeted ways. We also recognize that not all AI crawlers are the same and that some AI companies are looking for clear instructions for when they should not crawl a public website.

Crawler bots are nothing new. Cloudflare already protects you from scraping today.

Web crawlers have been around for a long time. The first, called World Wide Web Wanderer, was developed back in 1993 to measure the size of the web by counting the total number of accessible web pages. This technique led directly to the creation of the first popular search engine, WebCrawler, in 1994.

And still today, the most common use of a web crawler is for a search engine: Google’s GoogleBot. To provide the most relevant results for searches, crawlers like GoogleBot typically start by visiting web pages and retrieving the HTML content. Search engine operators predefine how much of the crawled HTML files is necessary for indexing, and then the files will be parsed to extract components like text, images, metadata, and links. This extracted data will then be stored in a structured format back on Google’s servers. Extracted links (URLs) are the key to how the crawlers discover new websites. The links that were present in the HTML files are added to a queue of URLs for the crawlers to visit and parse. And URLs are pretty easily spread around the Internet making it easy for crawlers to discover new sites. It can even be a URL that appeared in a referrer header that was stored and published by another web server. This process of following links, parsing, and storing data is recursively repeated allowing search engines to map out the web. All this collected data is then indexed to allow for efficient searching and retrieval of information.

While search engine crawler operations are generally beneficial for a site owner to get their site discovered, there are bot operators that use similar techniques for more malicious purposes such as price scraping to undercut competitor pricing or theft of copyrighted material such as images.

The techniques deployed by AI crawlers are no different. Just like a search engine crawler, they’ll parse HTML content and follow extracted URLs to gather available information. But instead of using it to index the web, this content will be applied as training data for their ML models.

Cloudflare identifies both good and bad crawlers using various systems such as attack signature matching, heuristics, machine learning, and behavioral analysis. All Cloudflare customers using Bot Fight Mode, Super Bot Fight Mode, or Bot Management are already protected from malicious crawlers.

Along with our bot detection tools, we also have a Verified Bot directory that allows responsible and necessary bots, like GoogleBot, to register to be segmented into their own separate detections (fill out a request here if you have a bot you think should be added). We’ve added new functionality to that directory to give our customers more control.

Available now: segment known bots with flexibility and precision

Our new Verified Bot categories are now available in the Cloudflare Rules Engine and Workers. With this granular bot categorization, Cloudflare users get better bot segmentation, and can choose specific responses to specific types of bots. To take advantage of these new bot categories, simply log in to the Cloudflare dash, go to the WAF tab, create a rule, and choose one of the Verified Bot sub categories as the Field.

Easily manage AI crawlers with our new bot categories

The new categories include:

  • Search Engine Crawler,
  • Aggregator,
  • AI Crawler,
  • Page Preview,
  • Advertising
  • Academic Research,
  • Accessibility,
  • Feed Fetcher,
  • Security,
  • Webhooks.

You can also view all the available categories using the Cloudflare API.

curl --request GET 'https://api.cloudflare.com/client/v4/bots_directory/categories' \
  --header "X-Auth-Email: <EMAIL>" \
  --header "X-Auth-Key: <API_KEY>" \

More targeted responses can be useful in a variety of situations. A few examples include:

  1. If you are a content creator, and you’re concerned about your work being reproduced by AI services, you can block AI bots we have cataloged in a simple firewall rule, while still allowing search engine crawlers to index your site.
  2. If your content is frequently shared on social media, you may want to use Workers to serve a simplified version of the page to Page Preview services, like the services that X (formerly Twitter), Discord and Slack are using to render a thumbnail version of a web page.
  3. If you run an online store that processes payments through webhooks API, you can harden your site’s security by only allowing verified webhooks services to make a request to that API endpoint.
  4. If you are using Cloudflare’s Load Balancing service and have limited in-region capacity, you can use Custom Rules for Load Balancing to send all bots except Search Engine Crawlers to a backup pool, prioritizing critical visitors over non-critical automated services.

Above all, these new categories give you, the website owner, complete, granular control over not only whether bots can visit your site, but what specific types of bots can and can’t do. For those of you that simply don’t want any bots, no problem, you don’t have to make any changes. Your existing rules that reference bot score or our Verified bots change will not be impacted at all.

More than just blocking, encouraging good behavior to make the Internet better

At Cloudflare, we have a history of working with good bot operators (like GoogleBot), who respect Internet norms and best practices, to access the websites that want to allow them. We want to encourage good behavior by AI crawlers as well, so we have developed a set of criteria that will allow us to tag respectful AI bots differently. In order to be tagged as a respectful AI bot, AI crawler must take the following steps to show they are acting in good faith:

Maintain a public web page committing to respect robots.txt.

  1. Set IPs that are used solely by the bot and are verifiable via a public IP list, reverse DNS lookup, or ASN ownership.
  2. Maintain a unique and stable user-agent to represent the bot.
  3. Respect a robots.txt entry for your user-agent as well as wild-card entries.
  4. Requiring all AI crawlers to respect crawl-delay, which has previously been a nonstandard extension.

These steps are an expansion of our existing Verified Bots policy which you can see here. When a bot creator has performed the steps above, we perform additional evaluation to confirm we’ve seen no suspicious activity from the bot. We check the bot's documentation, check internal dashboards to ensure traffic is appropriately distributed across the sites we protect, and check whether the bot hits suspicious endpoints like logins, or has exhibited other malicious activity.

While new AI bots can be scary, this industry is evolving incredibly quickly, and you may want to handle different bots differently in the future. We think it's important to distinguish between bot operators that are being respectful and those that are trying to be deceptive.

It should be easy for everyone to deal with AI crawlers, not just Cloudflare customers

While we’re glad we’ve made it easy for Cloudflare customers to manage AI Crawlers, not everyone uses Cloudflare. We want the Internet to be better for everyone. So we think that the industry should adopt a new protocol specifically for handling AI crawlers.

In the long run, AI bots respecting a new exclusion protocol gives website operators the most flexibility to change how they want to handle them over time. We think the key is to make it easier for customers to block these bots, or to allow them in some cases if they choose on their entire website or only on specific pages.

You’ll be hearing more about this from us in the next few months, so stay tuned.

But we didn’t want to wait to make sure our customers are protected, so we're making our new bot categories available today!

What’s next?

The first and most important step for us was to make it clear to every Cloudflare customer that you are already protected from AI crawlers you don’t want. Second, we wanted to give you granular control and make it easy to allow those crawlers, or other bots, that you deem useful for your site.

We encourage everyone to try out our new Verified Bot categories today. Log in to the Cloudflare dash, go to the WAF tab, create a rule, and choose one of the Verified Bot sub categories as the `Field`. And remember, this functionality is available to all Cloudflare customers, even on free plans.

Having launched Verified Bot categories, in the next few months we’ll be adding more detailed reporting based on the bot category, to better help you visualize the frequency at which different categories of bots are visiting your site over time. As AI continues to evolve at a breakneck pace, AI Crawlers are only going to become a larger part of the Internet. As that evolution happens, Cloudflare will be there every step of the way to help you evolve the way you deal with them.

Cloudflare is free of CAPTCHAs; Turnstile is free for everyone

Post Syndicated from Benedikt Wolters original http://blog.cloudflare.com/turnstile-ga/

Cloudflare is free of CAPTCHAs; Turnstile is free for everyone

Cloudflare is free of CAPTCHAs; Turnstile is free for everyone

For years, we’ve written that CAPTCHAs drive us crazy. Humans give up on CAPTCHA puzzles approximately 15% of the time and, maddeningly, CAPTCHAs are significantly easier for bots to solve than they are for humans. We’ve spent the past three and a half years working to build a better experience for humans that’s just as effective at stopping bots. As of this month, we’ve finished replacing every CAPTCHA issued by Cloudflare with Turnstile, our new CAPTCHA replacement (pictured below). Cloudflare will never issue another visual puzzle to anyone, for any reason.

Cloudflare is free of CAPTCHAs; Turnstile is free for everyone

Now that we’ve eliminated CAPTCHAs at Cloudflare, we want to make it easy for anyone to do the same, even if they don’t use other Cloudflare services. We’ve decoupled Turnstile from our platform so that any website operator on any platform can use it just by adding a few lines of code. We’re thrilled to announce that Turnstile is now generally available, and Turnstile’s ‘Managed’ mode is now completely free to everyone for unlimited use.

Easy on humans, hard on bots, private for everyone

Cloudflare is free of CAPTCHAs; Turnstile is free for everyone

There’s a lot that goes into Turnstile’s simple checkbox to ensure that it’s easy for everyone, preserves user privacy, and does its job stopping bots. Part of making challenges better for everyone means that everyone gets the same great experience, no matter what browser you’re using. Because we do not employ a visual puzzle, users with low vision or blindness get the same easy to use challenge flow as everyone else. It was particularly important for us to avoid falling back to audio CAPTCHAs to offer an experience accessible to everyone. Audio CAPTCHAs are often much worse than even visual CAPTCHAs for humans to solve, with only 31.2% of audio challenges resulting in a three-person agreement on what the correct solution actually is. The prevalence of free speech-to-text services has made it easy for bots to solve audio CAPTCHAs as well, with a recent study showing bots can accurately solve audio CAPTCHAs in over 85% of attempts.

We also created Turnstile to be privacy focused. Turnstile meets ePrivacy Directive, GDPR and CCPA compliance requirements, as well as the strict requirements of our own privacy commitments. In addition, Cloudflare's FedRAMP Moderate authorized package, "Cloudflare for Government" now includes Turnstile. We don’t rely on tracking user data, like what other websites someone has visited, to determine if a user is a human or robot. Our business is protecting websites, not selling ads, so operators can deploy Turnstile knowing that their users’ data is safe.

With all of our emphasis on how easy it is to pass a Turnstile challenge, you would be right to ask how it can stop a bot. If a bot can find all images with crosswalks in grainy photos faster than we can, surely it can check a box as well. Bots definitely can check a box, and they can even mimic the erratic path of human mouse movement while doing so. For Turnstile, the actual act of checking a box isn’t important, it’s the background data we’re analyzing while the box is checked that matters. We find and stop bots by running a series of in-browser tests, checking browser characteristics, native browser APIs, and asking the browser to pass lightweight tests (ex: proof-of-work tests, proof-of-space tests) to prove that it’s an actual browser. The current deployment of Turnstile checks billions of visitors every day, and we are able to identify browser abnormalities that bots exhibit while attempting to pass those tests.

For over one year, we used our Managed Challenge to rotate between CAPTCHAs and our own Turnstile challenge to compare our effectiveness. We found that even without asking users for any interactivity at all, Turnstile was just as effective as a CAPTCHA. Once we were sure that the results were effective at coping with the response from bot makers, we replaced the CAPTCHA challenge with our own checkbox solution. We present this extra test when we see potentially suspicious signals, and it helps us provide an even greater layer of security.

Turnstile is great for fighting fraud

Like all sites that offer services for free, Cloudflare sees our fair share of automated account signups, which can include “new account fraud,” where bad actors automate the creation of many different accounts to abuse our platform. To help combat this abuse, we’ve rolled out Turnstile’s invisible mode to protect our own signup page. This month, we’ve blocked over 1 million automated signup attempts using Turnstile, without a reported false positive or any change in our self-service billings that rely on this signup flow.  

Lessons from the Turnstile beta

Cloudflare is free of CAPTCHAs; Turnstile is free for everyone

Over the past twelve months, we’ve been grateful to see how many people are eager to try, then rely on, and integrate Turnstile into their web applications. It’s been rewarding to see the developer community embrace Turnstile as well. We list some of the community created Turnstile integrations here, including integrations with WordPress, Angular, Vue, and a Cloudflare recommended React library. We’ve listened to customer feedback, and added support for 17 new languages, new callbacks, and new error codes.

76,000+ users have signed up, but our biggest single test by far was the Eurovision final vote. Turnstile runs on challenge pages on over 25 million Cloudflare websites. Usually, that makes Cloudflare the far and away biggest Turnstile consumer, until the final Eurovision vote. During that one hour, challenge traffic from the Eurovision voting site outpaced the use of challenge pages on those 25 million sites combined! Turnstile handled the enormous spike in traffic without a hitch.

While a lot went well during the Turnstile beta, we also encountered some opportunities for us to learn. We were initially resistant to disclosing why a Turnstile challenge failed. After all, if bad actors know what we’re looking for, it becomes easier for bots to fool our challenges until we introduce new detections. However, during the Turnstile beta, we saw a few scenarios where legitimate users could not pass a challenge. These scenarios made it clear to us that we need to be transparent about why a challenge failed to help aid any individual who might modify their browser in a way that causes them to get caught by Turnstile. We now publish detailed client-side error codes to surface the reason why a challenge has failed. Two scenarios came up on several occasions that we didn’t expect:

First, we saw that desktop computers at least 10 years old frequently had expired motherboard batteries, and computers with bad motherboard batteries very often keep inaccurate time. This is because without the motherboard battery, a desktop computer’s clock will stop operating when the computer is off. Turnstile checks your computer’s system time to detect when a website operator has accidentally configured a challenge page to be cached, as caching a challenge page will cause it to become impassable. Unfortunately, this same check was unintentionally catching humans who just needed to update the time. When we see this issue, we now surface a clear error message to the end user to update their system time. We’d prefer to never have to surface an error in the first place, so we’re working to develop new ways to check for cached content that won’t impact real people.

Second, we find that a few privacy-focused users often ask their browsers to go beyond standard practices to preserve their anonymity. This includes changing their user-agent (something bots will do to evade detection as well), and preventing third-party scripts from executing entirely. Issues caused by this behavior can now be displayed clearly in a Turnstile widget, so those users can immediately understand the issue and make a conscientious choice about whether they want to allow their browser to pass a challenge.

Although we have some of the most sensitive, thoroughly built monitoring systems at Cloudflare, we did not catch either of these issues on our own. We needed to talk to users affected by the issue to help us understand what the problem was. Going forward, we want to make sure we always have that direct line of communication open. We’re rolling out a new feedback form in the Turnstile widget, to ensure any future corner cases are addressed quickly and with urgency.

Cloudflare is free of CAPTCHAs; Turnstile is free for everyone

Turnstile: GA and Free for Everyone

Announcing Turnstile’s General Availability means that Turnstile is now completely production ready, available for free for unlimited use via our visible widget in Managed mode. Turnstile Enterprise includes SaaS platform support and a visible mode without the Cloudflare logo. Self-serve customers can expect a pay-as-you-go option for advanced features to be available in early 2024. Users can continue to access Turnstile’s advanced features below our 1 million siteverify request limit, as has been the case during the beta. If you’ve been waiting to try Turnstile, head over to our signup page and create an account!

Numenta Has the Secret to AI Inference on CPUs like the Intel Xeon MAX

Post Syndicated from Patrick Kennedy original https://www.servethehome.com/numenta-has-the-secret-to-ai-inference-on-cpus-like-the-intel-xeon-max/

Numenta has a cool AI software solution using Intel AMX and AVX-512 to beat NVIDIA A100 GPUs at AI inference

The post Numenta Has the Secret to AI Inference on CPUs like the Intel Xeon MAX appeared first on ServeTheHome.

Get the full benefits of IMDSv2 and disable IMDSv1 across your AWS infrastructure

Post Syndicated from Saju Sivaji original https://aws.amazon.com/blogs/security/get-the-full-benefits-of-imdsv2-and-disable-imdsv1-across-your-aws-infrastructure/

The Amazon Elastic Compute Cloud (Amazon EC2) Instance Metadata Service (IMDS) helps customers build secure and scalable applications. IMDS solves a security challenge for cloud users by providing access to temporary and frequently-rotated credentials, and by removing the need to hardcode or distribute sensitive credentials to instances manually or programmatically. The Instance Metadata Service Version 2 (IMDSv2) adds protections; specifically, IMDSv2 uses session-oriented authentication with the following enhancements:

  • IMDSv2 requires the creation of a secret token in a simple HTTP PUT request to start the session, which must be used to retrieve information in IMDSv2 calls.
  • The IMDSv2 session token must be used as a header in subsequent IMDSv2 requests to retrieve information from IMDS. Unlike a static token or fixed header, a session and its token are destroyed when the process using the token terminates. IMDSv2 sessions can last up to six hours.
  • A session token can only be used directly from the EC2 instance where that session began.
  • You can reuse a token or create a new token with every request.
  • Session token PUT requests are blocked if they contain an X-forwarded-for header.

In a previous blog post, we explained how these new protections add defense-in-depth for third-party and external application vulnerabilities that could be used to try to access the IMDS.

You won’t be able to get the full benefits of IMDSv2 until you disable IMDSv1. While IMDS is provided by the instance itself, the calls to IMDS are from your software. This means your software must support IMDSv2 before you can disable IMDSv1. In addition to AWS SDKs, CLIs, and tools like the SSM agents supporting IMDSv2, you can also use the IMDS Packet Analyzer to pinpoint exactly what you need to update to get your instances ready to use only IMDSv2. These tools make it simpler to transition to IMDSv2 as well as launch new infrastructure with IMDSv1 disabled. All instances launched with AL2023 set the instance to provide only IMDSv2 (IMDSv1 is disabled) by default, with AL2023 also not making IMDSv1 calls.

AWS customers who want to get the benefits of IMDSv2 have told us they want to use IMDSv2 across both new and existing, long-running AWS infrastructure. This blog post shows you scalable solutions to identify existing infrastructure that is providing IMDSv1, how to transition to IMDSv2 on your infrastructure, and how to completely disable IMDSv1. After reviewing this blog, you will be able to set new Amazon EC2 launches to IMDSv2. You will also learn how to identify existing software making IMDSv1 calls, so you can take action to update your software and then require IMDSv2 on existing EC2 infrastructure.

Identifying IMDSv1-enabled EC2 instances

The first step in transitioning to IMDSv2 is to identify all existing IMDSv1-enabled EC2 instances. You can do this in various ways.

Using the console

You can identify IMDSv1-enabled instances using the IMDSv2 attribute column in the Amazon EC2 page in the AWS Management Console.

To view the IMDSv2 attribute column:

  1. Open the Amazon EC2 console and go to Instances.
  2. Choose the settings icon in the top right.
  3. Scroll down to IMDSv2, turn on the slider.
  4. Choose Confirm.

This gives you the IMDS status of your instances. A status of optional means that IMDSv1 is enabled on the instance and required means that IMDSv1 is disabled.

Figure 1: Example of IMDS versions for EC2 instances in the console

Figure 1: Example of IMDS versions for EC2 instances in the console

Using the AWS CLI

You can identify IMDSv1-enabled instances using the AWS Command Line Interface (AWS CLI) by running the aws ec2 describe-instances command and checking the value of HttpTokens. The HttpTokens value determines what version of IMDS is enabled, with optional enabling IMDSv1 and IMDSv2 and required means IMDSv2 is required. Similar to using the console, the optional status indicates that IMDSv1 is enabled on the instance and required indicates that IMDSv1 is disabled.

"MetadataOptions": {
                        "State": "applied", 
                        "HttpEndpoint": "enabled", 
                        "HttpTokens": "optional", 
                        "HttpPutResponseHopLimit": 1
                    },

[ec2-user@ip-172-31-24-101 ~]$ aws ec2 describe-instances | grep '"HttpTokens": "optional"' | wc -l
4

Using AWS Config

AWS Config continually assesses, audits, and evaluates the configurations and relationships of your resources on AWS, on premises, and on other clouds. The AWS Config rule ec2-imdsv2-check checks whether your Amazon EC2 instance metadata version is configured with IMDSv2. The rule is NON_COMPLIANT if the HttpTokens is set to optional, which means the EC2 instance has IMDSv1 enabled.

Figure 2: Example of noncompliant EC2 instances in the AWS Config console

Figure 2: Example of noncompliant EC2 instances in the AWS Config console

After this AWS Config rule is enabled, you can set up AWS Config notifications through Amazon Simple notification Service (Amazon SNS).

Using Security Hub

AWS Security Hub provides detection and alerting capability at the account and organization levels. You can configure cross-Region aggregation in Security Hub to gain insight on findings across Regions. If using AWS Organizations, you can configure a Security Hub designated account to aggregate findings across accounts in your organization.

Security Hub has an Amazon EC2 control ([EC2.8] Amazon EC2 instances should use Instance Metadata Service Version 2 (IMDSv2)) that uses the AWS Config rule ec2-imdsv2-check to check if the instance metadata version is configured with IMDSv2. The rule is NON_COMPLIANT if the HttpTokens is set to optional, which means EC2 instance has IMDSv1 enabled.

Figure 3: Example of AWS Security Hub showing noncompliant EC2 instances

Figure 3: Example of AWS Security Hub showing noncompliant EC2 instances

Using Amazon Event Bridge, you can also set up alerting for the Security Hub findings when the EC2 instances are noncompliant for IMDSv2.

{
  "source": ["aws.securityhub"],
  "detail-type": ["Security Hub Findings - Imported"],
  "detail": {
    "findings": {
      "ProductArn": ["arn:aws:securityhub:us-west-2::product/aws/config"],
      "Title": ["ec2-imdsv2-check"]
    }
  }
}

Identifying if EC2 instances are making IMDSv1 calls

Not all of your software will be making IMDSv1 calls; your dependent libraries and tools might already be compatible with IMDSv2. However, to mitigate against compatibility issues in requiring IMDSv2 and disabling IMDSv1 entirely, you must check for remaining IMDSv1 calls from your software. After you’ve identified that there are instances with IMDSv1 enabled, investigate if your software is making IMDSv1 calls. Most applications make IMDSv1 calls at instance launch and shutdown. For long running instances, we recommend monitoring IMDSv1 calls during a launch or a stop and restart cycle.

You can check whether your software is making IMDSv1 calls by checking the MetadataNoToken metric in Amazon CloudWatch. You can further identify the source of IMDSv1 calls by using the IMDS Packet Analyzer tool.

Steps to check IMDSv1 usage with CloudWatch

  1. Open the CloudWatch console.
  2. Go to Metrics and then All Metrics.
  3. Select EC2 and then choose Per-Instance Metrics.
  4. Search and add the Metric MetadataNoToken for the instances you’re interested in.
Figure 4: CloudWatch dashboard for MetadataNoToken per-instance metric

Figure 4: CloudWatch dashboard for MetadataNoToken per-instance metric

You can use expressions in CloudWatch to view account wide metrics.

SEARCH('{AWS/EC2,InstanceId} MetricName="MetadataNoToken"', 'Maximum')
Figure 5: Using CloudWatch expressions to view account wide metrics for MetadataNoToken

Figure 5: Using CloudWatch expressions to view account wide metrics for MetadataNoToken

You can combine SEARCH and SORT expressions in CloudWatch to help identify the instances using IMDSv1.

SORT(SEARCH('{AWS/EC2,InstanceId} MetricName="MetadataNoToken"', 'Sum', 300), SUM, DESC, 10)
Figure 6: Another example of using CloudWatch expressions to view account wide metrics

Figure 6: Another example of using CloudWatch expressions to view account wide metrics

If you have multiple AWS accounts or use AWS Organizations, you can set up a centralized monitoring account using CloudWatch cross account observability.

IMDS Packet Analyzer

The IMDS Packet Analyzer is an open source tool that identifies and logs IMDSv1 calls from your software, including software start-up on your instance. This tool can assist in identifying the software making IMDSv1 calls on EC2 instances, allowing you to pinpoint exactly what you need to update to get your software ready to use IMDSv2. You can run the IMDS Packet Analyzer from a command line or install it as a service. For more information, see IMDS Packet Analyzer on GitHub.

Disabling IMDSv1 and maintaining only IMDSv2 instances

After you’ve monitored and verified that the software on your EC2 instances isn’t making IMDSv1 calls, you can disable IMDSv1 on those instances. For all compatible workloads, we recommend using Amazon Linux 2023, which offers several improvements (see launch announcement), including requiring IMDSv2 (disabling IMDSv1) by default.

You can also create and modify AMIs and EC2 instances to disable IMDSv1. Configure the AMI provides guidance on how to register a new AMI or change an existing AMI by setting the imds-support parameter to v2.0. If you’re using container services (such as ECS or EKS), you might need a bigger hop limit to help avoid falling back to IMDSv1. You can use the modify-instance-metadata-options launch parameter to make the change. We recommend testing with a hop limit of three in container environments.

To create a new instance

For new instances, you can disable IMDSv1 and enable IMDSv2 by specifying the metadata-options parameter using the run-instance CLI command.

aws ec2 run-instances
    --image-id <ami-0123456789example>
    --instance-type c3.large
    --metadata-options “HttpEndpoint=enabled,HttpTokens=required”

To modify the running instance

aws ec2 modify-instance-metadata-options \
--instance-id <instance-0123456789example> \
--http-tokens required \
--http-endpoint enabled

To configure a new AMI

aws ec2 register-image \
    --name <my-image> \
    --root-device-name /dev/xvda \
    --block-device-mappings DeviceName=/dev/xvda,Ebs={SnapshotId=<snap-0123456789example>} \
    --imds-support v2.0

To modify an existing AMI

aws ec2 modify-image-attribute \
    --image-id <ami-0123456789example> \
    --imds-support v2.0

Using the console

If you’re using the console to launch instances, after selecting Launch Instance from AWS Console, choose the Advanced details tab, scroll down to Metadata version and select V2 only (token required).

Figure 7: Modifying IMDS version using the console

Figure 7: Modifying IMDS version using the console

Using EC2 launch templates

You can use an EC2 launch template as an instance configuration template that an Amazon Auto Scaling group can use to launch EC2 instances. When creating the launch template using the console, you can specify the Metadata version and select V2 only (token required).

Figure 8: Modifying the IMDS version in the EC2 launch templates

Figure 8: Modifying the IMDS version in the EC2 launch templates

Using CloudFormation with EC2 launch templates

When creating an EC2 launch template using AWS CloudFormation, you must specify the MetadataOptions property to use only IMDSv2 by setting HttpTokens as required.

In this state, retrieving the AWS Identity and Access Management (IAM) role credentials always returns IMDSv2 credentials; IMDSv1 credentials are not available.

{
"HttpEndpoint" : <String>,
"HttpProtocolIpv6" : <String>,
"HttpPutResponseHopLimit" : <Integer>,
"HttpTokens" : required,
"InstanceMetadataTags" : <String>
}

Using Systems Manager automation runbook

You can run the EnforceEC2InstanceIMDSv2 automation document available in AWS Systems Manager, which will enforce IMDSv2 on the EC2 instance using the ModifyInstanceMetadataOptions API.

  1. Open the Systems Manager console, and then select Automation from the navigation pane.
  2. Choose Execute automation.
  3. On the Owned by Amazon tab, for Automation document, enter EnforceEC2InstanceIMDSv2, and then press Enter.
  4. Choose EnforceEC2InstanceIMDSv2 document, and then choose Next.
  5. For Execute automation document, choose Simple execution.

    Note: If you need to run the automation on multiple targets, then choose Rate Control.

  6. For Input parameters, enter the ID of EC2 instance under InstanceId
  7. For AutomationAssumeRole, select a role.

    Note: To change the target EC2 instance, the AutomationAssumeRole must have ec2:ModifyInstanceMetadataOptions and ec2:DescribeInstances permissions. For more information about creating the assume role for Systems Manager Automation, see Create a service role for Automation.

  8. Choose Execute.

Using the AWS CDK

If you use the AWS Cloud Development Kit (AWS CDK) to launch instances, you can use it to set the requireImdsv2 property to disable IMDSv1 and enable IMDSv2.

new ec2.Instance(this, 'Instance', {
        // <... other parameters>
        requireImdsv2: true,
})

Using AWS SDK

The new clients for AWS SDK for Java 2.x use IMDSv2, and you can use the new clients to retrieve instance metadata for your EC2 instances. See Introducing a new client in the AWS SDK for Java 2.x for retrieving EC2 Instance Metadata for instructions.

Maintain only IMDSv2 EC2 instances

To maintain only IMDSv2 instances, you can implement service control policies and IAM policies that verify that users and software on your EC2 instances can only use instance metadata using IMDSv2. This policy specifies that RunInstance API calls require the EC2 instance use only IMDSv2. We recommend implementing this policy after all of the instances in associated accounts are free of IMDSv1 calls and you have migrated all of the instances to use only IMDSv2.

{
    "Version": "2012-10-17",
    "Statement": [
               {
            "Sid": "RequireImdsV2",
            "Effect": "Deny",
            "Action": "ec2:RunInstances",
            "Resource": "arn:aws:ec2:*:*:instance/*",
            "Condition": {
                "StringNotEquals": {
                    "ec2:MetadataHttpTokens": "required"
                }
            }
        }
    ]
} 

You can find more details on applicable service control policies (SCPs) and IAM policies in the EC2 User Guide.

Restricting credential usage using condition keys

As an additional layer of defence, you can restrict the use of your Amazon EC2 role credentials to work only when used in the EC2 instance to which they are issued. This control is complementary to IMDSv2 since both can work together. The AWS global condition context keys for EC2 credential control properties (aws:EC2InstanceSourceVPC and aws:EC2InstanceSourcePrivateIPv4) restrict the VPC endpoints and private IPs that can use your EC2 instance credentials, and you can use these keys in service control policies (SCPs) or IAM policies. Examples of these policies are in this blog post.

Conclusion

You won’t be able to get the full benefits of IMDSv2 until you disable IMDSv1. In this blog post, we showed you how to identify IMDSv1-enabled EC2 instances and how to determine if and when your software is making IMDSv1 calls. We also showed you how to disable IMDSv1 on new and existing EC2 infrastructure after your software is no longer making IMDSv1 calls. You can use these tools to transition your existing EC2 instances, and set your new EC2 launches, to use only IMDSv2.

If you have feedback about this post, submit comments in the Comments section below. If you have questions about this post, start a new thread on the AWS Compute re:Post or contact AWS Support.

Want more AWS Security news? Follow us on Twitter.

Saju Sivaji

Saju Sivaji

Saju is Senior Technical Program Manager with the AWS Security organization. When Saju isn’t managing security expectation programs to help raise the security bar for both internal and external customers, he enjoys travelling, racket sports, and bicycling.

Joshua Levinson

Joshua Levinson

Joshua is a Principal Product Manager at AWS on the Amazon EC2 team. He is passionate about helping customers with highly scalable features on EC2 and across AWS and enjoys the challenge of building simplified solutions to complex problems. Outside of work, he enjoys cooking, reading with his kids, and Olympic weightlifting.

Build event-driven architectures with Amazon MSK and Amazon EventBridge

Post Syndicated from Florian Mair original https://aws.amazon.com/blogs/big-data/build-event-driven-architectures-with-amazon-msk-and-amazon-eventbridge/

Based on immutable facts (events), event-driven architectures (EDAs) allow businesses to gain deeper insights into their customers’ behavior, unlocking more accurate and faster decision-making processes that lead to better customer experiences. In EDAs, modern event brokers, such as Amazon EventBridge and Apache Kafka, play a key role to publish and subscribe to events. EventBridge is a serverless event bus that ingests data from your own apps, software as a service (SaaS) apps, and AWS services and routes that data to targets. Although there is overlap in their role as the backbone in EDAs, both solutions emerged from different problem statements and provide unique features to solve specific use cases. With a solid understanding of both technologies and their primary use cases, developers can create easy-to-use, maintainable, and evolvable EDAs.

If the use case is well defined and directly maps to one event bus, such as event streaming and analytics with streaming events (Kafka) or application integration with simplified and consistent event filtering, transformation, and routing on discrete events (EventBridge), the decision for a particular broker technology is straightforward. However, organizations and business requirements are often more complex and beyond the capabilities of one broker technology. In almost any case, choosing an event broker should not be a binary decision. Combining complementary broker technologies and embracing their unique strengths is a solid approach to build easy-to-use, maintainable, and evolvable EDAs. To make the integration between Kafka and EventBridge even smoother, AWS open-sourced the EventBridge Connector based on Apache Kafka. This allows you to consume from on-premises Kafka deployments and avoid point-to-point communication, while using the existing knowledge and toolset of Kafka Connect.

Streaming applications enable stateful computations over unbound datasets. This allows real-time use cases such as anomaly detection, event-time computations, and much more. These applications can be built using frameworks such as Apache Flink, Apache Spark, or Kafka Streams. Although some of those frameworks support sending events to downstream systems other than Apache Kafka, there is no standardized way of doing so across frameworks. It would require each application owner to build their own logic to send events downstream. In an EDA, the preferred way to handle such a scenario is to publish events to an event bus and then send them downstream.

There are two ways to send events from Apache Kafka to EventBridge: the preferred method using Amazon EventBridge Pipes or the EventBridge sink connector for Kafka Connect. In this post, we explore when to use which option and how to build an EDA using the EventBridge sink connector and Amazon Managed Streaming for Apache Kafka (Amazon MSK).

EventBridge sink connector vs. EventBridge Pipes

EventBridge Pipes connects sources to targets with a point-to-point integration, supporting event filtering, transformations, enrichment, and event delivery to over 14 AWS services and external HTTPS-based targets using API Destinations. This is the preferred and most easy method to send events from Kafka to EventBridge as it simplifies the setup and operations with a delightful developer experience.

Alternatively, under the following circumstances you might want to choose the EventBridge sink connector to send events from Kafka directly to EventBridge Event Buses:

  • You are have already invested in processes and tooling around the Kafka Connect framework as the platform of your choice to integrate with other systems and services
  • You need to integrate with a Kafka-compatible schema registry e.g., the AWS Glue Schema Registry, supporting Avro and Protobuf data formats for event serialization and deserialization
  • You want to send events from on-premises Kafka environments directly to EventBridge Event Buses

Overview of solution

In this post, we show you how to use Kafka Connect and the EventBridge sink connector to send Avro-serialized events from Amazon Managed Streaming for Apache Kafka (Amazon MSK) to EventBridge. This enables a seamless and consistent data flow from Apache Kafka to dozens of supported EventBridge AWS and partner targets, such as Amazon CloudWatch, Amazon SQS, AWS Lambda, and HTTPS targets like Salesforce, Datadog, and Snowflake using EventBridge API destinations. The following diagram illustrates the event-driven architecture used in this blog post based on Amazon MSK and EventBridge.

Architecture Diagram

The workflow consists of the following steps:

  1. The demo application generates credit card transactions, which are sent to Amazon MSK using the Avro format.
  2. An analytics application running on Amazon Elastic Container Service (Amazon ECS) consumes the transactions and analyzes them if there is an anomaly.
  3. If an anomaly is detected, the application emits a fraud detection event back to the MSK notification topic.
  4. The EventBridge connector consumes the fraud detection events from Amazon MSK in Avro format.
  5. The connector converts the events to JSON and sends them to EventBridge.
  6. In EventBridge, we use JSON filtering rules to filter our events and send them to other services or another Event Bus. In this example, fraud detection events are sent to Amazon CloudWatch Logs for auditing and introspection, and to a third-party SaaS provider to showcase how easy it is to integrate with third-party APIs, such as Salesforce.

Prerequisites

For this walkthrough, you should have the following prerequisites:

Deploy the AWS CDK stack

This walkthrough requires you to deploy an AWS CDK stack to your account. You can deploy the full stack end to end or just the required resources to follow along with this post.

  1. In your terminal, run the following command:
    git clone https://github.com/awslabs/eventbridge-kafka-connector/

  2. Navigate to the cdk directory:
    cd eventbridge-kafka-connector/cdk

  3. Deploy the AWS CDK stack based on your preferences:
  4. If you want to see the complete setup explained in this post, run the following command:
    cdk deploy —context deployment=FULL

  5. If you want to deploy the connector on your own but have the required resources already, including the MSK cluster, AWS Identity and Access Management (IAM) roles, security groups, data generator, and so on, run the following command:
    cdk deploy —context deployment=PREREQ

Deploy the EventBridge sink connector on Amazon MSK Connect

If you deployed the CDK stack in FULL mode, you can skip this section and move on to Create EventBridge rules.

The connector needs an IAM role that allows reading the data from the MSK cluster and sending records downstream to EventBridge.

Upload connector code to Amazon S3

Complete the following steps to upload the connector code to Amazon Simple Storage Service (Amazon S3):

  1. Navigate to the GitHub repo.
  2. Download the release 1.0.0 with the AWS Glue Schema Registry dependencies included.
  3. On the Amazon S3 console, choose Buckets in the navigation pane.
  4. Choose Create bucket.
  5. For Bucket name, enter eventbridgeconnector-bucket-${AWS_ACCOUNT_ID}.

As Because S3 buckets must be globally unique, replace ${AWS_ACCOUNT_ID} with your actual AWS account ID. For example, eventbridgeconnector-bucket-123456789012.

  1. Open the bucket and choose Upload.
  2. Select the .jar file that you downloaded from the GitHub repository and choose Upload.

S3 File Upload Console

Create a custom plugin

We now have our application code in Amazon S3. As a next step, we create a custom plugin in Amazon MSK Connect. Complete the following steps:

  1. On the Amazon MSK console, choose Custom plugins in the navigation pane under MSK Connect.
  2. Choose Create custom plugin.
  3. For S3 URI – Custom plugin object, browse to the file named kafka-eventbridge-sink-with-gsr-dependencies.jar in the S3 bucket eventbridgeconnector-bucket-${AWS_ACCOUNT_ID} for the EventBridge connector.
  4. For Custom plugin name, enter msk-eventBridge-sink-plugin-v1.
  5. Enter an optional description.
  6. Choose Create custom plugin.

MSK Connect Plugin Screen

  1. Wait for plugin to transition to the status Active.

Create a connector

Complete the following steps to create a connector in MSK Connect:

  1. On the Amazon MSK console, choose Connectors in the navigation pane under MSK Connect.
  2. Choose Create connector.
  3. Select Use existing custom plugin and under Custom plugins, select the plugin msk-eventBridge-sink-plugin-v1 that you created earlier.
  4. Choose Next.
  5. For Connector name, enter msk-eventBridge-sink-connector.
  6. Enter an optional description.
  7. For Cluster type, select MSK cluster.
  8. For MSK clusters, select the cluster you created earlier.
  9. For Authentication, choose IAM.
  10. Under Connector configurations, enter the following settings (for more details on the configuration, see the GitHub repository):
    auto.offset.reset=earliest
    connector.class=software.amazon.event.kafkaconnector.EventBridgeSinkConnector
    topics=notifications
    aws.eventbridge.connector.id=avro-test-connector
    aws.eventbridge.eventbus.arn=arn:aws:events:us-east-1:123456789012:event-bus/eventbridge-sink-eventbus
    aws.eventbridge.region=us-east-1
    tasks.max=1
    key.converter=org.apache.kafka.connect.storage.StringConverter
    value.converter=com.amazonaws.services.schemaregistry.kafkaconnect.AWSKafkaAvroConverter
    value.converter.region=us-east-1
    value.converter.registry.name=default-registry
    value.converter.avroRecordType=GENERIC_RECORD

  11. Make sure to replace aws.eventbridge.eventbus.arn, aws.eventbridge.region, and value.converter.region with the values from the prerequisite stack.
  12. In the Connector capacity section, select Autoscaled for Capacity type.
  13. Leave the default value of 1 for MCU count per worker.
  14. Keep all default values for Connector capacity.
  15. For Worker configuration, select Use the MSK default configuration.
  16. Under Access permissions, choose the custom IAM role KafkaEventBridgeSinkStack-connectorRole, which you created during the AWS CDK stack deployment.
  17. Choose Next.
  18. Choose Next again.
  19. For Log delivery, select Deliver to Amazon CloudWatch Logs.
  20. For Log group, choose /aws/mskconnect/eventBridgeSinkConnector.
  21. Choose Next.
  22. Under Review and Create, validate all the settings and choose Create connector.

The connector will be now in the state Creating. It can take up to several minutes for the connector to transition into the status Running.

Create EventBridge rules

Now that the connector is forwarding events to EventBridge, we can use EventBridge rules to filter and send events to other targets. Complete the following steps to create a rule:

  1. On the EventBridge console, choose Rules in the navigation pane.
  2. Choose Create rule.
  3. Enter eb-to-cloudwatch-logs-and-webhook for Name.
  4. Select eventbridge-sink-eventbus for Event bus.
  5. Choose Next.
  6. Select Custom pattern (JSON editor), choose Insert, and replace the event pattern with the following code:
    {
      "detail": {
        "value": {
          "eventType": ["suspiciousActivity"],
          "source": ["transactionAnalyzer"]
        }
      },
      "detail-type": [{
        "prefix": "kafka-connect-notification"
      }]
    }
    

  7. Choose Next.
  8. For Target 1, select CloudWatch log group and enter kafka-events for Log Group.
  9. Choose Add another target.
  10. (Optional: Create an API destination) For Target 2, select EventBridge API destination for Target types.
  11. Select Create a new API destination.
  12. Enter a descriptive name for Name.
  13. Add the URL and enter it as API destination endpoint. (This can be the URL of your Datadog, Salesforce, etc. endpoint)
  14. Select POST for HTTP method.
  15. Select Create a new connection for Connection.
  16. For Connection Name, enter a name.
  17. Select Other as Destination type and select API Key as Authorization Type.
  18. For API key name and Value, enter your keys.
  19. Choose Next.
  20. Validate your inputs and choose Create rule.

EventBridge Rule

The following screenshot of the CloudWatch Logs console shows several events from EventBridge.

CloudWatch Logs

Run the connector in production

In this section, we dive deeper into the operational aspects of the connector. Specifically, we discuss how the connector scales and how to monitor it using CloudWatch.

Scale the connector

Kafka connectors scale through the number of tasks. The code design of the EventBridge sink connector doesn’t limit the number of tasks that it can run. MSK Connect provides the compute capacity to run the tasks, which can be from Provisioned or Autoscaled type. During the deployment of the connector, we choose the capacity type Autoscaled and 1 MCU per worker (which represents 1vCPU and 4GiB of memory). This means MSK Connect will scale the infrastructure to run tasks but not the number of tasks. The number of tasks is defined by the connector. By default, the connector will start with the number of tasks defined in tasks.max in the connector configuration. If this value is higher than the partition count of the processed topic, the number of tasks will be set to the number of partitions during the Kafka Connect rebalance.

Monitor the connector

MSK Connect emits metrics to CloudWatch for monitoring by default. Besides MSK Connect metrics, the offset of the connector should also be monitored in production. Monitoring the offset gives insights if the connector can keep up with the data produced in the Kafka cluster.

Clean up

To clean up your resources and avoid ongoing charges, complete the following the steps:

  1. On the Amazon MSK console, choose Connectors in the navigation pane under MSK Connect.
  2. Select the connectors you created and choose Delete.
  3. Choose Clusters in the navigation pane.
  4. Select the cluster you created and choose Delete on the Actions menu.
  5. On the EventBridge console, choose Rules in the navigation pane.
  6. Choose the event bus eventbridge-sink-eventbus.
  7. Select all the rules you created and choose Delete.
  8. Confirm the removal by entering delete, then choose Delete.

If you deployed the AWS CDK stack with the context PREREQ, delete the .jar file for the connector.

  1. On the Amazon S3 console, choose Buckets in the navigation pane.
  2. Navigate to the bucket where you uploaded your connector and delete the kafka-eventbridge-sink-with-gsr-dependencies.jar file.

Independent from the chosen deployment mode, all other AWS resources can be deleted by using AWS CDK or AWS CloudFormation. Run cdk destroy from the repository directory to delete the CloudFormation stack.

Alternatively, on the AWS CloudFormation console, select the stack KafkaEventBridgeSinkStack and choose Delete.

Conclusion

In this post, we showed how you can use MSK Connect to run the AWS open-sourced Kafka connector for EventBridge, how to configure the connector to forward a Kafka topic to EventBridge, and how to use EventBridge rules to filter and forward events to CloudWatch Logs and a webhook.

To learn more about the Kafka connector for EventBridge, refer to Amazon EventBridge announces open-source connector for Kafka Connect, as well as the MSK Connect Developer Guide and the code for the connector on the GitHub repo.


About the Authors

Florian Mair is a Senior Solutions Architect and data streaming expert at AWS. He is a technologist that helps customers in Germany succeed and innovate by solving business challenges using AWS Cloud services. Besides working as a Solutions Architect, Florian is a passionate mountaineer, and has climbed some of the highest mountains across Europe.

Benjamin Meyer is a Senior Solutions Architect at AWS, focused on Games businesses in Germany to solve business challenges by using AWS Cloud services. Benjamin has been an avid technologist for 7 years, and when he’s not helping customers, he can be found developing mobile apps, building electronics, or tending to his cacti.

AI 101: Do the Dollars Make Sense?

Post Syndicated from Stephanie Doyle original https://www.backblaze.com/blog/ai-101-do-the-dollars-make-sense/

A decorative image showing a cloud reaching out with digital tentacles to stacks of dollar signs.

Welcome back to AI 101, a series dedicated to breaking down the realities of artificial intelligence (AI). Previously we’ve defined artificial intelligence, deep learning (DL), and machine learning (ML) and dove into the types of processors that make AI possible. Today we’ll talk about one of the biggest limitations of AI adoption—how much it costs. Experts have already flagged that the significant investment necessary for AI can cause antitrust concerns and that AI is driving up costs in data centers

To that end, we’ll talk about: 

  • Factors that impact the cost of AI.
  • Some real numbers about the cost of AI components. 
  • The AI tech stack and some of the industry solutions that have been built to serve it.
  • And, uncertainty.

Defining AI: Complexity and Cost Implications

While ChatGPT, DALL-E, and the like may be the most buzz-worthy of recent advancements, AI has already been a part of our daily lives for several years now. In addition to generative AI models, examples include virtual assistants like Siri and Google Home, fraud detection algorithms in banks, facial recognition software, URL threat analysis services, and so on. 

That brings us to the first challenge when it comes to understanding the cost of AI: The type of AI you’re training—and how complex a problem you want it to solve—has a huge impact on the computing resources needed and the cost, both in the training and in the implementation phases. AI tasks are hungry in all ways: they need a lot of processing power, storage capacity, and specialized hardware. As you scale up or down in the complexity of the task you’re doing, there’s a huge range in the types of tools you need and their costs.   

To understand the cost of AI, several other factors come into play as well, including: 

  • Latency requirements: How fast does the AI need to make decisions? (e.g. that split second before a self-driving car slams on the brakes.)
  • Scope: Is the AI solving broad-based or limited questions? (e.g. the best way to organize this library vs. how many times is the word “cat” in this article.)
  • Actual human labor: How much oversight does it need? (e.g. does a human identify the cat in cat photos, or does the AI algorithm identify them?)
  • Adding data: When, how, and what quantity new data will need to be ingested to update information over time? 

This is by no means an exhaustive list, but it gives you an idea of the considerations that can affect the kind of AI you’re building and, thus, what it might cost.

The Big Three AI Cost Drivers: Hardware, Storage, and Processing Power

In simple terms, you can break down the cost of running an AI to a few main components: hardware, storage, and processing power. That’s a little bit simplistic, and you’ll see some of these lines blur and expand as we get into the details of each category. But, for our purposes today, this is a good place to start to understand how much it costs to ask a bot to create a squirrel holding a cool guitar.

An AI generative image of a squirrel holding a guitar. Both the squirrel and the guitar and warped in strange, but not immediately noticeable ways.
Still not quite there on the guitar. Or the squirrel. How much could this really cost?

First Things First: Hardware Costs

Running an AI takes specialized processors that can handle complex processing queries. We’re early in the game when it comes to picking a “winner” for specialized processors, but these days, the most common processor is a graphical processing unit (GPU), with Nvidia’s hardware and platform as an industry favorite and front-runner. 

The most common “workhorse chip” of AI processing tasks, the Nvidia A100, starts at about $10,000 per chip, and a set of eight of the most advanced processing chips can cost about $300,000. When Elon Musk wanted to invest in his generative AI project, he reportedly bought 10,000 GPUs, which equates to an estimated value in the tens of millions of dollars. He’s gone on record as saying that AI chips can be harder to get than drugs

Google offers folks the ability to rent their TPUs through the cloud starting at $1.20 per chip hour for on-demand service (less if you commit to a contract). Meanwhile, Intel released a sub-$100 USB stick with a full NPU that can plug into your personal laptop, and folks have created their own models at home with the help of open sourced developer toolkits. Here’s a guide to using them if you want to get in the game yourself. 

Clearly, the spectrum for chips is vast—from under $100 to millions—and the landscape for chip producers is changing often, as is the strategy for monetizing those chips—which leads us to our next section. 

Using Third Parties: Specialized Problems = Specialized Service Providers

Building AI is a challenge with so many moving parts that, in a business use case, you eventually confront the question of whether it’s more efficient to outsource it. It’s true of storage, and it’s definitely true of AI processing. You can already see one way Google answered that question above: create a network populated by their TPUs, then sell access.   

Other companies specialize in broader or narrower parts of the AI creation and processing chain. Just to name a few, diverse companies: there’s Hugging Face, Inflection AI, CoreWeave, and Vultr. Those companies have a wide array of product offerings and resources from open source communities like Hugging Face that provide a menu of models, datasets, no-code tools, and (frankly) rad developer experiments to bare metal servers like Vultr that enhance your compute resources. How resources are offered also exist on a spectrum, including proprietary company resources (i.e. Nvidia’s platform), open source communities (looking at you, Hugging Face), or a mix of the two. 

An AI generated comic showing various iterations of data storage superheroes.
A comic generated on Hugging Face’s AI Comic Factory.

This means that, whichever piece of the AI tech stack you’re considering, you have a high degree of flexibility when you’re deciding where and how much you want to customize and where and how to implement an out-of-the box solution. 

Ballparking an estimate of what any of that costs would be so dependent on the particular model you want to build and the third-party solutions you choose that it doesn’t make sense to do so here. But, it suffices to say that there’s a pretty narrow field of folks who have the infrastructure capacity, the datasets, and the business need to create their own network. Usually it comes back to any combination of the following: whether you have existing infrastructure to leverage or are building from scratch, if you’re going to sell the solution to others, what control over research or dataset you have or want, how important privacy is and how you’re incorporating it into your products, how fast you need the model to make decisions, and so on. 

Welcome to the Spotlight, Storage

And, hey, with all that, let’s not forget storage. At the most basic level of consideration, AI uses a ton of data. How much? Going knowledge says at least an order of magnitude more examples than the problem presented to train an AI model. That means you want 10 times more examples than parameters. 

Parameters and Hyperparameters

The easiest way to think of parameters is to think of them as factors that control how an AI makes a decision. More parameters = more accuracy. And, just like our other AI terms, the term can be somewhat inconsistently applied. Here’s what ChatGPT has to say for itself:

A screenshot of a conversation with ChatGPT where it tells us it has 175 billion parameters.

That 10x number is just the amount of data you store for the initial training model—clearly the thing learns and grows, because we’re talking about AI. 

Preserving both your initial training algorithm and your datasets can be incredibly useful, too. As we talked about before, the more complex an AI, the higher the likelihood that your model will surprise you. And, as many folks have pointed out, deciding whether to leverage an already-trained model or to build your own doesn’t have to be an either/or—oftentimes the best option is to fine-tune an existing model to your narrower purpose. In both cases, having your original training model stored can help you roll back and identify the changes over time. 

The size of the dataset absolutely affects costs and processing times. The best example is that ChatGPT, everyone’s favorite model, has been rocking GPT-3 (or 3.5) instead of GPT-4 on the general public release because GPT-4, which works from a much larger, updated dataset than GPT-3, is too expensive to release to the wider public. It also returns results much more slowly than GPT-3.5, which means that our current love of instantaneous search results and image generation would need an adjustment. 

And all of that is true because GPT-4 was updated with more information (by volume), more up-to-date information, and the model was given more parameters to take into account for responses. So, it has to both access more data per query and use more complex reasoning to make decisions. That said, it also reportedly has much better results.

Storage and Cost

What are the real numbers to store, say, a primary copy of an AI dataset? Well, it’s hard to estimate, but we can ballpark that, if you’re training a large AI model, you’re going to have at a minimum tens of gigabytes of data and, at a maximum, petabytes. OpenAI considers the size of its training database proprietary information, and we’ve found sources that cite that number as  anywhere from 17GB to 570GB to 45TB of text data

That’s not actually a ton of data, and, even taking the highest number, it would only cost $225 per month to store that data in Backblaze B2 (45TB * $5/TB/mo), for argument’s sake. But let’s say you’re training an AI on video to, say, make a robot vacuum that can navigate your room or recognize and identify human movement. Your training dataset could easily reach into petabyte scale (for reference, one petabyte would cost $5,000 per month in Backblaze B2). Some research shows that dataset size is trending up over time, though other folks point out that bigger is not always better.

On the other hand, if you’re the guy with the Intel Neural Compute stick we mentioned above and a Raspberry Pi, you’re talking the cost of the ~$100 AI processor, ~$50 for the Raspberry Pi, and any incidentals. You can choose to add external hard drives, network attached storage (NAS) devices, or even servers as you scale up.

Storage and Speed

Keep in mind that, in the above example, we’re only considering the cost of storing the primary dataset, and that’s not very accurate when thinking about how you’d be using your dataset. You’d also have to consider temporary storage for when you’re actually training the AI as your primary dataset is transformed by your AI algorithm, and nearly always you’re splitting your primary dataset into discrete parts and feeding those to your AI algorithm in stages—so each of those subsets would also be stored separately. And, in addition to needing a lot of storage, where you physically locate that storage makes a huge difference to how quickly tasks can be accomplished. In many cases, the difference is a matter of seconds, but there are some tasks that just can’t handle that delay—think of tasks like self-driving cars. 

For huge data ingest periods such as training, you’re often talking about a compute process that’s assisted by powerful, and often specialized, supercomputers, with repeated passes over the same dataset. Having your data physically close to those supercomputers saves you huge amounts of time, which is pretty incredible when you consider that it breaks down to as little as milliseconds per task.

One way this problem is being solved is via caching, or creating temporary storage on the same chips (or motherboards) as the processor completing the task. Another solution is to keep the whole processing and storage cluster on-premises (at least while training), as you can see in the Microsoft-OpenAI setup or as you’ll often see in universities. And, unsurprisingly, you’ll also see edge computing solutions which endeavor to locate data physically close to the end user. 

While there can be benefits to on-premises or co-located storage, having a way to quickly add more storage (and release it if no longer needed), means cloud storage is a powerful tool for a holistic AI storage architecture—and can help control costs. 

And, as always, effective backup strategies require at least one off-site storage copy, and the easiest way to achieve that is via cloud storage. So, any way you slice it, you’re likely going to have cloud storage touch some part of your AI tech stack. 

What Hardware, Processing, and Storage Have in Common: You Have to Power Them

Here’s the short version: any time you add complex compute + large amounts of data, you’re talking about a ton of money and a ton of power to keep everything running. 

A disorganized set of power cords and switches plugged into what is decidedly too small of an outlet space.
Just flip the switch, and you have AI. Source.

Fortunately for us, other folks have done the work of figuring out how much this all costs. This excellent article from SemiAnalysis goes deep on the total cost of powering searches and running generative AI models. The Washington Post cites Dylan Patel (also of SemiAnalysis) as estimating that a single chat with ChatGPT could cost up to 1,000 times as much as a simple Google search. Those costs include everything we’ve talked about above—the capital expenditures, data storage, and processing. 

Consider this: Google spent several years putting off publicizing a frank accounting of their power usage. When they released numbers in 2011, they said that they use enough electricity to power 200,000 homes. And that was in 2011. There are widely varying claims for how much a single search costs, but even the most conservative say .03 Wh of energy. There are approximately 8.5 billion Google searches per day. (That’s just an incremental cost by the way—as in, how much does a single search cost in extra resources on top of how much the system that powers it costs.) 

Power is a huge cost in operating data centers, even when you’re only talking about pure storage. One of the biggest single expenses that affects power usage is cooling systems. With high-compute workloads, and particularly with GPUs, the amount of work the processor is doing generates a ton more heat—which means more money in cooling costs, and more power consumed. 

So, to Sum Up

When we’re talking about how much an AI costs, it’s not just about any single line item cost. If you decide to build and run your own models on-premises, you’re talking about huge capital expenditure and ongoing costs in data centers with high compute loads. If you want to build and train a model on your own USB stick and personal computer, that’s a different set of cost concerns. 

And, if you’re talking about querying a generative AI from the comfort of your own computer, you’re still using a comparatively high amount of power somewhere down the line. We may spread that power cost across our national and international infrastructures, but it’s important to remember that it’s coming from somewhere—and that the bill comes due, somewhere along the way. 

The post AI 101: Do the Dollars Make Sense? appeared first on Backblaze Blog | Cloud Storage & Cloud Backup.

[$] Security policies for GNU toolchain projects

Post Syndicated from corbet original https://lwn.net/Articles/945536/

While the CVE process was created in response to real problems, it’s increasingly clear that CVE numbers are
creating problems of their own. At the 2023 GNU Tools Cauldron,
Siddhesh Poyarekar expressed the frustration that toolchain developers have
felt as the result of arguing with security researchers about CVE-number
assignments. In response, the GNU toolchain community is trying to better
characterize what is — and is not — considered to be a security-relevant
bug in its software.

Security updates for Thursday

Post Syndicated from jake original https://lwn.net/Articles/945829/

Security updates have been issued by Debian (ncurses), Fedora (emacs, firecracker, firefox, libkrun, python-oauthlib, and virtiofsd), Mageia (glibc and vim), Oracle (18), SUSE (bind, binutils, busybox, cni, cni-plugins, container-suseconnect, containerd, curl, exempi, ffmpeg, firefox, go1.19-openssl, go1.20-openssl, gpg2, grafana, gsl, gstreamer-plugins-bad, gstreamer-plugins-base, libpng15, libwebp, mutt, nghttp2, open-vm-tools, pmix, python-brotlipy, python3, python310, qemu, quagga, rubygem-actionview-5_1, salt, supportutils, xen, and xrdp), and Ubuntu (libwebp, minidlna, puma, and python2.7, python3.5).

Amazon Bedrock Is Now Generally Available – Build and Scale Generative AI Applications with Foundation Models

Post Syndicated from Antje Barth original https://aws.amazon.com/blogs/aws/amazon-bedrock-is-now-generally-available-build-and-scale-generative-ai-applications-with-foundation-models/

This April, we announced Amazon Bedrock as part of a set of new tools for building with generative AI on AWS. Amazon Bedrock is a fully managed service that offers a choice of high-performing foundation models (FMs) from leading AI companies, including AI21 Labs, Anthropic, Cohere, Stability AI, and Amazon, along with a broad set of capabilities to build generative AI applications, simplifying the development while maintaining privacy and security.

Today, I’m happy to announce that Amazon Bedrock is now generally available! I’m also excited to share that Meta’s Llama 2 13B and 70B parameter models will soon be available on Amazon Bedrock.

Amazon Bedrock

Amazon Bedrock’s comprehensive capabilities help you experiment with a variety of top FMs, customize them privately with your data using techniques such as fine-tuning and retrieval-augmented generation (RAG), and create managed agents that perform complex business tasks—all without writing any code. Check out my previous posts to learn more about agents for Amazon Bedrock and how to connect FMs to your company’s data sources.

Note that some capabilities, such as agents for Amazon Bedrock, including knowledge bases, continue to be available in preview. I’ll share more details on what capabilities continue to be available in preview towards the end of this blog post.

Since Amazon Bedrock is serverless, you don’t have to manage any infrastructure, and you can securely integrate and deploy generative AI capabilities into your applications using the AWS services you are already familiar with.

Amazon Bedrock is integrated with Amazon CloudWatch and AWS CloudTrail to support your monitoring and governance needs. You can use CloudWatch to track usage metrics and build customized dashboards for audit purposes. With CloudTrail, you can monitor API activity and troubleshoot issues as you integrate other systems into your generative AI applications. Amazon Bedrock also allows you to build applications that are in compliance with the GDPR and you can use Amazon Bedrock to run sensitive workloads regulated under the U.S. Health Insurance Portability and Accountability Act (HIPAA).

Get Started with Amazon Bedrock
You can access available FMs in Amazon Bedrock through the AWS Management Console, AWS SDKs, and open-source frameworks such as LangChain.

In the Amazon Bedrock console, you can browse FMs and explore and load example use cases and prompts for each model. First, you need to enable access to the models. In the console, select Model access in the left navigation pane and enable the models you would like to access. Once model access is enabled, you can try out different models and inference configuration settings to find a model that fits your use case.

For example, here’s a contract entity extraction use case example using Cohere’s Command model:

Amazon Bedrock

The example shows a prompt with a sample response, the inference configuration parameter settings for the example, and the API request that runs the example. If you select Open in Playground, you can explore the model and use case further in an interactive console experience.

Amazon Bedrock offers chat, text, and image model playgrounds. In the chat playground, you can experiment with various FMs using a conversational chat interface. The following example uses Anthropic’s Claude model:

Amazon Bedrock

As you evaluate different models, you should try various prompt engineering techniques and inference configuration parameters. Prompt engineering is a new and exciting skill focused on how to better understand and apply FMs to your tasks and use cases. Effective prompt engineering is about crafting the perfect query to get the most out of FMs and obtain proper and precise responses. In general, prompts should be simple, straightforward, and avoid ambiguity. You can also provide examples in the prompt or encourage the model to reason through more complex tasks.

Inference configuration parameters influence the response generated by the model. Parameters such as Temperature, Top P, and Top K give you control over the randomness and diversity, and Maximum Length or Max Tokens control the length of model responses. Note that each model exposes a different but often overlapping set of inference parameters. These parameters are either named the same between models or similar enough to reason through when you try out different models.

We discuss effective prompt engineering techniques and inference configuration parameters in more detail in week 1 of the Generative AI with Large Language Models on-demand course, developed by AWS in collaboration with DeepLearning.AI. You can also check the Amazon Bedrock documentation and the model provider’s respective documentation for additional tips.

Next, let’s see how you can interact with Amazon Bedrock via APIs.

Using the Amazon Bedrock API
Working with Amazon Bedrock is as simple as selecting an FM for your use case and then making a few API calls. In the following code examples, I’ll use the AWS SDK for Python (Boto3) to interact with Amazon Bedrock.

List Available Foundation Models
First, let’s set up the boto3 client and then use list_foundation_models() to see the most up-to-date list of available FMs:

import boto3
import json

bedrock = boto3.client(
    service_name='bedrock', 
    region='us-east-1'
)

bedrock.list_foundation_models()

Run Inference Using Amazon Bedrock’s InvokeModel API
Next, let’s perform an inference request using Amazon Bedrock’s InvokeModel API and boto3 runtime client. The runtime client manages the data plane APIs, including the InvokeModel API.

Amazon Bedrock

The InvokeModel API expects the following parameters:

{
    "modelId": <MODEL_ID>,
    "contentType": "application/json",
    "accept": "application/json",
    "body": <BODY>
}

The modelId parameter identifies the FM you want to use. The request body is a JSON string containing the prompt for your task, together with any inference configuration parameters. Note that the prompt format will vary based on the selected model provider and FM. The contentType and accept parameters define the MIME type of the data in the request body and response and default to application/json. For more information on the latest models, InvokeModel API parameters, and prompt formats, see the Amazon Bedrock documentation.

Example: Text Generation Using AI21 Lab’s Jurassic-2 Model
Here is a text generation example using AI21 Lab’s Jurassic-2 Ultra model. I’ll ask the model to tell me a knock-knock joke—my version of a Hello World.

bedrock_runtime = boto3.client(
    service_name='bedrock-runtime', 
    region='us-east-1'
)

modelId = 'ai21.j2-ultra-v1' 
accept = 'application/json'
contentType = 'application/json'

body = json.dumps(
    {"prompt": "Knock, knock!", 
     "maxTokens": 200,
     "temperature": 0.7,
     "topP": 1,
    }
)

response = bedrock_runtime.invoke_model(
    body=body, 
	modelId=modelId, 
	accept=accept, 
	contentType=contentType
)

response_body = json.loads(response.get('body').read())

Here’s the response:

outputText = response_body.get('completions')[0].get('data').get('text')
print(outputText)
Who's there? 
Boo! 
Boo who? 
Don't cry, it's just a joke!

You can also use the InvokeModel API to interact with embedding models.

Example: Create Text Embeddings Using Amazon’s Titan Embeddings Model
Text embedding models translate text inputs, such as words, phrases, or possibly large units of text, into numerical representations, known as embedding vectors. Embedding vectors capture the semantic meaning of the text in a high-dimension vector space and are useful for applications such as personalization or search. In the following example, I’m using the Amazon Titan Embeddings model to create an embedding vector.

prompt = "Knock-knock jokes are hilarious."

body = json.dumps({
    "inputText": prompt,
})

model_id = 'amazon.titan-embed-g1-text-02'
accept = 'application/json' 
content_type = 'application/json'

response = bedrock_runtime.invoke_model(
    body=body, 
    modelId=model_id, 
    accept=accept, 
    contentType=content_type
)

response_body = json.loads(response['body'].read())
embedding = response_body.get('embedding')

The embedding vector (shortened) will look similar to this:

[0.82421875, -0.6953125, -0.115722656, 0.87890625, 0.05883789, -0.020385742, 0.32421875, -0.00078201294, -0.40234375, 0.44140625, ...]

Note that Amazon Titan Embeddings is available today. The Amazon Titan Text family of models for text generation continues to be available in limited preview.

Run Inference Using Amazon Bedrock’s InvokeModelWithResponseStream API
The InvokeModel API request is synchronous and waits for the entire output to be generated by the model. For models that support streaming responses, Bedrock also offers an InvokeModelWithResponseStream API that lets you invoke the specified model to run inference using the provided input but streams the response as the model generates the output.

Amazon Bedrock

Streaming responses are particularly useful for responsive chat interfaces to keep the user engaged in an interactive application. Here is a Python code example using Amazon Bedrock’s InvokeModelWithResponseStream API:

response = bedrock_runtime.invoke_model_with_response_stream(
    modelId=modelId, 
    body=body)

stream = response.get('body')
if stream:
    for event in stream:
        chunk=event.get('chunk')
        if chunk:
            print(json.loads(chunk.get('bytes').decode))

Data Privacy and Network Security
With Amazon Bedrock, you are in control of your data, and all your inputs and customizations remain private to your AWS account. Your data, such as prompts, completions, and fine-tuned models, is not used for service improvement. Also, the data is never shared with third-party model providers.

Your data remains in the Region where the API call is processed. All data is encrypted in transit with a minimum of TLS 1.2 encryption. Data at rest is encrypted with AES-256 using AWS KMS managed data encryption keys. You can also use your own keys (customer managed keys) to encrypt the data.

You can configure your AWS account and virtual private cloud (VPC) to use Amazon VPC endpoints (built on AWS PrivateLink) to securely connect to Amazon Bedrock over the AWS network. This allows for secure and private connectivity between your applications running in a VPC and Amazon Bedrock.

Governance and Monitoring
Amazon Bedrock integrates with IAM to help you manage permissions for Amazon Bedrock. Such permissions include access to specific models, playground, or features within Amazon Bedrock. All AWS-managed service API activity, including Amazon Bedrock activity, is logged to CloudTrail within your account.

Amazon Bedrock emits data points to CloudWatch using the AWS/Bedrock namespace to track common metrics such as InputTokenCount, OutputTokenCount, InvocationLatency, and (number of) Invocations. You can filter results and get statistics for a specific model by specifying the model ID dimension when you search for metrics. This near real-time insight helps you track usage and cost (input and output token count) and troubleshoot performance issues (invocation latency and number of invocations) as you start building generative AI applications with Amazon Bedrock.

Billing and Pricing Models
Here are a couple of things around billing and pricing models to keep in mind when using Amazon Bedrock:

Billing – Text generation models are billed per processed input tokens and per generated output tokens. Text embedding models are billed per processed input tokens. Image generation models are billed per generated image.

Pricing Models – Amazon Bedrock offers two pricing models, on-demand and provisioned throughput. On-demand pricing allows you to use FMs on a pay-as-you-go basis without having to make any time-based term commitments. Provisioned throughput is primarily designed for large, consistent inference workloads that need guaranteed throughput in exchange for a term commitment. Here, you specify the number of model units of a particular FM to meet your application’s performance requirements as defined by the maximum number of input and output tokens processed per minute. For detailed pricing information, see Amazon Bedrock Pricing.

Now Available
Amazon Bedrock is available today in AWS Regions US East (N. Virginia) and US West (Oregon). To learn more, visit Amazon Bedrock, check the Amazon Bedrock documentation, explore the generative AI space at community.aws, and get hands-on with the Amazon Bedrock workshop. You can send feedback to AWS re:Post for Amazon Bedrock or through your usual AWS contacts.

(Available in Preview) The Amazon Titan Text family of text generation models, Stability AI’s Stable Diffusion XL image generation model, and agents for Amazon Bedrock, including knowledge bases, continue to be available in preview. Reach out through your usual AWS contacts if you’d like access.

(Coming Soon) The Llama 2 13B and 70B parameter models by Meta will soon be available via Amazon Bedrock’s fully managed API for inference and fine-tuning.

Start building generative AI applications with Amazon Bedrock, today!

— Antje

The collective thoughts of the interwebz