Security updates for Thursday

Post Syndicated from original https://lwn.net/Articles/928976/

Security updates have been issued by Debian (chromium, firefox-esr, lldpd, and zabbix), Fedora (ffmpeg, firefox, pdns-recursor, polkit, and thunderbird), Oracle (kernel and nodejs:14), Red Hat (nodejs:14, openvswitch2.17, openvswitch3.1, and pki-core:10.6), Slackware (mozilla), SUSE (nextcloud-desktop), and Ubuntu (exo, linux, linux-kvm, linux-lts-xenial, linux-aws, smarty3, and thunderbird).

AMD Radeon Pro W7900 and W7800 Aim to Undercut NVIDIA RTX Pro Pricing

Post Syndicated from Cliff Robinson original https://www.servethehome.com/amd-radeon-pro-w7900-and-w7800-aim-to-undercut-nvidia-rtx-pro-pricing/

The new AMD Radeon Pro W7900 and W7800 high-end GPUs aim to undercut NVIDIA RTX professional graphics pricing

The post AMD Radeon Pro W7900 and W7800 Aim to Undercut NVIDIA RTX Pro Pricing appeared first on ServeTheHome.

Amazon EC2 Inf2 Instances for Low-Cost, High-Performance Generative AI Inference are Now Generally Available

Post Syndicated from Antje Barth original https://aws.amazon.com/blogs/aws/amazon-ec2-inf2-instances-for-low-cost-high-performance-generative-ai-inference-are-now-generally-available/

Innovations in deep learning (DL), especially the rapid growth of large language models (LLMs), have taken the industry by storm. DL models have grown from millions to billions of parameters and are demonstrating exciting new capabilities. They are fueling new applications such as generative AI or advanced research in healthcare and life sciences. AWS has been innovating across chips, servers, data center connectivity, and software to accelerate such DL workloads at scale.

At AWS re:Invent 2022, we announced the preview of Amazon EC2 Inf2 instances powered by AWS Inferentia2, the latest AWS-designed ML chip. Inf2 instances are designed to run high-performance DL inference applications at scale globally. They are the most cost-effective and energy-efficient option on Amazon EC2 for deploying the latest innovations in generative AI, such as GPT-J or Open Pre-trained Transformer (OPT) language models.

Today, I’m excited to announce that Amazon EC2 Inf2 instances are now generally available!

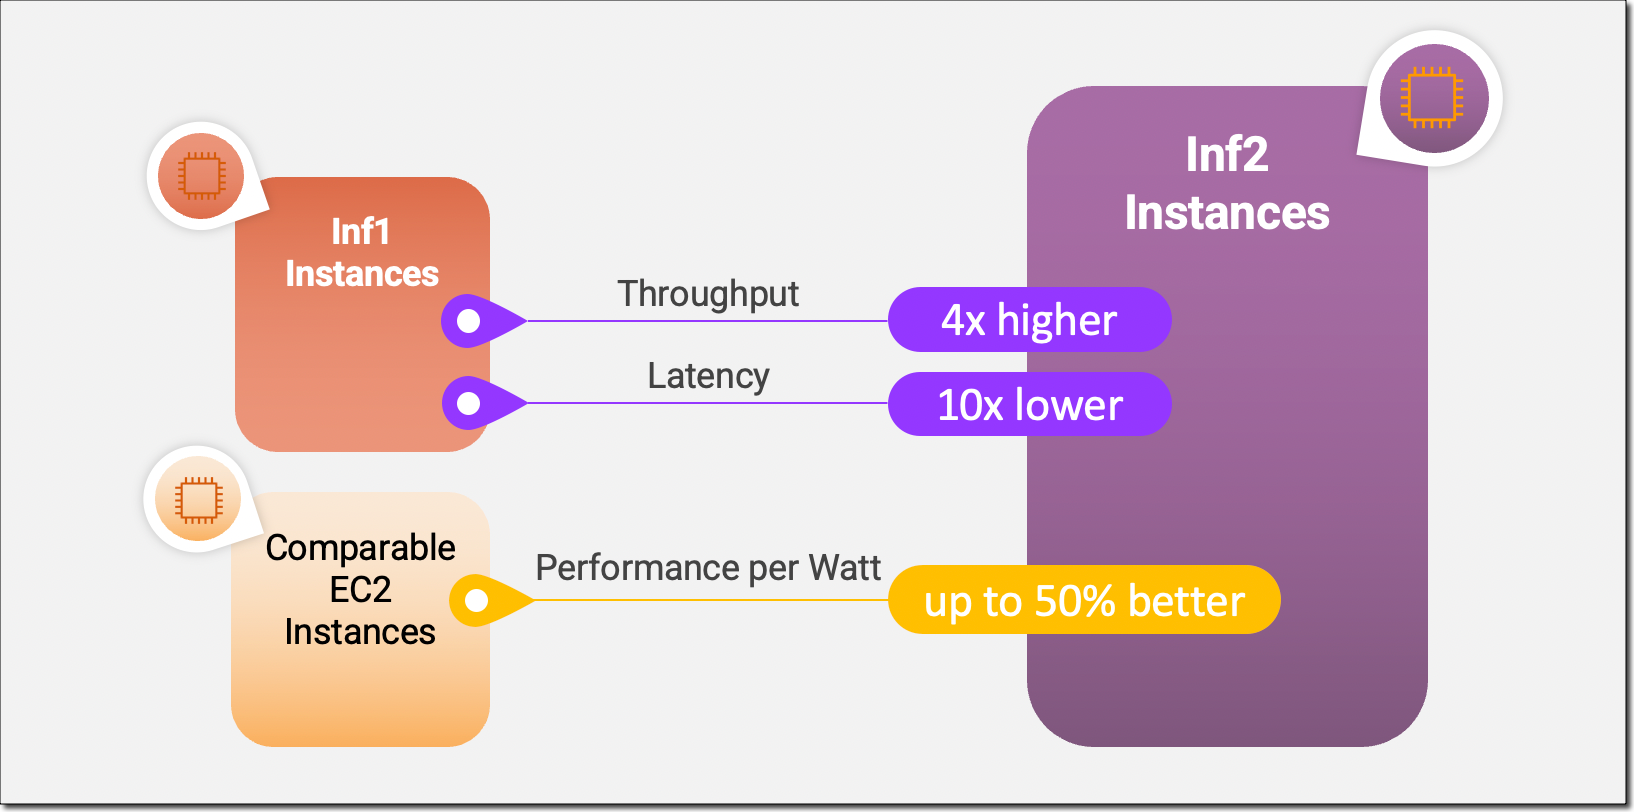
Inf2 instances are the first inference-optimized instances in Amazon EC2 to support scale-out distributed inference with ultra-high-speed connectivity between accelerators. You can now efficiently deploy models with hundreds of billions of parameters across multiple accelerators on Inf2 instances. Compared to Amazon EC2 Inf1 instances, Inf2 instances deliver up to 4x higher throughput and up to 10x lower latency. Here’s an infographic that highlights the key performance improvements that we have made available with the new Inf2 instances:

Performance improvements with Amazon EC2 Inf2

New Inf2 Instance Highlights
Inf2 instances are available today in four sizes and are powered by up to 12 AWS Inferentia2 chips with 192 vCPUs. They offer a combined compute power of 2.3 petaFLOPS at BF16 or FP16 data types and feature an ultra-high-speed NeuronLink interconnect between chips. NeuronLink scales large models across multiple Inferentia2 chips, avoids communication bottlenecks, and enables higher-performance inference.

Inf2 instances offer up to 384 GB of shared accelerator memory, with 32 GB high-bandwidth memory (HBM) in every Inferentia2 chip and 9.8 TB/s of total memory bandwidth. This type of bandwidth is particularly important to support inference for large language models that are memory bound.

Since the underlying AWS Inferentia2 chips are purpose-built for DL workloads, Inf2 instances offer up to 50 percent better performance per watt than other comparable Amazon EC2 instances. I’ll cover the AWS Inferentia2 silicon innovations in more detail later in this blog post.

The following table lists the sizes and specs of Inf2 instances in detail.

Instance Name
vCPUs AWS Inferentia2 Chips Accelerator Memory NeuronLink Instance Memory Instance Networking
inf2.xlarge 4 1 32 GB N/A 16 GB Up to 15 Gbps
inf2.8xlarge 32 1 32 GB N/A 128 GB Up to 25 Gbps
inf2.24xlarge 96 6 192 GB Yes 384 GB 50 Gbps
inf2.48xlarge 192 12 384 GB Yes 768 GB 100 Gbps

AWS Inferentia2 Innovation
Similar to AWS Trainium chips, each AWS Inferentia2 chip has two improved NeuronCore-v2 engines, HBM stacks, and dedicated collective compute engines to parallelize computation and communication operations when performing multi-accelerator inference.

Each NeuronCore-v2 has dedicated scalar, vector, and tensor engines that are purpose-built for DL algorithms. The tensor engine is optimized for matrix operations. The scalar engine is optimized for element-wise operations like ReLU (rectified linear unit) functions. The vector engine is optimized for non-element-wise vector operations, including batch normalization or pooling.

Here is a short summary of additional AWS Inferentia2 chip and server hardware innovations:

  • Data Types – AWS Inferentia2 supports a wide range of data types, including FP32, TF32, BF16, FP16, and UINT8, so you can choose the most suitable data type for your workloads. It also supports the new configurable FP8 (cFP8) data type, which is especially relevant for large models because it reduces the memory footprint and I/O requirements of the model. The following image compares the supported data types.AWS Inferentia2 Supported Data Types
  • Dynamic Execution, Dynamic Input Shapes – AWS Inferentia2 has embedded general-purpose digital signal processors (DSPs) that enable dynamic execution, so control flow operators don’t need to be unrolled or executed on the host. AWS Inferentia2 also supports dynamic input shapes that are key for models with unknown input tensor sizes, such as models processing text.
  • Custom Operators – AWS Inferentia2 supports custom operators written in C++. Neuron Custom C++ Operators enable you to write C++ custom operators that natively run on NeuronCores. You can use standard PyTorch custom operator programming interfaces to migrate CPU custom operators to Neuron and implement new experimental operators, all without any intimate knowledge of the NeuronCore hardware.
  • NeuronLink v2 – Inf2 instances are the first inference-optimized instance on Amazon EC2 to support distributed inference with direct ultra-high-speed connectivity—NeuronLink v2—between chips. NeuronLink v2 uses collective communications (CC) operators such as all-reduce to run high-performance inference pipelines across all chips.

The following Inf2 distributed inference benchmarks show throughput and cost improvements for OPT-30B and OPT-66B models over comparable inference-optimized Amazon EC2 instances.

Amazon EC2 Inf2 Benchmarks

Now, let me show you how to get started with Amazon EC2 Inf2 instances.

Get Started with Inf2 Instances
The AWS Neuron SDK integrates AWS Inferentia2 into popular machine learning (ML) frameworks like PyTorch. The Neuron SDK includes a compiler, runtime, and profiling tools and is constantly being updated with new features and performance optimizations.

In this example, I will compile and deploy a pre-trained BERT model from Hugging Face on an EC2 Inf2 instance using the available PyTorch Neuron packages. PyTorch Neuron is based on the PyTorch XLA software package and enables the conversion of PyTorch operations to AWS Inferentia2 instructions.

SSH into your Inf2 instance and activate a Python virtual environment that includes the PyTorch Neuron packages. If you’re using a Neuron-provided AMI, you can activate the preinstalled environment by running the following command:

source aws_neuron_venv_pytorch_p37/bin/activate

Now, with only a few changes to your code, you can compile your PyTorch model into an AWS Neuron-optimized TorchScript. Let’s start with importing torch, the PyTorch Neuron package torch_neuronx, and the Hugging Face transformers library.

import torch
import torch_neuronx from transformers import AutoTokenizer, AutoModelForSequenceClassification
import transformers
...

Next, let’s build the tokenizer and model.

name = "bert-base-cased-finetuned-mrpc"
tokenizer = AutoTokenizer.from_pretrained(name)
model = AutoModelForSequenceClassification.from_pretrained(name, torchscript=True)

We can test the model with example inputs. The model expects two sentences as input, and its output is whether or not those sentences are a paraphrase of each other.

def encode(tokenizer, *inputs, max_length=128, batch_size=1):
    tokens = tokenizer.encode_plus(
        *inputs,
        max_length=max_length,
        padding='max_length',
        truncation=True,
        return_tensors="pt"
    )
    return (
        torch.repeat_interleave(tokens['input_ids'], batch_size, 0),
        torch.repeat_interleave(tokens['attention_mask'], batch_size, 0),
        torch.repeat_interleave(tokens['token_type_ids'], batch_size, 0),
    )

# Example inputs
sequence_0 = "The company Hugging Face is based in New York City"
sequence_1 = "Apples are especially bad for your health"
sequence_2 = "Hugging Face's headquarters are situated in Manhattan"

paraphrase = encode(tokenizer, sequence_0, sequence_2)
not_paraphrase = encode(tokenizer, sequence_0, sequence_1)

# Run the original PyTorch model on examples
paraphrase_reference_logits = model(*paraphrase)[0]
not_paraphrase_reference_logits = model(*not_paraphrase)[0]

print('Paraphrase Reference Logits: ', paraphrase_reference_logits.detach().numpy())
print('Not-Paraphrase Reference Logits:', not_paraphrase_reference_logits.detach().numpy())

The output should look similar to this:

Paraphrase Reference Logits:     [[-0.34945598  1.9003887 ]]
Not-Paraphrase Reference Logits: [[ 0.5386365 -2.2197142]]

Now, the torch_neuronx.trace() method sends operations to the Neuron Compiler (neuron-cc) for compilation and embeds the compiled artifacts in a TorchScript graph. The method expects the model and a tuple of example inputs as arguments.

neuron_model = torch_neuronx.trace(model, paraphrase)

Let’s test the Neuron-compiled model with our example inputs:

paraphrase_neuron_logits = neuron_model(*paraphrase)[0]
not_paraphrase_neuron_logits = neuron_model(*not_paraphrase)[0]

print('Paraphrase Neuron Logits: ', paraphrase_neuron_logits.detach().numpy())
print('Not-Paraphrase Neuron Logits: ', not_paraphrase_neuron_logits.detach().numpy())

The output should look similar to this:

Paraphrase Neuron Logits: [[-0.34915772 1.8981738 ]]
Not-Paraphrase Neuron Logits: [[ 0.5374032 -2.2180378]]

That’s it. With just a few lines of code changes, we compiled and ran a PyTorch model on an Amazon EC2 Inf2 instance. To learn more about which DL model architectures are a good fit for AWS Inferentia2 and the current model support matrix, visit the AWS Neuron Documentation.

Available Now
You can launch Inf2 instances today in the AWS US East (Ohio) and US East (N. Virginia) Regions as On-Demand, Reserved, and Spot Instances or as part of a Savings Plan. As usual with Amazon EC2, you pay only for what you use. For more information, see Amazon EC2 pricing.

Inf2 instances can be deployed using AWS Deep Learning AMIs, and container images are available via managed services such as Amazon SageMaker, Amazon Elastic Kubernetes Service (Amazon EKS), Amazon Elastic Container Service (Amazon ECS), and AWS ParallelCluster.

To learn more, visit our Amazon EC2 Inf2 instances page, and please send feedback to AWS re:Post for EC2 or through your usual AWS Support contacts.

— Antje

Amazon CodeWhisperer, Free for Individual Use, is Now Generally Available

Post Syndicated from Steve Roberts original https://aws.amazon.com/blogs/aws/amazon-codewhisperer-free-for-individual-use-is-now-generally-available/

Today, Amazon CodeWhisperer, a real-time AI coding companion, is generally available and also includes a CodeWhisperer Individual tier that’s free to use for all developers. Originally launched in preview last year, CodeWhisperer keeps developers in the zone and productive, helping them write code quickly and securely and without needing to break their flow by leaving their IDE to research something. Faced with creating code for complex and ever-changing environments, developers can improve their productivity and simplify their work by making use of CodeWhisperer inside their favorite IDEs, including Visual Studio Code, IntelliJ IDEA, and others. CodeWhisperer helps with creating code for routine or time-consuming, undifferentiated tasks, working with unfamiliar APIs or SDKs, making correct and effective use of AWS APIs, and other common coding scenarios such as reading and writing files, image processing, writing unit tests, and lots more.

Using just an email account, you can sign up and, in just a few minutes, become more productive writing code—and you don’t even need to be an AWS customer. For business users, CodeWhisperer offers a Professional tier that adds administrative features, like SSO and IAM Identity Center integration, policy control for referenced code suggestions, and higher limits on security scanning. And in addition to generating code suggestions for Python, Java, JavaScript, TypeScript, and C#, the generally available release also now supports Go, Rust, PHP, Ruby, Kotlin, C, C++, Shell scripting, SQL, and Scala. CodeWhisperer is available to developers working in Visual Studio Code, IntelliJ IDEA, CLion, GoLand, WebStorm, Rider, PhpStorm, PyCharm, RubyMine, and DataGrip IDEs (when the appropriate AWS extensions for those IDEs are installed), or natively in AWS Cloud9 or AWS Lambda console.

Helping to keep developers in their flow is increasingly important as, facing increasing time pressure to get their work done, developers are often forced to break that flow to turn to an internet search, sites such as StackOverflow, or their colleagues for help in completing tasks. While this can help them obtain the starter code they need, it’s disruptive as they’ve had to leave their IDE environment to search or ask questions in a forum or find and ask a colleague—further adding to the disruption. Instead, CodeWhisperer meets developers where they are most productive, providing recommendations in real time as they write code or comments in their IDE. During the preview we ran a productivity challenge, and participants who used CodeWhisperer were 27% more likely to complete tasks successfully and did so an average of 57% faster than those who didn’t use CodeWhisperer.

Code generation from a comment in CodeWhisperer
Code generation from a comment

The code developers eventually locate may, however, contain issues such as hidden security vulnerabilities, be biased or unfair, or fail to handle open source responsibly. These issues won’t improve the developer’s productivity when they later have to resolve them. CodeWhisperer is the best coding companion when it comes to coding securely and using AI responsibly. To help you code responsibly, CodeWhisperer filters out code suggestions that might be considered biased or unfair, and it’s the only coding companion that can filter or flag code suggestions that may resemble particular open-source training data. It provides additional data for suggestions—for example, the repository URL and license—when code similar to training data is generated, helping lower the risk of using the code and enabling developers to reuse it with confidence.

Reference tracking in CodeWhisperer
Open-source reference tracking

CodeWhisperer is also the only AI coding companion to have security scanning for finding and suggesting remediations for hard-to-detect vulnerabilities, scanning both generated and developer-written code looking for vulnerabilities such as those in the top ten listed in the Open Web Application Security Project (OWASP). If it finds a vulnerability, CodeWhisperer provides suggestions to help remediate the issue.

Scanning for vulnerabilities in CodeWhisperer
Scanning for vulnerabilities

Code suggestions provided by CodeWhisperer are not specific to working with AWS. However, CodeWhisperer is optimized for the most-used AWS APIs, for example AWS Lambda, or Amazon Simple Storage Service (Amazon S3), making it the best coding companion for those building applications on AWS. While CodeWhisperer provides suggestions for general-purpose use cases across a variety of languages, the tuning performed using additional data on AWS APIs means you can be confident it is the highest quality, most accurate code generation you can get for working with AWS.

Meet Your new AI Code Companion Today
Amazon CodeWhisperer is generally available today to all developers—not just those with an AWS account or working with AWS—writing code in Python, Java, JavaScript, TypeScript, C#, Go, Rust, PHP, Ruby, Kotlin, C, C++, Shell scripting, SQL, and Scala. You can sign up with just an email address, and, as I mentioned at the top of this post, CodeWhisperer offers an Individual tier that’s freely available to all developers. More information on the Individual tier, and pricing for the Professional tier, can be found at https://aws.amazon.com/codewhisperer/pricing

Anarchy in the UK? Not Quite: A look at the cyber health of the FTSE 350

Post Syndicated from Rapid7 original https://blog.rapid7.com/2023/04/13/anarchy-in-the-uk-not-quite-a-look-at-the-cyber-health-of-the-ftse-350/

Anarchy in the UK? Not Quite: A look at the cyber health of the FTSE 350

The attack surface of the United Kingdom’s 350 largest publicly traded companies has—drum roll, please—improved. But it could be better. Those are the high level findings of the latest in Rapid7’s looks at the cybersecurity health of companies tied to some of the globe’s largest stock indices. This is the second time in more than two years that we looked at the FTSE 350 to gauge how well the entire UK’s business arena is faring against cyber threats. Turns out, they’ve improved in that time, and are on par with the other big indices we’ve looked at, though in some specific places, there is definitely room for improvement.

We chose the FTSE 350 as a benchmark in determining the cyber health of UK businesses because they are by and large some of the largest companies in the country and are not as resource constrained as some other, smaller, companies might be. This gives us a pretty even playing field on which to analyze their health and extrapolate out to the overall health of the region. We’ve done this with several other indices (most recently the ASX 200) and find it works well to provide a snapshot of what’s going on in the region.

In this report, we looked first at the overall attack surface of the FTSE 350 companies, broken down by industry. We also looked at the overall health of their email and web server security. All three areas showed improvement, as well as points for concern.

Attack Surface

By and large, the attack surfaces of the companies that make up the FTSE 350 was quite limited and in line with other major indices around the world. But, when you look at the individual industries that make up the FTSE you start to see some red flags.

For instance, financial and technology companies have by far the largest vulnerability through high risk ports exposed to the internet. Technology companies averaged well over 1000 ports with internet exposure and financial companies averaged nearly 800. That is 4 and 5 times the next highest industry (respectively). When it comes to particularly high risk ports, the financial sector is the biggest offender with an average of 12 high risk ports. For comparison, the technology sector had three.

Email Security

Email security is one area where we’ve seen some laudable improvement over the last time we looked at the FTSE 350. For instance, use of Domain-based Message Authentication, Reporting & Conformance (DMARC) policy is up 29%. However, the implementation of Domain Name System Security Extensions (DNSSEC) is at just 4% of the 350 companies that make up the index. Sadly, this too is on par with other indices. They should all seek improvements (alright, we’ll get off our soapbox).

Web Server Security

Going after vulnerable web servers is a favorite vector for attackers. When looking at the status of FTSE 350 company web servers we found that of the three most common types (NGinx, Apache, and IIS), not all were running high enough percentages of supported or fully patched versions. For instance, some 40% of NGinx servers were supported or fully patched, whereas 89% of Apache and 80% of IIS servers were. That’s a pretty big discrepancy. Thankfully, Apache and IIS are the dominant servers in this region, minimizing the overall risk.

If you want to take a look at our report you can read it here. If you’d like to check out the report we conducted for Australia’s ASX 200 it is available here.

Bypassing a Theft Threat Model

Post Syndicated from Bruce Schneier original https://www.schneier.com/blog/archives/2023/04/bypassing-a-theft-threat-model.html

Thieves cut through the wall of a coffee shop to get to an Apple store, bypassing the alarms in the process.

I wrote about this kind of thing in 2000, in Secrets and Lies (page 318):

My favorite example is a band of California art thieves that would break into people’s houses by cutting a hole in their walls with a chainsaw. The attacker completely bypassed the threat model of the defender. The countermeasures that the homeowner put in place were door and window alarms; they didn’t make a difference to this attack.

The article says they took half a million dollars worth of iPhones. I don’t understand iPhone device security, but don’t they have a system of denying stolen phones access to the network?

EDITED TO ADD (4/13): A commenter says: “Locked idevices will still sell for 40-60% of their value on eBay and co, they will go to Chinese shops to be stripped for parts. A aftermarket ‘oem-quality’ iPhone 14 display is $400+ alone on ifixit.”

Анализ на изборните проблеми

Post Syndicated from Bozho original https://blog.bozho.net/blog/4045

Тези дни се появяват множество публикации с проблемни изборни протоколи и грешни сумирания. На официалната пресконференция на Продължаваме промяната – Демократична България позицията ни беше, че проблеми има и те трябва да бъдат посочени и решени, и макар че тяхното натрупване едва ли би променило крайния резултат, всеки глас има значение. Подкрепям тази теза и нейнто спокойно артикулиране, като ще опитам да обясня детайлите и какво точно виждаме.

Първо, усещането за нечестност е разбираемо. Имаше много секции с проблеми с машините, заради това, че ЦИК не осигури тестове с реалната хартия и реалните ролки и те, оказа се, не работят добре с машините. Има секции с фрапантни грешки, има секции с поправяни протоколи, има лошо организиран процес в СИК, както се видя на камерите. Доста секции не излъчваха наживо, протоколите на РИК и дори финалния има несъответствия при сумирането, имаше и много сигнали за купуване на гласове. Тези проблеми произтичат от пропуски в Изборния кодекс и грешки на изборната администрация. И за почти всеки от тези проблеми сме предупреждавали. Но да ги разгледаме един по един:

  • разминавания между машинните данни и протоколите на СИК (т.е. човешкото броене). В много случаи (1/5 от секциите) имаше такива разминавания. Това беше очаквано и го казвахме много пъти – машината е по-добра от хората в това да брои и да смята. В крайна сметка, обаче, разликите са пренебрежимо малки. ППДБ имаме отчетени с 1458 гласа по-малко от секционните комисии спрямо машините. Да, не е редно да има такива грешки, защото всеки глас е важен и ние затова се борихме да останат машинните данни за такъв тип проверка, и настоявахме пред ЦИК тя да се случи в РИК, за да може да се отстраняват. Но именно заради тези усилия, злонамерени системни манипулации по-скоро няма – това са очаквани грешки при броенето, каквито винаги е имало. Между другото, ГЕРБ също са надолу с 894 гласа от тези грешки. Отговорността за тези разминавания е на мнозинството на ГЕРБ, ДПС и БСП и на ЦИК, които отказаха машината да вади протокол.
  • сериозни разминавания в някои секции – да, има такива секции, в които има разлика 10-20-40-80 гласа в ущърб на ППДБ. Тези секции са малко на брой (аз при предварително сваляне на данните открих 13 такива). От това, което изглеждах на видеозаписите (не съм изгледал всички), са заради хаотична работа в секционната комисия, а не злонамерени. Но трябва да предотвратявяме такива грешки, за да не бъдат скрити вбъдеще зад тях злонамерени действия.
  • проблеми с контролите – многото грешки в протоколите поставят под съмнение наличието на контроли. Реално, обаче, контроли има и те са сработили. Просто районните комисии приемат протоколите „в червено“ (т.е. с яснота, че има грешки по тях) и ги предават на ЦИК така. След това ЦИК анализира всички тези несъответствия. Поправя грешките там, където може (чл. 301), и описва всичко в доклад, който вече е публичен. В крайна сметка от тези неизлезли контроли разминаванията са незначителни в крайния резултат, но отново показват, че натрупването на проблеми от Изборния кодекс води до повече грешки.
  • грешно събиране на данни в протоколите на РИК и финалния на ЦИК – когато отворите протокол на РИК, особено в 24-ти МИР, бие на очи, че хартия+машина не е равно на „Общо“. Това изглежда неадекватно, и е, защото ЦИК е приело, че колоната „общо“ също е първична данна, както другите две колони. И когато в СИК не съберат две числа правилно, това се пренася с натрупване в районния протокол. Това можеше да бъде коригирано в РИК, но нито ЦИК, нито РИК са взели такива решения за няколко секции и накрая изглежда, че изборните органи не могат да съберат две числа. Реално и там разминаванията са малки (-109 гласа за ГЕРБ, -173 за ППДБ), но отново проблемът е резултат и от Изборния кодекс, и от действията на ЦИК. И заради липсата на ясно обяснение, създава сериозно недоверие. Любопитното е, че след повторната проверка такива грешки има само в няколко секции. Тази, която допринася за почти цялото разминаване в сумите е секция 244606040 в София, където са писали резултата в полето за „хартия“, и са оставили „машина“ и „общо“ празни. И нито РИК, нито ЦИК са коригирали тази очевидна грешка. Една секция не променя изборите, но заради нея се създава усещане за манипулации.
  • проблеми с машинното гласуване – на много места ролките и хартията бяха неподходящи, а тъй като не бяха тествани предварително, изборната администрация разбра това в изборния ден. Ще цитирам член на ЦИК (от квотата на БСП), който в средата на март казва следното. ЕМИЛ ВОЙНОВ: „Уважаеми колеги, аз считам, че ако специализираната хартия с утвърдените защити не бъде удостоверена от органите, които са оторизирани от Изборния кодекс да извършат удостоверяване, и се появи някакъв проблем с хартията в изборния ден, то може машинното гласуване да се компрометира и Централната избирателна комисия да носи отговорност в такъв случай, че не е взела всички мерки да бъде удостоверена тази хартия.“. Тези проблеми можеха да се решат, ако ЦИК беше изпълнило в пълнота параграф 55 от Изборния кодекс (предложен от нас) за провеждане на експерименти с реалната хартия. Но нетният резултат и от тях е няколко двойни гласувания, докато излезе разписка, което пък допринася за по-големия брой разминавания в протоколите, обяснено по-горе
  • без видеоизлъчване в 2639 секции, както и липса на видеоизлъчване в някои от определените като „рискови“ секции. Тук има два аспекта – първият е, че телекомите нямат добро покритие навсякъде (именно затова в плана за възстановяване има проект за високоскоростна свързаност в отдалечени райони). Това беше известно, очаквано и макар да нямаше информация за точната бройка секции, очакванията бяха за между 2 и 3 хиляди. Това не значи, че телефоните не са били включени и че няма запис – записите очаквам да бъдат качени съвсем скоро. Малко по-високият процент рискови секции без излъчване (26.9% спрямо 22.7 от всички, изчислено на база на качените видеа) също е обясним отчасти с покритието. Тъй като тези често са по-отдалечени места, е очаквано при тях липсата на излъчване да е по-масова. Това се потвърждава и от по-високия процент секции с лошо качество на излъчването в рисковите секции, което също може да се извлече от сайта evideo.bg. Трябва да имаме предвид, че секция се определя като рискова по много критерии, но основните са свързани с различни гласувания на големи групи избиратели на различни избори – иначе казано на едните избори са купени гласовете за една партия, на другите за друга, а на трети МВР си е свършило работата и не са излезли да гласуват. Това няма да се види на камерите. То се случва преди изборния ден и в самия изборен ден. Камерите бяха добър превантивен инструмент – когато знаеш, че нещо снима и записва, не си склонен да правиш фрапантни нарушения. В тези секции, между другото, членовете на СИК не знаят дали има излъчване или не. Има и секции с невключени телефони, като предстои да видим кои са те, но предвид горната статистика, не очаквам да има значително изкривяване.
  • липса на паравани – вместо тях се ползваха старите тъмни стаички, което позволява снимане за доказване на купен и контролиран вот. Тук доброто законодателно намерение се срещна с невъзможността на изборна администрация, местна администрация и централна администрация да изпълнят закона. ЦИК не каза какво точно значи параван, а общините и правителството на закупиха такива. Ако има нарушение, което смятам за сериозно, това е именно липсата на паравани. Но можем да го отдадем отчасти и на кратките срокове заради предсрочността на изборите. На следващи избори се надявам ЦИК, Министерски съвет и общините да поправят пропуска с параваните.
  • купуване на гласове – това е най-сериозният проблем на българските избори, не само на тези. От всичко изброено, то има най-значителен ефект върху крайния резултат. То обаче не е в компетенциите на ЦИК и не е пряка част от изборния процес (като изключим горната точка). Купуването на гласове е функция на много други проблеми в обществото, вкл. на нереформираната прокуратура и неспособността на МВР да противодейства достатъчно ефективно. Осъдени за купуване на гласове сигурно ще има, но те не купуват за себе си, а за някоя партия, и това става с нейното или одобрение, или затваряне на очи. Има необясними преференциални резултати из страната, които допринасят за усещането за нечестност. Трябва най-после купуването на гласове да спре и партии, които имат претенции да представляват големи групи избиратели, да се откажат от тези престъпни практики.
  • протокол на флашка с електронен подпис в бъдещето – Бърд са открили една секция, в която електронният подпис на машинния протокол е с дата в бъдещето. Това е интересно наблюдение и повдига въпроси, на които опитах да дам отговор вчера във Фейсбук. Накратко – това е само една секция, в която няма разминавания с данните на СИК, и грешката най-вероятно е при настройването на машините в складовете. ИО не може да копира ключове от картите, но както много пъти сме предлагали, трябва публичните ключове на всички карти да се публикуват преди изборния ден

Всичко това дава усещане за нещо нередно, за нещо манипулирано, за нещо нечестно. Но все пак изглежда, че няма основания да смятаме, че поправянето на грешките ще промени резултата. Няма основания, обаче, и да ги игнорираме, и ще предприемем действия в тази посока в парламента.

На тези избори няма сериозни разминавания между протоколите от СИК и данните на флашките. Разминаванията са далеч от гласовете за дори един мандат (който изисква малко под 10 хил. гласа). Грешките в протоколите на СИК, РИК и ЦИК след повторните проверки също са сумарно около 1000 гласа за всички. Но грешки, които не променят резултата на парламентарни избори, могат да променят всичко на предстоящите местни избори, при които няколко десетки гласа могат да променят кмета на дадена община или баланса в общинския ѝ съвет. И това е още една причина да направим така, че да не се случват.

Купуването на гласове не изглежда да има значителен ръст, но не е и намаляло. Затова съм подготвил въпрос към МВР, с който да получим по-добра представа за действията им.

Между другото, добре че спасихме данните от флашката в Изборния кодекс, за да можем да сме сигурни за мащаба на грешките и да можем да го проверяваме в реално време, още докато излизат резултатите и да подаваме разминаванията на ЦИК за проверка, както и направихме. Иначе няколко такива протокола щяха да имат още по-силен публичен ефект и да подкопаят още повече доверието в крайния резултат.

Това, че многото грешки и несъвършенствата в процеса не водят до сериозни изкривявания на тези избори е добре, но не трябва да ни успокоява – всеки глас е важен и трябва да бъде отчетен правилно. Особено на местни избори. Не ни успокоява и това, че при приемането на кодекса посочихме риска за много от тези проблеми. Нужно е, при наличие на парламентарно време, спокойно да решим какъв Изборен кодекс искаме. Не „на коляно“, не със сила, не с лудитски пориви за борба с технологиите и не със среднощни заседания. Този изборен кодекс не е добър, създава условия за всички тези грешки и за недоверие в изборния процеса. Нашата работа е да ги посочваме и решаваме без рушим и малкото останало доверие.

Материалът Анализ на изборните проблеми е публикуван за пръв път на БЛОГодаря.

[$] Searching for an elusive orchid pollinator

Post Syndicated from original https://lwn.net/Articles/928691/

Orchids are, of course,
flowers, and flowers generally need pollinators
in order to reproduce. A seemingly offhand comment about the unknown nature
of the pollinator(s) for a species of orchid in Western Australia
has led Paul Hamilton to undertake a multi-year citizen-science project to
try to fill that hole. He came to Everything Open 2023 to
give a report on the progress of the search.

Amazon EMR on EKS widens the performance gap: Run Apache Spark workloads 5.37 times faster and at 4.3 times lower cost

Post Syndicated from Melody Yang original https://aws.amazon.com/blogs/big-data/amazon-emr-on-eks-widens-the-performance-gap-run-apache-spark-workloads-5-37-times-faster-and-at-4-3-times-lower-cost/

Amazon EMR on EKS provides a deployment option for Amazon EMR that allows organizations to run open-source big data frameworks on Amazon Elastic Kubernetes Service (Amazon EKS). With EMR on EKS, Spark applications run on the Amazon EMR runtime for Apache Spark. This performance-optimized runtime offered by Amazon EMR makes your Spark jobs run fast and cost-effectively. Also, you can run other types of business applications, such as web applications and machine learning (ML) TensorFlow workloads, on the same EKS cluster. EMR on EKS simplifies your infrastructure management, maximizes resource utilization, and reduces your cost.

We have been continually improving the Spark performance in each Amazon EMR release to further shorten job runtime and optimize users’ spending on their Amazon EMR big data workloads. As of the Amazon EMR 6.5 release in January 2022, the optimized Spark runtime was 3.5 times faster than OSS Spark v3.1.2 with up to 61% lower costs. Amazon EMR 6.10 is now 1.59 times faster than Amazon EMR 6.5, which has resulted in 5.37 times better performance than OSS Spark v3.3.1 with 76.8% cost savings.

In this post, we describe the benchmark setup and results on top of the EMR on EKS environment. We also share a Spark benchmark solution that suits all Amazon EMR deployment options, so you can replicate the process in your environment for your own performance test cases. The solution uses the TPC-DS dataset and unmodified data schema and table relationships, but derives queries from TPC-DS to support the SparkSQL test cases. It is not comparable to other published TPC-DS benchmark results.

Benchmark setup

To compare with the EMR on EKS 6.5 test result detailed in the post Amazon EMR on Amazon EKS provides up to 61% lower costs and up to 68% performance improvement for Spark workloads, this benchmark for the latest release (Amazon EMR 6.10) uses the same approach: a TPC-DS benchmark framework and the same size of TPC-DS input dataset from an Amazon Simple Storage Service (Amazon S3) location. For the source data, we chose the 3 TB scale factor, which contains 17.7 billion records, approximately 924 GB compressed data in Parquet file format. The setup instructions and technical details can be found in the aws-sample repository.

In summary, the entire performance test job includes 104 SparkSQL queries and was completed in approximately 24 minutes (1,397.55 seconds) with an estimated running cost of $5.08 USD. The input data and test result outputs were both stored on Amazon S3.

The job has been configured with the following parameters that match with the previous Amazon EMR 6.5 test:

  • EMR release – EMR 6.10.0
  • Hardware:
    • Compute – 6 X c5d.9xlarge instances, 216 vCPU, 432 GiB memory in total
    • Storage – 6 x 900 NVMe SSD build-in storage
    • Amazon EBS root volume – 6 X 20GB gp2
  • Spark configuration:
    • Driver pod – 1 instance among other 7 executors on a shared Amazon Elastic Compute Cloud (Amazon EC2) node:
      • spark.driver.cores=4
      • spark.driver.memory=5g
      • spark.kubernetes.driver.limit.cores=4.1
    • Executor pod – 47 instances distributed over 6 EC2 nodes
      • spark.executor.cores=4
      • spark.executor.memory=6g
      • spark.executor.memoryOverhead=2G
      • spark.kubernetes.executor.limit.cores=4.3
  • Metadata store – We use Spark’s in-memory data catalog to store metadata for TPC-DS databases and tables—spark.sql.catalogImplementation is set to the default value in-memory. The fact tables are partitioned by the date column, which consists of partitions ranging from 200–2,100. No statistics are pre-calculated for these tables.

Results

A single test session consists of 104 Spark SQL queries that were run sequentially. We ran each Spark runtime session (EMR runtime for Apache Spark, OSS Apache Spark) three times. The Spark benchmark job produces a CSV file to Amazon S3 that summarizes the median, minimum, and maximum runtime for each individual query.

The way we calculate the final benchmark results (geomean and the total job runtime) are based on arithmetic means. We take the mean of the median, minimum, and maximum values per query using the formula of AVERAGE(), for example AVERAGE(F2:H2). Then we take a geometric mean of the average column I by the formula GEOMEAN(I2:I105) and SUM(I2:I105) for the total runtime.

Previously, we observed that EMR on EKS 6.5 is 3.5 times faster than OSS Spark on EKS, and costs 2.6 times less. From this benchmark, we found that the gap has widened: EMR on EKS 6.10 now provides a 5.37 times performance improvement on average and up to 11.61 times improved performance for individual queries over OSS Spark 3.3.1 on Amazon EKS. From the running cost perspective, we see the significant reduction by 4.3 times.

The following graph shows the performance improvement of Amazon EMR 6.10 compared to OSS Spark 3.3.1 at the individual query level. The X-axis shows the name of each query, and the Y-axis shows the total runtime in seconds on logarithmic scale. The most significant performance gains for eight queries (q14a, q14b, q23b, q24a, q24b, q4, q67, q72) demonstrated over 10 times faster for the runtime.

Job cost estimation

The cost estimate doesn’t account for Amazon S3 storage, or PUT and GET requests. The Amazon EMR on EKS uplift calculation is based on the hourly billing information provided by AWS Cost Explorer.

  • c5d.9xlarge hourly price – $1.728
  • Number of EC2 instances – 6
  • Amazon EBS storage per GB-month – $0.10
  • Amazon EBS gp2 root volume – 20GB
  • Job run time (hour)
    • OSS Spark 3.3.1 – 2.09
    • EMR on EKS 6.5.0 – 0.68
    • EMR on EKS 6.10.0 – 0.39
Cost component OSS Spark 3.3.1 on EKS EMR on EKS 6.5.0 EMR on EKS 6.10.0
Amazon EC2 $21.67 $7.05 $4.04
EMR on EKS $ – $1.57 $0.99
Amazon EKS $0.21 $0.07 $0.04
Amazon EBS root volume $0.03 $0.01 $0.01
Total $21.88 $8.70 $5.08

Performance enhancements

Although we improve on Amazon EMR’s performance with each release, Amazon EMR 6.10 contained many performance optimizations, making it 5.37 times faster than OSS Spark v3.3.1 and 1.59 times faster than our first release of 2022, Amazon EMR 6.5. This additional performance boost was achieved through the addition of multiple optimizations, including:

  • Enhancements to join performance, such as the following:
    • Shuffle-Hash Joins (SHJ) are more CPU and I/O efficient than Shuffle-Sort-Merge Joins (SMJ) when the costs of building and probing the hash table, including the availability of memory, are less than the cost of sorting and performing the merge join. However, SHJs have drawbacks, such as risk of out of memory errors due to its inability to spill to disk, which prevents them from being aggressively used across Spark in place of SMJs by default. We have optimized our use of SHJs so that they can be applied to more queries by default than in OSS Spark.
    • For some query shapes, we have eliminated redundant joins and enabled the use of more performant join types.
  • We have reduced the amount of data shuffled before joins and the potential for data explosions after joins by selectively pushing down aggregates through joins.
  • Bloom filters can improve performance by reducing the amount of data shuffled before the join. However, there are cases where bloom filters are not beneficial and can even regress performance. For example, the bloom filter introduces a dependency between stages that reduces query parallelism, but may end up filtering out relatively little data. Our enhancements allow bloom filters to be safely applied to more query plans than OSS Spark.
  • Aggregates with high-precision decimals are computationally intensive in OSS Spark. We optimized high-precision decimal computations to increasing their performance.

Summary

With version 6.10, Amazon EMR has further enhanced the EMR runtime for Apache Spark in comparison to our previous benchmark tests for Amazon EMR version 6.5. When running EMR workloads with the the equivalent Apache Spark version 3.3.1, we observed 1.59 times better performance with 41.6% cheaper costs than Amazon EMR 6.5.

With our TPC-DS benchmark setup, we observed a significant performance increase of 5.37 times and a cost reduction of 4.3 times using EMR on EKS compared to OSS Spark.

To learn more and get started with EMR on EKS, try out the EMR on EKS Workshop and visit the EMR on EKS Best Practices Guide page.


About the Authors

Melody YangMelody Yang is a Senior Big Data Solution Architect for Amazon EMR at AWS. She is an experienced analytics leader working with AWS customers to provide best practice guidance and technical advice in order to assist their success in data transformation. Her areas of interests are open-source frameworks and automation, data engineering and DataOps.

Ashok Chintalapati is a software development engineer for Amazon EMR at Amazon Web Services.

AWS Security Profile: Matt Luttrell, Principal Solutions Architect for AWS Identity

Post Syndicated from Maddie Bacon original https://aws.amazon.com/blogs/security/aws-security-profile-matt-luttrell-principal-solutions-architect-for-aws-identity/

AWS Security Profile: Matt Luttrell, Principal Solutions Architect for AWS Identity

In the AWS Security Profile series, I interview some of the humans who work in Amazon Web Services Security and help keep our customers safe and secure. In this profile, I interviewed Matt Luttrell, Principal Solutions Architect for AWS Identity.


How long have you been at AWS and what do you do in your current role?

I’ve been at AWS around five years and have worked in a variety of roles from Professional Services consulting as an application architect to a solutions architect. In my current role, I work on the Identity Solutions team, which is a group of solutions architects who are embedded directly in the Identity and Control Services team. We have both internal-facing and external-facing functions. Internally, we work with product managers, drive concepts like data perimeters, and generally act as the voice of the customer to our product teams. Externally, we have conversations with customers, present at events, and so on.

How did you get started in security?

My background is in software development. I’ve always had a side interest in security and have always worked for very security-conscious companies. Early in my career, I became CISSP certified and that’s what got me kickstarted in security-specific domains and conversations. At AWS, being involved in security isn’t an optional thing. So, even before I joined the Identity Solutions team, I spent a lot of time working on identity and AWS Identity and Access Management (IAM) in particular, as well as AWS IAM Access Analyzer, while working with security-conscious customers in the financial services industry. As I got involved in that, I was able to dive deep in the security elements of AWS, but I’ve always had a background in security.

How do you explain your job to non-technical friends and family?

I typically tell them that I work in the cloud computing division at Amazon and that my job title is Solutions Architect. Naturally, the next question is, “what does a solutions architect do? I’ve never heard of that.” I explain that I work with customers to figure out how to put the building blocks together that we offer them. We offer a bunch of different services and features, and my job is to teach customers how they all work and interact with each other.

What are you currently working on that you’re excited about?

One of the things our team is working on is data perimeters. Our customers will see continued guidance on data perimeters. We’ve done a lot of work in this space—workshops and presentations at some of our big conferences, as well as blog posts and example repositories.

I’m also putting together some videos that go in depth on IAM policy evaluation and offer prescriptive guidance on writing IAM policies.

In your opinion, what’s one of the coolest things happening in identity right now?

I might be biased here, but I think there’s been a shift in the security industry at large from network-based perimeters in the traditional on-premises world to identity-based perimeters in the cloud. This is where the concept of data perimeters comes into play. Because your resources and identities are distributed, you can no longer look at your server and touch your server that’s sitting right next to you. This really puts an extra emphasis on your authentication and authorization controls, as well as the need for visibility into those controls. I think there’s a lot of innovation happening in the identity world because of this increased focus on identity perimeters. You’re hearing about concepts in this area like zero trust, data perimeters, and general identity awareness in all levels of the application and infrastructure stacks. You have services like IAM Access Analyzer to help give you that visibility into your AWS environment and what your identities are doing in terms of who can access what. I think we’ll continue to see growth in these areas because workloads are not becoming less distributed over time.

Tell me about something fun that you’ve done recently at AWS.

Roberto Migli and I presented a 400-level workshop at re:Invent 2022 on IAM policy evaluation, AWS Identity and Access Management (IAM) policy evaluation in action. This workshop introduced a new mental model for thinking about policy evaluation and walked attendees through a number of different policy evaluation scenarios. The idea behind the workshop is that we introduce a scenario and have the attendee try to figure out what the result of the evaluation would be. It spends some extra time comparing how the evaluation of resource-based policies differs from that of identity-based policies. I hope attendees walked away with a better understanding of how policy evaluations work at a deeper level and how they can write better, more secure IAM policies. We presented practical advice on how to structure different types of IAM policies and the different tradeoffs when writing a policy one way compared to another. I hope the mental model we introduced helps customers better reason about how policies will evaluate when they write them in their environment.

What is your favorite Amazon Leadership Principle and why?

This is an easy one. For me, it’s definitely Learn and Be Curious. Something I try to do is put myself in uncomfortable situations because I feel that when I’m uncomfortable, I’m learning and growing because it means I don’t know something. I find comfortable situations boring at times, so I’m always trying to dig in and learn how things work. This can sometimes be distracting, too, because there’s so much to learn and understand in the identity world.

What’s the thing you’re most proud of in your career?

There’s no particular project that I can point to and say, “this is what I’m most proud of.” I’m proud to be a part of the team I’m on now. For my team, Customer Obsession is more than just a slogan. We really advocate on behalf of the customer, listen to the voice of the customer, and push back on features that might not be the best thing for the customer. I think it’s awesome that I get to work for a company that really does advocate on behalf of the customer, and that my voice is heard when I’m trying to be that advocate. That aspect of working at AWS and with my team is what I’m most proud of.

I’m also proud of the mentoring and teaching that I get to do within AWS and within my role specifically. It’s really fulfilling to watch somebody grow and realize that career growth is not a zero-sum game—just because someone else succeeds does not mean that I have to fail.

If you had to pick an industry outside of security, what would you want to do?

I’d probably choose to be a ski instructor. I’m a big fan of skiing, but I don’t get to ski very often because of where I live. I love being out on the mountains, skiing, and teaching. I’m looking for any excuse to spend my days in the mountains.

 
If you have feedback about this post, submit comments in the Comments section below. If you have questions about this post, contact AWS Support.

Want more AWS Security news? Follow us on Twitter.

Author

Maddie Bacon

Maddie (she/her) is a technical writer for Amazon Security with a passion for creating meaningful content that focuses on the human side of security and encourages a security-first mindset. She previously worked as a reporter and editor, and has a BA in Mathematics. In her spare time, she enjoys reading, traveling, and staunchly defending the Oxford comma.

Author

Matt Luttrell

Matt is a Principal Solutions Architect on the AWS Identity Solutions team. When he’s not spending time chasing his kids around, he enjoys skiing, cycling, and the occasional video game.

[$] The early days of Linux

Post Syndicated from original https://lwn.net/Articles/928581/

My name is Lars Wirzenius, and I was there when Linux started. Linux
is now a global success, but its beginnings were rather more humble.
These are my memories of the earliest days of Linux, its creation, and the
start of its path to where it is today.

SANS Institute uses Amazon QuickSight to drive transformational security awareness maturity within organizations

Post Syndicated from Carl R. Marrelli original https://aws.amazon.com/blogs/big-data/sans-institute-uses-amazon-quicksight-to-drive-transformational-security-awareness-maturity-within-organizations/

This is a guest post by Carl Marrelli from SANS Institute.

The SANS Institute is a world leader in cybersecurity training and certification. For over 30 years, SANS has worked with leading organizations to help ensure security across their organization, as well as with individual IT professionals who want to build and grow their security careers. We partner with over 500 organizations and support over 200,000 IT professionals with more than 90 technical training courses and over 40 professional (GIAC) certifications.

Our Security Awareness products include more than 70 instructional modules and have been deployed to over 6.5 million end-users to bring cybersecurity training to each employee within an organization.

As the Security Awareness department in particular began developing product strategies to deliver data-driven insights to customers, we were clear on using existing analytics services to rapidly build customer-facing analytics solutions. Building on a proven cloud provider would allow us to focus on our core expertise of helping organizations train, learn, and mature their programs instead of spending extra time and resources building and maintaining analytics from scratch.

We identified Amazon QuickSight, a fully managed, cloud-native business intelligence (BI) service, as the product that fit all our criteria. With it, we found an intuitive product with rich visualizations that we could build and grow with rapidly, allowing us to innovate without monetary risks or being locked in to cumbersome contracts. We considered other options, but they couldn’t support the licensing model that fit our needs.

In this post, we go over how we use QuickSight to serve our security customers.

Helping manage human risk with data-driven insights

SANS Security Awareness helps organizations use best-in-class security awareness and training solutions to transform their ability to measure and manage human risk. Security awareness programs are initiatives aimed at educating individuals about the importance of information security and the best practices for maintaining the confidentiality, integrity, and availability of information. We deliver expertly authored training materials to organizations, including computer-based video training sessions, interactive learning modules, supplemental materials, and reinforcement curriculum to keep security top-of-mind for all employees.

As organizations rapidly adopt and expand their use of digital technologies in their day-to-day work, the number of touchpoints with humans increases. As threat landscapes become increasingly more severe, managing human risk is critical to the success of the security program in any organization. Not only do organizations have to conduct security awareness training programs, but they also need insights into data and metrics that identify points of weakness to take data-driven corrective courses of action. As a leader in the space, we wanted to innovate by bringing relevant data-driven insights to our Security Awareness partners and customers in the journey to ensuring human-centered security across their organizations.

New data products to enhance and gamify risk assessment

We built one of our first insights products to support our Behavioral Risk Assessment. This service allows senior security and risk leaders to assess human risk with data handling, digital behavior, and compliance in an organization by individual, team, geography, business unit, and more. Leaders use the assessment to mature their security awareness capability with risk-informed interventions, identify process and procedure gaps, surface shadow IT, and reduce overall awareness training costs by focusing attention on the most important areas of risk.

Behavioral Risk Assessment dashboard with various charts

Delivered via a survey customized to the data types and risk profile of an organization, this assessment allows risk management leaders to more easily understand the data handling practices across roles and departments. Dashboards built in QuickSight empower stakeholders to quickly visualize what areas may need added attention by way of training intervention or updated policy.

Another product area where we invested in analytics to help organizations identify human risk is in gamified awareness training. The SANS Scavenger Hunt utilizes QuickSight in a unique way as a real-time game scoreboard. Players compete in the hunt while solving cybersecurity-related challenges, giving security teams a fun way to engage the workforce and promote good cyber behaviors.

Security Awareness challenge dashboard

The Scavenger Hunt was widely deployed during global Cybersecurity Awareness Month—a time for security awareness practitioners to shine a light on the purpose and mission of security awareness and also have a little fun. Typically, programs run during this time take place outside any regulated training cycle and are typically not delivered as mandatory training. This being the case, we identified dashboards as a way to gamify the experience to increase engagement among participants. These dashboards, built using QuickSight, provided users access to a leaderboard to not only track their own progress, but to also see how they compared to their fellow participants.

Building on the success of their experience with QuickSight and the Scavenger Hunt, we wanted to push the gamification and dashboards concept further so Chief Information and Security Officers (CISOs) and security teams could identify and mitigate the human side of ransomware risk. We developed Snack Attack!, a gamified learning experience that shows an organization how employees are performing in six key defensive areas where ransomware can be prevented. In 2021, over 80% of cyber breaches involved human error of some kind. Employees must have a fundamental awareness of cybersecurity and the ability to apply cyber knowledge within the scope of their jobs. Snack Attack! and QuickSight proved to be a great product to visualize and action on areas of human risk and sentiment for senior leadership.

A screenshot of a Snack Attack! dashboard

With Snack Attack!, we looked at Cybersecurity Awareness Month from the viewpoint of the awareness practitioner. The program itself focuses on driving engagement through an entertaining storyline with creative visuals. We chose to use the data from the training to help our customers build their awareness programs going forward. The dashboards included in Snack Attack! give the security awareness practitioner insights into the learned behavior of their users. Quick visualizations of learners’ scoring in Snack Attack! can act as an audit of the effectiveness of their existing program and provide a roadmap for future trainings.

Paving the way in using analytics for customer security

The SANS Institute brings together security awareness training programs with a metrics-based approach through out-of-the-box analytics dashboards so our customers can assess and manage human risk successfully. With QuickSight, we were able to rapidly innovate, developing valuable data products at a speed we could not have otherwise. Without up-front investments to get started and with the low cost to try with usage-based pricing, we were able to quickly ideate, build, and deploy customer-facing analytic products to drive security awareness within our customer organizations. Our analytics solutions differentiate us from existing enterprise products. With QuickSight, we are able to show organizations where they have cyber risk.

With the delivery of analytics solutions to customers, the SANS Institute is not only a top cybersecurity training, learning, and certification platform, but also a technology provider that helps customers use data and insights to make meaningful change in their organization. Moving forward, we have identified an expansion of QuickSight dashboards into our larger suite of assessments as the next logical step. Along with the Behavioral Risk Assessment, we offer Knowledge and Culture assessments to help security awareness practitioners better understand where and how to apply training and gauge the effectiveness of their programs. Because of the success we have had with QuickSight on our existing projects, we feel that similar dashboards can provide even more value to our customers.

To learn more about how QuickSight can help your business with dashboards, reports, and more, visit Amazon QuickSight.


About the Author

Carl R. Marrelli is the Director of Business Development and Digital Programs at SANS Institute. Based in Charlotte, NC, he has extensive experience in cross-functional team leadership, product management, and product marketing. Previously as Head of Product at SANS, Carl led the product management team for the Online Training and Security Awareness divisions through a significant growth period. Carl’s unique perspective and innovative ideas, support SANS as the company continues its mission to empower cybersecurity practitioners around the world.

Implementing up-to-date images with automated EC2 Image Builder pipelines

Post Syndicated from Sheila Busser original https://aws.amazon.com/blogs/compute/implementing-up-to-date-images-with-automated-ec2-image-builder-pipelines/

This blog post is written by Devin Gordon, Senior Solutions Architect, WWPS, and Brad Watson, Senior Solutions Architect, WWPS.

Amazon EC2 Image Builder is a service designed to simplify the creation and deployment of customized Virtual Machine (VM) and container images on AWS or on-premises. The posts Automate OS Image Build Pipelines with EC2 Image Builder and Quickly build STIG-compliant Amazon Machine Images using Amazon EC2 Image Builder show how you can create secure images using EC2 Image Builder pipelines.

In this post, we demonstrate how to automatically keep your base or standard images current, incorporating patches and any other changes using EC2 Image Builder pipelines. We also demonstrate how to keep workload-specific images current using Cascading Pipelines, a feature of EC2 Image Builder.

Dependency updates

You can use the Dependency update feature of EC2 Image Builder pipelines to automatically update your standard image based on changes to your build components.

When you create an EC2 Image Builder pipeline, you can choose to run the pipeline on a schedule, either using a schedule builder or a CRON expression (a method of defining minute, hour, day and month for scheduling). Furthermore, you can choose to only run the pipeline if a component in the pipeline or the source image has changed. This is referred to as a dependency update as shown in the following image.

Figure 1 An example EC2 Image Builder pipeline schedule with dependency update settings

Figure 1: An example EC2 Image Builder pipeline schedule with dependency update settings

When you select “Run pipeline at the scheduled time if there are dependency updates,” your pipeline only executes if the Base AMI or any Build or Test components have changed. The version of your components must be updated for this capability to work. Amazon-provided components include versioning out of the box. Here is an example of three versions of an Amazon-provided Build component that apply Security Technical Implementation Guide (STIG) baselines to Linux images.

Figure 2 Different versions of one Amazon-managed Build component

Figure 2: Different versions of one Amazon-managed Build component

When a new STIG baseline build component is released, the component’s version is incremented. If a pipeline includes this type of versioned Build component and utilizes the dependency updates capability, then the pipeline automatically runs at the next scheduled interval after the component is updated. Pipelines utilizing this capability will run when the base AMI changes or when a Build or Test component changes.

Notifications

To receive notifications about the pipeline execution, you can enable an Amazon Simple Notification Service (Amazon SNS) topic from within EC2 Image Builder. Under the Infrastructure Configuration section of the EC2 Image Builder pipeline, identify an SNS topic as shown in the following image.

Figure 3 An example SNS topic for sending pipeline execution notifications

Figure 3: An example SNS topic for sending pipeline execution notifications

The SNS topic receives a notification if a pipeline runs and completes with a status of AVAILABLE or FAILED. This occurs even when a pipeline execution is triggered by a component change that you didn’t directly initiate, such as when a new version of an Amazon-managed build component is released.

Even if no other aspects of the infrastructure configuration are used in the pipeline (instance type, security group, subnet, etc.), the SNS topic capability can be used to send a notification when the pipeline executes. With this in mind, you can leverage Amazon SNS to make sure that you’re always notified of any pipeline executions as well as trigger AWS Lambda functions for automation.

Cascading pipelines

Cascading Pipelines are a feature of EC2 Image Builder that you can use to create workload-specific images from a standard secured image (aka “gold image”) of an organization. The following image shows how you can use Cascading Pipelines to keep workload specific images updated.

Figure 4 An example workflow for a EC2 Image Builder Cascading Pipelines

Figure 4: An example workflow for a EC2 Image Builder Cascading Pipelines

You create a gold image pipeline for a hardened base operating system (OS) using the steps outlined in Automate OS Image Build Pipelines with EC2 Image Builder. This pipeline could include a base OS, OS patches, Build components to harden the OS (such as STIG or CIS baselines), as well as any additional software required by the organization (agents, etc.). Do not include application- or workload-specific software in the pipeline. Infrastructure or distribution components may not be included in the pipeline to maintain flexibility for using the gold image. For example, you typically wouldn’t want to include VPC configurations in your golden AMI build because that would constrain the AMI to a particular VPC.

To create a Cascading Pipeline that uses the gold image for applications or workloads, in the Base Image section of the EC2 Image Builder console, choose Select Managed Images.

Figure 5 Selecting the base image of a pipeline

Figure 5: Selecting the base image of a pipeline

Then, select “Images Owned by Me” and under Image Name, select the EC2 Image Builder pipeline used to create the gold image. Moreover, select “Use Latest Available OS Version” under Auto-versioning options to make sure that the Cascading Pipeline is executed any time there is a change to the base image.

Figure 6 Choosing the base golden image from a previous pipeline execution

Figure 6: Choosing the base golden image from a previous pipeline execution

Use this configuration to maintain images for each application or workload which utilizes the gold image. Any time that an update is made to the gold image, application pipelines execute, thus providing updated images. To send notifications, SNS topics are enabled on each workload-specific pipeline.

In this post, we demonstrated how to automatically update images for any changes using EC2 Image Builder pipelines. We also demonstrated how to keep workload specific images using Cascading Pipelines. Using these features, you can make sure that your organization stays up-to-date on the latest OS patches and dependency changes, without requiring human intervention. For more information on EC2 Image Builder, see the official documentation.

Introducing Cloudflare’s new Network Analytics dashboard

Post Syndicated from Omer Yoachimik original https://blog.cloudflare.com/network-analytics-v2-announcement/

Introducing Cloudflare’s new Network Analytics dashboard

Introducing Cloudflare’s new Network Analytics dashboard

We’re pleased to introduce Cloudflare’s new and improved Network Analytics dashboard. It’s now available to Magic Transit and Spectrum customers on the Enterprise plan.

The dashboard provides network operators better visibility into traffic behavior, firewall events, and DDoS attacks as observed across Cloudflare’s global network. Some of the dashboard’s data points include:

  1. Top traffic and attack attributes
  2. Visibility into DDoS mitigations and Magic Firewall events
  3. Detailed packet samples including full packets headers and metadata
Introducing Cloudflare’s new Network Analytics dashboard
Network Analytics – Drill down by various dimensions
Introducing Cloudflare’s new Network Analytics dashboard
Network Analytics – View traffic by mitigation system

This dashboard was the outcome of a full refactoring of our network-layer data logging pipeline. The new data pipeline is decentralized and much more flexible than the previous one — making it more resilient, performant, and scalable for when we add new mitigation systems, introduce new sampling points, and roll out new services. A technical deep-dive blog is coming soon, so stay tuned.

In this blog post, we will demonstrate how the dashboard helps network operators:

  1. Understand their network better
  2. Respond to DDoS attacks faster
  3. Easily generate security reports for peers and managers

Understand your network better

One of the main responsibilities network operators bare is ensuring the operational stability and reliability of their network. Cloudflare’s Network Analytics dashboard shows network operators where their traffic is coming from, where it’s heading, and what type of traffic is being delivered or mitigated. These insights, along with user-friendly drill-down capabilities, help network operators identify changes in traffic, surface abnormal behavior, and can help alert on critical events that require their attention — to help them ensure their network’s stability and reliability.

Starting at the top, the Network Analytics dashboard shows network operators their traffic rates over time along with the total throughput. The entire dashboard is filterable, you can drill down using select-to-zoom, change the time-range, and toggle between a packet or bit/byte view. This can help gain a quick understanding of traffic behavior and identify sudden dips or surges in traffic.

Cloudflare customers advertising their own IP prefixes from the Cloudflare network can also see annotations for BGP advertisement and withdrawal events. This provides additional context atop of the traffic rates and behavior.

Introducing Cloudflare’s new Network Analytics dashboard
The Network Analytics dashboard time series and annotations

Geographical accuracy

One of the many benefits of Cloudflare’s Network Analytics dashboard is its geographical accuracy. Identification of the traffic source usually involves correlating the source IP addresses to a city and country. However, network-layer traffic is subject to IP spoofing. Malicious actors can spoof (alter) their source IP address to obfuscate their origin (or their botnet’s nodes) while attacking your network. Correlating the location (e.g., the source country) based on spoofed IPs would therefore result in spoofed countries. Using spoofed countries would skew the global picture network operators rely on.

To overcome this challenge and provide our users accurate geoinformation, we rely on the location of the Cloudflare data center wherein the traffic was ingested. We’re able to achieve geographical accuracy with high granularity, because we operate data centers in over 285 locations around the world. We use BGP Anycast which ensures traffic is routed to the nearest data center within BGP catchment.

Introducing Cloudflare’s new Network Analytics dashboard
Traffic by Cloudflare data center country from the Network Analytics dashboard

Detailed mitigation analytics

The dashboard lets network operators understand exactly what is happening to their traffic while it’s traversing the Cloudflare network. The All traffic tab provides a summary of attack traffic that was dropped by the three mitigation systems, and the clean traffic that was passed to the origin.

Introducing Cloudflare’s new Network Analytics dashboard
The All traffic tab in Network Analytics

Each additional tab focuses on one mitigation system, showing traffic dropped by the corresponding mitigation system and traffic that was passed through it. This provides network operators almost the same level of visibility as our internal support teams have. It allows them to understand exactly what Cloudflare systems are doing to their traffic and where in the Cloudflare stack an action is being taken.

Introducing Cloudflare’s new Network Analytics dashboard
Data path for Magic Transit customers

Using the detailed tabs, users can better understand the systems’ decisions and which rules are being applied to mitigate attacks. For example, in the Advanced TCP Protection tab, you can view how the system is classifying TCP connection states. In the screenshot below, you can see the distribution of packets according to connection state. For example, a sudden spike in Out of sequence packets may result in the system dropping them.

Introducing Cloudflare’s new Network Analytics dashboard
The Advanced TCP Protection tab in Network Analytics

Note that the presence of tabs differ slightly for Spectrum customers because they do not have access to the Advanced TCP Protection and Magic Firewall tabs. Spectrum customers only have access to the first two tabs.

Respond to DDoS attacks faster

Cloudflare detects and mitigates the majority of DDoS attacks automatically. However, when a network operator responds to a sudden increase in traffic or a CPU spike in their data centers, they need to understand the nature of the traffic. Is this a legitimate surge due to a new game release for example, or an unmitigated DDoS attack? In either case, they need to act quickly to ensure there are no disruptions to critical services.

The Network Analytics dashboard can help network operators quickly pattern traffic by switching the time-series’ grouping dimensions. They can then use that pattern to drop packets using the Magic Firewall. The default dimension is the outcome indicating whether traffic was dropped or passed. But by changing the time series dimension to another field such as the TCP flag, Packet size, or Destination port a pattern can emerge.

In the example below, we have zoomed in on a surge of traffic. By setting the Protocol field as the grouping dimension, we can see that there is a 5 Gbps surge of UDP packets (totalling at 840 GB throughput out of 991 GB in this time period). This is clearly not the traffic we want, so we can hover and click the UDP indicator to filter by it.

Introducing Cloudflare’s new Network Analytics dashboard
Distribution of a DDoS attack by IP protocols

We can then continue to pattern the traffic, and so we set the Source port to be the grouping dimension. We can immediately see that, in this case, the majority of traffic (838 GB) is coming from source port 123. That’s no bueno, so let’s filter by that too.

Introducing Cloudflare’s new Network Analytics dashboard
The UDP flood grouped by source port

We can continue iterating to identify the main pattern of the surge. An example of a field that is not necessarily helpful in this case is the Destination port. The time series is only showing us the top five ports but we can already see that it is quite distributed.

Introducing Cloudflare’s new Network Analytics dashboard
The attack targets multiple destination ports

We move on to see what other fields can contribute to our investigation. Using the Packet size dimension yields good results. Over 771 GB of the traffic are delivered over 286 byte packets.

Introducing Cloudflare’s new Network Analytics dashboard
Zooming in on an UDP flood originating from source port 123 

Assuming that our attack is now sufficiently patterned, we can create a Magic Firewall rule to block the attack by combining those fields. You can combine additional fields to ensure you do not impact your legitimate traffic. For example, if the attack is only targeting a single prefix (e.g., 192.0.2.0/24), you can limit the scope of the rule to that prefix.

Introducing Cloudflare’s new Network Analytics dashboard
Creating a Magic Firewall rule directly from within the analytics dashboard
Introducing Cloudflare’s new Network Analytics dashboard
Creating a Magic Firewall rule to block a UDP flood

If needed for attack mitigation or network troubleshooting, you can also view and export packet samples along with the packet headers. This can help you identify the pattern and sources of the traffic.

Introducing Cloudflare’s new Network Analytics dashboard
Example of packet samples with one sample expanded
Introducing Cloudflare’s new Network Analytics dashboard
Example of a packet sample with the header sections expanded

Generate reports

Another important role of the network security team is to provide decision makers an accurate view of their threat landscape and network security posture. Understanding those will enable teams and decision makers to prepare and ensure their organization is protected and critical services are kept available and performant. This is where, again, the Network Analytics dashboard comes in to help. Network operators can use the dashboard to understand their threat landscape — which endpoints are being targeted, by which types of attacks, where are they coming from, and how does that compare to the previous period.

Introducing Cloudflare’s new Network Analytics dashboard
Dynamic, adaptive executive summary

Using the Network Analytics dashboard, users can create a custom report — filtered and tuned to provide their decision makers a clear view of the attack landscape that’s relevant to them.

Introducing Cloudflare’s new Network Analytics dashboard

In addition, Magic Transit and Spectrum users also receive an automated weekly Network DDoS Report which includes key insights and trends.

Extending visibility from Cloudflare’s vantage point

As we’ve seen in many cases, being unprepared can cost organizations substantial revenue loss, it can negatively impact their reputation, reduce users’ trust as well as burn out teams that need to constantly put out fires reactively. Furthermore, impact to organizations that operate in the healthcare industry, water, and electric and other critical infrastructure industries can cause very serious real-world problems, e.g., hospitals not being able to provide care for patients.

The Network Analytics dashboard aims to reduce the effort and time it takes network teams to investigate and resolve issues as well as to simplify and automate security reporting. The data is also available via GraphQL API and Logpush to allow teams to integrate the data into their internal systems and cross references with additional data points.

To learn more about the Network Analytics dashboard, refer to the developer documentation.

Security updates for Wednesday

Post Syndicated from original https://lwn.net/Articles/928870/

Security updates have been issued by Fedora (chromium, ghostscript, glusterfs, netatalk, php-Smarty, and skopeo), Mageia (ghostscript, imgagmagick, ipmitool, openssl, sudo, thunderbird, tigervnc/x11-server, and vim), Oracle (curl, haproxy, and postgresql), Red Hat (curl, haproxy, httpd:2.4, kernel, kernel-rt, kpatch-patch, and postgresql), Slackware (mozilla), SUSE (firefox), and Ubuntu (dotnet6, dotnet7, firefox, json-smart, linux-gcp, linux-intel-iotg, and sudo).

The collective thoughts of the interwebz