The 6.2.10
and 6.1.23
updates are also in the works, but have ended up going through additional
rounds of review; they could be released almost any time.
We are building a new online text-based Code Editor to help young people aged 7 and older learn to write code. It’s free and designed for young people who attend Code Clubs and CoderDojos, students in schools, and learners at home.
The Code Editor interface
At this stage of development, the Code Editor enables learners to:
Write and run Python code right in their browser, with no setup required. The interface is simple and intuitive, which makes getting started with text-based coding easier.
Save their code using their Raspberry Pi Foundation account. We want learners to easily build on projects they start in the classroom at home, or bring a project they’ve started at home to their coding club.
We’ve chosen Python as the first programming language our Code Editor supports because it is popular in schools, CoderDojos, and Code Clubs. Many educators and young people like Python because they see it as similar to the English language. It is often the text-based language young people learn when they take their first steps away from a block-based programming environment, such as Scratch.
Python is also widely used by professional programmers and usually tops at least one of the industry-standard indexes that ranks programming languages.
We will be adding support for web development languages (HTML/CSS/JavaScript) to the Editor in the near future.
We’re also planning to add features such as project sharing and collaboration, which we know young people will love. We want the Editor to be safe, accessible, and age-appropriate. As safeguarding is always at the core of what we do, we’ll only make new features available once we’ve ensured they comply with the ICO’s age-appropriate design code and our safeguarding policies.
Test the Code Editor and tell us what you think
We are inviting you to test the Code Editor as part of what we call the beta phase of development. As the Editor is still in development, some things might not look or work as well as we’d like — and this is why we need your help.
Text output in the Code Editor
We’d love you to try the Editor out and let us know what worked well for you, what didn’t work well, and what you’d like to see next.
You can now try out the Code Editor in the first two projects of our ‘Intro to Python’ path. We’ve included a feedback form for you to let us know which project you tried, and what you think of the Editor. We’d love to hear from you.
Your feedback helps us decide what to do next. Based on what learners, educators, volunteers, teachers, and parents tell us, we will make the improvements to the Editor that matter most to the young people we aim to support.
Where next for the Code Editor?
One of our long-term goals is to engage millions of young people in learning about computing and how to create with digital technologies. We’re developing the Code Editor with three main aims in mind.
1. Supporting young people’s learning journeys
We aim to build the Code Editor so it:
Suits beginners and also supports them as their confidence and independence grows, so they can take on their own coding projects in a familiar environment
Helps learners to transition from block-based to text-based, informed by our deep understanding of pedagogy and computing education
Brings together projects instructions and code editing into a single interface so that young people do not have to switch screens, which makes coding easier
2. Removing barriers to accessing computing education
Our work on the Code Editor will:
Ensure it works well on mobile and tablet devices, and low-cost computers including the Raspberry Pi 4 2GB
Support localisation and translation, so we can tailor the Editor for the needs of young people all over the world
3. Making learning to program engaging for more young people
We want to offer a Code Editor that:
Enables young people to build a vast variety of projects because it supports graphic user interface output and supplies images and sprites for use in multimedia projects
We’re also planning on making the Editor available as an open source project so that other projects and organisations focussed on helping people learn to code can benefit. More on this soon.
Our work on the Code Editor has been generously funded by the Algorand Foundation and Endless, and we thank them for their generous support. If you are interested in partnering with us to fund this key work, please reach out to us via email.
Всички сме големи експерти на тема Нидерландия, когато стане дума за Върджил и Рюте, с други думи – за футбол и политика. Измести ли се разговорът в посока литература, същата тази страна се превръща в бяло петно с размерите на Източна България.
Преводачите от нидерландски у нас се броят на пръстите на едната ръка,
което несъмнено е жалко за читателите, тъй като ги лишава от досег с безброй ценни текстове. От друга страна, този „недоимък“ превръща преводачите в търсачи на съкровища, в откриватели, овластява ги и ги натоварва с отговорността да подберат най-ценното, което да предложат на българските читатели.
Сред съкровищата, които се надявам един ден да имам честта и удоволствието да преведа на български, са три сравнително разнородни книги.
Първата от тях е
романът „Никога вече сън“ (Nooit meer slapen) на Вилем Фредерик Херманс (W. F. Hermans),
един от т.нар. голяма четворка на Нидерландия от XX в. „Никога вече сън“ (или „Отвъд съня“ според заглавието на едноименния филм, чийто превод е минал през английски) е писан през 1966 г., но спокойно може да е излязъл и изпод клавиатурата на наш съвременник.
В романа си Херманс, сам изкушен от геологията, пише за младия геолог Алфред Исендорф, който като всеки друг учен мечтае за слава и безсмъртие. Алфред поема на експедиция към Норвегия, където някой си професор Нумендал му е обещал да му предостави въздушни снимки. За съжаление, снимките потъват, така да се каже, вдън земя. Въпреки това Алфред се отправя към Нордкап с намерението да докаже, че определени езера в онази най-северна част на Норвегия са възникнали в резултат на удари от метеорити, а не при топенето на леда. Експедицията е тежка като раницата на гърба на Алфред. Той не може да спи от светлината и комарите. Постепенно става ясно, че намеренията на Исендорф са обречени на провал: множеството неуспехи, чувството за малоценност, което гризе младежа, неспособността му да общува с норвежките си колеги.
Една от темите в книгата е празнотата и безсмислието на човешкото съществуване – нещо, което скришом или явно вълнува и нас.
„Никога вече сън“ е фин класически роман, претърпял 39 издания само в Нидерландия, и едно от най-превежданите произведения на нидерландската проза.
Без съмнение е и книга, която никога няма да изневери на заглавието си и да „заспи“.
Далеч не само в името на равновесието и политкоректността, а и за да покажа как в тази страна на футболни таланти и шенгенски наредби литературата не се пише единствено от бели мъже от средната класа, избрах
съвременния психологически роман „Всичко отдавна отминало“ (Alles wat er was), създаден от младата хомосексуална авторка Хана Берфутс (Hanna Bervoets).
Книгата човърка мислите дълго след като се върне в библиотеката при „всичко отдавна прочетено“.
В романа телевизионен екип и група участници в предаване за наука се затварят в сградата на някогашно училище, за да заснемат интервю, когато навън проехтява мощна експлозия. Единственото, което се вижда през прозорците, е гъста мъгла. Никой от присъстващите няма представа какво се е случило. Малко след това по телевизията дават указания да се затворят всички възможни пролуки по врати и прозорци и в никакъв случай да не се излиза навън. Скоро героите започват да се нагаждат към новата ситуация с надеждата, че скоро ще се приберат при близките си.
Романът пресъздава в нехронологичен ред извадки от дневника на Мерел, една от жените в снимачния екип. И тъй като тя е единственият източник на информация, докрай не сме напълно сигурни доколко може да се вярва на разказа ѝ. Хладнокръвието, с което Мерел описва случващото се в училищната сграда през следващите дни и седмици, контрастира ярко с влошаващото се психическо състояние на присъстващите. Един по един героите напускат сцената, докато на 145-тия ден от апокалипсиса книгата не приключва с наистина неочакван финал.
Чрез „Всичко отдавна отминало“ по един деликатен начин, без обичайния морализаторски тон,
Хана Берфутс прави дисекция на днешния човек, зависим от телефона си и от интернет връзката, жаден за видимост и за слава.
Тази искреност на романа и появата му в „най-подходящия“ момент – с началото на пандемията от коронавирус и първия локдаун в Нидерландия – го изстреляха във висините и го превърнаха в една от най-четените книги в страната. И докато го четяха, всички се молеха собствената им изолация да не продължи 145 дни.
Друго име, което заслужава да бъде повтаряно с възхищение, е Ремко Камперт (Remco Campert).
Той почина през 2022 г. на 92-годишна възраст. Няколко месеца преди смъртта му „Тоест“ помести на стената си във Facebook откъс от стихотворението му „Съпротива“ , с което неговите издатели и издателите по цял свят изразиха съпричастност към случващото се в Украйна и осъдиха войната.
Самият Камперт е неразривно свързан със съпротивата, включително с тази срещу литературната традиция. Участник е в експерименталното движение „Файфтъхърс“ от края на 40-те години на миналия век, в което млади нидерландски поети се противопоставят на творческите възгледи на своите предшественици. Ала докато за останалите членове на движението нерядко може да се прочете, че успяват да сътворят единствено безподобни небивалици, Камперт изпъква с меланхоличния си и в същия момент ефирен стил. Смятат го за „най-достъпния от всички във „Файфтъхърс“. От този период е и стихотворението му „Поезия“:
… но думите, изречени веднъж, написани, са други; само премълчани, неизговорени, те могат да отправят претенции за правота и щастие.
Наред с поезия Камперт пише и десетки романи и новели, които намират широка публика. И все пак със смъртта на последния от групата на „Файфтъхърс“ нидерландската литература губи най-вече любимия си поет, своя виртуоз на стиховете. Със „Съпротива“ Камперт оставя на читателите си завета, че поезията е нещо повече от просто думи, нахвърляни върху лист. Това той изразява още по-ясно чрез безсмъртното си стихотворение „Поезията е акт“.
Поезията е акт на самодоказване. Ето, доказвам, че съм жив, че не просто съм жив. Поезията е бъдеще, размисли за предстоящата седмица, за далечна страна, за собствените ни старини. Поезията е като дъх, тя движи краката ми, понякога колебливо, по земята, която ги чака. Волтер бил болен от шарка, но се избавил, като изпил цял казан лимонада: ето това е поезия. Или да вземем прибоя. Вълните се размазват в скалите, но не се дават, а се съвземат и това е поезия. Всяка дума, която се пише, е шамар по лицето на старостта. Накрая, вярно, смъртта побеждава, но смъртта е единствено тишината из залата с прозвучаване на последната дума. Смъртта е затрогваща.
Кой не се чувства поне малко неловко при работата по неговите собствени социални конфликти, ако знае, че там, на тази маса, присъства експерт по този специален въпрос.1 (проф. Нилс Кристи)
При съгласие за участие в процедура по медиация се срещаме на място, определено от медиатора, а при задължителната първа среща – в съдебен център или в сградата на районен съд. Често се практикува и медиаторите да са двама.
Медиаторът обяснява какво представлява процедурата – каква е неговата роля и какво можем ние, страните. Когато се съгласим да участваме, подписваме споразумение за ангажиране с процедурата и декларация за поверителност.
След тази подготвителна част започва обсъждането на проблема. Двете страни споделят своята гледна точка. Ако се наложи, медиаторът може да се срещне и поотделно с тях. В индивидуалната среща медиаторът подпомага всяка страна да открие и заяви важното за нея в случая – актуалната ѝ потребност, и да формулира приемливи за нея и обективно постижими варианти за изход от нежеланата ситуация. След това страните отново се срещат и обсъждат различните варианти. Ако никой вариант не удовлетворява и двете страни и сме опитали всичко, което е по силите ни, явно имаме нужда някой да реши спора ни.
Какво е необходимо за пълноценна медиация?
Понеже изходът от процедурата по медиация зависи от нас като участници, наложително е да имаме самочувствие да признаем съществуването на проблема, да поемем контрола върху него и върху ситуацията, да преодоляваме стереотипи и притеснения („с него/нея не може да се говори“ или „защо да се излагам пред чужди хора“ и т.н.).
Другата значима опора на успешната процедура е ангажираността ни с процеса, с решението и с неговите последици. Удовлетворението от преживяването в значителна степен зависи от това да сме честни със себе си и с другата страна и същевременно открито да споделяме своите потребности и да зачитаме чуждите.
Съчетанието от увереност да се включим в управлението на спорната ситуация и ангажираност с този процес при структурирана и контролирана процедура от неутрален и безпристрастен медиатор гарантира целенасочен разговор, който сам по себе си укрепва както увереността в собствените ни сили, така и нашето доверие към насрещната страна. Това от своя страна стимулира сътрудничество и гарантира осъзнато поемане на ангажимент.
Защо се въвежда задължение при доброволност на процедурата по медиация?
Въведеното задължение е ограничено до сериозен разговор за перспективите вече повдигнат пред съд спор да бъде разрешен от страните. Исковата молба е знак, че ищецът не може да се справи сам със значим за него проблем. Възниква въпросът дали наложеното решение е единственият начин да бъде прекратен спорът.
Съдебното решение е винаги възможно, но то предполага допълнителни, понякога значителни усилия, а при спорове между страни в трайни отношения този подход задълбочава кризата помежду им, което често провокира и нови спорове. Освен това съдебното решение е постижимо след практически непредвидимо време и влагане на допълнителни ресурси както от страните по спора, така и от съдебната институция.
Въпреки посочените недостатъци на съдебната процедура и многобройните ползи от процедурата по медиация, тя продължава да е неразпозната. По-малко от 1% от съдебните спорове в Софийския районен съд и Софийския градски съд стигат до Центъра за спогодби и медиация към тези съдилища. От личен опит смея да твърдя, че това се дължи както на непознаване на процедурата, така и на липса на увереност у страните, че могат сами да намерят решение на своя спор. Очаквам, че структуриран разговор на основата на конкретните отношения между повече страни по предявен пред съд спор ще допринесе за осъзнаване, че медиацията е не само алтернатива, но и значително по-подходяща процедура за управление на конфликтни отношения и трайно разрешаване на проблеми.
Тук ще цитирам дъщеря ми, която на шест години интуитивно идентифицира същинската работа на съдиите – да разрешават споровете, когато хората не могат да го направят сами. Непосредственият ангажимент на държавата е да осигури бързо и справедливо решение, което предполага съсредоточаване в съдилищата предимно на спорове, чието разрешаване е непосилно за страните.
Подкрепата на страните при разрешими от тях спорове да намерят най-доброто решение за актуалните си потребности освобождава време за съдията да се съсредоточи върху споровете, разчитащи единствено на съдебно решение. Показателен в тази насока е и опитът в други европейски държави. Това именно провокира намесата на законодателя. Така е на концептуално ниво. От всички нас – страни, съдии, медиатори – зависи да оползотворим осигурената възможност за ползотворен разговор.
Законодателната промяна утвърждава безусловно задължение за разговор за медиацията като алтернатива на съдебния процес по спорове, при които съдът не дава защита на право, а регламентира отношения между страните (спорове между съсобственици как да управляват обща вещ, когато не могат да я ползват едновременно, или как да прекратят нежелана съсобственост; между етажни собственици – как да съчетаят индивидуалния с общия интерес, и др.). В съдебната зала разговорът е невъзможен, а нагнетеното от съдебната битка напрежение допълнително влошава микроклимата в общността.
Задължителният разговор е въведен и при уреждане на спорове за имуществената отговорност на управител или контрольор на търговско дружество и изплащане на дял при прекратено участие в дружество с ограничена отговорност. Като цяло броят на тези дела е нисък, но споровете са емоционално натоварени. Често и отношенията се нуждаят от дискретност, непостижими при конкурентната съдебна процедура. Очертаните предимства на процедурата по медиация предпоставят реална допълнителна полза за страните и по такива видове дела.
Законодателят прецени за по-удачно съдия да определя дали да препраща семейните спорове към сериозния разговор за приложимост на процедурата по медиация. Съдът може да задължи да участват в такъв разговор и страни по имуществен спор (най-общо казано) при интерес до 25 000 лв., по трудови спорове, при защита на членствени права в търговски дружества, кооперации и сдружения с нестопанска цел, по спорове за собственост и владение или за право на интелектуална собственост.
Ефективността на предвидения разговор зависи изключително от нагласата, с която страните ще влязат в него – дали го възприемат като пречка пред желан сблъсък в съдебна зала, или като възможност да намерят оптимално разрешение за своя проблем. Лично аз не виждам никакъв риск за страните. Възприемам предвиденото задължение те да отделят поне един, но не повече от три часа като реална подкрепа за тях да разберат какво им осигурява процедурата по медиация, и с помощта на медиатора да преценят нейната приложимост в техния случай. Вярвам, че тази нагласа ще допринесе за информиран избор на най-подходящия път за възстановяване на социалния мир в техните отношения – посредством споразумение или чрез респекта на съдебното решение.
Защо задължителна медиация по висящи дела?
Подобно на лекарите, които се грижат за физическото и психическото ни здраве, на нас, юристите, е поверен елемент от социалното здраве на хората. Когато ни боли нещо, отиваме на лекар, но той ни подлага на интервенция само след като се увери, че това се налага. Ако организмът ни има нужда от подкрепа, за да се възстанови, лекарят не ни предписва антибиотик, а дава витамини.
Аналогично виждам нещата и при задължителния разговор за медиация по висящо дело. Независимо дали медиацията е призната като по-добрата възможност със закон, или съдия прецени случая като притежаващ потенциал за успешен изход чрез такава процедура, срещата с медиатор е нужната подкрепа, за да поемем контрол над тази част от своя живот. За разлика от вирусите или бактериите, справянето с които минава през омаломощаването или унищожаването им, насрещната страна в спора е човек, по правило способен да комуникира, а и да действа разумно.
Както при лечението антибиотикът е на разположение и колкото по-рядко прибягваме до него, толкова по-бърза и по-ефективна е неговата намеса (ако се наложи), така е логично и да осмислим съдебната процедура като крайно средство за разрешаване на правни спорове. Ако очертаният в исковата молба проблем се окаже непосилен за неговите собственици, съдебният процес продължава. Подобно на ситуация, при която организмът, подкрепен с витамини, не успява сам да се справи със ситуацията, съдът е на разположение, за да сложи край на спора.
Същевременно ние, съдиите, сме в състояние да подкрепим страните при формиране на увереност, че като собственици на конфликта, както нарича участниците в него проф. Нилс Кристи, могат да поемат управлението му. Затова е сериозна отговорността на съдиите, разглеждащи дела от списъка на условно задължителната медиация. До голяма степен от нас зависи да подкрепим страните да преодолеят притеснения или стереотипи, да разпознаят потенциала на процедурата по медиация, за да могат да извлекат максимална полза от нея.
От друга страна, прекият ангажимент на съда при въвеждане на елемента задължителност осигурява известна гаранция за качество и достъпност на процедурата. Освен това открива възможност за разработване на модел, който в бъдеще да осигури провеждане на сериозния разговор за подходящия път за разрешаване на висящ спор преди съдебната процедура.
1 Макар и тезата да е развита в контекста на различна процедура – възстановително правосъдие, концепцията е обща: овластяване и подкрепа на участниците в конфликт да поемат неговото управление.
Amazon QuickSight previously launched threshold alerts on KPIs and gauge charts. Now, QuickSight supports creating threshold alerts on tables and pivot tables—our most popular visual types. This allows readers and authors to track goals or key performance indicators (KPIs) and be notified via email when they are met. These alerts allow readers and authors to relax and rely on notifications for when their attention is needed. In this post, we share how to create threshold alerts on tables or pivot tables to track important metrics.
Background information
Threshold alerts are a QuickSight Enterprise Edition feature and available for dashboards consumed on the QuickSight website. Threshold alerts aren’t yet available in embedded QuickSight dashboards or on the mobile app.
Alerts are created based on the visual at that point in time and are not affected by potential future changes to the visual’s design. This means the visual can be changed or deleted and the alert continues to work as long as the data in the dataset remains valid. In addition, you can create multiple alerts off of one visual, and rename them as appropriate.
Finally, alerts respect RLS and CLS rules.
Set up an alert on a table or pivot table
Threshold alerts are configured for dashboards. On a dashboard, there are three different ways to create an alert on a table or pivot table.
First, you can create directly from a pivot table or table. You click directly on the cell you would like to create an alert on (if there is another action enabled, you may have to right-click to get this option to show). This needs to be on a numeric value (no dates or strings allow for creation of alerts). Then choose Create Alert to start creating the alert.
Let’s assume you want to track the profit coming from online purchases for auto-related merchandise being shipped first class. Choose the appropriate cell and then choose Create Alert.
You’re presented with the creation pane for alerts. The only difference from KPIs or gauge visual alerts is that here you’ll find the other dimensions in the row that you’re creating the alert on. This will help you identify what value from the table you have selected, because there can be duplicates of the numeric values.
In the following screenshot, the value to track is profit, which currently is $437.39. This is the value that will be compared to the threshold you set. You will also see the dimensions being used to define this alert, which are taken from the row of the table. In this case, the Category is Auto, the Segement is Online, and the Ship Mode is First Class.
Now that you have checked that the value is correct, you can update the name of the alert that is automatically filled with the name of the visual it is created off of, set the condition (between Is above, Is below, and Is equal to), and pick the threshold value, notification frequency, and whether you want to be emailed when there is no data.
In the following example, the alert has been configured so that you will receive an email when the profit is above the threshold of $1,000. You’ve also left the notification frquency at Daily at most and haven’t requested to be emailed when there is no data.
If you have a date field, you also will see an option to control the date. This will automatically set the date field to be the most recent of whatever aggregation you’re looking at, such as hour, week, day, month. However, you could override to use the specific date applied to the value you have selected if you would prefer.
Below is an example where the data was aggregated based on the week and so Latest Week has been selected rather than the historical Week of Jan 4, 2015.
You can then choose Save if you’re happy with the alert and it will load the Manage alert pane.
The Create Alert button is also at the bottom of the pane. This is the second way you can start creating an alert off of a table or pivot table.
You can also get to this pane from the upper right alert button on the dashboard.
If you have no alerts, this will automatically drop you into the creation pane. There you will be asked to select a visual that supports alerts to begin creating an alert. If you already have alerts (as previously demonstrated), then all you need to do is choose Create Alert.
Then select a visual and choose Next.
You’re prompted to select a cell if you have picked a table or pivot table visual.
Then you repeat the same steps as creating off a cell within a table or pivot table.
Finally, you can start creating an alert from the bell icon on the pivot table or table. This is the third way to create an alert.
You’ll be prompted to select a cell from the table, and the creation pane appears.
After you choose the cell that you want to track, you start the creation process just like the first two examples.
Update and delete alerts
To update or delete an alert, you need to navigate back to the Manage alerts pane. You get there from the bell icon on the top right corner of the dashboard.
You can then choose the options menu (three dots) on the alert you want to manage. Three options appear: Edit alert, View history (to view recent times the alert has breached and notified you), and Delete.
Notifications
You’ll receive an email when your alert breaches the rule you set. The following is an example of what that looks like (the alert has been adjusted to be alerted if profit is over $100 and to be notified as frequently as possible).
The current profit breach is highlighted and the historical numbers are shown along with the date and time of the recorded breaches. You can also navigate to the dashboard by choosing View Dashboard.
Evaluate alerts
The evaluation schedule for threshold alerts is based on the dataset. For SPICE datasets, alert rules are checked against the data after a successful data refresh. With datasets querying your data sources directly, alerts are evaluated daily at a random time between 6:00 PM and 8:00 AM. This is based on the the timezone of the AWS Region your dataset was created in. Dataset owners can set up their own schedules for checking alerts and increase the frequency up to hourly (to learn more, refer to Working with threshold alerts in Amazon QuickSight).
Threshold alerts are billed for each evaluation, and follow the familiar pricing used for anomaly detection, starting at $0.50 per 1,000 evaluations. For example, if you set up an alert on a SPICE dataset that refreshes daily, you have 30 evaluations of the alert rule in a month, which costs 30 * $0.5/1000 = $0.015 in a month. For more information, refer to Amazon QuickSight Pricing.
Conclusion
In this post, you learned how to create threshold alerts on tables and pivot tables within QuickSight dashboards so that you can track important metrics. For more information about how to create threshold alerts on KPIs or gauge charts, refer to Create threshold-based alerts in Amazon QuickSight. Additional information is available in the Amazon QuickSight User Guide.
About the Author
Lillie Atkins is a Product Manager for Amazon QuickSight, Amazon Web Service’s cloud-native, fully managed BI service.
AWS Network Firewall is a managed service that provides a convenient way to deploy essential network protections for your virtual private clouds (VPCs). In this blog, we are going to cover how to leverage the TLS inspection configuration with AWS Network Firewall and perform Deep Packet Inspection for encrypted traffic. We shall also discuss key considerations and possible architectures.
Today, the majority of internet traffic is SSL/TLS encrypted to maintain privacy and secure communications between applications. Deep packet inspection (DPI) refers to the method of examining the full content of data packets as they traverse a network perimeter firewall. However, the lack of visibility into encrypted traffic presents a challenge to organizations that do not have the resources to decrypt and inspect network traffic. TLS encryption can hide malware, conceal data theft, or mask data leakage of sensitive information such as credit card numbers or passwords. Additionally, TLS decryption is compute-intensive and cryptographic standards are constantly evolving. Organizations that want to decrypt and inspect network traffic typically use a combination of hardware and software solutions from multiple vendors, which adds operational complexity and implementation challenges around capacity planning, scaling issues, and latency concerns. This forces some organizations to make adverse decisions to reduce the complexity of inspecting their network traffic such as blocking access to popular websites to mitigate performance problems.
There are multiple options you can use to perform DPI for encrypted traffic in your AWS environment, based on the use case. These include using AWS WAF or implementing third-party security appliances (next generation firewalls). The addition of new services like Gateway Load Balancer gives you more flexibility in designing your firewall architectures and the ability to perform DPI on AWS.
With this release, Network Firewall also becomes an option to support Deep Packet Inspection on encrypted payloads.
Considerations for deep packet inspection
The following are some key factors to consider when you enable TLS decryption functionality on Network Firewall.
DPI and performance. DPI is processor-intensive, because it not only looks into individual packets, but it also looks into traffic flows (a flow is a collection of related packets). This is combined with the fact that inspection needs to be done in real time with minimal impact to latency. Also, because many firewalls perform other advanced functions (for example, stateful packet inspection, NAT, virtual private network (VPN), and malware threat prevention), adding DPI increases the complexity of the entire system and impacts performance. However, because Network Firewall is an AWS managed service, the bandwidth performance of 100 gigabits per second (Gbps) per firewall endpoint is not impacted, even after you enable TLS inspection configuration. Single digit millisecond latency is expected at initial connection due to the TCP and TLS handshake before data can flow to the firewall. We recommend that you conduct your own testing for the rule sets to verify that the service meets your performance expectations.
DPI and encryption. Encryption has particularly been a challenge to DPI. Effective decisions can’t be made if the contents of the packets aren’t known. As more applications and websites use encryption, it is important that you implement the right TLS decryption technique. With Network Firewall, you can chose which traffic to decrypt by using your available certificates in AWS Certificate Manager (ACM). You can then apply the TLS configurations across the stateful rule groups, thereby authorizing Network Firewall to act as a go-between. For more information on how AWS Network Firewall handles privacy, please read the Network Firewall documentation.
AWS Network Firewall deployment architectures
There are three main architecture patterns for Network Firewall deployments. You can refer to the Deployment models for AWS Network Firewall blog post, which provides details on these, as well as key considerations. The three main models are as follows:
Distributed deployment model — Network Firewall is deployed into each individual VPC.
Centralized deployment model — Network Firewall is deployed into a centralized VPC for East-West (VPC-to-VPC) or North-South (inbound and outbound from internet, on-premises) traffic. We refer to this VPC as the inspection VPC throughout this blog post.
Combined deployment model — Network Firewall is deployed into a centralized inspection VPC for East-West (VPC-to-VPC) and a subset of North-South (on-premises, egress) traffic. Internet ingress is distributed to VPCs that require dedicated inbound access from the internet, and Network Firewall is deployed accordingly.
Each of these architectures is still valid for TLS inspection functionality. Today, AWS Network Firewall supports TLS inspection only for the ingress (inbound) traffic coming into the VPC.
In this section, we will highlight a deployment architecture with AWS Network Firewall and the process for deep packet inspection.
AWS Network Firewall – prior to TLS inspection configuration
Below figure 1 shows how Network Firewall performs inspection when the TLS inspection feature isn’t enabled. The workflow is as follows:
The ingress traffic enters the VPC. Ingress routing enables the internet traffic to be inspected by AWS Network Firewall.
The traffic from the firewall endpoint to the Network Firewall:
Network Firewall inspects the packet first through a stateless engine. Network Firewall makes a drop/pass decision by applying the rules that are present in the stateless engine.
If there is no match on the set of stateless rules present, the traffic is then forwarded to the stateful engine. Again, a drop/pass decision is made by applying the set of stateful rules.
If the decision is to pass traffic, then the firewall endpoint present in the firewall subnet sends the traffic to the customer subnet through the routes present in the VPC subnet route table.
AWS Network Firewall — after TLS inspection configuration
After you enable the TLS inspection capability in Network Firewall, the traffic flow changes slightly, as shown in Figure 2. Because the ingress data you want to inspect is encrypted, it first needs to be decrypted before it is sent to the firewall stateful engine.
In Figure 2, you can see the ingress traffic flow, which has the following steps:
The ingress traffic enters the VPC. Ingress routing enables the internet traffic to be inspected by AWS Network Firewall.
The traffic from the firewall endpoint to the Network Firewall:
Network Firewall inspects the packet first through a stateless engine. Network Firewall makes a drop/pass decision by applying the rules present in the stateless engine.
If there is no match on the set of stateless rules present, the traffic is then forwarded to the stateful engine. However, before the traffic passes to the stateful engine, if there is no match and the traffic is in the scope of the TLS encryption configuration, the traffic is forwarded for the decrypt operation.
After decryption, the traffic is then forwarded to the firewall stateful engine for inspection. Again, Network Firewall makes a drop/pass decision by applying the set of stateful rules.
If the decision is to pass traffic, then the firewall endpoint present in the firewall subnet sends the traffic to the customer subnet through the routes present in the VPC subnet route table.
Note: Customers must trust this certificate for the TLS inspection configuration to function properly.
Let’s look at how to implement TLS inspection when you create a new network firewall in AWS Network Firewall. A TLS inspection configuration contains one or more references to a valid AWS Certificate Manager (ACM) SSL/TLS certificate that Network Firewall uses to decrypt ingress (inbound) traffic. Network Firewall supports a variety of certificate types supported in addition to wildcard certificates. You can optionally define a scope (5-tuple based) to decrypt traffic by source and destination IP or port. To follow this procedure, you must have at least one valid certificate type supported by Network Firewall in ACM that’s accessible by your AWS account.
To create a TLS inspection configuration (console)
In the navigation pane, under Network Firewall, choose TLS inspection configurations.
Choose Create TLS inspection configuration.
Figure 3: TLS inspection configuration for AWS Network Firewall
On the Associate SSL/TLS certificates page, in the search box, select the ACM certificate to use in the TLS inspection configuration, and then choose Add certificate. You can use as many as 10 certificates for a single configuration.
Figure 4: SSL/TLS certificate as part of Network Firewall inspection configuration
Choose Next to go to the TLS inspection configuration’s Describe TLS inspection configuration page.
For Name, enter a name to identify this TLS inspection configuration, and optionally enter a description for the TLS inspection configuration.
Choose Next to go to the TLS inspection configuration’s Define scope page.
Figure 5: Description for Network Firewall inspection configuration
Note that you can’t change the name after you create the TLS inspection configuration.
In the Scope configuration pane, you can optionally define one or more 5-tuple scopes for the domains that you want Network Firewall to decrypt. Network Firewall uses the corresponding SSL/TLS certificates in your TLS inspection configuration to decrypt the SSL/TLS traffic that matches the scope criteria.
Figure 6: Define scope for Network Firewall to decrypt
For Protocol, choose the protocol to decrypt and inspect for. Network Firewall currently supports only TCP.
For Source, choose the source IP addresses and ranges to decrypt and inspect for. You can inspect for either Custom IP addresses or Any IPv4 address. (IPv6 is currently not supported.)
For Source port, choose the source ports and source port ranges to decrypt and inspect for. You can inspect for either Custom port ranges or Any port.
For Destination, choose the destination IP addresses and ranges to decrypt and inspect for. You can inspect for either Custom IP addresses or Any IPv4 address.
For Destination port, choose the destination ports and destination port ranges to decrypt and inspect for. You can inspect for either Custom port ranges or Any port.
After you’ve set the scope criteria, choose Add scope configuration, and then choose Next.
On the next page, Select encryption options, determine whether you want to use the AWS managed key or customize encryption settings (advanced). Here we use the default key that AWS owns and manages on your behalf, choose Next.
Figure 7: Select the encryption options
On the Add tags page, choose Next. Tags are optional but are recommended as a best practice. Tags help you organize and manage your AWS resources. For more information about tagging your resources, see Tagging AWS Network Firewall resources.
On the Review and confirm page, check the TLS inspection configuration settings. Choose Create TLS inspection configuration. Your TLS inspection configuration is now ready for use.
Figure 8: Validate the TLS inspection configuration
Update an existing network firewall with TLS inspection configuration
There are two methods that you can use modify an existing firewall configuration for TLS inspection, depending on your scenario.
Scenario 1: Add TLS inspection to an existing network firewall. In this scenario, you only need to consider the scope that TLS inspection applies to. After you have followed steps 1 through 12 outlined in the procedure in this post, and created the TLS inspection configuration, ingress (inbound) traffic will be decrypted and then sent to the stateful engine for inspection that uses your existing firewall policies.
Scenario 2: Modify an existing firewall with TLS inspection configured. In this scenario, where TLS configuration has already been added and you just need to modify the configuration, you can use the following steps. Note that you can’t change the name of a TLS inspection configuration after creation, but you can change other details.
AWS Network Firewall lets you inspect traffic at scale in a variety of use cases. In this blog post, we looked into the recently launched TLS inspection configuration for ingress inspection architectures and discussed considerations for enabling this feature. We showed how you can enable and update the TLS inspection feature on Network Firewall. To learn more about the TLS inspection feature, check out the AWS Network Firewall Developer Guide. We hope this post is helpful and look forward to hearing about how you use the latest feature.
If you have feedback about this post, submit comments in the Comments section below. If you have questions about this post, contact AWS Support.
Want more AWS Security news? Follow us on Twitter.
Mobian is a
project that aims to bring the Debian distribution to mobile devices such
as smartphones and
tablets. By building on the flexibility, stability, and community-driven
development of Debian, Mobian aspires to create a powerful and
user-friendly alternative to existing mobile operating systems. The project
is actively working on reducing the delta between Mobian and Debian, and its
ultimate goal is to be absorbed back into its parent distribution and to
make it easy to run Debian on mobile devices.
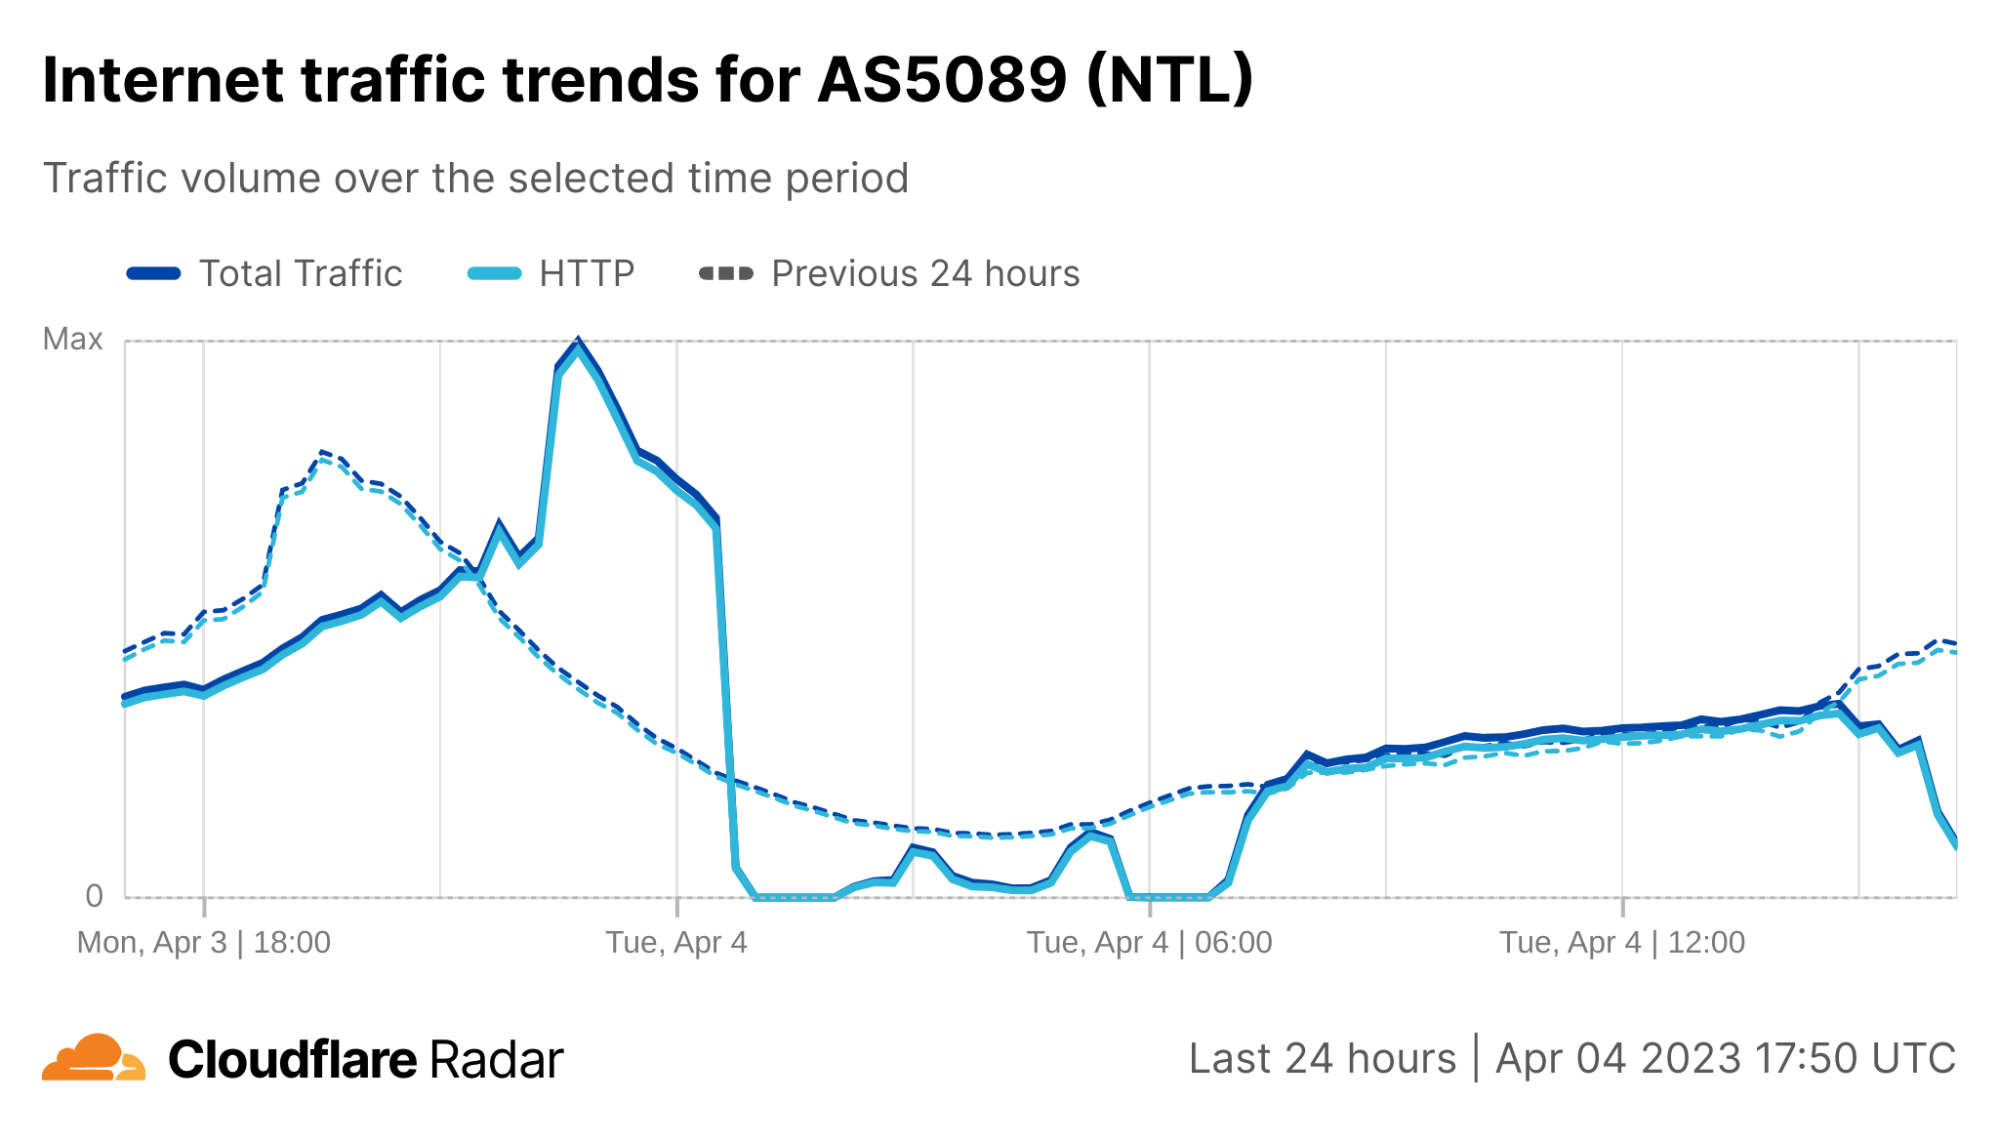
Just after midnight (UTC) on April 4, subscribers to UK ISP Virgin Media (AS5089) began experiencing an Internet outage, with subscriber complaints multiplying rapidly on platforms including Twitter and Reddit.
Cloudflare Radar data shows Virgin Media traffic dropping to near-zero around 00:30 UTC, as seen in the figure below. Connectivity showed some signs of recovery around 02:30 UTC, but fell again an hour later. Further nominal recovery was seen around 04:45 UTC, before again experiencing another complete outage between around 05:45-06:45 UTC, after which traffic began to recover, reaching expected levels around 07:30 UTC.
After the initial set of early-morning disruptions, Virgin Media experienced another round of issues in the afternoon. Cloudflare observed instability in traffic from Virgin Media’s network (called an autonomous system in Internet jargon) AS5089 starting around 15:00 UTC, with a significant drop just before 16:00 UTC. However in this case, it did not appear to be a complete outage, with traffic recovering approximately a half hour later.
Virgin Media’s Twitter account acknowledged the early morning disruption several hours after it began, posting responses stating “We’re aware of an issue that is affecting broadband services for Virgin Media customers as well as our contact centres. Our teams are currently working to identify and fix the problem as quickly as possible and we apologise to those customers affected.” Further responses after service restoration noted “We’ve restored broadband services for customers but are closely monitoring the situation as our engineers continue to investigate. We apologise for any inconvenience caused.”
However, the second disruption was acknowledged on Virgin Media’s Twitter account much more rapidly, with a post at 16:25 UTC stating “Unfortunately we have seen a repeat of an earlier issue which is causing intermittent broadband connectivity problems for some Virgin Media customers. We apologise again to those impacted, our teams are continuing to work flat out to find the root cause of the problem and fix it.”
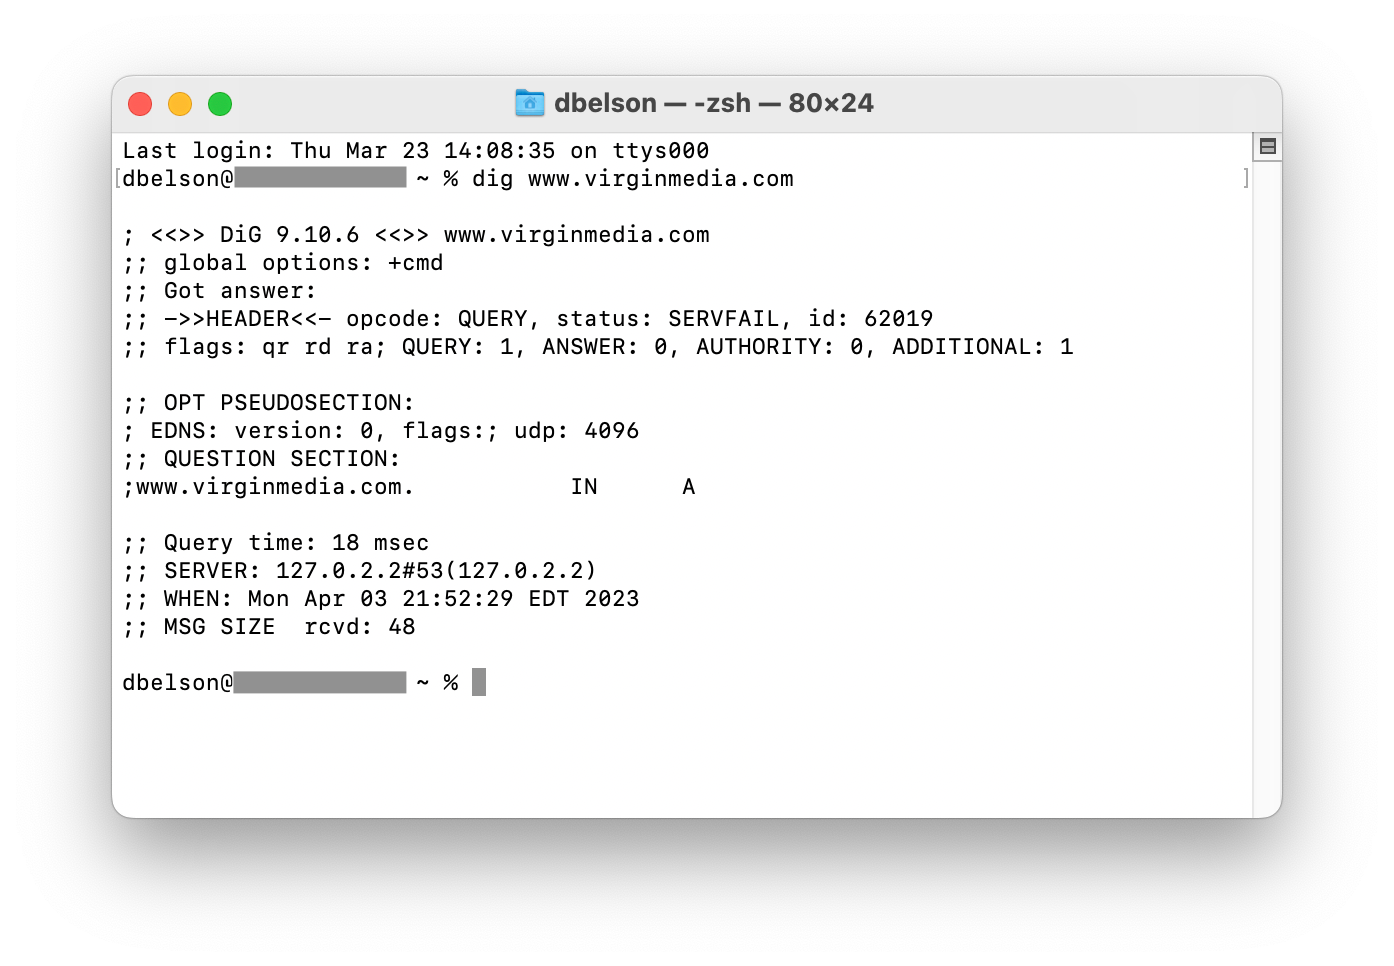
At the time of the outages, www.virginmedia.com, which includes the provider’s status page, was unavailable. As seen in the figure below, a DNS lookup for the hostname resulted in a SERVFAIL error, indicating that the lookup failed to return a response. This is because the authoritative nameservers for virginmedia.com are listed as ns{1-4}.virginmedia.net, and these nameservers are all hosted within Virgin Media’s network (AS5089) and thus are not accessible during the outage.
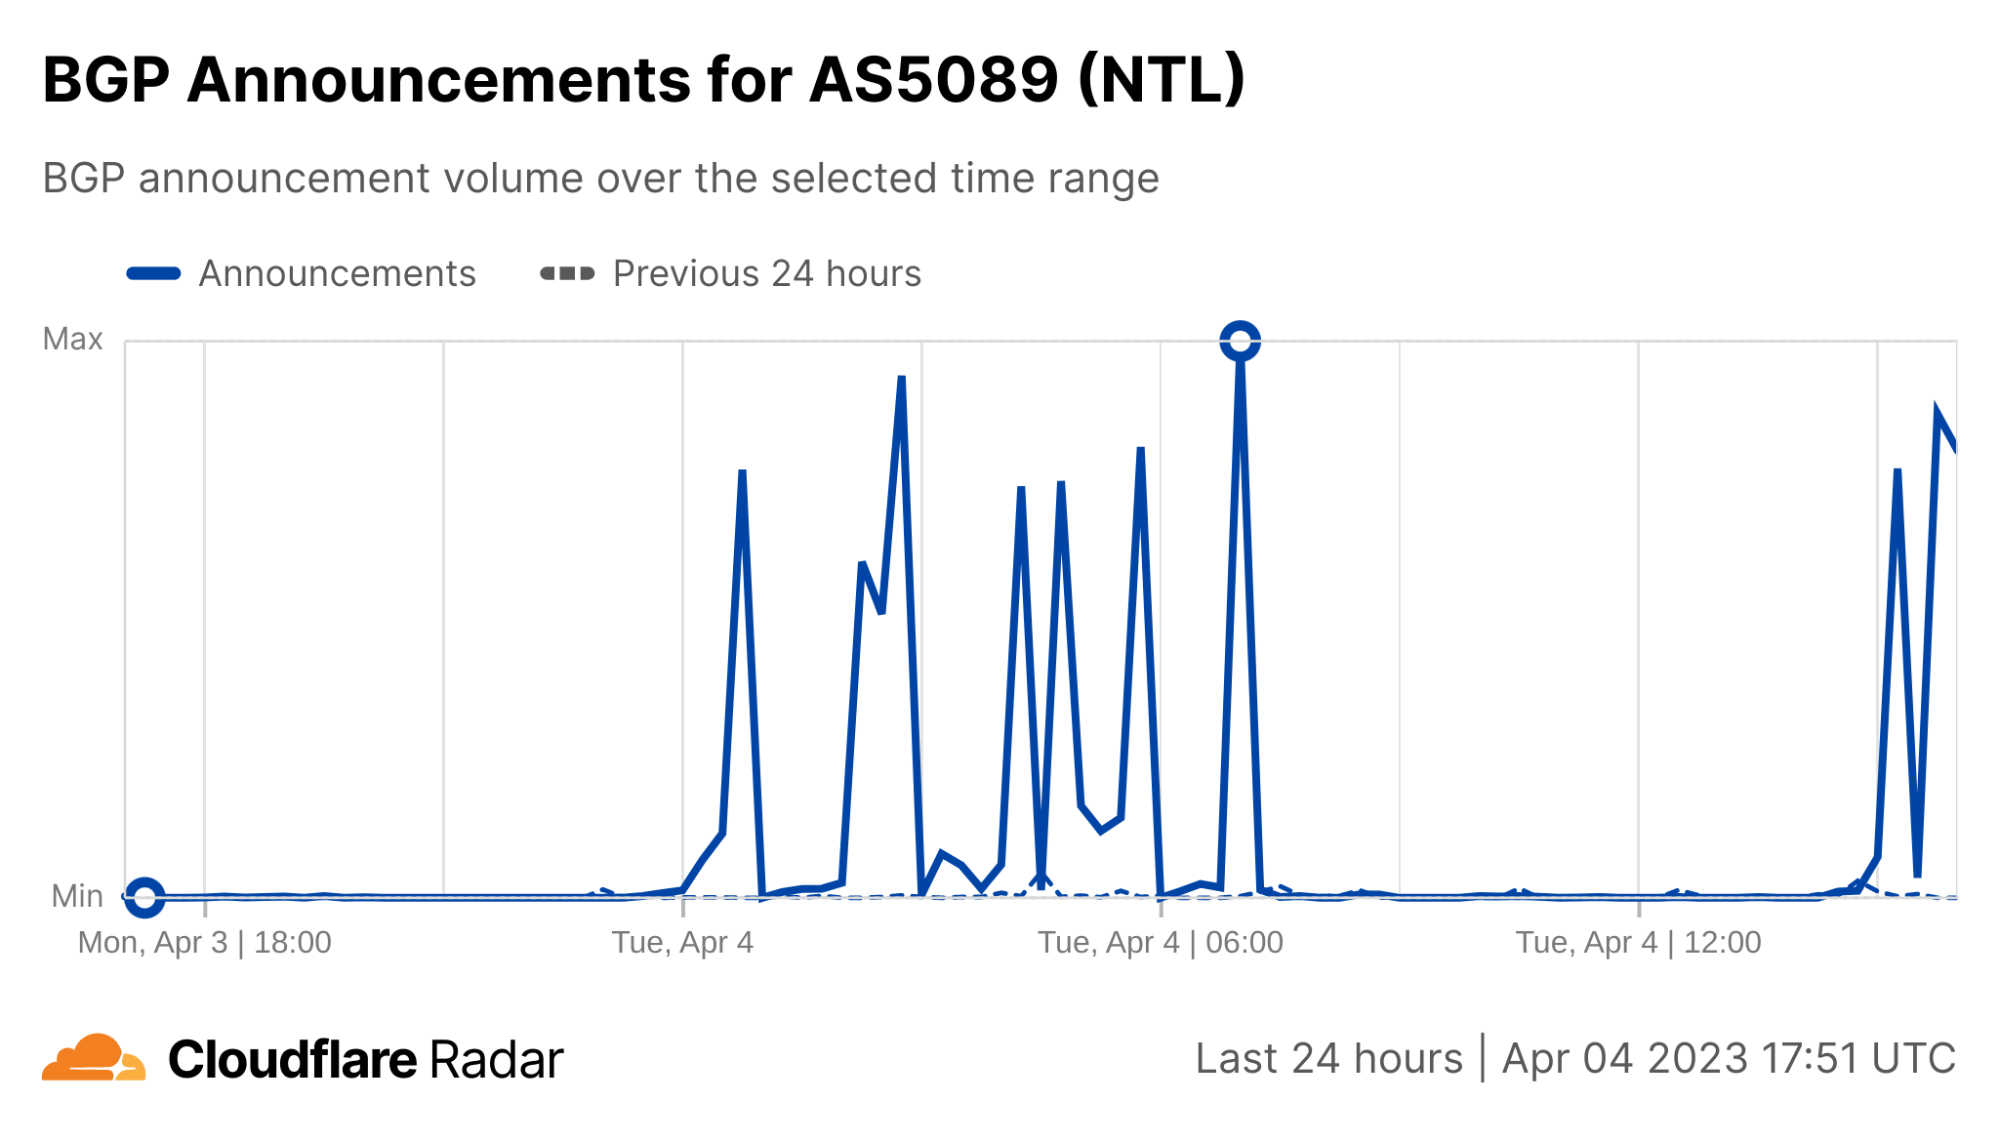
Although Virgin Media has not publicly released a root cause for the series of disruptions that its network has experienced, looking at BGP activity can be instructive.
BGP is a mechanism to exchange routing information between networks on the Internet. The big routers that make the Internet work have huge, constantly updated lists of the possible routes that can be used to deliver each network packet to its final destination. Without BGP, the Internet routers wouldn’t know what to do, and the Internet wouldn’t exist.
The Internet is literally a network of networks, or for math fans, a graph, with each individual network a node in it, and the edges representing the interconnections. All of this is bound together by BGP, which allows one network (Virgin Media, for instance) to advertise its presence to other networks that form the Internet. When Virgin Media is not advertising its presence, other networks can’t find its network and it becomes effectively unavailable.
BGP announcements inform a router of changes made to the routing of a prefix (a group of IP addresses) or entirely withdraws the prefix, removing it from the routing table. The figure below shows aggregate BGP announcement activity from AS5089 with spikes that align with the decreases and increases seen in the traffic graph above, suggesting that the underlying cause may in fact be BGP-related, or related to problems with core network infrastructure.
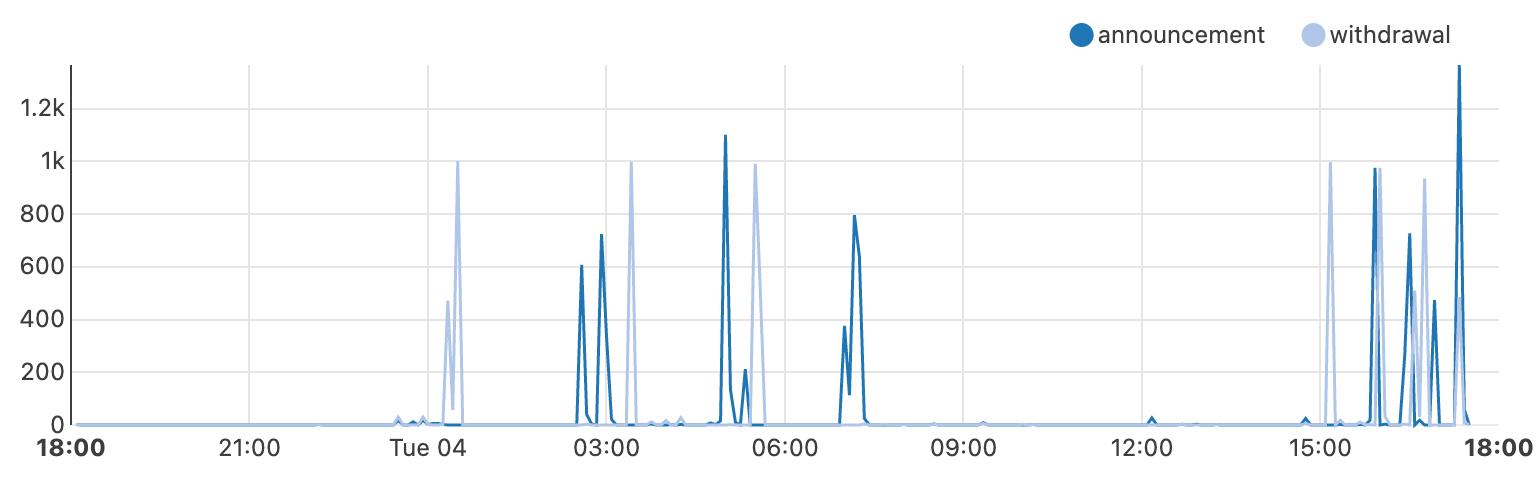
We can drill down further to break out the observed activity between BGP announcements (dark blue) and withdrawals (light blue) seen in the figure below, with key activity coincident with the loss and return of traffic. An initial set of withdrawals are seen just after midnight, effectively removing Virgin Media from the Internet resulting in the initial outage.
A set of announcements occurred just before 03:00 UTC, aligning with the nominal increase in traffic noted above, but those were followed quickly by another set of withdrawals. A similar announcement/withdrawal exchange was observed at 05:00 and 05:30 UTC respectively, before a final set of announcements restored connectivity at 07:00 UTC.
Things remained relatively stable through the morning into the afternoon, before another set of withdrawals presaged the afternoon’s connectivity problems, with a spike of withdrawals at 15:00 UTC, followed by additional withdrawal/announcement exchanges over the next several hours.
Effective security incident response depends on adequate logging, as described in the AWS Security Incident Response Guide. If you have the proper logs and the ability to query them, you can respond more rapidly and effectively to security events. If a security event occurs, you can use various log sources to validate what occurred and understand the scope. Then, you can use the results of your analysis to take remediation actions. To learn more about logging best practices, see Configure service and application logging and Analyze logs, findings, and metrics centrally.
In this blog post, we will show you how to achieve an effective strategy for logging for security incident response. We will share logging options across the typical cloud application stack, log analysis options, and sample queries. AWS offers managed services, such as Amazon GuardDuty for threat detection and Amazon Detective for incident analysis. If you want to collect additional logs or perform custom analysis, then you should consider the options described in this blog post.
Selection of logs
To select the appropriate logs for security incident response, you should start with the common cloud application stack, which consists of the components and layers of your application deployed on AWS. For each component, we will describe the logging sources that you have. For each log source, we will describe why you should log it for security incident response, how to enable the logs, and what your log storage options are.
To select the logs for security incident response, first consider the following questions:
What are your compliance and regulatory requirements for logging?
Note: Make sure that you comply with the log retention requirements of compliance standards relevant to your organization, as well as your organization’s incident response strategy.
What AWS services do you commonly use?
What AWS services have access to or contain sensitive data?
What threats are most relevant to you?
Note: Performing a threat model of your cloud architectures can help you answer this question. For more information, see How to approach threat modelling.
Considering these questions can help you develop requirements for logging that will guide your selection of the following log sources.
AWS account logs
An AWS account is the first, fundamental component of an application deployed on AWS. The account is a container for your AWS resources. You create and manage your AWS resources in this account, and the account provides administrative capabilities for access and billing.
AWS CloudTrail
Within an account, each action performed is an API call. From a console sign-in to the deployment of each resource in an AWS CloudFormation stack, events are generated to provide transparency on what has occurred in the account. With AWS CloudTrail, you can log, continuously monitor, and retain account activity related to actions across supported AWS services. CloudTrail provides the event history of your account activity, including actions taken through the AWS Management Console, AWS SDKs, command line tools, and other AWS services. CloudTrail logs API calls as three types of events:
Management events(also known as control plane operations) show management operations that are performed on resources in your account. This includes actions like creating an Amazon Simple Storage Service (Amazon S3) bucket and setting up logging.
Data events(also known as data plane operations) show the resource operations performed on or within resources in your account. These operations are often high-volume activities, such as Amazon S3 object-level API activity (for example, GetObject, DeleteObject, and PutObject API operations) and AWS Lambda function invocation activity.
Insights events capture unusual API call rate or error rate activity in your account. You must enable these events on a trail in order to capture them, and they are logged to a different folder prefix in the destination S3 bucket for your trail. Insights events provide you with information such as the type of event, the incident time period, the associated API, the error code, and statistics to help you understand and respond effectively to unusual activity.
For security investigations, CloudTrail provides context on the creation, modification, and deletion of AWS resources. Therefore, CloudTrail is one of your most important log sources for security incident response in an AWS environment. You have three primary ways to set up CloudTrail:
CloudTrail Event history — CloudTrail is enabled by default with 90-day retention of management events that you can retrieve through the CloudTrail Event history facility using the console, AWS Command line Interface (AWS CLI), or AWS SDK. You don’t need to take any action to get started using the Event history feature.
CloudTrail trail — For longer retention and visibility of data events, you need to create a CloudTrail trail and associate it with an S3 bucket and optionally with an Amazon CloudWatch log group. If you use AWS Organizations, you can create an organization trail that will log events for each account in the organization. By default, trails are multi-Region, so you don’t need to enable CloudTrail logs in each AWS Region.
AWS CloudTrail Lake — You can create a CloudTrail lake, which retains CloudTrail logs for up to seven years and provides a SQL-based querying facility. You don’t need to have a trail configured in your account to use CloudTrail Lake.
Amazon Security Lake — You can use Security Lake to ingest CloudTrail events, which include management and data events. You can further analyze these events with Amazon QuickSight or another other third-party security information and event management (SIEM) tool.
AWS Config
Creating and modifying resources is an integral part of your account use. Tracking resource configuration changes made by calling the AWS API helps you review changes throughout the resource lifecycle. AWS Config provides a detailed view of the configuration of AWS resources in your account, examines the resource configurations periodically, and tracks configuration changes that were not initiated by the API. This includes how the resources are related to one another and how they were configured in the past so that you can see how configurations and relationships change over time.
You should enable AWS Config in each Region where you have resources deployed, and you should configure an S3 bucket to receive configuration history and configuration snapshot files, which contain details on the resources that AWS Config records. You can then review configuration compliance and analyze activities performed before, during, and after an event using the configuration history in S3. You should centralize AWS Config resource tracking across multiple accounts in the same organization by setting up an aggregator. You can use AWS Control Tower to automate the setup.
During a security investigation, you might want to understand how a resource configuration has changed over time. For example, you might want to investigate the changes to an S3 bucket policy before and after a security event that involves an S3 bucket. AWS Config provides a configuration history for resources that can help you track activities performed during a security event.
Operating system and application logs
To record interactions with applications, you must capture operating system (OS) and application logs, especially custom logs generated by the application development framework. OS and local application logs are relevant for security events that involve an Amazon Elastic Compute Cloud (Amazon EC2) instance. These instances could be standalone, in an auto scaling group behind a load balancer, or compute workloads for Amazon Elastic Container Service (Amazon ECS) or an Amazon Elastic Kubernetes Service (Amazon EKS) cluster. OS logs track privileged use, processes, login events, access to directory services, and file system activity on a server. To analyze a potential compromise to an EC2 instance, you will want to review the security event logs for Windows OS and the system logs for Linux-based OS.
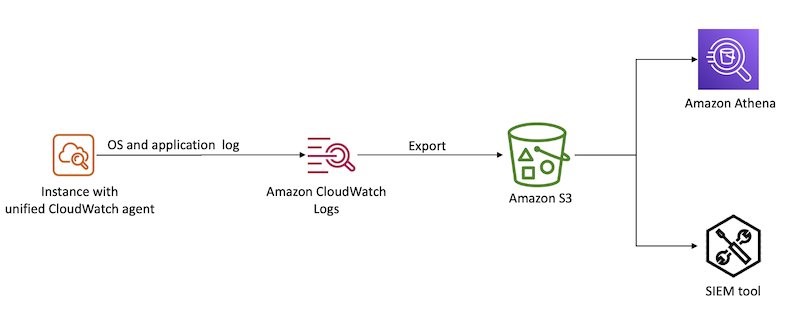
With the unified CloudWatch agent, you can collect metrics and logs from EC2 instances and on-premises servers. The CloudWatch agent aggregates log data into CloudWatch logs, which can then be exported to Amazon S3 for long-term retention and analyzed with a SIEM tool of your choice or Amazon Athena, as shown in Figure 1.
Figure 1: Aggregate OS and application logs using CloudWatch Logs
Database logs
With SQL databases, you can log transactions to help track modifications to the databases, such as additions or deletions. After an engine or system failure, you will need transaction logs to restore a database to a consistent state. Transaction logs are designed to be secure, and they require additional processing to access valuable information. It’s important that you understand data interactions during a security investigation, especially if your databases hold personally identifiable information (PII), financial and payments information, or other information subject to regulatory controls.
The goal of logging network activity is to gain insight into the communications that traverse your network. You might need this data for a variety of reasons, such as network troubleshooting or for use in a forensic investigation of suspected malware activity within your network.
In the AWS Cloud, you can log network activity by creating a proxy that logs network traffic or by using Traffic Mirroring to send a copy of network traffic to a logging server. You can adopt cloud-native approaches to capture this type of data using Amazon Route 53 DNS query logs and Amazon VPC Flow Logs.
There are also a variety of third-party networking solutions available like Palo Alto Networks and Fortinet, so you can continue to use the network logging mechanisms that you might have used in an on-premises environment.
Route 53 DNS query logs
You can configure Amazon Route 53 to log Domain Name System (DNS) queries. These logs are categorized into two groups:
Public DNS query logging
Resolver query logging
Logging public DNS queries against domains that you have hosted in Route 53 provides query information, such as the domain or subdomain requested, date and time stamp of the request, DNS record type, Route 53 edge location that responded, and response code.
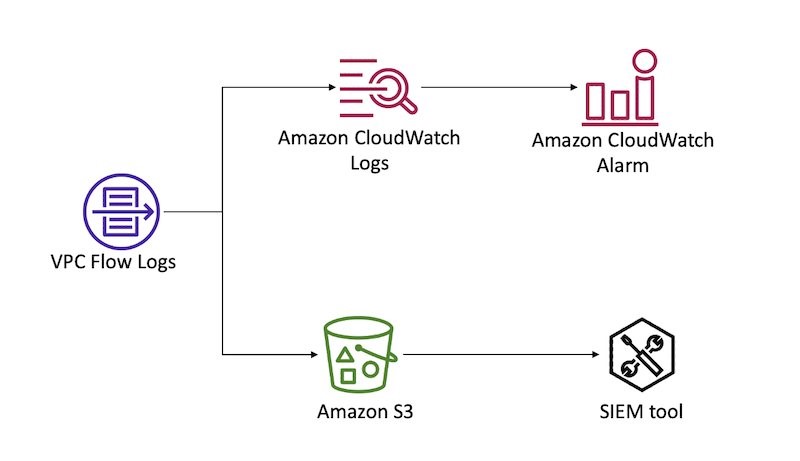
You can configure VPC Flow Logs for a VPC in your account to capture traffic that enters and moves around your VPC network, without the addition of instances or products. From these logs, you can review information, such as source and destination IP, ports, timestamps, protocol, account ID, and whether the traffic was accepted or rejected. For a complete list of the fields available for flow log records, see Available fields. You can create a flow log for a VPC, a subnet, or a network interface. If you create a flow log for a subnet or VPC, IP traffic going to and from each network interface in that subnet or VPC will be logged. For more details on VPC Flow Logs, see Logging IP traffic using VPC Flow Logs.
You can forward flow logs to Amazon CloudWatch Logs to create CloudWatch alarms based on metric filters. You can also forward flow logs to an S3 bucket for long-term retention and further analysis. Figure 2 demonstrates these configurations.
Figure 2: Sending VPC Flow logs to CloudWatch Logs and S3
Access logs
To identify access patterns for accessible endpoints, especially public endpoints, you should use access logs. Access logs capture detailed information about requests sent to your load balancer. Each log contains information such as the time the request was received, the client’s IP address, latencies, request paths, and server responses. With services built in layers behind a load balancer, unless you track the X-Forwarded-For request header, the requestor’s context is lost. Access logs help bridge that gap during investigations and analysis.
Amazon S3 server access logs
Access logs are critical to track object level access when using S3 buckets to store confidential or sensitive data. You can also turn on CloudTrail to capture S3 data events. You can store access logs in S3 buckets for long-term storage for compliance purposes and to run analyses during and after an event.
Load balancing logs
Elastic Load Balancing provides access logs that capture detailed information about requests sent to load balancers. Each log contains information such as the time the request was received, the client’s IP address, latencies, request paths, and server responses. You can use this log to analyze traffic patterns and to troubleshoot issues.
Access logs is an optional feature of Elastic Load Balancing that is turned off by default. To enable access logs for load balancers, see Access logs for your Application Load Balancer.
If you implement your own reverse proxy for load balancing needs, make sure that you capture the reverse proxy access logs. You can use the unified CloudWatch agent to forward the logs to CloudWatch. As with OS logs, you can export CloudWatch logs to an S3 bucket for long-term retention and analysis.
If you use an Amazon CloudFront distribution as the public endpoint for end users with load balancers as the custom origin, then load balancing access logs will represent the CloudFront distribution as the requestor, rather than the actual end user. If this information doesn’t add value to your incident handling process, then you can use CloudFront access logs as the log source that provides end user request details.
CloudFront access logs
You should enable standard logs, also known as access logs, when using CloudFront. Specify an S3 bucket where you want CloudFront to save the files.
CloudFront access logs are delivered on a best-effort basis. For information about requests made to a distribution in real time, use real-time logs that are delivered within seconds of receiving the requests. You should use real-time logs to monitor, analyze, and take action based on content delivery performance. For more details on the fields available from these logs, see the CloudFront standard log file format.
AWS WAF logs
When associated with a supported resource like a CloudFront distribution, Amazon API Gateway REST API, Application Load Balancer, AWS AppSync GraphQL API, Amazon Cognito user pool, or AWS App Runner, AWS WAF can help you monitor HTTP and HTTPS requests that are forwarded to the resource. You should configure web access control lists (ACLs) to gain fine-grained control over the requests, and enable logging for such ACLs to get detailed information about traffic that is analyzed by AWS WAF. Log information includes time of the request being received by AWS WAF from the AWS resource, details about the request, and the AWS WAF rules that the request matched. You can use this log information to monitor access patterns of public endpoints and configure rules to inspect requests in detail. For more information about AWS WAF logging, see Logging web ACL traffic.
Serverless logs
Serverless computing has become increasingly popular in the cloud-computing space. It provides on-demand compute power in a relatively short burst, meaning that cloud-based instances don’t need to be provisioned and kept around, idle, when there are no tasks to be completed. Although more and more compute tasks are being moved to serverless solutions, the need to log has not changed, but how the logs are generated has. In a serverless environment, security investigations not only benefit from logs that demonstrate the interactions and changes made by the code deployed, but that also document changes to the deployed code itself and access permissions of the Lambda execution role that is granting privileged access.
AWS Lambda
The logging of Lambda functions involves two components: how the function itself is operating, and what is happening inside the function (what your code is actually doing).
The logging of a Lambda function itself occurs through data events captured by CloudTrail. As noted earlier in this post, you must configure data events on a trail created in CloudTrail. During configuration, you will need to specify the function from which logs will be captured by your trail, and the destination S3 bucket where they will be stored. These logs contain details on the invocation of the function and help identify the IAM principals that called the Invoke API for Lambda.
AWS Lambda automatically monitors Lambda functions on your behalf and sends logs to CloudWatch. Your Lambda function comes with a CloudWatch Logs log group and a log stream for each instance of your function. The Lambda runtime environment sends details about each invocation to the log stream, and relays logs and other output from your function’s code. For more details on how to monitor Lambda functions, see Accessing Amazon CloudWatch logs for AWS Lambda.
Log analysis
For incident response, you need to be able to analyze and query your logs to validate what occurred and to understand the scope.
To begin, you can aggregate logs from various sources in S3 buckets for long-term storage, and you can integrate that data with query tools for further investigation. Logs can be exported and either parsed through directly, or ingested by another tool to help with the analysis. The following are some options that you can use to query these logs:
Amazon Athena — You can directly query CloudTrail events stored in S3 with Athena using SQL commands, specifying the LOCATION of the log files. You would generally use this approach if you have advanced queries to run, and you don’t have a SIEM. To set up Athena to query logs, you can use this open-source solution from AWS.
Amazon OpenSearch Service — OpenSearch is a distributed search and log analytics suite. Because it’s open source, it can ingest logs from more than just AWS log sources. To set this up, you can use this open-source SIEM solution from AWS.
CloudTrail Event History — Either from the console, or programmatically, you can query CloudTrail management events from the last 90-day period. This is ideal for when you have simple queries to make within the last 90 days, and you don’t need stored logs or more complex queries.
AWS CloudTrail Lake — Either from the console, or programmatically, you can query stored events in your configured CloudTrail Lake from the time of its configuration, up until the maximum storage duration of 2,557 days (7 years) from the time that you make your query. This approach allows for SQL-based queries, and it is ideal for when you need to make more complex queries against events, but don’t require the additional features of a SIEM solution.
Parse through raw JSON using CLI — This is achieved programmatically and parsed through terminal commands. It’s more a legacy method of parsing through logs. You might choose to use this approach for analysis if another service or solution isn’t feasible (for example, if you can’t use the service due to your corporate security policy).
Third-party SIEM — A third-party SIEM might be ideal if you already have a SIEM solution on AWS or elsewhere, and you don’t need a duplicated solution elsewhere. Typically, SIEM solutions will import logs from an S3 bucket and process and index events for analysis. To learn more about SIEM options, see the SIEM solutions in the AWS Marketplace, or the AWS Security Competency Partners for a partner local to you with threat detection and incident response (TDIR) expertise.
Sample queries
In this section, we provide samples of SQL queries. Both Athena and CloudTrail Lake accept SQL queries, but the following samples have been tested for use in Athena only. This is because some samples are for VPC Flow Logs, which you can’t query from CloudTrail Lake. To query CloudTrail logs in Athena, you must first create a table definition that points to the location of your logs stored in S3. You can do this from the CloudTrail Events console by using a hyperlinked suggestion, or from the Athena console directly. Alternatively, for Athena, you can use the AWS Security Analytics Bootstrap.
For each of these queries, you might need to modify some of the fields, such as the time frame that you are investigating, the IAM entity involved, and the account and Region in scope. For example, you might want to modify the time frame based on the current time and when you believe the security event began. This often involves expanding the time frame after running additional queries and learning more about the scope and timeline.
By using partitions for tables, you can restrict the amount of data scanned by each Athena query, helping to improve performance and reduce cost. For example, you can partition your CloudTrail Athena table manually or by using partition projection. You can include the partition column (for example, the timestamp) in your queries to limit the amount of data scanned.
Unauthorized attempts
When a security event occurs, you might want to review API calls that were attempted but failed due to the IAM principal not having access to perform the action on that resource. To discover this activity, run the following query (be sure to modify the time window first):
SELECT *
FROM cloudtrail
WHERE errorcode IN ('Client.UnauthorizedOperation','Client.InvalidPermission.NotFound','Client.OperationNotPermitted','AccessDenied')
AND useridentity.arn LIKE '%iam%'
AND eventtime >= '2023-01-01T00:00:00Z'
AND eventtime < '2023-03-01T00:00:00Z'
ORDER BY eventtime desc
This sample query can help you identify whether certain IAM principals have a significant amount of unauthorized API calls, which can indicate that an IAM principal is compromised.
Rejected TCP connections
During a security event, the unauthorized user that is interacting with the resources in your account is probably trying to establish persistence through the network layer. To get a list of rejected TCP connections and extract from it the day that these events occurred, run the following query:
SELECT day_of_week(date) AS
day,date,interface_id,srcaddr,action,protocol
FROM vpc_flow_logs
WHERE action = 'REJECT' AND protocol = 6
LIMIT 100;
Connections over older TLS versions
You might want to see how many calls to AWS APIs were made using older versions of the TLS protocol, as part of a forensic follow-up or a discovery job after a risk analysis. You can get this data by querying CloudTrail logs.
SELECT eventSource
COUNT(*) AS numOutdatedTlsCalls FROM cloudtrail WHERE tlsDetails.tlsVersion IN ('TLSv1', 'TLSv1.1') AND eventTime > '2023-01-01 00:00:00' GROUP BY eventSource ORDER BY numOutdatedTlsCalls DESC
Filter connections from an IP
With an IP address that you’d like to investigate, as a part of your forensic analysis, you might want to see the connections made to resources in a VPC. You can obtain this information by querying VPC Flow Logs. As with the server access logs, if you’re using Athena, you will first need to create a new table.
SELECT day_of_week(date) AS
day, date, srcaddr, dstaddr, action, protocol
FROM vpc_flow_logs
WHERE day >= '2023/01/01' AND day < '2023/03/01' AND srcaddr LIKE '172.50.%'
ORDER BY day DESC
LIMIT 100
Investigate user actions
If you have identified a user who has been compromised, or that you suspect has been compromised, you might want to know the API calls that they made over a specific time period. Understanding the activity of a user can help you understand the scope of impact during an incident, as well as the reach of user permissions when you design your access management strategy.
SELECT eventID, eventName, eventSource, eventTime, userIdentity.arn
AS user
FROM cloudtrail
WHERE userIdentity.arn = '%<username>%' AND eventTime > '2022-12-05 00:00:00' AND eventTime < '2022-12-08 00:00:00'
Conclusion
It is essential that you capture logs from various layers within your application architecture, so that you can effectively respond to a security event at various layers of the application stack. If a security event occurs, logs can help provide a clear picture of what happened and the scope of the affected resources. This post helps you build a logging strategy for security incident response by understanding what logs you want to analyze, where you want to store those logs, and how you will analyze them.
When you start thinking about backup strategies, it tends to get inside your head. Like Dustin Hoffman’s character in “Rain Man”, seeing equations float around him as he calculates his odds in Vegas, the mental exercise of ensuring your backups have backups of their own tends to manifest itself in the strangest places.
Take, for example, the finale of the Netflix show “Dead to Me” starring Christina Applegate and Linda Cardellini. The show wrapped up a few months back and should definitely be moving toward the top of your “I’ve been meaning to watch that” list. And if you have already seen it, I can’t stress enough how much more you pick up on a second time around.
Anyway, to a certain segment of the audience, the climax of the show served as a fitting conclusion to a whole host of storyline threads whose dense weave kept viewers enthralled from the first episode to the last. But to those of us who tend to worry about things like a proper 3-2-1- backup strategy, the final few episodes concealed a subtle message about the importance of proper data backup procedures.
Let’s dig into what “Dead to Me” can teach us about the importance of a good backup strategy.
One: On-site storage on your home device. Your phone, your laptop, your tablet, whatever. If you can physically touch it and your files are in there somewhere, that’s your first copy.
Two: On-site storage on a separate device. This can be an external hard drive, a thumb drive, or if you’re on a Mac, Time Machine. If it’s not physically in the device, but it’s still somewhere close by, that’s your second copy.
Three: Off-site backup. This should automatically scan the files on your device and upload copies to the cloud for safe-keeping. (Pssst, we’re partial to Backblaze’s astonishingly simple cloud back up here).
Okay, So What Does That Have to Do With “Dead to Me”?
There’s kind of a long road ahead, so buckle up.
For those of you who haven’t seen it, or who binged it so long ago you need a refresher, “Dead to Me” follows the story of two friends, Jen (Applegate) and Judy (Cardellini). Jen is a recently widowed mom whose husband Ted had been killed in a hit and run shortly before the show started. Judy is a woman she meets during a group therapy session, who claims to have lost her husband as well.
Only, as it turns out, Judy didn’t lose her husband. They just split up—after an argument that started when they accidentally struck and killed Jen’s husband.
Intrigued yet? We’re only on the first episode.
By the end of the first season, Jen has discovered the truth about Judy (but they’re still friends), Judy is dating a police officer who is investigating the crime she committed, and her ex-husband Steve (James Marsden, playing against his usual type as a jerk) is desperately trying to cover up the crime while avoiding the Greek mafia, who have a contract out on him.
We cannot stress enough that all of this craziness happens in the first season, which ends with Jen accidentally murdering Steve by—of course—cracking him in the head with a wooden bird, which winds up as a critical plot point.
You see tchotchke. I see danger.
From there the plot twists around on itself, throwing every curveball imaginable at you from secret twin brothers to money laundering schemes to torrid affairs (and hey, we already mentioned the Greek mafia). But critical to our point is one plot thread that could have been avoided with a proper backup strategy.
Karen and the… Let’s Call It 2-1 Strategy
A minor character in the first few seasons, Karen is a neighbor of Jen’s who… well, can be kind of a Karen. You know that person in your neighborhood that you suspect reports you to the Homeowner’s Association whenever your grass gets a little too long? That’s her.
As the neighborhood Karen, she has a natural inclination to keep an eye on things. As such, her house is ringed by security cameras. And as we learned in the season two premiere, one of those cameras just happened to spy Steve on his way to Jen’s house the night he was murdered.
Plot twist, right?
Since this is a huge piece of evidence implicating them in the murder they’re actively covering up, Jen and Judy have to ensure that the incriminating footage is destroyed forever. That means deleting the footage, which they discover has been safely stored in the cloud. They first try to convince Jeff, Karen’s ex, to log on and do it (side note: this happens after they discovered he was having an affair with one of Judy’s ex-boyfriends, because this show is bonkers) but unfortunately Karen has changed the password to her cloud storage.
So they have to sweet-talk their way into Karen’s house (greasing the wheels with her favorite dish—Mexican lasagna with extra raisins) and get her to delete the footage off the cloud. It’s a wonderful moment of female camaraderie as they convince Karen that the data on the cloud represents too many painful memories of her time with her ex. And when Karen finally drags the folder to the trash, we cheer her for finding the strength to move on.
Just a couple of friends, deleting files over coffee.
And then, the punchline.
“And if I ever want to see it again, I have it backed up on my hard drive,” she exclaims, holding up her external drive backup. Jen and Judy manage to steal that, and in doing so get away with their crime scot-free.
What Should Karen Have Done?
Look, we get that the show is trying to get us to root for Jen and Judy as our protagonists, but to be honest, murder is one of those things that is a little hard to look past.
Especially given that the FBI was looking into the crime at that point in the show, what Karen did could legally be considered obstruction of justice. Or at least unintended obstruction of justice, which we’re pretty sure is still a crime. (We on the blog team are definitely not lawyers, though.)
Had Karen utilized a proper 3-2-1 strategy, she should have had a third copy—the one on her local drive—even after she was tricked into deleting it from the cloud and handing over her external drive. And, if she was using Backblaze, she would have been able to access an earlier version of her backup with either our standard 30-day version history or Extended Version History. So, she could have pulled a copy even after she deleted it.
The Moral of the Story Is: 3-2-1 Backups Are Still the Best
Karen handed over all the incriminating evidence about the murder to the person who committed it. Which, true, made for a happy ending as far as the show is concerned. But for those of us who can’t seem to get 3-2-1 backup strategies out of our head, she committed a serious blunder. A 2-1 backup strategy just won’t cut it.
And that, folks, is how “Dead to Me” reminds us all once again that a 3-2-1 backup strategy is still the best way to keep your data safe and out of the hands of nefarious, if endearing, murderers.
The first call for
votes for the 2023 Debian Project Leader election has gone out. The
campaigning was easy to miss this year, for one simple reason: the current
incumbent, Jonathan Carter, is running unopposed for another term. That
suggests that turnout will be low this time but, as several developers have
pointed out, there is still value in voting; it clarifies whether Carter
still has the support of the project.
Researchers at Russian cybersecurity firm Kaspersky today revealed that they identified a small number of cryptocurrency-focused firms as at least some of the victims of the 3CX software supply-chain attack that’s unfolded over the past week. Kaspersky declined to name any of those victim companies, but it notes that they’re based in “western Asia.”
Security firms CrowdStrike and SentinelOne last week pinned the operation on North Korean hackers, who compromised 3CX installer software that’s used by 600,000 organizations worldwide, according to the vendor. Despite the potentially massive breadth of that attack, which SentinelOne dubbed “Smooth Operator,” Kaspersky has now found that the hackers combed through the victims infected with its corrupted software to ultimately target fewer than 10 machines—at least as far as Kaspersky could observe so far—and that they seemed to be focusing on cryptocurrency firms with “surgical precision.”
Security updates have been issued by Fedora (openbgpd and seamonkey), Red Hat (httpd:2.4, kernel, kernel-rt, and pesign), SUSE (compat-openssl098, dpdk, drbd, ImageMagick, nextcloud, openssl, openssl-1_1, openssl-3, openssl1, oracleasm, pgadmin4, terraform-provider-helm, and yaml-cpp), and Ubuntu (haproxy, ldb, samba, and vim).
The collective thoughts of the interwebz
Manage Consent
To provide the best experiences, we use technologies like cookies to store and/or access device information. Consenting to these technologies will allow us to process data such as browsing behavior or unique IDs on this site. Not consenting or withdrawing consent, may adversely affect certain features and functions.
Functional
Always active
The technical storage or access is strictly necessary for the legitimate purpose of enabling the use of a specific service explicitly requested by the subscriber or user, or for the sole purpose of carrying out the transmission of a communication over an electronic communications network.
Preferences
The technical storage or access is necessary for the legitimate purpose of storing preferences that are not requested by the subscriber or user.
Statistics
The technical storage or access that is used exclusively for statistical purposes.The technical storage or access that is used exclusively for anonymous statistical purposes. Without a subpoena, voluntary compliance on the part of your Internet Service Provider, or additional records from a third party, information stored or retrieved for this purpose alone cannot usually be used to identify you.
Marketing
The technical storage or access is required to create user profiles to send advertising, or to track the user on a website or across several websites for similar marketing purposes.
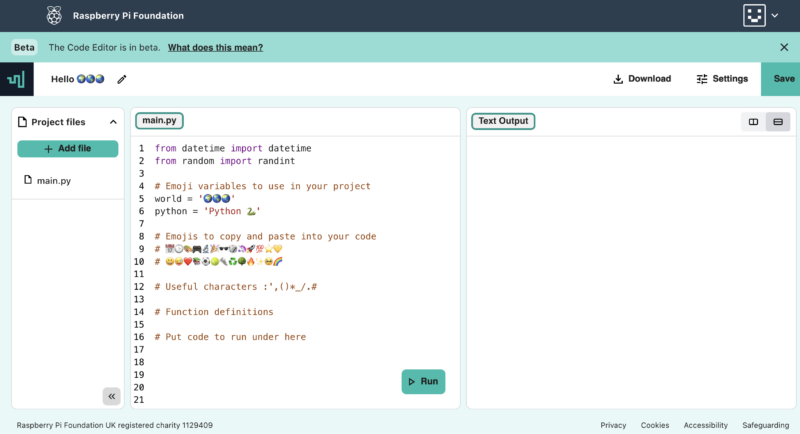


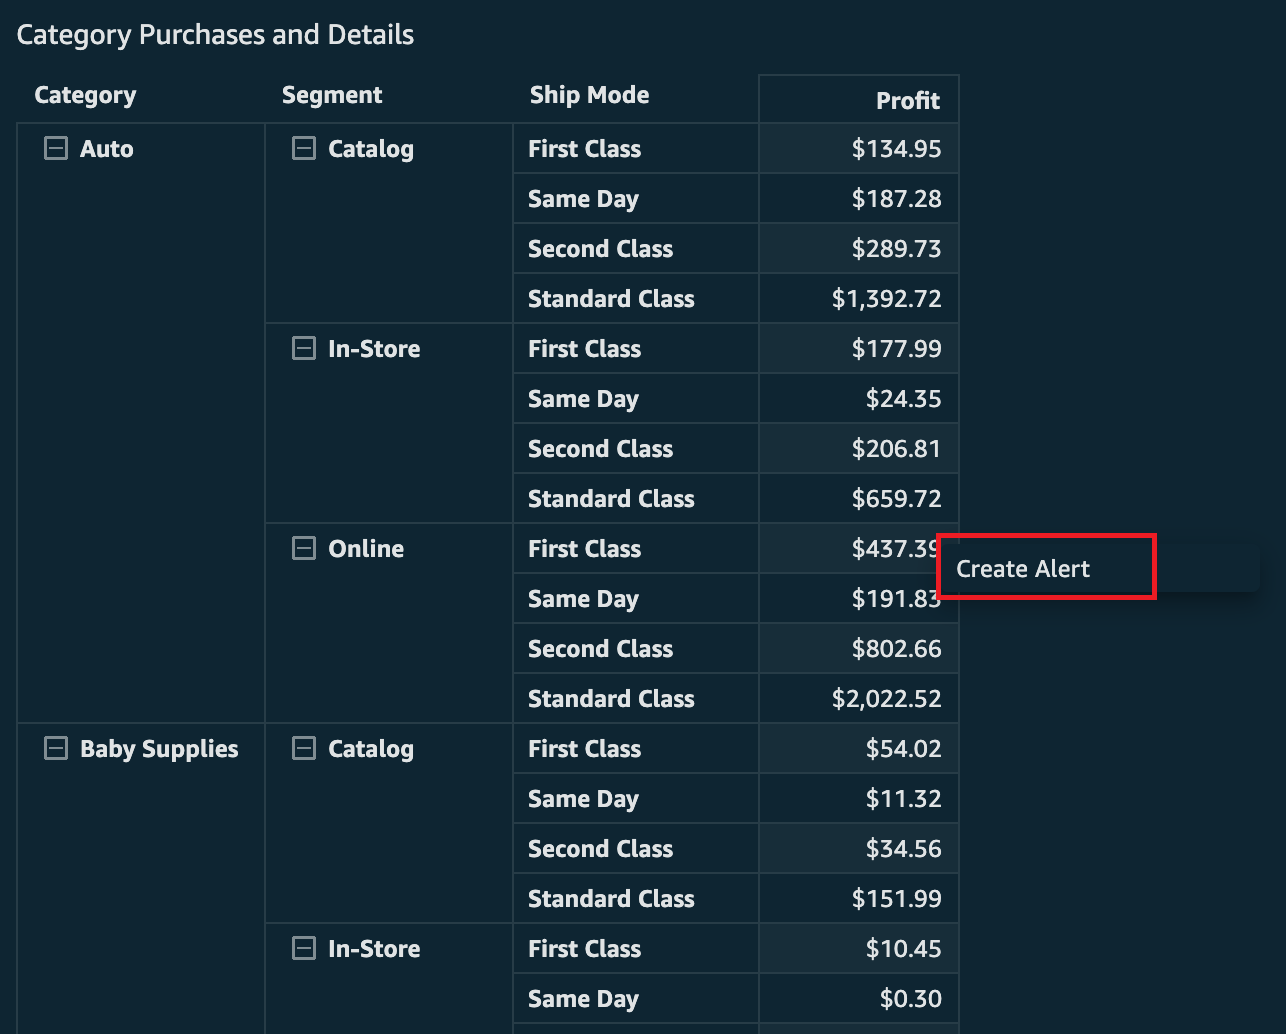


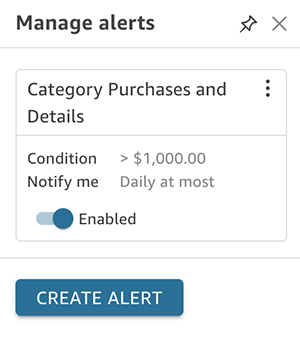

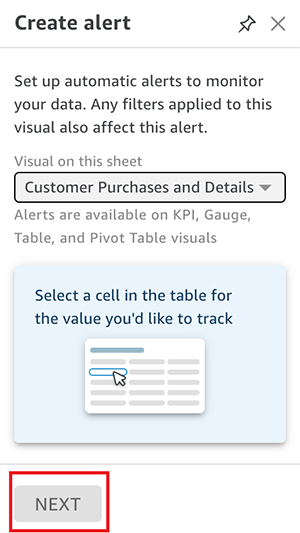
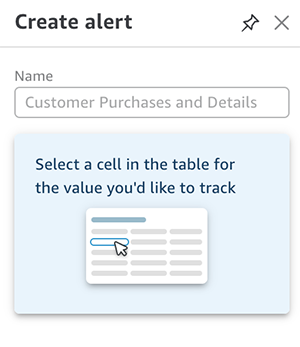
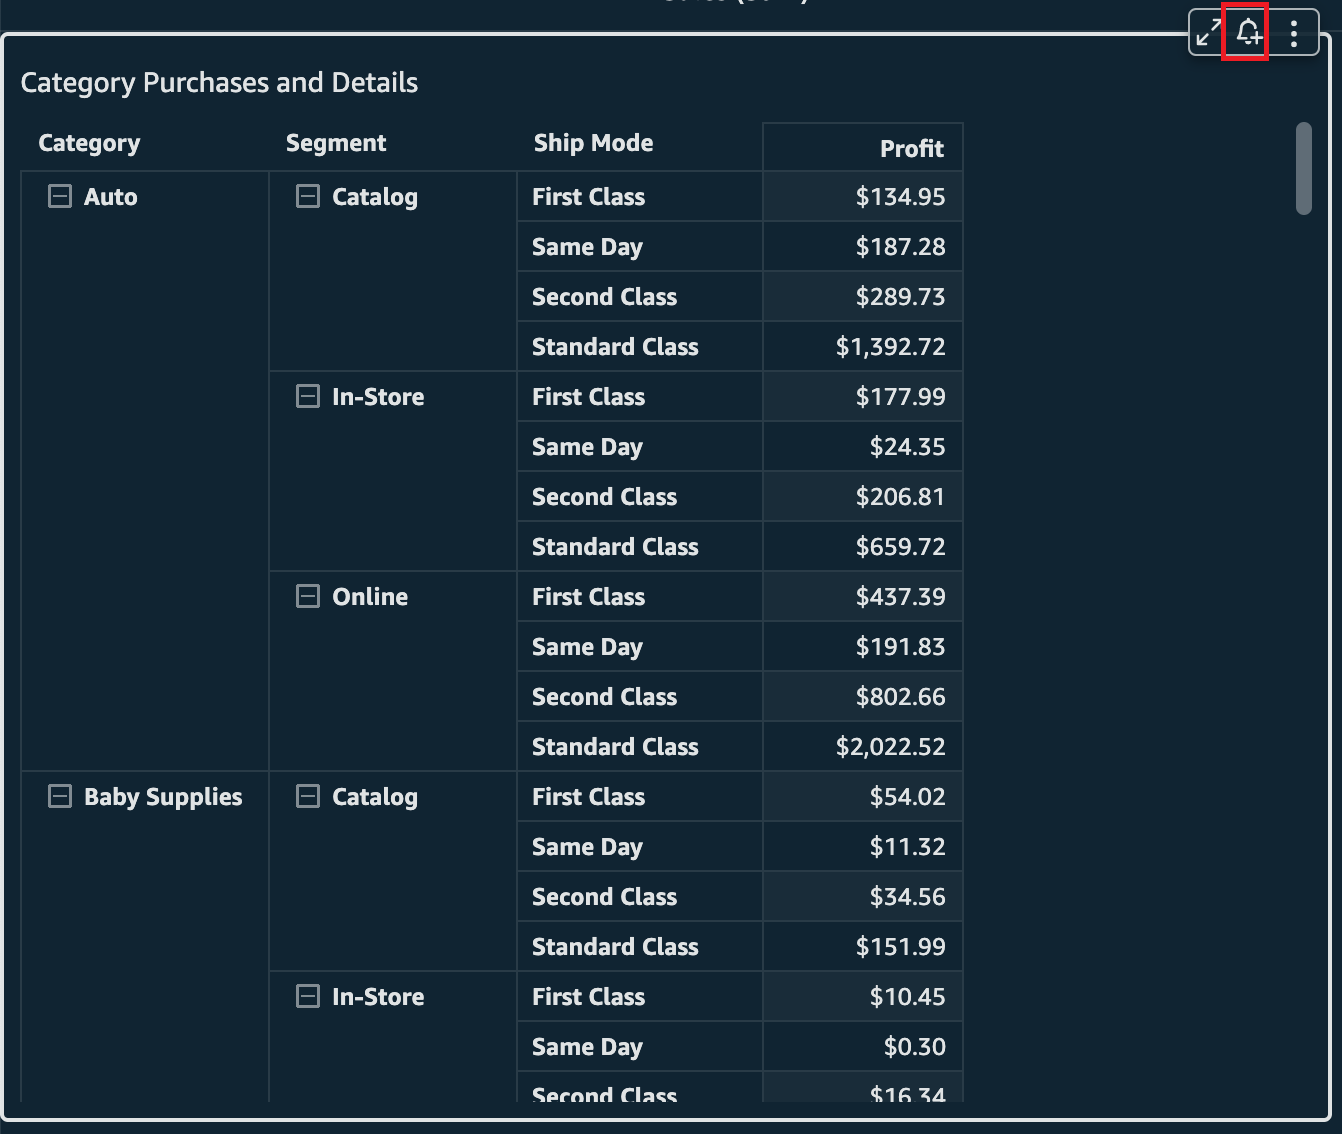


 Lillie Atkins is a Product Manager for Amazon QuickSight, Amazon Web Service’s cloud-native, fully managed BI service.