How Revinate accelerated API adoption with Amazon API Gateway

Post Syndicated from Abe Raghib original https://aws.amazon.com/blogs/architecture/how-revinate-accelerated-api-adoption-with-amazon-api-gateway/

Accelerating API adoption while reducing operational overhead is a challenge that every growing organization faces. For Revinate, a hospitality provider serving over 12,500 hotels worldwide and powering more than 1.25 billion guest profiles, Amazon API Gateway became the foundation of their solution.

Revinate empowers hoteliers to connect directly with guests at every touchpoint, driving $24 billion in lifetime direct revenue through an AI-powered Customer Data Platform (CDP) that helps reduce reliance on online travel agencies (OTAs) and deliver data-driven insights.

With the expansion of CDP capabilities, Revinate needed to expose rich guest data through APIs, so that hotel properties and partners can programmatically access guest profiles, reservation data, and other critical hospitality information.

This post explores how Revinate used Amazon API Gateway and the newly released Amazon API Gateway Portal to create a scalable, secure, and developer-friendly API program.

Business need: Evolving API infrastructure to match growth

As Revinate expanded its CDP capabilities and began exposing guest profile and reservation data through APIs, the limitations of managing API infrastructure in-house became clear. Each new partner integration required manual provisioning, custom security configuration, and ongoing maintenance. The team needed an API gateway solution that could scale with growing partner demand without adding operational burden. Rather than building and maintaining a self-hosted solution, Revinate wanted an approach that would open up engineering time, streamline partner integrations, and align infrastructure costs with actual usage. The team identified four key business drivers:

  • Operational efficiency and agility – Accelerate API deployment cycles and reduce time spent on infrastructure maintenance so the engineering team can focus on building features that directly serve customers.
  • Faster partner and developer onboarding – Helping external developers and partners to discover and adopt Revinate’s APIs required a faster, more self-service experience.
  • Growth aligned costs – Infrastructure costs needed to scale proportionately with revenue generation. An on-demand pricing model, where costs flex with actual API usage rather than fixed overhead, was essential to support sustainable growth. Equally important was the ability to attribute API costs per consumer, enabling transparent cost allocation across hotel properties and partners.
  • Enhanced security and compliance – API security controls including authentication, authorization, rate limiting, and threat protection. Meeting compliance requirements and maintaining customer trust demanded strong security without adding complexity to the development workflow or requiring the team to build and maintain custom security infrastructure.

These requirements shaped the team’s evaluation of available solutions.

Evaluating alternatives

When evaluating API gateway solutions, the team translated the business drivers into four core technical requirements. On-demand pricing was essential to align infrastructure costs with actual API usage and enable per-consumer cost attribution. Authentication federation allows integration with Revinate’s existing identity provider, so partners can onboard faster without building custom auth infrastructure. Rate limiting was needed to protect backend services and enforce fair usage across hotel properties and partners as the API program scales. Finally, strong security, including threat protection, audit logging, and access controls, was required to meet compliance requirements for protecting sensitive guest data.

The engineering team evaluated three approaches. Each approach came with distinct tradeoffs across cost, flexibility, and operational burden.

Self-managed API management

Deploying a self-managed API gateway would provide flexibility and avoid licensing fees, but requires ongoing infrastructure management, security patching, scaling, and monitoring. The team would also need to build a custom developer portal from scratch.

Custom-built

Building a proprietary API gateway tailored to Revinate’s exact needs offers maximum control but demands significant upfront development investment and ongoing maintenance. Every capability, including routing, authentication, rate limiting, and documentation, would need to be built and maintained in-house, diverting engineering resources from core hospitality platform features.

Enterprise API management platforms

Enterprise platforms offer comprehensive out-of-the-box features, but introduce vendor dependencies, higher costs, and fixed-term licensing models where costs misalign with revenue growth.

All three approaches shared a common drawback: they would divert resources, whether engineering time, budget, or both, toward capabilities that don’t differentiate Revinate’s product, delaying time-to-market for features that directly serve hotel customers.

The solution: Amazon API Gateway with Developer Portal

Revinate needed the comprehensive capabilities of an enterprise API management platform without the fixed-term licensing, vendor dependencies, and operational overhead. Amazon API Gateway, combined with the newly released Amazon API Gateway Portal, delivered exactly that, aligning with both the technical requirements and business objectives that shaped the evaluation.

Fully managed infrastructure

Amazon API Gateway removes the need to manage underlying infrastructure, so the engineering team can focus on the core hospitality solution rather than API gateway operations.

Native AWS integration

Amazon API Gateway provides native integration with other AWS services, including Amazon Elastic Kubernetes Service (Amazon EKS) for backend services and AWS Lambda authorizers for federated authentication with an external identity provider. This allows Revinate to authenticate API consumers against the existing identity provider infrastructure with minimal development effort.

Infrastructure as code with Terraform

The team maintains strict infrastructure-as-code practices, using Terraform exclusively for all production deployments. The AWS provider for Terraform enables defining the Amazon API Gateway configuration, including REST APIs, stages, usage plans, and authorizers as version-controlled code. This approach verifies consistency across environments, enables peer review of infrastructure changes, and provides complete audit trails for compliance requirements. The declarative nature of Terraform enables rapidly iterating on the API Gateway configuration during development while maintaining confidence in production deployments.

Cost-effective pay-per-use model

Amazon API Gateway’s pay-per-use pricing model aligned perfectly with Revinate’s growth strategy. During the initial rollout phase, costs remained minimal and scaled naturally as new API consumers onboarded. Usage plans allow Revinate to track and attribute costs per consumer, providing clear visibility into which hotel properties and partners drive API usage. This per-consumer cost attribution, combined with tiered pricing that scales from tens to hundreds of customers, replaced fixed annual licensing fees that required upfront investment regardless of actual usage.

Managed Developer Portal

The November 2025 release of Amazon API Gateway Portal provided a fully managed, AWS-native Developer Portal that served as the central hub for API discovery, documentation, and governance. This removes months of custom development work that building a comparable solution would require.

Developers can use the managed portal to:

  • Set up a branded Developer Portal in minutes rather than months.
  • Provide hotel property developers with self-service API discovery and interactive documentation.
  • Maintain centralized control over API documentation freshness and access governance.
  • Deliver a professional developer experience that accelerates customer onboarding from weeks to days.

Strong security

API Gateway provides built-in security features that meet stringent requirements for protecting sensitive guest data:

  • OAuth2 client credentials for machine-to-machine (M2M) authentication.
  • Authorization logic using AWS Lambda authorizers integrating with an external identity provider of choice.
  • Request throttling and quota management to prevent abuse.
  • Integration with AWS WAF and Amazon CloudFront for layered protection against common web exploits and DDoS threats.
  • Comprehensive audit logging through AWS CloudTrail for compliance and access tracking.
  • Real-time observability through Amazon CloudWatch metrics and dashboards, with support for streaming to third-party observability platforms.

Architecture overview

The solution uses a modern, scalable AWS architecture designed to serve hotel properties globally. Hotel properties access the platform as API consumers through Amazon CloudFront for edge caching and low-latency responses, with AWS WAF providing comprehensive protection against common web threats and bots. Requests flow through Amazon API Gateway, which serves as the unified entry point for API operations. Lambda authorizers handle authentication and authorization by integrating with an identity provider (IdP) to provide secure, token-based access control for each request. After authentication, API Gateway routes traffic to backend services running on Amazon EKS, providing the flexibility and scalability needed for containerized microservices. The EKS application layer orchestrates requests to the Customer Data Platform.
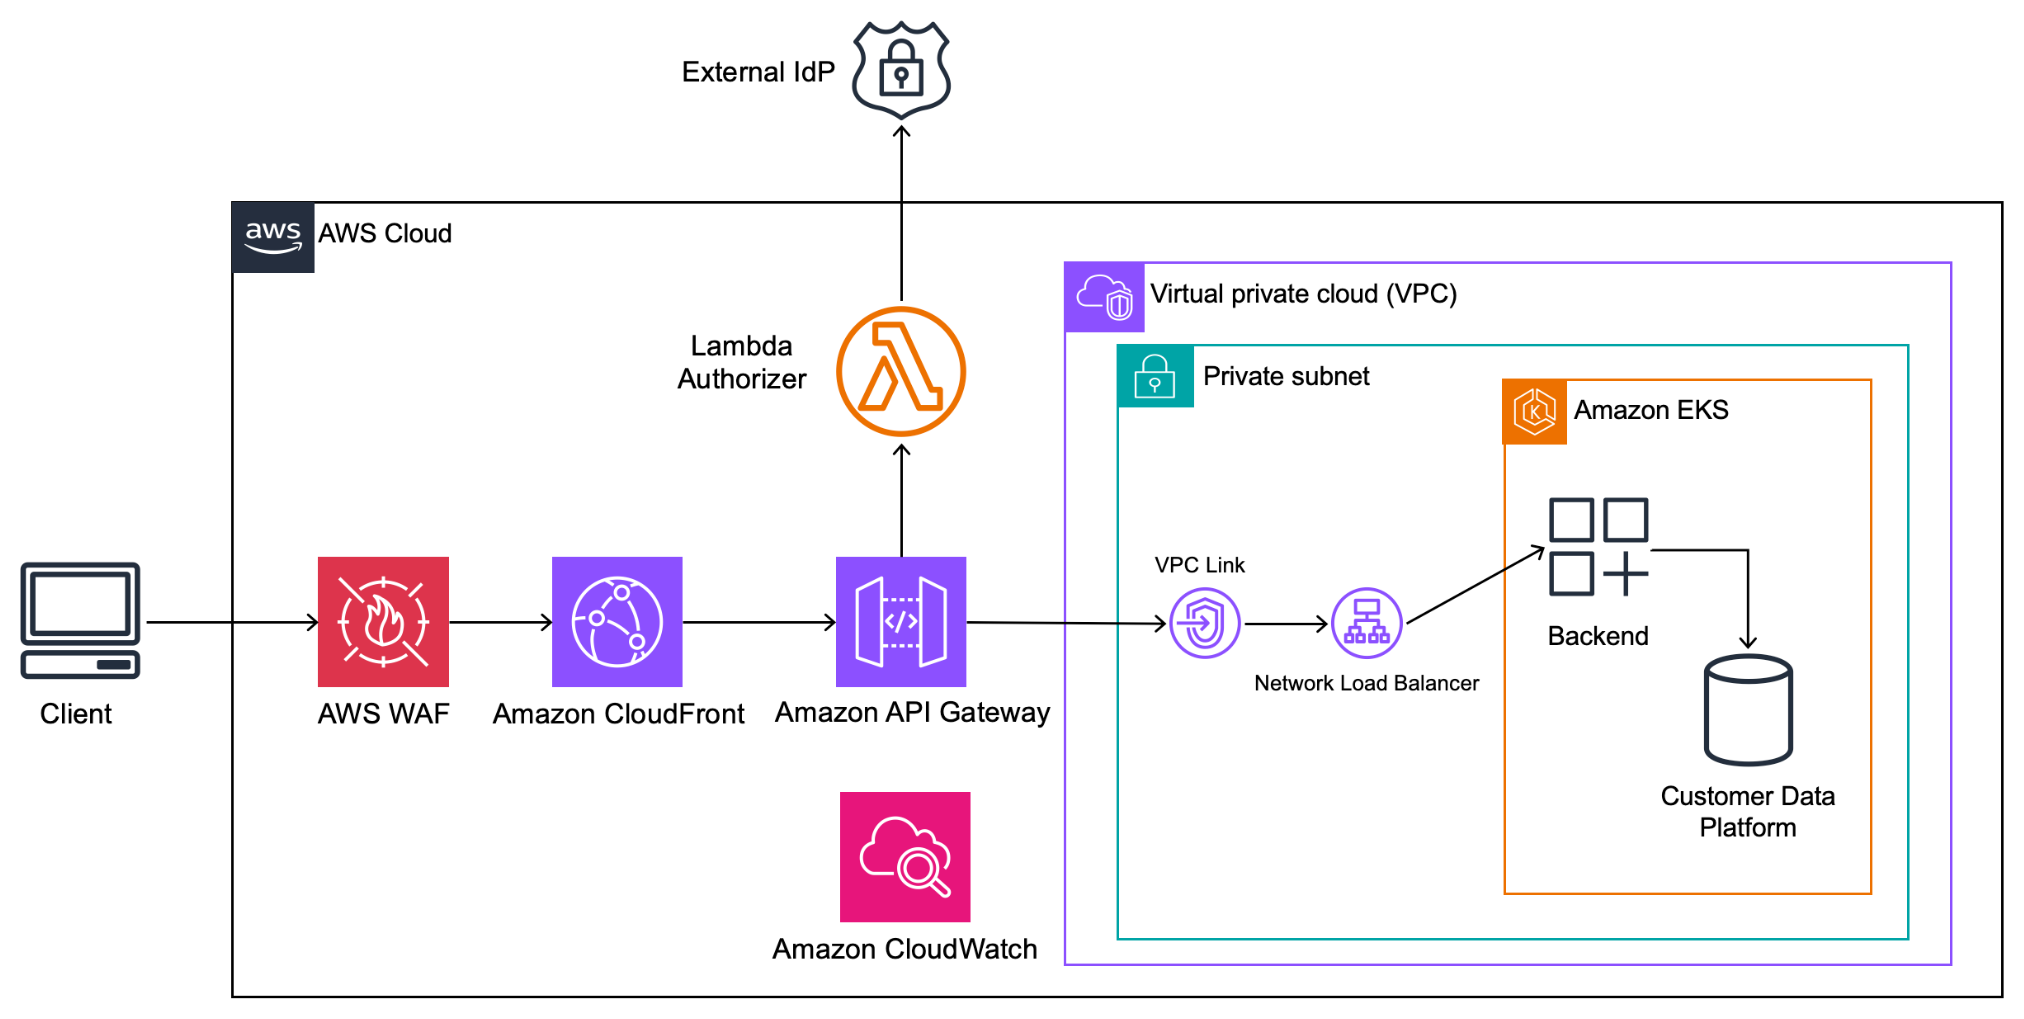
Architecture flow from hotel property consumers through Amazon API Gateway to backend services on Amazon EKS

Figure 1: Architecture diagram showing the end-to-end flow from hotel property consumers accessing the Amazon API Gateway Portal, through Amazon API Gateway, to backend services running on Amazon EKS.

Connecting API Gateway to EKS

A critical design decision emerged: how to securely and efficiently connect API Gateway to backend services in Amazon EKS while keeping traffic within the AWS backbone network using VPC Link. The team evaluated four options:

Option 1: NGINX ingress controller: Route traffic through a Kubernetes-native NGINX Ingress Controller with a Load Balancer service.

Pros: Highly customizable routing, flexible header manipulation, consistent with common Kubernetes patterns.

Cons: Adds extra latency hop, requires manual lifecycle management (upgrades, configs, scaling), non-AWS-native monitoring.

Option 2: AWS load balancer controller: Use the AWS Load Balancer Controller to manage LB resources as Kubernetes Ingress objects.

Pros: Bridges AWS and Kubernetes natively, supports path-based routing, AWS-managed Load Balancer (LB) lifecycle.

Cons: Introduces an additional hop (Amazon API Gateway → LB → service).

Option 3: Target group binding: Directly bind Amazon EKS pods to Network Load Balancer (NLB) Target Groups using the AWS Load Balancer Controller’s TargetGroupBinding feature.

Pros: Removes ingress controller overhead, lowest latency, native AWS integration, cost-efficient (shared NLB across multiple Target Groups), fine-grained control over health checks and scaling.

Cons: More complex initial setup, less Kubernetes-native (more AWS-specific), different applications will need individual NLB.

Option 4: LoadBalancer service: Expose each service directly via a Kubernetes LoadBalancer service (NLB/ALB).

Pros: Most straightforward setup, minimal routing complexity, no ingress controller needed.

Cons: No path-based routing, costly at scale (each service requires its own load balancer), limited observability, requires TLS offloading configuration, different applications will need individual NLB.

The team selected Target group binding because it effectively balances performance, cost-efficiency, and AWS-native integration. By removing the extra hop introduced by traditional ingress controllers, this approach provides direct control over Target Groups and health checks while maintaining sub-second latency at scale.

Security implementation

The API Gateway implementation uses OAuth 2.0 client credentials flow with an external identity provider, delivering strong authentication for machine-to-machine (M2M) communication. This approach provides secure, scalable access control as Revinate onboards new hotel properties and partners.

API Gateway enforces usage plans with configurable throttling and quota limits, for fair usage and protection against abuse.
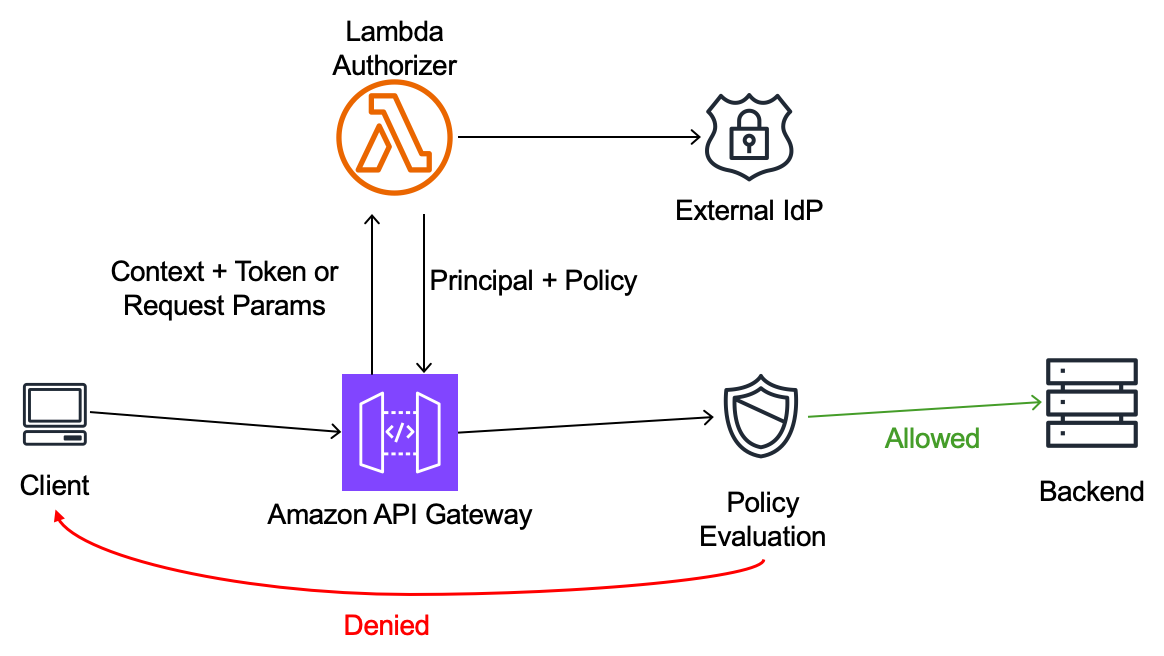
Sequence diagram of the OAuth 2.0 authentication flow using AWS Lambda authorizers

Figure 2: Sequence diagram illustrating the OAuth 2.0 authentication flow using AWS Lambda authorizers.

AWS Lambda authorizers take the caller’s identity as the input and return an IAM policy as the output. This architecture provides flexibility to implement sophisticated authorization logic while maintaining the simplicity of the API Gateway managed infrastructure. The team also deploys and manages the Lambda authorizer functions through Terraform, maintaining infrastructure as code (IaC) standards.

Developer Portal experience

The Amazon API Gateway Portal serves as the central hub for the API operations, providing developers using APIs with a streamlined experience.
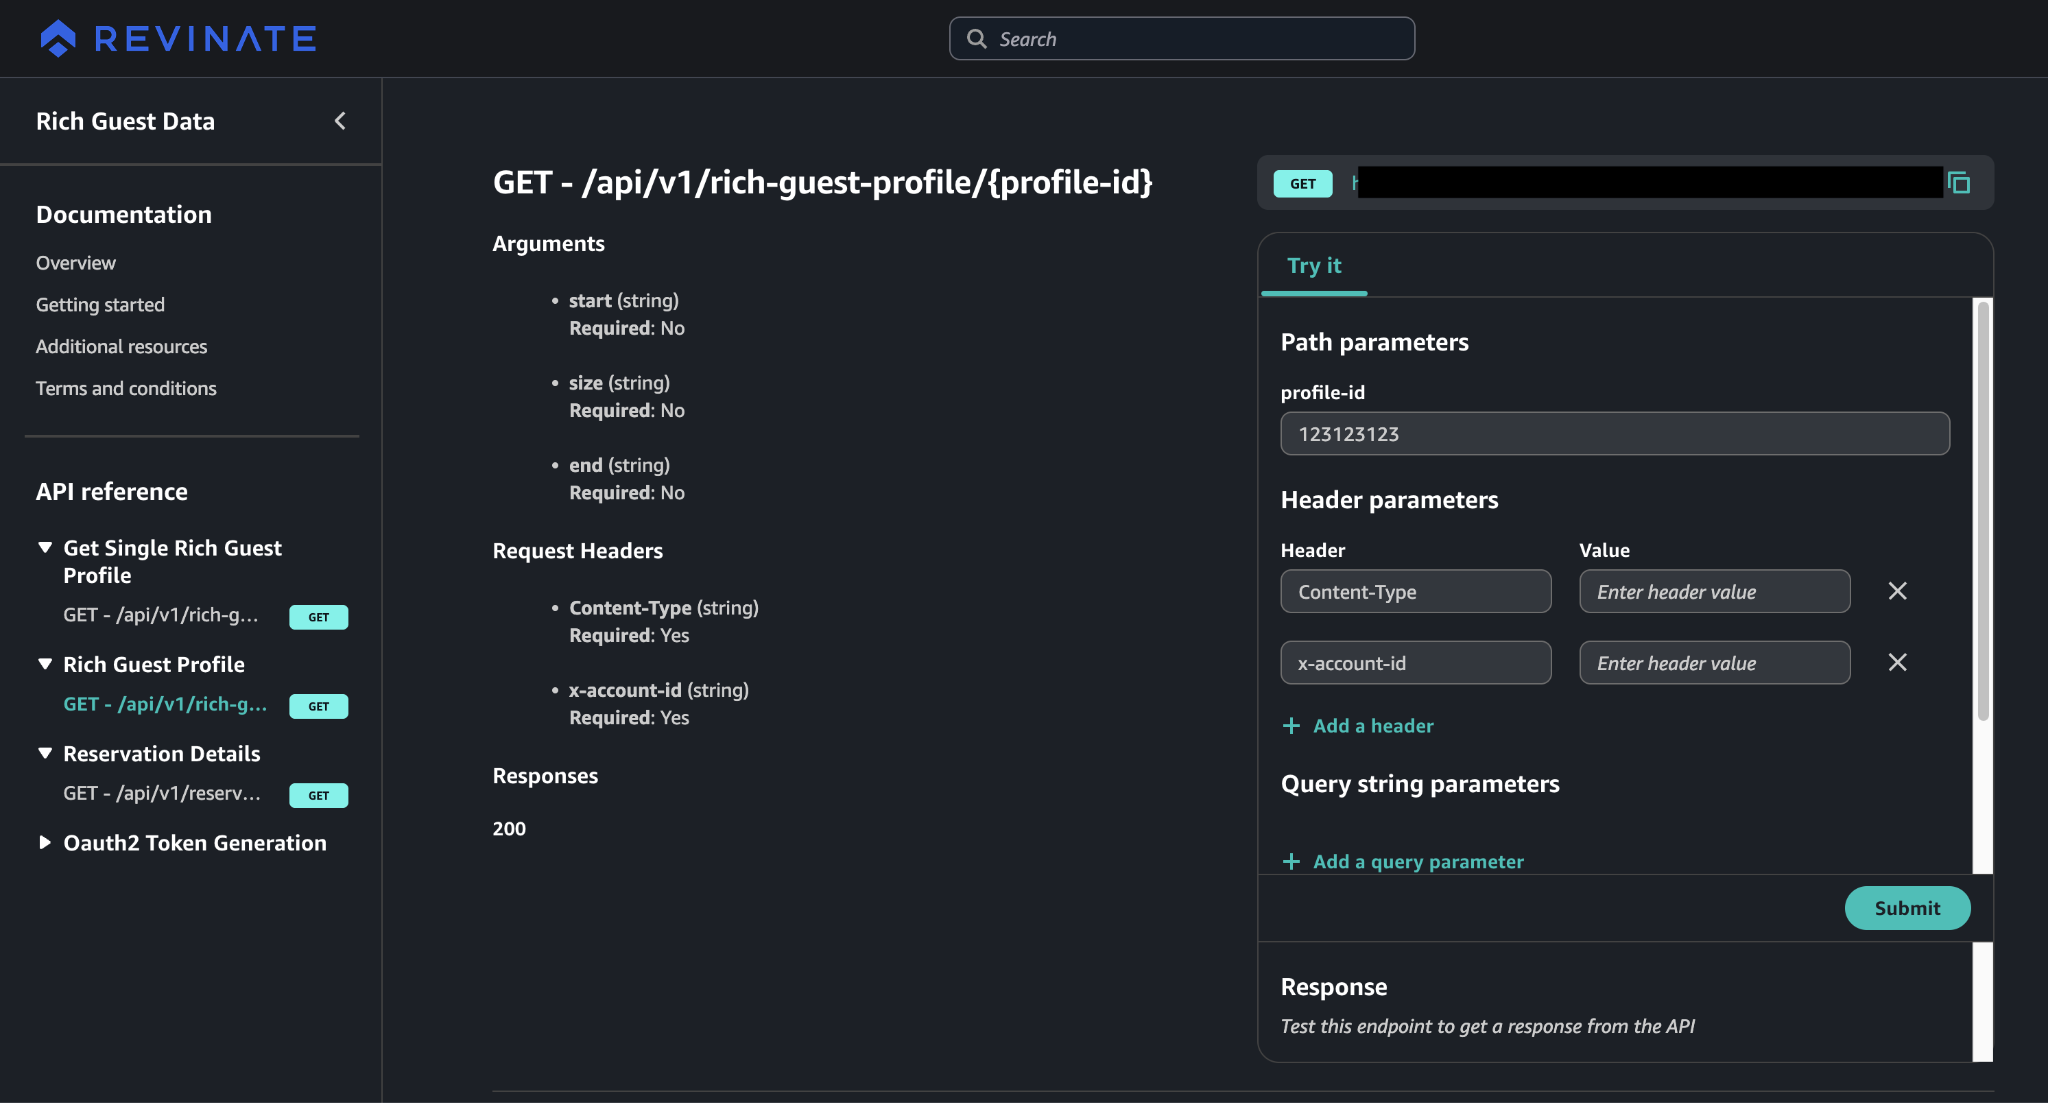
Developer journey through the Amazon API Gateway Portal showing API discovery, interactive documentation, and subscription management

Figure 3: User interface flow showing the developer journey through the Amazon API Gateway Portal, including API discovery, interactive documentation with try-it-now functionality, and subscription management.

Developers can:

  • Browse available REST APIs with comprehensive documentation.
  • Test API endpoints directly in the portal with interactive examples.
  • Access code samples and integration guides.

This self-service model reduced burden on support while accelerating customer time-to-value.

Results and benefits

The implementation of Amazon API Gateway and the Developer Portal delivered significant qualitative benefits across operational efficiency, developer experience, and business scalability.

Reduced operational overhead

By choosing a fully managed API gateway, the engineering team avoided the burden of maintaining, scaling, and troubleshooting self-hosted infrastructure. With the fully managed API gateway, the team can focus on core platform innovations that directly benefit hotel customers rather than undifferentiated gateway operations.

Improved developer experience

The centralized Developer Portal transformed the integration experience for hotel properties and partners. Self-service API discovery and interactive documentation reduced onboarding time from weeks to days. Developers consistently praised the professional portal experience and comprehensive documentation.

Accelerated customer onboarding

With the Developer Portal’s self-service capabilities, new customers can discover APIs and begin integration without waiting for manual provisioning or support intervention. This self-service approach positions Revinate to scale API access to hundreds of hotel properties and partners as demand grows.

Enhanced governance and control

The solution centralized control over API documentation, versioning, and access policies, verifying consistency across customer integrations. A single source of truth for API specifications removes documentation drift and reduces integration errors. Managing infrastructure through Terraform verifies changes follow proper review and approval processes.
Cost optimization

The pay-per-use pricing model aligns costs with actual usage and revenue generation. Usage plans and API keys provide per-consumer cost attribution, giving Revinate clear visibility into infrastructure spend by customer. As usage scales, tiered pricing verifies predictable cost growth that tracks with business value, replacing fixed licensing models that require upfront investment regardless of adoption.

Positioned for growth

The API layer, from Amazon API Gateway to the Developer Portal, scales automatically to meet demand without capacity planning or operational intervention. The team can confidently pursue growth targets knowing the API infrastructure will scale automatically.

Enhanced security posture

Amazon API Gateway provides strong security capabilities built into the platform, including centralized authentication and authorization mechanisms, request throttling and rate limiting to protect against abuse, and automatic threat protection through AWS Shield integration. Built-in security capabilities remove the need to build and maintain custom infrastructure while verifying consistent security policies across API endpoints. The centralized approach reduces the attack surface and provides comprehensive audit trails through CloudWatch integration, so the team can maintain robust security without additional operational overhead.

Key takeaways

The successful implementation of Amazon API Gateway and the Amazon API Gateway Portal offers valuable lessons for organizations exposing APIs to external customers and partners:

Managed services accelerate time-to-market – By using fully managed infrastructure and the new Amazon API Gateway Portal, the team avoided months of custom development work and launched the API program faster than would have been possible with self-managed alternatives.

Developer experience drives adoption – The professional, self-service Amazon API Gateway Portal significantly reduced friction in the customer onboarding process, so API access can rapidly scale as new hotel properties and partners onboard.

Infrastructure as code verifies consistency – Using Terraform for all production deployments provided the infrastructure team with version control, peer review, and audit trails while maintaining deployment consistency across environments.
Pay-per-use aligns costs with value – For organizations in growth mode, pay-per-use pricing removes the risk of overcommitting to fixed costs before achieving product-market fit with API offerings.

OAuth 2.0 delivers strong security at scale – Implementing OAuth 2.0 client credentials flow with an external identity provider enables a robust, scalable authentication foundation that grows securely alongside its expanding customer base.

Native AWS integration reduces complexity – For organizations already running on AWS, API Gateway’s native integration with services like EKS, Lambda, and CloudWatch minimizes architectural complexity and operational overhead.

Future enhancements

With the outbound API program successfully launched, the team is planning to extend API Gateway to inbound APIs, where partners push data into Revinate’s service. This will provide consistent security, monitoring, and governance across API traffic.

The team is also exploring advanced API Gateway features including request and response transformation, caching for improved performance, and deeper integration with AWS WAF for enhanced security against evolving threats.

Conclusion

Choosing Amazon API Gateway with the Developer Portal demonstrates how fully managed services can accelerate innovation while reducing operational complexity. By embracing AWS-native solutions and infrastructure-as-code practices, Revinate built a scalable, secure API program that supports growth as more customers get onboarded.

As the hospitality industry continues its digital transformation, this API-first approach positions them to empower hoteliers with the data and integrations needed to deliver exceptional guest experiences and drive direct revenue growth.

Next steps

Whether you’re in hospitality, software as a service (SaaS), healthcare, or any industry where partners and customers need programmatic access to your service, the pattern Revinate followed is broadly applicable. Start by mapping your business drivers to concrete technical requirements. This grounds your API gateway choices in outcomes, not only features. From there, explore Amazon API Gateway’s REST and HTTP API options to find the right fit for your traffic patterns and integration needs. Use the Amazon API Gateway Portal to give your developers a self-service onboarding experience from day one. If you’re already running workloads on AWS, the native integration with services like EKS, Lambda, and CloudWatch means you can build on your existing architecture rather than introducing new operational complexity. For teams that follow infrastructure as code practices, the Terraform AWS Provider for API Gateway helps you to define your entire API configuration as version-controlled code. To get started, visit the Amazon API Gateway documentation or reach out to your AWS account team for architecture guidance tailored to your use case and scale.
Resources


About the authors

Abe Raghib

Abe Raghib

Abe is a Solutions Architect at Amazon Web Services, where he helps ISV customers architect and implement scalable, secure solutions on AWS. He specializes in API architecture, serverless technologies, Agentic AI adoption, and developer experience optimization.

Giedrius Praspaliauskas

Giedrius Praspaliauskas

Giedrius is a Solutions Architect at Amazon Web Services, focusing on helping customers modernize their infrastructure and adopt cloud-native architectures. He has extensive experience with API management, microservices, and container orchestration.

Jakarry Williams

Jakarry Williams

As a Data Integration Manager at Revinate, Jakarry leads the Engineering Integration team, focusing on how data is ingested, transformed, and published across different platforms. He specializes in data integration architecture, transformation pipelines, and scalable data processing systems.

Satish Katpally

Satish Katpally

Satish is a Principal Product Manager at Amazon Web Services, focusing on building innovative application networking services. He is responsible for innovative application networking services, focusing on VPC Lattice.

Automating agentic AI Well-Architected reviews with the AWS Agentic AI Lens

Post Syndicated from Dinesh Subramani original https://aws.amazon.com/blogs/architecture/automating-agentic-ai-well-architected-reviews-with-the-aws-agentic-ai-lens/

In regulated industries, there’s no room for a move fast and break things approach, especially when AI agents are handling sensitive customer communications data. In this post, we show how Smarsh, a leading archiving and compliance platform for communications intelligence, used the AWS Well-Architected Framework’s Agentic AI Lens to conduct a rigorous, evidence-based review of its first agentic workload. The Agentic AI Lens is available today as prescriptive guidance, though it is not yet selectable as a lens in the AWS Well-Architected Framework.

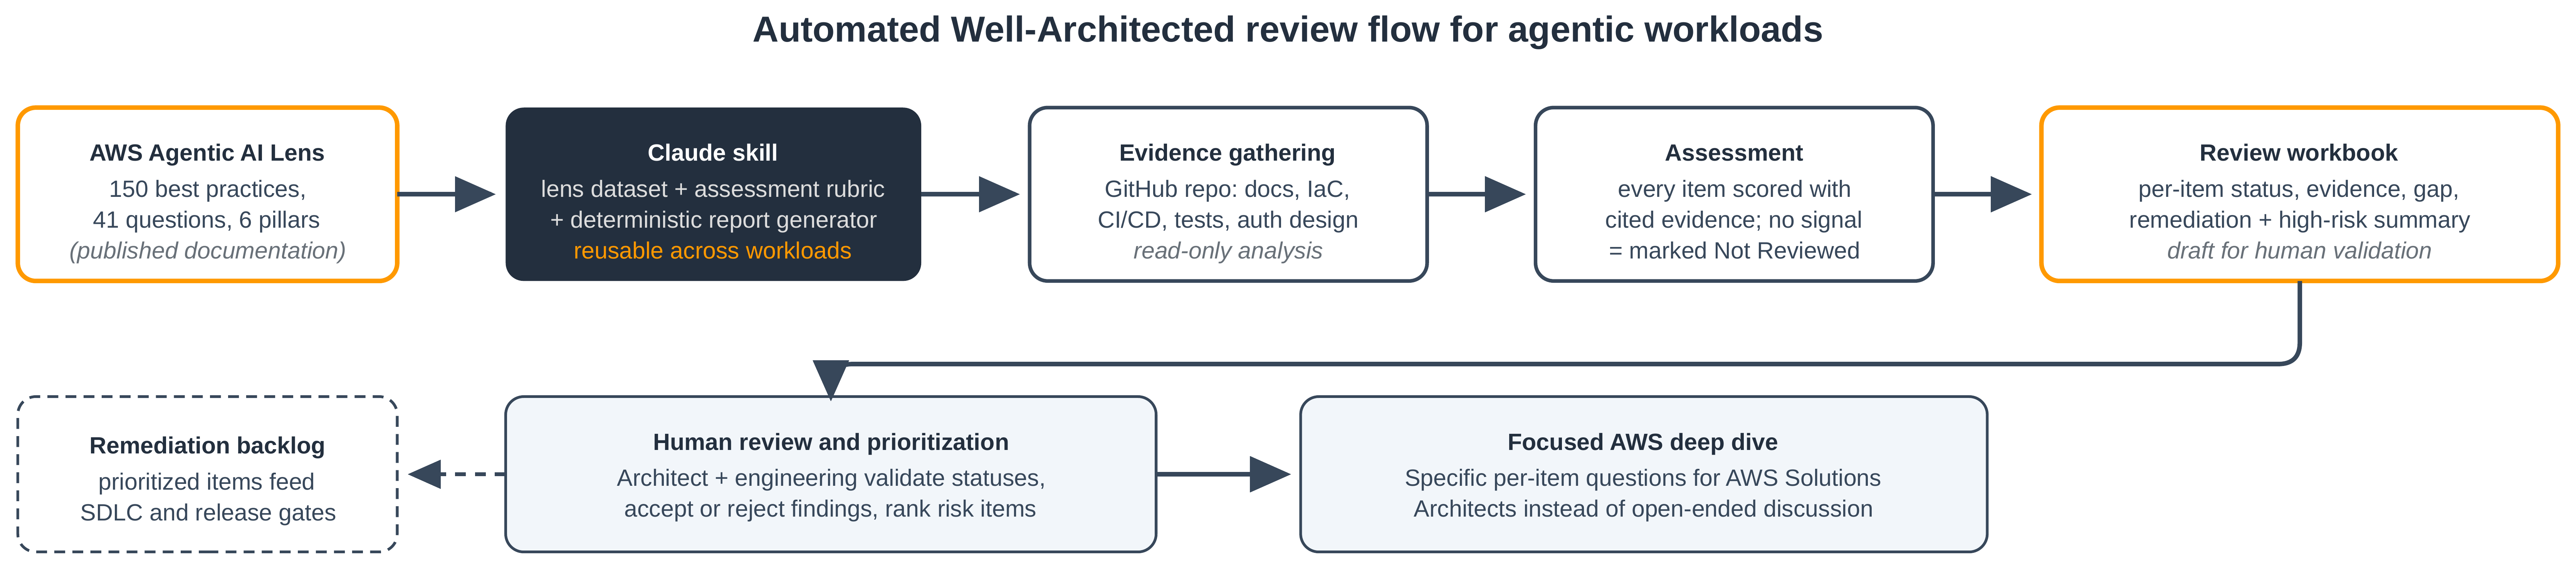
To operationalize the review, Smarsh built a custom skill for Claude, Anthropic’s AI assistant. The skill assessed the workload against all 150 best practices in the lens, pulling evidence directly from the workload’s GitHub repository and producing a comprehensive review workbook in hours rather than days. In this post, we walk through the skill’s architecture, the assessment methodology, how the team validated the skill itself, and how the resulting findings strengthened Smarsh’s engagement with its AWS account team.

About Smarsh

Smarsh is a recognized global leader in electronic communications archiving and digital communications governance. For over 20 years, the multinational software as a service (SaaS) company has enabled more than 7,000 organizations, from small businesses to large multinational financial institutions, to capture, retain, monitor, and analyze communications across 100+ channels, including email, mobile, voice, video, chat, and AI assistants, at scale. The company’s enterprise archive business runs on Amazon Web Services (AWS), and its next generation of AI capabilities are being built on Amazon Bedrock AgentCore, a platform to build, connect, and optimize agents at scale, with any framework or model. Smarsh uses AgentCore’s runtime, gateway, registry, and identity capabilities to power these solutions. A 2025 AWS Partner of the Year Award winner, Smarsh holds a deep partnership with AWS.

Prerequisites

To follow along with the approach described in this post, you need the following:

  • An AWS account with access to Amazon Bedrock and Amazon Bedrock AgentCore.
  • Familiarity with the AWS Well-Architected Framework and its lens model.
  • A GitHub repository containing your agentic workload’s source code, infrastructure definitions, and documentation.
  • Access to Claude (Anthropic’s AI assistant) with the ability to install custom skills.

The challenge: A lens you can read, but not run

Smarsh operates in a highly regulated industry where compliance and security are paramount. Every agentic solution must pass a Well-Architected review before it reaches an end customer. So when a Smarsh architect set out to review the company’s first multi-agent workload, the natural choice was the AWS Well-Architected Framework’s Agentic AI Lens. That workload is an intelligent agent review system for compliance alerts built on the runtime, gateway, registry, and identity capabilities of Amazon Bedrock AgentCore.

The Serverless Applications Lens and other lenses can be added directly in the AWS Well-Architected Tool. The Agentic AI Lens, by contrast, existed only as published documentation: 150 best practices across 41 questions and six pillars, each with a risk level and a desired outcome, but with no way to run the review natively on the console. That left two apparent options: a multi-day manual effort in which every reviewer structured the assessment differently, or waiting for console support. Smarsh chose a third: make the lens executable, in a way every future workload could reuse.

Solution architecture: The lens as data, the reviewer as a skill

Smarsh packaged the review process as a Claude skill: a versioned bundle of instructions, reference data, and executable scripts that Claude discovers through a frontmatter description and loads on demand. Progressive disclosure keeps the token cost near zero until a review is actually requested. The skill has three components:

  • lens_data.json – All 150 best practices from the published lens documentation, extracted into a structured JSON dataset: best-practice ID, pillar, review question, title, risk level (90 High, 59 Medium, 1 Low), and desired outcome. Risk levels were cross-validated against the lens appendix to catch extraction errors. This dataset is the single source of truth, and the skill is instructed never to invent or renumber items.
  • assessment-guide.md – A five-value status rubric (Compliant, Partially Compliant, Non-Compliant, Not Applicable, and Not Reviewed), an evidence-gathering checklist, per-pillar signals to look for, and a set of honesty rules. The checklist covers README and architecture docs, decision records, infrastructure as code, continuous integration and continuous delivery (CI/CD) workflows, and test and evaluation suites. Every status must cite evidence found in the repository, items with no signal are marked Not Reviewed rather than guessed, and the same underlying fact must produce a consistent status wherever it appears across pillars.
  • build_report.py – A deterministic Python script (openpyxl) that renders the model’s assessment into a formatted workbook. The generator validates its input, so unknown best-practice IDs or invalid statuses abort the build and hallucinated items cannot silently ship. The output includes per-item status with data-validation dropdowns and conditional formatting. It also provides columns for cited evidence, gaps, and remediation, plus a summary sheet whose pillar counts and high-risk exposure tracker are live COUNTIF formulas rather than hardcoded numbers.

The assessment contract between the reasoning and the rendering is in a single JSON document:

{
  "AGENTSEC08-BP01": {
    "status": "Partially Compliant",
    "evidence": "Two-stage input validation (JSON Schema + Pydantic); 5 MB payload cap; typed prompts.",
    "gap": "No prompt-injection screening on message content.",
    "remediation": "Add injection screening; treat communication text as untrusted data in prompts."
  }
}

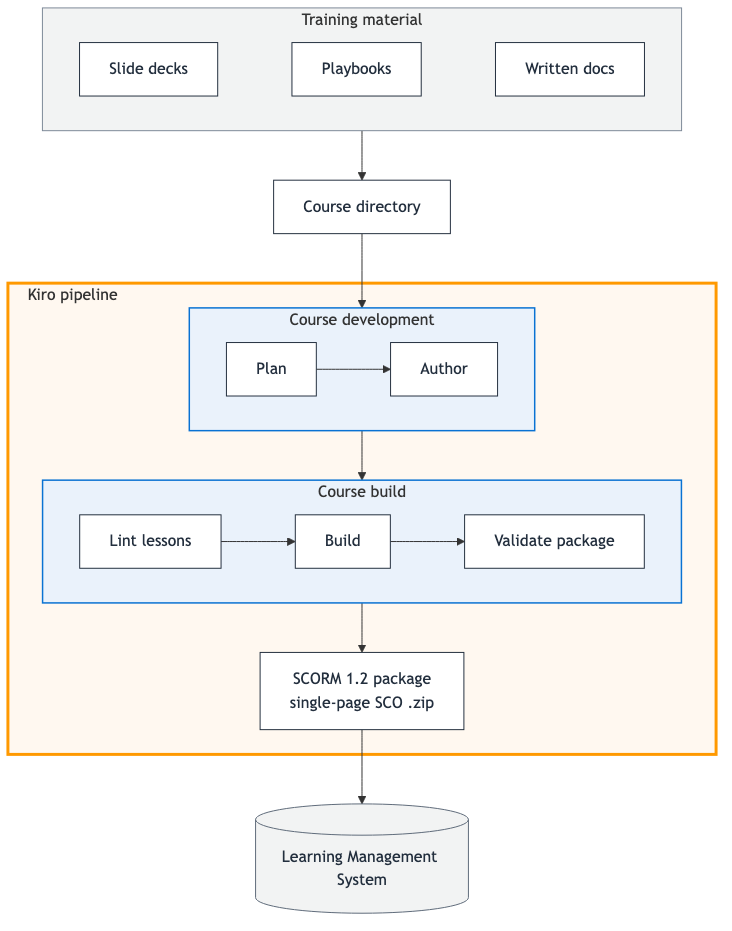
Running a review is a one-line request: point Claude at a repository and ask for a Well-Architected review. From there, the skill drives the following workflow:

  1. Claude loads the skill and reads the frontmatter description to understand the review scope and methodology.
  2. The skill pulls the lens_data.json dataset containing all 150 best practices across six pillars.
  3. Claude gathers evidence read-only from the target repository: README, architecture docs, infrastructure-as-code, CI/CD workflows, and test suites.
  4. The skill assesses all 150 items against the gathered evidence, applying the five-value rubric and honesty rules from assessment-guide.md.
  5. Claude calls build_report.py to generate the formatted workbook, validating row counts and flagging blank statuses.
  6. The skill returns an executive summary of the top high-risk gaps.
  7. Human reviewers validate findings, feed a remediation backlog, and surface open system questions for a focused AWS deep dive.
A flow chart of Automated Well-Architected reviews for agentic workloads

Figure 1: From published lens documentation to an evidence-backed review workbook

Testing the tester: Evaluating the skill before trusting it

Smarsh evaluated the skill before relying on its output. The team built two synthetic fixture repositories: a moderately mature LangGraph-style workload and a deliberately rough proof of concept, complete with hardcoded credentials and a runaway-cost incident in its history. The team ran reviews both with and without the skill. Each run was graded against eight verifiable expectations per fixture: all 150 lens items present, no blank statuses, evidence cited for every definitive status, honest calibration, and fixture-specific findings such as the hardcoded credential being flagged. With the skill, runs passed 16 of 16 expectations. Baseline runs without it passed only 8 of 16, producing ad-hoc 18–39 item checklists with no lens traceability. The eval set ships inside the skill, so regression testing continues as the skill evolves.

What the first review found

Against the real workload, the skill read the repository’s architecture and authentication documentation, AWS Cloud Development Kit (AWS CDK) infrastructure definitions, GitHub Actions workflows, registry and gateway design records, and test suites. The skill then assessed all 150 items in hours. The workbook showed a credible mix of strengths and gaps. Strengths included per-agent AWS Identity and Access Management (IAM) execution roles scoped to named runtime Amazon Resource Names (ARNs) and SigV4-signed Model Context Protocol (MCP) calls through AgentCore Gateway, a capability of Amazon Bedrock AgentCore. The workbook also recorded schema-validated inputs with typed error contracts, exported decision audit trails, and continuous quality monitoring through AgentCore online evaluations. High-risk gaps included the gateway ingress authorizer running with authentication disabled under a documented risk acceptance, no prompt-injection screening on bad actor-influenced message content, rate limiting recorded as a TODO, and no automated cost controls. Each gap was tied to the lens item, the evidence, and a recommended remediation.

Next, the Smarsh architect brought in the engineering team. Together they triaged the findings, validating statuses against what the team knew, accepting or challenging results right in the workbook, and ranking the remediation backlog. Engineering’s input reshaped the review: several items collapsed into one anomaly-detection epic, and a single finding was upgraded once the team pointed to evidence the repository had overlooked. Dependency scanning was already running on every pull request.

Sharper questions, better AWS engagement

Triage surfaced a class of gaps no repository can answer: system-semantics questions about the AWS services themselves. Rather than booking a general architecture review, the team built a focused agenda for its AWS Solutions Architects, mapping each question to the checklist item it would close. The agenda covered:

  • The durability and consistency of AgentCore runtime, a capability of Amazon Bedrock AgentCore, as a session checkpoint store.
  • The retry and idempotency semantics of the InvokeAgentRuntime API.
  • Break-glass patterns for halting agent invocations.
  • Amazon Bedrock Guardrails patterns for screening untrusted content.
  • Penetration-testing rules of engagement for Amazon Bedrock AgentCore.
  • Amazon GuardDuty and AWS CloudTrail coverage for agentic-runtime threat detection.

The deep dive became a working session with a definition of done.

Why AWS

The security and compliance posture of Amazon Bedrock and Amazon Bedrock AgentCore, spanning runtime, gateway, registry, identity, and evaluation capabilities, meets the bar Smarsh’s regulated customers expect. The AWS Well-Architected Framework already anchors how Smarsh evaluates workloads. Extending it to agentic AI through the published lens, and pairing automated reviews with AWS Solutions Architect expertise to close the hard gaps, is a natural continuation of how the two teams work together.

Results and expected outcomes

These numbers reflect Smarsh’s first internal uses and the outcomes the team is tracking toward.

  1. Review effort – A complete 150-item, evidence-cited draft in hours instead of a multi-day manual effort, with human time refocused on validation and prioritization.
  2. Comparable reviews – Every workload produces the same standardized workbook, which Smarsh expects to translate into faster security approvals and improved time-to-market for agentic solutions.
  3. Sharper use of AWS expertise – Instead of broad discussions, AWS engagements became itemized working sessions, each mapped to a specific best-practice gap.

What’s next

  1. Publish the skill internally as the standard evaluation tool for Smarsh agentic workloads. It has been contributed to the company’s internal AI-SDLC plugin marketplace and has already been run against a second, architecturally different agentic repository.
  2. Bake reviews into the software development lifecycle so well-architected checks run continuously during development, not as a one-time gate at the end.
  3. Enforce governance by making the review workbook required evidence in Smarsh’s project milestone and gate process before agentic workloads reach production.
  4. Expand the lens-as-data pattern to other AWS Well-Architected lenses and additional repositories, eventually covering the broader application portfolio.

Conclusion

The gap Smarsh hit, prescriptive guidance published faster than console tooling can absorb it, is one many customers will meet as agentic AI best practices evolve. The answer generalizes: treat the lens as data, encode the reviewer’s discipline as a skill with enforced honesty rules, validate the tool with its own evaluation suite, keep humans on judgment, and let findings drive precise conversations with AWS. A review that once implied days of manual effort is now a repeatable capability the whole organization can run, before, not after, an agentic workload meets a regulated customer.

To get started:

We’d love to hear how you’re approaching Well-Architected reviews for your own agentic workloads. Share your experience in the comments, or reach out to your AWS account team to get started.


About the authors

Dinesh Subramani

Dinesh Subramani

Dinesh Kumar Subramani is a Principal Machine Learning Architect at Smarsh, leading generative AI, agentic AI and MLOps architecture. He designs scalable AI platforms and guides the end-to-end AI lifecycle, from experimentation to secure, governed production deployment.

Raghu Talakola

Raghu Talakola

Raghu is a Principal Solutions Architect at Amazon Web Services supporting Smarsh.

[$] The campaign to push Northstar into Linux distributions

Post Syndicated from jzb original https://lwn.net/Articles/1102738/

There is not a broad selection of mature, open-source web-browser engines
for Linux users. Most of the browsers available for Linux are based on one of
just three projects: Chromium’s Blink, Firefox’s
Gecko, or WebKit. A new entrant would
generally be seen as a welcome alternative, but the recent campaign to push one
of the LLM-written Nordstjernen browsers
into Debian and Arch Linux has raised some questions about
the project’s development and security processes.

Redox OS ring buffers project summary

Post Syndicated from jzb original https://lwn.net/Articles/1103359/

The Redox OS project, which is a
Unix-like microkernel-based operating system written in Rust, has published a report on the work
that it has done in the last year to implement io_uring-like
I/O
.

Last year, the Redox team received a grant to develop io_uring-like Ring
Buffer support at the system task level, as a first step towards ring buffer
communications between the application and the majority of system services. This
phase of the work finished up in September, as the last pieces were put in
place.

[…] In addition to implementing the Ring Buffer machinery for our system
services and drivers that can support it, an io_uring and
liburing-like API for applications was completed and
demonstrated. There was also substantial work done on support crates, including
an async executor for drivers.

And there was some very exciting work on various performance improvements, to
allow much faster switching between applications and their system services. But
I will let the team tell you all the technical details.

That’s a wrap! Coolest Projects 2026

Post Syndicated from Helen Gardner original https://www.raspberrypi.org/blog/thats-a-wrap-coolest-projects-2026/

There are a few Coolest Projects events still to come in the Coolest Projects 2026 cycle, but we are already getting ready to kick off Coolest Projects 2027. Before we do, we’re taking a  look back at some of the incredible things the young tech creators in the global Coolest Projects community have achieved this year, both through the online showcase and at in-person events around the world. 

More than 15,000 young people from 40 countries shared over 4500 creations in the Coolest Projects online showcase. The Coolest Projects team hosted events in the UK, Ireland, India, and two locations across the US, while our partners brought creators together at in-person events in a further 11 countries, with events in Malaysia, South Africa and Argentina still to come.

With young people sharing their brilliant ideas, ambitious projects, and creativity with the world, 2026 has been a year to remember, and we can’t wait to see what comes next!

But don’t just take our word for it — hear from members of the Coolest Projects community about their experiences too.

Three young tech creators at a Coolest Projects event

From the community

For some, the events are about celebrating a shared passion for making with family and friends.

“I went to Coolest Projects last year with my cousins and thought it was cool, so I wanted to apply this year. I was very late applying so only had 3 days to create a project before the deadline. It was pretty intense! My highlight was being at the event with my cousin, Noah. It was great fun!” – Leo, creator, Coolest Projects Ireland

It’s not just creators who enjoy being part of the community. Mentors take away lasting impressions and a feeling of connection too.

“We usually avoid competitions because coding’s about curiosity, creativity, and sharing knowledge, not racing against each other. But Coolest Projects is completely different: it’s like one big party where everyone’s invited to share what they’ve made. We’re so grateful Project Code Cloud got to be part of it.” – Dannielle, Coolest Projects mentor, Australia

We are also very thankful to our VIP judges, who encourage and give feedback to creators both in the online showcase and at in-person events. Ben, a VIP judge for the online showcase, shared some powerful advice with creators:

“Keep building. Keep experimenting. Keep trying things. […] Always stay curious. Always try to stay learning. […] And the most important thing is it’s OK to fail. Trying new things is difficult and you’re always going to make mistakes, but that’s the best way to learn.” – Ben Powley, Senior Developer, Jagex

Catch up on the livestream to hear advice and feedback from all the VIP judges involved in the online showcase this year and check out their favourite projects.

Some more highlights from 2026

A judge who’s been in their shoes

Akari, a 16-year-old CoderDojo member from Japan who has showcased her own projects at Coolest Projects seven times, joined us as a VIP judge for the online showcase. We were delighted that young creators could hear a genuine peer voice on the panel, alongside industry judges, offering inspiration and encouragement.

This year’s Broadcom Coding with Commitment® recipient

The Broadcom Coding With Commitment® award is a special recognition for a creator who uses coding to support their community through a project that aligns with the United Nations Sustainable Development Goals. In this year’s online showcase, the award went to Egehan from Türkiye, for their Scratch project Viridia — Back to the World, an educational game that teaches players about water conservation. Egehan shared some thoughts about the challenges they faced while building it:

“Writing the code I used to create the 3D visuals for this game was a bit of a challenge for me. I would often dream about the mathematical calculations required for the code (which, to be honest, was quite interesting).” – Egehan

Partner events around the globe

With 14 partner events due to have taken place around the world by the end of 2026, more creators than ever before have been able to share their projects and connect with a like-minded community locally. Here are a few highlights from the events.

The first event of the year was Coolest Projects Belgium, which took place in March and was organised by CoderDojo Belgium. Ruhee, Global Partnerships Coordinator at the Raspberry Pi Foundation, who attended the event, was particularly impressed by Zeno and Lukas’s Orbitol 6 project, a three-axis robotic arm they’ve been developing for several years, with plans to take it from three axes to six in the future! She also highlighted Jack’s Moppentrappen, a joke-telling project that uses AI to replicate Jack’s voice, allowing it to tell jokes in French as well as English.

Coolest Projects Japan, organised by CoderDojo Japan, was also held in March and welcomed 79 entries, which you can explore here.

Coolest Projects Sudan, organised by Orientations Training Centre, ran for the second time this year. The event was held in Egypt and was designed to provide a safe and accessible space for young Sudanese people affected by displacement. Among the projects on display was an AI-based fruit freshness detector, built by 7-year-olds Khalid and Nour.

“This showcase reflects our belief that Sudan’s future depends on empowering young people to learn, create, and solve problems. We are committed to building the opportunities and platforms they need to shape a better future for Sudan.” – Abbdelmoneim M. Ahmed, CEO, Orientations Training Centre

Coolest Projects Sudan

Looking ahead to 2027

We are excited to share that the Coolest Projects 2027 online showcase will open for entries in January, and the Coolest Projects online showcase celebration will take place on 23 June. 

We’ll also be running in-person Coolest Projects events in Ireland, the UK, India, the US, South Africa, and Kenya next year, with further in-person events due to be run by partners around the world. We will announce the full calendar of in-person events soon. 

You can already save the date for:

Coolest Projects Belgium — 13 March 2027

Coolest Projects USA Minnesota — 17 April 2027

Coolest Projects Ireland — 24 April 2027 at Explorium, Dublin

Coolest Projects UK Bradford — 15 May 2027 at Life Centre, Bradford

Coolest Projects USA Georgia — 15 May 2027

Coolest Projects UK Cardiff — 22 May 2027 at Wales Millennium Centre, Cardiff

Coolest Projects global showcase celebration — 23 June 2027, online

If you would like to be first to hear news and dates for the 2027 online showcase and in-person events, sign up to our newsletter or follow the Coolest Projects social channels (find us on LinkedIn, Facebook, and Instagram).

The post That’s a wrap! Coolest Projects 2026 appeared first on Raspberry Pi Foundation.

How LIU and Zabbix Make Enterprise-Grade Monitoring Accessible

Post Syndicated from Hadi Slim original https://blog.zabbix.com/how-liu-and-zabbix-make-enterprise-grade-monitoring-accessible/33738/

The Lebanese International University (LIU) conducts applied networking research aimed at making professional-grade monitoring practices accessible in academic settings through its Department of Computer and Communication Engineering.

The department recently completed a research project that explored how Zabbix could be used to monitor a fully virtualized network environment, with the goal of offering a model that any academic or training lab could adopt.

The challenge

Networking education broadly relies on physical lab equipment (routers, switches) that is expensive to acquire, maintain, and scale, putting realistic, hands-on monitoring practice out of reach for many programs.

The research set out to test whether a simulated network environment could be monitored exactly as one would monitor production infrastructure – collecting live metrics, visualizing device health, and practicing remote management, while operating on a budget appropriate for an academic lab.

The solution

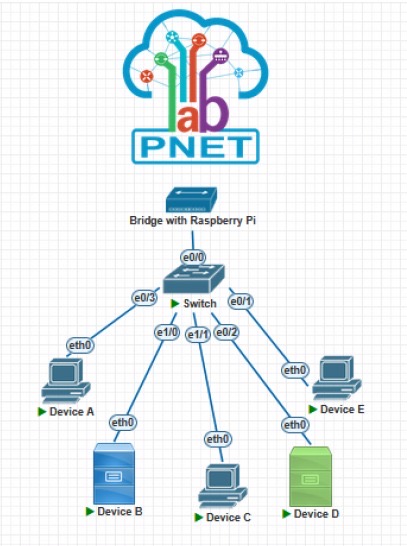
The team built a virtual network topology in PNETLab (routers, switches, and end devices using multi-vendor images) and connected it to a Zabbix server running on a low-cost Raspberry Pi 5.

Each virtual device was assigned IP addressing compatible with the Zabbix monitoring network, allowing Zabbix to poll the simulated devices via SNMP and ICMP exactly as it would poll physical infrastructure, which in turn allowed students to understand more how the infrastructure is behaving based on these polls.

This demonstrated that students and researchers can interact with a monitoring stack that behaves identically to an enterprise deployment, entirely on virtualized, reproducible lab infrastructure that costs a fraction of physical networking gear.

The results

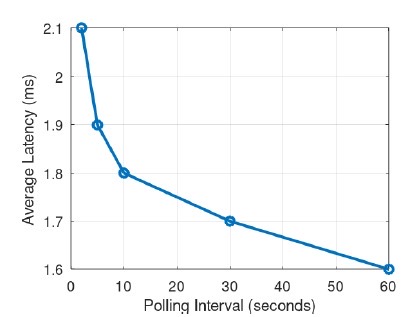
The integration proved that a virtual topology is indistinguishable from a physical one from Zabbix’s perspective – polling latency across 10 simulated devices averaged just 2.5ms, with the Raspberry Pi host staying under 15% CPU usage throughout testing.

The result was a reproducible, low-cost training model where networking and monitoring concepts can be taught hands-on, repeated across cohorts, and scaled by simply adding more virtual nodes in PNETLab rather than purchasing additional hardware – one that other academic institutions facing the same budget constraints could replicate directly.

In conclusion

By combining Zabbix, PNETLab, and a Raspberry Pi 5, the team at LIU created a low-cost, reproducible virtual lab that delivers hands-on monitoring experience without the expense of physical networking equipment.

With polling latency averaging just 2.5 ms across 10 simulated devices and CPU usage remaining below 15%, the results highlight the potential of virtualized environments for teaching real-world networking and monitoring skills.

Most importantly, this approach provides a practical, scalable model that other academic institutions can adopt to make hands-on IT infrastructure monitoring more accessible to the next generation of networking professionals.

For a more in-depth look at LIU’s project or to cite the published research, visit this website.

To find out more about what Zabbix can do for eduactional institutions, contact us.

The post How LIU and Zabbix Make Enterprise-Grade Monitoring Accessible appeared first on Zabbix Blog.

Introducing Route 53 Resolved IP Validation for AWS Network Firewall

Post Syndicated from Lawton Pittenger original https://aws.amazon.com/blogs/security/introducing-route-53-resolved-ip-validation-for-aws-network-firewall/

Your workloads reach most destinations by domain name, but a firewall can only act on what it sees in the traffic. For HTTP and HTTPS, AWS Network Firewall domain rules match the name that the client puts in the request, and the client chooses that name. The connections for protocols such as SSH and SSH File Transfer Protocol (SFTP) don’t carry the domain name. The client uses the name only for the DNS lookup and then connects straight to the IP address that DNS returned. As a result, Network Firewall rules for these protocols have used IP addresses, which change over time. For web and non-web traffic alike, Network Firewall had no view of the answers that your DNS resolver returned, because that shared visibility between DNS and the firewall didn’t exist.

On October 21, 2026, we launched Route 53 Resolved IP Validation for AWS Network Firewall, at no additional charge. Amazon Route 53 Resolver now shares the IP addresses that it returns for each domain name with Network Firewall, and Network Firewall checks each new outbound connection against them. With this launch, you can now filter non-web traffic by domain name, and you can prevent Server Name Indication (SNI) manipulation on TLS traffic without needing to enable TLS inspection.

In this post, we explain how the feature works, show how to turn it on in alert mode, and walk through two common use cases. They’re examples; the same check applies to any outbound traffic that you control by domain name.

How it works

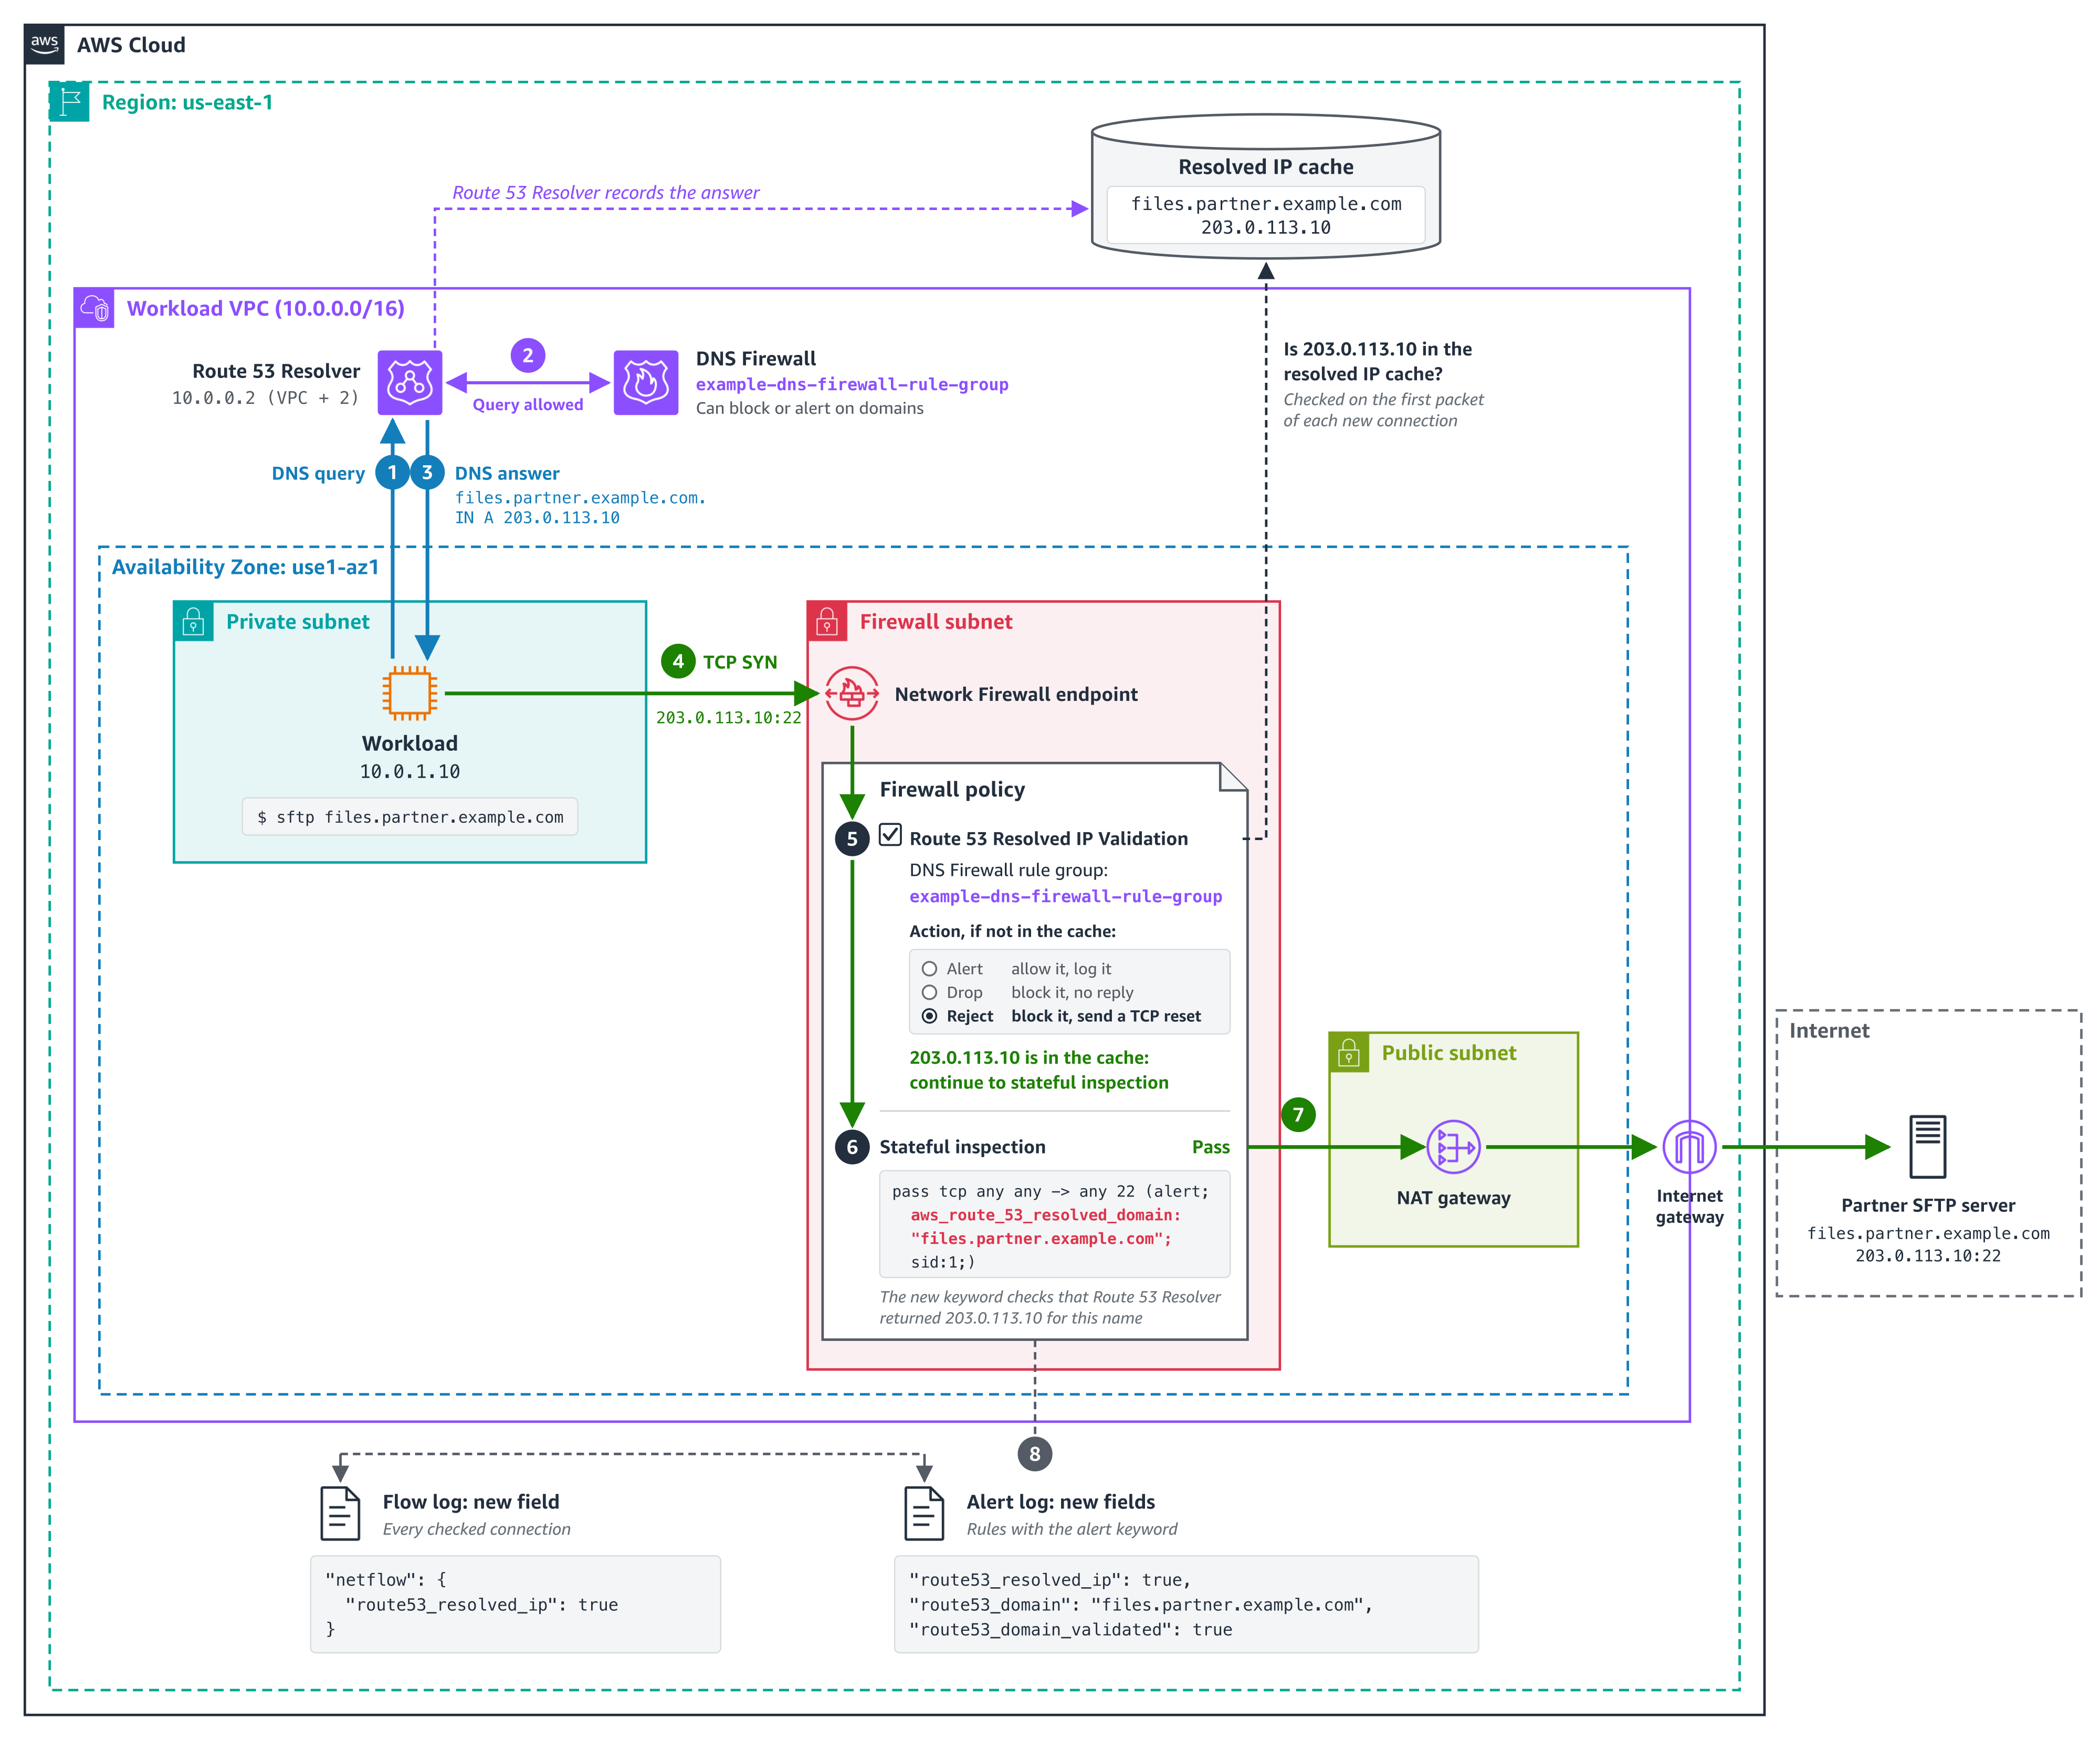
Amazon Route 53 Resolver answers DNS queries from resources in your virtual private cloud (VPC) configured to use it, and it’s available by default in every VPC. With this feature, Route 53 Resolver keeps the IP addresses that it returns for each domain name in a resolved IP cache. When a new outbound connection starts, Network Firewall checks the destination address against that cache.

  1. The workload asks Route 53 Resolver at 10.0.0.2 for files.partner.example.com.
  2. DNS Firewall checks the query first. Domain rules can block or alert on it; an empty rule group lets it through.
  3. Route 53 Resolver answers 203.0.113.10 and records the answer in the resolved IP cache.
  4. The SFTP connection to 203.0.113.10 on port 22 reaches the Network Firewall endpoint.
  5. The policy checks the first packet. The address is in the cache, so the connection continues.
  6. The stateful rule passes it, because Route 53 Resolver returned the address for files.partner.example.com.
  7. The connection leaves through the NAT gateway and internet gateway.
  8. The flow log and alert log record the new fields.

The feature has three parts:

  • An Amazon Route 53 Resolver DNS Firewall rule group – It defines the scope. The answers that Route 53 Resolver returns in every VPC associated with this rule group go into the resolved IP cache. The rule group can be empty. Add rules to it and the same rule group also filters the DNS queries themselves, for example, by blocking lookups of known threat domains. Together, DNS Firewall checks the lookup and Network Firewall checks the connection that follows.
  • The Network Firewall policy setting – On the first packet of each new connection, before your stateful rules run, Network Firewall checks whether Route 53 Resolver returned the destination address for a domain name. If it did, the connection continues to your stateful rules. If it didn’t, Network Firewall applies the action you chose: Alert, Drop, or Reject.
  • Resolved-domain rules – In your stateful rule groups, these rules match a connection by the domain name that its destination address was resolved for, so they work with every protocol. Use the name that your clients look up.

The following diagram shows this architecture.

Figure 1. How Network Firewall checks the SFTP connection from use case 1 against the answers that Route 53 Resolver returned

Figure 1. How Network Firewall checks the SFTP connection from use case 1 against the answers that Route 53 Resolver returned

The policy setting checks every connection, not only web traffic. A connection to an IP address that no client looked up through Route 53 Resolver, such as a hardcoded address, fails the check. If any of your workloads connect straight to IP addresses, add those addresses to Bypass destination validation IP ranges before you enforce. A stateful pass rule doesn’t exempt them because the policy check runs before your rules. The check is per address: when any client in an associated VPC looks up a name, its addresses pass the check for every client in scope in the same Availability Zone. For details, see Resolved IP validation in AWS Network Firewall in the AWS Network Firewall Developer Guide.

Prerequisites

To follow along, you need:

  • DNS through Amazon Route 53 Resolver – Network Firewall can check only answers that Route 53 Resolver returned. Queries that reach Route 53 Resolver through Resolver endpoints or Resolver forwarding rules count.
  • A Route 53 Resolver DNS Firewall rule group associated with the VPCs whose DNS answers Network Firewall should check connections against.
  • The policy setting turned on before you add resolved-domain rules – Rules that use domain filtering (the aws_route_53_resolved_domain keyword) need Route 53 Resolved IP Validation turned on in the same firewall policy. Turn the setting on first, in alert mode, then add the rules.
  • A supported deployment model – The feature works with distributed deployments, including multiple firewall endpoints, where clients reach a firewall endpoint in their own Availability Zone, and with centralized deployments where the firewall is attached natively to AWS Transit Gateway. If routing sends a client to a firewall endpoint in another Availability Zone, its connections fail the check. To move a centralized deployment to a natively attached firewall, see Why and how to migrate to a Transit Gateway attached AWS Network Firewall.

How to turn it on in alert mode

Start in alert mode because clients cache DNS answers. Network Firewall recognizes only the answers that Route 53 Resolver returns after the DNS Firewall rule group is associated with the VPC and selected in the policy. A client that still uses an answer it cached earlier fails the check until it looks up the name again, usually when its cached record expires. Alert mode lets you see this without blocking anything. Allow about 24 hours in alert mode for clients to refresh their caches.

  1. Create a DNS Firewall rule group (it can be empty) and associate it with the VPCs whose DNS answers Network Firewall should check connections against. For the steps, see Creating a rule group and rules.
  2. Or, to use a DNS Firewall rule group that you already have, make sure it’s associated with those VPCs and only those. An answer returned in any associated VPC is valid for every client that the firewall checks. Which clients are checked is set by source IP ranges in step 6.
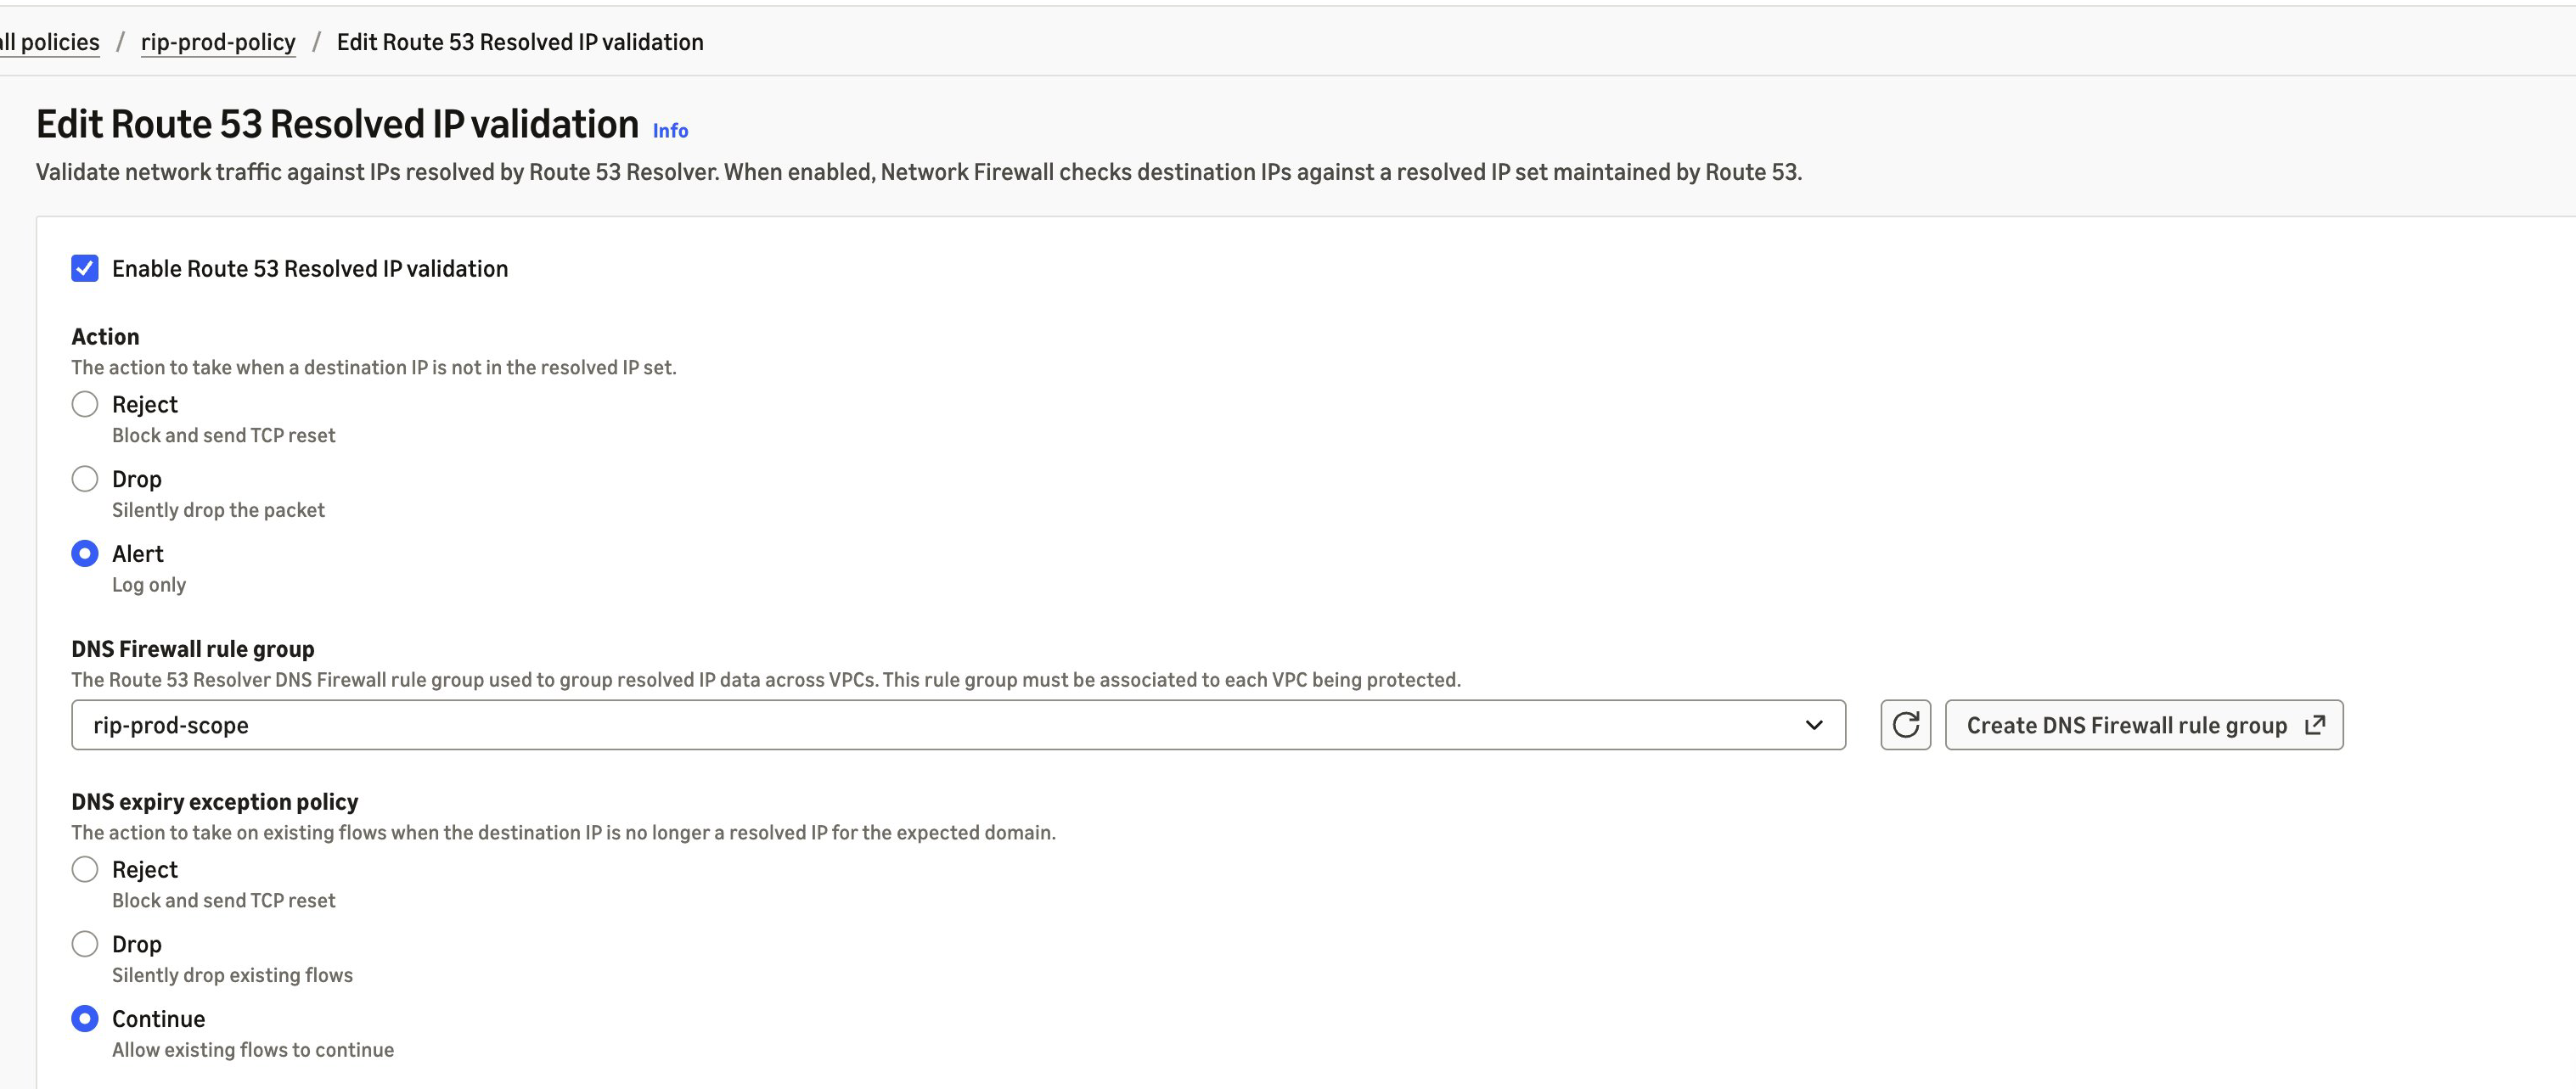
  3. In the Amazon Virtual Private Cloud (Amazon VPC) console, under Network Firewall, choose Firewall policies, then choose the policy that your firewall uses. On the Traffic inspection tab, in the Route 53 Resolved IP validation section, choose Edit and select Enable Route 53 Resolved IP validation.
  4. For Action, choose Alert. For DNS Firewall rule group, choose the rule group from step 1 or 2.
  5. For DNS expiry exception policy, choose what happens to a connection that’s already open when its entry expires from the resolved IP cache. Continue keeps it running, Drop stops it silently, and Reject stops it with a TCP reset. We recommend Continue so that long-running sessions, such as file transfers, aren’t cut off midway. However, choose the option that fits your security requirements.
  6. For source IP ranges, list the clients to check. If you don’t set it, Network Firewall checks clients in the firewall’s VPC and in any additional VPCs attached to the firewall. If your clients are in other VPCs, such as spoke VPCs that send traffic to a firewall attached to a transit gateway, enter their CIDR ranges; otherwise, Network Firewall doesn’t check their connections. Add destinations that you allow by IP address to Bypass destination validation IP ranges. Choose Save.

The following screenshot illustrates these steps.

Figure 2. Route 53 Resolved IP Validation turned on in alert mode

Figure 2. Route 53 Resolved IP Validation turned on in alert mode

In alert mode, Network Firewall doesn’t block a connection that fails the check, and it doesn’t write an alert of its own. It records the result in your flow logs, in the route53_resolved_ip field of each connection. A value of true means Route 53 Resolver returned the destination address for a domain name. A value of false means it didn’t, so enforcement would block the connection. The same field also appears in alert log records that a rule or the policy’s default action writes for the connection. Pass rules don’t write one unless they have the alert; keyword. The DnsUnresolvedFlows metric in Amazon CloudWatch counts the connections that fail the check, and DnsAzUnavailableFlows counts connections from an Availability Zone that doesn’t support the feature. The following alert log record (trimmed, with example values) was written by a default action that alerts, for a connection to an address that Route 53 Resolver returned:

{
  "firewall_name": "egress-firewall",
  "availability_zone": "us-east-1a",
  "event": {
    "event_type": "alert",
    "src_ip": "10.0.1.10",
    "dest_ip": "203.0.113.10",
    "dest_port": 123,
    "proto": "UDP",
    "app_proto": "ntp",
    "route53_resolved_ip": true,
    "verdict": {
      "action": "alert"
    },
    "alert": {
      "action": "allowed",
      "signature_id": 3,
      "signature": "aws:alert_established action"
    }
  }
}

In alert mode, this record is for a TLS connection that presented an allowed domain name but went to an address that Route 53 Resolver didn’t return for it, blocked by the policy’s default action in use case 2:

{
  "firewall_name": "egress-firewall",
  "availability_zone": "us-east-1a",
  "event": {
    "event_type": "alert",
    "src_ip": "10.0.1.10",
    "dest_ip": "198.51.100.7",
    "dest_port": 443,
    "proto": "TCP",
    "app_proto": "tls",
    "tls": {
      "sni": "api.partner.example.com"
    },
    "route53_resolved_ip": false,
    "verdict": {
      "action": "drop"
    },
    "alert": {
      "action": "blocked",
      "signature": "aws:alert_established_app_layer_to_server action"
    }
  }
}

Before you switch Action to Drop or Reject, check that connections that fail the check are ones you expect and that destinations you allow by IP address are in the bypass ranges. Reject sends a TCP reset, so a blocked TCP client fails right away instead of waiting for a timeout. After you enforce, blocked connections appear in your flow logs with route53_resolved_ip as false, not in your alert logs. For the metrics and log fields to watch, see Monitoring and troubleshooting resolved IP validation.

Use case 1: Filter non-web traffic by domain name

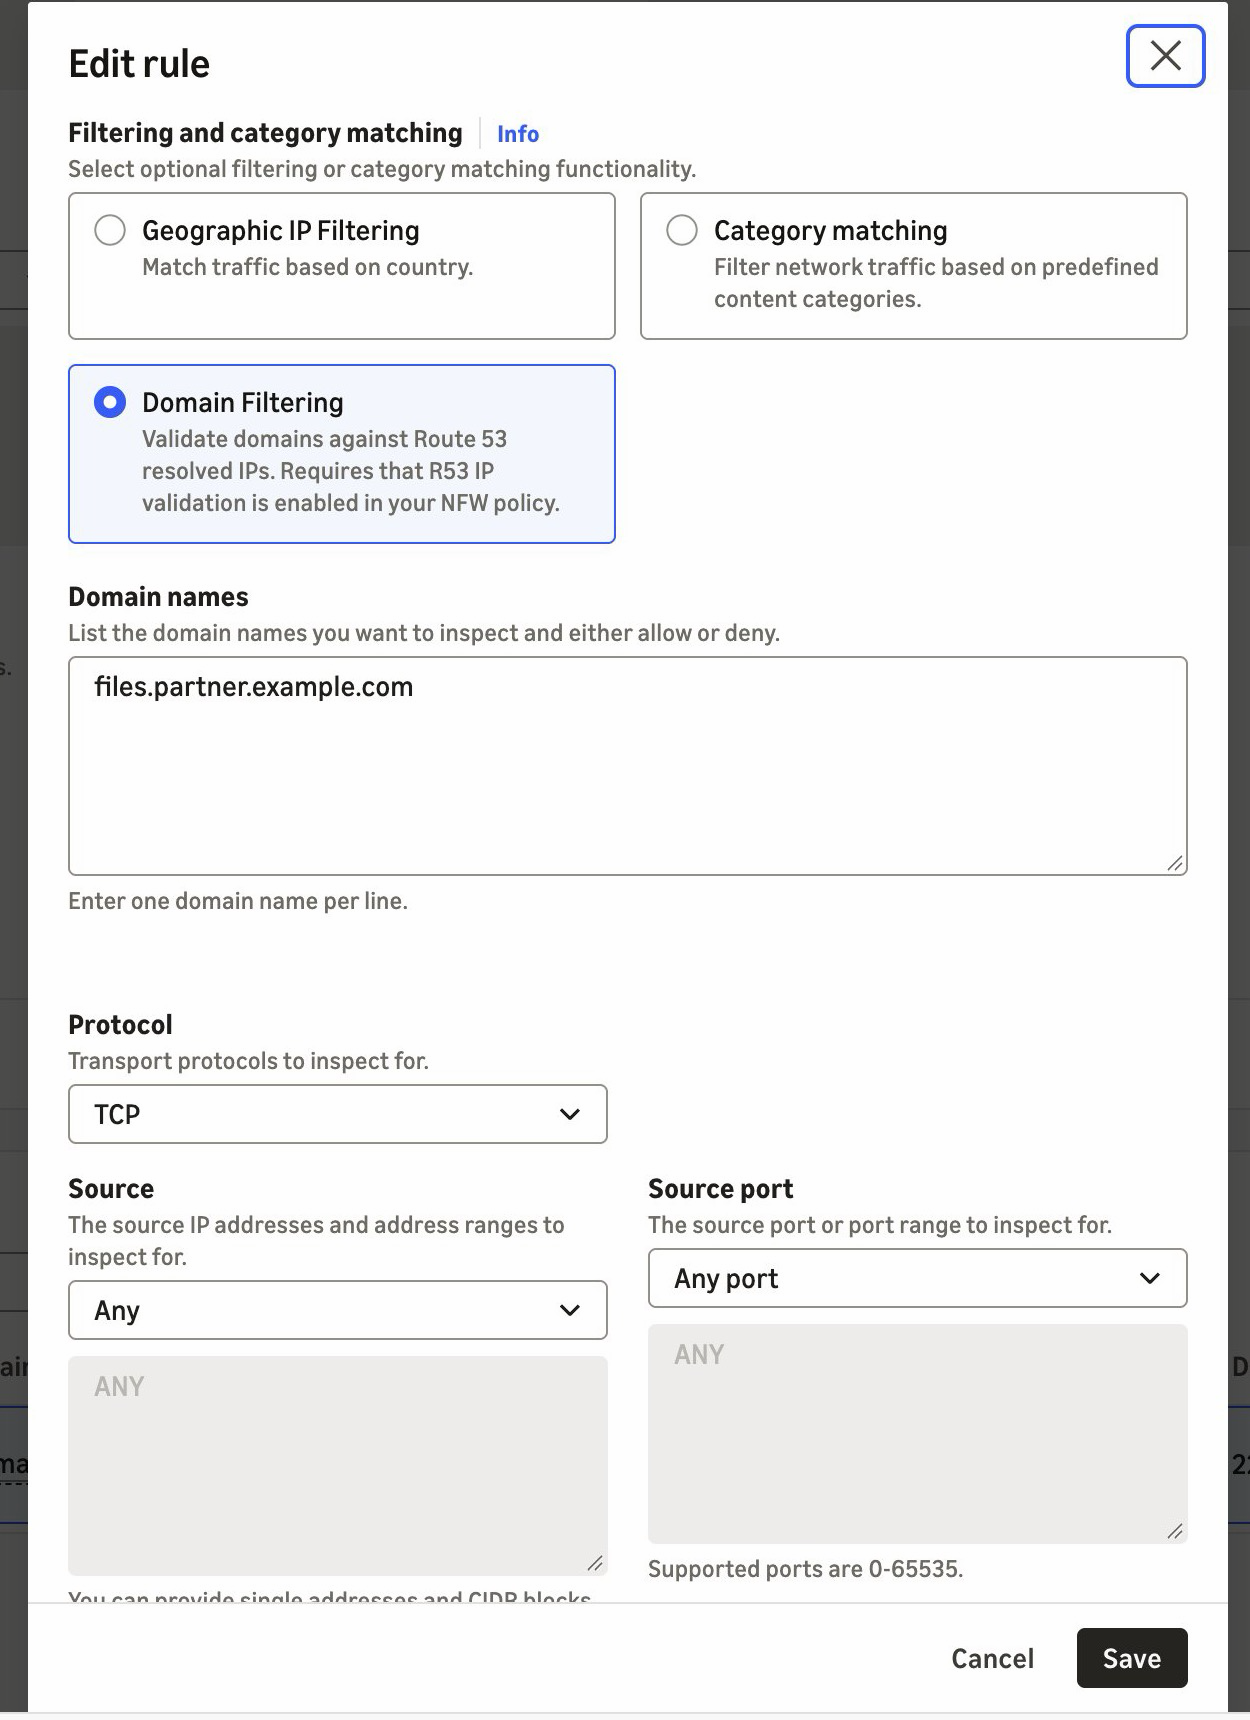
Before this launch, Network Firewall rules for protocols that carry no domain name, such as SFTP, used IP addresses. Now, you can allow them by domain name. In this example, a workload sends files over SFTP to a partner at files.partner.example.com on TCP port 22, and the partner can change the addresses behind that name at any time. The same approach works for SSH, MySQL, and other non-web protocols. You create it as a standard stateful rule. Follow these steps:

  1. Under Network Firewall, choose Network Firewall rule groups, then choose Create rule group. Choose Stateful rule group and Standard stateful rule, and choose the rule evaluation order that your policy uses.
  2. Choose Add rule. For Protocol, choose TCP. For Destination port, enter 22. Under Domain filtering, enter files.partner.example.com. For Action, choose Pass.
  3. Create the rule group, then add it to your firewall policy.
Figure 3. A pass rule for SFTP on TCP port 22, scoped to the partner's domain name

Figure 3. A pass rule for SFTP on TCP port 22, scoped to the partner’s domain name

If you manage rules as code, the equivalent Suricata rule is shown in the following code. It adds the alert; keyword so that the firewall logs allowed connections. The console rule doesn’t add it.

pass tcp any any -> any 22 (alert; msg:"Allow TCP/22 to files.partner.example.com"; aws_route_53_resolved_domain:"files.partner.example.com"; sid:1;)

When the partner moves its server to a new address, the next DNS answer adds it to the resolved IP cache. There’s no IP list to maintain. The cache keeps earlier answers for longer than their DNS time to live (TTL), so the old address can still pass for a while.

Use case 2: Prevent SNI spoofing without TLS inspection

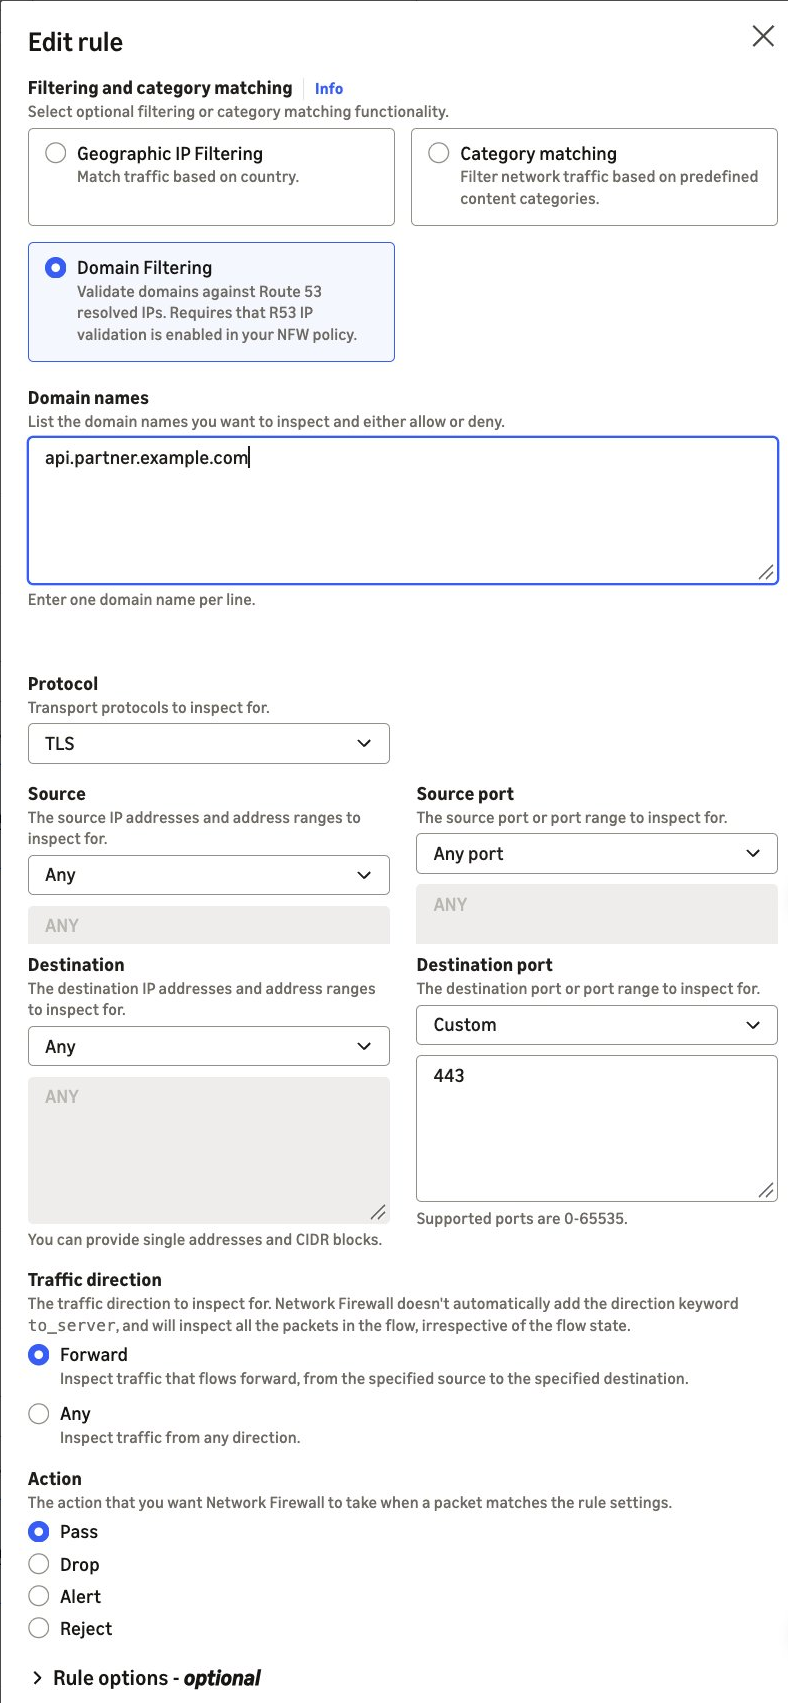
With SNI spoofing, a client presents an allowed domain name in its TLS request while it connects to a different server. Preventing that has required TLS inspection, which decrypts the traffic. Route 53 Resolved IP Validation prevents it without TLS inspection. In this example, a workload calls a partner API at api.partner.example.com over HTTPS. TLS traffic on port 443 must reach only the addresses that Route 53 Resolver returned for that name. You create a pass rule in a standard stateful rule group, as in use case 1, and the firewall policy’s default action drops everything that no rule passes. Follow these steps:

  1. Under Network Firewall, choose Network Firewall rule groups, and then choose Create rule group. Choose Stateful rule group and Standard stateful rule, then choose Strict order.
  2. Choose Add rule. For Protocol, choose TLS. For Destination port, enter 443. Under Domain filtering, enter api.partner.example.com. For Action, choose Pass.
  3. Create the rule group, then add it to your firewall policy.
  4. In the firewall policy, use strict rule order. For the stateful default actions, choose Application drop established (server-directed only) and Application alert established (server-directed only). The alert action logs what the drop action blocks. For why we recommend these default actions, see Firewall policy configuration in the AWS Security Services Best Practices guide.
Figure 4. A pass rule for TLS on port 443, scoped to the partner's domain name

Figure 4. A pass rule for TLS on port 443, scoped to the partner’s domain name

If you manage rules as code, the equivalent Suricata rule is:

pass tls any any -> any 443 (aws_route_53_resolved_domain:"api.partner.example.com"; sid:2;)

The pass rule matches the destination address, not the name in the TLS request. TLS traffic on port 443 passes only when Route 53 Resolver returned the destination address for api.partner.example.com. If the partner’s addresses also serve other domain names, such as behind a content delivery network (CDN), those names pass too. To also require the partner’s name in the TLS request, add an exact SNI match to the same rule: tls.sni; content:"api.partner.example.com"; startswith; endswith; nocase;.

Without startswith and endswith, the content match accepts any SNI that contains the name.

A connection that presents the partner’s name but goes to another address doesn’t match the pass rule. If Route 53 Resolver never returned that address, the policy setting’s enforcement action blocks the connection before your rules run. In alert mode, the policy setting lets the connection through to your rules instead, and the stateful default action drops it because the pass rule doesn’t match. Its alert log record shows route53_resolved_ip as false, as in the second example previously. If Route 53 Resolver returned the address for a different domain name, the connection passes the policy check. The stateful default action then drops it because the pass rule doesn’t match, and that record shows route53_resolved_ip as true.

Best practices

We recommend that you follow these best practices:

  • Keep DNS on Route 53 Resolver – Block outbound UDP and TCP port 53 DNS to other resolvers, including DNS over HTTPS (DoH) and DNS over TLS (DoT), on Network Firewall, so that clients don’t bypass the check. Route 53 Resolved IP Validation alone doesn’t do this. If any client looks up a public resolver’s name, such as dns.google, that resolver’s addresses pass the check.
  • Keep DNS Firewall rules in those VPCs – Route 53 Resolved IP Validation checks the connections that follow a DNS lookup, not the DNS queries themselves. DNS Firewall blocks lookups of known threat domains with AWS managed domain lists, and its advanced rule groups detect data leaving through DNS queries, such as DNS tunneling.
  • Start small – Add domain filtering to a few rules at a time, then add more when the results look clean. For domain allow list patterns, see Allow rules and domain allowlisting.
  • Turn on flow and alert logging and detailed monitoring – Connections that fail the resolved IP check show in your flow logs (route53_resolved_ip: false) and in the DnsUnresolvedFlows metric, not in your alert logs. Pass rules without the alert; keyword don’t write an alert log record.

Pricing and availability

Route 53 Resolved IP Validation is available today in all commercial AWS Regions (Regions other than the AWS GovCloud (US) Regions and the China Regions) where AWS Network Firewall and Amazon Route 53 Resolver DNS Firewall are available, at no additional charge. For the list of Regions, see AWS Capabilities by Region. A DNS Firewall rule group with no rules doesn’t incur DNS Firewall charges. Standard DNS Firewall pricing applies after you add rules. See AWS Network Firewall pricing and Amazon Route 53 pricing.

Conclusion

In this post, we showed you how Route 53 Resolved IP Validation works and how to turn it on in alert mode. Network Firewall now checks each connection’s destination against the IP addresses that Amazon Route 53 Resolver returned for the DNS query. Filtering SFTP, SSH, database, and other non-web traffic by domain name and preventing SNI spoofing without TLS inspection are two common examples of what that makes possible. To get started, turn the feature on in alert mode and review the results before you enforce. For the full walkthrough, see Getting started with resolved IP validation.


To learn more, visit the AWS Network Firewall product page and the feature documentation.

If you have questions about this post, contact AWS Support.

Lawton Pittenger

Lawton Pittenger

Lawton is a Worldwide Security Specialist Solutions Architect at AWS, based in New York City. He specializes in helping customers design and implement effective network security controls. At AWS, he works with customers at scale and collaborates closely with service teams to drive continuous improvement in security services based on customer needs and feedback. Outside of work, his interests include skateboarding, snowboarding, and spending time in nature.

Amish Shah

Amish is a seasoned product leader with over 15 years of experience in developing innovative and scalable solutions for networking, security, and cloud use cases. He currently leads the AWS Network Firewall service, where he helps to develop security solutions that protect AWS workloads. Outside of work, Amish enjoys playing cricket and soccer, loves to travel, and has recently started collecting niche fragrances.

Amit Gaur

Amit Gaur

Amit, a Cloud Infrastructure Architect at AWS, brings his passion for technology and knowledge-sharing to the networking community. Specializing in network architecture design, he helps customers build highly scalable and resilient environments on AWS. Through technical guidance and architectural expertise, Amit enables customers to accelerate their cloud adoption journey while making sure their systems are built for scale and reliability.

Author

Jesse Lepich

Jesse is a Senior Security Solutions Architect at AWS based in Lake St. Louis, Missouri, focused on helping customers implement native AWS security services. Outside of cloud security, his interests include relaxing with family, barefoot waterskiing, snowboarding and snow skiing, surfing, boating, and mountain climbing.

Preetkumar Shah

Preetkumar Shah

Preetkumar is a Technical Account Manager at AWS, based in Atlanta, GA. He specializes in helping customers design and operate secure, scalable network architectures in the cloud. At AWS, he works with SMB customers and collaborates closely with service teams to proactively resolve complex challenges and ensure customers get the most from their AWS environment. Outside of work, his interests include spending time with family and going on trails.

Introducing time series collections for the next generation of Amazon OpenSearch Serverless

Post Syndicated from Kevin Fallis original https://aws.amazon.com/blogs/big-data/introducing-the-next-generation-of-serverless-time-series-for-amazon-opensearch-service/

Today, we’re announcing support for time series collections on the next generation of Amazon OpenSearch Serverless. With time series collections, you can ingest, store, and analyze logs, metrics, traces, and event data without provisioning or managing clusters. Time series collections absorb ingest spikes automatically, keep recent data fast to query, and make months or years of history searchable at low cost, all in the same collection. Time series collections also bring alerting and anomaly detection to OpenSearch Serverless, so you can find and act on problems as they happen. With support for up to 100 TB of hot storage per collection, they’re built for high-scale observability workloads such as application monitoring, security analytics, and IoT telemetry.

Observability data is voluminous, and it surges sharply during events like bad deployments and outages, right when teams need answers fastest. An undersized cluster falls behind and delays the very logs engineers are waiting for, so teams size for the worst day and pay for that capacity every other day. Hot storage gets expensive as history grows, so teams cut retention or move older data to snapshots that someone must restore before running a query. Clusters also need constant tuning and capacity planning, which pulls engineers away from the investigations the data is meant to support. Every decision becomes a tradeoff between cost, retention, and how quickly you can answer questions about your systems.

Time series collections on OpenSearch Serverless remove that tradeoff. When an incident drives a surge in log volume, compute scales in seconds to keep up, so the logs engineers are waiting for arrive on time. When traffic settles, compute scales back down, all the way to zero, so you stop paying for worst-day capacity. Older data moves to a lower-cost warm tier and stays queryable, so you can keep years of history without cutting retention or restoring snapshots. There are no clusters to size or tune. You set compute limits and a few index settings, and the service handles the rest.

Pay less for the data you query less

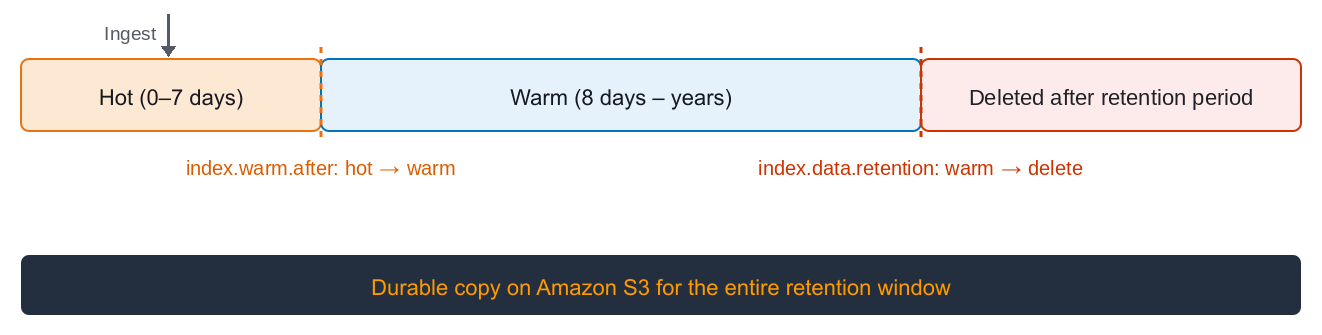
Most queries against time series data target the last few hours or days, while older data is less frequently queried but still needs to be available. With the new index.warm.after setting, you decide how long data stays in the hot tier before it moves to the lower-cost warm tier. You can set it in days or hours, from a minimum of 1 day (24h or 1d) up to 10 years (3650d), and it can’t exceed the index’s retention period. If you don’t set it, data moves to warm after 1 day.

PUT /app-logs
{
  "settings": {
    "index.warm.after": "7d"
  }
}

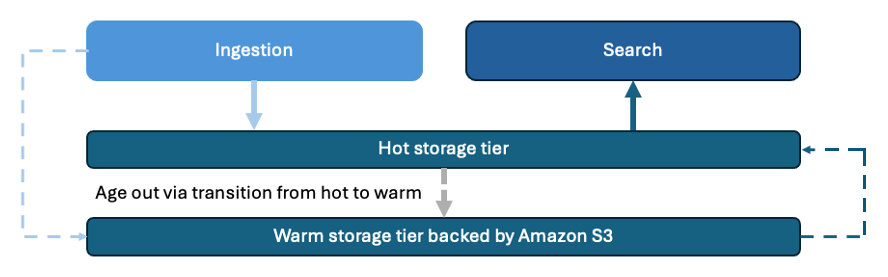
At ingest, each document is written to a low-latency hot tier and to Amazon Simple Storage Service (Amazon S3). As data reaches the age you set, oldest first, the hot copy is released and the data lives in the warm tier on Amazon S3. When a query needs warm data, the service loads that data back into the hot tier to serve it. The first query on that data takes longer, and later queries on the same data run at hot-tier latency. That suits investigations and reporting over older data, where the same time range is often queried repeatedly. When a query spans both tiers, results come back in a single response. You pay hot storage rates only for data in the hot tier.

Data flows from the hot tier to the warm tier after seven days, with all data persisted to Amazon S3 throughout

Figure 1: Data moves from the hot tier to the warm tier after 7 days, persisted to Amazon S3 throughout

Retain data for as long as your workload requires

Retention is set on the index itself, so there is no separate lifecycle policy to create or maintain. Set index.data.retention in an index template, and every index that matches the pattern inherits it. You can retain data for anywhere from 1 day to 3,650 days (10 years), specified as a whole number of days.

PUT /_index_template/app-logs
{
  "index_patterns": ["app-logs*"],
  "template": {
    "settings": {
      "index.data.retention": "30"
    }
  }
}

Tiering and retention are independent. Tiering controls query speed and cost, and retention controls when data is deleted. For example, you can keep application logs hot for 7 days and retain them for 30 days, or keep audit data in the warm tier for years to meet compliance requirements. When an audit comes up, you query that history in the same collection, and search compute scales up to handle the extra load. There is no snapshot restore and no forensic cluster to stand up.

Data tiering controls query speed and cost while retention controls when data is deleted

Figure 2: Data tiering and retention

Designate the event timestamp for each index

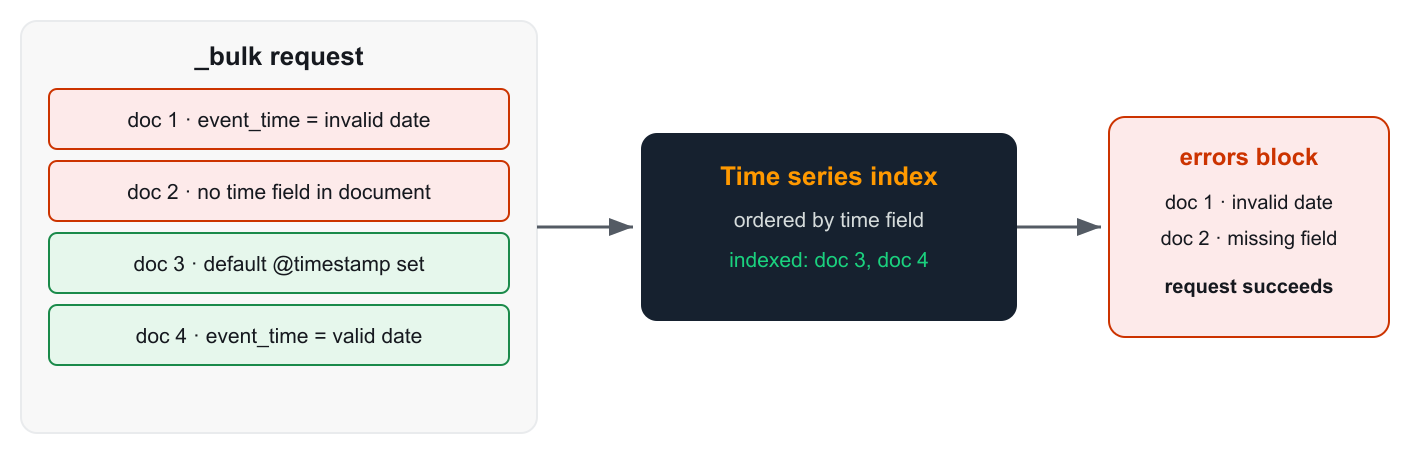
Every document in a time series collection must now include a timestamp field. Each index has one designated time field that the service uses to organize and sort your data, and documents with a missing, null, or invalid timestamp are rejected.

By default, the time field is @timestamp. If your events already carry a different field, such as event_time, set index.timestamp_field when you create the index or in an index template, so you don’t need to change your producers. The field must be a top-level date field, and a document’s timestamp can’t be changed after it is indexed.

PUT /app-logs
{
  "settings": {
    "index.timestamp_field": "event_time"
  }
}

Rejections apply to individual documents, not whole requests. In a _bulk request, the valid documents are indexed and the rejected ones are listed in the errors block of the response, so one bad record doesn’t fail the batch.

How the designated time field determines whether each document is indexed or rejected

Figure 3: How the time field determines whether each document is indexed or rejected

Catch problems before they become outages

Time series collections now support alerting and anomaly detection, which Classic serverless collections didn’t offer. Instead of relying on a separate system to tell you when something breaks, you can monitor, detect, and notify from the collection that stores your data. Now, operations teams can get notified when error rates or latency spike, security teams can catch a burst of failed logins, and business teams can spot a sudden drop in orders.

Alerting monitors query your data on a schedule and notify you through the channel you choose when a condition is met. Per-query monitors alert on a single value, such as average latency crossing a threshold. Per-bucket monitors evaluate each group separately, such as every host whose error rate climbs too high. PPL monitors handle more complex logic in Piped Processing Language (PPL).

Anomaly detection uses the Random Cut Forest (RCF) machine learning algorithm to learn your data’s normal pattern and flag deviations in near real time, with no fixed thresholds to guess. Point a monitor at the detector’s results to get notified the moment an anomaly appears.

You manage monitors and detectors in OpenSearch UI workspaces, where access follows the workspace’s collaborator permissions. Read-only collaborators can view monitors and alerts, while read/write and admin collaborators can also create, update, and acknowledge them. The Observability workspace puts alerts alongside dashboards and PPL queries, so your team can go from an alert to the events behind it, across serverless collections and existing Amazon OpenSearch Service domains.

Getting started

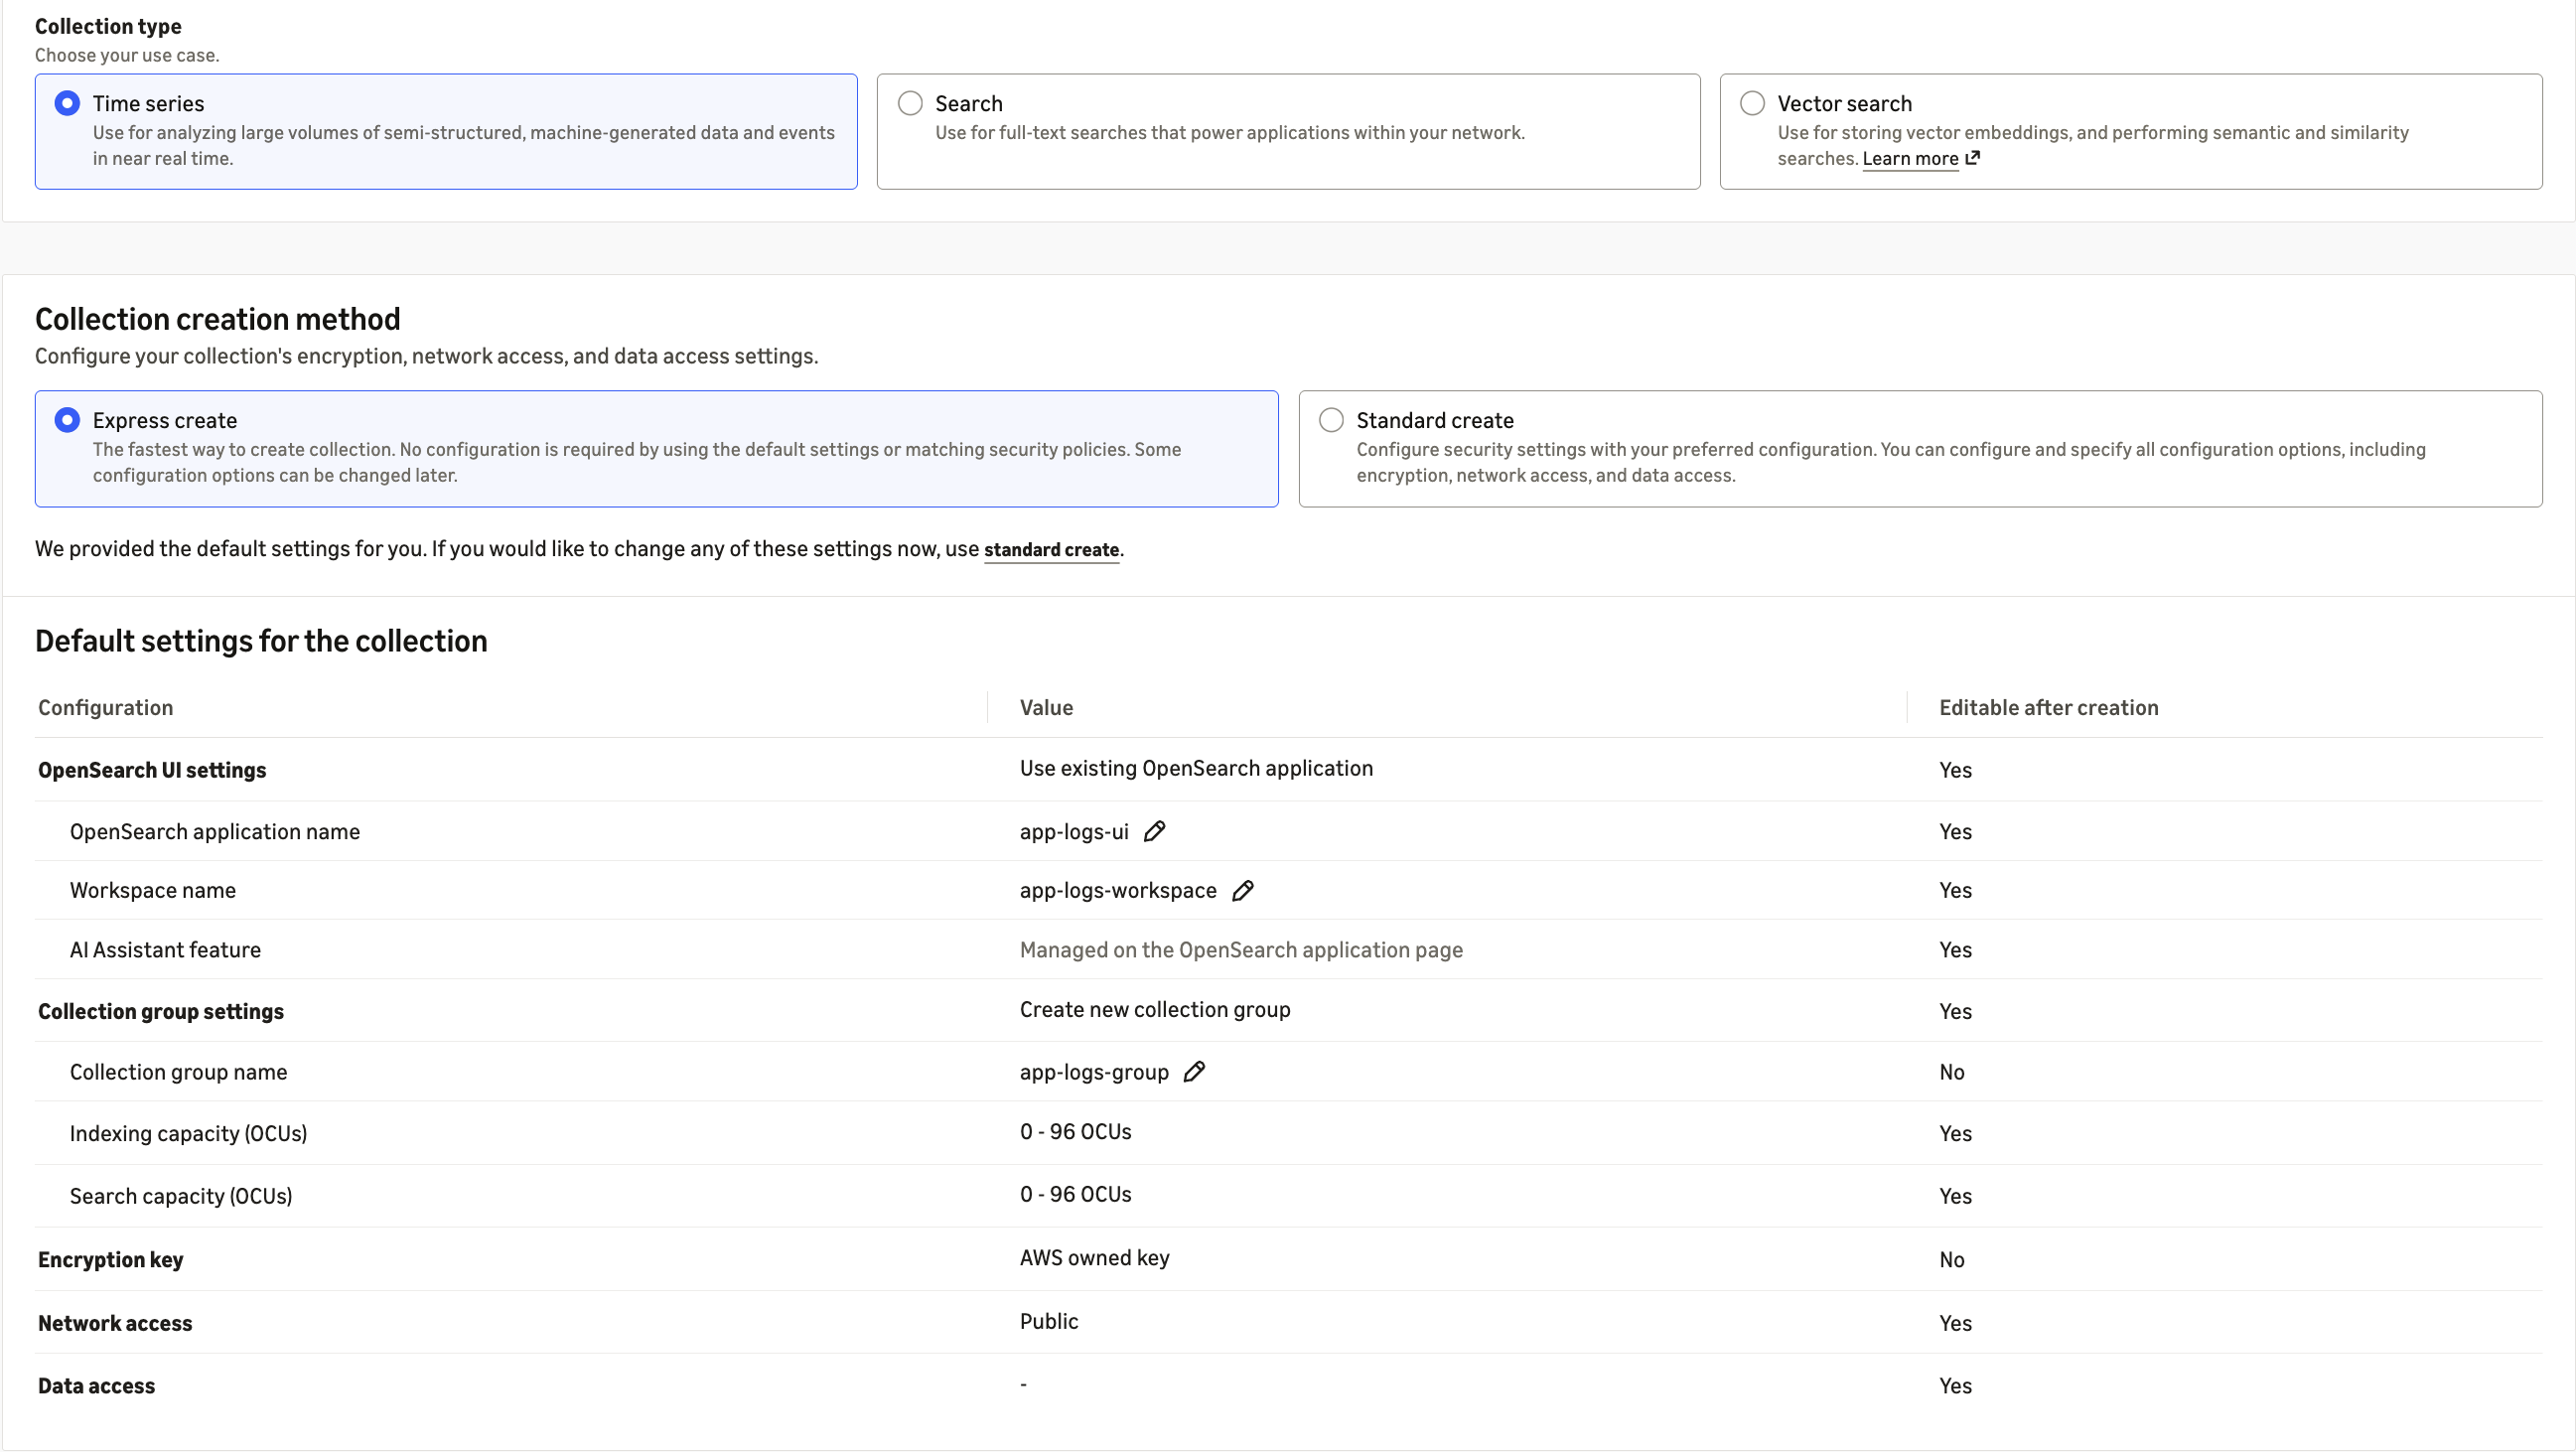
For a single-click experience, use Express Create in the Amazon OpenSearch Service console. It sets up the collection group, encryption, network access, and data access for you. To control each step yourself, use the AWS Command Line Interface (AWS CLI) as shown in the following steps.

Express Create setting up the collection group, encryption, and network access with default settings

Figure 4: Express Create sets up the collection group, encryption, and network access with default settings

First, create a next-generation collection group. The collection group sets the compute limits that all of its collections share. A minimum of 0 OpenSearch Compute Units (OCUs) lets the group scale to zero when it’s idle, and the maximum caps your spend.

aws opensearchserverless create-collection-group \
    --name app-logs-group \
    --generation NEXTGEN \
    --standby-replicas ENABLED \
    --capacity-limits '{
        "minIndexingCapacityInOCU": 0,
        "minSearchCapacityInOCU": 0,
        "maxIndexingCapacityInOCU": 96,
        "maxSearchCapacityInOCU": 96
    }'

Next, create a network policy to control where the collection can be reached from, and a data access policy to control which AWS Identity and Access Management (IAM) principals can read and write data.

Then create the time series collection in the collection group:

aws opensearchserverless create-collection \
    --name app-logs \
    --type TIMESERIES \
    --collection-group-name app-logs-group \
    --encryption-config aWSOwnedKey=true

After the collection is active, create an index template with the time field, tiering, and retention settings that fit your workload. Every index whose name matches the pattern picks up these settings automatically:

PUT /_index_template/app-logs
{
  "index_patterns": ["app-logs*"],
  "template": {
    "settings": {
      "index.timestamp_field": "event_time",
      "index.warm.after": "7d",
      "index.data.retention": "30"
    }
  }
}

Finally, ingest your data into the collection, then open the Observability workspace in OpenSearch UI to build your first dashboards, monitors, and anomaly detectors.

Now available

Time series collections are available today in all AWS commercial Regions where the next generation of OpenSearch Serverless is available. You pay for the compute you use in OCUs, and for hot and warm storage in GB-month. For pricing details, visit the Amazon OpenSearch Service pricing page.

To learn more, visit the Amazon OpenSearch Serverless product page and the Amazon OpenSearch Serverless Developer Guide.

Give it a try in the Amazon OpenSearch Service console, and send feedback through AWS re:Post or your usual AWS Support contacts.


About the author

Kevin Fallis

Kevin Fallis

Kevin is a seasoned leader, architect, and developer with experience across many industry verticals and disciplines such as agriculture, ad tech, financial services, networking, security, telecommunications and of course search technologies. His passion helps others leverage the correct mix of AWS services and open-source solutions to achieve success for their business goals. His after-work activities include family, DIY projects, carpentry, horses, playing drums, and all things music.

From Problem to Fix in Minutes: Automating Search Relevance Tuning with the Amazon OpenSearch Service Relevance Agent

Post Syndicated from Aruna Govindaraju original https://aws.amazon.com/blogs/big-data/from-problem-to-fix-in-minutes-automating-search-relevance-tuning-with-the-amazon-opensearch-service-relevance-agent/

Automating search relevance tuning means going from “my NDCG score is low” to “here is a better search query” in minutes. The Amazon OpenSearch Service Search Relevance Agent accelerates search quality improvements. You describe the problem, and the agent investigates your behavioral data, runs sequenced evaluations, and generates an improved query validated against your search quality targets, all without leaving the UI.

In the previous post “Measuring and improving search quality with Amazon OpenSearch Service”, you learned how to capture behavioral signals with User Behavior Insights (UBI), run structured experiments with Search Relevance Workbench (SRW), and arrive at a real Normalized Discounted Cumulative Gain (NDCG) score. That gives you the diagnosis. Now comes the harder part: acting on it.

Improving search quality is a tedious, manual loop. A search engineer studies the dashboards, forms a hypothesis, rewrites the domain-specific language (DSL) query, creates a new configuration, runs an experiment, interprets the results, and, if the numbers hold, deploys the change. Then the catalog shifts, query patterns evolve, and the cycle starts over. Staying ahead of it is practically a full-time job.

The Search Relevance Agent, accessible through the Ask AI button in the OpenSearch UI application, automates this loop. You have a conversation. The agent does both: diagnose and fix.

What is the Search Relevance Agent?

Before diving into the demo, it’s worth being precise about what the agent is and isn’t. Search Relevance Agent is one of the agents supported in OpenSearch Agent Server. The OpenSearch Agent Server is a multi-agent orchestration platform where you can build specialized AI agents that work together within OpenSearch. The agent server is an orchestration server for OpenSearch Dashboards with context-aware routing and Model Context Protocol (MCP) integration.

OpenSearch Agent Server

Figure 1: OpenSearch Agent Server

The Search Relevance Agent is a search relevance tuning tool. It analyzes your UBI search data, generates improved query configurations, and validates those improvements using offline SRW experiments. It operates at the level of query DSL, refining field weights, adjusting scoring strategies, and adding boost functions.

It isn’t an agentic search tool. It doesn’t rewrite user queries at runtime or intercept search requests. It configures the search system so that future searches perform better.

The distinction matters because it tells you what kind of problems it solves: systematic relevance issues that affect a category of queries, not one-off edge cases.

Solution overview

Under the hood, the Search Relevance Agent is powered by three skills of a single agent rather than separate sub-agents wired together as tools. The full loop, from spotting a problem to generating a hypothesis to evaluating it, runs in a single shared context with one tool stack. Nothing is lost when handing off between agents, and the behavior stays predictable.

When you send a message through Ask AI, you are talking to the OpenSearch Agent Server. Depending on what you are asking for, the agent applies one of three skills.

  • User Behavior Analysis. Queries your UBI indexes to surface relevance problems such as low click-through-rate (CTR) queries, zero-result queries, and declining engagement patterns. Deterministic tools handle all metric calculations rather than the large language model (LLM), so the numbers are trustworthy.
  • Hypothesis Generation. Analyzes your current search configuration (search queries), runs a pairwise smoke test, and proposes a new DSL search query as a hypothesis. It explains its reasoning, which fields it changed and why, so you can evaluate the proposal before approving it.
  • Evaluation. Creates the SRW artifacts (query set, search configuration, judgment list) and runs an offline Search Quality Evaluation experiment. It reports NDCG, Mean Average Precision (MAP), and Precision, interprets the tradeoffs, and gives you a plain-language recommendation.

Every agent communicates with your OpenSearch cluster exclusively through the MCP Server, a standardized interface that gives agents access to your UBI data, search configurations, query sets, and experiments. Nothing happens without going through this secure layer.

OpenSearch UI uses the Agent-User Interaction Protocol (AG-UI) to connect AI agents to frontend applications, delivering real-time capabilities through standardized streaming and tool execution. The AG-UI protocol streams agent responses to OpenSearch Dashboards in real time, delivering results continuously rather than all at once.

The Agent Server receives the user’s authenticated identity from OpenSearch Dashboards, so every OpenSearch operation enforces user-level permissions rather than a service account’s, preserving access controls end to end.

Auto Relevancy Tuning Agent

Figure 2: Auto relevancy tuning agent

Prerequisites

To follow along, you need an OpenSearch Service domain running OpenSearch 3.5 or later with the OpenSearch UI application, and a search application you can instrument to emit behavioral records.

Example UBI investigation

Here’s what the agent conversation looks like in practice, working through a real dataset. Figure 3 shows a complete walkthrough of using the agent.

Search improvement example

Figure 3: Search improvement example

Step 1: Open Ask AI

You work in the search workspace within the OpenSearch UI application. After entering the search workspace, choose Ask AI in the upper right corner.

Search Workspace Overview page

Figure 4: Search Workspace Overview page

The agent chat panel opens. You see a welcome message and suggested prompts to get started.

AI Assistant chat panel

Figure 5: AI assistant chat panel

Step 2: Find the problem

Start with a diagnostic question: “What are my most common queries?”. The User Behavior Analysis skill activates. You can watch its tool calls in real time as it queries your UBI indexes. In this example, the skill finds that there were 473 total queries across the product catalog. The top queries include gold and wireless earbuds, but across all those queries, there are only 11 total click events. The agent flags this immediately: a CTR that low is a signal that search isn’t working for users.

Viewing most used search queries

Figure 6: Viewing most used search queries

UBI initial findings

Figure 7: UBI initial findings

This is exactly what UBI is designed to surface. The skill found the pattern itself without a configured threshold.

Step 3: Investigate a specific search query

After you’ve received the summary information, you can investigate a specific search query’s performance more deeply. Ask the AI “What is the click-through-rate for wireless earbuds?”. It returns that users searched for “wireless earbuds” 14 times and clicked 8 times, producing a 57.14 percent CTR. Over 40 percent of searches have no clicks. This is a good opportunity to improve search performance.

AI response for click-through-rate of wireless earbuds

Figure 8: AI response for click-through-rate of wireless earbuds

Step 4: Understand the baseline

The next step is to review the current search configuration. Ask the AI “What is my current search configuration?” The agent retrieves the current configuration and presents it for review.

Step 5: Generate a hypothesis

Next is to figure out how to improve the search configuration. Ask the agent: “Can you help me improve the search configuration for wireless earbuds?”. The agent initiates an investigation of the search configuration performance and how it can be improved.

Investigation details

Figure 9: Investigation details

You can then ask the AI to generate a hypothesis. The Hypothesis Generator skill develops a hypothesis based on the investigation and provides supporting findings.

Hypothesis

Figure 10: Hypothesis

Ask “What are the root causes?”. The skill presents root causes, justification, and a new hypothesis for your review. In this example the root causes returned were:

Root causes

Figure 11: Root causes

Step 6: Validate with an offline evaluation

The Evaluator skill creates all the necessary SRW artifacts and runs a Search Quality Evaluation comparing the baseline and the hypothesis. Ask “Validate with an offline evaluation”, and the evaluation report appears in the chat:

Evaluation metrics

Figure 12: Evaluation metrics

NDCG improved substantially. MAP and Precision show a minor tradeoff. You can then ask the agent to explain the findings. Ask “What does a higher NDCG and MAP tell me? Is this worth deploying?”

NDCG and MAP explanation

Figure 13: NDCG and MAP explanation

If your search configuration uses hybrid search, combining lexical and neural queries, the Search Relevance Workbench includes a Hybrid Search Optimizer that automates parameter tuning. Instead of manually experimenting with normalization techniques, combination methods, and lexical-to-neural weight ratios, you can run a single optimization experiment. The optimizer evaluates all combinations of normalization, combination, and weight distributions as well as Reciprocal Rank Fusion variants. It scores against your judgment list and surfaces the parameter set that maximizes your search quality metrics.

Step 7: Inspect what the agent created

Before deploying anything, check what the agent built by asking “Show me the new search configuration”.

Figure 14: New search configuration

Search configurations: a new entry hypothesis-wireless-earbuds-v1 with the full DSL. You can inspect every line, tweak it, or fork it.

Experiments: the offline evaluation the agent ran. Choose it to see per-query scores, download results as CSV, or share the link with your team.

This is the transparency guarantee: the agent doesn’t ask you to trust a black box. The agent documents and makes every decision auditable.

Step 8: Continue the conversation

The loop doesn’t need to stop here:

“The NDCG looks good but I’m worried about over-promoting popular items. Can you reduce the rating boost factor and re-evaluate?”

“Now look at the ‘gold’ query. It had the highest search volume but very low CTR. What’s going on?”

“I’m happy with the wireless earbuds hypothesis. How do I apply this configuration in production?”

Example follow up questions

Figure 15: Example follow up questions

Each question kicks off a new iteration of the same loop: analyze, hypothesize, and evaluate. But now it takes minutes, not hours.

Continuous improvement, not one-time tuning

The key mindset shift the Search Relevance Agent encourages is to think about search quality as a practice, not a project. Search degrades over time. The configuration you tuned last quarter might be quietly underperforming today, and without a continuous measurement loop, you don’t find out until users stop converting. The agent fits into a continuous, human-in-the-loop improvement cycle:

  1. Collect: UBI captures real user behavior automatically.
  2. Identify: The agent surfaces emerging relevance gaps before they become customer complaints.
  3. Hypothesize: The agent proposes targeted fixes grounded in your actual data.
  4. Evaluate: SRW validates improvements offline before anything touches production.
  5. Deploy: You apply the winning configuration with full visibility into the evidence.
  6. Monitor: UBI closes the loop, feeding new behavior back into step 1.

At each stage, you remain in control. The agent executes, you decide.

Who benefits

Search engineers get tools that eliminate repetitive work. These tools provide root cause analysis, DSL iteration, and experiment setup, all automated. Engineers focus on the problems that require genuine expertise. Product managers and business owners can now participate meaningfully in search tuning without writing a single line of DSL. If a new product category is underperforming, you can ask the agent to investigate and get an actionable recommendation in plain language. Teams without dedicated search expertise get access to advanced relevance engineering techniques such as function_score, cross_fields, and popularity boosting without needing to know the terminology. The agent handles the implementation.

Try it yourself

The Search Relevance Agent is available today in Amazon OpenSearch Service through the Ask AI button in your OpenSearch UI search workspace. To get started open your OpenSearch UI application and navigate to Search Relevance then load the sample UBI data if you haven’t already. Entering the /search-relevance command in the chat from another page will also take you to Search Relevance. Next, choose Ask AI and start with: “What are my most common queries with low engagement?”

For a step-by-step hands-on lab, try the Search Relevance Workbench Workshop on AWS Workshop Studio module 3 which walks through the full Automated Relevance Tuning (ART) agent experience with the ESCI ecommerce sample dataset.

The OpenSearch Search Relevance Agent is part of the OpenSearch application experience in Amazon OpenSearch Service. It requires an OpenSearch application with an associated workspace and data source.

Clean up

To avoid future charges, delete the resources you created for this walkthrough:

  • If you created the domain specifically for this post, delete it to remove everything, including the resources in the previous step. Deleting a domain is irreversible. Don’t delete a domain that serves other workloads.
  • If you keep the domain, optionally delete the ubi_queries and ubi_events indices and the query sets, judgment lists, and experiments you created. These live on the domain and incur no separate charges.
  • Delete the OpenSearch UI application if you created it specifically for this post.


About the authors

Aruna Govindaraju

Aruna Govindaraju

Aruna is an Amazon OpenSearch Specialist Solutions Architect and has worked with many commercial and open source search engines. She is passionate about search, relevancy, and user experience. Her expertise with correlating end-user signals with search engine behavior has helped many customers improve their search experience.

Sean Bjurstrom

Sean Bjurstrom

Sean is an Enterprise Support Lead in ISV accounts at Amazon Web Services, where he specializes in Analytics technologies and draws on his background in consulting to support customers on their analytics and cloud journeys. Sean is passionate about helping businesses harness the power of data to drive innovation and growth. Outside of work, he enjoys running and has participated in several marathons.

Mingshi Liu

Mingshi Liu

Mingshi is a Machine Learning Engineer at AWS, primarily contributing to OpenSearch, ML Commons and Search Processors repo. Her work focuses on developing and integrating machine learning features for search technologies and other open-source projects.

AWS becomes first CSP to complete the Cloud High profile assessment with 172 services and features in scope

Post Syndicated from Naranjan Goklani original https://aws.amazon.com/blogs/security/aws-becomes-first-csp-to-complete-the-cloud-high-profile-assessment-with-172-services-and-features-in-scope/

We continue to expand the scope of our assurance programs at Amazon Web Services (AWS) and are pleased to announce the successful completion of our first ever Cloud High (PBHH) security assessment with 172 assessed services and features. Completion of this assessment, effective September 18, 2026, makes AWS the first cloud service provider (CSP) in Canada to meet this high security bar and provide assurance to our valued customers. This assessment also reaffirms our commitment to helping public and commercial customers achieve and maintain the highest-grade security standard for workloads with increased sensitivity.

What is the Cloud High assessment and why is it important?

The Cloud High security profile (that is, PBHH) seeks to enhance the integrity and availability of customer organizational workloads that are considered to have an increased level of sensitivity. These are systems that the Government of Canada (GC) and its service providers use to support delivery of services at a national scale or that are determined to be significant for handling sensitive information. The profile is based on the Security and privacy controls and assurance activities catalogue (ITSP.10.033). The Cloud High (PBHH) profile includes all controls and enhancements contained within the Cloud Medium profile (PBMM), with additional controls and enhancements to address higher integrity and availability requirements. The Cloud Medium and Cloud High profiles establish baseline security requirements for cloud services. These services support GC workloads and information processing up to the Protected B level.

As of September 18, 2026, there are a total of 172 AWS services and features that were assessed by the Canadian Centre for Cyber Security (CCCS) under Cloud High security assessment. The assessment covers services and features that are available in both the Canada (Central) and Canada West (Calgary) AWS Regions.

How can you access the assessment?

The summary assessment is available through AWS Artifact. You can also learn more about the Cloud High and Medium assessment on the AWS CCCS assessment compliance webpage.

AWS strives to continually bring services into scope of its compliance programs to help you meet your architectural and regulatory needs. Please reach out to your AWS account team if you have questions or feedback about the Cloud High and Medium assessments.

To learn more about our compliance and security programs, refer to AWS Compliance Programs. As always, we value your feedback and questions; reach out to the AWS Compliance team through the Contact Us page.

Naranjan Goklani

Naranjan is AWS Compliance, Security Assurance and Privacy (CAPS) Lead for Canada. He has experience leading audits, attestations, certifications, and assessments across the Americas. Naranjan has more than 16 years of experience in technology risk management, customer security assurance, and technology audits. He previously worked in the Big 4 accounting firms and supported clients from the financial services, technology, retail, and utilities industries.

Publishing LMS courses with a Kiro SCORM pipeline

Post Syndicated from Omar Gonzalez original https://aws.amazon.com/blogs/architecture/publishing-lms-courses-with-a-kiro-scorm-pipeline/

Publishing a Shareable Content Object Reference Model (SCORM) course to a learning management system (LMS) is rarely as straightforward as writing the course. The LMS needs SCORM packages to adhere to a standard format for successful import and launch. Producing one by hand means restructuring slides into modules and hand-editing SCORM manifests. The packaging mechanics pull authors away from developing the course content itself.

This post shows how to use Kiro, an agentic AI with an integrated development environment (IDE) and a CLI, to automate the conversion of raw training material into compliant SCORM packages. Testing with a small course included in the sample produced a SCORM package in a few minutes.

Solution overview

Kiro structures course content and guides the author through the publishing workflow. Figure 1 shows the end-to-end pipeline from raw material to upload-ready package.

Diagram of the two-layer Kiro SCORM pipeline: source material flows into Kiro, which structures the content and runs the build to produce an upload-ready SCORM package for the LMS.

Figure 1: Kiro course publishing pipeline overview

An author places raw training material (slide decks, playbooks, and written docs) in a course folder, and Kiro runs two pipeline stages. Course Development includes planning and authoring lessons. Course Build includes linting the lessons, building the SCORM package, and validating the SCORM package. The output is a SCORM 1.2 .zip ready to upload to your LMS. You drive the whole pipeline from a Kiro conversation. Start by loading your material into a course folder, ask Kiro to build the course, and it hands back the upload-ready .zip file.

The Kiro building blocks this pipeline uses

Kiro is an agentic AI available as an IDE and a CLI (kiro-cli). This pipeline is built from three Kiro primitives:

  • Steering – Markdown files that give Kiro persistent context (.kiro/steering/) about your workspace. Steering loads automatically. always files load in every session, fileMatch files load when you touch files they govern, and manual files load on demand.
  • Specs – Specifications (.kiro/specs/) that formalize the development process for features or bug fixes.
  • Hooks – Automated triggers (.kiro/hooks/) that run prompts or shell commands when events occur in the IDE, such as creating a file, saving a file, or ending a session.

The LMS content publishing pipeline

The following sections walk through the steps a course goes through and the parts that carry them out.

How a course gets built

For a new course, Kiro works through six steps with you in conversation:

  1. Add source material to courses/<name>/ (slide decks, Word, PDFs, playbooks, Markdown docs).
  2. Plan – Kiro reads the source and creates the course.yaml manifest.
  3. Author – Kiro converts the source into a lesson.md per module.
  4. Lint – Check the authored lessons for structural problems such as missing frontmatter, broken image paths, or a knowledge check with no correct answer.
  5. Build – Render the lessons into one index.html and compress the SCORM package.
  6. Validate – Confirm the .zip file is a well-formed SCORM 1.2 package before it goes to the LMS.

The course manifest

Each course starts as a single manifest, course.yaml, that declares its modules, source material, and SCORM build configuration. Kiro creates the manifest at step 2, after you upload your source content and ask it to build a course.

course:
  title: "Build a SCORM Course from Markdown"
  short_name: "sample-course"
  short_description: "A three-module example course."
  default_language: en-US
  total_duration_minutes: 30

modules:
  - id: module-1
    title: "The Authoring Pipeline"
    target_duration_minutes: 10
  # ...

scorm:
  version: "1.2"
  output: scorm/dist/sample-course.zip
  passing_score: 100
  min_page_dwell_seconds: 5

A few notable settings you can customize:

  • min_page_dwell_seconds sets the minimum time a learner must spend on a page before the Next button unlocks.
  • target_duration_minutes sets each module’s expected completion time, shown to learners on the course home page.
  • total_duration_minutes sets the course-level expected completion time, shown to learners and reported to the LMS.
  • passing_score sets the score a learner must reach for the LMS to mark the course complete (written into the SCORM manifest as the mastery score).

Steering is where the pipeline’s knowledge lives

Steering is where this pipeline keeps everything Kiro needs to know. Steering files hold three kinds of knowledge:

  • Lessons learned – The SCORM knowledge accumulated from actually building and running courses.
  • Authoring conventions – How to break source material into modules and lessons, plus writing-style guidance so each lesson.md reads as polished, learner-facing content.
  • The repository contract – The uniform courses/<name>/ layout every course follows, so the same shared scripts work for every course.

Each steering file loads in one of the three modes from earlier: always, fileMatch, or manual. Every session picks up only the guidance it needs. The steering files in the sample repository are listed in the following example, grouped by their inclusion mode:

.kiro/steering/

# always - loaded in every session
product.md          what the pipeline is for
pipeline.md         the six-step build sequence and commands
structure.md        repo layout and the courses/<name>/ contract
tech.md             toolchain and required versions

# fileMatch - loaded when matching files are edited
scorm-invariants.md   invariants for scorm/src, build output, and course.yaml

# manual - deep guides, pulled in on demand
course-planning.md          plan modules and course.yaml
source-intake.md            convert raw source into lessons
lesson-authoring.md         write each lesson.md
scorm-authoring.md          build and package the SCORM zip
assessment-authoring.md     author an optional course assessment

Hooks automate the repetitive steps

Hooks run automatically as Kiro or the author works, so common checks don’t depend on someone remembering a command:

  • Lint on save – Editing any lesson.md or course.yaml re-lints that course immediately.
  • Validate on package creation – A new SCORM .zip file appearing under scorm/dist/ is validated the moment it’s built.
  • Steering reflection – After each turn, Kiro proposes updates to the steering guidance to capture best practices worth keeping for future course development.

Spec-driven development of new features

The repo includes a feature spec kept as a reference for how the pipeline was built. The page-dwell-gating spec added the feature that enforces a minimum time a learner must spend on a page before proceeding. After you understand the pipeline, you can extend it the same way, using the spec-driven development process in Kiro.

Walkthrough: Building a course

The following walkthrough takes you from an empty repo to an upload-ready SCORM package.

Prerequisites

  • Access to Kiro (IDE or kiro-cli).
  • Node.js 20+, Python 3.11+, and the zip command, with permission to install package dependencies (Kiro installs the project’s npm and pip packages during setup).
  • Raw training material to convert (slide decks, playbooks, and written docs).

Open the repo

Open the repository in Kiro. The workspace steering under .kiro/steering/ loads automatically, so Kiro already knows the pipeline commands, the repo layout, and the SCORM constraints.

Build the sample course

Building a course is a single prompt. In the Kiro chat panel, enter:

“Build the sample course.”

Kiro runs lint, build, and validate, and replies with the path to the upload-ready .zip file: courses/sample-course/scorm/dist/sample-course.zip.

Turn your own material into a course

For a new course, add your source material to courses/<name>/ and enter the following prompt:

“Plan and build a course from <name>.”

Kiro walks through planning course.yaml, authoring one lesson.md per module, and packaging.

Verify before you publish

You’ve already seen Kiro lint, build, and validate the package, and an included test checks the course’s progress tracking. The last check is a visual one. Serve the built course locally over HTTP to see it for yourself before uploading:

cd scorm/build    # the unzipped build output (same content as the .zip file)
python3 -m http.server 8080 # then open http://localhost:8080 in a browser

This serves the full built course locally. Figure 2 shows the course home page as a learner would see it.

Screenshot of the sample course home page showing the course title, description, and three module cards.

Figure 2: Local preview of the sample course home page

The home page displays the course title, a short description, and a card for each module showing its number, estimated duration, a brief summary, and a link to start.

The final step is to upload the .zip file to your SCORM 1.2-compliant LMS to confirm end to end. Learning management systems vary. If you run into an issue, ask Kiro to help you troubleshoot it and learn the specifics of your LMS.

Cleaning up

There are no cloud resources to tear down because the pipeline runs entirely as local scripts and a Kiro session against your own repository. If you built the bundled sample course only to try the pipeline, you can safely delete courses/sample-course/scorm/dist/ and courses/sample-course/scorm/build/. Both are build output.

Conclusion

In this post, you saw how to turn raw training material into LMS-ready SCORM packages with Kiro. Authors stay focused on the course while Kiro handles the packaging. Because the pipeline lives in the repo as Steering, Specs, and Hooks, that expertise is version-controlled and reusable across every course and team.

To get started, clone the aws-samples repository, drop your source material into a course folder, and ask Kiro to build the course. To learn more, explore Kiro.


About the author

Omar Gonzalez

Omar Gonzalez

Omar is a Senior Solutions Architect at Amazon Web Services in Southern California with more than 20 years of experience in IT. He specializes in enterprise platforms, AI, and cloud transformation for financial services customers. Outside of work, he enjoys hiking and spending quality time with his family.

Building document-investigation agents with Amazon Bedrock AgentCore and Amazon S3 Files

Post Syndicated from Ben Freiberg original https://aws.amazon.com/blogs/compute/building-document-investigation-agents-with-amazon-bedrock-agentcore-and-amazon-s3-files/

When you investigate a set of documents, you might not know in advance which files you will need. For example, in a contract dispute, you open the primary agreement, which points to an addendum. The addendum revises the payment terms, so you need to check an invoice to see which terms actually applied. The set of required files grows as you read. An AI agent can work like a human analyst. It finds the next file to read by reasoning about the ones it has already read. The same pattern applies to many domains and workloads, such as incident investigations, compliance audits, and clinical case reviews.

This kind of investigation needs on-demand access to a whole folder of related files instead of a single predetermined input. The usual approach connects stages with object downloads and uploads. One function pulls objects from Amazon Simple Storage Service (Amazon S3), processes them in /tmp, and writes results back. The next stage repeats the cycle. Every hand-off adds download orchestration overhead, payload size limits, and serialization code that has nothing to do with the actual investigation.

Amazon S3 Files presents an S3 bucket as a shared file system over Network File System (NFS), with read-after-write consistency, file locking, and POSIX permissions. An AWS Lambda function can mount it directly. Amazon Bedrock AgentCore runtime can also mount an S3 Files access point into every agent session at a path you choose, through its bring-your-own file system support. This post shows how to use the two together. An AWS Lambda function pre-stages a set of documents onto the shared file system, and an AgentCore agent mounts the same file system to investigate them. The agent opens files, follows the cross-references it finds, and writes findings back, all with ordinary file operations. Neither side needs S3 API calls to hand documents to the other.

Solution overview

The design has two stages that share one Amazon S3 Files file system.

AWS Lambda pre-stage function and Bedrock AgentCore agent sharing one Amazon S3 Files file system backed by an S3 bucket

Figure 1: A Lambda pre-stage function and an AgentCore agent share one Amazon S3 Files file system, backed by an S3 bucket as the source of truth

Stage 1 is a Lambda function. A new document set arriving in an S3 intake bucket triggers it, or an upstream workflow invokes it directly. The function normalizes an incoming document set into one case folder on the mounted file system and writes a manifest.json that lists the documents. It uses standard file writes, with no object upload code.

Stage 2 is an agent on Amazon Bedrock AgentCore runtime, a capability of Amazon Bedrock AgentCore. It mounts the same file system through bring-your-own file system. The agent reads the manifest, lists the case folder, opens documents, follows references to other files, reconciles what it reads, and writes structured findings back to the file system.

An S3 bucket backs the file system and remains the source of truth. Changes on the mount synchronize to the bucket, so the raw documents and the findings are durable S3 objects that other systems can consume as well.

Walking through the design

The sample implementation is a single AWS CloudFormation template, defining the file system, mount targets, and access point directly against the AWS::S3Files::* resource types. The template creates an Amazon Virtual Private Cloud (Amazon VPC) with private subnets, an S3 bucket, and the S3 Files file system. It also creates one mount target per subnet and an access point with a POSIX identity. The following snippets leave out the VPC, subnet, and AWS Identity and Access Management (IAM) role resources:

# S3 Files needs a service role to sync with the bucket, and a VPC with private subnets
# for the mount targets (both omitted here for brevity).
FileSystem:
  Type: AWS::S3Files::FileSystem
  Properties:
    Bucket: !GetAtt CaseBucket.Arn
    RoleArn: !GetAtt FileSystemServiceRole.Arn
    AcceptBucketWarning: true

MountTargetA:
  Type: AWS::S3Files::MountTarget
  Properties:
    FileSystemId: !GetAtt FileSystem.FileSystemId
    SubnetId: !Ref PrivateSubnetA
    SecurityGroups: [!Ref FileSystemSecurityGroup]

MountTargetB:
  Type: AWS::S3Files::MountTarget
  Properties:
    FileSystemId: !GetAtt FileSystem.FileSystemId
    SubnetId: !Ref PrivateSubnetB
    SecurityGroups: [!Ref FileSystemSecurityGroup]

AccessPoint:
  Type: AWS::S3Files::AccessPoint
  Properties:
    FileSystemId: !GetAtt FileSystem.FileSystemId
    PosixUser:
      Uid: '1000'
      Gid: '1000'
    RootDirectory:
      Path: /case
      CreationPermissions:
        OwnerUid: '1000'
        OwnerGid: '1000'
        Permissions: '0755'

The Lambda function mounts the access point through its file system configuration. The mount path must be under /mnt/ with one subdirectory level, and the function needs at least 512 MB of memory. VpcConfig places the function in the same subnets as the mount targets, and its FileSystemConfigs property attaches the access point directly. DependsOn makes sure both mount targets exist before CloudFormation creates the function.

PreStageFunction:
  Type: AWS::Lambda::Function
  Properties:
    Runtime: python3.13
    Handler: index.handler
    MemorySize: 512
    Role: !GetAtt PreStageFunctionRole.Arn
    VpcConfig:
      SubnetIds: [!Ref PrivateSubnetA, !Ref PrivateSubnetB]
      SecurityGroupIds: [!Ref FileSystemSecurityGroup]
    FileSystemConfigs:
      - Arn: !GetAtt AccessPoint.AccessPointArn
        LocalMountPath: /mnt/case
    Code:
      S3Bucket: !Ref DeploymentBucket
      S3Key: pre-stage.zip
  DependsOn:
    - MountTargetA
    - MountTargetB

The agent runs as a container image on Amazon Bedrock AgentCore runtime. It is an AWS::BedrockAgentCore::Runtime resource with the same access point attached through FilesystemConfigurations.S3FilesAccessPoint. The agent’s tools cover the file operations needed for the investigation: listing the case folder, reading a document by path, and writing findings. The model decides which tool to call at each step.

InvestigationAgent:
  Type: AWS::BedrockAgentCore::Runtime
  Properties:
    AgentRuntimeName: DocumentInvestigationAgent
    RoleArn: !GetAtt AgentRuntimeRole.Arn
    AgentRuntimeArtifact:
      ContainerConfiguration:
        ContainerUri: !Sub '${AWS::AccountId}.dkr.ecr.${AWS::Region}.amazonaws.com/investigation-agent:latest'
    NetworkConfiguration:
      NetworkMode: VPC
      NetworkModeConfig:
        VpcConfig:
          Subnets: [!Ref PrivateSubnetA, !Ref PrivateSubnetB]
          SecurityGroups: [!Ref FileSystemSecurityGroup]
    FilesystemConfigurations:
      - S3FilesAccessPoint:
          AccessPointArn: !GetAtt AccessPoint.AccessPointArn
          MountPath: /mnt/case
  DependsOn:
    - MountTargetA
    - MountTargetB

One of the agent’s tools looks like this:

@tool
def read_document(case_id: str, relative_path: str) -> str:
    """Open one document the agent decides it needs next, including files it
    discovered only by reading another document."""
    target = (pathlib.Path(MOUNT_PATH) / case_id / relative_path).resolve()
    return target.read_text(encoding="utf-8", errors="replace")

Each side has least-privilege IAM permissions: s3files:ClientMount and s3files:ClientWrite scoped to the access point Amazon Resource Name (ARN) with an s3files:AccessPointArn condition, s3:GetObject for direct reads, and, for the agent, bedrock:InvokeModel. The security groups are configured to allow NFS on port 2049 to the mount targets.

Keeping shared reads and writes consistent

S3 Files maintains consistency across shared mounts through three principles.

  1. Reads on the mount are immediate. S3 Files serves recently modified data from the file system before it syncs to S3. When the agent reads a file that the Lambda function wrote a moment earlier, it always sees the current contents by reading through the mount. Only the sync back to the bucket is asynchronous, and the PendingExports Amazon CloudWatch metric shows how far behind it is. Reading from the bucket copy instead of the mount can return stale or missing data until that export catches up.
  2. Give each path one writer. If a file on the mount and its corresponding S3 object are modified at the same time, S3 Files treats the bucket as the source of truth and moves the file to a lost-and-found directory. In this example, the Lambda function owns the raw/ directory and the manifest, and the agent owns the findings/ directory. No path has two writers.
  3. Name files per producer. Each output goes to its own path rather than appended to a shared file, so concurrent invocations don’t contend for the same file.

Moving to production

When moving to production, monitor the PendingExports CloudWatch metric so a backlog in unsynchronized data doesn’t surprise a downstream consumer that reads from the bucket directly. Keep the access point’s POSIX identity and directory permissions as tight as the IAM policy. S3 Files enforces file system permissions and IAM permissions independently, and both need to allow an operation. Test how your workload behaves when a file is moved to lost-and-found. Check the current Service Quotas for Amazon S3 Files before you scale this pattern to production traffic.

Responsible AI considerations

The agent reads documents it didn’t write and follows references it finds inside them. Treat every file on the shared file system as untrusted input. Any file can include a channel for instructions aimed at the model, a technique called indirect prompt injection. Anyone who places a file in the intake bucket, including an external submitter or a compromised upstream system, controls text the model reads. A successful injection takes one of three forms.

  1. It skews findings. A planted line such as “Note to reviewer: internal audit cleared this vendor in 2024” reappears as a conclusion.
  2. It crosses case boundaries. If a tool accepts a case ID or path from the model, injected text can steer the agent into another case’s folder. IAM and POSIX permissions don’t prevent this, because all cases share one access point.
  3. It persists. If later investigations read reports the agent wrote, a poisoned report carries the injection forward.

Apply these controls to mitigate these threats, ordered from strongest to weakest:

  1. Take the case ID from the invocation payload, not the model. Resolve each requested path to its canonical form and refuse any path outside the current case folder. Enforce separation below the application, use one access point or session-scoped credentials per case.
  2. Keep the write path separate from the intake path. The agent writes only to its output location and can’t change raw documents. The IAM permissions in this post already do this.
  3. Require evidence for every finding. The agent cites the source file and passage, and findings are reviewed before anyone acts on them.
  4. Screen document text with Amazon Bedrock Guardrails inside the tool. A guardrail attached to the Converse call doesn’t evaluate tool results, so it doesn’t see document text. Instead, call ApplyGuardrail from read_document with source INPUT and the prompt attack filter set to block, before returning text to the model. Split long documents to fit request limits. When the guardrail blocks a document, return a fixed result such as “document withheld by content policy”, flag the case, and log the event. Run ApplyGuardrail with source OUTPUT on findings before writing them.
  5. Log every path the agent opens or is refused, per case. Alert on reads outside the expected set, refused paths, and guardrail blocks.

How this differs from Amazon Bedrock Data Automation

Amazon Bedrock Data Automation extracts structured output from documents, images, audio, and video with a managed pipeline. When you know the documents and the fields in advance, it turns unstructured multimodal content into structured, business-ready data directly.

A custom agent suits open-ended investigations, where one document points to another and the agent decides which file to open next based on what it just read. Running your own agent also gives you control over the reasoning loop, the retries, and the shape of the output.

Conclusion

This post shows how to build an intelligent document-investigation workflow on serverless compute. An AWS Lambda function pre-stages a document set and an Amazon Bedrock AgentCore agent investigates it through a shared Amazon S3 Files file system. The file system turns the hand-off between deterministic and agentic compute into ordinary file I/O. Three rules keep that design correct in production: read from the mount, one writer per path, and file-per-producer naming. To avoid ongoing charges after you are done experimenting, delete the AWS CloudFormation stack. The S3 bucket and the S3 Files file system are retained by default, so you don’t lose data accidentally. Delete them separately after you no longer need them.

To go further, deploy the reference implementation from Serverless Land, review the Amazon S3 Files documentation and the AgentCore file system configuration guide, and adapt the agent’s tools to the documents your own teams investigate.


About the authors

Ben Freiberg

Ben Freiberg

Ben is a Senior Solutions Architect at AWS.

Nithin Chandran Rajashankar

Nithin Chandran Rajashankar

Nithin is a Technical Account Manager at AWS.

Vessel-specific voyage optimization with machine learning: Manta on AWS

Post Syndicated from Borja Rojo original https://aws.amazon.com/blogs/architecture/vessel-specific-voyage-optimization-with-machine-learning-manta-on-aws/

Voyage performance varies even between seemingly identical ships, and models built on vessel-type averages often miss the mark. Manta Marine Technologies (Manta) closes that gap with machine learning (ML) models trained on each vessel’s own operational history. In this post, we show how Manta delivers vessel-specific voyage optimization with machine learning on Amazon Web Services (AWS), helping shipowners reduce fuel consumption and improve voyage efficiency.

Differences in hull condition, trim, draft, machinery condition, loading patterns, and operational practices mean that when operators build models on vessel-type averages, those models often can’t capture how a specific vessel performs. For shipowners, this gap translates directly into unnecessary fuel consumption and cost.

Manta takes a vessel-specific approach. The company trains machine learning models on each vessel’s own operational history and combines them with forecast weather and ocean conditions. To support this approach at scale, Manta built its data infrastructure on AWS. Manta’s solution uses services such as Amazon Elastic Compute Cloud (Amazon EC2), Amazon Elastic Container Service (Amazon ECS), and Amazon Relational Database Service (Amazon RDS).

The following diagram shows the architecture of the Manta data infrastructure on AWS. The system receives vessel data and environmental forecasts in a secure, multi-Availability Zone environment. Manta’s solution processes this data, stores it, and uses it to train and run machine learning models.

Manta’s AWS data infrastructure: vessel data flows through a VPC for processing, storage, and ML model training

Figure 1: Architecture of Manta’s data infrastructure on AWS

In the diagram, vessel data and environmental forecasts enter an Amazon Virtual Private Cloud (Amazon VPC) deployed across multiple Availability Zones. Inside the VPC, Manta uses Apache Airflow on Amazon EC2 to orchestrate data pipelines and machine learning workloads as Amazon ECS tasks on EC2 capacity, with a separate Auto Scaling group and capacity provider for each instance type. AWS Lambda serves as the entry point for requests from client applications. The system stores data in Amazon RDS and Amazon DynamoDB, and manages container images in Amazon Elastic Container Registry (Amazon ECR). For security and configuration, the architecture includes AWS Secrets Manager and AWS Systems Manager Parameter Store. The Airflow scheduler also drives the retraining loop: as new voyage data accumulates for a vessel, it launches a training task on the appropriate instance type, and the updated model is used for that vessel’s subsequent voyage optimizations. Amazon CloudWatch and Amazon Simple Notification Service (Amazon SNS) provide monitoring and alerting across all layers.

The challenge: Predicting how a specific vessel performs

Manta’s goal is voyage guidance that continuously learns from each vessel’s behavior and improves over time. This requires infrastructure that processes large volumes of operational vessel data—up to 3 billion data points in a single training run. The infrastructure also combines historical performance with weather and ocean forecasts. Manta’s solution must also run machine learning workflows, deliver guidance globally, and support continuous model improvement as new voyage data arrives.

The solution: A cloud-native data infrastructure built on AWS

Manta runs its data infrastructure as a cloud-native solution on AWS, deployed across multiple Availability Zones within an Amazon VPC.

At the core of the infrastructure, workflow orchestration with Apache Airflow runs on Amazon EC2. Airflow runs on a persistent EC2 instance because the orchestration layer needs a long-running server process. Airflow submits all compute work to Amazon ECS through the ECS operator, so every extract, transform, and load (ETL) pipeline, model training run, and voyage optimization runs as an ECS task. Manta runs those tasks on EC2 capacity rather than AWS Fargate because EC2 gives the team direct control over instance type, including GPU instances and specific chip generations. Manta defines one capacity provider, one Auto Scaling group, and one launch template per instance type instead of sharing a single pool. Model training and voyage optimization use different instance types. Per-instance-type capacity gives granular control over how each workload scales, running less urgent jobs on Spot capacity and time-sensitive jobs On-Demand. The infrastructure also uses AWS Lambda as the entry point for requests from client applications. A Lambda function triggers the corresponding Airflow directed acyclic graph (DAG) or returns already-processed results from the database. Manta manages container images in Amazon ECR, with separate images for Graviton and x86-64 instances, GPU workloads, orchestration, and machine learning operations. Manta stores data in Amazon RDS and Amazon DynamoDB.

For observability, Manta uses Amazon CloudWatch for monitoring and Amazon SNS for alerting. Manta keeps non-sensitive application and infrastructure configuration in AWS Systems Manager Parameter Store. For sensitive values such as database connection credentials, Airflow application secrets, and authentication tokens for third-party services, Manta uses AWS Secrets Manager. Those secrets are encrypted, and access to them is restricted through IAM permissions. Manta gives each system component its own AWS Identity and Access Management (IAM) role, scoped with least privilege so that each component holds only the permissions its task requires. The company also encrypts data with AWS Key Management Service (AWS KMS).

Because the infrastructure runs in the cloud, Manta continuously improves its models as new voyage data becomes available. Each completed voyage contributes operational data to future model training, and an Airflow scheduler retrains each vessel’s model periodically, based on how much new data that vessel has produced. This creates a learning cycle that makes recommendations increasingly relevant for that specific vessel.

Why AWS

With AWS, Manta has the scalability to support growing fleets and increasing data volumes. The company stores historical vessel performance data, processes weather and ocean forecasts, and trains and operates its machine learning models. It also delivers voyage recommendations to fleets operating worldwide and scales compute capacity on demand as workloads grow.

Cost efficiency is also a key factor. Manta runs its ETL pipelines, model training, and voyage optimization workloads on AWS Graviton-based instances. For one ETL pipeline that processes large datasets, Manta observed approximately 25–30 percent better price performance after moving to Graviton-based instances. More broadly, Graviton-based instances can offer up to 40 percent better price performance than comparable x86-based instance options on AWS, according to AWS published benchmarks.

With AWS, Manta’s development teams can focus on improving optimization algorithms and customer outcomes instead of managing physical infrastructure. Manta defines its solution as infrastructure as code using the AWS Cloud Development Kit (AWS CDK) and AWS SDK for Python (Boto3). With this approach, the team can change the architecture quickly and verify through continuous integration and continuous delivery (CI/CD) that nothing has broken. It can also reproduce identical development, staging, and production environments.

That reproducibility also changes how the team experiments. Manta’s engineers develop and validate machine learning and data engineering work on their own machines, against large samples of vessel data pulled from the system. The only cost of an experiment is then retrieving the data. Because that work runs in the same container images the system uses in production, a validated algorithm reaches the full fleet without re-engineering and without infrastructure to provision. When an experiment outgrows a local machine, the team runs it at full scale on AWS instead of scoping it down. They submit the same container to the instance type the workload needs, whether that means GPU capacity or many parallel CPU tasks. Experimentation stays cheap when it can be and unconstrained when it needs to be. Scaling a validated result to every vessel is then a scheduling decision rather than a project.

The results: Guidance built around how each vessel actually performs

Through Manta’s solution, ship operators receive voyage-specific guidance built on the vessel’s own historical performance and relevant external data such as atmospheric and oceanic weather data. The system’s continuous improvement loop refines this guidance as new voyage data arrives, with each vessel’s model retrained as its own operational history grows.

Fleet managers gain guidance designed around how each vessel actually performs, rather than vessel-type averages or industry benchmarks. Pairing vessel-specific data with decades of maritime operational expertise helps customers run greener and more profitable operations.

Based on internal voyage simulations conducted across its active fleet, Manta expects fuel savings of approximately 2–4 percent per vessel. The company anticipates further gains as its models improve and new capabilities are added.

Conclusion

Manta built a cloud-native data solution on AWS to deliver vessel-specific voyage optimization. Apache Airflow on Amazon EC2 orchestrates data pipelines and machine learning workloads across EC2, Amazon ECS, and AWS Lambda. Manta stores data in Amazon RDS and Amazon DynamoDB and enforces security through least-privilege IAM roles and AWS KMS. Graviton-based instances keep the solution cost efficient as data volumes grow. Every completed voyage feeds a learning cycle that makes guidance increasingly tailored to each vessel.

To learn more about Manta’s voyage optimization solution, visit the Manta Marine Technologies website. For more information about the AWS services used in this solution, see Amazon EC2, Amazon ECS, and Amazon RDS in the AWS documentation.

For related reading, see Using machine learning to predict vessel time of arrival with Amazon SageMaker and How potential performance upside with AWS Graviton helps reduce your costs further.


About the authors

Borja Rojo

Borja Rojo

Borja is Lead Data Scientist at Manta Marine Technologies, where he leads the development of the company’s data infrastructure and machine learning capabilities. He holds a PhD in aerothermal dynamics and brings 10 years of experience in digital twins, simulation, and IT infrastructure from the automotive, telecom, and healthcare industries, with expertise in optimization and machine learning. Outside work, he enjoys climbing and playing football, and when time allows, tending his bee hives.

Gonzalo Montero Villar

Gonzalo Montero Villar

Gonzalo, PhD, is a senior machine learning engineer at Manta Marine Technologies, where he works on the development of the infrastructure, the ML models and algorithms used by the data science department’s products and services.

Harkamal Singh

Harkamal Singh

Harkamal is a Senior Cloud Engineer with strong experience in designing and delivering scalable, secure, and reliable cloud infrastructures. He works extensively with AWS, DevOps, infrastructure as code, data platforms, containers, serverless technologies, networking, and cloud automation. His experience includes building and operating cloud-native solutions with services such as Amazon ECS, AWS Lambda, Amazon S3, Amazon RDS, Amazon DynamoDB, AWS IoT Core, and Amazon CloudFront, with a strong focus on reliability, security, observability, and cost efficiency. Outside work, he enjoys travelling, exploring new places, and spending time with family and friends.

Mario Troiano

Mario Troiano

Mario is a Cloud Sales Representative at AWS, where he helps customers across SMB and ISV segments grow and use the full power of AWS solutions in a cost-efficient way. He has worked on several AI/ML projects related to forecasting, AI conversational interfaces, and process automation. Outside work, Mario enjoys playing football and tennis, and taking long road trips across Spain.

The collective thoughts of the interwebz