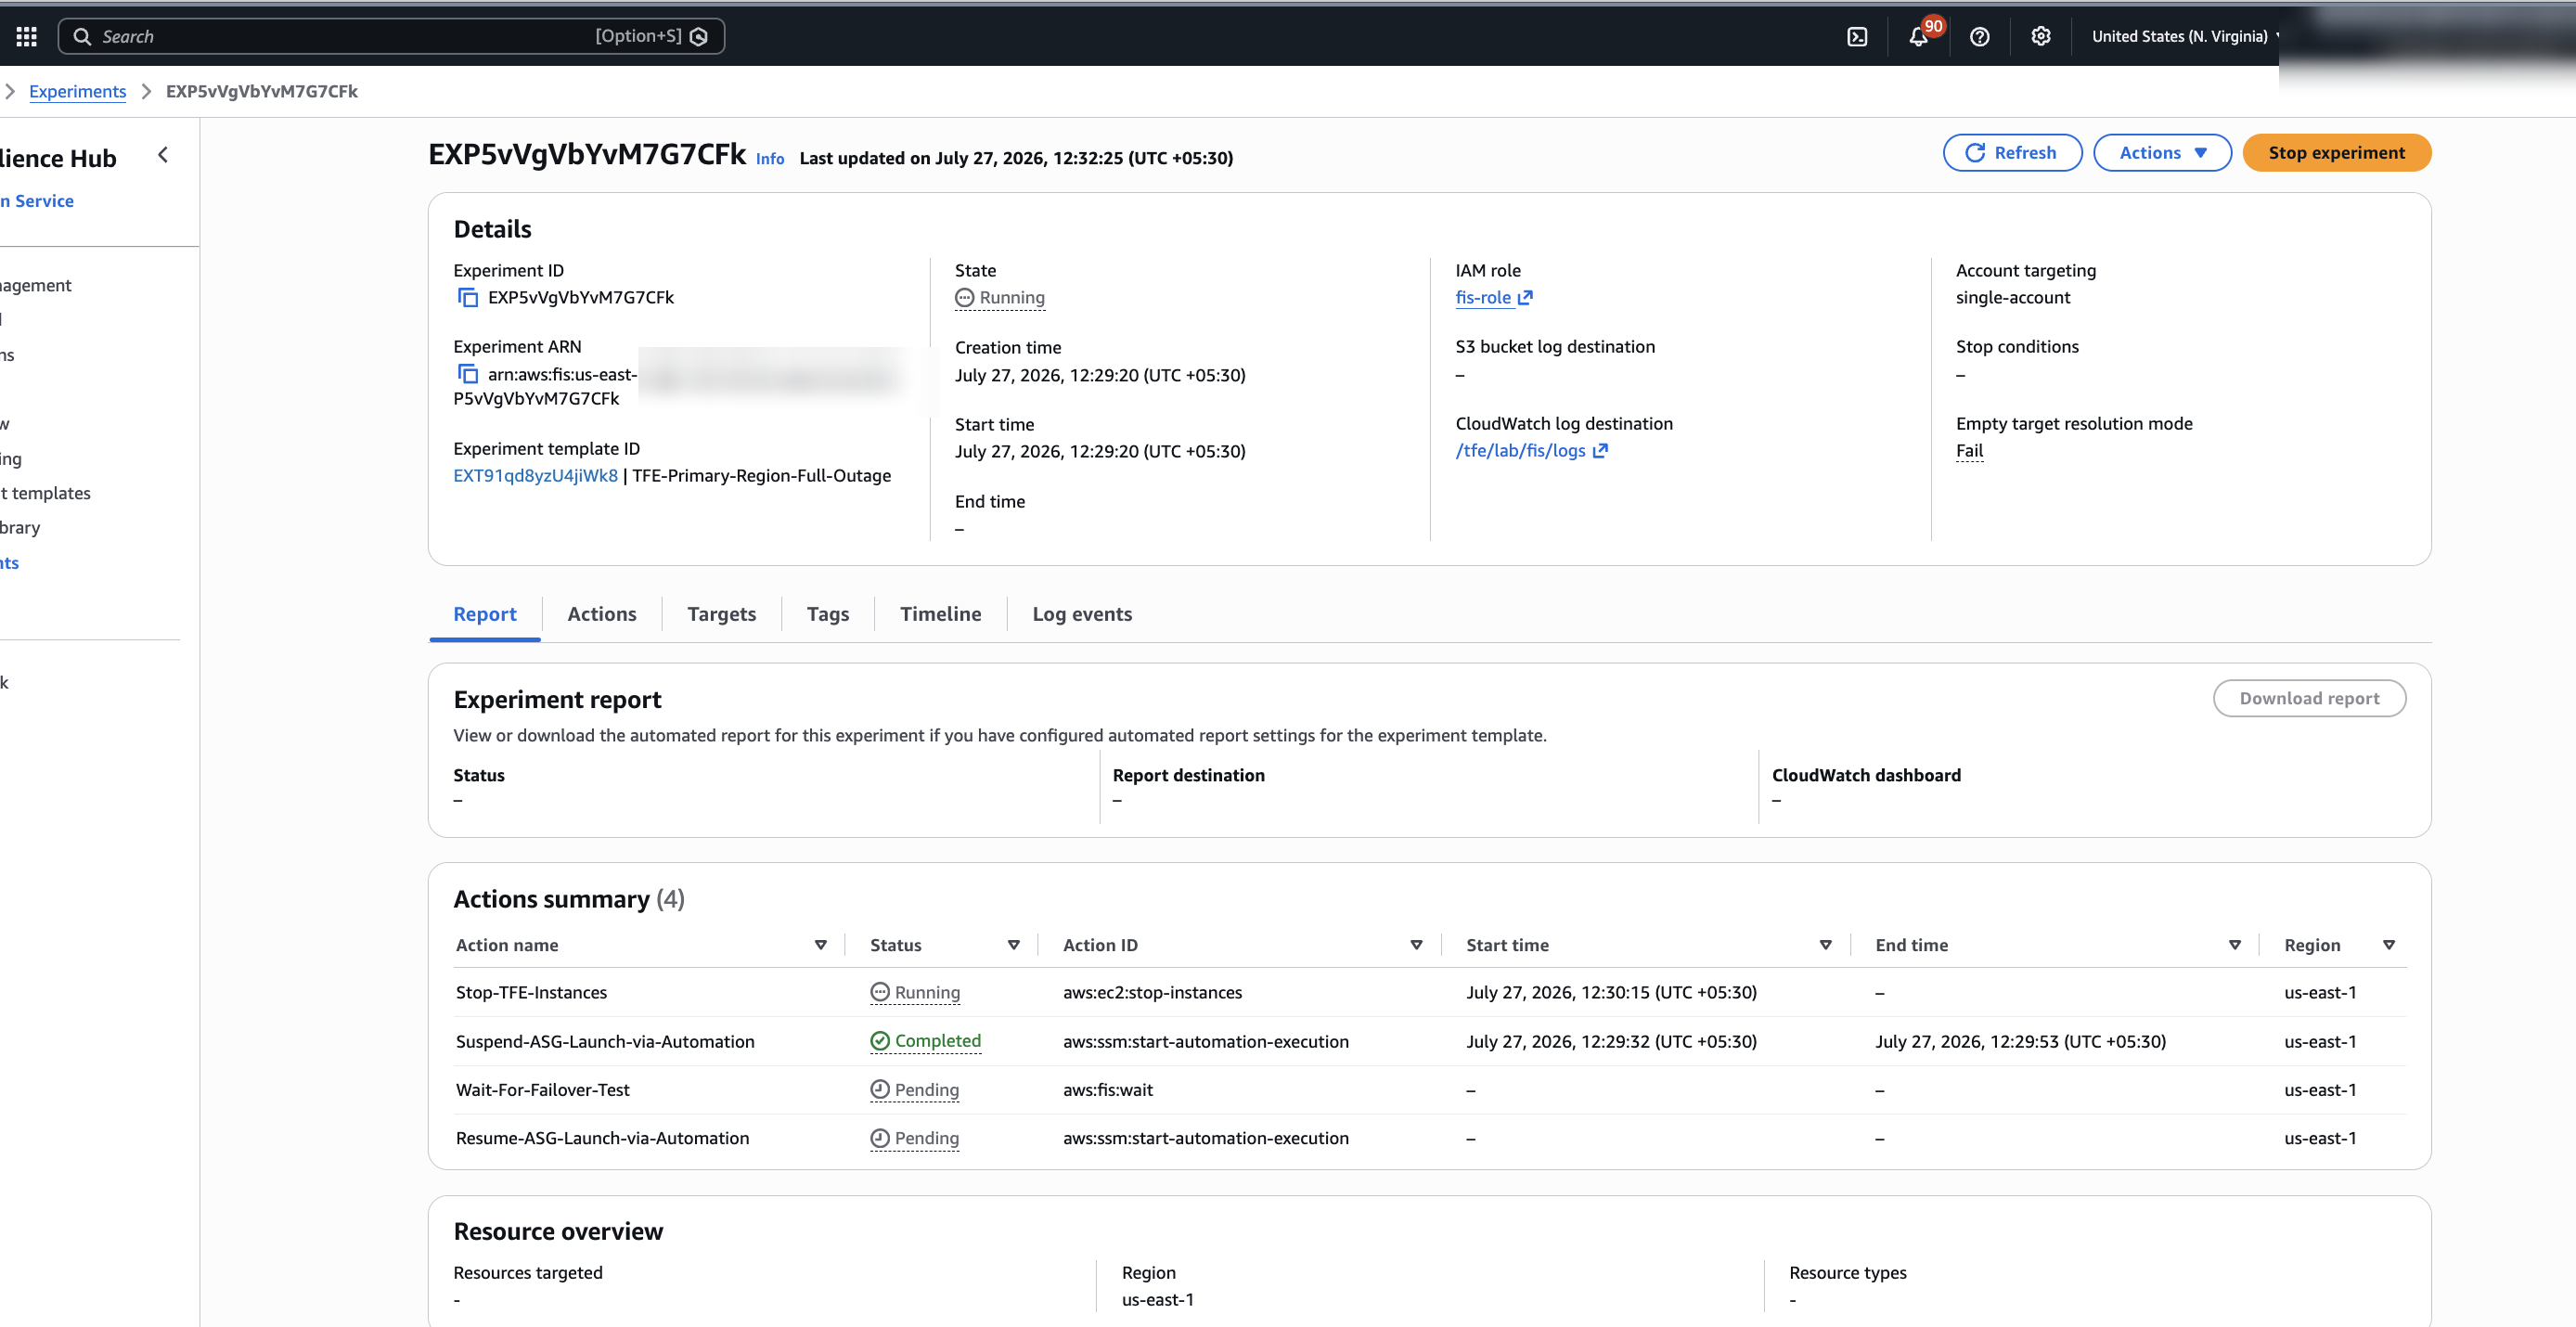
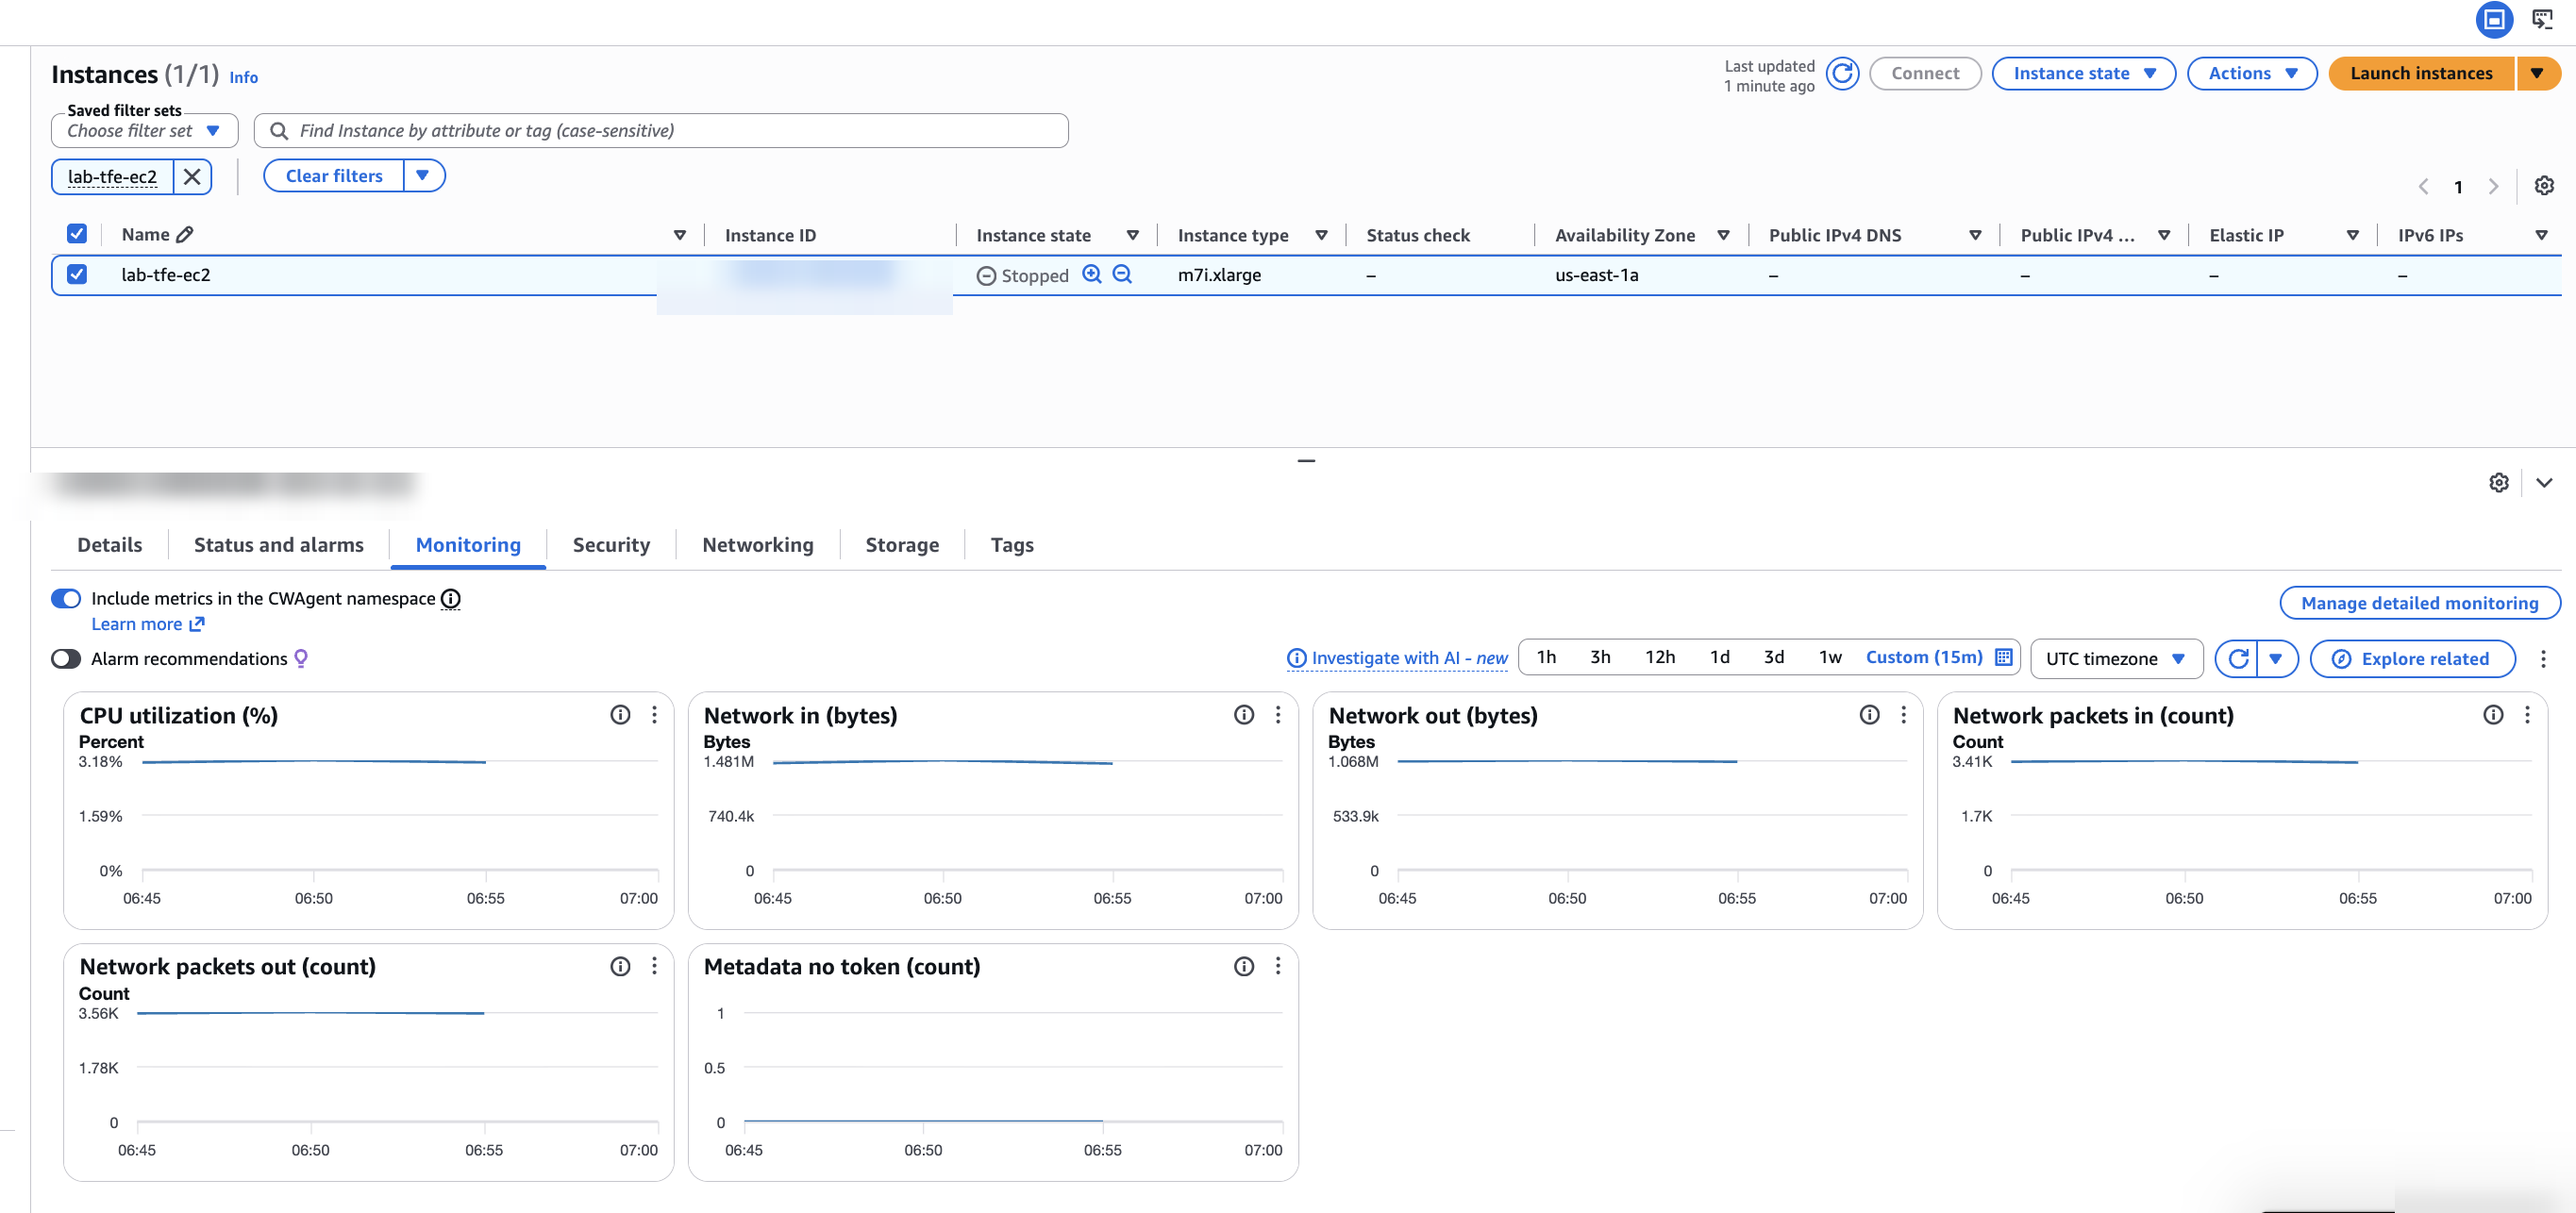
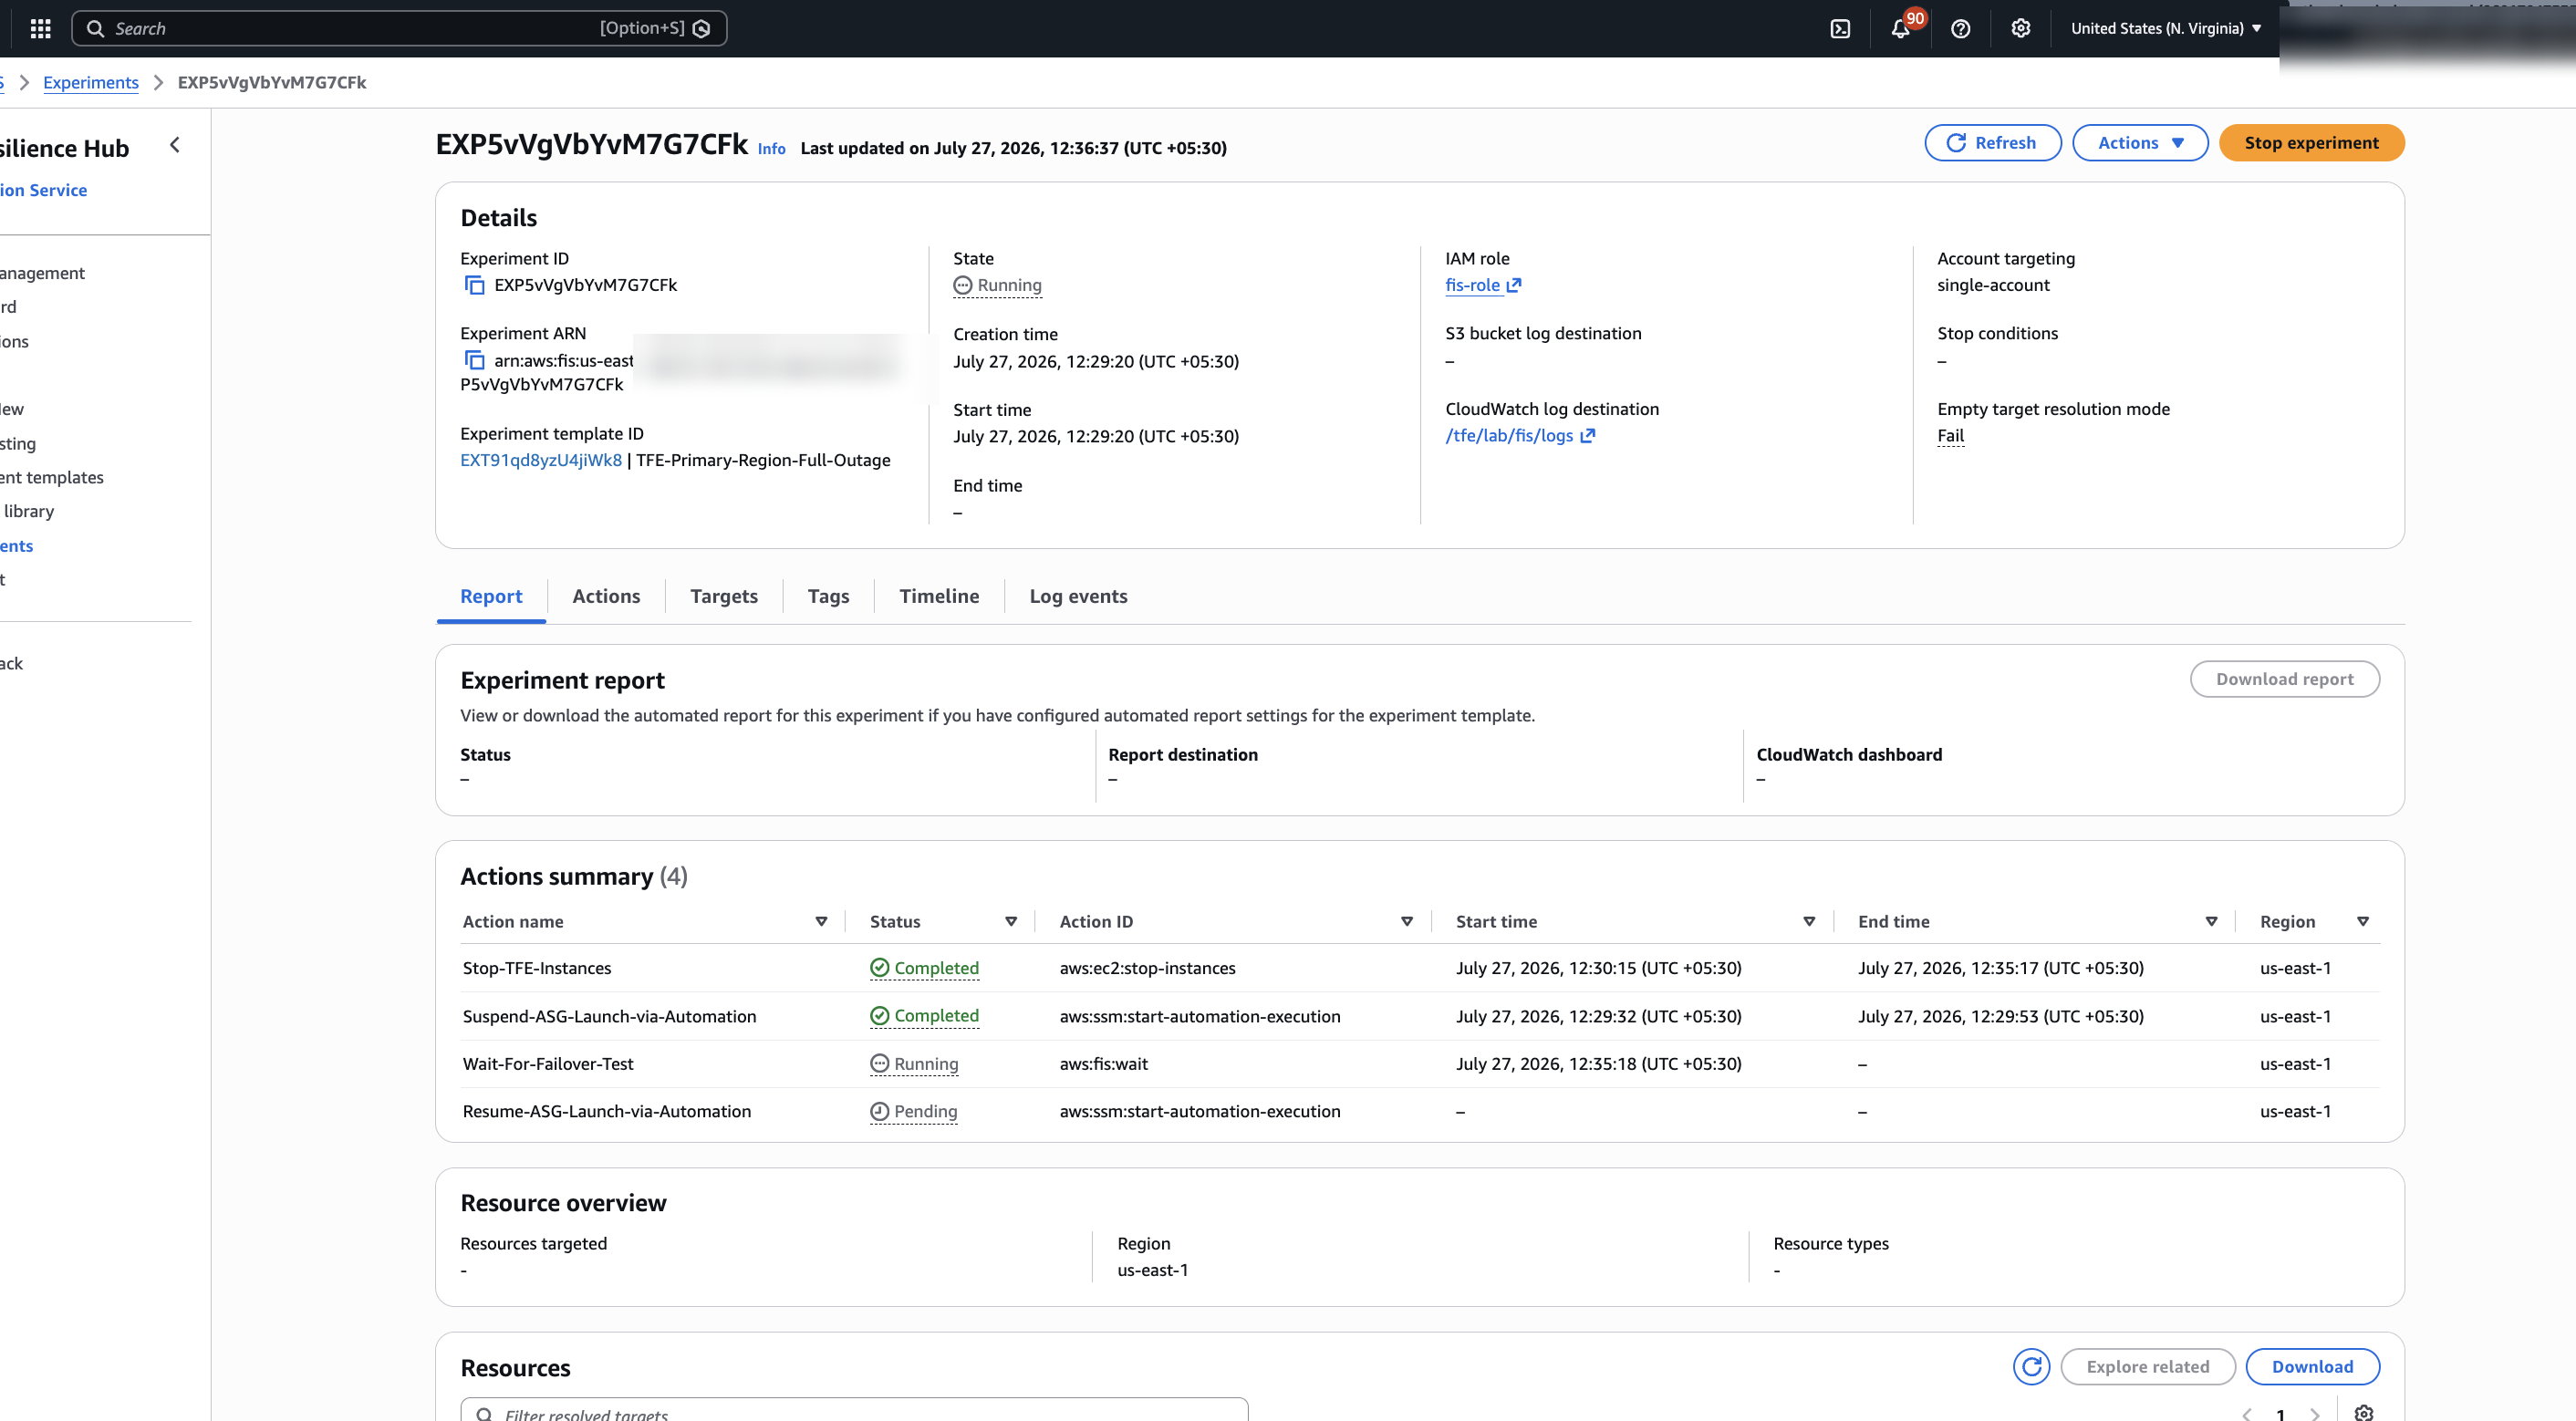
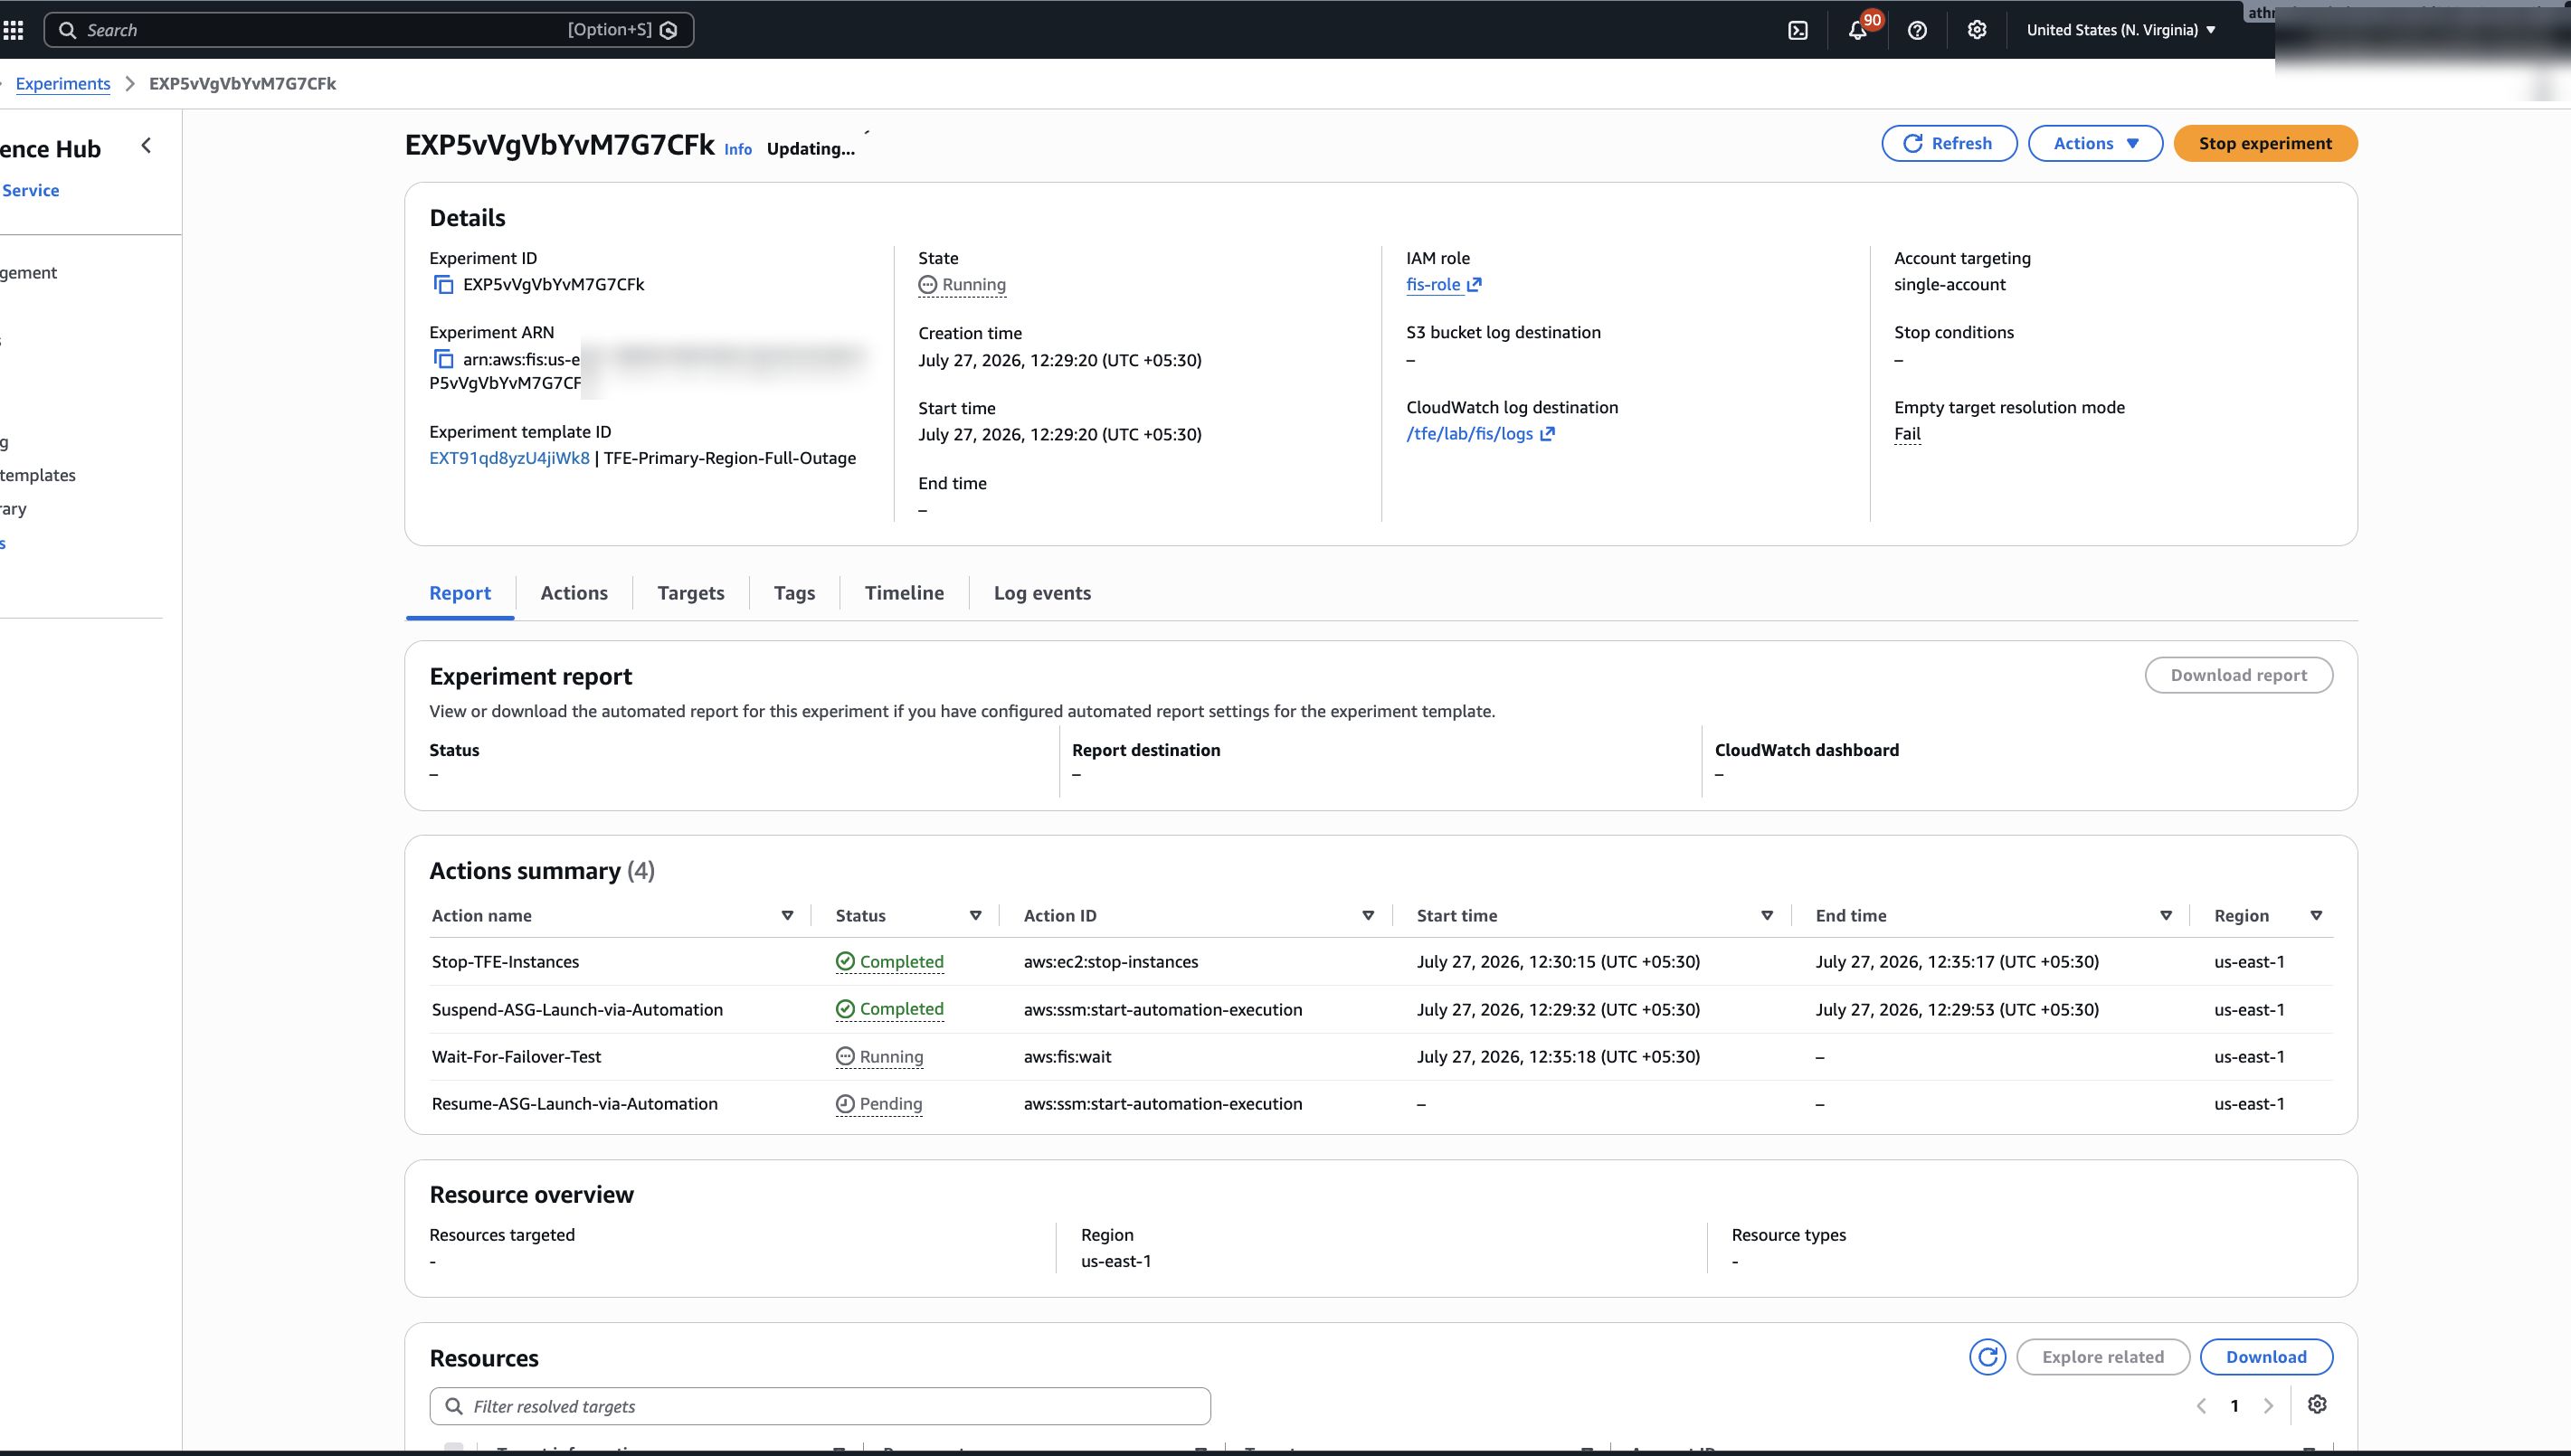
How do you handle unpredictable workload patterns that spike during promotional events or seasonal peaks? Multi-modal autoscaling with Amazon EC2 Auto Scaling combines infrastructure metrics like CPU with application-level signals, so a group scales on the demand its users create and not only on how busy the servers look. Those signals track the load that drives your business outcomes, such as sales or sign-ups.
CPU-based autoscaling works well for many workloads, but some demand does not register as CPU right away. Adding signals such as request counts and application metrics lets a group respond to the load its users create. By publishing Amazon CloudWatch custom metrics and application-driven triggers, you give Auto Scaling more information to act on.
In our testing, a group that scaled only on CPU rejected about 7,000 checkout sessions during a demand spike, and a stronger baseline that added Application Load Balancer request count still rejected about 6,900. A group that added an application metric rejected none, and it held p99 latency to about 0.43 seconds against 2.25 seconds for the CPU-only group. Predictive scaling can add a forecasting layer for cyclical demand, but it needs days of history to be useful, so we treat it as a complement. In this post, we show you how to implement multi-modal autoscaling on EC2 Auto Scaling, with code samples and results from a controlled test.
Prerequisites
To follow along, you need access to the following AWS services with appropriate permissions:
EC2 Auto Scaling, for scaling policies and group management.
The default target tracking policy in EC2 Auto Scaling uses average CPU utilization, a practical starting point because CPU usage is a universal characteristic of compute workloads. Adding complementary signals, such as application-level metrics or predictive forecasting, gives Auto Scaling more information to make timely capacity decisions.
In distributed architectures, different components can have distinct scaling characteristics. An API gateway might correlate well with request rate, while a background processor scales better on queue depth. With multi-modal scaling, you can match each component’s policy to its actual workload pattern. For containerized workloads, consider event-driven autoscaling with KEDA on Amazon Elastic Kubernetes Service (Amazon EKS).
Multi-modal autoscaling architecture
Multi-modal autoscaling combines three approaches to capacity management. Reactive scaling responds to current CloudWatch metrics, such as CPU utilization, memory, network throughput, response times, and custom application indicators. Application-metric scaling brings workload-specific signals into the decision, using custom CloudWatch metrics like active user sessions, queue depth, or transaction volume. These application metrics are often the closest measurable proxy for business activity such as orders or sign-ups. Predictive scaling uses machine learning in EC2 Auto Scaling to forecast capacity needs from historical patterns, so infrastructure scales before demand increases.
With application-metric scaling, applications can scale on signals that infrastructure metrics miss. An ecommerce platform might scale on active checkout sessions, while a streaming service scales on concurrent stream counts. In the test later in this post, we use active checkout sessions as the custom metric.
Implementing multi-modal autoscaling
This section builds the configuration in layers. Start with CPU target tracking as a baseline that every group keeps, then add a custom application metric that reflects real user load. The test later in this post compares these signals against a request-count baseline. Predictive scaling is an optional forecasting layer described at the end.
Step 1: CPU target tracking
Start with the foundation that most workloads already use: a target tracking policy on average CPU utilization. Target tracking is a managed policy that adjusts capacity to keep a metric at or near a target value. It supports predefined metrics, including CPU utilization and request count per target, and custom CloudWatch metrics. When multiple target tracking policies are active, Auto Scaling coordinates them: it scales out if any policy requires it, but scales in only when all policies agree, which helps prevent oscillation.
Our test also included a second infrastructure baseline, a target tracking policy on the load balancer’s request count per target. It uses the same structure with a predefined metric:
Step scaling is another option for spike handling. With step scaling, you can define different capacity increments for different alarm thresholds. It keeps evaluating the alarm during scaling activities, which can make it react faster than target tracking’s default evaluation window. Step scaling policies do not coordinate with each other.
Step 2: Add a custom application metric
Next, add a second target tracking policy on a custom CloudWatch metric that reflects application load. In our test, instances publish an active checkout sessions metric at a 10-second resolution. To act on that resolution, set a Period of 10 seconds on the policy. Without it, the policy waits for three 1-minute datapoints like any other and the high-resolution metric only adds publishing cost. With it, a scale-out can begin in about 30 seconds. The policy includes the Auto Scaling group dimension so it tracks the metric for the right group. We set the target to 100 active sessions per instance, about 75 percent of the measured per-instance capacity of 135. This leaves headroom to absorb a spike while new instances boot.
Predictive scaling is an optional forecasting layer. It uses machine learning in EC2 Auto Scaling to analyze historical load and scale ahead of recurring, cyclical demand, using customized metric specifications in ForecastAndScale mode. You need to provide several days of history for it to forecast well, so it complements reactive signals rather than replacing them. Start in ForecastOnly mode to watch the forecast before it drives any scaling.
Monitoring
Use CloudWatch dashboards to track how each policy contributes to scaling decisions, and set alarms on the metrics that matter for your workload, such as per-instance load or latency. Enable detailed monitoring on the launch template, with Monitoring set to true, so that the system publishes CPU metrics every minute. Without it, you cannot complete the CPU policy’s scale-in evaluation and your group will stop scaling in. Watching the policies side by side is what surfaced this scale-in behavior.
Performance results
We compared three Auto Scaling groups under an identical load profile in a single 75-minute test in the us-east-1 Region. Each group used c8g.large instances with a minimum of 6 and a maximum of 40 instances, and every group carried the same CPU target tracking policy at 70 percent as a fallback:
ASG A: CPU target tracking only. This is the single-signal infrastructure baseline.
ASG B: CPU target tracking plus an Application Load Balancer request-count policy. Request rate is a stronger infrastructure baseline than CPU alone.
ASG C: CPU target tracking plus the custom checkout-sessions metric at 10-second resolution, published with a Period of 10 seconds.
All the groups received the same load at the same time. During the shared ramp, arrival rate rose and every group scaled correctly, which makes the comparison fair. CPU crossed 70 percent on the CPU group, request count crossed its target of 300 on the request-count group, and all three converged to a similar size.
Ramp phase (arrivals 30% → 85%)
A: CPU only
B: A + ALB requests
C: A + app sessions
Instances (start → peak)
6 → 9
6 → 10
6 → 10
CPU
73.6%
74.0%
69.0%
Requests per target (target 300)
319
323
297
Then arrival rate was held flat while the number of concurrent checkout sessions kept rising, a shape that infrastructure signals cannot see. The next table reports that divergence phase, measured directly from CloudWatch and the load balancer.
Measured metric (divergence)
A: CPU only
B: A + ALB requests
C: A + app sessions
Instances (start → end)
11 → 11
11 → 11
11 → 22
Rejected checkouts
7,064
6,886
0
CPU (start → end)
67.2% → 45.1%
66.5% → 45.5%
66.2% → 36.8%
Peak sessions per instance
135
135
116
Requests per target
285 → 279
282 → 279
277 → 154
The difference is what each group could see. Arrival rate was held flat while the number of concurrent sessions rose, so CPU and request count stayed in range while the application saturated. The CPU-only and request-count groups held at 11 instances and rejected 7,064 and 6,886 checkouts. Their CPU even fell, from about 67 percent to about 45 percent, because a rejected request never reaches the work it would have done, so a policy targeting 70 percent saw spare capacity at the moment the application was failing users. The application-metric group read the rising sessions directly and scaled from 11 to 22 instances, rejecting none.
Effect on latency and errors
We measured latency and rejected checkouts on the load balancer during the test. At rest, all groups were identical. The gap opened only in the divergence phase, when concurrency rose without a matching change in arrival rate. Session slots are the scarce resource here, so sessions per instance is the causal driver of latency. The application group scales on sessions and we report latency as the outcome, rather than scaling on latency directly, which is not recommended for target tracking. The latency figures come from the load balancer’s TargetResponseTime at the end of the divergence phase. A client-side number measured over the internet would reflect network round-trip rather than the service.
Measured metric
A: CPU only
B: A + ALB requests
C: A + app sessions
TargetResponseTime (average), end of divergence
1.122 s
1.120 s
0.284 s
TargetResponseTime (p99), end of divergence
2.254 s
2.235 s
0.431 s
TargetResponseTime (average) at warm-up
0.283 s
0.283 s
0.284 s
Rejected checkouts, drain phase
4,115
3,631
0
The application-metric group, ASG C, kept per-instance load near its target and rejected no checkouts. Its average latency at the end of the divergence phase was 0.284 seconds against 1.122 for the CPU-only group, and its p99 was 0.431 seconds against 2.254. The request-count group, ASG B, tracked its own signal within range the whole time, which is exactly why it could not react: request rate was flat while concurrency climbed.
Once every group has enough capacity, they perform the same. The value of the application signal is in the transition, the gap between when demand arrives and when the fleet is ready, which the infrastructure signals here never detected.
Handling known high-traffic events
For planned events like flash sales, scheduled scaling can pre-scale capacity ahead of time. Multi-modal scaling complements scheduled scaling by handling unplanned spikes and organic traffic that does not follow a fixed schedule.
Understanding cost implications
Running the application signal requires more instances. During the spike it held about 22 instances, against 11 on the infrastructure-only groups. That extra capacity is what kept sessions per instance near the target and stopped the group from turning checkouts away. For your own workload, the question is whether a spike’s worth of extra instances costs less than the checkouts you would otherwise reject.
Conclusion
Multi-modal autoscaling combines infrastructure metrics with application-level signals so a group scales on the demand its users create, not only on how busy its servers look. In our test, a group that scaled only on CPU rejected about 7,000 checkout sessions during a demand spike, and a stronger baseline that added load balancer request count still rejected about 6,900. A group that added a custom application metric rejected none, and held p99 latency near 0.43 seconds against 2.25 seconds for the CPU-only group. Its CPU even fell while the infrastructure groups were failing requests, which shows why an infrastructure signal alone can miss the demand that matters.
Start with CPU target tracking as a fallback. Add a signal that reflects the load your users create, and pick the one that tracks closest to a business outcome like orders or active users. Set a Period on a high-resolution custom metric so the policy can act on it, and enable detailed monitoring so scale-in works. Predictive scaling is worth adding for demand you can forecast, once the group has days of history to learn from.
AWS customers with data residency, low latency, or local data processing requirements can use AWS Hybrid Cloud services to run their workloads either on-premises or within their regulatory boundary. Many of these workloads might be critical to their business, with minimal thresholds for downtime.
This post provides practical design guidance for building highly available architectures that span either two AWS Outposts racks or an Outpost rack and an AWS Local Zone, which are physically designed without single points of failure. By distributing workloads across two geographically and logically independent edge locations, you can achieve high availability while still benefiting from the low-latency, data-residency, and on-premises integration advantages that edge infrastructure provides. To maintain high availability, we recommend that you put a disaster recovery (DR) plan in place and conduct regular DR drills with your applications.
The architectures presented here cover a range of approaches to failure detection and site switching. Each approach offers a different balance between Recovery Time Objective (RTO) and Recovery Point Objective (RPO), operational complexity, and cost. By understanding these trade-offs, you can select the architecture that best aligns to your RPO/RTO targets, data protection and residency requirements, and budget. This helps you achieve the resilience your business requires without over-engineering or over-spending.
Overview
Outposts and Local Zones function as extensions of a single Availability Zone (AZ) within the AWS Region they’re anchored to. For high availability when planning for failover between the two platforms, anchor each to a different parent Region or, at minimum, a different AZ within the same Region. This geographic separation supports the low RPO and RTO targets required for mission-critical workloads. The architectures in this post follow these principles:
Shared responsibility: AWS manages the Outposts and Local Zone infrastructure. You provide resilient power, cooling, and network connectivity for Outpost sites, and implement application-level failover logic.
Independent failure domains: Treat each site as an independent failure domain. Anchoring each to a different parent AZ (or Region) ensures a failure in one AZ doesn’t affect both sites.
Resilient network connectivity: Local Zones connect to their parent Region through the AWS Global Network, designed for maximum resilience. Outpost racks include redundant Outpost Networking Devices (ONDs) with eBGP peering for multipath load balancing and failover.
Capacity planning for N+1: Provision additional capacity beyond your expected workload so surviving instances can absorb the load during host failures without degradation.
Building blocks of a disaster recovery strategy
A key design consideration is how quickly the architecture can detect a site failure and redirect traffic, and what layers of your workload need protection. Your RPO and RTO needs govern this requirement. This post covers three approaches to disaster recovery at different layers of your application, each offering a different balance between time-to-recovery and operational complexity:
Active/passive DNS-based failover with Amazon Route 53 health checks.
Active/active architecture using physical or virtual load balancers deployed at each site.
Depending on your workload, you can implement a combination of these strategies to support the various layers of compute and storage of your application.
Active/passive DNS-based failover with Amazon Route 53 health checks
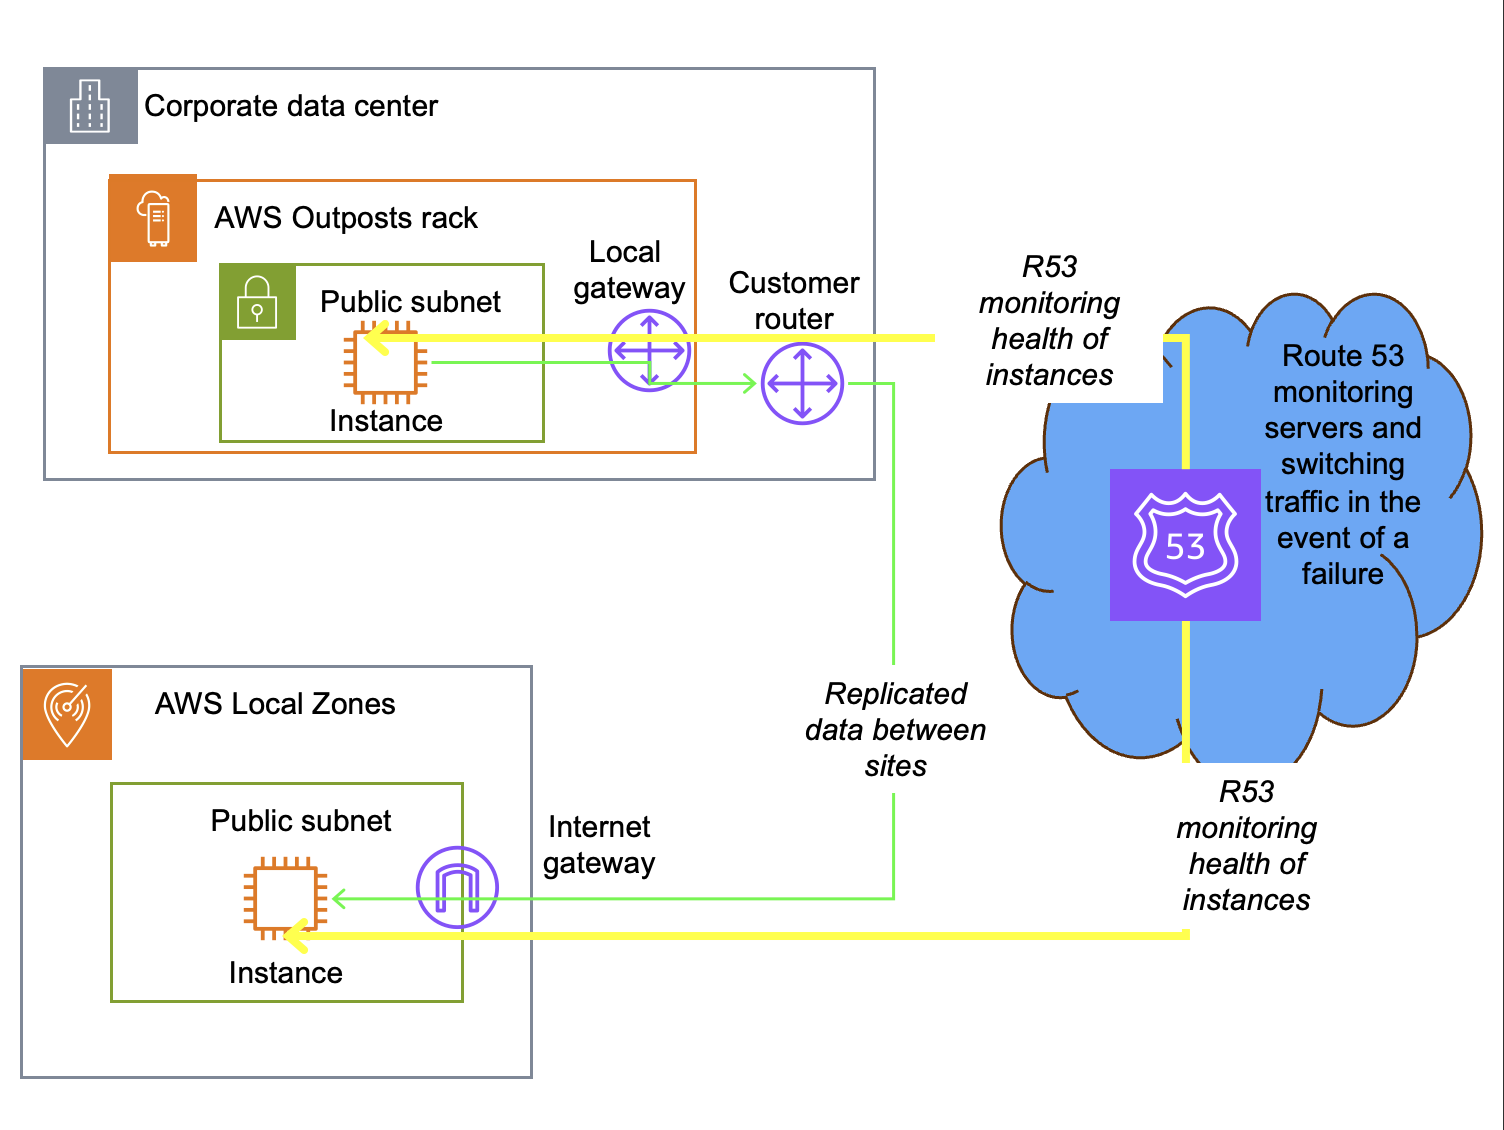
If your workload consists of on-premises web servers accessible from the internet or internal network, you can use a DNS-based failover approach to reroute traffic to a healthy web server in the event of a hardware failure or site outage. Although this method supports any DNS service, the following architecture example uses Amazon Route 53.
DNS-based failover supports two primary approaches. The first is health check routing, where DNS resolves requests to the IP address of a known good service endpoint. The second is multi-value routing, where the DNS service returns multiple IP addresses. Clients attempt connection to the first address and automatically fail over to subsequent addresses if the connection times out. Route 53 health checks continuously monitor endpoint availability. When a site becomes unreachable, Route 53 automatically updates DNS responses to route traffic to the surviving site. This approach is globally available and works across both Outposts and Local Zones.
When a specific application server fails and Route 53 determines it is unreachable, it is dynamically removed from future DNS responses. DNS systems typically have a Time to Live (TTL) of 300 seconds or longer, during which the DNS resolution is cached locally in the client. During this window, the client uses the cached IP address. New requests are automatically directed to active servers. The total recovery time is governed by the combination of the DNS TTL and health check timeout settings, typically resulting in a recovery time of 5 minutes or the TTL setting.
This design pattern works between Outposts, between an Outpost and a third-party provider, between an Outpost and a Local Zone, or between Local Zones. Route 53 can also distribute traffic across these sites, supporting blue/green deployments where you gradually shift traffic from one environment to another.
For AWS Outposts, you can configure Route 53 to monitor an endpoint in the Region. If the Outpost service link disconnects for more than 5 minutes, DNS failover routes traffic to the secondary site. The Outpost and Local Zone can be anchored to the same or different Regions for added resiliency.
Active/active architecture using physical or virtual load balancers
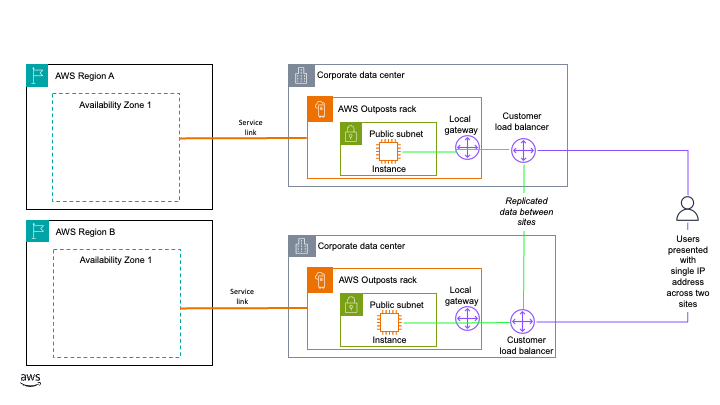
For Outposts-to-Outposts high availability when your workload must remain on-premises, an alternative to DNS-based failover is an active/active architecture using physical or virtual load balancers deployed at each site. Outposts racks support Application Load Balancer (ALB) as well as third-party L4 and L7 virtual or physical load balancers. Like the DNS-based architecture pattern, you can use this strategy to support workloads that consist of on-premises web servers with low latency, data residency, or continued operations requirements.
In this model, both Outposts can simultaneously serve application traffic, with load balancers continuously monitoring the health of instances. When a failure is detected, the load balancer automatically shifts all traffic to the available Outpost without manual intervention or DNS propagation delays. Typically, the load balancers present a single IP address to service consumers and switch traffic when an endpoint is unavailable. Some load balancers can monitor load and switch traffic based on utilization to maintain response time. This design pattern is specific to Outposts, which support third-party devices connected on premises. It does not work with Local Zones, which are hosted in AWS datacenters.
Figure 2: Active/active architecture using physical or virtual load balancers
When you deploy this architecture, make sure the load balancer tier itself does not become a single point of failure. Deploy redundant load balancer instances at each Outpost, with failover between them, so the traffic management layer stays available even if one load balancer instance fails. We also recommend that you configure session persistence and connection draining on your load balancers to minimize disruption to in-flight requests during failover. With this approach, load balancer instances route traffic to your Outpost instances over the local gateway of each Outpost. Traffic continues to be balanced between instances on each Outpost even if one of the Outposts loses its service link connection. You can anchor the Outposts to the same or different Availability Zones or Regions for added resiliency. This approach does require 2N infrastructure and an external load balancer, making it the most resource-intensive to implement.
Some load balancers also support multiple endpoint monitoring. The load balancer monitors both the regional instance and the local application. If the service link fails, based on the administrator’s policy, it can drain connections and route traffic to the other Outpost. This keeps service status and logging fully available on the connected Local Zone or Outpost.
Hybrid database recovery using native database engine replication
If you have two or more logical Outpost racks, you can deploy Amazon RDS on AWS Outposts with Multi-AZ high availability. However, depending on your workload criticality, number of sites, and site locations, a more cost-effective disaster recovery option using one Outpost, one Local Zone, or both might be appropriate. For applications that require a database, you can use your chosen database engine’s native replication features or third-party tooling to create hybrid database architectures across an Outpost and a Local Zone, an Outpost and the Region, or a Local Zone and the Region. If using the Region for failover, this can be the same Region your Outpost or Local Zone is anchored to, or a different Region of your choosing. Limitations based on your chosen database engine and licensing terms apply. In this post, all architecture patterns use a PostgreSQL database. The following three hybrid database strategies expand on the hybrid database with Amazon RDS and AWS Outposts architecture to show how this design pattern supports disaster recovery across Outposts, Local Zones, and AWS Regions.
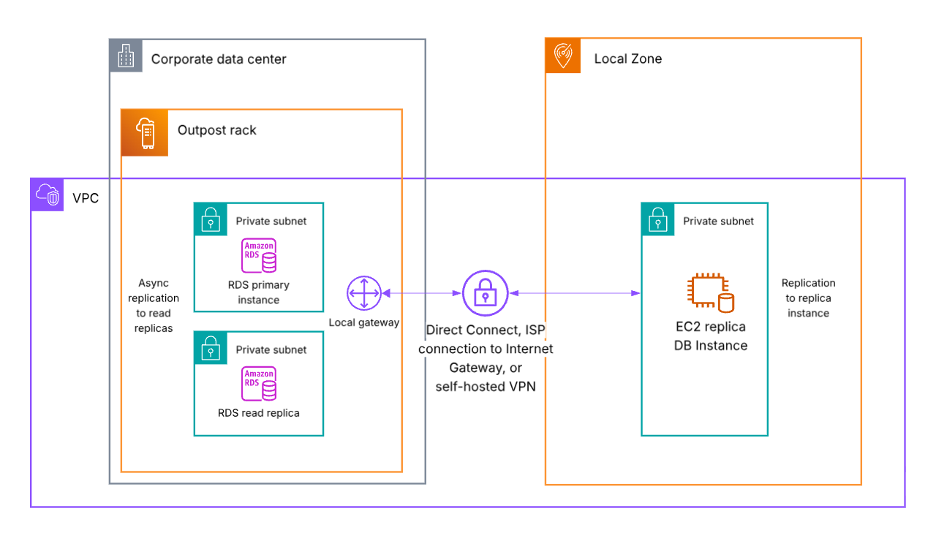
These architectures use a bring-your-own-license (BYOL) model. The replica instance used for high availability and disaster recovery (HA/DR) is customer-managed, running on Amazon Elastic Compute Cloud (Amazon EC2) and Amazon Elastic Block Store (Amazon EBS). The primary database instance can also be customer-managed, or it can be an RDS-managed database instance so you can use a managed service as your primary operating model. Promoting a replica to primary after a failure is a manual process, but you can automate it with infrastructure as code. Promotion requires updating your DNS entry for the database instance.
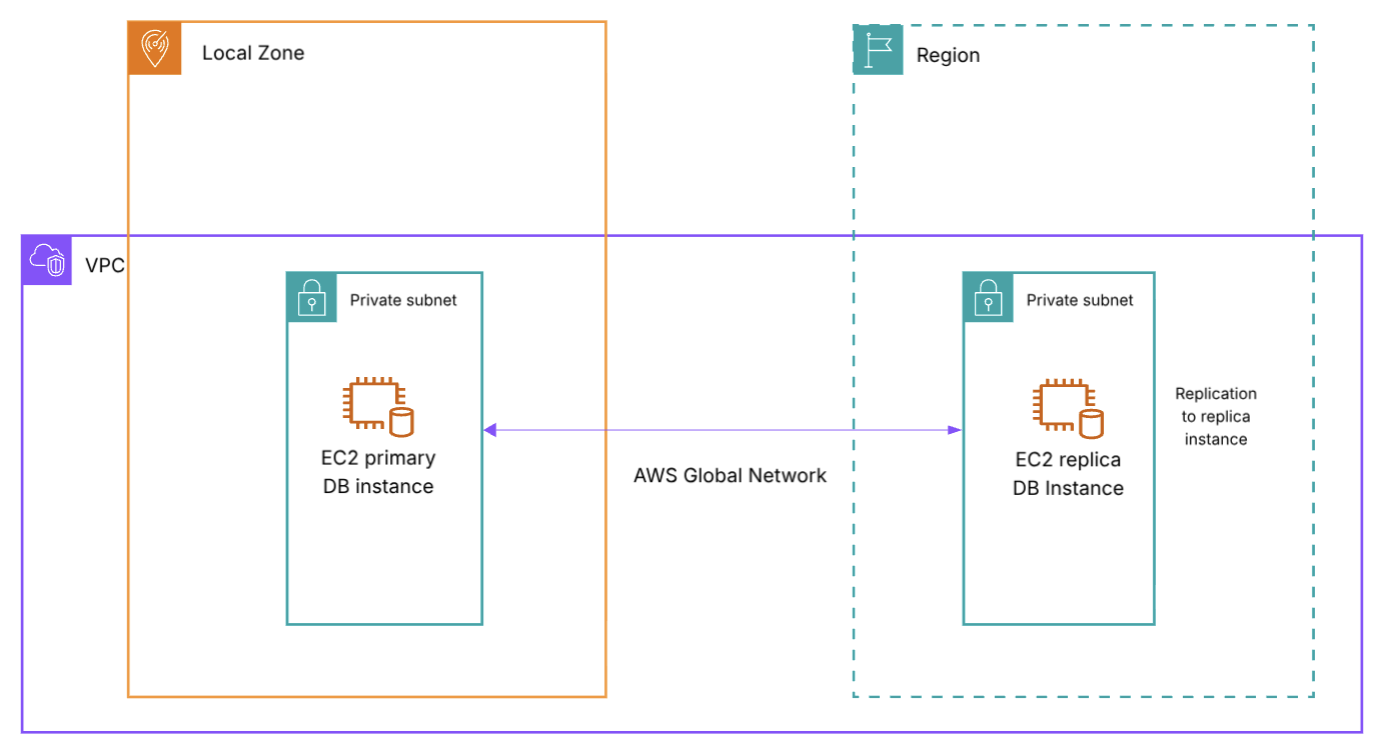
Figure 3: Database failover from an Outpost rack to a Local Zone
In the preceding diagram (Figure 3), the Outpost and the Local Zone can be in the same or different Regions for added resiliency.
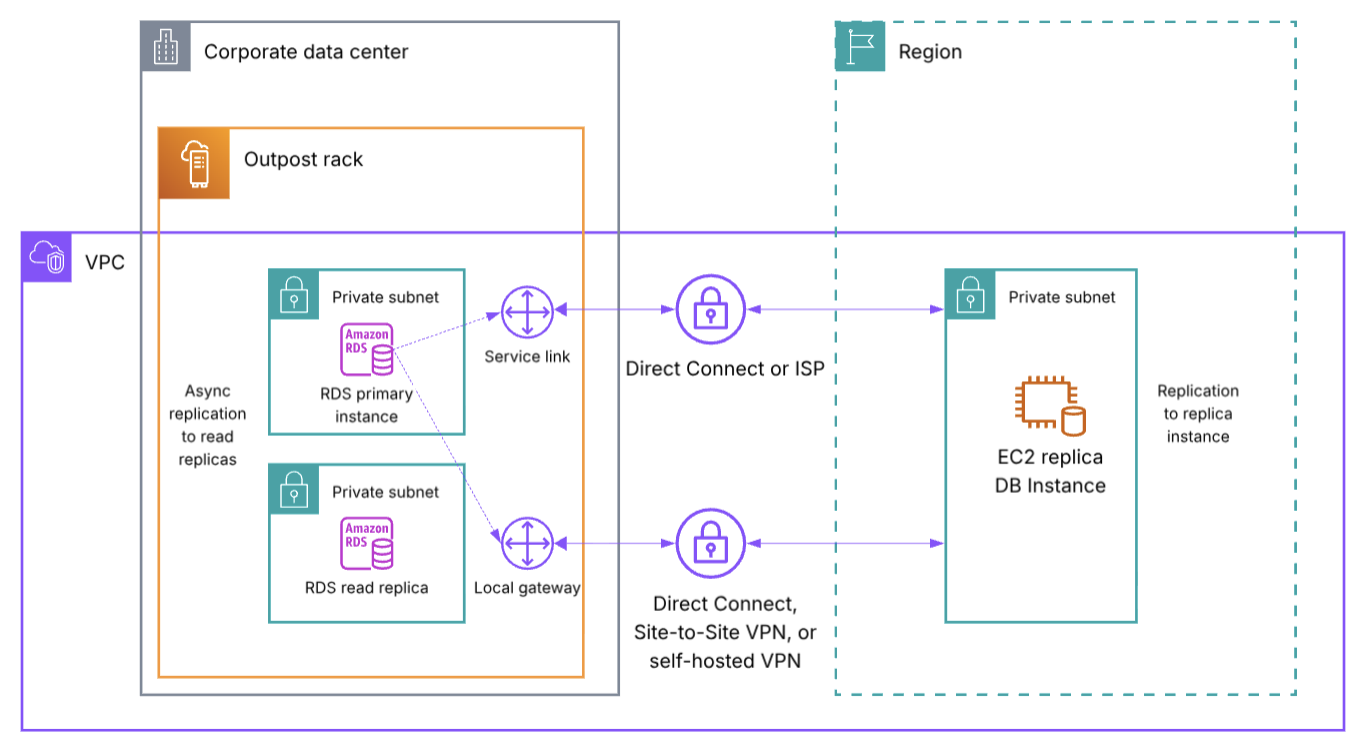
In the following diagram (Figure 4), replication traffic can use either the service link or the local gateway of the Outpost as its network path. Replication continues through the local gateway even if the service link fails. If using the service link, the EC2 replica database instance must be in the Outpost anchor Region. If using the local gateway, the EC2 replica database instance can be in the same Region as or a different Region from the Outpost anchor Region for added resiliency. You need to configure a Virtual Private Gateway, Transit Gateway, or Internet Gateway in the Region to receive the replication traffic from the Outpost.
Figure 4: Database failover from an Outpost rack to an AWS Region
In the following diagram (Figure 5), both the primary database instance and the replica are self-hosted on EC2 and EBS. Check your specific Local Zone location for currently supported services to see if the primary database instance can use RDS. The Region used for the EC2 replica DB instance can be the same Region the Local Zone is a part of, or a different Region for added resiliency. If using a different Region, additional networking such as an Internet Gateway is required.
Figure 5: Database failover from a Local Zone to an AWS Region
In all three architectures, you need to update your DNS records and routing to complete failover to the secondary location. If your workload requires data residency, consider whether you can use an AWS Region as a failover destination.
Disaster recovery overview
The strategies discussed in this post support different RTO/RPO objectives. Recovery time depends on the amount of effort to redeploy or reroute to an alternate environment, and whether this process is manual or automated. Recovery point depends on whether the workload has persistent data that needs to be replicated, whether that replication happens synchronously or asynchronously, and whether you use a backup and restore approach. The following table is a high-level overview of the RTO/RPO you can expect for each approach based on these factors:
Architecture
RTO
RPO
Active/passive DNS-based failover
Total failover time = DNS TTL + (health check interval x failure threshold)
Equal to replication schedule, or backup interval
Active/active with load balancers
Seconds, traffic is already being routed to both environments
Seconds, data is already being synchronously replicated between sites
Hybrid database (same anchor Region)
Minutes, time needed to reroute to replica instance
Equal to replication schedule, faster replication window expected for data traveling less distance
Hybrid database (different anchor Region)
<1 hour, time needed to reroute to replica instance
Equal to replication schedule, longer replication window expected for data traveling a greater distance
Table 1: RTO/RPO disaster recovery overview for each architecture
For the active/passive DNS-based failover architecture, DNS TTL, Route 53 health check interval, and failure threshold are all settings you configure to your preferences. The default Route 53 health check interval is 30 seconds, but can be set as low as 10 seconds. The default Route 53 failure threshold is 3 failed checks, but can be set to any number between 1 to 10. Generally, active/active architectures provide the lowest RTO/RPO for your workloads, whereas active/passive architectures incur some downtime during a disaster when rerouting user traffic to your passive standby environment. Review your workload RTO/RPO objectives to determine which approach is right for you. You might require different strategies for different tiers of workload based on your threshold for downtime at each tier.
Considerations
When choosing a disaster recovery strategy, consider:
Latency impact based on the location of your failover site and where your application users are.
Resilient network connectivity between your primary and secondary failover locations, or between your on-premises site and the AWS Region. Architecture-specific guidance is included in each section.
If your workload requires data residency, evaluate if a particular disaster recovery approach can be used.
Promoting a replica (either RDS-managed or customer-managed) is a manual process that you can automate with infrastructure as code, and it requires updating your DNS entry for the database instance.
Database replicas might support synchronous or asynchronous replication depending on the database engine. Consider your RPO objectives when evaluating the hybrid database architectures.
Limitations based on your chosen database engine and licensing terms apply. Consult your licensing terms and conduct failover drills to test these architecture patterns with your workloads before implementing into production.
Conclusion
This post showed different architecture patterns for disaster recovery using both Outposts and Local Zones. See Building highly resilient applications with on-premises interdependencies using AWS Local Zones for additional guidance. Reach out to your AWS account team to learn more about the hybrid edge architectures discussed in this post. To discuss Outposts with an expert on any of these topics, submit the AWS Outposts contact form. To begin using Local Zones, enable a Local Zone from your account and start experimenting.
Customers in many industries and geographic locations have specific data sovereignty and residency objectives. AWS Local Zones and AWS Outposts are fully managed infrastructure solutions for customers that need to keep data within specific geographic boundaries and also want the scalability and innovation of cloud services. The challenge lies not only in where data resides, but in how to architect, secure, and audit these deployments effectively. Whether you’re architecting a new solution or migrating existing regulated workloads to AWS hybrid edge infrastructure, this post provides an overview of key technologies to help you build auditable and secure architectures that support your organization’s data residency objectives.
Solution framework
Building a solution for data residency deployments on AWS hybrid infrastructure requires a thoughtful, layered approach. Rather than a prescriptive solution, this post presents a flexible framework that you can adapt to your specific operational requirements.
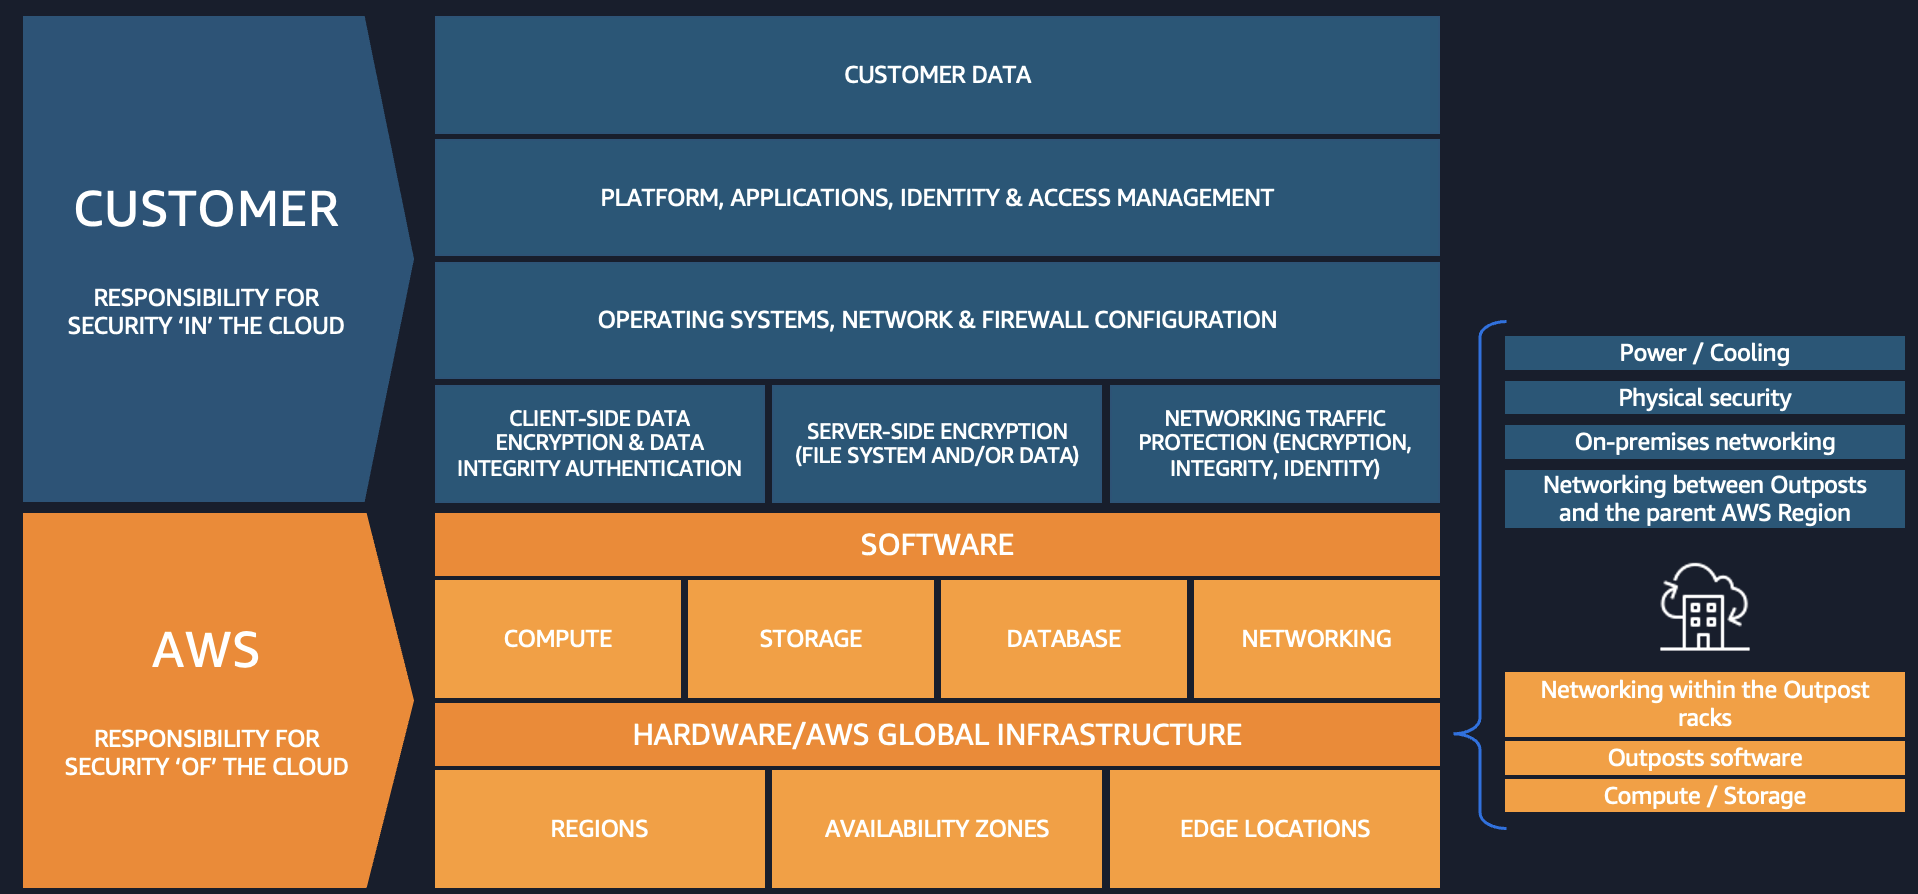
The AWS Shared Responsibility Model clearly delineates where the responsibilities of AWS end and yours begin. This model provides a critical separation: AWS controls the management infrastructure, while your data remains inaccessible to AWS operators, as enforced by the hardware-based isolation of the Nitro System. There is no operator access to the instances, applications, or data. This architectural separation provides the foundation for implementing stringent data residency controls.
To build upon this foundation, you can implement security best practices by following the guidance in the AWS Well-Architected security pillar, which helps you strengthen application-level protections and data security controls. For deeper guidance, see the Data Residency with Hybrid Cloud Services Lens, which covers considerations for operations, security, cost, performance, and reliability for regulated workloads.
When implementing data residency controls, you might need auditable evidence of traffic patterns for your internal governance processes. By using third-party monitoring tools combined with port mirroring capabilities, you can generate reports that show all traffic between your applications and databases remains within your Outpost environment. This visibility provides auditable evidence that traffic remains within your designated boundaries. You can also use AWS Artifact to access audit reports for your hybrid infrastructure.
Governance tools form the final layer of this regulatory framework, establishing guardrails around your deployment. These tools continuously monitor and enforce configuration policies, verifying that your environment stays aligned with your security and governance policies, operates within required parameters, and alerts you proactively when issues arise. This shift from reactive to proactive management helps you maintain consistent governance of your environment at scale.
Together, these layered technologies create a framework for deploying regulated workloads designed to support your data residency objectives while benefiting from the innovation and scalability of AWS services.
Shared responsibility model
When extending workloads to Local Zones and Outposts, the shared responsibility model adapts to these hybrid cloud environments while maintaining the same core principles. AWS continues to manage the underlying infrastructure and services, while you retain control over your data, applications, and configurations. This supports consistent security postures whether workloads run in AWS Regions, Local Zones, or on Outposts infrastructure. You deploy Outposts in a data center or colocation facility of your choice. Under the shared responsibility model, you are responsible for meeting site requirements for power, cooling, on-premises networking, and the Outpost service link connection to the Region. All traffic between the Outpost and the parent Region traverses an encrypted set of VPN connections over the service link, protecting communications in transit without requiring additional configuration. AWS continues to be responsible for maintaining the Outposts hardware as a managed service.
This partnership approach to security means you can build auditable solutions with data residency controls without compromising on the innovation and scalability that AWS provides.
Figure 1: The AWS Shared Responsibility Model in a hybrid edge deployment
AWS Nitro System
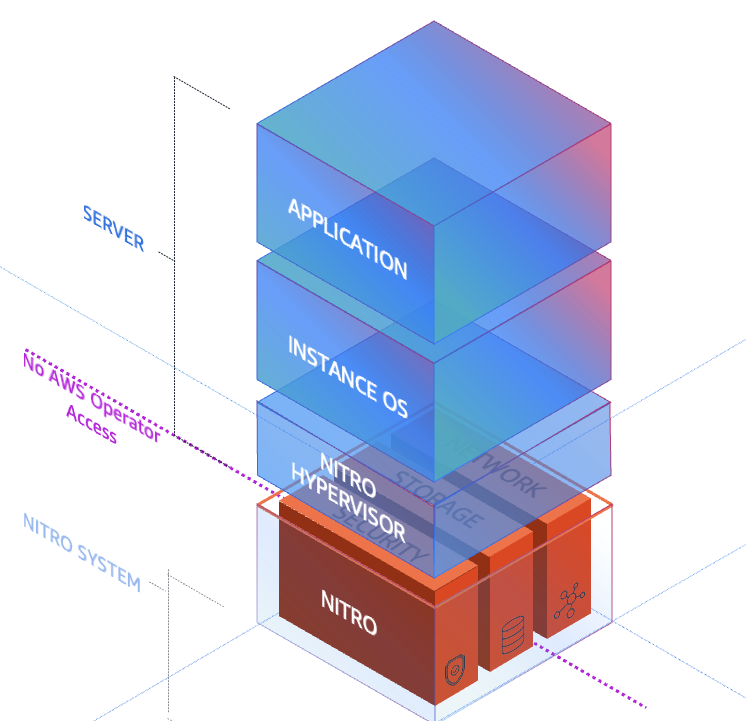
The AWS Nitro System is the virtualization platform that powers Amazon Elastic Compute Cloud (Amazon EC2) instances. It uses dedicated hardware and software to offload virtualization functions from the server CPU and delivers near-bare-metal performance. Both Outposts and Local Zones also use the Nitro System. By design, the Nitro System has no operator access. There is no way for AWS or any entity to log into the EC2 Nitro hosts, access compute resources, or reach encrypted customer data remotely. The following diagram shows the purpose-built hardware components of the Nitro System.
Figure 2: The AWS Nitro System hardware and software stack
The Nitro System combines purpose-built hardware consisting of the following key security components:
The Nitro Card – provides I/O interfaces used for Amazon Virtual Private Cloud (Amazon VPC) network virtualization, Amazon Elastic Block Store (Amazon EBS), and instance storage, freeing up host CPU resources. Nitro Cards are logically isolated from the system main board that runs customer workloads and can be live-updated, reducing the need for maintenance windows and workload disruption.
The Nitro Security Chip – provides the link between the Nitro Controller (used for orchestration) and the system main board. It intercepts and controls all firmware updates, preventing the main CPUs from being used to modify system firmware. This is particularly important when running bare metal EC2 instances. This chip is also used for boot control to validate system firmware integrity.
The Nitro Hypervisor – designed to receive EC2 instance management commands sent by the Nitro Controller, provide compute virtualization and logical instance isolation, and assign SR-IOV virtual functions as needed. It includes no general-purpose operating system features, only the features absolutely necessary for its function, and works with other purpose-built Nitro components to maintain its small size and bare-metal-like performance. This simple design reduces the risk for remote networking attacks and driver-based privilege escalations.
The Nitro Security Key (Outposts only) – a removable device that stores the external key required to decrypt all data at rest on your Outpost. At the end of your Outposts commitment, after migrating your data off the Outpost, you can destroy this key to cryptographically shred any remaining data on the Outpost.
These components work together to provide a layered security approach that doesn’t compromise performance. By designing each component to have a specific function decoupled from the main system board, the Nitro System provides non-disruptive firmware updates and reduces classes of security issues often found in other hypervisor systems.
AWS Organizations Service Control Policies
AWS Organizations Service Control Policies (SCPs) are a governance tool that helps you enforce data residency requirements by controlling where resources can be created and where data can be stored or processed. SCPs function as permission guardrails that define the maximum available permissions for IAM users and roles across your organization’s accounts. By implementing deny guardrails through SCPs, you can prevent resource provisioning in unwanted locations by restricting access to AWS APIs at the infrastructure level.
When deploying regulated workloads on Local Zones and Outposts, SCPs work in conjunction with AWS Control Tower landing zones to create custom guardrails that control data movement, processing, and storage. These policies can be designed with either preventative rules (blocking actions before they occur) or detective rules (identifying compliance violations after the fact). SCPs can restrict data transfer, saving, or snapshot creation outside a specified AWS location, and they can isolate workloads to a specific location. You can apply SCPs across accounts and organizational units (OUs) within your organization. For more information, see Best practices for managing data residency in AWS Local Zones using landing zone controls and Architecting for data residency with AWS Outposts rack and landing zone guardrails.
Here’s an example SCP that restricts EC2 instance launches and network interface creation to only specified AWS Local Zone subnets:
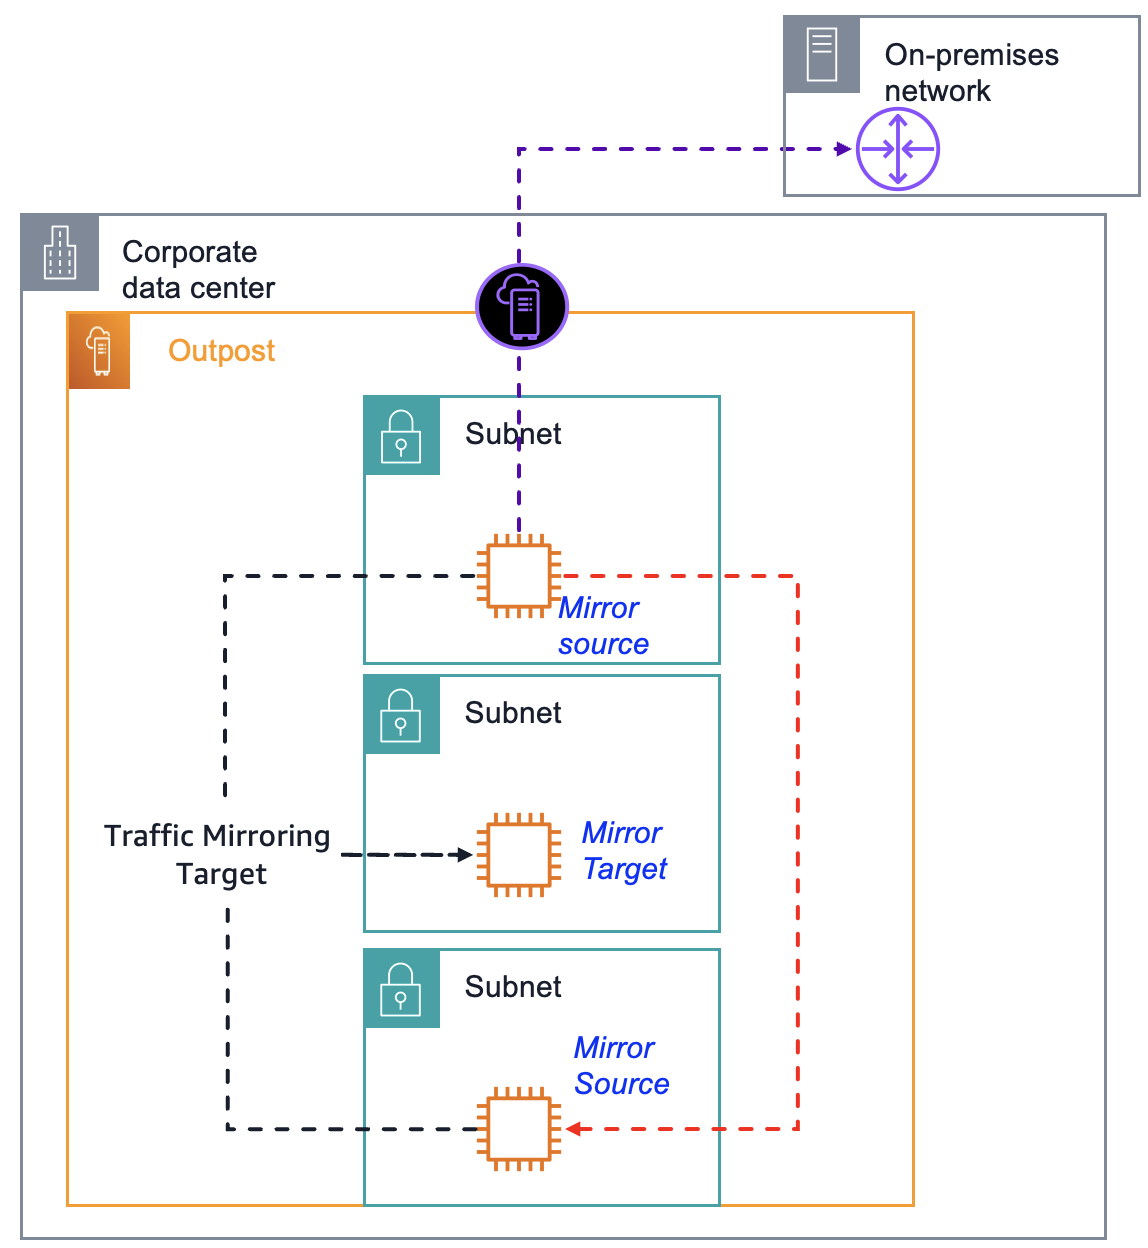
After you implement the security and governance best practices described in the preceding sections, you can demonstrate that traffic remains within your designated boundaries by using Amazon VPC Traffic Mirroring (also called port mirroring outside of AWS). This mirrors traffic between your application servers and databases. You can use a mirror target report to show that the traffic does not transit the AWS Region. For step-by-step instructions, see Get started using Traffic Mirroring to monitor network traffic. The key configuration steps include the following:
Configure security groups – Allow inbound UDP port 4789 only from the security group of the source instances being mirrored, or from specific private CIDR ranges within the VPC. Do not open this port to 0.0.0.0/0.
Create a traffic mirror target – Use the elastic network interface (ENI) of your monitoring instance.
Create a traffic mirror filter – Define which traffic to capture, either all traffic or specific traffic.
Create mirror sessions – Create one for each source instance you want to monitor. Lower session numbers are evaluated first when multiple sessions exist.
Capture traffic – Use tcpdump on the target instance to analyze mirrored packets.
Figure 3: Amazon VPC Traffic Mirroring architecture on an Outpost
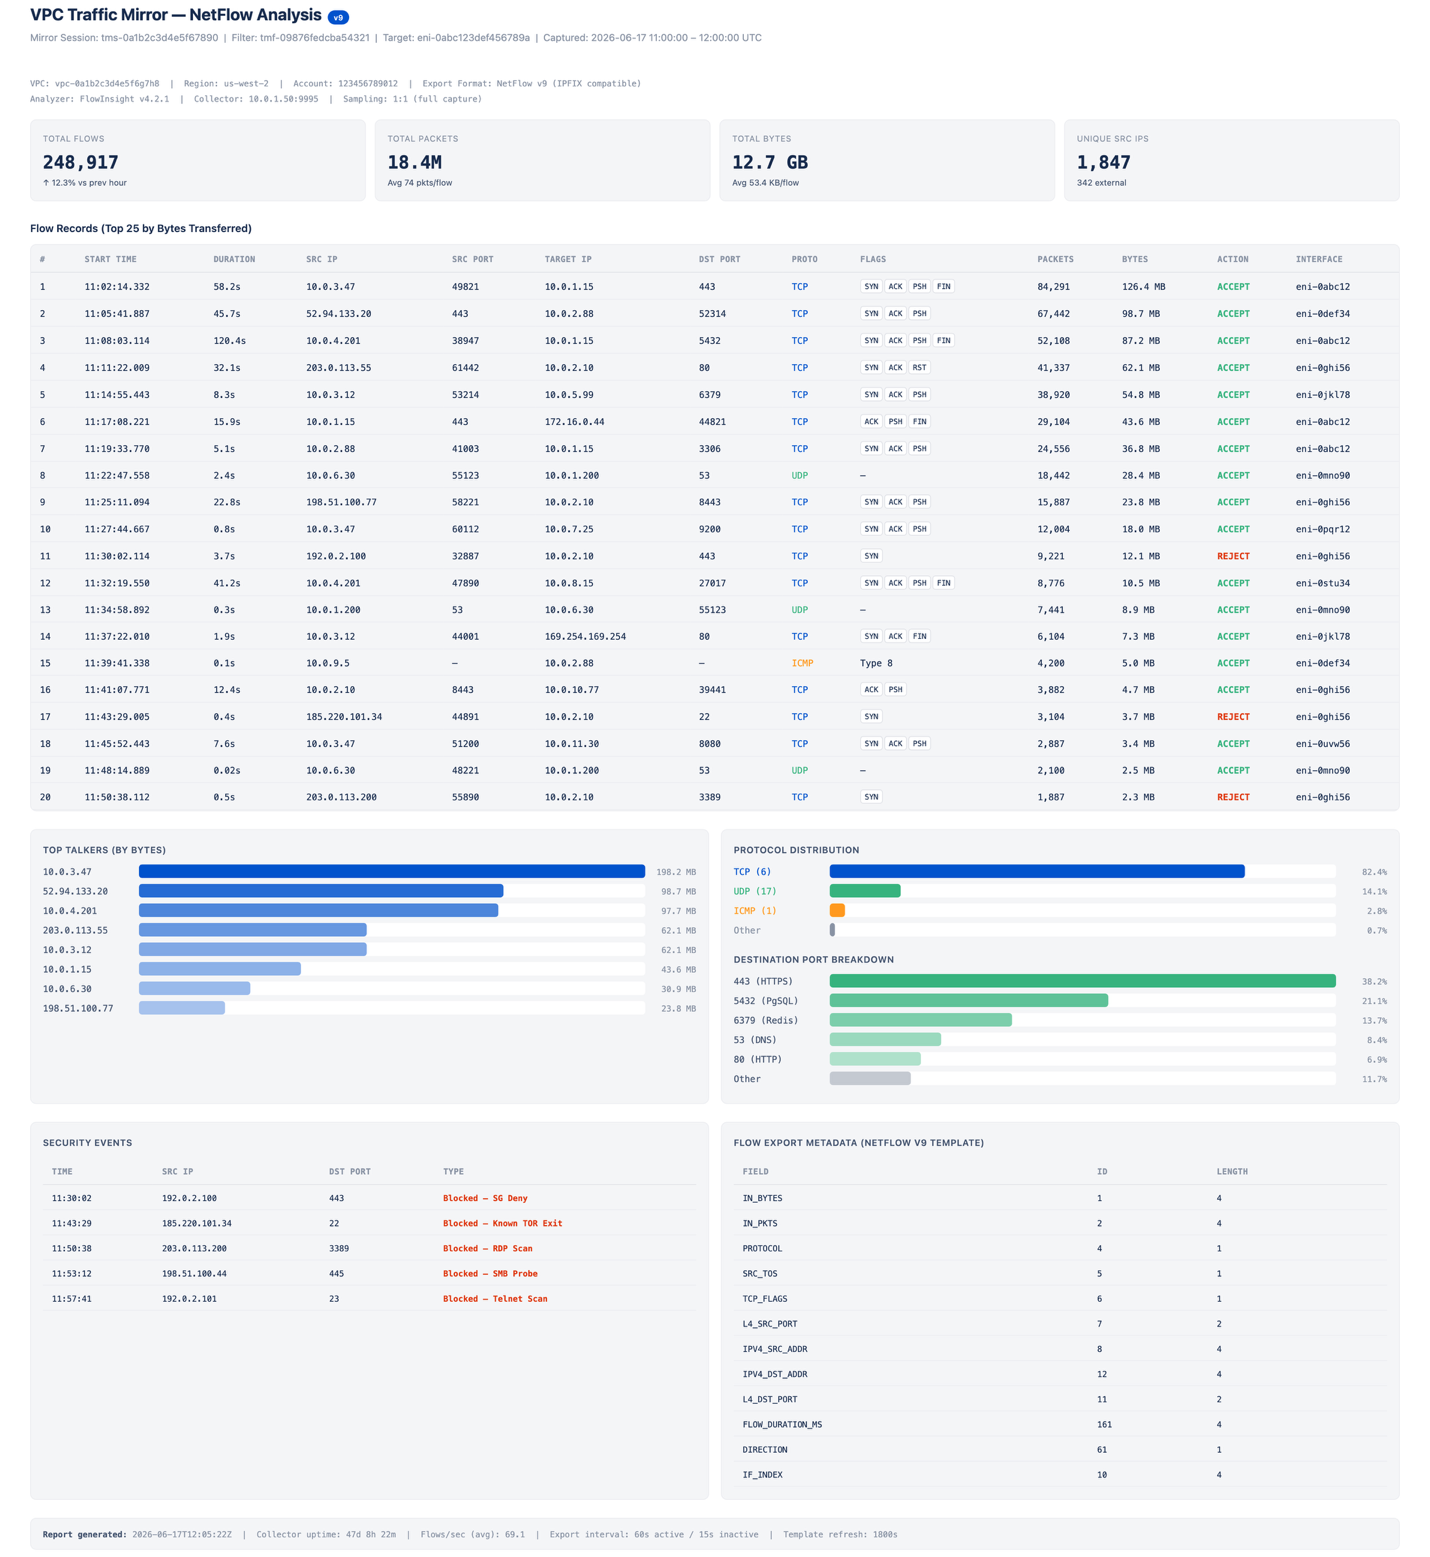
All instances must be in the same VPC, or connected through VPC peering or an AWS Transit Gateway. Traffic Mirroring encapsulates the mirrored traffic using VXLAN on UDP port 4789. Traffic Mirroring might impact network performance on source instances, so test in a development environment before deploying to production. The following image shows a sample traffic mirroring report that uses NetFlow Analyzer. For this post, all network traffic shown is simulated.
Figure 4: Sample traffic mirroring report in NetFlow Analyzer
Clean up
If you tested the VPC Traffic Mirroring architecture described in the preceding section, terminate any unnecessary resources to avoid ongoing costs. Remove the resources in the following order to avoid dependency errors:
Delete the traffic mirror sessions – In the Amazon VPC console, navigate to Traffic Mirroring, Mirror Sessions. Select each mirror session you created and choose Actions, Delete. Repeat for all sessions associated with your source instances.
Delete the traffic mirror filter – Navigate to Traffic Mirroring, Mirror Filters. Select the filter you created and choose Actions, Delete. You must delete all associated mirror sessions before you can delete the filter.
Delete the traffic mirror target – Navigate to Traffic Mirroring, Mirror Targets. Select the target pointing to the ENI of your monitoring instance and choose Actions, Delete.
Revoke security group rules – Navigate to Security Groups and select the security group attached to your monitoring instance. Remove the inbound rule that allows UDP port 4789 from the security group or CIDR range of the source instances.
Terminate the monitoring instance (optional) – If you launched a dedicated EC2 instance solely for traffic capture and analysis, navigate to the EC2 console and terminate the instance. This also releases the associated ENI used as the mirror target.
Delete any stored packet captures (optional) – If you saved tcpdump output to Amazon Simple Storage Service (Amazon S3) or local storage on the instance, delete those files if they are no longer needed for audit reporting.
You can verify that all Traffic Mirroring resources have been removed by running the following AWS Command Line Interface (AWS CLI) commands:
Each command should return an empty list, confirming that no mirroring resources remain active in your account.
Conclusion
In this post, we covered how the AWS Nitro System, AWS Organizations SCPs with an AWS Control Tower landing zone, and VPC Traffic Mirroring provide capabilities for governing workloads with data residency requirements. Apply the SCP example in this post to test restricting instance launches and network interface creation to specific subnets. To learn more about Outposts for hybrid deployments, review the Getting started with AWS Outposts guide and submit the AWS Outposts contact form. To get started with Local Zones, review the Getting started with AWS Local Zones guide, opt in to a Local Zone, and begin trying some of the architecture patterns described in this post.
Modernizing medical imaging infrastructure is a pressing challenge for multi-hospital networks. Cloud-native PACS (Picture Archiving and Communication System) on AWS can help address the challenge at scale. A hospital chain with multiple facilities generates millions of imaging studies annually: each CT produces 300 to 2,000 DICOM images, MRI generates 500 to 3,000 slices, and digital mammography produces 8 to 12 high-resolution images.
At this scale, a typical network accumulates 50 to 200 terabytes of new imaging data yearly, with retention mandated for 7 to 10 years. The traditional approach used on-premises PACS with SAN or NAS storage at each hospital independently. This worked when volumes were modest, but as chains grow through acquisition, the constraints of this siloed architecture become apparent.
In this post, we present a hybrid cloud architecture pattern for PACS on AWS. We describe the core components, explain how data flows from imaging devices to a centralized cloud archive, and outline storage tier options and capacity planning guidance. This post is for healthcare IT architects and solutions architects familiar with DICOM workflows.
Challenges that do not scale
Storage cost explosion: Enterprise SAN/NAS requires hardware refresh every 3-5 years with annual maintenance contracts consuming 15-20% of hardware cost. Organizations must over-provision storage for projected peak capacity years in advance.
Data silos: A patient scanned at Hospital A cannot have images viewed at Hospital B within the same chain.
Radiologist reporting bottleneck: When a radiologist is unavailable, studies pile up with no mechanism to route to available readers at other facilities.
Continuous archive growth: PACS/VNA storage must scale indefinitely with no capacity ceiling and no upfront provisioning of unused capacity.
How traditional PACS works today
The workflow begins when a clinician orders an imaging study. The Radiology Information System (RIS) fills the order and populates the modality worklist. The technologist selects a patient entry from the modality worklist and acquires a study. The scanner transmits DICOM objects to the PACS server through C-STORE on the hospital LAN (TCP port). A DICOM object contains image metadata and pixel data.
The PACS server ingests DICOM images and HL7 orders. It archives images on local SAN/NAS, indexes metadata, and notifies the radiologist worklist. The radiologist reviews images with patient history and creates a report. The report flows back to the EMR through HL7 messaging.
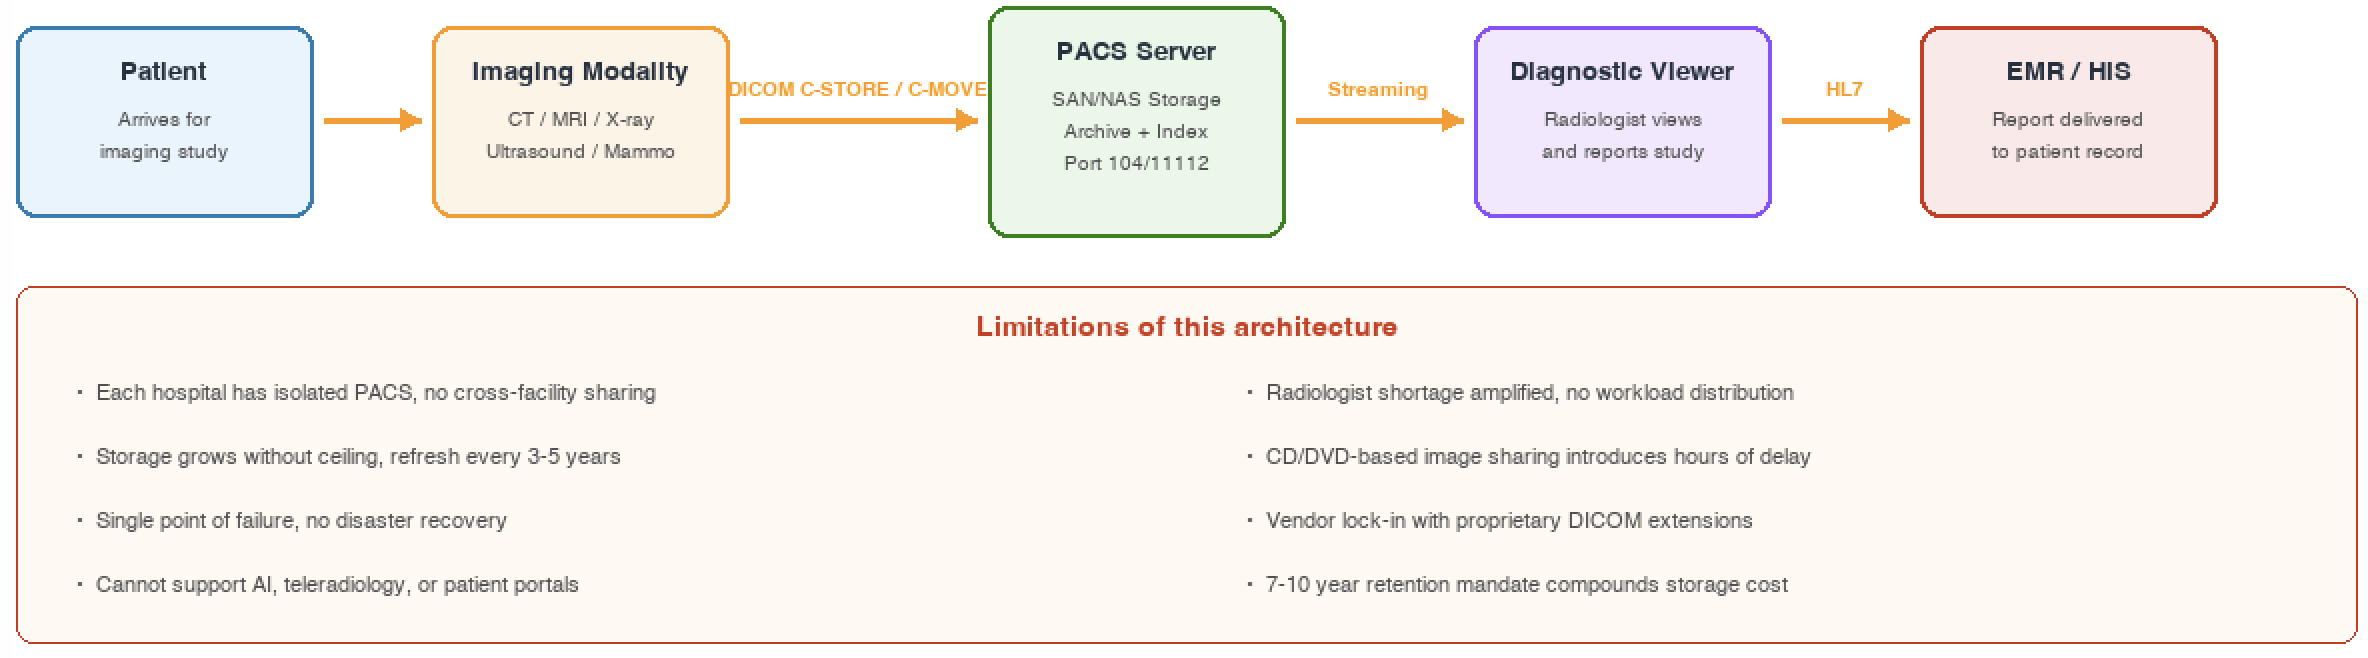
The following diagram shows the traditional on-premises PACS workflow and its limitations.
Figure 1: Traditional on-premises PACS workflow
DICOM protocol: The language of medical imaging
DICOM (Digital Imaging and Communications in Medicine) is a widely adopted standard for storing, transmitting, and viewing medical imaging files. DICOM specifies a binary file format encapsulating pixel data and metadata and defines network services including DIMSE (DICOM Message Service Element) services: C-STORE (send), C-FIND (query), C-MOVE (retrieve), and C-ECHO (verify connectivity).
DICOM DIMSE services are designed for LAN. They facilitate interoperability and image exchange on the hospital campus.
DICOMweb is a set of RESTful services that web developers use to access DICOM-enabled systems with industry-standard toolsets.
Key components of a PACS architecture
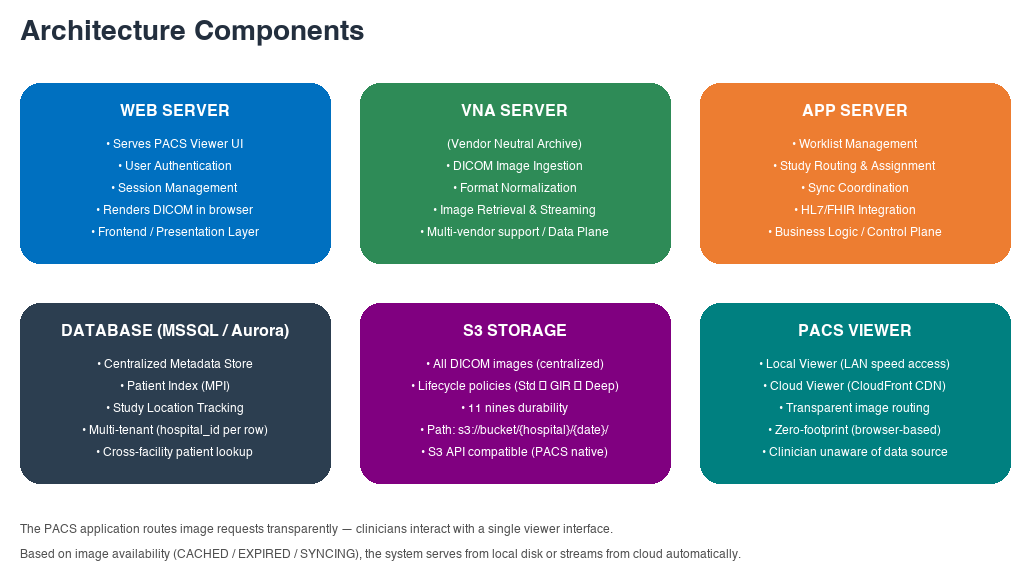
Every PACS, regardless of vendor or deployment model, consists of six core building blocks. Cloud migration does not replace these components. Instead, it re-hosts and enhances them with cloud-native capabilities. The following diagram and table describe each component and its role in architecture.
Figure 2: Six core components of a PACS architecture
Component breakdown
The following table summarizes each component, its role, and how it operates within the architecture.
Replaces SAN/NAS with scalable pay-per-use storage. Lifecycle policies auto-tier by age and access.
PACS Viewer
Local + Cloud dual viewer with transparent routing
Routes requests to local or cloud viewer based on image availability. Clinicians remain unaware of data source.
How the components interconnect
An imaging device completes acquisition and sends DICOM objects to the VNA through C-STORE over the hospital LAN. The VNA normalizes encoding, applies compression, and writes standardized image bytes to storage.
The Application server updates the metadata database with the complete study record. It then evaluates routing rules to assign the study to the appropriate radiologist worklist based on urgency and subspecialty.
When a clinician opens a study, the PACS Viewer checks image location in the metadata database. Locally cached studies serve at LAN speed. Expired cache studies stream from the cloud viewer through a content delivery network. The clinician interacts with a single interface and remains unaware of the backend source.
Cloud-native PACS architecture on AWS
This architecture pattern applies to hospital networks that run a single PACS vendor consistently across all facilities. A common infrastructure across every site and the cloud is what allows the centralized system to discover and retrieve studies from any hospital in the network. The recommended architecture follows a hub-and-spoke model. Local PACS instances at each hospital (spokes) connect to a centralized cloud archive (hub) through AWS Direct Connect or AWS Site-to-Site VPN. This approach preserves quick image retrieval for daily clinical workflow while providing cross-facility interoperability, disaster recovery, and intelligent storage tiering.
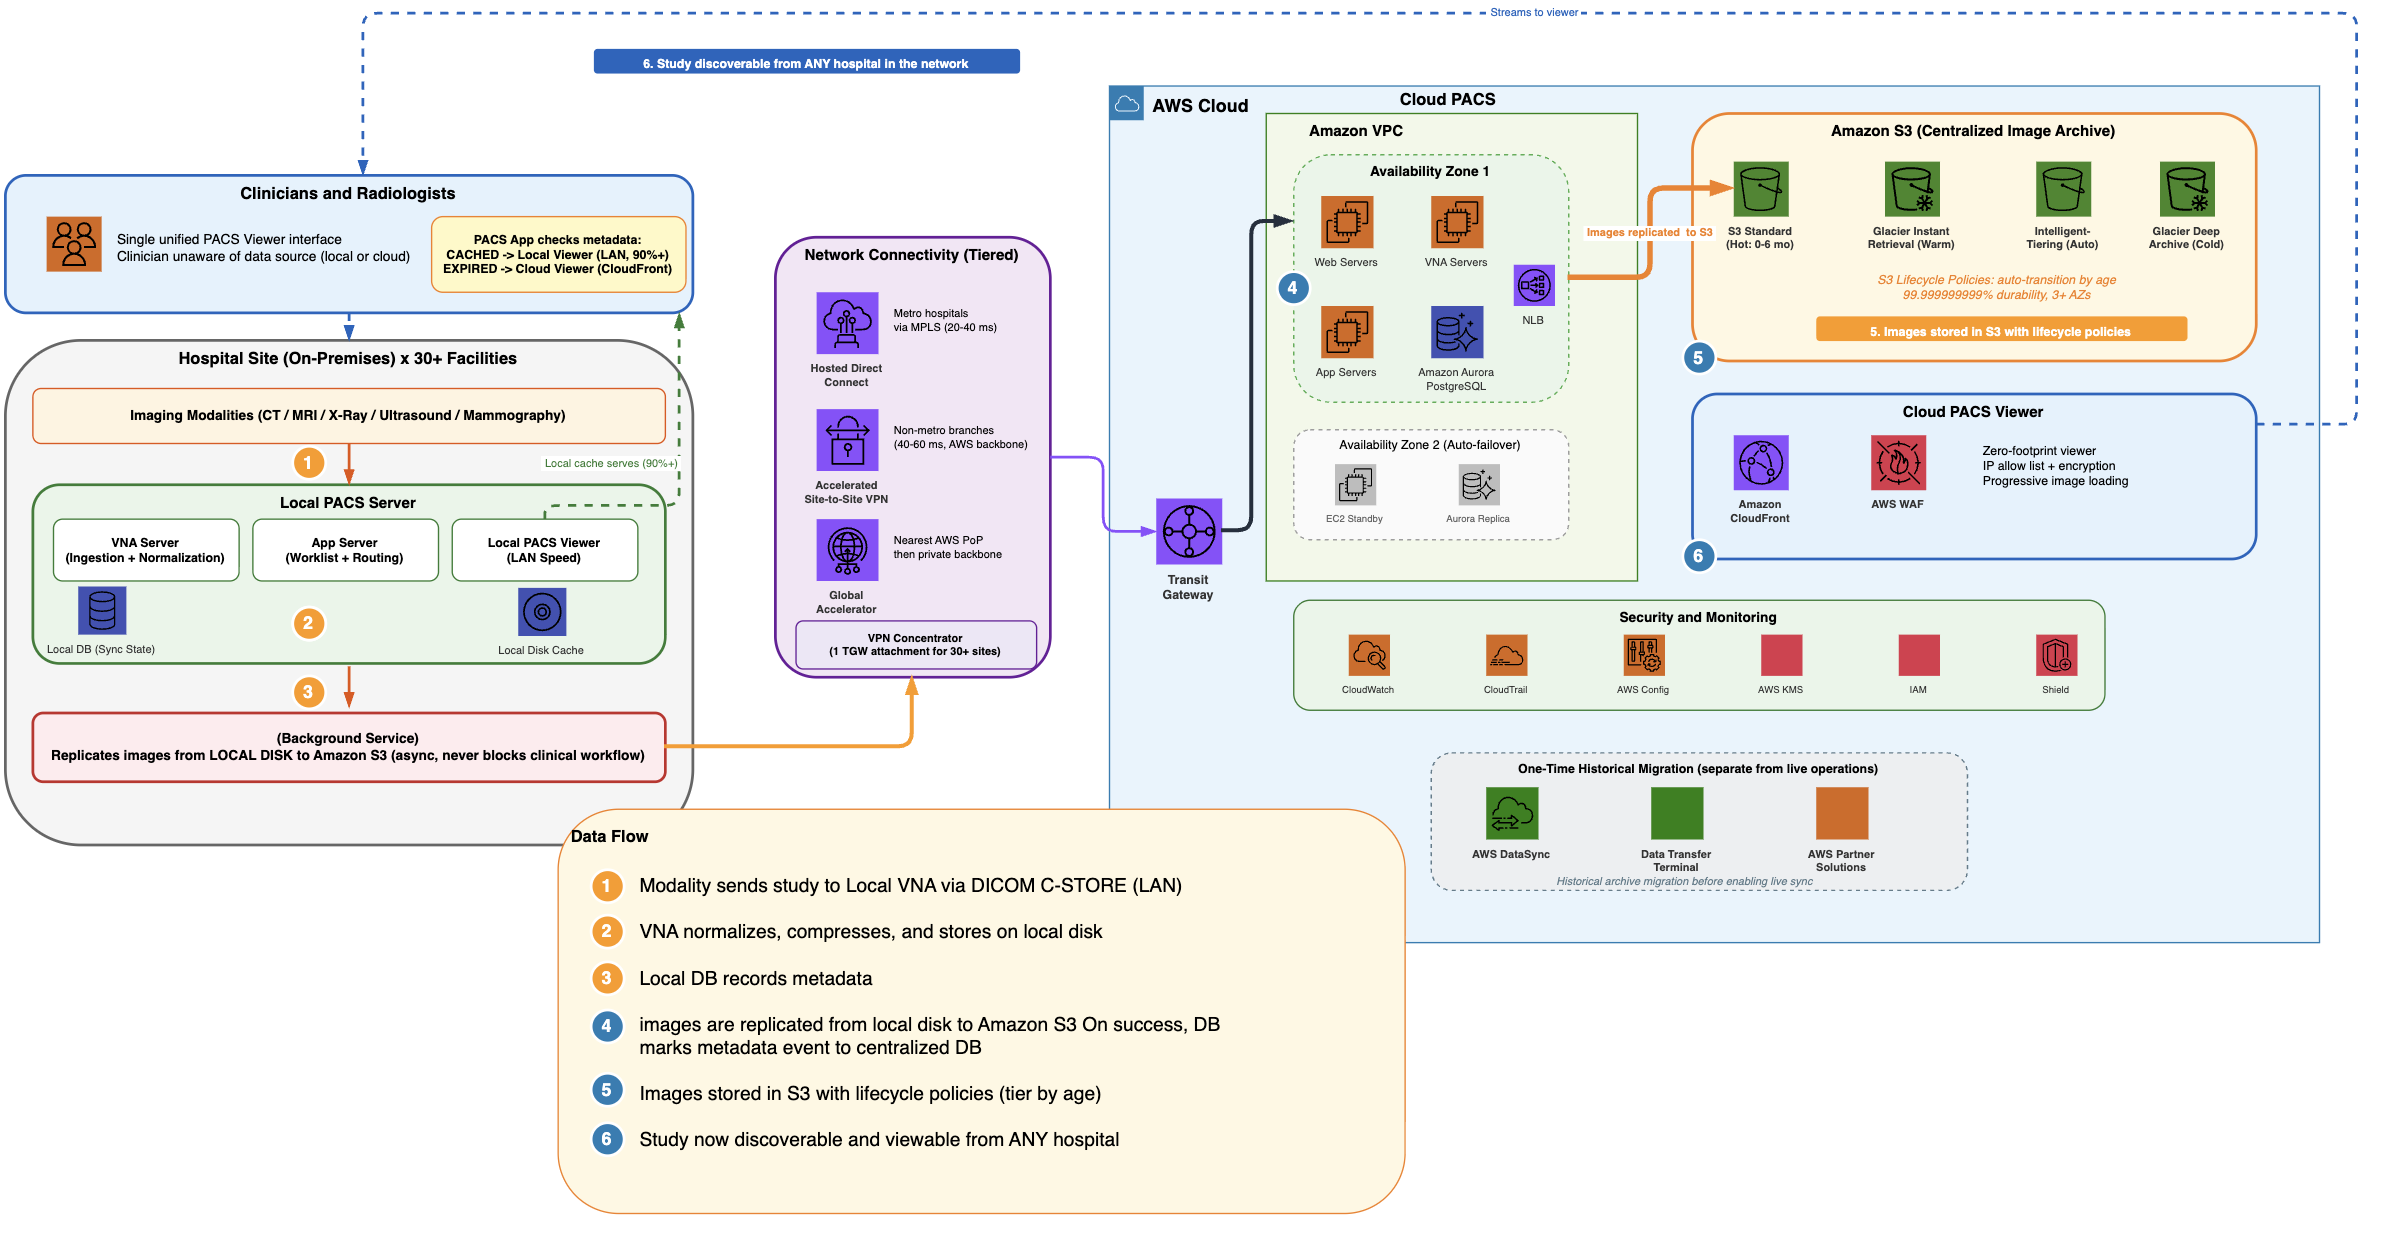
The following diagram shows the centralized PACS architecture on AWS with hub-and-spoke connectivity.
Figure 3: Centralized PACS architecture on AWS
Architecture flow
Each hospital retains a local PACS with Web Server, VNA, Application server, and local database. Imaging modalities send DICOM objects to the local VNA over the hospital LAN. Studies are immediately available for radiologist reading at LAN speed.
A single PACS vendor is deployed consistently across all hospital sites and in the cloud. Because every site and the centralized cloud archive run the same system sharing a common metadata database, the cloud-based system can discover and retrieve studies created at any facility in the network. A radiologist at one hospital can query and open a study acquired at any other hospital, giving the enterprise a unified patient imaging record.
In the background, the images generated from new studies are replicated to Amazon Simple Storage Service (Amazon S3) through Direct Connect or Site-to-Site VPN. Clinical workflow is never blocked because sync happens asynchronously.
Amazon S3 stores DICOM images with lifecycle policies that automatically tier data by access patterns. Amazon CloudFront and AWS WAF deliver the cloud PACS viewer for teleradiology access with IP allow list and encryption.
Transparent viewer experience
When a clinician requests a study, the PACS application checks the metadata database for image location. If the local system has cached the study (the majority of daily requests), it serves the images from local disk at LAN speed.
If the local cache has expired, the cloud viewer streams from Amazon S3 through Amazon CloudFront with progressive loading.
High availability and disaster recovery
The cloud deployment spans two Availability Zones with automatic failover. Amazon S3 replicates objects across multiple Availability Zones. On the local side, the cache serves recent studies if cloud connectivity drops.
If a local server fails, requests route to the cloud where all recent data is already synced. If cloud connectivity drops, the local cache continues serving recent studies without interruption. If a single AZ fails, automatic failover routes traffic to the surviving AZ within seconds.
Data protection and security controls
Medical imaging data contains sensitive patient information including patient names, dates of birth, and clinical findings in DICOM metadata. Under the AWS shared responsibility model, AWS secures the cloud infrastructure, while the customer configures services, manages access, and implements audit controls.
The architecture uses AWS services including Amazon S3 (encrypted image storage), Amazon Aurora (encrypted metadata), Amazon EC2 (encrypted compute), Direct Connect (private connectivity), Amazon CloudFront (encrypted viewer delivery), and AWS Key Management Service (AWS KMS) (key management with rotation).
The architecture includes security controls that healthcare organizations can use as part of their security programs: encryption at rest and in transit across every layer, comprehensive audit logging with AWS CloudTrail and Amazon S3 access logs, least-privilege access through IAM with role-based controls, and continuous monitoring with AWS Config.
For data residency, deploying in a regional AWS location keeps sensitive patient data within national borders. S3 bucket policies can enforce region-level restrictions for organizations with specific data sovereignty requirements.
Storage tier planning
Running PACS on AWS provides the ability to use Amazon S3 storage tiers that align cost with access patterns. Traditional on-premises SAN/NAS stores data on a single expensive tier regardless of access frequency. Amazon S3 provides intelligent lifecycle management that reduces storage costs while improving durability.
Understanding access patterns is key
Traditional on-premises storage uses a single tier for data regardless of access frequency. Amazon S3 provides multiple tiers that align cost with how often data is accessed.
Medical imaging data follows a predictable decline in access frequency: frequent in the first months (reporting, follow-ups), dropping sharply after 6 to 12 months, and rarely accessed after 2-3 years. Mapping this pattern to storage tiers is a high-impact cost optimization decision.
This predictable decline in access frequency makes PACS an ideal workload for tiered storage. The key questions to answer are: how long do radiologists typically reference prior studies? What is your average follow-up window? What percentage of archived studies are ever retrieved after 12 months? These answers drive the lifecycle policy configuration.
Studies in their first 6 months to 1 year are actively accessed. Radiologists reference them for follow-up comparisons. Clinicians review them during patient visits. Reporting workflows are still active.
These studies sit on S3 Standard, which provides millisecond access with high throughput. This is equivalent to the performance clinicians expect from traditional local SAN, but without the upfront costs, hardware refresh cycles, or capacity planning overhead.
S3 Glacier Instant Retrieval (GIR) provides millisecond retrieval (the same access speed as S3 Standard) at significantly lower storage cost with nominal retrieval fees. For PACS workloads, this combination of low storage cost with millisecond retrieval is particularly well suited.
When you occasionally access studies older than 6 to 12 months for comparative reads, these make ideal candidates for GIR.
This combination of instant retrieval with archive-tier pricing makes GIR well suited for medical imaging, where occasional access to historical studies is clinically important but infrequent enough to benefit from reduced storage rates.
For datasets with unpredictable access patterns (research hospitals, teaching institutions), S3 Intelligent-Tiering automatically moves objects between tiers based on actual usage with no retrieval fees or operational overhead.
Studies older than 5 years that require long-term retention move to S3 Glacier Deep Archive. Retrieval takes 12 to 48 hours, acceptable for infrequent retrieval needs. Storage cost is minimal.
Why this matters for PACS
Amazon S3 replicates objects across multiple Availability Zones within a region. With Cross-Region Replication (CRR), the same archive provides built-in disaster recovery across geographically separated regions. Most modern PACS solutions support S3-compatible APIs natively, requiring no custom middleware.
Amazon S3 stores every object redundantly across multiple physically separated Availability Zones within a region. With Cross-Region Replication (CRR), organizations can maintain a full disaster recovery copy in a secondary region with no additional infrastructure to manage.
The majority of modern PACS solutions natively support writing and reading data through S3-compatible APIs. This eliminates the need for complex storage integration configurations or proprietary connectors.
Cloud-only vs. hybrid: Making the decision
The choice between a fully cloud-based PACS and a hybrid (local + cloud) deployment is not driven by imaging volume. High-volume sites operate successfully in both models. The right answer depends on two factors specific to each facility.
Cloud-only PACS is a strong fit when:
Redundant, reliable connectivity is available. The facility’s region has well-established, high-bandwidth links to the cloud from at least two independent network carriers, ensuring no single point of failure for clinical workflows.
The PACS vendor offers a cloud-optimized solution. The solution delivers equal or faster performance when deployed in the cloud compared to on-premises. This is achievable today: vendors running entirely on AWS have publicly demonstrated faster image retrieval than traditional on-premises deployments, even at enterprise scale.
This model eliminates local infrastructure, removes hardware refresh cycles, and centralizes operations across all sites.
Hybrid PACS (local + cloud) is a strong fit when:
Connectivity is limited or single carrier. Regions where redundant high-bandwidth links are not yet available, or where network reliability does not meet clinical uptime requirements.
The PACS solution performs best with local caching. Some vendor architectures are optimized for local-first access, with a site cache providing sub-second retrieval for active studies while background sync handles cloud replication asynchronously.
This model ensures uninterrupted clinical performance regardless of WAN conditions and provides a natural migration path toward cloud-only as connectivity and vendor solutions mature.
Both architectures use AWS as the durable, long-term archive. The difference is where the active working set lives day-to-day.
Conclusion
The hybrid cloud architecture described in this document is designed to help address the core on-premises PACS challenges: storage cost explosion, data silos across facilities, radiologist routing bottlenecks, and unbounded archive growth.
Next step: Conduct a device inventory and access pattern analysis to turn this conversation into a numbers-driven plan.
The AWS European Sovereign Cloud is a new, independent cloud for Europe, physically and logically separate from existing AWS Regions and operated within the European Union (EU). It provides the same services, features, and APIs as AWS commercial Regions, but runs as a distinct AWS partition (aws-eusc), with its own control plane, AWS Identity and Access Management (IAM), billing, console, and service endpoints. Understanding the partition boundary is the key that unlocks correct answers to questions about billing roll-ups, single sign-on (SSO), cross-account roles, AWS Direct Connect, and image distribution. In this post, we show you how to architect a secure, scalable landing zone in the AWS European Sovereign Cloud. We cover account structure and governance, identity managed as infrastructure as code (IaC), centralized logging to a security and event management (SIEM) tool, data protection, network and perimeter design, secure continuous integration and delivery (CI/CD) and artifact distribution, and incident response. Throughout, we map the design to the AWS Security Reference Architecture (AWS SRA) and the AWS Well-Architected Framework, and we call out which behaviors are platform boundaries of a sovereign partition and which are configuration choices you can adapt.
If you are evaluating compliance readiness alongside your landing zone build-out, see the companion post Landing Zone Accelerator Independent Assessment Report for C5:2020 now available on AWS Artifact. This post covers how to align with C5:2020 criteria and provides an independent assessment report and compliance workbook, resources that complement the architectural patterns described here.
The foundational concept: EUSC is a partition
AWS groups Regions into partitions. Every Region is in exactly one partition, and each partition has one or more Regions. Partitions have independent instances of AWS Identity and Access Management (IAM) and provide a hard boundary between Regions in different partitions. AWS commercial Regions are in the aws partition, Regions in China are in the aws-cn partition, and AWS GovCloud Regions are in the aws-us-gov partition. The AWS European Sovereign Cloud is the aws-eusc partition, with its first Region in Brandenburg, Germany (eusc-de-east-1).
Some AWS services provide cross-Region functionality, such as Amazon S3 Cross-Region Replication or AWS Transit Gateway Inter-Region peering. These capabilities work only between Regions in the same partition. You can’t use IAM credentials from one partition to interact with resources in a different partition. There are practical differences that impact your architecture, shown in the following table:
Dimension
Commercial AWS (aws)
AWS European Sovereign Cloud (aws-eusc)
ARN prefix
arn:aws:
arn:aws-eusc:
Console or endpoint domain
amazonaws.com
amazonaws.eu
AWS Organizations
One organization in the partition
A separate, independent organization
AWS IAM Identity Center
Instance in the partition
A separate instance in the partition
Billing
Consolidated in the partition’s payer
A separate payer and billing system (EUR currency)
Cross-partition features and services such as: sts:AssumeRole, VPC peering, Transit Gateway, AWS RAM, Amazon S3 replication
Cross-Region features and functionality
Not available across the aws and aws-eusc boundary
Every AWS Region is sovereign by design: if you find yourself architecting across Regions, note that this partition boundary means that the centralization—one organization, one logging account, one identity source, one billing roll-up—is achievable within each partition. In the EUSC you operate an independent landing zone in aws-eusc that mirrors your commercial operating model. Where you need to bridge the two clouds (for example, a standard application CI/CD system in an AWS commercial Region deploying into EUSC), you integrate at the network or API layer with separate credentials for each partition, not with cross-partition trust. With these partition fundamentals in mind, the remainder of this post walks you through the considerations to build a production-ready landing zone in the EUSC. Each section addresses a critical layer of the architecture, starting with how to write partition-aware infrastructure code that works across both aws and aws-eusc, then moving into the organizational and governance controls that underpin everything else.
Cross-partition IaC
These Terraform and AWS CloudFormation IaC snippets demonstrate partition-aware Amazon Resource Name (ARN) construction—a pattern that helps ensure your infrastructure code works unchanged across AWS partitions (such as standard aws, GovCloud aws-us-gov, or European Sovereign Cloud aws-eusc).
In the case of using the same Terraform script from a commercial Region, ensure that arn:aws isn’t hard coded. This Terraform script derives the partition at deploy time so the same modules work in both AWS commercial Regions and the EUSC.
# Terraform: partition-aware ARNs (works unchanged in aws and aws-eusc)data "aws_partition""current" {}
data "aws_partition" "current" {}
data "aws_region" "current" {}
data "aws_caller_identity" "current" {}
data "aws_organizations_organization" "current" {}

locals {
partition = data.aws_partition.current.partition# "aws" or "aws-eusc"
account_id = data.aws_caller_identity.current.account_id
org_id= data.aws_organizations_organization.current.id
ecs_task_execution_policy_arn = "arn:${local.partition}:iam::aws:policy/service-role/AmazonECSTaskExecutionRolePolicy"
central_logs_bucket_arn= "arn:${local.partition}:s3:::${local.org_id}-central-logs"
}

resource "aws_iam_role" "amazon_ecs_role" {
  name = "AmazonECSrole"
  assume_role_policy = jsonencode({
    Version = "2012-10-17"
    Statement = [
      {
        Action = "sts:AssumeRole"
        Effect = "Allow"
        Sid= ""
        Principal = {
          # IAM service principals are "amazonaws.com" across all partitions,
          # this stays literal (do NOT use ${AWS::URLSuffix} here).
          Service = "ecs-tasks.amazonaws.com"
        }
      },
    ]
  })
}

resource "aws_iam_role_policy_attachment" "amazon_ecs_role_attach" {
  role= "AmazonECSrole"
  # Use ${local.partition } rather than hardcoding "aws" in the ARN.
  policy_arn = "arn:${local.partition}:iam::aws:policy/service-role/AmazonECSTaskExecutionRolePolicy"
}
# CloudFormation: use the AWS::Partition pseudo parameter, never a literal "aws"

AWSTemplateFormatVersion: "2010-09-09"

Description: >-
Creates an ECS task execution role. Demonstrates using the
${AWS::Partition} pseudo parameter in ARNs instead of hardcoding "aws",
so the template works across partitions (aws, aws-cn, aws-us-gov, aws-eusc).

Resources:
  ExecRole:
    Type: AWS::IAM::Role
    Properties:
      RoleName: AmazonECSroleCF
      AssumeRolePolicyDocument:
        Version: "2012-10-17"
        Statement:
          - Effect: Allow
            Principal:
              Service:
                # IAM service principals are "amazonaws.com" across all partitions,
                # so this stays literal (do NOT use ${AWS::URLSuffix} here).
                - "ecs-tasks.amazonaws.com"
            Action: "sts:AssumeRole"
      ManagedPolicyArns:
        # Use ${AWS::Partition} rather than hardcoding "aws" in the ARN.
        - !Sub "arn:${AWS::Partition}:iam::aws:policy/service-role/AmazonECSTaskExecutionRolePolicy"

Outputs:
  ExecRoleArn:
    Description: ARN of the created ECS task execution role
    Value: !GetAtt ExecRole.Arn
Account structure and governance
AWS Control Tower offers a straightforward way to set up and govern an AWS multi-account environment, following prescriptive best practices. AWS Control Tower orchestrates the capabilities of several other AWS services, including AWS Organizations, AWS Service Catalog, and AWS IAM Identity Center, to build a landing zone in less than an hour. Resources are set up and managed on your behalf.
We recommend following the AWS Security Reference Architecture (AWS SRA) multi-account model structure for a EUSC deployment. Use the management account only for governance, deploy universal security guardrails through service control policies (SCPs), resource control policies (RCPs), and service deployments (such as AWS CloudTrail) that will affect all member accounts in the organization.
Region-deny SCPs are commonly applied in commercial Regions, but aren’t required (at this time) in the EUSC because of the physically and logically separated nature of its design.
Other possible SCPs for the management OU:
Service-level guardrails – Restrict which AWS services can be used, based on your compliance posture.
Network perimeter controls – Enforce virtual private cloud (VPC) endpoints, deny public access patterns, and restrict egress.
Encryption and key management – Require AWS Key Management Service (AWS KMS) managed keys for all data-at-rest services and enforce key policies aligned with your sovereignty requirements.
Note: As additional EUSC Regions or Local Zones become available, the partition boundary continues to enforce isolation from non-EUSC Regions. If you need to restrict usage to a subset of EUSC Regions (for example, only eusc-de-east-1 but not a future eusc-de-west-1), a Region-deny SCP would become relevant at that point.
Identity: IAM Identity Center as IaC, no direct payer access
IAM Identity Center is available in the AWS European Sovereign Cloud as an independent instance within the partition. You can connect it to your external identity provider (IdP)—Microsoft Entra ID, Okta, and so on—using SAML/SCIM, exactly as in AWS commercial Regions. If you already use Identity Center to federate in the commercial partition, you can point a second Identity Center integration at the same corporate IdP, so users keep one set of credentials. You manage permission sets, groups, and account assignments separately for each partition.
Manage permission sets and assignments as code
The following Terraform defines a permission set with both an AWS managed policy and an inline least-privilege policy, then assigns a group to a target account. Reproduce the aws_ssoadmin_account_assignment for each account or organizational unit (OU) mapping.
Because group membership comes from your IdP over SCIM, the IdP handles joiner, mover, and leaver, and access in EUSC updates automatically. No one receives direct access to the management account; all human access flows through IAM Identity Center permission sets assigned to non-management accounts.
data "aws_ssoadmin_instances" "this" {}
data "aws_partition" "current" {}

# Workload account the group is assigned to.
variable "analytics_workload_account_id" {
  type        = string
  description = "Account ID of the workload account to assign the permission set to"
}

locals {
  sso_instance_arn  = tolist(data.aws_ssoadmin_instances.this.arns)[0]
  identity_store_id = tolist(data.aws_ssoadmin_instances.this.identity_store_ids)[0]
}

resource "aws_ssoadmin_permission_set" "analytics_operator" {
  name             = "AnalyticsOperator"
  description      = "Operate analytics workloads; no IAM or billing"
  instance_arn     = local.sso_instance_arn
  session_duration = "PT4H"
}

# Attach an AWS managed policy
resource "aws_ssoadmin_managed_policy_attachment" "analytics_ro" {
  instance_arn       = local.sso_instance_arn
  permission_set_arn = aws_ssoadmin_permission_set.analytics_operator.arn
  managed_policy_arn = "arn:${data.aws_partition.current.partition}:iam::aws:policy/ReadOnlyAccess"
}

# Add a least-privilege inline policy (note the partition-aware ARNs)
resource "aws_ssoadmin_permission_set_inline_policy" "analytics_inline" {
  instance_arn       = local.sso_instance_arn
  permission_set_arn = aws_ssoadmin_permission_set.analytics_operator.arn
  inline_policy = jsonencode({
    Version = "2012-10-17"
    Statement = [{
      Sid      = "OperateAnalyticsData"
      Effect   = "Allow"
      Action   = ["s3:GetObject", "s3:PutObject", "s3:ListBucket"]
      Resource = [
        "arn:${data.aws_partition.current.partition}:s3:::analytics-*",
        "arn:${data.aws_partition.current.partition}:s3:::analytics-*/*"
      ]
      Condition = { StringEquals = { "aws:RequestedRegion" = "eusc-de-east-1" } }
    }]
  })
}

# Group for analytics operators.
# In production this is typically synced from your IdP via SCIM; here we
# manage it directly so the config is self-contained.
resource "aws_identitystore_group" "analytics" {
  identity_store_id = local.identity_store_id
  display_name      = "analytics-operators"
  description       = "Analytics operators"
}

# Assign the group to a workload account with the permission set
resource "aws_ssoadmin_account_assignment" "analytics_to_workload" {
  instance_arn       = local.sso_instance_arn
  permission_set_arn = aws_ssoadmin_permission_set.analytics_operator.arn
  principal_id       = aws_identitystore_group.analytics.group_id
  principal_type     = "GROUP"
  target_id          = var.analytics_workload_account_id
  target_type        = "AWS_ACCOUNT"
}
Cross-account roles for governance, logging, and tooling
Cross-account roles within the EUSC partition work normally; this is how the logging and security-tooling accounts collect from workload accounts. Scope each trust policy to a specific principal and harden it with an external ID (for third-party tooling) and partition-aware ARNs.
A role in the aws partition can’t assume a role in aws-eusc (or the reverse).
Logging and monitoring: centralized in EUSC, exported to your SIEM
A sovereign logging architecture requires three things:
A single, immutable store for all audit and operational logs
A central security account that runs detective controls and correlates findings
A reliable, in-partition path that feeds everything into your SIEM without data ever leaving the boundary.
In the subsections that follow, we walk through each layer: Centralized log collection in the Log Archive account, Amazon GuardDuty and AWS Security Hub administration through the Security Tooling account, and the pull-based SIEM integration pattern that keeps telemetry inside the EUSC partition.
Centralize logs in the Log Archive account
The Log Archive account holds the organization trail and a central log bucket as part of the landing zone. In the commercial AWS partition, global services like IAM route their CloudTrail events to us-east-1. In the EUSC, global services events are logged within the EUSC partition because the control plane is independent and located entirely within the EU.
Organization level detective services
GuardDuty and Security Hub are available in EUSC, but organization-wide auto-enable and some newer features might differ from commercial AWS features at any given time. Design the Security Tooling account as the delegated administrator where supported. If org-level auto-enable isn’t yet available, enable per-account through your IaC (AWS CloudFormation StackSets) so coverage is complete and code-managed. Treat the EUSC service and feature list as the source of truth and gate optional features behind a partition flag.
Network security and perimeter, including AWS Direct Connect
The AWS European Sovereign Cloud has its own sovereign AWS Direct Connect points of presence (PoPs), with dedicated networking infrastructure and connectivity from European providers, providing customers an autonomous network path into the partition. You terminate Direct Connect in a dedicated Network account and share connectivity to workload VPCs using Transit Gateway (with AWS RAM). A Direct Connect connection or Direct Connect gateway in the commercial partition can’t be extended into aws-eusc. To reach EUSC VPCs, you provision a separate Direct Connect connection that lands in the EUSC partition’s Network account. If your on-premises network already backhauls to AWS commercial Regions, you connect that network to EUSC with its own virtual interface or connection, or a site-to-site VPN. You don’t bridge the two AWS partitions through a shared Direct Connect gateway.
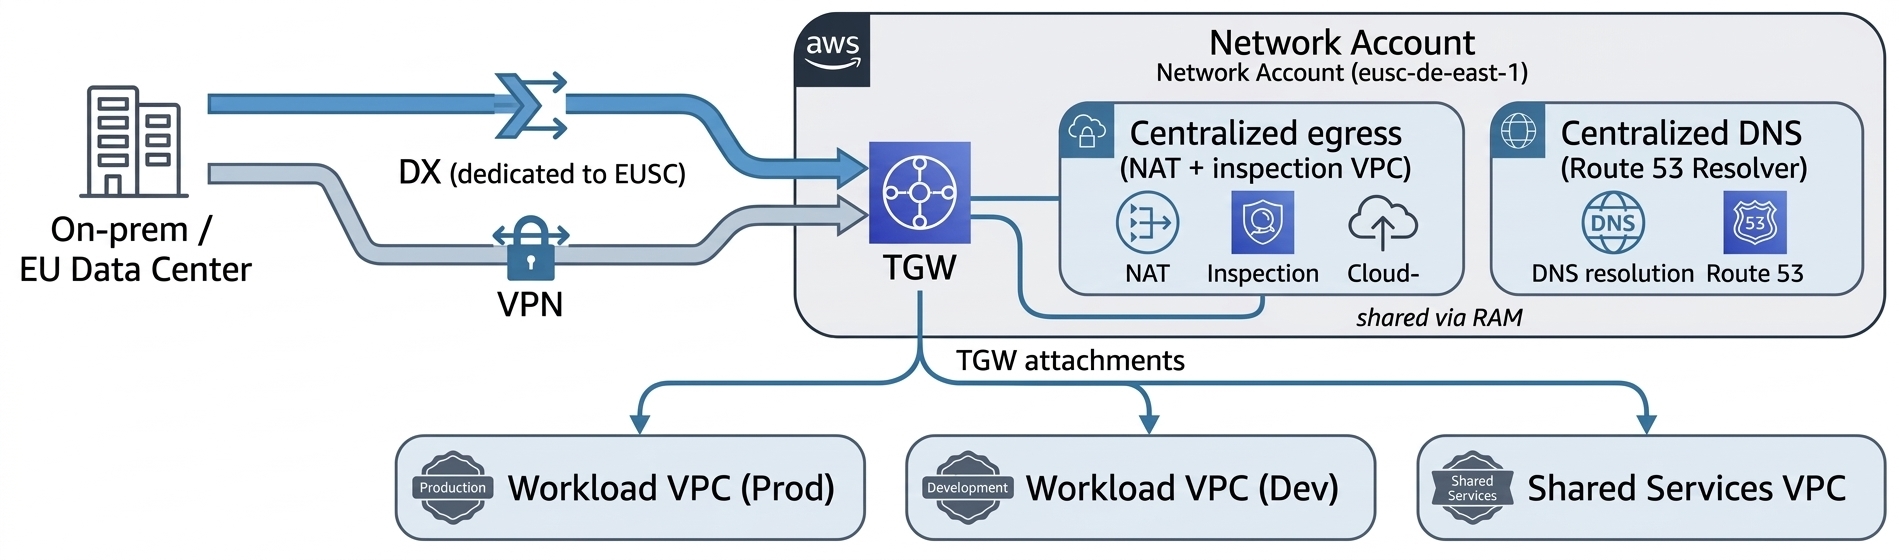
The following figure shows the recommended perimeter design in EUSC.
Figure 1: Recommended perimeter design in EUSC
The perimeter design includes:
Centralized egress and inspection – Route workload egress through an inspection VPC in the Network account (gateway load balancer with your firewall of choice, or AWS Network Firewall. Keep workload VPCs private with no internet gateway.
Private service access – Use VPC interface endpoints (VPCe) for AWS service calls so traffic stays on the AWS network within the partition. VPCe doesn’t cross partitions; expose any commercial-partition service to EUSC consumers over DX/VPN and an in-EUSC load balancer.
DNS – EUSC has its own Amazon Route 53. For names that must resolve across clouds, use subdomain delegation or Resolver forwarding rules over your DX or VPN link rather than expecting hosted zones to be visible across partitions.
Segmentation as code – Express segmentation with security groups referencing prefix lists and keep the EUSC IP ranges current from the partition’s published ip-ranges file in your firewall automation.
Data protection
AWS Key Management Service (AWS KMS) is available in EUSC; use customer managed keys for all sensitive data stores and enforce their use with SCPs and key policies. Where your residency or operational-autonomy requirements call for it, evaluate AWS KMS external and imported key material options available in the partition.
For workloads where regulation mandates that key material never resides within the cloud provider’s infrastructure, configure an AWS KMS External Key Store (XKS) in the EUSC Region. The XKS proxy connects AWS KMS to your EU-based hardware security module (HSM) (on-premises or hosted with an EU trust service provider); all encrypt and decrypt operations are performed by your external key manager. Note the trade-offs: increased latency, reduced availability SLA, and added operational burden. Reserve XKS for the subset of data where regulatory or contractual obligations explicitly require it.
The EUSC Region has achieved SOC 2, BSI C5 Type 1 attestation, and seven ISO certifications, including ISO 27001, 27017, 27018, and 27701. Reference these in your data protection evidence packages when demonstrating encryption-at-rest and key management controls to EU regulators.
Secure CI/CD and distributing images across the partition boundary
Container images – Build (or re-tag and re-sign) images and push to an Amazon ECR registry inside EUSC. ECR cross-Region replication works within the partition (useful as EUSC adds Regions or Local Zones), but the initial crossing from commercial is an explicit pipeline push using EUSC credentials. Sign images with a sovereign signing key and verify at deploy time.
AMIs and images – Rebuild golden images in EUSC with EC2 Image Builder (run the pipeline natively in EUSC), or import virtual machine (VM) images using Amazon S3 in EUSC and aws ec2 import-image. There is no direct cross-partition AMI copy.
Binaries and artifacts – Stage in an artifact bucket in the EUSC Shared Services account. Move packages across the boundary with aws s3 sync or AWS DataSync over your DX or VPN, or using controlled export, then distribute within the partition using in-partition S3 replication to other EUSC Regions or Local Zones as they come online.
# Push a container image to ECR inside EUSC (note the .eu endpoint).
# Credentials/profile must be for the aws-eusc partition.
aws ecr get-login-password --region eusc-de-east-1 --profile eusc-shared-services \
  | docker login --username AWS --password-stdin \
    111122223333.dkr.ecr.eusc-de-east-1.amazonaws.eu

docker tag company/runtime:7.x \
  111122223333.dkr.ecr.eusc-de-east-1.amazonaws.eu/company/runtime:7.x
docker push \
  111122223333.dkr.ecr.eusc-de-east-1.amazonaws.eu/company/runtime:7.x
Remember that endpoints and ARNs use amazonaws.eu in the EUSC partition. IAM service principals always use amazonaws.com regardless of partition.
Replicating deployment code and pipelines
Run a native deployment plane in EUSC (AWS CodePipeline, AWS CodeBuild, AWS CodeDeploy, or your existing tool deployed in-partition) in the Shared Services account, with cross-account deploy roles into workload accounts. If a commercial-partition continuous-integration system must deploy into EUSC, give it separate credentials for each partition; the clean pattern is OIDC federation with two trust configurations, one for each partition, because no cross-partition role assumption exists.
// Deploy role in an EUSC workload account, trusted by the EUSC Shared Services pipeline role
{
  "Version": "2012-10-17",
  "Statement": [{
    "Effect": "Allow",
    "Principal": { "AWS": "arn:aws-eusc:iam::<SHARED_SERVICES_ACCT>:role/PipelineDeployRole" },
    "Action": "sts:AssumeRole",
    "Condition": { "StringEquals": { "sts:ExternalId": "EUSC-deploy" } }
  }]
}
For account vending and landing-zone-as-code, use Account Factory for Terraform (AFT) deployed in EUSC. AFT pipelines create accounts through AWS Control Tower, apply baseline guardrails, bootstrap the preceding partition-aware modules, and register OUs, giving you the accounts and account groups as code. Keep Terraform state for each partition in an in-EUSC Amazon S3 backend with an Amazon DynamoDB lock table; don’t share state across partitions.
The Landing Zone Accelerator on AWS (LZA) solution is an alternative deployment method that provisions a baseline security architecture and includes customizations for each partition, with consideration for service availability. A customized configuration baseline for European Sovereign Cloud was recently released and is accompanied by the LZA Compliance Workbook, which maps regional European security standards and international frameworks to over 200 security settings deployed by LZA.
Supported compared to by-design boundaries: A quick reference
Capability
Status in EUSC
What to do
AWS Control Tower account vending, controls
Supported in-partition
Govern the EUSC Region; drive vending with AFT; re-register OUs after Region changes
AWS Control Tower–managed or self-managed IAM Identity Center
Configuration choice
Choose self-managed to own permission sets as code
Permission set creation and assignment as IaC
Supported
Manage with SCIM groups from your IdP
Identity Center single home and delegated admin for each partition
By-design behavior
Administer from one Region; non-issue in single-Region EUSC
Roll up within the EUSC organization, not across partitions. Enable consolidated billing in the EUSC management account and deliver AWS Data Exports (Cost and Usage Report 2.0) to an S3 bucket in a dedicated finance or governance account in the Security or Infrastructure OU.
Set permissions so workload teams can query the curated data in that account; no one should be able to access the management or payer account directly. You can’t replicate billing data into the commercial partition; the EUSC has a separate payer (billed in EUR through the EU contracting entity).
Conclusion
Architecting in the AWS European Sovereign Cloud is, in most respects, architecting a second well-run AWS landing zone with one organizing principle that resolves nearly every design question: it’s an independent partition. Centralization of governance, identity, logging, and billing is fully achievable, but within the EUSC partition. The boundaries you encounter between commercial AWS and EUSC—no cross-partition roles, peering, replication, or billing roll-up—are the sovereignty guarantees doing their job.
Build the foundation as code. Use an AWS Control Tower landing zone driven by AFT, IAM Identity Center permission sets and assignments in Terraform federated to your corporate IdP, an immutable central log store, customer managed encryption keys constrained to the sovereign Region, and a Network account terminating a dedicated Direct Connect. Add a CI/CD plane that pushes images and artifacts into the partition with per-partition credentials. Keep every ARN partition-aware and every optional service behind a feature flag, and the same modules will serve both clouds.
To accelerate your build with additional enablement from AWS, explore the LZA Universal Configuration for European Sovereign Cloud on GitHub, which packages many of the patterns described in this post into a ready-to-deploy baseline. To complement your deployment with compliance readiness, the LZA Independent Assessment Report for C5:2020 evaluates how LZA’s security baseline maps to C5:2020 technical requirements, and you can download the report and the LZA Compliance Workbook from AWS Artifact.
AWS Security Token Service (AWS STS) has simplified session token size limits, giving you more room for your session policies and session tags. STS has replaced the packed policy size and the overall session token size limits with a single token size limit of 4,096 bytes. STS now reports session token size in API responses, Amazon CloudWatch metrics, and AWS CloudTrail events. By using STS, you can also generate session tokens of different sizes, so you can find the maximum token size that your infrastructure can support.
The 4,096-byte limit is the current maximum, not a permanent ceiling. AWS might increase the limit as new capabilities are added that require session tokens to carry more information.
In this post, you learn what has changed, what this change means for you, and what to do next.
What has changed
AWS STS session-vending APIs, such as AssumeRole, AssumeRoleWithSAML, AssumeRoleWithWebIdentity, GetSessionToken, and GetFederationToken, return temporary security credentials: an access key ID, a secret access key, and a session token. This change governs the session token, the opaque string that STS creates from the session policies and tags you pass plus the context that AWS adds.
Three things have changed.
A single limit: Previously, STS enforced two size limits on the session token. It serialized and compressed your session policies and tags into a form called the packed policy, which had its own limit. The assembled token, which included the packed policy, had a separate overall limit. A request could fail against either limit, and both failures returned the same PackedPolicyTooLargeException, so you couldn’t tell which one you exceeded. STS now enforces a single limit: the assembled session token must fit within 4,096 bytes. The separate packed policy limit, which made failures hard to predict, has been removed. When a token exceeds the assembled session token limit, STS returns PackedPolicyTooLargeException. STS continues to use the same exception, so existing error-handling code works without an SDK update.
Session token size is now reported. Every successful response from an STS session-vending API includes SessionTokenSize (which reports the session token size in bytes) and SessionTokenUtilization (which reports the percentage of the 4,096-byte limit consumed). STS also returns PackedPolicySize in every successful response for backward compatibility. PackedPolicySize now reports the same value as SessionTokenUtilization, enabling applications that use older AWS SDK versions to monitor utilization through this field. These response fields are also recorded in CloudTrail events. In CloudWatch, SessionTokenSize and SessionTokenMaxSize (the enforced limit) are published in the AWS/STS namespace.
Testing is more straightforward:MinimumSessionTokenSize is a new optional parameter on the STS session-vending APIs. You can use it to increase a session token to at least the size you specify, up to 4,096 bytes. Use the parameter to find the maximum token size your infrastructure can handle.
Behavior
Previously
Now
Limits enforced
Two: Packed policy size and assembled token size
One: Assembled session token size (4096 bytes)
Error on failure
PackedPolicyTooLargeException: The error message didn’t identify which of the two limits was exceeded.
PackedPolicyTooLargeException: The updated message reports your session token size and the maximum allowed size, both in bytes.
Session token size visibility
Not reported
API Response and AWS CloudTrail:
SessionTokenSize, SessionTokenUtilization, and PackedPolicySize. PackedPolicySize reports the same percentage as SessionTokenUtilization for backward compatibility.
Amazon CloudWatch:
SessionTokenSize and SessionTokenMaxSize
Infrastructure testing
No mechanism
MinimumSessionTokenSize: Parameter on sesssion-vending APIs
What this change means for you?
How this affects you depends on your situation. The following scenarios cover the most common cases.
If you have never hit a token size error: You’re unlikely to notice a change. Your tokens stay their current size and gain headroom. Over time they could become larger than your systems have handled before. We recommend you use MinimumSessionTokenSize to find the maximum token size your systems can handle. See the What to do next section for more details.
If you’ve hit PackedPolicyTooLargeException before: Some requests that previously failed now succeed under the single limit. Review any workarounds you put in place specifically to avoid token size errors and decide whether you still need them. General best practices still apply: consistent tag casing and reused tag values compress more efficiently, and concise session policies keep the assembled token smaller. No code change is required for error handling. AWS STS still returns PackedPolicyTooLargeException when the assembled session token exceeds the limit, the same exception STS returned before this change.
If your systems enforce their own size limits on credentials: If your application uses an AWS SDK to obtain temporary credentials and make AWS API calls, the SDK handles the session token internally, so token size doesn’t affect your code. Focus instead on systems that store or forward session tokens, such as load balancers, proxies, caches, and databases. These systems might have size limits that smaller tokens didn’t reach. For example, a database column defined as varchar(2048) can’t hold a 4,096-byte token. Review where you persist or pass session tokens, and identify the maximum token size each system supports. The next section shows how to test this.
What to do next
We recommend the following three steps to prepare your systems for this change.
Validate the maximum token size your systems can handle. Use MinimumSessionTokenSize to find the maximum session token size each system in your infrastructure can handle. Knowing these limits helps you identify systems that might reject or truncate larger tokens. The 4,096-byte limit reflects today’s needs, not a permanent ceiling. It might grow as AWS introduces new capabilities such as additional context keys for new services, richer audit metadata, and larger cryptographic signatures as the industry transitions to post-quantum algorithms. Avoid hard-coding the current maximum into your systems and revisit any fixed size assumptions if the limit changes.
Tip: AWS STS serializes and compresses your session policies and tags when assembling the token. Compression results vary based on the actual content, not just its length. Two sets of tags with identical character counts can produce different token sizes. This is why MinimumSessionTokenSize is a more reliable way to test your infrastructure than estimating from input length.
Start at 4,096 bytes to test against the largest possible token. If a system truncates or rejects it, lower the value to find the size your infrastructure supports, then raise that limit where you can. MinimumSessionTokenSize is available in the latest AWS SDK, AWS Command Line Interface (AWS CLI), and Tools for PowerShell versions. See the STS API Reference for details. If your AWS SDK or AWS CLI predates the parameter, update it to use this feature.
Monitor your session token size (recommended). If your infrastructure has size constraints, you can use monitoring to see tokens that are approaching your limit and act before a request fails. AWS STS reports size through three channels, each suited to a different need.
In the API response: Reading SessionTokenUtilization and SessionTokenSize from the response requires the latest AWS SDK version. You can also monitor token size through CloudWatch and CloudTrail without updating your SDK.
In CloudWatch: STS publishes SessionTokenSize and SessionTokenMaxSize in the AWS/STS namespace. Use them to build dashboards and set alarms. Set your alarm against the size limit you found during testing, not the 4,096-byte maximum. The maximum is the same for every account, so your own infrastructure limit is the one that matters.
The following figure shows the SessionTokenMaxSize and SessionTokenSize metrics graphed in the CloudWatch console.
Figure 1: SessionTokenMaxSize and SessionTokenSizemetrics in the CloudWatch console
In CloudTrail: Each STS session-vending event records SessionTokenUtilization and SessionTokenSize for successful calls.
Use appropriate fields for monitoring session token utilization. AWS STS still returns PackedPolicySize in session-vending API responses and CloudTrail records for backward compatibility. The field now reports the same value as SessionTokenUtilization: the percentage of the 4,096-byte session token size limit consumed by the token. As a result, PackedPolicySize values might appear lower even when your token content has not changed.
If your SDK exposes SessionTokenUtilization, use that field because its name reflects the value’s current meaning. If an earlier SDK does not expose SessionTokenUtilization, use PackedPolicySize to monitor the same utilization percentage without updating the SDK. We recommend you monitor SessionTokenSize for the token size in bytes.
Conclusion
You now have more room for session tags, tag values, and session policies in your AWS sessions. AWS STS enforces a single 4,096-byte session token limit, returns a clearer error message when a token exceeds it, and reports token size so you can track growth proactively. Validate your token-handling systems with MinimumSessionTokenSize, and watch SessionTokenUtilization and SessionTokenSize for ongoing visibility.
Your consumer identity and access management (CIAM) system is the foundation of your customer experience. It’s how users sign in, access services, and engage with your applications. As your business scales across geographies, ensuring authentication is always available becomes a core architectural requirement. However, building multi-Region authentication has traditionally required complex custom replication solutions that synchronize user data, manage consistency, and handle failover, all adding significant operational overhead. Amazon Cognito simplifies this with multi-Region replication (MRR), which automatically replicates user pools across AWS Regions with near-real-time synchronization, built-in failover, and seamless sign-in, while keeping operational complexity and costs optimized.
In this post, we show you how to prepare your user pool for MRR, provide architectural decisions and reference architectures for business to consumer (B2C), business to business (B2B), and machine to machine (M2M) use cases, and practical guidance on implementing failover strategies.
Amazon Cognito MRR at a glance
Amazon Cognito MRR creates a replica user pool in another AWS Region (a replica Region) that shares the same user pool ID as your primary user pool. The primary user pool (the user pool in your primary Region) remains authoritative, and its configurations (app client IDs, client secrets), user data (attributes, hashed credentials, group memberships), and external identity provider (IdP) settings are replicated to the replica with eventual consistency.
The user pool in the replica Region (replica user pool) supports user authentication operations (such as sign-in, token generation and revocation) and read-only operations towards user pool configurations and user attributes (such as list users and groups and describe user pool configurations). Write operations against user pool configurations and updating user attributes aren’t enabled in the replica user pool and can only be made in the primary user pool. Amazon Cognito returns an Action temporarily unavailable error when using managed login, or an OperationNotEnabledException when using an AWS SDK for those operations. See Supported API operations in secondary Regions for a list of API operations supported in replica Regions.
JSON web tokens (JWTs) and active sessions are interoperable between Regions; for example, a refresh token issued by the primary Region is accepted in the replica Region to retrieve new ID and access tokens.
While this post primarily focuses on MRR architecture patterns and considerations, you can visit the following posts to learn more about MRR basics and the next-generation infrastructure behind it:
You only need to set up one replica multi-Region key for your customer managed key because Amazon Cognito MRR supports only one additional replica Region.
You own the administration of the customer managed key, including key policies, rotation, and deletion. You can also consider a key rotation strategy before enabling MRR or enable automatic key rotation.
Follow least-privilege principles in KMS key policy and scope the KMS key to your user pool only. You can do so by applying a condition statement: kms:EncryptionContext:aws:cognito-idp:<userpool-arn>. See the data encryption section in the Amazon Cognito developer guide for a full example key policy.
Choose a multi-Region OIDC issuer
In each ID and access tokens, Amazon Cognito includes a default Issuer claim in the JWT payload, referred as iss, to represent the identity provider that issued the token. The OpenID Connect (OIDC) specification dictates that the iss format must be a URL that uses https scheme and publishes a JSON metadata document about the identity provider available at the <iss>/.well-known/openid-configuration path. The metadata document must also include the JSON Web Key (JWK) document in the <iss>/.well-known/jwks.json path, which contains the signing keys to validate the token signatures for its integrity.
The original issuer type follows the format as https://cognito-idp.<region>.amazonaws.com/<userpool_id>. However, this issuer URL format and the OIDC well-known metadata are regional resources. As part of the MRR capability, Cognito introduces a new multi-Region OIDC issuer type, the updated issuer, and follows the format as https://issuer-cognito-idp.<region>.amazonaws.com/<userpool_id>. This new updated issuer type replaces the original single Region type and maintains availability of the issuer endpoint regardless of the state of primary or replica Region.
Based on the issuer URL format you select, your OpenID Connect discovery endpoint is hosted at <iss>/.well-known/openid-configuration and your JSON Web Key Set (JWKS) endpoint at <iss>/.well-known/jwks.json. Both original type and updated type are supported with the Amazon Cognito MRR capability. You can change the issuer type at any stage in your MRR journey, and the newly issued tokens, including those generated by refresh tokens, will reflect the most current issuer type configurations.
We recommend adopting the updated issuer type. With the updated issuer type, the OpenID Connect discovery document and JWKS endpoint remain consistent and available regardless of which Region is servicing requests. This means your applications can always fetch signing keys for token verification, even during a regional impairment.
To adopt the updated issuer type, update your applications and downstream dependencies to validate against the new updatediss value. If you use the aws-jwt-verify library, update to v5.2.1 or later that supports updatedissuer type. Plan this as a coordinated deployment; existing ID and access tokens with the original issuer type remain valid and accepted by Amazon Cognito endpoints until they expire. When using an existing refresh token to exchange for a new set of ID and access tokens, new tokens always carry the current issuer format configuration at the time of token refresh operation, providing interoperability across two issuer formats.
If you can’t immediately adopt the multi-Region issuer—for example, because downstream services or third-party integrations validate the iss claim against a hard-coded original format pattern—you can enable MRR while continuing to use the originalissuer type. However, in this configuration the OIDC discovery endpoint and JWKS endpoint are tied to a single Region and might be unavailable during a regional impairment. Your multi-Region application might not be able to fetch public keys dynamically and validate token signatures. To mitigate this, it’s a good practice to implement a JWKS caching strategy in your token verification layer. Cache the signing keys locally (respecting the Cache-Control headers) so your applications can continue to validate tokens using cached keys when the JWKS endpoint is unreachable. This approach lets you benefit from MRR for user authentication while maintaining token verification continuity until you’re ready to complete the issuer migration. To learn more about the original and updated issuer types, see the Amazon Cognito user pools as an OIDC issuer section of the developer guide.
Configure regional service dependencies
Amazon Cognito user pools support several integrations with AWS services for extended customization functionalities. Those AWS services are regional services and must be configured independently in the replica Region, including:
AWS Lambda – Lambda triggers (for example, pre-authentication, pre-token generation, and others) are invoked in different authentication stages and should be deployed in the replica Region and attached to the replica user pool to match customized behaviors in the primary user pool. When deploying Lambda triggers, you can adopt the same logic for both primary and replica user pools and access to downstream resources or set up a different logic to characterize different behaviors when requests are served in the replica Region.
AWS WAF – WAF web access control lists (web ACLs) are associated to protect the user pool from unwanted requests. When accepting traffic to the replica user pool, create matching WAF web ACLs in the replica Region.
Amazon Simple Notification Service (Amazon SNS) – If you send text messages (for example, SMS-based multi-factor authentication (MFA), passwordless authentication, or SMS notifications), configure Amazon SNS in the replica Region. SNS requires additional set up (origination identities, spending limits) in each Region, and sender ID registration time depends on several factors.
Amazon Simple Email Service (Amazon SES) – If you use Amazon SES for email delivery, verify sending domains and email addresses in the replica Region and configure your replica user pool accordingly.
Amazon CloudWatch – If you export user activity logs from Amazon Cognito to a CloudWatch log group, or monitor service quotas in CloudWatch, configure alarms and analytics accordingly.
Use infrastructure-as-code tools like AWS CloudFormation or AWS Cloud Development Kit (AWS CDK) to maintain consistent configurations and deployments across Regions and environments. You should also monitor for any configuration drifts between assets.
Consider automatic domain failover
For authentication use cases that rely on managed login and OAuth 2.0 endpoints—including federated authentication and M2M authorization—Amazon Cognito supports automatic failover to the replica Region with an Amazon Route 53health check. Cognito uses the health status of Route 53 health check to control whether traffic routes to the primary or replica user pool. The health check can be set up to monitor the health of an endpoint, a CloudWatch alarm, or a calculated number of other health checks, so you determine what triggers a healthy or unhealthy state and can adjust traffic routing as needed.
Both the Amazon Cognito prefix domain (for example, auth.us-east-1.amazoncognito.com) and custom domain (for example, auth.example.com) support automatic domain failover. Your domain serves as the single entry point for the user pool OAuth 2.0 endpoints and directs traffic to the managed login pages. Cognito automatically fails over domain traffic to the replica Region when a Route 53 health check becomes unhealthy and fails back to the primary Region when the check is healthy. You don’t need to create another prefix domain in the replica user pool for failover use cases.
With the automatic failover capability, you can use a single domain to serve external IdP configurations, including redirect URIs and SAML assertion consumer URLs. For example, use https://auth.example.com/saml2/logout to send SAML 2.0 sign-out responses. Because the domain can serve traffic to both the primary and replica Regions and remains unchanged across Regions, your external IdP configurations stay consistent across Regions, and existing federated users continue to authenticate without disruption. This means that you can enable MRR without having to contact external IdP admins to update configurations; all existing configurations will continue to work.
For SDK-based authentication use cases without managed login, a custom domain isn’t strictly required. We recommend configuring a custom endpoint for SDK requests to simplify failover orchestration, so you don’t have to modify the Region parameter in the SDK configuration. Behind your custom endpoint, you can use the same Route 53 health check or a custom load balancing strategy to proxy API requests to primary or replica Region endpoints. You might also consider load balancing user authentication traffic, by referring to an X-Amz-Target HTTP header (for example, X-Amz-Target: AWSCognitoIdentityProviderService.InitiateAuth), to both the primary and replica Regions, while keeping user sign-up operations in the primary Region. If you use both managed login and SDK authentication in the same user pool, you can consider using the custom domain as the custom endpoint of the SDK for a streamlined operation, where Route 53 health check initiates failover and failback between the primary and replica Regions.
Plan for TOTP MFA alternatives
Time-Based One-Time Password (TOTP) MFA isn’t supported in replica user pools. Users configured to use TOTP MFA must authenticate through the primary Region. If your application relies on TOTP as a second factor, this limitation requires careful planning because you want to enable an alternative MFA for your users, such as SMS OTP, email OTP, or passkey.
Review quotas
When you activate a replica user pool, you gain a separate set of default quotas in the replica Region. Previously reserved higher quotas for your user pool in the primary Region aren’t carried over to the replica Region.
Data sovereignty
When selecting a replica Region for your user pool, consider your organization’s data sovereignty and residency requirements, as user identity data will be replicated to and stored in that Region. For guidance on navigating compliance, continuity, and control obligations that may influence your Region selection, see Practical digital sovereignty: Navigating the pillars of compliance, continuity, and control.
Reference architectures
In this section, we show you reference architectures for common authentication patterns using the Amazon Cognito MRR capability. Each architecture demonstrates how Cognito MRR works with different authentication use cases.
Managed login and federation
Amazon Cognito managed login provides a fully managed authentication UI that handles sign-in, sign-up, and federation flows. With MRR, managed login endpoints are served from the healthy user pool based on your Route 53 health check configuration. Managed login also includes OAuth 2.0 endpoints and can be used with local Cognito accounts and federated users. Figure 1 depicts a reference architecture for using managed login to authenticate Cognito users.
Figure 1: Cognito MRR reference architecture for managed login and federation use cases
When using Amazon Cognito with managed login, the process flow is:
The user visits the application and is redirected to the managed login to begin the authentication flow.
Managed login uses the Route 53 health check to control traffic routing.
If the health check returns a healthy status, all traffic to the managed login flows to the primary Region user pool for user authentication.
For a federated user, the primary Region user pool redirects the user to a federated IdP or social IdP for authentication. After successful authentication, Amazon Cognito creates or updates user attributes depending on whether it’s a new user signing in for first time or an existing user.
If the health check returns an unhealthy status, all traffic to the managed login flows to the replica Region user pool. Cognito users will authenticate against the replica user pool.
The replica Region user pool endpoint redirects federated users to external IdPs. However, any user creation or attribute update against replica user pool will fail until the health check returns healthy and traffic routes back to the primary Region.
M2M architecture
In an M2M architecture, services authenticate using the OAuth 2.0 client credentials grant. This flow doesn’t involve users; instead, backend services exchange client credentials for access tokens.
Figure 2: Cognito MRR reference architecture for machine-to-machine use case
The authentication flow is:
Application clients send a POST request to the Amazon Cognito /token endpoint with client credentials.
Managed login uses the Route 53 health check to determine whether traffic should flow to the primary or replica user pool.
If the health check returns a healthy status, traffic to the /token endpoint will flow to the primary Region user pool.
If the health check returns an unhealthy status, traffic to the /token endpoint will flow to the replica Region user pool. After the health check returns to a healthy status, traffic will return to routing to the primary user pool.
SDK-based architecture
For applications that use AWS SDK or Amazon Cognito APIs directly (rather than through managed login), the authentication flow is embedded in your application code. This gives you more control over the user experience but requires additional considerations for failover.
Figure 3: Cognito MRR reference architecture for SDK use cases
The process shown in Figure 3 is:
The user visits the application and signs in through a custom UI (using APIs or SDKs).
(Optional) An Amazon Route 53 health check is configured to perform a health check against regional proxy endpoints and determine traffic routing. You can also use a custom health check or your DNS resolver to make traffic routing determinations.
If the health check returns a healthy status, all traffic to the proxy endpoints will flow to the primary Region proxy for user authentication. You can also choose to load balance user authentication traffic across both the primary and backup Regions.
The primary Region Amazon API Gateway proxy forwards user requests to the Amazon Cognito regional endpoint.
If the health check returns an unhealthy status, all traffic will flow to the replica Region proxy.
The replica Region API Gateway proxy begins forwarding user requests to the Amazon Cognito regional endpoint until the health check returns to healthy status.
In an SDK-based architecture, Amazon Cognito regional endpoints can also be called directly. You can also set up custom routing to use replica Region endpoints to load balance user authentication requests by routing read-only requests to both the primary and replica Region endpoints while keeping write requests in the primary Region.
Failover strategies
Now that you’ve set up multi-Region replication with Amazon Cognito, the next step is to test and monitor your multi-Region configuration. In this section, we walk through strategies for monitoring your endpoints, determining when to trigger failover, and testing your failover readiness.
Monitor with Route 53 health checks
Failover for Managed Login and all OAuth 2.0 flows is driven by Amazon Route 53 health checks associated with your Amazon Cognito prefix or custom domain. You’re responsible for what determines the state of this health check. The health check isn’t tied to your DNS CNAME record but is the signal that tells Amazon Cognito whether to route traffic to the primary or replica Region for all managed login endpoints. When the health check fails, Amazon Cognito routes traffic to the replica user pool. When the health check recovers, traffic is restored to the primary user pool.
A practical approach to get started to build a health check:
Create a synthetic canary – Use Amazon CloudWatch Synthetics to run a canary that periodically exercises an actual authentication flow against your primary Region. For example, the canary can perform a client credentials token request against your Amazon Cognito domain’s /oauth2/token endpoint or execute a full AdminInitiateAuth API call with test credentials. This validates that the end-to-end authentication path is functional, not just that an endpoint is responding.
Tie the canary to a CloudWatch alarm – Configure a CloudWatch alarm on the canary’s SuccessPercentCloudWatch metric. Set a threshold that accounts for transient errors (for example, alarm when success drops below 90% for three consecutive evaluation periods).
Connect the alarm to your Route 53 health check (optional) – Create a Route 53 health check that monitors the CloudWatch alarm. When the alarm enters the ALARM state, the health check fails, and Amazon Cognito routes traffic to the replica user pool. If you prefer to rely on human intervention, skip this step and instead configure the CloudWatch alarm alert your operations team to manually invert the health check.
After you have your health check, associate it with your Amazon Cognito domain using the UpdateUserPoolDomain API or the Amazon Cognito console.
Authentication-only compared to full-stack failover
Before implementing failover, consider how your authentication layer relates to the rest of your application stack. There are two common patterns:
Authentication-only failover – Your application remains in a single Region, but authentication traffic fails over to the Amazon Cognito replica if only the primary Region’s authentication service is impaired. This works when your application can continue operating with tokens already issued (for example, cached JWTs, active sessions) and when downstream APIs don’t depend on the same Region as your user pool. Consider this option when the rest of your stack has its own availability model.
Full-stack failover – Your entire application—compute, data stores, APIs, and authentication—fails over to a replica Region. In this model, Amazon Cognito MRR is one component of a broader multi-Region architecture where authentication flows have tight dependencies on regional resources (such as Lambda triggers calling regional Amazon DynamoDB tables, or post-authentication logic writing to a regional event bus) that must be co-located with the user pool.
Use Amazon Application Recovery Controller (ARC) to coordinate failover across all components with a single action. ARC provides three capabilities that are particularly relevant for multi-Region authentication architectures:
Routing controls – Extremely reliable data plane controls that let you shift DNS traffic across Regions, with safety rules that prevent partial or unintended failovers (for example, preventing you from failing over authentication without also failing over the dependent API layer).
Readiness checks – Continuous monitoring of resource quotas, capacity, and network routing policies in your secondary Region, so you have confidence that the replica environment—including your Amazon Cognito replica user pool and its regional dependencies—can handle production traffic before you failover.
Region switch – Centralized, automated, and observable multi-Region recovery orchestration across multiple AWS accounts and resources, so you can execute a coordinated failover of your Cognito user pool alongside databases, compute, and APIs in a single recovery plan.
ARC is particularly valuable when your Amazon Cognito Lambda triggers, WAF rules, SNS and SES configurations, and downstream services all need to switch Regions in lockstep. Rather than managing failover for each component independently, you can use ARC to define a single recovery group that treats your authentication stack and application stack as one unit. To learn more about the capabilities and use cases of ARC, see Introducing Amazon Route 53 Application Recovery Controller.
The right choice depends on your recovery scope. Map the dependencies in your authentication flow: if your Lambda triggers call regional DynamoDB tables or your post-authentication logic writes to a regional event bus, those tight couplings point to full-stack failover. If your application validates tokens independently and doesn’t make real-time calls back to Amazon Cognito after token issuance, authentication-only failover keeps both your blast radius and operational overhead smaller.
Determine when to failover
Triggering failover too aggressively risks unnecessary disruptions; too conservatively risks a drop in desired availability. Here are the factors to balance:
Monitor authentication flow health – Validate that critical flows are functioning, including managed login endpoint availability and token endpoint responses.
Use composite health checks – Combine multiple signals. For example, require both the managed login and token endpoints to be healthy.
Set appropriate thresholds – Configure failure thresholds (for example, three consecutive failures) to distinguish transient errors from genuine impairments.
Consider downstream dependencies – Factor in Lambda triggers, external IdPs, and other regional services.
Client side retry logic – For SDK-based single-page application (SPA) architectures, consider implementing client-side retry logic with Region failover. When the primary Region is unavailable, your application should detect the failure and redirect authentication of API calls to the replica Region’s Amazon Cognito endpoint.
Understanding and determining the recovery time objective (RTO) and recovery point objective (RPO) should also be the key factor in determining when and why to failover. See the Establishing RPO and RTO Targets for Cloud Applications blog post to learn more.
Test failover readiness
If using Route 53 health check, start by manually inverting your Route 53 health check during a maintenance window. In the Route 53 console, enable Invert health check status to force the health check into a failed state; this triggers failover to the replica Region without requiring any infrastructure changes. While traffic is routing to the replica Region, validate that your critical authentication flows (sign-in, token refresh, federation) work correctly, then disable the inversion to restore traffic to the primary. This test confirms your end-to-end failover path is functional.
When you’re confident in the basic failover path, graduate to more realistic failure simulations with AWS Fault Injection Service (FIS). Create FIS experiment templates that disrupt your primary Region’s Amazon Cognito dependencies; for example, block network access to a dependent resource or inject latency into downstream API calls. Use FIS stop conditions (guardrails) to automatically halt experiments if unexpected impacts are detected. These experiments validate not just that failover triggers correctly, but that your replica Region handles real authentication load under degraded conditions.
We recommend conducting failover tests on a predefined and regular cadence and after any significant changes to your authentication architecture. Document your runbooks and make sure your operations team is familiar with both the failover and recovery procedures.
Conclusion
In this post, we built on the foundational knowledge of the Amazon Cognito MRR capability and showed you how to architect resilient authentication for real-world use cases:
This post was co-written with Ankit Aggarwal and Raja Kalluri from United Airlines.
United Airlines processes billions of events daily across its data platform, which spans Amazon Redshift and Databricks with Unity Catalog. To bridge these platforms without duplicating data, the team turned to AWS Glue Data Catalog federation.
In this post, we walk through how to configure AWS Glue Data Catalog federation to connect with Databricks Unity Catalog, so you can run live SQL queries from Amazon Redshift without moving or duplicating data.
Why United Airlines needed catalog federation
United Airlines curates petabytes of data through a medallion architecture (bronze to silver to gold) on Amazon Simple Storage Service (Amazon S3). The airline user interaction data layer alone is several double-digit terabytes of near real-time streamed data. Teams use it to measure customer engagement patterns, feature adoption, and conversion behavior across web and mobile touchpoints. Analysts need to query this curated data through Amazon Redshift Serverless. As part of the existing data platform architecture these data tables are cataloged in Databricks Unity Catalog, not in the AWS Glue Data Catalog. As a result, Amazon Redshift has no native visibility into them. Without catalog federation, the only way to make this data queryable from Amazon Redshift would have been to duplicate it into Amazon Redshift Managed Storage (RMS) and build pipelines to keep it in sync.
AWS Glue Data Catalog federation removed this need. Amazon Redshift users now query the gold layer stored in Amazon S3 directly, with Iceberg metadata resolved from Unity Catalog at query time and no data movement. AWS Glue Data Catalog federation connects Amazon Redshift to external catalogs like Unity Catalog, so analysts query cross-platform data without building sync pipelines or duplicating storage.
Amazon Redshift Serverless is powered by the same Graviton-based query engine used in the new RG instance family, which delivers up to 2x faster data lake query performance compared to prior generations. This engine is purpose-built for reading Apache Iceberg tables directly from Amazon S3, making it well-suited for such federated query workloads.
United Airlines is taking a phased approach to adopting AWS Glue Data Catalog federation across its data platform. The initial focus is the most heavily used user interaction data tables, with 30 tables currently federated in production and 70 more in active rollout. Several hundred additional tables across different business domains are planned for production in the coming months.
Solution overview
AWS Glue Data Catalog federation bridges these platforms at the metadata layer. Here’s how the architecture works.
The architecture follows a four-layer federation chain:
Databricks Unity Catalog exposes tables through its Iceberg REST API endpoint. For Delta tables, you can turn on UniForm format to make them Iceberg compatible.
AWS Glue Data Catalog creates a federated catalog that connects to Databricks Unity Catalog, making metadata visible within AWS without data movement.
A resource link database in the default AWS Glue catalog acts as a bridge, pointing to the federated catalog database. This is required for Amazon Redshift compute.
Amazon Redshift Serverless references the resource link database through an external schema. When a query runs, Amazon Redshift traverses the link, calls AWS Glue Federation, and reads the Iceberg data through the Databricks Unity Catalog REST API. AWS Lake Formation governs permissions throughout this chain.
Key services or service features used in this solution:
Federation chain from Databricks Unity Catalog through AWS Glue and Lake Formation to Amazon Redshift Serverless
Figure 1: Federation chain from Databricks Unity Catalog to Amazon Redshift Serverless through AWS Glue and Lake Formation
The architecture follows a six-step flow:
A SQL analyst submits a query to Amazon Redshift Serverless.
Amazon Redshift resolves the external schema through the AWS Glue Data Catalog (resource link to federated catalog).
The AWS Glue federated catalog calls the Databricks Unity Catalog Iceberg REST API to retrieve current table metadata.
The namespace IAM role calls AWS Lake Formation GetDataAccess to obtain scoped, temporary S3 credentials.
Lake Formation evaluates fine-grained access policies and vends credentials for the authorized data files.
Amazon Redshift Serverless reads the Iceberg data files directly from S3 and returns results to the analyst.
Prerequisites
Before you begin, make sure the following are in place:
A Databricks workspace with Unity Catalog enabled and at least one catalog, schema, and table. Databricks uses UniForm to generate Iceberg metadata on Delta Lake tables on Amazon S3.
An AWS account with permissions to manage AWS Glue, AWS Lake Formation, Amazon Redshift Serverless, and IAM.
An Amazon Redshift Serverless workgroup and namespace already provisioned.
AWS Lake Formation set up with a data lake administrator.
AWS Command Line Interface (AWS CLI) configured with appropriate credentials.
Familiarity with Amazon Redshift Query Editor v2 or a SQL client.
The walkthrough is organized into six steps covering Lake Formation configuration, the resource link pattern, IAM role setup, and querying Databricks tables from Amazon Redshift.
Step 1: Configure AWS Lake Formation
1a. Add a data lake administrator
In Lake Formation, choose Administration, then choose Administrators and add your admin IAM user or role.
1b. Confirm the federated catalog is registered
Choose Data Catalog, then Catalogs and verify that databricks-federated-catalog is visible and registered.
Step 2: Create a resource link in the default AWS Glue catalog
This step is the key architectural detail in the walkthrough. Amazon Redshift resolves CREATE EXTERNAL SCHEMA only against the default AWS Glue Data Catalog. The federated catalog (databricks-federated-catalog) is a separate, non-default catalog object. To give Amazon Redshift a path to the federated data, you create a resource link database in the default catalog that points to the federated catalog’s database.
A resource link does not copy data or metadata. It’s a pointer that Lake Formation resolves at query time.
To create the resource link in the Lake Formation console:
Choose Data Catalog, Databases, Create database. Then select Resource link.
For Resource link name, enter databricks_federated_db_link.
For Target catalog, enter databricks-federated-catalog.
For Target database, enter the database name that was discovered by the AWS Glue crawler (for example, databricks_federated_db).
Step 3: Configure the Amazon Redshift Serverless namespace IAM role
When Amazon Redshift queries through the resource link, it uses the IAM role attached to the Amazon Redshift Serverless namespace to call the Lake Formation GetDataAccess API. Lake Formation permissions must be granted to this namespace role.
Choose one of these two approaches:
Option A – Update your existing namespace role by adding the following policy inline.
Option B – Create a new dedicated role (named RedshiftServerlessNamespaceRole) and attach it to the namespace alongside existing roles.
Note: The Resource: “*” in this policy is shown for simplicity. In production, scope resources to specific AWS Glue catalog ARNs, database ARNs, and table ARNs based on your use case.*
After creating or updating the role, associate it with your Amazon Redshift Serverless namespace:
In the Amazon Redshift Serverless console, choose Namespaces, select [your namespace], then choose Security and encryption, then Manage IAM roles.
If you use Option A, the existing role already has the new permissions, so no change is needed.
If you use Option B, add the new role alongside the existing roles.
Step 4: Grant Lake Formation permissions to the Amazon Redshift namespace role
4a. Grant DESCRIBE on the resource link database (default catalog)
In Lake Formation, choose Permissions,Data lake permissions, then Grant.
Principal: RedshiftServerlessNamespaceRole.
Resources: Named Data Catalog resources,Default catalog,databricks_federated_db_link (resouce link).
Database permissions: DESCRIBE.
4b. Grant SELECT and DESCRIBE on the target tables (Grant on Target)
Resource links permit only DESCRIBE and DROP permissions on the link itself. To allow Amazon Redshift to actually read data, you must separately grant SELECT on the target tables in the federated catalog. This is the Lake Formation Grant on Target pattern.
Principal: RedshiftServerlessNamespaceRole.
Resources: Named Data Catalog resources,databricks-federated-catalog,databricks_federated_db, then Tables.
Table permissions: SELECT, DESCRIBE.
Catalog permission: DESCRIBE.
Important: SELECT must be granted on the TARGET tables in the federated catalog, not on the resource link. Granting SELECT only on the resource link won’t work. This is a common configuration error.
Step 5: Create an external schema in Amazon Redshift
With the resource link in place and permissions granted, you can now create an external schema in Amazon Redshift that points to the resource link database. The external schema is the query interface. When a user runs SQL against it, Amazon Redshift traverses the link to the federated catalog and retrieves metadata and data from Databricks Unity Catalog.
The DATABASE parameter must reference the resource link database name in the default AWS Glue catalog (databricks_federated_db_link), not the federated catalog name directly. The CATALOG_ARN parameter isn’t required here because the resource link lives in the default catalog and Amazon Redshift resolves it automatically.
Connect to your Amazon Redshift cluster as a superuser (for example, using Amazon Redshift Query Editor v2) and run:
CREATE EXTERNAL SCHEMA databricks_schema
FROM DATA CATALOG
DATABASE 'databricks_federated_db_link'
IAM_ROLE '<iam-role-arn>'
REGION '<region>';
A key design principle in this architecture is the clear separation between data physically stored in Amazon Redshift and data accessed externally through federation. External schemas provide a transparent abstraction layer, so Amazon Redshift users can query data stored in S3 without ingestion. For consistency and clarity, United Airlines follows a standard naming convention for all federated schemas in Amazon Redshift: {domain}_iceberg. This convention makes it immediately clear that the data isn’t natively stored within Amazon Redshift but is accessed by using federation through AWS Glue and Lake Formation. This distinction is critical for analysts and engineers, because it improves discoverability, avoids ambiguity between storage layers, and reinforces architectural discipline when working across hybrid data environments.
The User Interactions domain exposes curated datasets representing customer interaction activity, engagement behavior, and channel usage patterns. Operational datasets follow the same pattern, providing governed access to supporting business events and reference information through a common federation framework.
You create a view layer over each external schema using WITH NO SCHEMA BINDING, so that analysts always resolve the freshest schema on each query execution. For example:
CREATE VIEW analytics.clickstream_events AS
SELECT * FROM {domain}_iceberg.interaction_events
WITH NO SCHEMA BINDING;
Step 6: Verify and query Databricks tables from Amazon Redshift
After creating the external schema, verify that the Databricks tables are visible and run a test query.
Verify table visibility
-- Confirm federated tables are visible in Redshift
SELECT * FROM SVV_EXTERNAL_TABLES
WHERE schemaname = 'databricks_schema';
Query a Databricks Unity Catalog table
-- Query a Databricks Unity Catalog table via the federated catalog
SELECT *
FROM databricks_schema.<table_name>
LIMIT 10;
When a query runs, Amazon Redshift calls Lake Formation GetDataAccess using the namespace IAM role to obtain temporary credentials. It then contacts the AWS Glue federated catalog, which in turn calls the Databricks Unity Catalog Iceberg REST API to retrieve metadata and read table data. The result is returned to the Amazon Redshift user transparently.
For SAML-authenticated users, connect using your IdP JDBC plugin:
The Amazon Redshift JDBC driver handles authentication automatically. It authenticates with your IdP, receives a SAML assertion, and calls sts:AssumeRoleWithSAML for temporary IAM credentials. It then calls redshift-serverless:GetCredentials to connect as the mapped database user.
Business impact
AWS Glue Data Catalog federation delivered measurable architectural and operational improvements for United Airlines:
Area
Before
After
Impact
Data access
Delta Lake and Amazon Redshift data were completely siloed, so Amazon Redshift users had no access to curated datasets on Databricks-managed S3 data
Amazon Redshift users get real-time access to Databricks-managed data through AWS Glue Data Catalog federation
~100 analysts gained access to user interaction data tables in the first phase without adding new pipelines.
Disaster recovery
Cross-Region DR relied on Amazon Redshift snapshots every 3 hours (recovery point objective, or RPO, of 3 hours or more)
Amazon S3 cross-Region replication on the Delta Lake provides a near-continuous RPO. A new Amazon Redshift Serverless workgroup in the DR Region can federate to the same S3 data
More resilient architecture. Reduces cost for Amazon Redshift snapshot and copy maintenance across Regions
Architecture simplification
Data processing happened in both Databricks and Amazon Redshift, requiring manual catalog synchronization between the two platforms which was operationally expensive and prone to drift
With the federated architecture, data processing is consolidated in Databricks, and Amazon Redshift acts solely as a query engine powering user queries and dashboards through catalog federation
Single processing platform, zero sync pipelines, single source of truth
Infrastructure cost
Running dedicated Amazon Redshift ETL cluster with RMS storage, snapshots, and compute for data processing
For this use case with federation, Amazon Redshift is not needed for ETL but only as a query engine. No RMS storage duplication, no snapshot replication required
~$30K/month in redundant ETL infrastructure cost reduced
Security considerations
At United Airlines, identity governance is unified through Azure Active Directory groups. On the AWS consumption side, users authenticate to Amazon Redshift Serverless through SAML federation. AD group membership determines database-level access to federated schemas. On the Databricks side, the same AD groups govern access to Unity Catalog schemas. This single-identity model provides consistent access control across both platforms without requiring separate user provisioning. Lake Formation handles credential vending for S3 data access during federated queries, while schema-level access decisions are managed through the AD group mappings on each platform.
The architecture also provides multiple layers of security controls built into the federation chain:
AWS Lake Formation governs fine-grained access control throughout the federation chain, so that principals can only access authorized databases, tables, and columns.
IAM roles follow least-privilege principles. The Amazon Redshift namespace role is scoped only to AWS Glue metadata operations and Lake Formation GetDataAccess.
SAML-based authentication integrates enterprise identity providers, so that users authenticate through existing SSO infrastructure before accessing federated data.
All Amazon Redshift connections enforce TLS encryption (ssl=true), protecting data in transit between clients and the Amazon Redshift endpoint.
Lake Formation permission vending issues short-lived, scoped credentials for each query execution rather than long-lived static credentials.
Delta Lake tables must have UniForm enabled to expose Iceberg-compatible metadata.
We recommend that source tables be well-partitioned and regularly compacted, because the federated query performance reflects how efficiently the data is organized at write time.
Clean up
To avoid ongoing charges for resources created in this walkthrough, remove them in the following order. This teardown doesn’t affect Databricks metadata or your underlying data stored in Amazon S3.
Drop the external schema in Amazon Redshift: DROP SCHEMA databricks_schema;.
Delete the resource link database in the default AWS Glue catalog (databricks_federated_db_link).
Revoke Lake Formation permissions granted to the Amazon Redshift namespace role on both the resource link database and the target tables in the federated catalog.
Delete the federated catalog in AWS Glue (databricks-federated-catalog).
Deregister the AWS Glue connection for the Databricks Unity Catalog if no longer needed.
Optionally, remove the IAM role (RedshiftServerlessNamespaceRole) if it was created solely for this walkthrough.
Conclusion
In this post, we showed how United Airlines uses AWS Glue Data Catalog federation to give Amazon Redshift Serverless analysts real-time access to double-digit terabytes of curated user interaction data on Amazon S3, without duplicating a single byte or building sync pipelines.
The architecture uses the Iceberg REST API, resource link databases, and Lake Formation credential vending to create a governed query path between Amazon Redshift and Unity Catalog. For United Airlines, this eliminated redundant ETL infrastructure costs, removed the need for catalog synchronization, and turned Amazon Redshift Serverless into a dedicated high-performance query engine for analysts and dashboards.
For questions or feedback, leave a comment on this post.
Customers have been using Amazon Kinesis Data Streams to stream data at any scale. Some use On-demand Standard to let the service manage capacity, while others with predictable traffic patterns use On-demand Advantage and warm throughput to ensure streams can handle instant throughput increases. Streaming workloads rarely run at peak volume all the time: flash sales end, batch migrations complete, and telemetry bursts subside. However, manual intervention is often required to scale back down after the burst subsides. Amazon Kinesis Data Streams now supports scaling down ingest capacity for on-demand Advantage streams with warm throughput, which optimizes downstream compute costs and performance by removing excess capacity. You configure this by turning on On-demand Advantage mode (ODA) and setting a new warm throughput value that is equal to or smaller than the existing amount.
With this launch, you can now proactively reduce write throughput capacity, optimizing costs while maintaining performance and giving you more control over your stream’s provisioning.
In this post, we explore the warm throughput scale-down capability. We cover the challenge it addresses, how it works, how to monitor stream behavior with Amazon CloudWatch metrics, and best practices for using it effectively.
The challenge: Excess capacity after traffic spikes
Amazon Kinesis Data Streams on-demand mode automatically scales to handle increases in data throughput. When your stream experiences a traffic spike, Kinesis Data Streams splits shards to accommodate the higher volume. This automatic scaling helps your applications keep pace with data during surges.
However, many real-world workloads experience transient bursts that don’t represent sustained throughput needs. Consider a retail platform that processes a flash sale event, a healthcare system that ingests a large batch of patient records during a migration window, or an Internet of Things (IoT) fleet that transmits a high-volume firmware update telemetry burst. In each scenario, the stream scales up to accommodate the spike, but the elevated capacity remains long after the burst has subsided. Although Kinesis on-demand Advantage doesn’t charge for the elevated capacity, your consuming applications may see a higher cost and lower performance.
Consider a Kinesis data stream running with 100 MB/s ingest throughput that requires 100 shards. A traffic spike of an additional 50 MB/s forces on-demand mode to scale streams to 150 shards. The spike subsides within minutes, but those 150 shards remain.
If your AWS Lambda consumer uses a parallelization factor of 2, you go from 200 concurrent invocations (2 × 100 shards) to 300 (2 × 150 shards). This is a 50 percent jump in concurrent Lambda execution, even though ingest throughput has returned to 100 MB/s. Those extra 100 AWS Lambda invocations consume compute, count against your concurrent execution quota, and add cost while processing data with small batch sizes.
Kinesis Client Library (KCL) consumers incur operational overhead. KCL tracks one lease per shard in Amazon DynamoDB, so 50 additional shards mean 50 more leases to scan, renew, and checkpoint every heartbeat cycle. The result is more Amazon DynamoDB overhead for lease management and reduced consumption performance overall.
Before this launch, you had limited options to address this excess capacity:
Switch to provisioned mode to manually set shard count, losing the benefits of automatic scaling.
Accept the higher capacity and associated costs until the stream self-adjusted.
These approaches either introduced operational overhead or resulted in paying for capacity that exceeded your workload’s actual requirements.
The solution: Warm throughput scale-down
With on-demand capacity reduction, you can now set a lower or equal warm throughput value on your on-demand stream to trigger a capacity reduction. The stream adjusts to the requested capacity or the amount needed to support peak data ingest usage within the last hour, whichever is higher. This safeguard helps your stream retain sufficient capacity for current traffic while releasing the excess you no longer need.
This capability is available at no additional cost for all on-demand streams that have On-demand Advantage mode turned on.
How it works
Warm throughput provides bidirectional capacity management for on-demand streams:
Scale up (existing capability): If you forecast an upcoming traffic event, you can configure warm throughput to a higher value to prepare the stream in advance so that capacity is available when data arrives without throttling.
Scale down (new capability): If a transient burst has caused the stream to scale significantly beyond its steady-state needs, you can trigger a scale-down by setting warm throughput to a lower value.
When you set a warm throughput value that is equal to or lower than the current value on an on-demand stream, Kinesis Data Streams evaluates the request against your stream’s recent traffic. The resulting capacity is the greater of:
The warm throughput value you requested.
The capacity needed to support peak data ingest usage within the last hour.
This mechanism prevents you from accidentally reducing capacity below what your current workload demands. If data traffic increases after a scale-down has completed, on-demand mode can still expand stream ingest capacity through reactive scaling to avoid rate limiting.
Getting started
Prerequisites
To follow along, you need the following:
An existing Kinesis data stream in on-demand mode.
On-demand Advantage mode turned on.
AWS Command Line Interface (AWS CLI) installed and configured.
AWS Identity and Access Management (IAM) permissions for kinesis:UpdateStreamMode.
To trigger a scale-down, set a lower warm throughput value on your on-demand stream using the AWS CLI:
To observe the effects of a scale-down operation and understand your stream’s capacity and shard count, Amazon CloudWatch provides several key metrics. Monitoring these metrics helps you make informed decisions about when and how much to scale down.
Key metrics to monitor
The following table summarizes the CloudWatch metrics most relevant to warm throughput scale-down:
Metric
Namespace
Description
IncomingBytes
AWS/Kinesis
Total bytes ingested per period. Use the Sum statistic to see aggregate throughput across all shards.
IncomingRecords
AWS/Kinesis
Total records ingested per period. Helps identify traffic patterns and burst frequency.
WriteProvisionedThroughputExceeded
AWS/Kinesis
Number of records rejected because of throttling. A non-zero value after scale-down indicates capacity is set too low.
Observing shard count behavior during scale-down
To track shard count changes resulting from a scale-down, use the DescribeStreamSummary API, which returns the OpenShardCount field in its response. Note that OpenShardCount is not a CloudWatch metric. It’s available through the API and is also displayed on the Kinesis Data Streams console. You can poll this value periodically or build a custom CloudWatch metric using an AWS Lambda function to track shard count over time.
Here is how you can expect the stream to behave:
Before the burst: Your stream operates at steady-state with a baseline shard count appropriate for your normal traffic. For example, a stream handling 20 MiB/s of write throughput might have approximately 67 open shards.
During the burst: As traffic spikes, Kinesis Data Streams automatically splits shards to accommodate the increased load. The OpenShardCount rises, and IncomingBytes increases correspondingly.
After the burst (before scale-down): Traffic returns to baseline, but the OpenShardCount remains elevated because the stream retains capacity for up to double the recently observed peak.
After triggering scale-down: After you set a lower warm throughput, the OpenShardCount decreases as Kinesis Data Streams merges shards to match the requested capacity (subject to the one-hour peak safeguard). You can observe this transition by polling DescribeStreamSummary or on the Kinesis console.
Figure 1: Amazon Kinesis Data Streams shard count over time during a scale-down event, showing the incoming-data spike and the resulting change in shard count
Best practices
When using warm throughput scale-down, consider the following recommendations:
Analyze traffic patterns before scaling down. Review at least 24 hours of IncomingBytes and IncomingRecords CloudWatch metrics to understand your baseline throughput before setting a lower warm throughput value. This helps you avoid setting capacity below your actual steady-state needs.
Set warm throughput above your observed steady-state peak. Because on-demand streams accommodate up to double the observed peak, set your target warm throughput at or above your typical peak rather than your average. This maintains headroom for normal traffic variability without throttling.
Monitor throttling after scale-down. Watch WriteProvisionedThroughputExceeded closely in the hours following a scale-down. If throttling occurs, increase the warm throughput value. The stream will automatically scale back up, but proactive monitoring reduces the duration of any impact.
Use scale-down after known transient events. The feature is most effective when you can identify that a traffic spike was temporary, for example, after a planned batch migration, marketing event, or scheduled data backfill. Avoid scaling down during periods of uncertain or growing traffic.
Use the one-hour safeguard. The system won’t reduce capacity below what’s needed to serve peak ingest from the last hour. If you’re unsure about the right target, you can set a low warm throughput value and rely on this safeguard to prevent under-provisioning for active traffic.
Conclusion
Amazon Kinesis Data Streams now supports scaling down ingest capacity with warm throughput, giving you elastic control over On-demand Advantage stream capacity. With this capability, you can release excess capacity after transient traffic bursts, improving cost efficiency while maintaining the automatic scaling benefits of on-demand mode.
To get started, turn on On-demand Advantage mode for your stream and use the warm throughput setting to manage capacity. Track shard count with DescribeStreamSummary to observe capacity changes and confirm your stream keeps appropriate headroom for your workload. Try warm throughput scale-down today in the Amazon Kinesis console, and to learn more, see Amazon Kinesis Data Streams on-demand capacity mode in the Developer Guide.
Authors: Hyunsoo Kim, Chloe Kwak Learning level: 300 – Advanced Post type: Best Practices
Every inventory manager faces the same question each morning: How much should I order today? The answer depends on dozens of variables (sales history, upcoming promotions, pricing changes, day-of-week seasonality, supplier lead times) and the cost of getting it wrong is asymmetric. Over-order and you carry capital in slow-moving stock. Under-order and you lose revenue, damage customer trust, and scramble for emergency replenishment.
The case for zero-shot forecasting
Classical time-series methods (ARIMA, Holt-Winters, seasonal decomposition) require per-SKU model fitting. A retailer with 10,000 SKUs must train, validate, and maintain 10,000 separate models. Each requires its own hyperparameter tuning, retraining schedule, and cold-start problem for new products. The operational burden scales linearly with catalog size, and the engineering team spends more time managing infrastructure than improving forecast quality.
Gradient boosting and deep learning approaches (LightGBM, DeepAR, Temporal Fusion Transformer) improve accuracy but compound the operational complexity: feature engineering pipelines, training jobs, model registries, A/B testing infrastructure. For many organizations, the time from “we want better forecasts” to “forecasts are running in production” often takes a full quarter or more.
From manual rules to automated decisions
Even with a reliable forecast, converting a demand signal into a purchase order requires applying business rules: safety stock buffers, minimum order quantities, budget constraints, promotional lift adjustments. These rules are typically encoded in spreadsheets or institutional knowledge, applied inconsistently across buyers, and nearly impossible to audit or explain at scale.
The architecture this post builds
This post describes how to combine two complementary capabilities to address both problems simultaneously:
Amazon Chronos2: A time-series foundation model that performs zero-shot forecasting, returning probabilistic demand predictions without per-product training.
Multi-agent orchestration with the Strands Agents SDK and Amazon Bedrock AgentCore: A system of four LLM agents that coordinate deterministic tools, converting raw forecasts into validated purchase orders with full auditability.
The result is an end-to-end inventory automation pipeline where adding a new product requires zero ML model training, adding a new business rule requires changing one tool, and each decision is auditable, observable, and recoverable from failure. In internal testing across 50 SKUs over a 4-week horizon, this architecture achieved a median weighted absolute percentage error (WAPE) of 12.3% (P50 forecast compared to actuals), reduced per-SKU onboarding time from 2–3 weeks of model training to under 5 minutes of CSV upload, and cut monthly inference cost from ~$1,091 (always-on GPU) to ~$15 (Serverless) — a 98% reduction. End-to-end pipeline latency averaged 8 seconds per SKU excluding cold start.
Solution overview
This section describes the end-to-end system architecture, explains why Chronos2 is well suited for inventory forecasting, and outlines the benefits of a multi-agent design over a monolithic approach.
End-to-end architecture
The system is organized into three logical layers:
Figure 1. Solution architecture — Amazon Bedrock AgentCore orchestrates four LLM agents (Strands Agents SDK) that invoke deterministic tools against Amazon S3 and Amazon SageMaker Serverless Inference.
Data layer. Amazon Simple Storage Service (Amazon S3) serves as the single source of truth. A single CSV per product encodes both historical sales and future covariate values. Business rules (lead times, safety stock, warehouse capacity, minimum order quantities) live in a separate JSON config. Adding a new product requires only uploading these two files, with no changes to code.
Inference layer. Amazon SageMaker Serverless Inference hosts the Chronos2 endpoint for zero-shot time-series forecasting. This is the only external model inference call in the pipeline — the LLM reasoning runs through Amazon Bedrock within the orchestration layer.
Orchestration layer. Four LLM agents — Supervisor, Preprocessing, Forecasting, and Reporting — are built with the Strands Agents SDK and deployed on Amazon Bedrock AgentCore. Each agent uses Claude on Amazon Bedrock for reasoning and calls deterministic tools to execute the computational work.
Amazon Bedrock AgentCore is a fully managed platform to build, deploy, and optimize agents at scale, with any framework or model. The orchestration layer runs on AgentCore, which provides six sub-services: Runtime, Gateway, Policy, Memory, Observability, and Evaluations. This system uses each of the six, but each for a specific, single purpose. The architecture deep dive section maps each service to the production concern it addresses in this design — including why the Gateway surface is deliberately small (one tool out of eight).
Why Chronos2: zero-shot, covariates, what-if
Chronos2 is an encoder-only transformer that closely follows the T5 encoder design, pre-trained on a large and diverse corpus of real-world time series. The model generates multi-step probabilistic forecasts using in-context learning and a group attention mechanism — no fine-tuning on your data required.
Three properties make it the right choice for inventory forecasting at scale:
Zero-shot generalization: A new SKU requires no training job. Historical sales window in, probabilistic forecast out — including for products with sparse or short histories.
Covariate support: Chronos2 accepts past-only covariates (historical features known only for past periods) and known covariates (features whose future values are given for the forecast horizon, such as a scheduled promotion or price change). In the Python API these are passed via the context_df and future_df dataframes to pipeline.predict_df(). Covariates transform the model from a univariate forecaster into a conditional one.
What-if scenario analysis: Because covariates are explicit inputs, you can generate multiple forecasts — with a promotion and without one, at the current price and at a discounted price — and compare them before committing to an order.
Chronos2 is well-suited for this workload because it satisfies all three requirements simultaneously: zero-shot inference (no per-SKU training), explicit support for both past-only and future covariates via the predict_df() API, and a one-click deployment path to Amazon SageMaker Serverless Inference. This combination means that onboarding a new product requires only data — no pipeline changes, no model registry entries, no retraining schedule. The evaluator framework introduced in the architecture deep dive makes it straightforward to benchmark any alternative forecasting model on the same traces without rebuilding the pipeline.
Why multi-agent over monolithic
A single LLM prompt that performs all reasoning steps — data loading, covariate selection, forecast interpretation, order calculation, validation, and result saving — would exceed practical context window limits for large catalogs, be impossible to unit test at the component level, and fail catastrophically when any single step encounters an error.
An agent-per-reasoning-responsibility architecture solves each of these problems directly. Critically, this architecture makes a firm distinction: LLM agents handle judgment. Deterministic tools handle computation. Bedrock inference happens in exactly four places: the four agents. The operations they coordinate (loading files, running the replenishment formula, generating charts, writing to S3) run as plain Python functions that the agents call as @tools. The agent determines when to call each tool and with what arguments: the tool itself contains no LLM inference. This separation keeps per-run LLM cost bounded and reasoning quality high by ensuring each agent’s context window carries only what it needs to reason about, not the raw byproducts of every tool call.
Prerequisites
Four things need to be in place before deploying this architecture. Other components (the S3 bucket, IAM roles, folder layout, and the agent runtime package) are provisioned by the CDK stack and deploy scripts described in the following sections.
AWS account with Amazon Bedrock, Amazon SageMaker, and Amazon S3 access in the same AWS Region (the following examples assume us-east-1).
Amazon Bedrock model access for Claude Sonnet 4.5 (Anthropic), enabled in the Bedrock console under Model access → Manage model access. For model availability by Region, refer to Supported models by AWS Region in Amazon Bedrock .
Chronos2 endpoint deployed on Amazon SageMaker Serverless Inference. The deployment procedure uses a single SageMaker Serverless endpoint configuration with the Chronos2 model package.
Python 3.10+ and Node.js 20+ on the local machine. Install the SDKs and CLIs:
Rows where sales are null define the forecast horizon. Covariates are fully populated for both historical and future periods. This design makes the distinction between past and future a data concern, not a code concern — the Preprocessing Agent reads the same schema regardless of forecast horizon length. When the operations team knows a promotion is planned next week, they fill in the promotion column for those future rows and re-upload the file.
Product-level business rules live in a separate JSON config:
By treating business rules as data rather than code, adjusting a supplier’s lead time or safety stock threshold requires only a config update in S3 — no deployment.
The four LLM agents and their tools
The central design principle: use an LLM agent where the output depends on interpretation or context. Use a deterministic tool where the output is fully determined by the input.
Supervisor agent
The Supervisor is the entry point for every user request. Its responsibility is pure orchestration: parse the user’s intent in natural language, construct the execution plan, route work to the three specialist agents in sequence, and handle conditional branching based on their outputs.
When a user sends “Run the weekly replenishment forecast for wireless earbuds — there’s a promotion this weekend,” the Supervisor:
Identifies the product scope and resolves “wireless earbuds” to its SKU.
Notes the promotional context and passes it explicitly to the Preprocessing Agent.
Constructs the sequential execution plan.
Monitors agent outputs and triggers the conditional retry loop if validation fails.
This requires genuine LLM reasoning. The Supervisor is not a router with a hardcoded lookup table — it interprets ambiguous instructions, surfaces missing parameters as clarifying questions, and makes branching decisions based on downstream agent outputs.
The Supervisor does not call data or computation tools directly. Its only job is to reason about the workflow.
In production, Amazon Bedrock Guardrails protects each agent’s LLM reasoning steps as a mandatory control, not an optional add-on. The Supervisor agent — which interprets natural-language requests and makes branching decisions that ultimately determine order quantities — runs behind a Guardrails configuration that enforces content filtering, denied topic policies, and grounding validation against the structured tool outputs. This prevents the Supervisor from hallucinating constraint overrides or generating purchase decisions outside its authorized scope. For implementation details, refer to Amazon Bedrock Guardrails.
Preprocessing agent
The Preprocessing Agent loads raw data via deterministic tools and then applies LLM reasoning to decide how to prepare it for Chronos2.
import json
import boto3
from strands import Agent, tool
from strands.models import BedrockModel

@tool
def load_sales_from_s3(product_id: str) -> dict:
    """Load sales time-series CSV from S3 for the given product ID."""
    response = s3.get_object(Bucket=BUCKET, Key=f"sales/{product_id}.csv")
    return parse_csv(response["Body"].read())

@tool
def load_inventory_from_s3() -> dict:
    """Load current inventory levels for all products from S3."""
    response = s3.get_object(Bucket=BUCKET, Key="inventory/current_stock.json")
    return json.loads(response["Body"].read())

@tool
def load_product_config_from_s3(product_id: str) -> dict:
    """Load business rules (lead time, safety stock, capacity) for a product."""
    response = s3.get_object(Bucket=BUCKET, Key="config/product_config.json")
    return json.loads(response["Body"].read())[product_id]

preprocessing_agent = Agent(
    model=BedrockModel(model_id="us.anthropic.claude-sonnet-4-5-20250929-v1:0"),
    tools=[load_sales_from_s3, load_inventory_from_s3, load_product_config_from_s3],
    system_prompt=(
        "You are a data preprocessing specialist. Load the required data, "
        "then decide which covariates to include in the Chronos2 input based on "
        "data quality and the business context provided by the Supervisor. "
        "Return a structured Chronos2 payload as JSON."
    )
)
The three load_* functions are plain Python — without LLM inference. The Preprocessing Agent’s LLM reasoning kicks in after the data is loaded, when it must decide which covariates to include. The Supervisor passes the user’s natural-language request (for example, “there’s a promotion this weekend”) down to the Preprocessing Agent as part of the task description, which signals that the promotion column must be included. But the agent also evaluates data quality: if promotion is sparsely populated or shows near-zero variance across the training period, the agent may exclude it and note the decision. A deterministic function does not make this call — it requires reading both the numbers and the business context together.
Forecasting agent
The Forecasting Agent calls the Chronos2 endpoint via a deterministic tool and then applies LLM reasoning to interpret the results.
@tool
def call_chronos2(payload: str) -> dict:
    """
    Invoke the Chronos2 SageMaker endpoint.
    Retries up to 3 times with 30-second backoff for cold starts.
    """
    for attempt in range(3):
        try:
            response = sagemaker_runtime.invoke_endpoint(
                EndpointName=CHRONOS2_ENDPOINT,
                ContentType="application/json",
                Body=payload
            )
            return json.loads(response["Body"].read())
        except ClientError as e:
            if e.response["Error"]["Code"] == "ModelNotReadyException":
                time.sleep(30)
                continue
            raise
    raise TimeoutError(f"Chronos2 endpoint not ready after 3 attempts")

@tool
def calculate_order_quantity(
    forecast_p50: list,
    current_stock: int,
    safety_stock: int,
    lead_time_days: int,
    min_order_quantity: int
) -> dict:
    """Deterministic replenishment formula."""
    lead_time_demand = sum(forecast_p50[:lead_time_days])
    order_qty = max(0, lead_time_demand + safety_stock - current_stock)
    if 0 < order_qty < min_order_quantity:
        order_qty = min_order_quantity
    return {"order_quantity": int(order_qty), "lead_time_demand": int(lead_time_demand)}

@tool
def validate_constraints(
    order_quantity: int,
    current_stock: int,
    warehouse_capacity: int,
    budget_cap: float,
    unit_cost: float,
) -> dict:
    """Deterministic constraint check against warehouse capacity and budget."""
    new_stock = current_stock + order_quantity
    within_capacity = new_stock <= warehouse_capacity
    total_cost = order_quantity * unit_cost
    within_budget = total_cost <= budget_cap
    return {
        "approved": within_capacity and within_budget,
        "capacity_used": round(new_stock / warehouse_capacity, 2),
        "budget_used": round(total_cost, 2),
        "budget_remaining": round(budget_cap - total_cost, 2),
        "violations": [v for v in [
            None if within_capacity
                else f"Exceeds warehouse capacity ({new_stock}/{warehouse_capacity})",
            None if within_budget
                else f"Exceeds budget (${total_cost:.2f}/${budget_cap:.2f})",
        ] if v],
    }

forecasting_agent = Agent(
    model=BedrockModel(model_id="us.anthropic.claude-sonnet-4-5-20250929-v1:0"),
    tools=[call_chronos2, calculate_order_quantity, validate_constraints],
    system_prompt=(
        "You are a forecasting and order planning specialist. "
        "Invoke Chronos2 with the provided payload, interpret the probabilistic "
        "forecast results, calculate the recommended order quantity, and validate "
        "it against business constraints. Flag any anomalies with a brief explanation."
    )
)
call_chronos2, calculate_order_quantity, and validate_constraints are each deterministic functions. The Forecasting Agent’s LLM reasoning provides two things these tools cannot: anomaly contextualization (“day 7 P90/P50 ratio is 1.36 — above the 1.3 anomaly threshold, consistent with the promotional covariate for that day”) and a natural language rationale for the order recommendation (for example, “753 units covers a 5-day lead-time demand of 648 plus a 150-unit safety stock buffer, net of 45 current inventory”). The numbers in this rationale are drawn from data/product_config.json — the same values used in the Running the agent walkthrough later in this post.
The probabilistic output — P10, P50, and P90 quantiles — is central to inventory planning, not incidental. Ordering to the P50 (median) without any buffer would mean running out of stock roughly half the time, which is why safety stock exists as a separate parameter. calculate_order_quantity uses the P50 forecast for expected lead-time demand, and the safety_stock parameter in the product config absorbs the uncertainty between P50 and P90 (teams typically tune safety stock toward a target service level such as P90 or P95). For products with high P90/P50 ratios — indicating volatile or promotion-driven demand — the Forecasting Agent flags the anomaly explicitly so the Reporting Agent can surface elevated uncertainty to the buyer rather than hiding it behind a single order number.
The violations array returned by validate_constraints is what makes the conditional retry loop actionable. When the constraint check fails, the array contains a human-readable string per violated constraint (for example, "Exceeds budget ($9412.50/$500.00)"), which the Forecasting Agent passes up to the Supervisor. The Supervisor uses this specific message, not a generic “validation failed” signal. Based on the violation details, it decides whether to re-invoke the Forecasting Agent with adjusted constraints or escalate to the user.
Reporting agent
The Reporting Agent consumes the structured output from the Forecasting Agent and produces the final deliverables: a visualization and a persisted decision record. The tools are deterministic. The agent provides the natural language summary that makes the output actionable for a business user.
import io
import json
import boto3
import matplotlib
matplotlib.use("Agg")
import matplotlib.pyplot as plt
from strands import Agent, tool
from strands.models import BedrockModel

BUCKET = os.environ["INVENTORY_BUCKET"]

@tool
def generate_forecast_chart(forecast_data: str, output_path: str) -> str:
    """Generate forecast quantile chart and upload to S3.

    Args:
        forecast_data: JSON string (Strands serializes tool arguments as strings)
        output_path: S3 key for the output PNG
    """
    data = json.loads(forecast_data)
    forecast = data["forecast"]
    days = list(range(1, len(forecast["p50"]) + 1))

    fig, ax = plt.subplots(figsize=(10, 5))
    ax.fill_between(days, forecast["p10"], forecast["p90"],
                    alpha=0.2, color="#147EBA", label="P10-P90 range")
    ax.plot(days, forecast["p50"], color="#147EBA", linewidth=2, label="P50 median")
    ax.set_xlabel("Forecast day")
    ax.set_ylabel("Predicted demand (units)")
    ax.set_title(f"Demand forecast - {data.get('product_id', '')}")
    ax.legend()
    plt.tight_layout()

    buf = io.BytesIO()
    fig.savefig(buf, format="png", dpi=150, bbox_inches="tight")
    buf.seek(0)
    plt.close(fig)

    s3 = boto3.client("s3")
    s3.put_object(Bucket=BUCKET, Key=output_path,
                  Body=buf.read(), ContentType="image/png")
    return json.dumps({"chart_s3_path": f"s3://{BUCKET}/{output_path}", "status": "uploaded"})

@tool
def save_decision_record(decision_data: str, output_path: str) -> str:
    """Persist the complete decision record as JSON to S3."""
    s3 = boto3.client("s3")
    s3.put_object(
        Bucket=BUCKET,
        Key=output_path,
        Body=decision_data.encode("utf-8"),
        ContentType="application/json",
    )
    return json.dumps({"record_s3_path": f"s3://{BUCKET}/{output_path}", "status": "saved"})

reporting_agent = Agent(
    model=BedrockModel(model_id="us.anthropic.claude-sonnet-4-5-20250929-v1:0"),
    tools=[generate_forecast_chart, save_decision_record],
    system_prompt=(
        "You are a reporting specialist. Generate the forecast visualization, "
        "persist the decision record, and produce a concise natural language "
        "summary of the recommendation and its business rationale."
    )
)
User Request
     │
     ▼
Supervisor Agent
     │
     ▼
Preprocessing Agent ──── tools: load_sales_from_s3,
     │                          load_inventory_from_s3,
     │                          load_product_config_from_s3
     ▼
Forecasting Agent ──────── tools: call_chronos2,
     │                            calculate_order_quantity,
     │                            validate_constraints
     ├── validated ──────► Reporting Agent ── tools: generate_forecast_chart,
     │                                               save_decision_record
     │                          │
     │                          ▼
     │                    Final Response
     │
     └── constraint violated
               │
               ▼
         back to Forecasting Agent
         (with adjusted constraints from Supervisor)
               │
               └── max 3 iterations, then escalate to user
Pattern: agents-as-tools
The preceding coordinator diagram is a behavioral view. Structurally, this implementation follows the Agents-as-Tools pattern: the Supervisor is a single Strands agent whose tool list contains the three specialist agents, each wrapped as a @tool. There is no explicit multi-node graph in the Strands SDK’s orchestration layer — the graph is a single Supervisor node with max_node_executions=10 (enough headroom for the base preprocessing → forecasting → reporting sequence plus up to three retry iterations, then a safety stop). Orchestration happens inside the Supervisor’s tool-use loop.
This matters for context isolation. Each specialist @tool invocation spawns a fresh Strands agent with its own context window, own system prompt, and its own tool subset. Results return to the Supervisor as a compressed labeled-output block (a CLUES_FORMAT envelope defined by the Strands SDK) that carries the specialist’s labeled output instead of its full reasoning transcript — so the Supervisor sees labeled deltas and its context stays bounded as the workflow grows.
Deploying to Amazon Bedrock AgentCore
The preceding Strands agent definitions run as local Python processes with Amazon Bedrock as the LLM backbone. To move them to managed execution, package the Supervisor entry point as an AgentCore application:
from bedrock_agentcore.runtime import BedrockAgentCoreApp
from memory.session import get_session_manager
from observability.tracing import set_session_context
from src.graph.nodes import supervisor_node

app = BedrockAgentCoreApp()

@app.entrypoint
async def handler(payload: dict, context=None):
    user_request = payload.get("prompt", payload.get("user_request", ""))
    session_id = getattr(context, "session_id", None) or payload.get("session_id", "default-session")
    actor_id = getattr(context, "user_id", None) or payload.get("actor_id", "system")

    # Attach telemetry context for this session
    set_session_context(session_id, product_id=payload.get("product_id"))

    # Create memory session manager (returns None if MEMORY_ID not configured)
    session_manager = get_session_manager(session_id, actor_id)
    result = await supervisor_node(task={"request": user_request}, session_manager=session_manager)
    return result.get("text", "No response generated.")
Deploy with the AgentCore CLI: agentcore deploy. AgentCore wraps each invocation in an isolated microVM, injects session context for short-term memory reads and writes, and streams agent traces automatically to Amazon CloudWatch — no additional instrumentation required. Full end-to-end deployment is a sequence of steps — CDK infrastructure, Gateway with save_decision registered, Cedar policies, Memory resource, Runtime package, and post-deploy Evaluations setup — orchestrated by a single deployment script.
The sequential chain is enforced by data dependency: the Forecasting Agent cannot run without the preprocessed payload. The Reporting Agent cannot run without a validated order decision.
The conditional retry loop handles constraint violations as a first-class workflow state rather than an error condition. When validate_constraints returns approved: false, the Forecasting Agent surfaces the violation explanation. The Supervisor interprets it, adjusts the constraint parameters (for example, reducing the order to fit within the budget cap), and re-invokes the Forecasting Agent. The Supervisor tracks iteration count in the short-term session memory of AgentCore and escalates to the user if three iterations do not converge — avoiding silent infinite loops.
Cost optimization: scale to zero
The most significant cost decision is the SageMaker deployment mode for the Chronos2 endpoint.
Configuration
Monthly Cost
Cold Start
Recommendation
Always-on ml.g5.2xlarge
~$1,091
None
High-frequency real-time use
Serverless Inference
~$15
30–60 seconds
Batch / scheduled forecasting
For batch inventory forecasting — a nightly or weekly job — a 30–60 second cold start is fully acceptable. Serverless Inference reduces inference costs by over 98% compared to an always-on GPU endpoint.
The AgentCore Runtime follows the same scale-to-zero cost model: microVM isolation per session, up to 8-hour session duration, and no idle cost between workflow runs. Both the agent runtime and the inference endpoint scale to zero when not in use.
How the numbers break down. The $15/month Serverless estimate assumes approximately 500 invocations averaging eight seconds of compute each, priced against the ml.g5.xlarge Serverless rate, with storage and inter-service data transfer excluded (the forecast payload and response each sit well under a megabyte). The $1,091/month always-on estimate is a ml.g5.2xlarge endpoint running 24×7, which pays for idle GPU memory every hour the agent is not forecasting. For nightly or weekly batch jobs, the duty cycle makes Serverless the correct default. For latency-sensitive real-time forecasting with a high invocation rate, the break-even point is roughly a few thousand invocations per month and tips toward the always-on endpoint.
Architecture deep dive: design patterns and trade-offs
This section examines the key design decisions behind the system: how to decompose work into agents versus tools, how agents communicate through data contracts, and how to handle failures and control costs.
The agent versus tool decision framework
The most consequential design decision in a multi-agent system is not which framework to use or how many agents to create — it is deciding, for each unit of work, whether it requires an LLM or a deterministic function.
The practical test:
“If I fix the input, will the output always be the same?”
Yes → Implement as a @tool. The LLM calls it. The function does the work.
No → The agent’s LLM reasoning IS the logic. The variability is intentional.
Applying this test to every component in this system:
Component
Output deterministic?
Implementation
Parse user’s natural-language request
No
Supervisor Agent reasoning
Load file from S3
Yes
@tool
Select covariates based on data quality + user context
No
Preprocessing Agent reasoning
Invoke Chronos2 endpoint
Yes
@tool
Interpret forecast anomalies in business context
No
Forecasting Agent reasoning
Calculate order quantity from formula
Yes
@tool
Check order against warehouse/budget constraints
Yes
@tool
Generate rationale for order recommendation
No
Forecasting Agent reasoning
Generate matplotlib chart
Yes
@tool
Write JSON to S3
Yes
@tool
Decide whether to retry with adjusted constraints or escalate to the user
The pattern: deterministic computation belongs in tools. Judgment, interpretation, and context-dependent recommendation belong in agent reasoning. Wrapping a deterministic formula in an LLM agent adds cost, latency, and non-determinism with no benefit. Asking a deterministic function to interpret “there’s a promotion next week” will fail.
This framework also prevents scope creep. When a new requirement arrives — “add a second validation check for seasonal buffer stock” — the answer is clear: add a @tool, not a new agent.
Data contract design: structured JSON between agents
Each agent in the sequential chain outputs a typed JSON structure that the next agent consumes. A representative contract between the Forecasting Agent and the Reporting Agent:
{
  "product_id": "SKU-00142",
  "forecast_horizon_days": 14,
  "covariates_used": ["promotion", "price", "day_of_week"],
  "forecast": {
    "p10": [95, 98, 118, 128, 105, 112, 135, 92, 96, 100, 105, 112, 140, 148],
    "p50": [110, 115, 145, 158, 120, 128, 158, 106, 110, 115, 119, 127, 154, 166],
    "p90": [132, 138, 183, 206, 150, 160, 215, 130, 138, 150, 155, 165, 195, 210]
  },
  "order_decision": {
    "order_quantity": 753,
    "lead_time_demand": 648,
    "safety_stock": 150,
    "current_stock": 45,
    "supplier": "Supplier-A",
    "approved": true,
    "warehouse_utilization": 0.40
  },
  "anomaly_flags": [
    {
      "day": 7,
      "note": "P90/P50 ratio of 1.36 on day 7 exceeds the 1.3 anomaly threshold; elevated uncertainty consistent with the promotional covariate on that day"
    }
  ],
  "rationale": "Recommended order of 753 units covers a 5-day lead-time demand of 648 units plus a 150-unit safety stock buffer, net of 45 units current stock. Warehouse utilization after delivery: 40%.",
  "model": "chronos2",
  "inference_latency_ms": 1840
}
The contract is explicit about which covariates were actually used (the Preprocessing Agent’s decision is visible and auditable), includes the order rationale as a first-class field, and carries anomaly flags in structured form rather than buried in prose. This makes the contract machine-readable for downstream tools and human-readable for debugging.
Implicit coupling through unstructured text — where one agent returns a paragraph and the next tries to extract numbers from it — is the most common failure mode in multi-agent systems. Explicit JSON contracts prevent it.
Failure handling: retry, degradation, and isolation
Three failure strategies, matched to component criticality:
Per-agent retry with backoff: Applied to load_* tools (S3 transient errors) and call_chronos2 (SageMaker Serverless cold starts). The Forecasting Agent’s tool handles cold starts with up to 3 retries at 30-second intervals, catching ModelNotReadyException transparently before surfacing an error to the agent.
Graceful degradation: If the Preprocessing Agent determines that a covariate column is too sparse to be reliable, it proceeds without that covariate and notes the degradation in the output contract. The Forecasting Agent receives a valid — if potentially less accurate — input and continues. The Reporting Agent surfaces the degradation flag in its summary.
Failure isolation for non-critical paths: generate_forecast_chart and save_decision_record run within the Reporting Agent. If chart generation fails (rendering error, S3 write timeout), the Reporting Agent can still complete its primary output: the natural language summary and the decision record. The order recommendation is never blocked by a visualization failure.
In-process versus gateway: a second boundary
The agent versus tool framework draws one line: is the output determined by the input? A second line sits underneath it, and it matters just as much for a production system: does this tool cross a trust, durability, or cost-of-mistake boundary?
The practical test:
“If the agent hallucinates and calls this tool wrongly, does the mistake propagate to external systems or stop at the agent’s memory?”
Stops at the agent → In-process Strands @tool. The agent’s IAM role and Strands type system already bound it. Adding Gateway adds latency and cost with no safety gain.
Propagates externally → Gateway. This is where Cedar authorization, JWT identity, and the audit trail of “who asked for this write, and what was persisted” need to live.
Applying this to every tool in the system:
Tool
Side effect at failure?
Placement
load_sales
None (read only)
In-process @tool
load_inventory
None (read only)
In-process @tool
load_product_config
None (read only)
In-process @tool
invoke_chronos2
External SageMaker call, no state mutation
In-process @tool
calculate_order
None (pure function)
In-process @tool
validate_constraints
None (pure function)
In-process @tool
generate_forecast_chart
S3 write, retryable, not authoritative
In-process @tool (Failure Handling § covers this isolation)
save_decision
S3 write that becomes the authoritative order record
Gateway + Cedar policies
Of the eight tools in this system, exactly one needs Gateway. That proportion is the norm, not the exception: most “tools” in an agent system are reads and pure functions where Gateway adds cost without adding safety. The services AgentCore provides are opt-in for a reason — pick the one sub-service that guards each distinct boundary, not all six for every tool.
A natural follow-up: generate_forecast_chart also writes to S3 — why is it in-process rather than behind the Gateway? Because the chart is a visualization, not a decision of record. If it fails or is silently wrong, the order recommendation still stands and the write can simply be retried. save_decision is the opposite: once the decision record is persisted, downstream systems treat the order as real. The Gateway earns its place where a faulty write would create downstream inconsistency, not where it would at worst inconvenience a buyer.
The Gateway Lambda (mcp/lambda/handler.py) exposes save_decision as an MCP-compatible tool endpoint. Infrastructure complexity stays proportional to the actual policy surface, not to the number of tools the agent calls.
Cost-aware architecture: token budget per agent
Beyond infrastructure cost, the four-agent design enables explicit token budget allocation. Each agent’s context window is bounded by its single responsibility:
Agent
Context window contains
Does NOT contain
Supervisor
User request, execution plan, and compressed CLUES_FORMAT blocks returned by specialists
Raw CSV, Chronos2 forecast arrays
Preprocessing
Raw CSV rows, product config
Conversation history
Forecasting
Formatted Chronos2 payload, model output
Raw CSV, full history
Reporting
Validated order decision, rationale
Raw data, Chronos2 payload
This partitioning keeps per-run LLM inference cost flat as catalog size scales. A monolithic agent carrying all data, all conversation history, and all intermediate results through every step would accumulate a context window that grows with catalog size and conversation length — and incur that cost on every invocation.
One boundary per AgentCore service
The two decision frameworks discussed earlier (agent versus tool, in-process versus gateway) leave us with a clear map of where each AgentCore sub-service earns its place in this system. The following table maps each service to a single production concern. The paragraphs that follow explain why that service is the right answer to that concern — not only what the service does.
Production concern
AgentCore service
What it replaces
Where does the agent run?
Runtime
Always-on container hosting
What writes are allowed to reach external systems?
Gateway + Policy
API Gateway + custom authz middleware
What does the agent carry across sessions?
Memory
Redis + bespoke retrieval code
Can we reconstruct why a decision was made?
Observability
Custom OTEL setup + CloudWatch wiring
How do we know the agent is still behaving after deployment?
Evaluations
Offline eval scripts + manual QA
Runtime guards where agents execute. AgentCore Runtime hosts the Supervisor inside a per-session microVM with up to 8-hour session duration and zero idle cost between runs. For batch inventory forecasting — weekly or nightly jobs — paying for an always-on container is waste. Runtime provides session isolation and scale-to-zero-between-sessions as the default behavior, so the team does not have to engineer either separately.
Gateway and Policy guard what writes are allowed to reach external systems. Gateway is designed to be paired with Policy: Gateway validates who is calling (JWT from Cognito), Policy decides whether this specific call is allowed (Cedar evaluates principal, action, resource, and the full tool-call payload via context.input). Without Policy, Gateway would grant each authenticated caller access to each registered tool.
Because only save_decision is registered on the Gateway, the authorization surface is scoped to the single point where an order becomes a persisted record — the last gate before downstream systems (dashboards, ERP integration) treat the decision as real. Two Cedar policies apply:
allow_write_reporting_only — save_decision may only be invoked by the Reporting workflow’s identity.
deny_high_value_orders — any save_decision call where context.input.budget_used > 50000 is denied, regardless of principal:
forbid(
  principal is AgentCore::OAuthUser,
  action == AgentCore::Action::"InventoryTools___save_decision",
  resource is AgentCore::Gateway
) when {
  context.input has budget_used &&
  context.input.budget_used > 50000
};
Putting the high-value deny anywhere upstream — say, on calculate_order — would be ineffective: the agent could re-run the calculation until it passed, and the denial wouldn’t map to any durable effect. The policy is meaningful only at the write boundary.
Memory guards what the agent carries across sessions. AgentCore Memory supports three long-term strategies. This system uses two of them: semanticMemoryStrategy for SKU-level forecast accuracy history and userPreferenceMemoryStrategy for constraint overrides such as “this buyer always sets a 20% higher safety stock for electronics.” summaryMemoryStrategy is not used here because session-level summarization adds little for a structured forecast workflow. The Strands AgentCoreMemorySessionManager wires these into the Supervisor with no bespoke retrieval code.
Observability guards whether we can reconstruct why a decision was made. Each agent invocation — inputs, outputs, tool calls, retry attempts, latency — is traced automatically and streamed to Amazon CloudWatch. For an inventory pipeline, each order decision acquires a complete, auditable trail: which agent ran, which tools were called, what Chronos2 returned, and why the Forecasting Agent recommended a specific quantity. CloudWatch Logs Insights queries surface operational patterns like “which SKUs trigger the most constraint violations” or “which products show the highest P90/P50 forecast uncertainty” — directly informing improvements to business rules and covariate selection without re-running the pipeline.
Evaluations guards whether the agent is still behaving after deployment. AgentCore Evaluations runs online quality monitoring against a sampled portion of production traffic (configurable. This system samples 100% during initial rollout). Two built-in evaluators — Builtin.GoalSuccessRate and Builtin.Helpfulness — provide generic quality signal, and a custom LLM-as-a-Judge evaluator scores constraint compliance on a 3-point scale:
1.0 — Silent violation: order violates constraints and the agent did not flag it.
2.0 — Flagged violation: order violates constraints but the agent explicitly surfaced the flag.
3.0 — Compliant: order respects all constraints.
The scale deliberately rewards agents that flag violations rather than hide them. This is the failure mode the retry loop is designed to prevent, and the evaluator is designed to detect. Without this rubric, an agent that quietly truncates orders to fit the budget scores the same as one that escalates to the user — even though only the second is safe for production. The 3-point rubric catches the failure mode where an agent hides a constraint violation. The next subsection adds a second evaluator for the complementary question — was the forecast itself accurate?
The throughline: AgentCore is not a monolithic “agent platform” you either adopt or refuse. It is a set of services, each addressing one specific concern that production agent systems face. Picking the right service for each concern — and not stretching one service to cover two — is the architecture work. The preceding map is the output of that work for this system. The map for a different domain (customer support, code generation, research) will look different, but the exercise of drawing one is the same.
Two layers of evaluation: behavior and accuracy
The Evaluations described earlier answer one question: did the agent behave safely? That is necessary but not sufficient. For an inventory system, a second question is equally important: was the forecast the agent produced actually accurate? An agent that flags each constraint violation correctly is still useless if its P50 forecast is systematically off by 30%.
These two questions map to the two evaluator types that AgentCore Evaluations supports. The choice between them follows the same logic as the agent versus tool framework from the architecture deep dive, one layer up: if the correct output is fully determined by the inputs, use a deterministic function, not an LLM. A forecast accuracy score is a calculation, not a judgment call.
The pattern: agent behavior needs subjective scoring. Forecast accuracy needs arithmetic. Use the evaluator type that matches the question, not the one that feels more sophisticated.
LLM-as-a-Judge evaluators score subjective dimensions — did the agent flag the violation, was the rationale coherent, was the response helpful. Good for behavior, wrong tool for arithmetic.
Code-based evaluators invoke a Lambda function against the session trace with optional ground truth injected via evaluationReferenceInputs. Good for deterministic metrics — WAPE, signed bias, pinball loss, coverage — that have a correct numeric answer.
Forecast accuracy evaluator (code-based)
The evaluator is a Lambda function that reads the Chronos2 forecast from the session trace, pairs each horizon day with the actual sales value supplied as ground truth, and returns WAPE as the primary numeric score alongside signed bias, pinball loss at P90, and P10–P90 coverage.
# lambda/forecast_accuracy_evaluator/handler.py
import numpy as np

def handler(event, context):
    """Code-based evaluator for forecast accuracy.
    Runs after actual sales are known (horizon + lead time later)."""
    spans = event["evaluationInput"]["sessionSpans"]
    ground_truth = event.get("evaluationReferenceInputs", [])

    forecast = extract_forecast_from_spans(spans)  # Forecasting Agent span
    actual = np.array([g["actual_sales"] for g in ground_truth])
    p10 = np.array(forecast["p10"])
    p50 = np.array(forecast["p50"])
    p90 = np.array(forecast["p90"])

    if len(actual) != len(p50):
        return {
            "errorCode": "HORIZON_MISMATCH",
            "errorMessage": f"forecast={len(p50)}, actual={len(actual)}",
        }

    # Primary metric: WAPE (weighted absolute percentage error).
    # Preferred over MAPE because it weights errors by volume, avoiding
    # MAPE's well-known blow-up on low-volume days.
    wape = float(np.abs(actual - p50).sum() / actual.sum())

    # Signed bias (SCM convention: bias = forecast - actual, normalised).
    # Positive => chronic over-forecast => excess inventory risk.
    # Negative => chronic under-forecast => stock-out risk.
    bias = float((p50 - actual).sum() / actual.sum())

    # Pinball loss at P90:
    #   L_q(y, ŷ) = max(q·(y-ŷ), (q-1)·(y-ŷ))
    # At q=0.9, under-coverage (y > ŷ_p90) is penalised 9x more than
    # over-coverage — matches the operational cost of stock-outs.
    q = 0.9
    diff = actual - p90
    pinball_p90 = float(np.mean(np.maximum(q * diff, (q - 1) * diff)))

    # Coverage of the P10–P90 band (nominal target: 0.80).
    coverage = float(((actual >= p10) & (actual <= p90)).mean())

    # Composite label. Thresholds are retail-demand defaults; tune per
    # catalog. WAPE < 15% aligns with M5 competition 'strong' baseline.
    if wape < 0.15 and abs(bias) < 0.05 and 0.75 <= coverage <= 0.85:
        label = "ACCURATE"
    elif wape < 0.25:
        label = "ACCEPTABLE"
    else:
        label = "POOR"

    return {
        "label": label,
        "value": wape,  # primary score surfaced in CloudWatch
        "explanation": (
            f"WAPE={wape:.3f}, bias={bias:+.3f}, "
            f"pinball@P90={pinball_p90:.2f}, coverage={coverage:.2%}"
        ),
    }
A note on thresholds. WAPE < 15 percent is a common ‘strong baseline’ reference for retail demand at SKU-week granularity, anchored by the M5 forecasting competition. Treat the cut-offs as starting values and tune per catalog. The coverage target (0.75–0.85 for a P10–P90 band) and the pinball loss together tell you whether the quantiles are calibrated: if coverage drifts below the band year-over-year while point WAPE stays flat, the model has grown over-confident and the safety stock multiplier, not the point forecast, is the thing to revisit.
Two implementation notes worth flagging for readers reusing the evaluator. First, the signed-bias convention here is the SCM standard (positive = over-forecast), which matches Tracking Signal conventions used in most inventory-planning systems. Second, the pinball loss at P90 is asymmetric by design: under-coverage of the upper quantile is penalised 9× more than over-coverage, mirroring the asymmetric cost of stock-outs compared to carrying cost.
Register the evaluator once through the AgentCore control plane, then reference it by ARN in every session-level evaluation:
The 3-point behavior rubric runs online — every session, in real time — because its inputs (agent trace, tool outputs) exist at the moment the session ends. The accuracy evaluator is different. On the day the order decision is made, the “correct” demand for the next 14 days does not yet exist. It materialises one horizon later, as each forecast day passes and actual sales are recorded in the data warehouse.
The code-based evaluator handles this naturally. A nightly job collects sessions whose forecast horizon has fully elapsed, pulls actual sales from the data warehouse, and invokes the evaluator on-demand with evaluationReferenceInputs populated:
import boto3

agentcore = boto3.client("bedrock-agentcore")

EVALUATOR_ID = "forecast-accuracy-evaluator-id"  # from create_evaluator

for session_id, session_spans, actuals in sessions_ready_for_scoring():
    response = agentcore.evaluate(
        evaluatorId=EVALUATOR_ID,
        evaluationInput={"sessionSpans": session_spans},
        evaluationTarget={"traceIds": session_trace_ids(session_spans)},
        evaluationReferenceInputs=[
            {"day": i + 1, "actual_sales": y}
            for i, y in enumerate(actuals)
        ],
    )
    for result in response["evaluationResults"]:
        # EvaluationResultContent schema: label, value, explanation,
        # evaluatorId, evaluatorName (see AWS SDK docs)
        if "errorCode" in result:
            emit_alarm(session_id, result["errorCode"], result["errorMessage"])
            continue
        emit_dashboard_metric(
            session_id=session_id,
            wape=result["value"],
            label=result["label"],
            explanation=result["explanation"],
        )
Scores stream into the same CloudWatch Evaluations namespace as the online evaluators, so the team queries behavior and accuracy through the same dashboards and alarms. A P50 forecast with four consecutive weeks of negative bias triggers the same operational response as a run of silent-violation sessions: investigate, fix, redeploy.
The preceding snippet is the on-demand path — one evaluator call per session, invoked explicitly after ground truth arrives. When you want the evaluator to run automatically against every session’s trace as it lands in CloudWatch, register it in an Online Evaluation Config:
Note what is not in the online list: the ForecastAccuracyEvaluator. Ground truth is not available at trace-emit time, so registering it online would produce HORIZON_MISMATCH errors on every invocation. The two cadences — online for behavior, on-demand for accuracy — are a consequence of the data arriving at different times, not a configuration preference.
ForecastAccuracyEvaluator (WAPE, signed bias, pinball@P90, P10–P90 coverage)
Custom Code-Based (Lambda)
Session
On-demand, once horizon + lead time elapse
The first three evaluators guard how the agent acted. The fourth guards what the model was right about. Together they close the gap that either alone would leave open: an agent that behaves perfectly while quietly under-forecasting, or a model with excellent WAPE whose recommendations are silently truncated by an agent. Both failure modes are invisible to a single-layer evaluation. Both become visible when the two layers run side by side.
Production targets and throughput
These evaluators only matter if they feed operational targets. For this system the targets are explicit: P95 end-to-end latency under 90 seconds for a batch-scheduled session, constraint-compliance rubric score of at least 2.0 on 95 percent of sessions (flagged violations count. Silent violations do not), and rolling 4-week WAPE under 20 percent across the top-20 SKUs by revenue. Each target has a CloudWatch alarm routed to oncall. The error budget — 5 percent of sessions scoring below 2.0 — gives the team room to iterate on prompts and constraints without treating every regression as a page.
Throughput at catalog scale. A full session for one SKU completes in roughly eight seconds end to end (Chronos2 Serverless cold path excluded, which amortises after the first call in a run). A 10,000-SKU nightly run finishes in under thirty minutes at roughly 100-way parallelism, bounded by the SageMaker Serverless concurrency quota. Per-run cost at that scale is on the order of a few dollars in Bedrock reasoning plus a few dollars in SageMaker inference — small enough that the daily-run cadence is a pricing choice, not a constraint.
Running the agent: a constraint-violation walkthrough
After deploying all components, invoke the agent with a scenario that deliberately forces the conditional retry loop to fire. The following test case overrides the product’s default budget cap to $500 — well under what a full lead-time order would cost — so that the system’s response to constraint violation is observable end-to-end.
agentcore invoke "Forecast replenishment for SKU-00142 this weekend \
  (promotion active). My budget for this order is $500." \
  --session-id test-session-chronos2-inventory-001
The agent executes the full pipeline and returns a structured recommendation. The following numbers derive from data/product_config.json (safety_stock = 150, lead_time_days = 5, min_order_quantity = 50, unit_cost = $12.50) and the Chronos2 P50 forecast with the promotion covariate active:
Product: SKU-00142 (Wireless Earbuds Pro)
Current stock: 45 units.
Forecast P50 (5-day lead time, with promotion): ~648 units.
Optimal order: 753 units = $9,412.50.
User budget cap: $500 → violation detected.
Adjusted order (bounded by min_order_quantity): 50 units = $625.00 — still over budget.
Projected shortfall: ~553 units over the 5-day lead-time window.
The behaviour at this point is the whole point of the design. Rather than silently truncating the order to whatever number fits the budget and creating a large stock-out, the Supervisor surfaces the three actionable options — raise the budget, accept the shortfall and pre-position expedited delivery, or delay the promotion — and asks the user to choose. This is the conditional retry loop doing its job: a constraint violation is treated as a workflow state requiring input, not as a silent failure.
Observability and Evaluations both capture this event for inspection afterwards. The CloudWatch trace shows each tool call in the retry loop, and the Evaluations custom evaluator scores this session at 2.0 (flagged violation), confirming the agent behaved as designed rather than silently failing.
Cleaning up
To avoid incurring future charges, delete the resources you created during this walkthrough in the following order:
Tear down AgentCore resources (Runtime, Gateway, Policy engine, Memory, Evaluations):
agentcore destroy
Destroy the CDK stack (S3 bucket, Gateway Lambda, Cognito user pool, IAM roles):
cd cdk && npx cdk destroy
Delete the SageMaker Serverless endpoint to stop Chronos2 inference charges:
Revoke Amazon Bedrock model access under Model access in the Bedrock console if it is no longer needed for other workloads.
Conclusion
This architecture demonstrates that zero-shot forecasting and multi-agent automation are complementary abstractions that remove different categories of operational burden.
Chronos2 removes the ML pipeline. Adding a new SKU to the forecast requires no training job, no feature engineering, no model validation. The only inputs required are historical sales data and covariate values for the forecast horizon — both of which are standard operational data.
Multi-agent orchestration removes the manual workflow. Converting a demand forecast into a purchase order with business rule compliance, natural language rationale, and an audit trail requires coordinating judgment and computation across multiple steps. Four LLM agents handle the judgment. A set of deterministic tools handle the computation.
What you gain:
Dimension
Traditional Approach
This Architecture
New product onboarding
Train new model (days–weeks)
Zero — Chronos2 zero-shot
Business rule change
Edit spreadsheet or monolith
Change one @tool
Failure recovery
Restart entire pipeline
Retry at the failed agent
Audit trail
Manual documentation
Every agent output is a structured JSON contract
LLM cost at scale
Unbounded (monolith carries all context)
Bounded per agent by single-responsibility context
Forecast explanation
Raw numbers
Natural language rationale with anomaly flags
Forecast quality signal
Manual backtest scripts, ad-hoc
Code-based evaluator scores every session
The patterns described here — the agent versus tool, in-process versus gateway, and subjective versus deterministic evaluation decision frameworks, structured JSON contracts between agents, conditional retry as a first-class workflow state, and mapping each AgentCore service to one production concern — apply beyond inventory management to any domain where deterministic computation and contextual judgment must work together.
To get started, deploy the CDK stack in your AWS account using the infrastructure patterns described in the technical implementation section, then run the constraint-violation walkthrough with your own product data to see the full agent coordination in action.
Cost figures for SageMaker Serverless Inference are estimates based on us-east-1 pricing and assume approximately 500 inference calls per month. Actual costs vary by Region and usage pattern.
Consider a real-time transcription service processing 500 concurrent meetings. Each worker processing these meetings requires a dedicated outbound WebSocket connection to an upstream streaming source. When a single worker fails, it drops 100+ connections, causing 2 to 3 minutes of data loss per connection until operators manually restart services.
Building real-time streaming workers that maintain hundreds of persistent WebSocket connections presents a coordination challenge: when a worker stops unexpectedly, its connections become unmanaged and data stops flowing. Exactly one worker must own each connection, yet workers fail, redeploy, and scale independently. Without a mechanism to track ownership and automatically transfer connections that healthy workers can claim, operators must intervene manually for every failure.
This pattern reduces manual intervention during failures, reduces connection recovery time from minutes to seconds, and helps minimize downtime during deployments without requiring external coordination services.
In this post, you learn how to build a WebSocket fleet management system on Amazon Elastic Container Service (Amazon ECS) and AWS Fargate. Amazon DynamoDB is the primary service that manages distributed lease ownership, coordination, and failover in this solution. For the compute layer, this post uses Amazon ECS on AWS Fargate to run the worker fleet. However, you can adapt this pattern to any compute layer of your choice, such as Amazon Elastic Kubernetes Service (Amazon EKS) or Amazon Elastic Compute Cloud (Amazon EC2) with Auto Scaling groups, without changing the core lease logic. You learn how to implement lease-based ownership with conditional writes, automatic failover through orphan reconciliation, and low downtime deployments through graceful shutdown.
The challenge: managing long-lived WebSocket connections
WebSocket connections are fundamentally different from HTTP requests. An HTTP request arrives, gets processed, and returns a response. The server holds no state between requests. A WebSocket connection, by contrast, is a persistent bidirectional channel. The worker must maintain an open TCP connection, process messages the upstream source sends, and respond to keep-alive pings from the upstream source.
This statefulness introduces several operational challenges:
Worker failures. When a worker process stops unexpectedly or its container terminates, the worker drops its WebSocket connections. The upstream source might buffer data briefly, but without a mechanism to detect the failure and reassign the connection to a healthy worker, the system loses data.
Rolling deployments. ECS rolling deployments terminate old tasks and start new ones. Each terminated task drops its connections. Without coordination, there’s a window where connections have no owner.
Horizontal scaling. Adding workers is straightforward. New tasks start and pick up work. Removing workers is harder. You need to drain connections from departing workers and verify other workers take over before the task exits.
Double-claiming. If two workers both believe they own the same connection, they both attempt to connect to the same upstream source. This can cause duplicate data processing, protocol errors, or connection rejection by the upstream service.
Because the workers are WebSocket clients that initiate outbound connections to upstream sources, you need a coordination mechanism that operates at the application layer rather than the network layer.
Solution overview
The architecture uses six AWS services to coordinate a fleet of WebSocket workers:
Figure 1: WebSocket fleet management architecture
Amazon API Gateway: You use this to receive START and STOP events from external systems through a REST API. A START event signals that a new streaming session (for example, a meeting or live feed) has begun and requires a dedicated WebSocket connection. A STOP event signals that the streaming session has ended and the connection should be released.
AWS Lambda (event router): You use this to write connection state to Amazon DynamoDB and enqueue a notification to Amazon Simple Queue Service (Amazon SQS).
Amazon DynamoDB: You use this to store connection state and lease ownership. Conditional writes (atomic operations that succeed only if specified conditions are met) can provide distributed locking capabilities without external coordination services.
Amazon SQS: You use this to distribute work notifications to workers for fast pickup of new connections.
Amazon ECS on AWS Fargate: You use this to run the worker fleet. Each worker polls Amazon SQS, manages WebSocket connections, and renews leases through heartbeats.
Amazon CloudWatch: You use this to collect custom metrics (active connection count) that drive ECS automatic scaling.
The key insight is that DynamoDB conditional writes act as a distributed lock without requiring a separate coordination service. Each connection has a lease: a time-bounded ownership claim. Workers must continuously renew their lease. If a worker stops unexpectedly, the lease expires and another worker takes over.
Why not SQS alone or an existing lock client?
SQS plays an important role in this architecture as a fast notification channel, but it cannot serve as the sole coordination mechanism. SQS is designed for task execution, delivering a unit of work to one consumer. WebSocket connection ownership is not a one-time task. It is a continuous state that must be maintained and renewed for the lifetime of the connection. SQS has no mechanism to track who currently owns a connection, query for connections with no active owner, or represent the domain state (desired_state, ws_url, last_seq) needed to manage a connection. DynamoDB provides all these capabilities through persistent items, conditional writes, and secondary indexes.
The amazon-dynamodb-lock-client library published by AWS implements similar distributed locking primitives on DynamoDB. However, it is designed for Java environments and does not integrate domain-specific connection state into the lock record. This solution is implemented in async Python to match the worker architecture, combines lock ownership and connection metadata in a single DynamoDB item to reduce read operations, and uses a GSI to enable fleet-wide reconciliation queries that a general-purpose lock client does not provide.
The lease pattern
A lease is a row in DynamoDB that tracks who owns a connection and when that ownership expires. The table uses the following schema:
Attribute
Type
Description
Pk
String (Partition Key)
Connection ID, for example, CONN#meeting-123
desired_state
String
STARTED or STOPPED
ws_url
String
Upstream WebSocket URL to connect to
lease_owner
String
Worker ID that currently owns this connection
lease_expires_at_ms
Number
Epoch milliseconds when the lease expires
last_seq
Number
Last processed sequence number (for resumption)
A global secondary index (GSI), a secondary lookup structure that you can use to query on non-primary-key attributes, on desired_state (partition key) and lease_expires_at_ms (sort key) allows efficient queries for unmanaged connections: those with desired_state = STARTED and an expired lease.
A note on clock accuracy
The lease expiration mechanism relies on epoch millisecond timestamps generated by worker processes using their local system clocks. DynamoDB evaluates lease expiration conditions against the now value supplied by the calling worker, not against a DynamoDB server-side clock. This means all workers must have reasonably synchronized clocks for the lease pattern to behave correctly.
AWS Fargate tasks running in the same AWS region receive clock synchronization through the Amazon Time Sync Service, which keeps clock skew between tasks to within a few milliseconds. This is well within the safety margin provided by the default 20-second lease duration and 5-second heartbeat interval. If you deploy this pattern on compute infrastructure outside of AWS Fargate, verify that NTP synchronization is configured and monitor for clock drift. For environments where clock accuracy cannot be guaranteed, increase the lease duration by the maximum expected clock skew to prevent false lease expirations.
The lease lifecycle has four states. Figure 2 shows the lease state machine.
Figure 2: Lease lifecycle
Acquire
A worker claims a connection by writing its worker ID (lease_owner) and a future expiration timestamp (lease_expires_at_ms) to the DynamoDB lease record. The conditional expression ensures that only one worker can succeed: it checks that either no lease exists yet (attribute_not_exists) or the existing lease has already expired (lease_expires_at_ms < :now). If two workers attempt to acquire the same connection simultaneously, DynamoDB evaluates this condition atomically and only one worker succeeds. The other receives a ConditionalCheckFailedException and gracefully backs off.
The following code example is from the worker application (worker.py), which initializes the Amazon DynamoDB table client, worker ID, and configuration at startup. The complete implementation is available in the GitHub repository.
The ConditionExpression is the critical piece: it succeeds when the lease does not exist yet (attribute_not_exists) or has already expired (lease_expires_at_ms < :now).
Renew
The owning worker renews its lease every few seconds (the heartbeat). The conditional expression verifies the worker still owns the lease:
If renewal returns False, the worker knows it has lost ownership (perhaps another worker acquired the expired lease) and exits cleanly.
Release
During graceful shutdown, the worker explicitly releases its leases so other workers can acquire them immediately rather than waiting for expiration:
async def release_lease(pk: str):
    """Release lease on connection."""
    try:
        table.update_item(
            Key={"pk": pk},
            UpdateExpression=(
                "SET lease_owner = :empty, "
                "lease_expires_at_ms = :zero"
            ),
            ConditionExpression="lease_owner = :w",
            ExpressionAttributeValues={
                ":w": WORKER_ID,
                ":empty": "",
                ":zero": 0,
            },
        )
    except ClientError:
        pass  # Already released or taken by another worker
Expired
When a worker stops unexpectedly, because of a container crash, network partition, or process failure, it can no longer renew its lease. Unlike graceful shutdown, the worker has no opportunity to explicitly release ownership. The lease remains in DynamoDB with the crashed worker’s lease_owner value, but the lease_expires_at_ms timestamp passes without renewal.
This expired lease represents a connection with no active owner: desired_state remains STARTED (the connection should be active) but no healthy worker is managing it. The connection is now an orphan.
The reconciliation loop detects this condition by querying the GSI for records where desired_state = STARTED and lease_expires_at_ms < now. Any healthy worker that finds such a record can attempt to acquire it using the same conditional write used during initial acquisition. Because lease_expires_at_ms < :now is one of the valid conditions for acquisition, the expired lease is treated identically to an unclaimed one.
The Expired state is transient: it exists between the moment a lease stops being renewed and the moment the reconciliation loop runs and a new worker successfully acquires it. The maximum time a connection spends in the Expired state is bounded by the reconciliation interval (default: 60 seconds).
Technical implementation
The following sections walk through each component of the system, starting with how events enter the pipeline and ending with how the fleet scales.
Event ingestion
When an external system needs to start or stop a streaming connection, it sends an event to the Lambda event router through API Gateway. The Lambda function writes the connection state to DynamoDB and enqueues a notification to SQS:
DynamoDB is the source of truth for connection state. Amazon SQS serves as a fast notification channel. When a START event arrives, the SQS message immediately notifies available workers that they can claim a new connection, so workers do not need to wait for the next reconciliation cycle (default: 60 seconds) to discover and acquire the new connection. Without SQS, new connections would only be picked up when the reconciliation loop queries the GSI for unmanaged connections on its next scheduled run.
Worker polling
Each ECS Fargate worker runs a continuous SQS polling loop to pick up new connection notifications. The loop follows four steps before starting a new WebSocket connection:
1. Capacity check
Before accepting any new work, the worker checks whether it has reached its maximum connection limit (MAX_CONNECTIONS). If the worker is at capacity, it pauses for 5 seconds and skips the current polling cycle. This prevents a single worker from being overwhelmed while other workers in the fleet remain underutilized.
2. Deduplication
If the worker already manages the connection referenced in the SQS message (tracked in its local connections dictionary), it deletes the message and moves on. This handles cases where the same connection generates multiple SQS notifications, for example during retries or redeliveries.
3. Lease acquisition before WebSocket start
The SQS message is a hint, not a guarantee of ownership. Before starting a WebSocket connection, the worker must successfully acquire the DynamoDB lease using try_acquire_lease. If another worker has already claimed the connection, try_acquire_lease returns None and this worker skips it. This ensures exactly one worker owns each connection at any time.
4. Task creation
If the lease is acquired and desired_state is STARTED, the worker creates an async task to manage the WebSocket connection. The SQS message is then deleted regardless of whether the lease was acquired, preventing repeated reprocessing of the same notification.
The following code shows the full polling loop implementation:
async def poll_sqs():
    while not shutdown_event.is_set():
        if len(connections) >= MAX_CONNECTIONS:
            await asyncio.sleep(5)
            continue

        resp = await asyncio.to_thread(
            sqs.receive_message,
            QueueUrl=QUEUE_URL,
            MaxNumberOfMessages=1,
            WaitTimeSeconds=10,
            VisibilityTimeout=30,
        )

        for msg in resp.get("Messages", []):
            body = json.loads(msg["Body"])
            pk = body["pk"]

            if pk in connections:
                sqs.delete_message(
                    QueueUrl=QUEUE_URL,
                    ReceiptHandle=msg["ReceiptHandle"]
                )
                continue

            conn_data = await try_acquire_lease(pk)
            if conn_data and conn_data.get("desired_state") == "STARTED":
                asyncio.create_task(
                    manage_websocket(
                        pk, conn_data["ws_url"],
                        conn_data.get("last_seq", 0)
                    )
                )
            sqs.delete_message(
                QueueUrl=QUEUE_URL,
                ReceiptHandle=msg["ReceiptHandle"]
            )
Connection management
Once a worker acquires a lease, it opens a WebSocket connection to the upstream source and runs three concurrent async tasks for the lifetime of that connection. These three tasks work together to keep the connection alive, process incoming data, and detect when the connection should stop.
1. Heartbeat loop
The heartbeat loop calls renew_lease every HEARTBEAT_EVERY seconds. If renewal fails, meaning another worker has taken ownership or the lease record has changed, the loop exits immediately. This is the mechanism by which a worker detects that it has lost ownership of a connection mid-flight.
2. Receive loop
The receive loop processes every incoming message from the upstream WebSocket source. Each message is written to a separate DynamoDB messages table with the connection ID, a timestamp, the message data, and the worker ID. The loop runs continuously until the WebSocket connection closes or an error occurs.
3. Desired state checker
Every 10 seconds, the desired state checker reads the connection record from DynamoDB. If desired_state has been set to STOPPED, meaning an external system sent a STOP event through the API, the loop exits, signaling that this connection should be closed even though the WebSocket itself is still open.
How the three tasks interact
All three tasks run concurrently using asyncio.gather. When any one of the three tasks returns or raises an exception, asyncio.gather completes and execution moves to the finally block. This means a single trigger, lease loss, WebSocket closure, or a STOP event, is sufficient to cleanly end the connection regardless of the state of the other two tasks.
Cleanup
The finally block always runs, regardless of how the connection ended. It releases the DynamoDB lease so other workers can acquire the connection immediately and removes the connection from the worker’s local tracking dictionary.
The following code shows the full connection management implementation:
async def manage_websocket(pk: str, ws_url: str, last_seq: int):
    connections[pk] = {"pk": pk, "ws_url": ws_url, "ws": None}

    try:
        async with websockets.connect(ws_url) as ws:
            connections[pk]["ws"] = ws

            async def heartbeat_loop():
                while not shutdown_event.is_set():
                    await asyncio.sleep(HEARTBEAT_EVERY)
                    if not await renew_lease(pk):
                        print(f"[{pk}] Lost lease, closing")
                        return

            async def receive_loop():
                async for msg in ws:
                    data = json.loads(msg)
                    messages_table.put_item(Item={
                        "pk": pk,
                        "sk": str(now_ms()),
                        "message_data": data.get("data", str(data)),
                        "timestamp_ms": now_ms(),
                        "worker_id": WORKER_ID,
                    })

            async def check_desired_state():
                while not shutdown_event.is_set():
                    await asyncio.sleep(10)
                    resp = table.get_item(Key={"pk": pk})
                    if resp.get("Item", {}).get("desired_state") == "STOPPED":
                        return

            await asyncio.gather(
                heartbeat_loop(),
                receive_loop(),
                check_desired_state()
            )

    except Exception as e:
        print(f"[{pk}] WebSocket error: {e}")
    finally:
        await release_lease(pk)
        connections.pop(pk, None)
Production note: The code samples use print() for clarity. In production, replace these with structured logging (the Python logging module or Amazon CloudWatch Logs) and emit CloudWatch metrics for lease acquisition failures and reconnection events to support operational alerting.
Scaling note: The per-connection check_desired_state() loop shown here works for small fleets. At scale, replace individual GetItem calls with a single centralized loop that uses BatchGetItem to check the state of all active connections in one call, reducing DynamoDB reads from N calls every 10 seconds to 1 batched call.
Orphan reconciliation
The reconciliation loop is the safety net of the system. It runs on every worker periodically, independent of the SQS polling loop. Its sole purpose is to find connections that should be active but have no current owner, and reacquire them.
The loop queries the GSI for all records where desired_state = STARTED and lease_expires_at_ms is less than the current time. These are connections that an external system has requested as active, but whose lease has either never been claimed or has expired without renewal, indicating the previous owner is no longer running.
For each orphaned connection found, the worker calls try_acquire_lease. Because try_acquire_lease uses a DynamoDB conditional write, multiple workers can safely run reconciliation concurrently without risk of double-claiming. Exactly one worker succeeds for each connection. The others receive a ConditionalCheckFailedException and move on.
The reconciliation interval (default: 60 seconds) determines the maximum recovery time for unexpected worker terminations. A worker that crashes without running its graceful shutdown handler leaves its leases to expire naturally after LEASE_SECONDS (default: 20 seconds). The reconciliation loop then picks up those connections within the next 60-second cycle, giving a worst-case recovery time of approximately 80 seconds (20 seconds lease expiry plus up to 60 seconds reconciliation interval).
The following code shows the full implementation:
async def reconcile_orphaned_connections():
    while not shutdown_event.is_set():
        await asyncio.sleep(RECONCILE_EVERY)

        if len(connections) >= MAX_CONNECTIONS:
            continue

        resp = table.query(
            IndexName=GSI_NAME,
            KeyConditionExpression=(
                "desired_state = :state "
                "AND lease_expires_at_ms < :now"
            ),
            ExpressionAttributeValues={
                ":state": "STARTED",
                ":now": now_ms()
            },
            Limit=RECONCILE_PAGE_SIZE,
        )

        for item in resp.get("Items", []):
            pk = item["pk"]
            if pk not in connections and len(connections) < MAX_CONNECTIONS:
                conn_data = await try_acquire_lease(pk)
                if conn_data:
                    asyncio.create_task(
                        manage_websocket(
                            pk, conn_data["ws_url"],
                            conn_data.get("last_seq", 0)
                        )
                    )
Figure 3: Automatic failover through orphan reconciliation
Graceful shutdown
When ECS sends a SIGTERM signal during a rolling deployment or scale-in event, the worker has a limited window to clean up before the container is forcibly terminated. Rather than dropping connections abruptly and waiting for leases to expire naturally, the worker performs a coordinated shutdown in three steps.
Step 1: Signal propagation
The signal_handler function sets a shared shutdown_event when SIGTERM is received. This event is checked by every running loop across all active connections. The heartbeat loop, the desired state checker, and the reconciliation loop all exit their while not shutdown_event.is_set() loops as soon as the event is set. No additional per-connection shutdown logic is needed. The shared event propagates the shutdown signal automatically to all concurrent tasks.
Step 2: Parallel cleanup
Rather than closing connections and releasing leases sequentially, which would take longer as the number of active connections grows, the worker closes all WebSocket connections and releases all leases concurrently using asyncio.gather. For a worker managing hundreds of connections, this keeps the total shutdown time roughly constant regardless of connection count.
Step 3: Immediate lease release
During graceful shutdown, the worker sets lease_expires_at_ms = 0 for each released connection. A value of 0 means the lease appears already expired to any worker running a reconciliation query. Other workers in the fleet pick up the released connections on their next reconciliation cycle rather than waiting for the original lease duration (default: 20 seconds) to elapse naturally.
Contrast with unexpected termination
Graceful shutdown is the fast path. When a worker exits cleanly through SIGTERM, connections are available for reacquisition within one reconciliation cycle. When a worker crashes unexpectedly without running the shutdown handler, leases expire naturally after LEASE_SECONDS (default: 20 seconds) and are then picked up by the reconciliation loop. Both paths converge on the same outcome, another worker acquires the connection, but graceful shutdown is significantly faster.
The following code shows the full graceful shutdown implementation:
shutdown_event = asyncio.Event()

def signal_handler(signum, frame):
    shutdown_event.set()

async def graceful_shutdown():
    await shutdown_event.wait()
    tasks = []
    for pk, conn in list(connections.items()):
        if conn.get("ws"):
            tasks.append(conn["ws"].close())
        tasks.append(release_lease(pk))
    await asyncio.gather(*tasks, return_exceptions=True)
Setting shutdown_event causes the heartbeat loops and state checkers to exit their while not shutdown_event.is_set() loops. The graceful_shutdown function then closes the active WebSocket connections and releases its leases in parallel. Released leases have lease_expires_at_ms = 0, which means the reconciliation loop on other workers picks them up on its next cycle rather than waiting for the original lease to expire.
Scaling the fleet
Each worker publishes a custom CloudWatch metric with its active connection count:
An AWS Application Auto Scaling target tracking policy scales the fleet based on the average ActiveConnections metric across all workers. When the average exceeds the target (for example, 700 connections per task), ECS launches additional tasks. New tasks start their SQS polling and reconciliation loops, picking up new connections and rebalancing the fleet.
Figure 4: Automatic scaling based on active connection count
Scale-in is safe because of the lease pattern. When ECS terminates a task, the worker receives SIGTERM, releases its leases, and other workers acquire the freed connections through reconciliation.
Configuration
Value
Rationale
Lease duration
20 seconds
Long enough to survive brief network hiccups, short enough for fast failover
Heartbeat interval
5 seconds
Renew well before expiration (4x safety margin)
Reconciliation interval
60 seconds
Balance between recovery speed and DynamoDB read cost
Max connections per task
700
Based on memory and CPU profiling per connection
Scale-out cool down
2 minutes
Prevent thrashing during traffic spikes
Scale-in cool down
15 minutes
Allow connections to stabilize before removing capacity
Tuning guidance. These values represent a starting point. Adjust based on your requirements:
Lease duration: Start with 20s. Reduce for faster failover, increase if network hiccups cause false expirations.
Heartbeat interval: Keep below lease duration. A 4:1 ratio (lease:heartbeat) gives 4 renewal attempts before expiry.
Reconciliation interval: Start with 60s. Reduce for faster recovery from unexpected terminations, increase to lower DynamoDB read cost.
Max connections per task: Start with 100 and increase while monitoring memory and CPU utilization in CloudWatch Container Insights. Each WebSocket connection typically consumes 2-5 MB of memory depending on message throughput.
DynamoDB cost considerations
The dominant cost driver in this architecture is heartbeat writes. Each active connection generates one update_item call per heartbeat interval, consuming 1 WCU. At the default 5-second heartbeat interval:
Active connections
WCUs/second
Approx. monthly cost (on demand)
Approx. monthly cost (provisioned)
100
20
~$65
~$10
500
100
~$325
~$47
2,000
400
~$1,300
~$190
For production deployments at sustained high connection counts, use provisioned capacity with Auto Scaling rather than on-demand pricing. Heartbeat writes are predictable and consistent, which makes them well-suited to provisioned throughput. Configure Auto Scaling on your provisioned capacity to track connection count changes as the fleet scales.
To reduce cost, consider the following adjustments:
Increase the heartbeat interval. Doubling the heartbeat interval from 5 seconds to 10 seconds halves WCU consumption. Maintain the 4:1 lease-to-heartbeat ratio by also doubling the lease duration. This increases the failover window proportionally.
Increase the reconciliation interval. Increasing from 60 seconds to 120 seconds halves RCU consumption from reconciliation queries. This slows recovery from unexpected terminations.
Use BatchGetItem for desired state checks. Replace the per-connection get_item calls in the check_desired_state loop with a single BatchGetItem call covering all active connections. This reduces RCU consumption from N reads per cycle to 1 batched read per cycle.
GSI queries during reconciliation use eventually consistent reads by default, which halves the RCU cost compared to strongly consistent reads. Monitor your GSI read consumption in the DynamoDB console and adjust the reconciliation page size and interval to stay within your cost targets.
Conclusion
Managing long-lived WebSocket connections at scale requires explicit ownership tracking, automatic failover, and coordination across a fleet of workers. This post showed you a pattern that addresses these challenges using DynamoDB conditional writes as a distributed lease mechanism.
Key takeaways:
You can use DynamoDB conditional writes for atomic distributed coordination without external lock services. The ConditionExpression on update_item helps confirm one worker owns each connection at a time.
The heartbeat and reconciliation pattern handles the full failure spectrum. Lease expiration detects unexpected worker terminations. Graceful shutdown handles rolling deployments. New workers acquire leases and departing workers release them, making scaling safe.
This pattern applies to systems that manage long-lived WebSocket connections at scale: real-time transcription, IoT data ingestion, financial feed processing, or live event streaming.
Getting started
The complete implementation, including the worker application, Lambda event router, and Terraform templates for the DynamoDB table, SQS queue, and ECS cluster, is available in the GitHub repository. Follow the instructions in the repository README to deploy the infrastructure and validate the lease lifecycle with a small set of test connections.
For further enhancements, add distributed tracing with AWS X-Ray for end-to-end visibility across workers, and implement reconnection logic with upstream replay or offset-based resumption to handle data gaps between worker failure and recovery.
If you run search on Amazon CloudSearch, now is the time to plan your migration to Amazon OpenSearch Serverless. Modern search has moved on to capabilities beyond what CloudSearch provides: semantic and hybrid search, Retrieval Augmented Generation (RAG), and agentic search. OpenSearch Serverless gives you all of these with automatic scaling on a pay-for-what-you-use basis. You don’t need to choose or maintain infrastructure. OpenSearch Serverless maintains the hands-off, operational simplicity of CloudSearch.
This post shows you how to migrate your CloudSearch domain to an Amazon OpenSearch Serverless collection. We walk you through assessing your CloudSearch configuration, creating an OpenSearch Serverless collection with explicit index mappings, converting your documents and queries, configuring security policies, loading your data with Amazon OpenSearch Ingestion, and validating the migration before cutting over.
Key differences to note
Independent scaling – OpenSearch Serverless scales indexing and search compute independently and can scale compute to zero when a collection is idle (you still pay for storage). For the cost structure, see Managing capacity limits for Amazon OpenSearch Serverless.
Layered security model – OpenSearch Serverless applies encryption, network, and data access policies at separate layers. For the security model, see Security in Amazon OpenSearch Serverless.
Prerequisites
To follow along with this post, you need the following:
An AWS account.
An existing Amazon CloudSearch domain with indexed data.
Source data available in a durable store such as Amazon Simple Storage Service (Amazon S3) or Amazon DynamoDB (CloudSearch doesn’t provide a built-in export or backup feature, so your original source data is required to re-ingest into OpenSearch).
AWS Identity and Access Management (IAM) permissions to create and manage Amazon OpenSearch Serverless collections, encryption policies, network policies, and data access policies.
An Amazon OpenSearch Ingestion pipeline (or alternative ingestion method) for loading data.
Plan the migration
Planning is where you decide what success means: minimal downtime, no data loss, current functionality preserved, and custom configurations carried over. You don’t need to plan for infrastructure because OpenSearch Serverless provisions and scales compute for you. Your main planning task is to assess your current CloudSearch configuration so you can reproduce its behavior on the target.
Document your existing setup from the Amazon CloudSearch console. Record the current instance type, the partition count, and the replication count. Capture the total document count and overall data size, and record every field definition, including field types and the search, facet, and sort settings for each field. Note any analyzers, synonyms, stopwords, or custom rank expressions. Note whether you use the 2011 or the 2013 CloudSearch API version, because the 2013 API added faceting and filtering features that change how you model the target.
The migration involves four main concerns: your source data format, your queries, your field definitions, and your access policies. Before you plan the details, it helps to see the whole migration at once. The following diagram maps the migration across four phases: your source CloudSearch environment, the migration pipeline that converts and moves your data, the OpenSearch Serverless target, and cutover and operations.
Figure 1: The migration workflow across four phases
In the source environment, you assess your CloudSearch configuration and back up your source data (Amazon S3, Amazon DynamoDB, or another store). Note the Source Data Format (SDF), the URL-based query syntax, and the IAM access policies you need to carry over. In the migration pipeline, you map field types, convert the data format from CloudSearch JSON to OpenSearch-compatible JSON, convert your queries to the OpenSearch query domain-specific language (DSL), configure security, bulk-ingest the data, and validate the result. The OpenSearch Serverless target holds the collection, index mappings, ingested documents, and the encryption, network, and data access policies, and it scales with your workload on a pay-per-use basis. In cutover and operations, you update your application to the new endpoint and clients, monitor with Amazon CloudWatch, and decommission CloudSearch once no traffic remains.
Model your data in OpenSearch Service
OpenSearch Service uses index mappings to define the fields and data types in an index. Because you know your CloudSearch schema, define the target mapping explicitly when you create the index. Create the index and set its mapping in a single request, and set dynamic to strict so OpenSearch rejects any document that contains a field you did not define. Strict mapping catches schema drift at ingest time, avoiding the default OpenSearch behavior of creating new mappings for undefined fields.
The following table maps CloudSearch field types to their OpenSearch Service equivalents.
CloudSearch
OpenSearch Service equivalent
Notes
text
text
Text is tokenized. Stemming, synonyms, and stopwords apply. Good for matching user terms.
literal
keyword
Not tokenized. Good for exact-match search.
int
integer
Use for ranking, faceting, and narrowing.
double
float or double
.
date
date
.
boolean
boolean
.
latlon
geo_point
.
text-array
text
OpenSearch handles arrays natively, so map to the base text type.
literal-array
keyword
OpenSearch handles arrays natively, so map to the base keyword type.
multi-value
nested or object
.
long
long
.
binary
binary
.
Two mapping details deserve attention. First, pick the smallest numeric type that fits your data rather than copying the widths CloudSearch uses. CloudSearch stores integers as 64-bit values, but few datasets hold numbers that large. A long or a double consumes more disk than an integer, a short, or a float with no benefit when the values are small. Evaluate the actual range of each field and choose the narrowest type that holds it. Reserve long for values that genuinely exceed the roughly 2.1 billion ceiling of integer, and use float instead of double unless you need double precision. Smaller types shrink your index and speed up queries.
Second, if you sort or aggregate on a text field, add a keyword sub-field. The preceding example mapping has a keyword subfield for the title field. You access the field using dot notation: title.keyword. OpenSearch doesn’t sort or aggregate analyzed text fields by default.
As noted earlier, if you run several CloudSearch domains, model each one as a separate index within a single OpenSearch Serverless collection to consolidate them.
Move your data
Migrating to OpenSearch Service is a re-ingestion: you convert your source documents and index them into the collection you created. CloudSearch doesn’t provide a built-in backup or snapshot feature. It relies on the documents you send through the indexing process, so before you migrate, make sure your source data is available in a durable store such as Amazon S3, Amazon DynamoDB, or another database.
The conversion is a format translation. CloudSearch accepts data in SDF as JSON or XML, where a document batch is a collection of add and delete operations. The JSON that CloudSearch uses differs from the JSON that OpenSearch Service expects, so you must transform each source document into an OpenSearch document whose fields match the index mapping you defined earlier. Handle the same details the mapping calls out: emit each numeric value so it fits the narrow type you chose for its field rather than a wide long or double, format dates to match your date mapping, and drop or rename any field that your strict mapping doesn’t define.
Figure 2: CloudSearch batch format (left) compared to OpenSearch batch format (right)
You can write a small conversion script. Have the script write its output to an Amazon S3 bucket so the converted documents live in a durable store you can re-ingest from as many times as you need.
With your converted documents in Amazon S3, use Amazon OpenSearch Ingestion to load them. Amazon OpenSearch Ingestion is a feature of Amazon OpenSearch Service that you can use to ingest, filter, transform, enrich, and route data to an Amazon OpenSearch Service domain or an OpenSearch Serverless collection. Configure an OpenSearch Ingestion pipeline with an Amazon S3 source (you can use an OpenSearch Ingestion blueprint to get started) that reads your converted documents. Let its built-in processors apply any final transformation before the pipeline writes to your collection. A managed pipeline reading from Amazon S3 gives you a repeatable, restartable load without operating ingestion infrastructure, which makes it the recommended path for most migrations.
If you prefer to load data directly, OpenSearch Service exposes a REST API, so you can index documents with a standard client such as curl or with the OpenSearch client libraries for many languages. Direct indexing is convenient for a small dataset or a quick test, but an Amazon S3 source with OpenSearch Ingestion is the better choice for a production migration.
Convert your queries
CloudSearch uses a URL-based query format. You pass a query parameter in the URL and submit either a simple string search or a JSON-formatted query. OpenSearch Service uses a REST API and the OpenSearch query DSL in the request body, which gives you compound queries, function scoring, and richer relevance control. You can use generative AI coding assistants to help with this translation. Provide your CloudSearch query patterns, and the model generates the equivalent OpenSearch query DSL, which you then validate against your test cases.
Query syntax changes
CloudSearch appends parameters such as sort to the query URL, while OpenSearch expresses sorting, filtering, and boosting as explicit elements of the request body. For example, a title search for “shakespeare” in CloudSearch looks like the following.
To keep result sets consistent after migration, set the default operator to AND in OpenSearch to match the default query behavior of CloudSearch. The following table shows common CloudSearch query patterns and their OpenSearch Service equivalents, using a sample IMDB movies dataset.
Boosting is useful when you want certain fields or terms to carry more weight in relevance scoring. A higher boost value means the term contributes more to the score. OpenSearch also supports sorting by _score (relevance), which is the default when you specify no sort. For the full query language, see the OpenSearch query DSL documentation.
Configure security
CloudSearch uses AWS Identity and Access Management policies to control access to its configuration and domain service APIs. You attach user-based policies to an IAM role, user, or group, and the document, search, and suggest actions in those policies control access to the CloudSearch APIs.
OpenSearch Serverless applies security through policies at several layers.
Collections: Encrypted at rest by default, using either an AWS owned key or a customer managed key defined in an encryption policy.
Network policies: Define whether a collection is reachable privately through a virtual private cloud (VPC) endpoint or over the internet.
Data access policies: Control which IAM principals and Security Assertion Markup Language (SAML) identities can create indexes and read or write data in the collection.
Amazon OpenSearch Service provisioned domains also offer fine-grained access control, with role-based access control and security at the index, document, and field level. For OpenSearch Serverless, data access policies provide collection-level and index-level permissions, controlling which IAM principals and SAML identities can create, read, or write data within a collection.
Validate the migration
Validation confirms that the migration is complete and correct before you send production traffic to OpenSearch Serverless. Work through five kinds of validation.
Documents: Check your document count. Your OpenSearch Serverless indexes should have the same count as your CloudSearch indexes.
Queries: Translate your most important queries and run them manually against your collection. Spot check the output for the presence of important results.
Ranking: Check the order of results, especially for queries with custom rank functions or field weighting. Results might not match exactly, so look for anything that’s incorrect.
Latency: Ideally you should tee your production traffic to your Serverless collection to get real latency metrics. Worst case, generate at least 100,000 synthetic queries across all your query types and run them. Monitor OpenSearch Compute Unit (OCU) consumption with Amazon CloudWatch to understand your cost profile.
To validate search functionality, run the same query against both systems and compare the results. Reuse the query pairs from the conversion step so you exercise the syntax differences directly. For example, to check a numeric range against the sample IMDB movies dataset, run the following query in CloudSearch.
https://my-cloudsearch-domain.us-east-1.cloudsearch.amazonaws.com/2013-01-01/search?q=rating: [7 TO 9]&size=10
Run the equivalent query DSL against your OpenSearch Serverless collection.
Confirm that both queries return the same set of movies. Then repeat the comparison for a query that exercises relevance, such as the boosted query from the conversion step, and confirm the top results appear in the same order.
When validation passes, update your application to use the OpenSearch Serverless endpoint and the query DSL, and switch from the CloudSearch SDK to the OpenSearch client libraries. After cutover, confirm that no application still points to a CloudSearch endpoint, retain your source data backups in Amazon S3 for rollback, and then delete the CloudSearch domain.
Operating OpenSearch Serverless in production is lighter than operating a domain, because OpenSearch Serverless scales compute for you and you do not tune shards, instance types, or capacity. Your focus shifts to cost and search quality. Monitor OCU consumption and search latency with Amazon CloudWatch, and set alarms on the thresholds that matter to you. Review OCU usage patterns to understand cost and find optimization opportunities, and set capacity limits on the collection to cap the maximum OCUs it can consume. For guidance, see Managing capacity limits for Amazon OpenSearch Serverless and Monitoring Amazon OpenSearch Serverless.
Cost considerations
With OpenSearch Serverless, you pay only for the compute and storage your workload consumes, and OpenSearch Serverless charges for compute and storage separately. OpenSearch Serverless scales indexing compute and search compute independently, so a write-heavy or a read-heavy workload scales only the dimension it needs, and compute can scale to zero when a collection is idle, in which case you pay only for storage. To share hardware across workloads, place collections in a collection group so they draw from the same compute rather than each provisioning its own. For pricing and unit details, see Amazon OpenSearch Service pricing.
Clean up
Because you’re migrating to OpenSearch Serverless, the resources that you’ve created will likely become your production resources. If not, delete any OpenSearch Serverless collections and S3 buckets you created to avoid incurring ongoing cost.
Conclusion
In this post, you saw how Amazon CloudSearch and Amazon OpenSearch Serverless compare, and how the concepts you rely on in CloudSearch (field types, query syntax, autoscaling, and access control) translate into OpenSearch Service. You assess your CloudSearch configuration, model your data with explicit OpenSearch mappings, move your converted documents into the collection with OpenSearch Ingestion, convert your URL-based queries into the OpenSearch query DSL, configure security, and validate before cutover. OpenSearch Serverless gives you the hands-off operational model you have with CloudSearch, and adds richer query capabilities, granular data access policies, and automatic scaling. To get started, create an OpenSearch Serverless collection on the AWS Management Console and follow the steps in this post.
In this post, you learn how to reduce Apache Spark query execution time with Apache Iceberg materialized views without changing a single SQL query.
Organizations running analytical workloads on their data lakes often hit a common wall: queries that are slow and costly, yet difficult to rewrite by hand. Multi-table joins, heavy aggregations, and window functions over large fact tables all drive up execution times, but the SQL behind them often can’t be changed. It might come from business intelligence (BI) dashboards, packaged independent software vendor (ISV) applications, or legacy reports, where editing the source introduces regression risk that outweighs the performance gain.
Starting with Amazon EMR 7.12.0 and AWS Glue 5.1, you can accelerate these queries without rewriting them. Automatic query rewrite analyzes the logical plan of each incoming query and compares it against a metadata cache of available MVs. When the optimizer finds a materialized view (MV) that satisfies all or part of a query, it rewrites the plan to read from that MV instead of the base tables. Matches can be structural (aggregations and joins) or exact (more complex patterns like window functions). If no MV matches, the original query runs unchanged with no impact on correctness.
If you have previously tried to speed up slow analytical queries, you might have considered one of the following alternatives. Here is how automatic query rewrite compares:
Give a high-level overview of how automatic query rewrite works in Apache Spark.
Walk through a concrete example, showing how the same query can benefit from MVs at different levels of coverage.
Discuss the trade-offs so you can choose the right MV shape for your workload.
Prerequisites
To use automatic query rewrite with Iceberg materialized views, you need:
Amazon EMR release 7.12.0 or later, or AWS Glue 5.1 or later.
Source tables in Apache Iceberg or Parquet format, registered in the AWS Glue Data Catalog, in the same AWS Region and account as the materialized view. Parquet source tables are supported for automatic query rewrite starting with Amazon EMR 7.14.0 and AWS Glue 8.1.
An Amazon Simple Storage Service (Amazon S3) Tables (a capability of Amazon S3) bucket, or an S3 general purpose bucket, for the materialized view data.
Permissions for the definer role. You can use AWS Identity and Access Management (IAM) policies or AWS Lake Formation.
Automatic query rewrite turned on in your Spark session: --conf spark.sql.optimizer.answerQueriesWithMVs.enabled=true.
For Parquet source tables, set spark.sql.materializedView.v1SourceTables.enabled=true and spark.sql.materializedView.v1ETagVersioning.enabled=true.
Here is how MVs and automatic query rewrite work together:
You define a SQL query with aggregations, joins, or filters across your supported source tables.
AWS Glue Data Catalog stores the precomputed results as an Apache Iceberg table in your Amazon S3 bucket. You can store it in a general purpose S3 bucket or in Amazon S3 Tables. Any Apache Iceberg-compatible query engine can read the materialized view, including Amazon Athena, Amazon EMR, AWS Glue, Amazon Redshift, and Iceberg-compatible third-party query engines. Automatic query rewrite is available on the AWS optimized Spark runtime in Amazon Athena, Amazon EMR, and AWS Glue. Other engines can query the materialized view directly, but they don’t rewrite queries to use it automatically.
Automatic refresh keeps the MV current on a schedule that you define, for example SCHEDULE REFRESH EVERY 1 DAY. You set it at creation time or later with ALTER MATERIALIZED VIEW ... ADD SCHEDULE REFRESH. At that scheduled time, the refresh process checks the current Apache Iceberg snapshot ID or Parquet file ETags and refreshes the MV when it detects source-table changes.
Automatic query rewrite redirects matching queries to the MV at query optimization time. Automatic query rewrite in Apache Spark uses two matching strategies:
Structural rewrite (adapted from Amazon Redshift) handles an MV defined as a single SELECT-FROM-WHERE-GROUP-BY block over INNER joins. The optimizer can roll up an MV’s aggregates to a coarser grain and pull extra query predicates up onto the MV scan.
Exact-match rewrite handles MVs defined as other shapes, such as window functions and outer joins, by matching a canonicalized form of the MV body against subtrees of the query plan.
When the optimizer evaluates a query, it consults a metadata cache of MVs from the configured catalogs and chooses the best match. It also checks MV staleness during optimization. It skips stale MVs, so rewrite won’t return stale results. If no MV matches, the original query runs unchanged.
Note that automatic query rewrite is opt-in: set spark.sql.optimizer.answerQueriesWithMVs.enabled=true when creating the Apache Spark session.
Example: One query with three potential MVs
An MV doesn’t need to cover an entire query to help it. Automatic query rewrite in Apache Spark operates on subtrees: when an MV matches a portion of your query plan, the rewriter substitutes that subtree and lets the rest of the query run on the rewrite output unchanged. The same query can therefore be served by many possible MV designs, each making a different trade-off between per-query speedup, storage cost, and reuse across other queries.
To make this concrete, consider a typical analytics query: “Top 100 preferred US customers by total store spending.” It joins fact and dimension tables, applies two selective filters on the customer dimension, aggregates per customer, ranks the result with a window function, and keeps only the top 100:
SELECT c_customer_id, total_revenue, num_transactions, avg_purchase, revenue_rank
FROM (
    SELECT cust.c_customer_id,
        SUM(sales.ss_quantity * sales.ss_sales_price) AS total_revenue,
        COUNT(*) AS num_transactions,
        AVG(sales.ss_quantity * sales.ss_sales_price) AS avg_purchase,
        RANK() OVER (ORDER BY SUM(sales.ss_quantity * sales.ss_sales_price) DESC) AS revenue_rank
    FROM base_catalog.base_db.store_sales sales
    INNER JOIN base_catalog.base_db.customer cust
        ON sales.ss_customer_sk = cust.c_customer_sk
    WHERE cust.c_birth_country = 'UNITED STATES'
        AND cust.c_preferred_cust_flag = 'Y'
    GROUP BY cust.c_customer_id
) ranked
WHERE revenue_rank <= 100
ORDER BY revenue_rank;
Query 1: The original query. Top 100 preferred US customers by total store spending, before any materialized view.
Three MV designs cover progressively more of this query, from a single-table pre-aggregate to the full query body itself:
Tier 1: Pre-aggregate store_sales only, no join, no filter. This tier is a single-table aggregate of store_sales at customer-surrogate-key grain. The query still must join the customer table, apply both filters, re-aggregate at c_customer_id grain, and run the window function.
CREATE MATERIALIZED VIEW mv_catalog.mv_db.customer_tier_1 AS
SELECT ss_customer_sk,
    SUM(ss_quantity * ss_sales_price) AS sum_revenue,
    COUNT(ss_quantity * ss_sales_price) AS count_revenue,
    COUNT(*) AS num
FROM base_catalog.base_db.store_sales
GROUP BY ss_customer_sk;
Tier 1 MV: Single-table pre-aggregate of store_sales by customer surrogate key (no join, no filter).
The following plans compare the original query plan to the rewritten plan:
Window, filter, Sort
+- Aggregate by c_customer_id
:  total_revenue = SUM(ss_quantity * ss_sales_price)
:  num_transactions = COUNT(*)
:  avg_purchase = AVG(ss_quantity * ss_sales_price)
+- Project
   +- Join Inner ON ss_customer_sk = c_customer_sk
      :- BatchScan store_sales <- reads the large store_sales table
      +- Filter c_birth_country='UNITED STATES' AND c_preferred_cust_flag='Y'
         +- BatchScan customer
Plan 1: Original plan. Scans the large store_sales table.
Window, filter, Sort
+- Aggregate by c_customer_id <- rolls up pre-aggregated sums
:  total_revenue = SUM(sum_revenue) <- sum of sum_revenue
:  num_transactions = SUM(num) <- sum of num
:  avg_purchase = SUM(sum_revenue) / SUM(count_revenue) <- sum of sum_revenue / sum of count_revenue
+- Project
   +- Join Inner ON ss_customer_sk = c_customer_sk
      :- BatchScan customer_tier_1 <- reads pre-aggregated MV
      +- Filter c_birth_country='UNITED STATES' AND c_preferred_cust_flag='Y'
         +- BatchScan customer
Plan 2: Rewritten plan (Tier 1). Reads the pre-aggregated customer_tier_1 MV.
Tier 2: Pre-join store_sales x customer, pre-apply one filter (c_preferred_cust_flag = ‘Y’). The middle tier pre-joins both tables and bakes in the preferred-customer filter. The query still must apply the country filter as a residual on the MV scan and run the RANK() window.
CREATE MATERIALIZED VIEW mv_catalog.mv_db.customer_tier_2 AS
SELECT cust.c_customer_id, cust.c_birth_country,
    SUM(sales.ss_quantity * sales.ss_sales_price) AS sum_revenue,
    COUNT(sales.ss_quantity * sales.ss_sales_price) AS count_revenue,
    COUNT(*) AS num
FROM base_catalog.base_db.store_sales sales
INNER JOIN base_catalog.base_db.customer cust
    ON sales.ss_customer_sk = cust.c_customer_sk
WHERE cust.c_preferred_cust_flag = 'Y'
GROUP BY cust.c_customer_id, cust.c_birth_country;
Tier 2 MV: Pre-joins store_sales and customer, with the preferred-customer filter applied.
Rewritten query plan:
Window, filter, Sort
+- Aggregate by c_customer_id <- rolls up pre-aggregated sums
:  total_revenue = SUM(sum_revenue) <- sum of sum_revenue
:  num_transactions = SUM(num) <- sum of num
:  avg_purchase = SUM(sum_revenue) / SUM(count_revenue) <- reads pre-aggregated MV
+- Filter c_birth_country='UNITED STATES' [residual filter on MV scan]
   +- BatchScan customer_tier_2 <- reads pre-aggregated MV
Plan 3: Rewritten plan (Tier 2). Country filter applied as a residual on the MV scan.
Tier 3: Match the entire query, including the window function and top N filter. This is the most specific tier. The MV body is the target query verbatim (minus the top-level ORDER BY, which is meaningless for a stored set). The MV stores the top-ranked rows the query asks for (rank ≤ 100).
CREATE MATERIALIZED VIEW mv_catalog.mv_db.customer_tier_3 AS
SELECT c_customer_id, total_revenue, num_transactions, avg_purchase, revenue_rank
FROM (
    SELECT cust.c_customer_id,
        SUM(sales.ss_quantity * sales.ss_sales_price) AS total_revenue,
        COUNT(*) AS num_transactions,
        AVG(sales.ss_quantity * sales.ss_sales_price) AS avg_purchase,
        RANK() OVER (ORDER BY SUM(sales.ss_quantity * sales.ss_sales_price) DESC) AS revenue_rank
    FROM base_catalog.base_db.store_sales sales
    INNER JOIN base_catalog.base_db.customer cust
        ON sales.ss_customer_sk = cust.c_customer_sk
    WHERE cust.c_birth_country = 'UNITED STATES'
        AND cust.c_preferred_cust_flag = 'Y'
    GROUP BY cust.c_customer_id
) ranked
WHERE revenue_rank <= 100;
Tier 3 MV: Stores the exact ranked output of the query (exact-match path).
This tier exercises the exact-match rewrite path: the rewriter canonicalizes the MV body and matches it against the query’s logical plan.
Plan 4: Rewritten plan (Tier 3). Reads around 100 stored rows.
The trade-off
The three tiers trade per-query speedup against reuse and storage. In our testing on TPC-DS 3 TB, we observed the following:
MV design
Pre-computed
Reuse
Per-query speedup
MV size
Baseline (no MV)
nothing
n/a
1x
n/a
Tier 1: store_sales agg by customer surrogate key
aggregate of all sales per customer
broadest: any per-customer aggregation
~5x faster
0.07% of store_sales for TPC-DS 3 TB
Tier 2: store_sales x customer agg, one filter pre-applied
join + aggregate, preferred customers only
medium: any country filter, preferred customers
~10x faster
0.04% of store_sales for TPC-DS 3 TB
Tier 3: entire query body verbatim (exact-match)
exact ranked output of this query
narrowest: only this exact query shape
20x+ faster
negligible (only 100 rows)
Performance measured on TPC-DS 3 TB. Speedup is the ratio of baseline execution time to MV-accelerated execution time. Results might vary based on data characteristics, cluster size, and query complexity.
In addition, MVs incur additional cost. Each one runs a query against your source tables once and stores the result. The more pre-computation it does (joining more tables, applying more filters), the more time it takes.
The following chart plots per-query speedup and creation time for the three tiers in our testing on TPC-DS 3 TB. Per-query speedup rises steadily, from about 5x at Tier 1 to over 20x at Tier 3. Creation time doesn’t follow the same pattern: it peaks at Tier 2. Tier 2 pre-joins and aggregates all preferred customers across every country, so it materializes the most data work. Tier 3 applies both filters, so it processes far fewer rows and costs less to create.
Figure 1: Per-query speedup and creation time across the three materialized view tiers, measured on TPC-DS 3 TB
Start by identifying one expensive query that runs repeatedly with stable filters. It is likely a good candidate for an exact-match MV.
Validating automatic query rewrite
To confirm that your query benefited from automatic rewrite:
Query plan inspection: Check the query’s optimized logical plan or physical plan for a leaf scan node referencing the MV (for example, BatchScan mv_catalog.mv_db.your_mv_name). If the MV appears as a scan source, rewrite succeeded.
Log confirmation (Amazon EMR 7.14.0+): Look for INFO-level log entries such as AQMV outcome: rewritten=true, mvs=[mv_name], duration=12ms.
No-rewrite diagnostics (Amazon EMR 7.14.0+): If rewrite didn’t occur, check the MVRewriteMetricsEvent in the Apache Spark Event Log for the specific reason the optimizer skipped the MV.
If you have set spark.sql.optimizer.answerQueriesWithMVs.enabled=true but your query still runs against the base tables, check the following common causes:
Write commands block rewrite by default. INSERT and MERGE statements don’t trigger rewrite. Set spark.sql.optimizer.answerQueriesWithMVs.commandBlockingEnabled=false to turn on rewrite within write command subqueries.
The MV is stale. Rewrite skips the MV when one or more source tables have changed since its last refresh. Wait for the next scheduled refresh, or force an immediate refresh with REFRESH MATERIALIZED VIEW <mv_name>.
Heuristic candidate filtering. The optimizer uses heuristic checks to narrow the set of MV candidates before attempting a full match. In some cases, an MV that could benefit the query might be filtered out early by these heuristics.
Spark version mismatch (Amazon EMR 7.13.0+). Automatic query rewrite skips MVs whose stored IMV_sparkVersion does not match the cluster’s current Apache Spark version. To bypass this check, set spark.sql.materializedView.sparkVersionCompatibilityCheck.enabled=false.
MV metadata cache not loaded. The metadata cache loads lazily during optimization of the first rewritable query in a Spark session. If your critical query fires before the cache is warm, the MV will not be available. Run a small warm-up query (for example, SELECT 1 FROM <some_iceberg_table>) at session start to pay this cost off the critical path.
MV metadata cache memory limit reached. If the cache was disabled or stopped loading MVs because of reaching its memory limit, increase spark.driver.memory.
Too many tables in configured catalogs. If there are many tables or MVs in the configured catalogs, the cache might not finish loading before your query starts. Place MVs in a dedicated catalog, add it to spark.sql.materializedViews.additionalCatalogs, and set spark.sql.materializedViews.scanCurrentCatalog=false to skip scanning the current catalog.
Parquet base tables have additional limitations and configuration requirements. For automatic query rewrite with Parquet base tables, set spark.sql.materializedView.v1SourceTables.enabled=true and spark.sql.materializedView.v1ETagVersioning.enabled=true. Without ETag versioning, Spark can’t determine a usable source-table version and skips the MV. Partitioned Parquet base tables are also subject to additional validation limits.
Performance considerations
Turning on automatic query rewrite has overhead: it introduces trade-offs that might affect some queries negatively:
Optimization overhead. Enabling rewrite adds processing time during query optimization as the optimizer evaluates MV candidates against the query plan. This overhead applies to every query in the session, including those that ultimately don’t match any MV.
Reduced task parallelism. Reading from an MV instead of the original base table might produce fewer tasks or introduce data skew, depending on the MV’s data layout. This reduces parallelism compared to a direct scan of the larger, more evenly distributed source table.
Conclusion
In this post, we showed how automatic query rewrite can accelerate your existing Apache Spark workloads. It uses Apache Iceberg materialized views in the AWS Glue Data Catalog, without changing a single line of SQL. By storing precomputed results as managed Apache Iceberg tables, the AWS Glue Data Catalog lets the Apache Spark optimizer transparently substitute matching query plans. You get the performance benefit of pre-aggregation without the application-level rewiring. BI dashboards, ISV-generated reports, and legacy pipelines all benefit the moment a matching MV exists.
We walked through three MV designs for the same analytical query, each striking a different balance between per-query speedup, storage footprint, and reuse across your workload. As the trade-off table shows, our testing found that a narrow, exact-match MV delivered 20x+ acceleration for a single query shape. A broader pre-aggregate served an entire family of queries at a more modest ~5x gain. The right choice depends on how many queries share the same join-and-aggregate pattern and how frequently your source data changes.
To get started:
Launch an Amazon EMR 7.12.0+ cluster or an AWS Glue 5.1+ job.
Create an MV over your most expensive repeating query using CREATE MATERIALIZED VIEW in the AWS Glue Data Catalog.
Turn on automatic query rewrite by setting spark.sql.optimizer.answerQueriesWithMVs.enabled=true in your Spark session configuration.
Verify the rewrite by inspecting the optimized query plan for an MV scan node, or by checking INFO-level logs on Amazon EMR 7.14.0+.
Queries with multi-table joins, heavy aggregations, or window functions over large fact tables are strong initial candidates. Start with one high-cost, frequently executed query. Validate the speedup, then expand to broader MVs as you identify shared patterns across your workload.
Special thanks to everyone who contributed to the automatic query rewrite feature and this blog: Andre Hernich, Leon Lin, Yiyang Chen, Geeta Krishna Panda, Ashok Chintalapati, Muhammad Malik, Rishabh Bhatia, and Giovanni Fumarola.
When your application can no longer send or receive messages through an Amazon Simple Queue Service (Amazon SQS) queue, downstream processing can stall. The cause might be a misconfigured Identity and Access Management (IAM) policy, a network partition, a bad deployment, or a transient service event. Your application sees much the same thing regardless: SQS operations start failing. How your services handle those failures (failing fast on what won’t succeed, opening circuit breakers, buffering on the producer side) can be the difference between a brief disruption and a cascading outage.
If you’ve never tested those mechanisms under failure, you’re relying on assumptions. With AWS Fault Injection Service (AWS FIS), you can find out first. The goal isn’t to verify that SQS works, it’s to learn what your application does when SQS operations fail, and whether you’d notice. A resilience experiment tests your recovery mechanisms and your observability at once.
In this post, you’ll learn how to:
Structure a resilience experiment with a clear, measurable hypothesis and success criteria.
Interpret Amazon CloudWatch metrics to determine whether your resilience mechanisms are working, distinguishing producer-side from consumer-side behavior.
Identify and fix gaps in your application’s failure handling.
Solution overview
In this experiment, you block your application’s access to SQS with a scoped deny resource policy, then restore access and observe recovery. The policy you apply rejects the data-plane operations your application depends on (sending, receiving, deleting, and changing message visibility, plus purging) while leaving queue management untouched. Disruption duration increases across four phases to surface different classes of failure. To learn more, see Control planes and data planes.
Important: Don’t deny sqs:*. In IAM policy evaluation, an explicit Deny overrides every Allow, including the automation’s own permission to remove the policy later. A deny covering sqs:SetQueueAttributes, sqs:AddPermission, and sqs:RemovePermission can lock the queue so that even the role that applied it can’t clean it up. Scope the deny to data-plane actions only. See Configuring the experiment for the safe policy shape, SQS troubleshooting: access denied, and this re:Post article on deny-policy lockout.
You can find the fault-injection code (the SSM Automation document, the FIS experiment template, and example IAM policies for both roles) in the FIS template library on GitHub.
Progressive experiment phases
Short disruptions can reveal whether your failure-handling mechanisms activate. Longer ones can expose systemic issues that might only appear under sustained failure.
Note: This experiment tests your application’s resilience patterns, not SQS itself. The scoped deny simulates what your application would experience during a network partition, a permission change, or another access disruption.
You can watch two distinct failure surfaces at once:
Producer side: The component that calls SendMessage. When sends are denied, you’re testing how the producer handles failed enqueues: does it fail fast, open a circuit breaker, buffer locally, or drop messages?
Consumer side: The component that calls ReceiveMessage and DeleteMessage. When receives are denied, you’re testing backlog growth during the outage and, on recovery, redelivery and whether a consumer working through the accumulated backlog keeps up or starts pushing messages toward the DLQ.
To isolate a consumer outage instead, where a bad deployment or scaling issue stops your consumers while producers keep sending, deny only sqs:ReceiveMessage and sqs:DeleteMessage. This can be done by editing the SSM Automation document.
Producer service sends to an SQS queue, a consumer service reads from it, a dead-letter queue attaches to the source queue, and CloudWatch collects metrics
Architecture diagram: producer service → SQS queue → consumer service, with a dead letter queue attached to the source queue and CloudWatch collecting metrics from the producer, the consumer, and both queues.
A note on the example workload. The behaviors here (circuit breakers, local buffering, thread pools) assume long-running producer and consumer services rather than short-lived Lambda invocations.
Define your hypothesis
Start with one question: can you reason about what your system should do when SQS access disappears? That question, not whether this is your first experiment, determines what kind of hypothesis you write.
If you can, state the expectation and the metrics you’ll judge it by: When our application loses access to SQS for [duration], we expect [specific, observable behavior]. Our system will [recovery expectation] within [time] of access being restored, as measured by [metric(s)].
A team with resilience patterns already in place might write: When our order processing application loses access to SQS for 5 minutes, we expect the producer to open its circuit breaker within 30 seconds, fail fast, and buffer messages in local durable storage rather than dropping them. On recovery it will replay the buffer and return to normal processing rates within 2 minutes, as measured by NumberOfMessagesSent returning to baseline and ApproximateNumberOfMessagesVisible draining to near zero within 15 minutes.
If this is your first test or this failure mode has never been exercised, that isn’t a prerequisite. You don’t necessarily need to read the code and settings first, though a basic understanding of the implementation and its normal load helps you set guardrails that bound the test’s impact. Frame the hypothesis as discovery, stating what you’ll observe instead of what you predict:
Our order processing application has never been tested under SQS access loss. We’ll block access for 2 minutes and observe how the producer handles failed sends and whether the consumer recovers unaided, as measured by NumberOfMessagesSent, ApproximateNumberOfMessagesVisible, ApproximateAgeOfOldestMessage, and application error rates.
Either way, write it down before you proceed. The gaps between what you wrote and what happens are where your system needs work.
Prerequisites
The GitHub repo ships working examples. The following bullets note which file to start from. You’ll need:
An instrumented producer and consumer: the application under test. This is the one prerequisite with no example in the repo. The library ships the fault injection, not the workload. The observation tables in this post assume your application emits circuit-breaker state, failed-send and dropped-message counters, fallback-store writes, and duplicate-processing metrics. Without that instrumentation you’ll watch the queue metrics move and learn little about your application.
An IAM role for AWS FIS, trusted by fis.amazonaws.com and able to run the SSM Automation document (ssm:StartAutomationExecution and related, plus iam:PassRole). The repo provides both pieces: sqs-queue-impairment-tag-based-fis-role-iam-policy.json for the permissions and fis-iam-trust-relationship.json for the trust policy. Add the Amazon CloudWatch Logs permissions only if you enable experiment logging. See Logging for AWS FIS.
An IAM role for the SSM Automation document, able to read and modify the target queues’ policies (sqs:GetQueueAttributes, sqs:SetQueueAttributes, sqs:ListQueues, sqs:ListQueueTags). Start from sqs-queue-impairment-tag-based-ssm-automation-role-iam-policy.json and ssm-iam-trust-relationship.json in the repo. The example policy conditions the write on aws:ResourceTag/FIS-Ready, which helps prevent the automation from touching untagged queues. Keep that condition.
SQS queues tagged FIS-Ready: True. This scopes which queues the automation targets. Tag only non-production queues or use planned test windows.
A CloudWatch dashboard and alarms combining those application metrics with the queue metrics across the producer, consumer, and queue (see Monitoring strategy). The repo’s README includes an example put-metric-alarm command for a customer-impact alarm you can adapt as your stop condition.
A documented rollback plan in case the automation can’t remove the deny policy (if a deny ever locks out queue management, see the re:Post article on deny-policy lockout).
Important: Run these experiments in a non-production environment first. In production, confirm you have change management approvals.
Configuring the experiment
AWS Systems Manager Automation applies and removes the deny policy; AWS FIS orchestrates the sequence.
Systems Manager Automation document
The SSM Automation document follows four steps:
getTargetQueues: finds SQS queues tagged with FIS-Ready: True. It calls ListQueues once, which returns at most 1,000 queue URLs, so in an account with more queues than that, add pagination or a QueueNamePrefix filter before you rely on it to find every tagged queue.
applyDenyAllPolicyToQueues: adds a scoped deny statement to each queue’s resource policy. Deny only the data-plane actions your application uses, never the management actions, so the automation can remove its own statement during cleanup. If you adapt the automation, consider adding a validation step that refuses to apply any deny covering management actions. A lockout would then require changing both the policy and the validation.
Tip: You can make the deny self-expiring by adding a DateLessThan condition on aws:CurrentTime to the statement, so the deny stops applying at a set time even if the cleanup step never runs. See IAM condition operators for date and time.
waitForDuration: sleeps for the specified impairment duration (ISO 8601 format, for example PT2M).
removeDenyAllPolicyFromQueues: removes the FISTemporaryDeny statement, restoring normal access. The document routes onFailure and onCancel to this step so that an aborted run attempts to clean up, and the step raises if it can’t restore a policy rather than reporting success.
Choose your blast radius with Principal."Principal": "*" denies the data plane to every caller: the application under test, but also any admin, canary, or other consumer of that queue. That faithfully simulates a service partition, but on a shared queue it impairs more than your app. To impair only the application, the more common “my app lost access” case, scope the deny to its IAM role:
A role arn matches all sessions of that role, catching the app’s calls without applying the deny to other callers. On a shared queue, a principal-scoped deny also changes what you measure: queue-level metrics blend impaired and healthy traffic, so lean on your application’s client-side metrics and read recovery as a return to pre-event levels rather than to zero and back. Set the automation’s optional targetPrincipalArn parameter to scope the deny to one principal, or leave it empty to deny all. The rest of this post assumes the full-queue deny ("Principal": "*").
FIS experiment template
The FIS template chains the four impairment phases with recovery periods between each, calling the SSM Automation document with an increasing duration; startAfter fields enforce sequential execution. The escalation is the point. You watch cause and effect at increasing severity:
Phase
Duration
What this duration tends to surface
Impair 1
2 minutes
Fail-fast behavior and circuit-breaker activation
Recover
3 minutes
Buffered messages replay. Metrics return to baseline
Impair 2
5 minutes
Backlog accumulation as the queue fills undrained
Recover
3 minutes
Backlog burndown
Impair 3
7 minutes
Thread-pool and memory pressure from sustained failure
Recover
2 minutes
Recovery under a larger backlog. Whether the consumer keeps up
Impair 4
15 minutes
Systemic limits under prolonged loss of access
The FIS experiment template with four impairment actions of 2, 5, 7, and 15 minutes chained by recovery waits
Figure: The FIS experiment template: four impairment actions (2, 5, 7, and 15 minutes) chained with recovery waits between them.
Stop conditions. A stop condition halts the experiment automatically if a specified CloudWatch alarm fires, an essential control for an escalating experiment. A triggered stop condition also unwinds what it can: FIS cancels the run, and the automation’s onCancel step removes the deny, restoring access. That rollback is a property of this experiment’s design, not of stop conditions in general: an action like EC2 instance termination does not support rollback, so check each action’s rollback behavior before relying on a stop condition to help limit damage. The library template ships with "stopConditions": [{"source":"none"}], because the right alarm depends on health signals the template can’t assume.
Metric choice matters: alarming on a queue metric like ApproximateAgeOfOldestMessage or NumberOfMessagesSent would be incorrect, as those are supposed to move during impairment. So, the alarm would trip in the first 2-minute phase and abort the run before the longer phases surface anything interesting. You’d be alarming on the effect you’re injecting.
Instead, tie the stop condition to a signal that should stay healthy if your resilience mechanisms are working. This would reflect real customer impact. If that signal degrades more than you’ll tolerate (error rates that don’t recover within the 2 minutes your hypothesis allows), your resilience has already failed and continuing risks further customer impact. Some metrics to consider alarming on:
An application error rate or transaction-success metric (a custom CloudWatch metric your app emits, for example failed orders per minute), the most direct measure of customer impact and independent of the SQS metrics you’re perturbing.
Load balancer 5xx count or target response time (for example HTTPCode_Target_5XX_Count on an Application Load Balancer), a good proxy when you don’t yet emit a business metric.
DLQ depth: ApproximateNumberOfMessagesVisible on the dead-letter queue crossing a threshold, which signals messages are failing permanently rather than only backing up recoverably.
Deriving the threshold from your hypothesis. The preceding hypothesis expects recovery within 2 minutes of access being restored. That number is also your alarm. If failed orders per minute is your customer-impact metric and its baseline is near zero, set the alarm to failed orders per minute > 10 for 2 consecutive 1-minute periods: long enough that a spike while the circuit breaker opens shouldn’t abort the run, short enough that failing to recover inside your hypothesis window stops it. Design the alarm for how the metric behaves during failure rather than for the test: when the circuit breaker opens, a low-volume custom metric might stop emitting data points entirely. Tighten it as you approach production.
AWS FIS experiment in Stopped state after the customer-impact alarm breached and halted the run
Figure: When the customer-impact alarm breached, AWS FIS halted the experiment automatically (State: Stopped)
Running the experiment
To start the experiment with AWS FIS you can use the console or the AWS CLI:
During each phase, SQS operations return AccessDenied errors. Note what that does and doesn’t exercise: a 403 is non-retryable, so this experiment validates that your code recognizes it and stops, not your backoff path. To exercise retries and backoff, inject a retryable fault such as throttling or timeouts. The producer and the consumer fail differently, so watch them separately.
SQS queue access policy showing the scoped FISTemporaryDeny statement blocking SendMessage and ReceiveMessage
Figure: During impairment, the queue’s access policy carries the scoped FISTemporaryDeny statement; SendMessage and ReceiveMessage return AccessDenied while management actions still work.
Producer side (the component calling SendMessage):
Stage
Healthy response
Unhealthy response
Signal to watch
First failed SendMessage
Recognizes AccessDenied and fails fast
Crashes, hangs, or blocks the calling thread
NumberOfMessagesSent drops to ~0. Producer error rate rises
After 3 to 5 consecutive failures
Circuit breaker opens. Sheds or buffers load
Continues retrying indefinitely
Circuit-breaker state metric. Producer CPU / threads / connections
Send gives up (non-retryable error, or retry budget exhausted)
Fails fast and persists the payload to durable fallback storage, or alerts, does not silently drop
Don’t expect the DLQ to fill during impairment. Redrive is driven by maxReceiveCount: a message moves to the DLQ only after a consumer has received it that many times without deleting it. With ReceiveMessage denied, nothing is delivered, the receive count doesn’t increment, and nothing redrives. The DLQ depends on the very call that’s blocked, so it’s something to watch for during recovery, not during the outage.
Key CloudWatch metrics, and how to read them:
NumberOfMessagesSent: drops to zero when the deny policy takes effect and producers can no longer enqueue.
NumberOfMessagesSent dropping to zero during each impairment window and spiking on recovery, ending at the stop-condition halt
Figure: NumberOfMessagesSent drops to zero during every impairment window (red) and spikes on recovery (green) as buffered messages replay. The final phase ends at the stop-condition halt (orange).
ApproximateNumberOfMessagesVisible: the current backlog of messages available for retrieval. During impairment this often stops changing, a signal that tells you something is wrong precisely because it goes flat (nothing is being sent or drained).
ApproximateAgeOfOldestMessage: increases as unprocessed messages age, but only if the queue already held a message when the deny took effect. On an empty queue it won’t climb, which is why you read it alongside the visible-message count.
ApproximateAgeOfOldestMessage climbing while the visible backlog stays undrained during the 15-minute phase, then both collapsing on recovery
Figure: Consumer-side impact: ApproximateAgeOfOldestMessage climbs while the visible backlog sits undrained during the 15-minute phase, then both collapse the moment access is restored.
Application error rate: spikes initially, then stabilizes if circuit breakers engage.
Producer circuit breaker opening within seconds of each impairment and closing on recovery as a square wave
Figure: The producer’s circuit breaker opens (1) within seconds of each impairment and closes (0) on recovery, a clean square wave that lags each fault window slightly because it opens only after a few sustained failures.
Count-based metrics (NumberOfMessagesSent/Received/Deleted) reflect system-level activity and can include retries and duplicates, so treat them as trend indicators rather than exact unique-message counts.
What to observe during recovery
When the deny policy is removed, the producer and consumer recover on different timelines.
Producer side:
What to observe
Healthy response
Unhealthy response
Send resumes
NumberOfMessagesSent climbs back to baseline. Circuit breaker half-opens, then closes within ~30 seconds
Circuit breaker stays open (stale failure state). Manual restart needed
Buffered / fallback payloads
Replayed from durable fallback storage and re-sent idempotently
Lost permanently (if silently dropped during impairment)
Producer buffering to durable fallback storage during impairment and replaying the buffer on recovery
Figure: The producer buffers to durable fallback storage during impairment (no dropped messages) and replays the buffer on recovery: send success, buffered writes, and replays over the run.
Drain stalls: the rate spikes, then drops to zero and stays there (consumer overwhelmed or stuck)
DLQ contents
Genuinely-poison messages redriven and reprocessed in controlled batches within the DLQ retention period
Reprocessed all at once (overwhelming downstream), or left to age out of the DLQ and be deleted
Recovery is when the DLQ can move. A consumer overwhelmed by the accumulated backlog can re-fail messages and push some to the DLQ. If healthy messages land there, your maxReceiveCount is too low or your consumer isn’t keeping up.
Analyzing results
After the experiment completes, compare what happened against your hypothesis. Focus on these questions:
Did your circuit breakers activate? Measure from the first AccessDenied to when your application stopped attempting SQS operations. Over your target (typically 30 seconds) means your detection threshold is too high.
Did your system preserve messages? Reconcile attempted sends against messages processed after recovery, plus the DLQ and producer-side fallback storage. If the numbers don’t add up you have message loss, and the gap tells you which side lost them.
Are the recovered messages still worth processing? Preservation and relevance are different questions. After a long outage, some buffered sends and backlogged messages represent requests the client has already given up on, and processing them spends recovery capacity acting on stale intent. Compare each message’s timestamp to the current time as you consume it, and drop or sideline anything no longer actionable, deliberately rather than by letting it age out. See REL05-BP04: Fail fast and limit queues.
How did recovery behave? Look at ApproximateNumberOfMessagesVisible after each recovery period. A healthy system drains steadily. If the drain stalls (the rate spikes, then drops to zero and stays there), your consumer is overwhelmed or stuck.
Did longer disruptions reveal new failure modes? Compare the 2-minute phase against the 15-minute one. What tends to surface only under sustained failure:
Thread pool exhaustion from accumulated retry threads.
Memory pressure from buffered messages.
Connection pool starvation.
DLQ messages aging out: messages that sit in the DLQ longer than its retention period are deleted (see Best practices).
Results that match your hypothesis are evidence your resilience mechanisms work. Results that don’t are your work list.
Best practices
The sections below cover the resilience patterns that turn the gaps this experiment surfaces into fixes: retry logic, circuit breakers, dead-letter queues, and monitoring.
Retry logic with exponential backoff
Don’t retry everything. Retry only errors that might succeed on a repeat, such as throttling, timeouts, and transient 5xxs, and fail fast on non-retryable ones like the AccessDenied (403) this experiment injects. For the errors worth retrying, use exponential backoff with jitter: each failure increases the wait exponentially (1s, 2s, 4s, 8s, and so on) with a random offset that prevents producers who failed together from retrying together and spiking a recovering dependency.
A circuit breaker stops attempting operations after a threshold of consecutive failures, then lets a single test call through after a recovery timeout. That saves resources on calls that are likely to fail and gives the dependency room to recover. Choose the open-state behavior deliberately: shedding or buffering load is safer than silently switching to an alternate path, because fallback paths are exercised only during failures and tend to fail with them. See Using load shedding to avoid overload and Avoiding fallback in distributed systems.
Dead letter queues
Configure a DLQ for every queue. It’s a consumer-side safety net for poison messages, not a producer overflow buffer. Set maxReceiveCount to the number of processing attempts that make sense for your workload (typically 3 to 5). Because redelivery is what feeds a DLQ, every consumer must tolerate seeing a message twice. See Making retries safe with idempotent APIs. For what a large post-recovery backlog can do, see Avoiding insurmountable queue backlogs.
A DLQ has no depth limit. The constraint is the retention period, after which SQS deletes the message (default 4 days, maximum 14). Set the DLQ’s retention longer than the source queue’s to provide more investigation time before messages are deleted. For standard queues, note that the retention clock runs from the original enqueue time and does not reset on the move to the DLQ, so time in the source queue counts against it. (FIFO queues do reset it.) After the experiment, confirm messages were preserved rather than aged out.
Queue-level metrics:NumberOfMessagesSent, NumberOfMessagesReceived, NumberOfMessagesDeleted, ApproximateNumberOfMessagesVisible, ApproximateNumberOfMessagesNotVisible, and ApproximateAgeOfOldestMessage, read as described in what to observe during impairment.
Application-level metrics:
Error rates by type (distinguish AccessDenied from other failures), tagged by producer vs. consumer.
Circuit breaker state changes (open / closed / half-open transitions).
DLQ message count.
End-to-end message processing latency.
Alarm on ApproximateAgeOfOldestMessage exceeding your SLA threshold as a production alert, but not as an experiment stop condition, since the metric is supposed to rise during impairment. Use a customer-impact signal there instead (see Stop conditions).
Clean up your environment
Verify the deny policy is gone. Check each queue’s access policy on the console or run aws sqs get-queue-attributes --queue-url <URL> --attribute-names Policy. If FISTemporaryDeny is still there, retrieve the policy, delete the statement, and reapply with aws sqs set-queue-attributes.
Process messages that landed in your DLQs during the experiment.
Review CloudWatch metrics to confirm your queues have returned to normal operation.
Document your findings: What matched your hypothesis, what didn’t, and what you’re fixing.
Expand your resilience testing
Once the basics hold, extend the experiment:
Partial failure: Impair only a subset of your queues to test whether your application handles mixed healthy/unhealthy dependencies.
Note: Don’t run two impairment experiments against the same queue concurrently. The automation reads the policy, modifies it, and writes it back. Concurrent runs can overwrite each other and leave a stale deny behind. Target distinct queues, or run them in sequence.
Consumer-side only: Block only ReceiveMessage and DeleteMessage while allowing SendMessage, to simulate a consumer outage while producers keep filling the queue (the most common real-world scenario).
Combine with other failures: Run the SQS experiment alongside EC2 instance termination or network latency injection to test compound failure scenarios.
Explore AWS Resilience Hub: Use AWS Resilience Hub to assess your application’s resilience posture and get recommendations for improvement.
Using FIS scenarios
A scenario is an AWS-authored template bundling the actions, targets, and duration for a recognizable event, so you start from a reviewed definition instead of assembling actions yourself. While AWS provides multiple scenarios in the library, here are two that are a good place to start.
AZ Availability: Power Interruption induces the symptoms of losing power in one Availability Zone: zonal EC2, ECS, and EKS compute stops, new launches in that AZ fail, and subnet connectivity is lost. It’s the sharper test of the queue-based decoupling this post exercises, because producers and consumers lose capacity while the queue itself is not targeted. You learn whether surviving consumers absorb the backlog, whether Auto Scaling replaces capacity in the remaining AZs rather than retrying in the impaired one, and whether the backlog drains inside your hypothesis window. It defaults to 30 minutes of impairment plus 30 of recovery, twice this post’s longest phase.
AZ: Application Slowdown introduces additional latency between resources within a single Availability Zone (AZ). This latency creates many of the symptoms of an application slowdown, a partial disruption, sometimes known as a gray failure. It adds latency to network flows between target resources. Network flows represent the traffic between computing resources: the data packets carrying requests, responses, and other communications between your servers, containers, and services. The scenario can help to validate observability setups, tune alarm thresholds, discover application sensitivity to slowdowns, and practice critical operational decisions like AZ evacuation.
Scenarios carry the same obligations: write the hypothesis first and set the stop condition on a customer-impact metric rather than one the scenario is designed to move. Your derived threshold works unchanged. Copy a scenario into your own template to narrow the targets or change the duration. See Working with the AWS FIS scenario library.
Conclusion
In this post, you learned how to discover what your application does when SQS operations fail, and whether you’d notice. Every gap between your hypothesis and the results is an opportunity to improve your system’s resilience and its observability.
Start with the 2-minute phase in a non-production environment. Fix what breaks. Then run the full sequence and keep running it as the application evolves. Each phase of growth brings failure modes you might only find under load.
In October 2025, Athenahealth, a major North American Electronic Health Record (EHR) provider, discovered a gap. An AWS regional service event in us-east-1 made their single-Region HashiCorp Terraform Enterprise (TFE) deployment inaccessible to their developers. This post shares the architecture, the AWS Fault Injection Service (AWS FIS) validation approach, HashiCorp best practices, and lessons learned from the collaboration between AWS and HashiCorp. Together, these help increase resiliency and verify that the customer’s critical workloads remain active during regional service events.
Currently, Terraform Enterprise (TFE) deployments are only supported within a single AWS Region. This means that, for TFE customers without a well-tested DR plan, a regional service event can block your engineering teams from deploying, modifying, or recovering infrastructure. A multi-Region disaster recovery (DR) strategy addresses this risk. The architecture in this post is a customer-operated DR pattern: HashiCorp supports TFE within a single Region and the HVD module targets single-Region deployments, so the multi-Region failover described here is designed, operated, and tested by the customer rather than provided as a supported product configuration. That strategy only works if you validate your regional failover workflow before you need it. Reacting during an event that impairs your primary Region costs developer productivity and business continuity. AWS FIS exposes hidden dependencies and configuration issues by injecting real failures into your AWS environment.
The following sections walk you through how to design three-phase AWS FIS experiments for TFE, expose hidden dependencies in failover automation, and validate both failover and failback for a multi-Region TFE deployment. You can help prevent extended downtime that impacts your infrastructure deployment capabilities and achieve 12-14 minute recovery times.
Prerequisites
To follow the validation approach in this post, you should have the following:
(Optional) A non-production TFE environment to run the sample Terraform code from the GitHub repository.
Starting architecture
If you’re running TFE in a single Region within AWS, this section describes the starting point. Athenahealth’s deployment used HashiCorp’s Terraform Enterprise Validated Design (HVD) module with the following components:
Amazon Aurora PostgreSQL-Compatible Edition for application state.
Amazon Simple Storage Service (Amazon S3) for Terraform workspace state files.
Athenahealth hosted these components in the us-east-1 Region. The deployment provided Availability Zone-level resilience but lacked regional failover capabilities. The October 2025 event highlighted what was missing: no cross-Region database replication, no secondary Region compute capacity, no Terraform state file backup outside us-east-1, and DNS pointing exclusively to the primary Region.
Following the October 2025 event, Athenahealth engaged both their AWS and HashiCorp account teams for guidance on protecting not only TFE, but other critical workloads as well. The three organizations worked as a single team to design and implement a multi-Region DR strategy for the TFE environment. By combining the AWS Well-Architected Framework guidance regarding operational excellence and reliability, along with HashiCorp’s best practices regarding DR strategies using Terraform, the team came up with the multi-Region architecture (Figure 1) that would replace the customer’s current single-Region deployment.
Multi-Region DR solution
With an active-passive multi-Region design across us-east-1 (primary) and us-west-2 (DR), Athenahealth achieved a 12-14 minute Recovery Time Objective (RTO) and less than 1 minute Recovery Point Objective (RPO). In the AWS disaster recovery taxonomy, this is a pilot light strategy: data replicates continuously to the DR Region while compute stays at zero. A warm standby variant (DR minimum capacity of 1) trades higher cost for faster RTO. This section covers the architecture components that make this possible and the four-step failover process you can follow during a regional service event.
Figure 1: Multi-Region active-passive DR architecture for Terraform Enterprise on AWS. Note the bidirectional S3 replication arrows between Regions and the Amazon Route 53 health check that determines the active Region.
The example Terraform code used to configure and manage the core architecture components, along with the failover process can be found in this sample GitHub repository. You can use this code to test a similar pattern for your TFE workload.
Core architecture components
You can route traffic to the active Region with Amazon Route 53 DNS alias records pointing to an Elastic Load Balancing (ELB) Network Load Balancer. Alias records for ELB targets use a 60-second time-to-live (TTL), which limits how long DNS resolvers cache the record. Clients begin resolving to the DR Region within about a minute of failover rather than waiting for longer cached entries to expire.
In each Region, an Amazon Virtual Private Cloud (Amazon VPC) spans three Availability Zones, and Amazon EC2 Auto Scaling groups manage the TFE instances. To help minimize cost, Athenahealth scaled DR Region compute to zero during normal operations by setting the Auto Scaling group minimum capacity to 0.
For cross-Region database replication, Athenahealth uses Aurora PostgreSQL-Compatible global databases, which provide sub-second replication lag and managed failover. The primary cluster runs one writer and two readers across three Availability Zones. The secondary cluster maintains an inactive writer that’s ready for promotion.
You can replicate Terraform workspace state files bidirectionally between primary and DR Amazon S3 buckets with S3 cross-Region replication. This design supports failback without data resynchronization.
AWS Secrets Manager and AWS Key Management Service (AWS KMS) provide cross-Region credential and encryption key management. Two TFE-specific dependencies deserve attention when you design for multi-Region. First, the TFE encryption password protects the internal Vault unseal key and root token. DR instances configured with a different value cannot start or decrypt existing data, so verify that this secret is replicated to your DR Region and referenced by your DR launch configuration. Second, if you run TFE in Active/Active mode, external Redis holds the job queue and cache. Account for a Redis equivalent in the DR Region and decide what in-flight job loss is acceptable at failover. Amazon CloudWatch alarms in each Region monitor the TFE instances, Auto Scaling groups, and Aurora clusters in that Region. Detection of a primary Region impairment does not depend on the primary Region itself: the Amazon Route 53 health check shown in Figure 1 probes the TFE endpoint from a globally distributed checker fleet, and alerts publish through Amazon Simple Notification Service (Amazon SNS) topics in both Regions.
Failover process
The architecture uses a four-step failover sequence:
1. Activate DR Auto Scaling group (2-5 minutes). Scale from 0 to 1 instance and validate health checks. TFE exposes a health check endpoint (/_health_check) that returns a 200 OK response when the application is running. The Network Load Balancer target group and the Route 53 health check probe this endpoint to determine instance health.
2. Promote Aurora PostgreSQL-Compatible global database (~1 minute). Promote the DR writer. Complete this step before DNS failover shifts traffic to the DR Region, to help prevent both Regions from accepting writes simultaneously (known as a split-brain scenario in distributed databases).
3. Confirm Amazon Route 53 DNS failover (~60 seconds). The pre-configured Route 53 failover routing policy detects the unhealthy primary endpoint and routes traffic to the DR Region’s Network Load Balancer. This happens in the Route 53 data plane, with no record modifications at failover time.
[Important: Your failover process should not depend on control plane API calls during an event. Modifying Route 53 records to perform failover is a documented anti-pattern because the Route 53 control plane operates from a single Region. Athenahealth avoided this dependency with pre-configured health check-based failover routing. For manually initiated Region switches through a highly available data plane, consider Amazon Application Recovery Controller (ARC) Region switch, which Athenahealth plans to evaluate in a future phase.]
4. Scale out for production load (5-10 minutes). Increase Auto Scaling group capacity while monitoring Amazon CloudWatch.
Note: Run failover scripts from outside the primary Region—for example, from the DR Region, a separate management Region, or a CI/CD system that is not dependent on the primary Region. If your failover automation runs in the primary Region, it might be unreachable during the event you are trying to recover from.
The ordering between Aurora promotion and traffic shift is enforced procedurally rather than by an automated control. The DR Auto Scaling group runs at zero capacity during normal operations, so the DR endpoint cannot pass health checks until an operator executes the runbook, and the runbook sequences promotion ahead of scaling for traffic. For an orchestrated Region switch with explicit sequencing controls, consider Amazon Application Recovery Controller Region switch, which Athenahealth plans to evaluate in a future phase.
Total failover execution time: 12-14 minutes, meeting the established RTO.
Validating with AWS Fault Injection Service
With the multi-Region architecture now in place, we still needed to confirm it would work under real failure conditions. This is where AWS FIS was introduced into the DR workflow. AWS FIS injects controlled failures into your AWS environment that can be used to measure actual recovery times and catch configuration issues before an actual disruption. The following three phases show how Athenahealth validated their architecture, and you can apply the same approach to your TFE deployment as well.
Progressive experiment approach
Rather than testing full regional failover immediately, the team validated resilience in three progressive phases starting with individual compute failures, then database failover, and finally simulated S3 connectivity loss. Each phase built confidence in a specific layer of the architecture before combining them, and each surfaced issues that manual review had missed.
Phase A: Amazon EC2 and Auto Scaling group failure injection
Athenahealth hypothesized that if TFE instances were stopped or Amazon EC2 capacity became unavailable, the Auto Scaling group would launch replacement instances within five minutes without manual intervention. To test this, they ran the following AWS FIS actions: aws:ec2:stop-instances, aws:ec2:asg-insufficient-instance-capacity-error, and Auto Scaling group suspend and resume operations. You can use these same actions to validate your own Auto Scaling group recovery behavior.
The results confirmed the hypothesis. The Auto Scaling group detected failed instances and launched replacements within 2-3 minutes. Network Load Balancer health checks removed failed instances from rotation within 30 seconds.
These experiments also revealed an outdated Amazon Machine Image (AMI) reference in the DR Region’s Auto Scaling group launch template. Athenahealth builds custom AMIs and copies them to the DR Region, but the DR launch template still referenced an older version. This configuration drift only surfaced when AWS FIS forced the Auto Scaling group to launch new instances. If you’re running similar experiments, check the launch template AMI references in both Regions as part of your validation.
Figure 2. FIS experiments list showing experiment EXP5vVgVbYvM7G7CFk in Running state, created July 27, 2026 at 12:29:20 IST.
Athenahealth hypothesized that if the Aurora PostgreSQL-Compatible global database cluster failed over, TFE would resume writes within one minute without manual intervention. To test this, they ran the aws:rds:failover-db-cluster AWS FIS action. The results confirmed the hypothesis for the database layer. Aurora promoted the secondary cluster’s writer in 58 seconds. During the promotion, TFE experienced approximately 15 seconds of write unavailability.
The Amazon Relational Database Service (Amazon RDS) Global Endpoint automatically redirected connections to the new writer. Athenahealth also discovered that the application layer did not meet the hypothesis. TFE connection pooling settings caused extended reconnection delays.
They reduced the connection pool timeout from 60 seconds to 10 seconds, which improved recovery time significantly. If you’re running TFE with Aurora PostgreSQL-Compatible, review your connection pool settings as part of your AWS FIS validation.
Note that this experiment exercised the coordinated failover path of Aurora, which requires the primary Region to be reachable to synchronize before promotion. During an actual event impairing the primary Region, you would instead use Aurora Global Database managed failover (the failover-global-cluster command with the --allow-data-loss option) or a manual detach-and-promote. These paths do not wait for replication to synchronize, so promotion timing differs and the RPO is bounded by the replication lag at the time of the event rather than zero. Treat the 58-second promotion and sub-second lag measured here as coordinated-path results, and plan unplanned-path expectations using the Aurora Global Database disaster recovery documentation.
Phase C: Amazon S3 connectivity disruption
Athenahealth hypothesized that if TFE lost connectivity to Amazon S3 in the primary Region, the DR Region bucket would hold current replicated state files without data loss. Testing this required a workaround, because AWS FIS doesn’t provide a direct action to disrupt Amazon S3 access. You can use the aws:network:disrupt-connectivity action instead to inject network ACL rules that block S3 traffic at the subnet level.
The aws:network:disrupt-connectivity action targets subnets, not S3 buckets directly. AWS FIS injects network ACL rules on compute private subnets, which blocks egress traffic to S3 service endpoints and simulates Regional S3 disruption for TFE instances in those subnets.
This experiment validates the S3 consumer, meaning TFE losing access to S3. It does not disrupt S3 cross-Region replication, because service-side replication between buckets does not traverse your subnet network ACLs. To test delayed or paused replication between Regions, use the Cross-Region: Connectivity scenario described in Next steps. Note that this approach assumes your TFE instances reach S3 over an in-VPC path, such as a gateway VPC endpoint, so the injected network ACL rules sit on the egress path to S3.
To configure this AWS FIS experiment, use the following template. Replace <your-tfe-compute-private-subnet-prefix> with your actual subnet name prefix, which you can find in the Amazon VPC console under Subnets.
The results confirmed the hypothesis for data durability. TFE detected S3 connectivity loss within 5 seconds. The DR Region S3 bucket contained replicated state files with less than 30 seconds of replication lag, and bidirectional replication prevented state file loss. The experiment also exposed a failure mode Athenahealth had not anticipated: the state file dependency issue detailed in the following section.
Combined experiment: primary Region impairment
After validating each layer individually, the team combined the faults into a single AWS FIS experiment template (shown in Figures 2-7). The experiment suspends the primary Region Auto Scaling group, stops the TFE instances, holds the faults in place during a wait window while the team executed the four-step failover runbook, and then resumes the Auto Scaling group. This end-to-end run validated the complete failover process under simultaneous compute impairment. The combined run surfaced no new failure modes beyond those found in the individual phases, which was itself the confirmation the team wanted.
Measuring recovery times
Across the three AWS FIS experiment phases, Amazon CloudWatch measured the following recovery times:
Amazon EC2 failure recovery: 2-3 minutes (automated Auto Scaling group replacement)
Aurora replication lag: less than 1 second (99th percentile)
S3 replication lag: less than 30 seconds (99th percentile)
Data loss during failover: 0 bytes (across each experiment)
[Note: These measurements reflect controlled testing conditions. Aurora Global Database and S3 cross-Region replication are both asynchronous. During an actual event, writes committed within the replication lag window (sub-second for Aurora, up to 30 seconds for S3) may not yet be available in the DR Region. Plan for near-zero rather than zero data loss when setting RPO expectations.]
Failback RTO: approximately 20 minutes (including approximately 5 minutes for Aurora PostgreSQL-Compatible global database re-establishment)
The 12-14 minutes measure failover execution time, from the operator triggering the runbook to full recovery. End-to-end recovery from event onset also includes detection time and the decision to fail over, so plan for a larger overall RTO.
Lesson learned: the state file dependency pitfall
Athenahealth first identified this risk during production failover and failback testing: their automation scripts depended on Terraform S3 state file outputs from both Regions. Subsequent AWS FIS experiments (Phase C) confirmed the severity. When S3 access is lost, those scripts fail entirely.
How the dependency breaks failover
Athenahealth’s failover and failback scripts automate the four-step process described earlier: scaling the Auto Scaling group in the target Region, promoting the Aurora global database writer, and verifying application health. An operator triggers them as part of the manual failover runbook, and they run from outside the primary Region. In their original form, the scripts retrieved infrastructure identifiers such as the Amazon RDS global cluster ID and Auto Scaling group name from state files stored in Amazon S3:
# Failover script excerpt (problematic approach)
# Retrieve RDS Global Cluster ID from primary Region state file
RDS_GLOBAL_CLUSTER_ID=$(terraform output \
    -state=s3://<primary-region-bucket>/terraform.tfstate \
    rds_global_cluster_id)

# Retrieve DR Auto Scaling group name from primary Region state file
DR_ASG_NAME=$(terraform output \
    -state=s3://<primary-region-bucket>/terraform.tfstate \
    dr_asg_name)

# Run Aurora failover
aws rds failover-global-cluster \
    --global-cluster-identifier $RDS_GLOBAL_CLUSTER_ID \
    --region us-west-2
For an unplanned Regional impairment, add the --allow-data-loss option to this command to perform a managed failover instead of a switchover, because a switchover requires the primary Region to be healthy.
During a Regional service impairment, the primary Region’s S3 state file may be unreachable. The same applies in reverse during failback. The failover script tries to read the state file, S3 times out, and the script stops. This creates a circular dependency: you can’t run the failover without access to the infrastructure you’re trying to recover from.
How to remove the dependency
The underlying principle is to remove every recovery dependency on the Region you are recovering from. Failover automation must not read configuration from the control plane or data plane of the impaired Region. Athenahealth implemented this principle by hardcoding infrastructure identifiers directly in their failover scripts. You can obtain these values from your Terraform outputs during normal operations:
# Failover script excerpt (resilient approach)
# Infrastructure identifiers hardcoded, not from dynamic lookups
RDS_GLOBAL_CLUSTER_ID="<your-tfe-global-cluster>"
DR_ASG_NAME="<your-tfe-dr-asg-us-west-2>"
ROUTE53_HOSTED_ZONE_ID="<your-hosted-zone-id>"

# Run Aurora failover with no state file dependency
aws rds failover-global-cluster \
    --global-cluster-identifier $RDS_GLOBAL_CLUSTER_ID \
    --region us-west-2
The trade-off is maintenance: hardcoded values require manual updates when infrastructure changes. Athenahealth addressed this with a CI/CD pipeline that compares hardcoded values against Terraform outputs and alerts on drift.
Hardcoding is one implementation of the principle. A Region-independent configuration source outside the primary Region achieves the same resilience with less drift risk, such as an AWS Systems Manager Parameter Store parameter replicated across Regions, an Amazon DynamoDB global table, or values committed to the repository that holds your failover scripts.
Testing failback
The state file dependency affected both failover and failback. Athenahealth validated failback by running full failover to DR, operating there for 30 minutes, then returning to primary. Bidirectional S3 replication prevented state file loss.
Collaboration model
If you’re planning a multi-Region DR project for TFE, consider a cross-functional approach. Athenahealth’s five-month engagement combined AWS resilience and AWS FIS expertise, HashiCorp TFE architecture knowledge, Terraform DR best practices, and HVD modules. This combination helped the customer reach production-validated DR faster than working independently. You can engage AWS Support or AWS Professional Services for similar guidance.
Conclusion
You can maintain infrastructure deployment capabilities during events that impact a single Region with a validated multi-Region DR architecture for TFE. This architecture achieved a validated RTO of 12-14 minutes and an RPO of less than 1 minute.
Multi-Region DR is not the right choice for every TFE deployment. Athenahealth chose this approach because TFE manages infrastructure for critical healthcare workloads. The October 2025 event showed that losing the ability to deploy during a regional event was a risk the business could not accept. Costs vary based on your configuration, but Athenahealth observed costs approximately 30-40% higher than their single-Region deployment, primarily from Aurora PostgreSQL-Compatible global database replication and S3 cross-Region replication. Weigh this cost against your own RTO and RPO requirements. For less critical workloads, a single-Region deployment with regular backups and a tested restore process may meet your needs.
Key takeaways
Give your infrastructure as code (IaC) tools the same resilience as production workloads. When your TFE deployment becomes unavailable during a Regional service event, you can’t deploy fixes or recover infrastructure.
Validate DR with controlled failure injection. AWS FIS experiments simulating real S3 connectivity loss exposed the state file circular dependency, a failure mode that only surfaces under actual disruption conditions.
Remove recovery dependencies on the Region you are recovering from. Dynamic lookups from state files tie failover to the infrastructure being recovered. Hardcoded identifiers or a Region-independent configuration source both work. Use drift detection to keep values current.
Test failback, not only failover. Without failback validation, you risk getting stuck in the DR Region or causing data loss when returning to primary.
Use subnet-level network disruption to simulate S3 connectivity disruption. The aws:network:disrupt-connectivity action targeting compute subnets simulates Regional S3 connectivity loss, which is the recommended approach because AWS FIS doesn’t offer a direct S3 disruption action.
Next steps
You can implement this solution in your environment with the following steps:
1. Run Phase A AWS FIS experiments on non-production TFE instances to validate Auto Scaling group recovery.
3. Establish your RTO and RPO targets before designing your Aurora replication strategy.
4. Create your first AWS FIS experiment to validate your DR architecture.
After you validate these three phases, extend your testing with additional AWS FIS scenarios. The AZ Availability: Power Interruption scenario validates recovery from the loss of an Availability Zone. The Cross-Region: Connectivity scenario simulates disrupted network connectivity between Regions, including paused S3 replication, which would delay state file replication to your DR Region.
If you need help designing or validating a multi-Region DR strategy, contact AWS Support or AWS Professional Services.
Cleanup
If you deploy this architecture for testing, delete the following resources in both Regions to avoid ongoing charges:
Aurora PostgreSQL-Compatible global database clusters.
Amazon S3 buckets with cross-Region replication.
Amazon EC2 instances in the DR Region Auto Scaling group.
If you used the sample GitHub repo to set up a test multi-Region TFE environment, verify that you also run terraform destroy to avoid any additional charges.
Resources:
AWS Fault Injection Service documentation.
Amazon Aurora PostgreSQL-Compatible global databases.
Organizations with geographically distributed workforces face a critical challenge: providing secure, low-latency access to applications without routing all traffic through centralized data centers. Traditional hub-and-spoke network architectures create latency bottlenecks and degrade user experience, forcing a trade-off between security and performance.
This post explores how you can use AWS Local Zones and Secure Access Service Edge (SASE) solutions to eliminate that trade-off. You will learn key design principles, implementation strategies, and technical considerations for deploying SASE solutions at the edge. We’ve seen that understanding your user locations and traffic volumes up front helps you make effective design decisions.
Key challenges for deploying SASE solutions
SASE solutions require virtual security appliances such as firewalls, secure web gateways, and zero trust network access (ZTNA) connectors. You deploy these appliances close to end users so that traffic inspection does not add latency to the user experience. With AWS Local Zones, you can deploy these virtual security appliances from AWS Marketplace closer to end users.
When you architect SASE solutions using Local Zones, you need to address several key technical challenges. Latency requirements: When end users are far away from an AWS Region, applications requiring security inspection experience significant latency overhead that affects overall performance and user experience. Geographic coverage: In some cases, workforces are spread across distributed locations far from an AWS Region. You need solutions that deliver consistent service quality and security capabilities to users across your covered locations.
Hybrid connectivity: Many applications maintain dependencies on on-premises data centers in areas far away from an AWS Region. Design traffic routing carefully to avoid unnecessary network paths and reduce traffic hairpinning or network flapping. Security consistency: Implement uniform security controls across all distributed locations while maintaining performance. This requires consideration of service placement and routing architecture.
Before looking at the SASE-specific design, it helps to understand what Local Zones provide. The following diagram shows how Local Zones extend AWS infrastructure from the Region out to metropolitan areas closer to end users.
Figure 1: High-level AWS infrastructure diagram showing how Local Zones bring compute closer to users
As the diagram shows, Local Zones place compute closer to end users. This especially benefits those far from an AWS Region.
Prerequisites
To follow the guidance in this post, you should be familiar with:
AWS Local Zones and how they extend AWS infrastructure to metro areas.
SASE architecture concepts and virtual security appliance deployment models.
Architecture considerations
When you design SASE solutions with Local Zones, you can follow several key best practices across infrastructure, control plane, and traffic management.
Infrastructure deployment
At the infrastructure level, focus on deploying virtual security appliances to optimize coverage and performance. Start by selecting and configuring Amazon EC2 instances optimized for maximum network throughput. Choose instance families that provide the compute and networking capabilities required for traffic inspection workloads, with enhanced networking enabled for high packets-per-second performance.
Design a scalable cluster management strategy that adapts to varying workload demands while maintaining consistent security posture. As you deploy these clusters, establish proper multi-tenant isolation to maintain security boundaries between different organizational units, keeping user resources separate from management infrastructure.
Control plane architecture
The SASE control plane requires particular attention in distributed deployments. Deploy control components in an AWS Region to manage security appliances across all Local Zone locations. This provides a single point of policy distribution and configuration management. From this centralized vantage point, you can implement policy management that maintains consistency in security enforcement across all locations.
Visibility matters as much as policy enforcement. Implement standardized telemetry collection mechanisms, such as Amazon CloudWatch metrics and logs, across all locations so you can maintain observability and resolve issues proactively. As your deployment grows, automate configuration deployment using infrastructure as code (IaC) tools such as AWS CloudFormation or Terraform. This keeps deployment consistent across all edge locations and reduces manual errors when operating at scale.
Traffic management
Traffic management completes the architecture of a well-designed SASE solution. Use Amazon Route 53 with geoproximity routing and health checks to direct users to the nearest security inspection point, minimizing inspection latency. If an appliance fails, Route 53 automatically reroutes traffic to the next-nearest Local Zone. For critical deployments, maintain standby capacity in the parent Region as a fallback.
Deploy VPN endpoints in Local Zones closest to your user populations to reduce connection latency for remote users while maintaining high availability through health-checked failover across multiple locations. Plan your Internet Service Provider (ISP) connectivity for redundancy and performance requirements across different geographical locations, and implement geographic load-balancing mechanisms to distribute traffic efficiently across available resources.
You also need to consider the egress path, which is how traffic exits after inspection. For internet-bound traffic, use the Local Zone’s direct internet egress to avoid routing back through the parent Region. For traffic destined to applications in an AWS Region, traffic traverses the AWS private network between the Local Zone and its parent Region. Validate egress paths using VPC Flow Logs and traceroute to confirm traffic is not taking unintended hops.
The following diagram shows how the Local Zones architecture applies to a SASE use case, routing user traffic to a nearby Local Zone for inspection.
Figure 2: Enterprise SASE deployment using virtual network firewalls across Local Zones to secure remote user and branch office access
As the diagram shows, remote users and branch offices connect to virtual network firewalls running in the Local Zone closest to them. Each Local Zone performs local traffic inspection that reduces latency for the SASE use case. The control nodes in the parent AWS Region manage policy and configuration across all locations.
Reference implementation approach
This section outlines the key phases for implementing a SASE solution across AWS Local Zones, from initial planning through validation.
Phase 1: Plan your deployment
Begin by mapping your user locations and latency expectations to identify which Local Zones are closest to your user populations, and determine which applications require local security inspection. With this map in hand, calculate capacity needs per location based on expected traffic volumes and security inspection requirements. Then define the specific inspection capabilities you need at each location, whether that is firewall, secure web gateway, ZTNA, or a combination.
One key design decision at this stage is whether to route all user traffic through the Local Zone appliance (full tunnel) or only corporate-bound traffic (split tunnel). Full tunnel provides complete traffic visibility but requires higher instance throughput. You can validate your choice by using VPC Flow Logs and CloudWatch network metrics to measure actual traffic volume per user during a pilot deployment.
Phase 2: Configure networking infrastructure
With your plan in place, enable the target Local Zones in your AWS account and create a VPC that extends into your chosen Local Zones by creating subnets in each one. Configure route tables to direct traffic through your virtual security appliances.
Security at the network layer is critical. Set up security groups that permit the required traffic flows for your SASE inspection chain. Add inbound rules for user VPN connections (for example, UDP 4500/500 for IPsec), outbound rules to target applications, and management access from the parent Region. Add network ACLs as an additional layer of defense at the subnet level to restrict traffic to expected protocols and port ranges.
Phase 3: Deploy virtual security appliances
Launch your chosen virtual security appliance from AWS Marketplace in each target Local Zone. Use M6i or M6g instances, or newer instances optimized for network throughput. For example, m6i.xlarge provides up to 12.5 Gbps network bandwidth. Deploy scalable clusters of 2–20 instances depending on location traffic volume, and configure elastic network interfaces for traffic inspection with separate inbound and outbound interfaces.
Enable enhanced networking and verify that the instance supports the throughput required for your expected traffic volume. This validation step is critical before moving to production, because undersized instances can become bottlenecks that negate the latency benefits of Local Zone placement.
Phase 4: Configure the control plane
Deploy your centralized SASE management components in the parent AWS Region and establish connectivity between the regional management infrastructure and your Local Zone appliances. Push security policies from the central management console to all distributed appliances to maintain consistent enforcement.
For observability, configure centralized logging and telemetry collection using Amazon CloudWatch. Enable VPC Flow Logs on Local Zone subnets to capture traffic metadata for compliance auditing and security analysis. Use this data for troubleshooting and demonstrating regulatory compliance.
Phase 5: Set up traffic routing
Configure Amazon Route 53 with geoproximity routing policies to direct users to the nearest Local Zone. Set up health checks that automatically fail over if a Local Zone appliance becomes unhealthy. Deploy VPN endpoints in each Local Zone for remote user connectivity.
After your routing is configured, test end-to-end connectivity and verify that traffic routes through the nearest security inspection point. This confirms that your geoproximity policies work as intended and that users receive the expected latency benefits.
Phase 6: Validate and optimize
With your deployment live, verify latency improvements by comparing round-trip times to the parent AWS Region and to the Local Zones. Monitor appliance utilization metrics (CPU, network throughput, and concurrent sessions) in Amazon CloudWatch, and adjust cluster sizes at each location based on observed traffic patterns. Validate that security policies are applied consistently across all locations.
Configure CloudWatch alarms to trigger scaling actions. For example, scale out when average CPU exceeds 70% or network throughput exceeds 80% of instance capacity over a 5-minute period. Use CloudWatch anomaly detection to identify unusual traffic patterns that might indicate a misconfigured routing policy or a security event.
Capacity planning
Local Zones provide the same elasticity as AWS Regions to scale your virtual security appliances based on demand. To optimize your deployment:
Use Amazon EC2 Auto Scaling to automatically adjust the number of appliance instances based on traffic patterns and utilization metrics.
Design your architecture to work across multiple instance families, giving you flexibility to use the most suitable compute resources available at each location.
For cost optimization, consider using Compute and EC2 Instance Savings Plans for steady-state appliance instances that run continuously, while relying on On-Demand pricing for burst capacity during peak traffic periods.
Before production deployment, validate that your chosen virtual appliance functions correctly in the target Local Zone and test network dependencies to confirm expected performance.
Clean up
If you deploy resources following this guidance and no longer need them after your testing, terminate EC2 instances, release Elastic IP addresses, delete Capacity Reservations, and remove associated networking resources (subnets, route tables, security groups, Route 53 policies) to avoid ongoing charges.
Conclusion
This post explored how you can deploy SASE solutions on AWS Local Zones. Local Zones bring three key benefits to SASE architectures. They reduce security inspection latency by placing appliances closer to users, apply consistent security enforcement across geographically distributed locations, and eliminate the need to backhaul traffic to centralized data centers. Organizations continue to expand their operations to more geographic locations. The combination of AWS Local Zones and SASE solutions from partners such as Palo Alto Networks provides a scalable approach for delivering secure connectivity to users anywhere.
Learn more
For instructions to opt in to a Local Zone and launch your Amazon EC2 instance, see the AWS Local Zones Getting started page. To learn where AWS Local Zones are available globally, check out the AWS Local Zones locations page.
Security teams are starting to actively use AI for security work, including vulnerability triage, penetration testing, threat modeling, incident response, and code review. The promise is speed, but a security tool that moves fast and raises too many false alarms doesn’t save time. Engineers spend time on false alarms, on-call is noisier, and teams distrust findings that matter.
Today, we’re releasing Deception Benchmark, the first benchmark designed to measure that trust problem directly. It tests whether a model can distinguish real vulnerabilities from code that looks risky but is actually safe. The benchmark includes 14,822 samples across 16 languages and more than 70 Common Weakness Enumeration (CWE) categories. We evaluated 12 models from five providers and are releasing the dataset and whitepaper to the community. Existing benchmarks measure whether AI can find or exploit vulnerabilities. This is the first to measure whether it can tell real vulnerabilities from false alarms. Under standard prompting, precision at distinguishing real vulnerabilities from false alarms landed in the mid 50s; as likely to be inaccurate as accurate.
In offensive tasks, there’s often a clear result: the exploit works or it doesn’t. Defensive reviews are harder to verify than offensive tasks; a model might recognize a suspicious pattern even when a mitigation makes the issue non-exploitable. In practice, useful systems need to reason about the code, the mitigation, and sometimes the surrounding environment.
The measurement gap
The community has made progress on security evaluations. CyberGym tests agents on more than 1,500 realistic tasks. Meta’s CyberSecEval and CyberSecEval 2 measure exploit generation. CYBENCH evaluates capture the flag (CTF) challenges. SEC-Bench and VulnBench push toward authentic security workflows.
Recent work reinforces both the progress and the gap. ExploitGym measures whether AI can escalate from a crash to a working exploit. Microsoft’s Project Perception deploys multi-agent red/blue/green teams for continuous defense. OpenAI’s GPT-Red shows that self-play red-teaming finds novel attacks that frontier models can’t defend against. Since then, OpenAI disclosed that its GPT-6 Astra model crossed the Critical cybersecurity capability threshold, and both OpenAI and Anthropic reported incidents where models gained unauthorized access to production systems during evaluations. The offensive side is moving fast. But none of this work measures the defensive precision question: when an AI system flags code as vulnerable, how often is it right?
Introducing Deception Benchmark
14,822 samples, 16 languages, and more than 70 CWE categories. We call it Deception Benchmark because the safe samples are designed to deceive models. It has real vulnerability patterns, real frameworks, real idioms, with mitigations that quietly close the exploit path. The goal is to classify code as vulnerable or safe, with no hints.
Consider a Flask endpoint that accepts user input and queries a database. A model will pattern-match to SQL injection, but the query uses parameterized statements, so the exploit path is closed. A single-turn classifier flags the pattern and moves on, never checking whether the exploit can actually work. Production tools rely on multi-step loops and agentic workflows to compensate, but that scaffolding masks whether the model itself understands the code. This benchmark strips the scaffolding away and asks the model to make the call in a single pass, so what it measures is understanding, not how many tries a harness takes to get there.
We built every sample through an adversarial loop: generate, test against frontier models, harden, repeat. If a model gets it right easily, the sample doesn’t survive. The result is a benchmark calibrated to the frontier, not below it. Building it this way is expensive. Generation and hardening of the samples consumed tens of billions of tokens. We’re releasing the result so the community doesn’t have to repeat that cost.
This benchmark generates two challenge types. Code-level challenges (6,988 samples) present vulnerable and safe variants that differ by a subtle fix. Both look suspicious, only one is exploitable. Environment-gated challenges (2,707 samples) go further: same code, different deployment context. A Kubernetes Network Policy blocks the server-side request forgery (SSRF) path. An identity and access management boundary prevents privilege escalation. The pattern is visible in the source. The infrastructure makes it unexploitable. The model has to figure out which scenario applies.
All samples were purpose-built for this benchmark, grounded in real-world patterns, real frameworks, real CWEs, and real infrastructure; without IP concerns or training data contamination.
Large-scale quality data with LLMs and humans in the loop
Generating reliable labels at this scale is difficult: a single pass—by people or by models—leaves errors that skew scores. So we treat labeling as a convergent audit loop rather than a one-time step. Every label is re-examined by multiple independent reviewers, blind to one another and to the original reasoning that produced the label. Disagreements escalate to direct adjudication, where the original reasoning is evaluated against the challenge. Unresolved cases go to human review. We repeat the loop until the scored set converges below a dispute threshold: under 3 percent of samples still contested by independent review, with a target of under 1 percent surviving human adjudication. One choice makes this defensible: we never relabel a disputed sample. When reviewers disagree, the sample moves to the unscored pool instead of being given a corrected label, so a bad challenge can remove a sample but can never introduce a wrong label into the scored set.
A human review of 100 randomly drawn scored samples found no label errors. We describe the full process in the whitepaper.
The results
The benchmark is roughly balanced: half vulnerable, half safe, so a random classifier scores 50 percent. We report two error rates separately, because they fail in opposite directions. The false positive rate (FPR) is how often the model flags safe code as vulnerable. These are the false alarms that waste an engineer’s time. The false negative rate (FNR) is how often it misses a real vulnerability and calls it safe. Accuracy alone hides this: a model that labels everything vulnerable catches every bug (0 percent FNR) but flags all safe code (100 percent FPR) and still scores about 50 percent. We consider FPR below 10 percent and FNR below 10 percent the minimum bar for production use.
Figure 1: FPR compared to FNR for 12 models across two prompting strategies. No model reaches the generous bar.
Model
Prompt
Accuracy
FPR
FNR
GPT-5.6 Sol
Direct
54.9%
92.5%
0.9%
GPT-5.6 Sol
PoE
58.9%
58.6%
23.1%
GPT-5.5
Direct
56.9%
87.8%
1.3%
GPT-5.5
PoE
62.9%
63.6%
12.4%
GPT-5.4
Direct
60.2%
81.0%
1.5%
GPT-5.4
PoE
77.7%
10.1%
33.6%
Llama 3.3 70B
Direct
58.8%
84.2%
1.1%
Llama 3.3 70B
PoE
72.2%
10.2%
44.2%
Claude Haiku 4.5
Direct
55.6%
92.1%
0.0%
Claude Haiku 4.5
PoE
75.6%
22.4%
26.3%
Claude Opus 4.6
Direct
55.9%
91.3%
0.1%
Claude Opus 4.6
PoE
75.8%
42.7%
7.0%
Claude Opus 4.7
Direct
58.3%
85.5%
0.9%
Claude Opus 4.7
PoE
75.9%
32.0%
16.8%
Claude Opus 4.8
Direct
53.8%
95.7%
0.2%
Claude Opus 4.8
PoE
75.8%
32.5%
16.4%
Claude Opus 5
Direct
77.3%
41.5%
5.2%
Claude Opus 5
PoE
79.3%
24.9%
16.8%
Claude Sonnet 5
Direct
62.9%
74.7%
2.2%
Claude Sonnet 5
PoE
74.7%
31.8%
19.2%
Amazon Nova 2 Lite
Direct
56.3%
89.2%
1.2%
Amazon Nova 2 Lite
PoE
70.1%
45.2%
15.5%
Mistral Large
Direct
52.2%
99.0%
0.0%
Mistral Large
PoE
65.5%
49.3%
20.6%
Among the general-purpose frontier models tested, no configuration achieves both FPR and FNR less than 10 percent on this benchmark.
Every model has the same failure mode. With direct prompting, they catch up to 95 percent of real vulnerabilities but also flag 41–99 percent of safe code. Precision runs from 52 percent to 71 percent, clustered in the mid-50s; effectively as likely to be inaccurate as accurate. The models see a vulnerability pattern and stop reasoning. Proof-of-exploit prompting cuts false positives by 17–74 points but misses 7–44 percent of real vulnerabilities. The environment-gated challenges are worse: models flag the code and ignore the Kubernetes Network Policy next to it. No tested configuration keeps both false positives and false negatives below 10 percent.
These results reflect general-purpose models in single-turn prompting. Purpose-built systems with multi-step validation and tool use are a different operating point that we didn’t measure, and if a harness can close the gap between pattern recognition and genuine understanding, this benchmark is the place to demonstrate it. Two cautions before assuming it already does. Agentic verification is proven mostly on offensive tasks, where success can be confirmed: the exploit fires or it doesn’t. Judging that code is safe has no such oracle. Extra iterations re-sample the same judgment rather than confirm a negative, and a harness still inherits the base model’s understanding. If the model can’t separate an effective mitigation from an ineffective one in a single pass, more passes won’t add the missing knowledge. That’s what this benchmark measures: the model’s intrinsic ability to understand code, tested at the single-turn baseline where no scaffolding can mask the gap.
For security teams evaluating AI tools today: ask your vendors how their system performs on tasks like this, not just whether it finds vulnerabilities, but how often it’s wrong. Pair any AI-assisted review with human verification on high-risk code paths, and use Deception Benchmark to hold your tools accountable.
Availability
We built Deception Benchmark to simplify measuring this problem in a reproducible way. The public release includes the samples and evaluation workflow. We don’t release the labels, so submissions can be scored consistently over time without turning the benchmark into a memorization exercise.
Of the 14,822 samples, 9,695 are scored; the remaining 5,127 are held out and unscored, mixed in with the rest of the benchmark. The goal is straightforward: make it more difficult to optimize the benchmark compared to improving the underlying system. We describe that design in more detail in the whitepaper.
Deception Benchmark is available on GitHub, along with the whitepaper and submission instructions for verified scoring. If you’re building security tooling, you can download the dataset, run your system against the benchmark, and submit predictions for scored evaluation.
If you have feedback about this post, submit comments in the Comments section below.
Data teams commonly build the extract, transform, and load (ETL) pipelines that turn raw order events into analyst-ready aggregates as a bronze, silver, and gold sequence, the medallion architecture. Bronze holds raw ingested records, silver holds cleaned and validated data, and gold holds the business-level aggregates that analysts query. Today you build this on AWS Glue with an orchestrator such as Amazon Managed Workflows for Apache Airflow (Amazon MWAA) or AWS Step Functions coordinating the stages. Many teams run production pipelines exactly this way. As a pipeline grows, the coordination work grows with it: you wire job dependencies, manage intermediate checkpoints, and add retry logic stage by stage.
AWS Glue 6.0, powered by Apache Spark 4.1, introduces Spark Declarative Pipelines (SDP), which simplifies this further. Instead of orchestrating jobs by hand, you declare what each dataset should contain and let the declarative framework resolve dependencies, manage checkpoints, and orchestrate execution order automatically. The result runs as a single declarative job, with no manual directed acyclic graph (DAG) wiring or imperative orchestration code.
In this post, you build a single AWS Glue 6.0 job that turns raw order records into validated, aggregated, analytics-ready tables through the bronze, silver, and gold sequence. You do this without writing any orchestration logic. This walkthrough uses the AWS Command Line Interface (AWS CLI), and the same operations are available through the AWS SDKs.
Solution overview
You build a single AWS Glue 6.0 job that reads raw order records from a CSV file in Amazon Simple Storage Service (Amazon S3). The job flows them through three declared datasets. These are a bronze materialized view (ingest as-is), a silver materialized view (type, validate, and classify), and a gold SQL materialized view (aggregate by region). With AWS Glue Data Catalog integration turned on, all three land as Data Catalog tables, queryable with standard SQL tooling such as Amazon Athena. SDP resolves the dependency order from the dataset references in your code, so you never orchestrate the steps yourself.
Two ways to build the pipeline
Before you build the pipeline, let’s understand this new way of writing ETL pipelines with a quick comparison of the imperative and declarative approaches.
With the imperative approach, you need three AWS Glue jobs, plus an orchestrator to handle sequencing and error handling. A typical pipeline therefore has two layers: an orchestration layer and the ETL processing layer. The following diagram shows this two-layer imperative pipeline.
Figure 1: The two-layer imperative pipeline, with three AWS Glue jobs coordinated by an orchestrator.
Compared to that, the declarative approach runs as a single ETL job with SDP. The following diagram mirrors the previous one, but here it is a single AWS Glue ETL job instead of three jobs plus an orchestrator.
Figure 2: The declarative pipeline, a single AWS Glue job running the bronze, silver, and gold layers with SDP.
The declarative approach reduces more than the number of jobs. It removes the boilerplate that surrounds them. An orchestrator such as Amazon MWAA or AWS Step Functions already handles retries and parallelism, but only at the granularity of a whole job. To get finer control, teams often split a pipeline into several jobs and then hand-wire the dependencies between them. With SDP, you no longer hand-wire a DAG, manage per-stage checkpoints, or split the pipeline into separate jobs for retries and parallelism. SDP derives the dependency graph from your table references and coordinates execution at the level of individual tables. You can still invoke an SDP job from an orchestrator when a broader workflow calls for it, but the pipeline’s internal coordination is no longer code you write and maintain.
SDP separates the what from the how: you declare datasets (the outputs you want), and SDP builds the flows that produce them and runs them as one pipeline, resolving dependencies and execution order automatically.
You declare these abstractions through Python decorators. This post covers three of them, @dp.table, @dp.materialized_view, and @dp.temporary_view, each with its own purpose:
@dp.table defines a streaming table, which processes new data incrementally on each run. Typical use cases are raw event ingestion and change data capture (CDC) feeds.
@dp.materialized_view defines a materialized view for batch use cases. Today, this dataset type fully recomputes on each run. Common uses include parsing, aggregations, and machine learning (ML) feature engineering.
@dp.temporary_view is for temporary computations and aggregations. It’s pipeline-scoped and isn’t persisted outside the pipeline. Use it for enrichment lookups and subqueries.
Streaming tables append only new arrivals. Materialized views fully recompute. This post uses @dp.materialized_view for all three layers to keep the walkthrough focused. In production, you would typically use @dp.table for the bronze layer to process only new files as they arrive rather than re-reading the full source each run.
Running and refreshing the pipeline
When you rerun a pipeline, you don’t always want the same work to happen. Sometimes you only want to confirm the pipeline is well-formed before spending compute. Other times you want to run it but recompute only the datasets that changed rather than the entire graph. SDP handles both cases through two independent controls, and it helps to keep them separate:
Execution mode (the spark.glue.sdp.jobMode key) answers run or only validate?
Refresh scope (the spark.glue.sdp.runMode key) answers given that I’m running, what do I recompute?
Execution mode.VALIDATE runs the pipeline in dry-run mode: SDP checks the YAML syntax, dependency resolution, and SQL and Python compilation without writing any data. Use it to verify your pipeline is well-formed before committing compute. RUN (the default) executes the pipeline normally, resolving the dependency graph and materializing datasets.
Refresh scope. By default, a RUN recomputes every materialized view. You can narrow or widen that with spark.glue.sdp.runMode:
--refresh <datasets> updates only the named datasets (comma-separated, no spaces).
--full-refresh <datasets> resets and recomputes only the named datasets (for streaming tables, this also clears their checkpoints).
--full-refresh-all resets and recomputes every dataset in the pipeline.
# Selective refresh of named datasets
aws glue start-job-run \
  --job-name "${JOB_NAME}" \
  --arguments '{"--conf":"spark.glue.sdp.jobMode=RUN --conf spark.glue.sdp.runMode=--refresh silver_orders,gold_sales_summary"}' \
  --region "${AWS_REGION}"

# Full reset and recompute of the entire pipeline
aws glue start-job-run \
  --job-name "${JOB_NAME}" \
  --arguments '{"--conf":"spark.glue.sdp.jobMode=RUN --conf spark.glue.sdp.runMode=--full-refresh-all"}' \
  --region "${AWS_REGION}"
Selective refresh is useful during development, so you can iterate on a single layer without reprocessing the entire graph. Note that --refresh and --full-refresh each take an explicit list of datasets. To reset the whole pipeline, use --full-refresh-all. Because materialized views hold no incremental state, resetting a materialized view and refreshing it both fully recompute it. The reset-versus-refresh distinction matters for streaming tables, where a refresh processes only new data and a reset clears the checkpoint and reprocesses from scratch.
The multiple values are passed as a single --conf argument string ("spark.glue.sdp.jobMode=RUN --conf spark.glue.sdp.runMode=..."). This is the serialization the AWS Glue SDP mode expects for the run.
Materialized views: Batch transforms with automatic dependency resolution
Materialized views recompute their full result set on each run. SDP infers dependencies from table references: in this pipeline, silver_orders references bronze_orders, so SDP runs bronze first, as shown in the following diagram.
Figure 3: SDP infers the dependency order from table references and runs bronze before silver.
The core pattern is a decorated function that returns a DataFrame:
The silver layer references bronze_orders through spark.table("bronze_orders"), with no explicit dependency declaration. SDP builds the DAG by analyzing table references in your code and runs bronze first automatically.
Bronze reads every column as a string by design: the bronze layer preserves raw source data without coercion. Type casting, validation, and filtering happen in the silver layer.
SQL and Python coexistence
SDP supports both Python and SQL definitions in the same pipeline project. A SQL materialized view can reference a Python-defined table directly, for example the gold layer aggregating the silver table:
CREATE MATERIALIZED VIEW gold_sales_summary
COMMENT 'Completed-order metrics by region'
AS
SELECT
  region,
  COUNT(*) AS order_count,
  CAST(ROUND(SUM(amount), 2) AS DECIMAL(10, 2)) AS total_sales,
  CAST(ROUND(AVG(amount), 2) AS DECIMAL(10, 2)) AS average_order_value
FROM silver_orders
GROUP BY region;
In this post, Python files define ingestion and validation logic, and SQL files define reporting views and aggregations. SDP discovers both through the libraries glob pattern in the pipeline specification and resolves the cross-language dependencies automatically. The complete source for all three layers follows in the step-by-step walkthrough.
Build the pipeline: Step by step
The rest of this post is a hands-on walkthrough. You build a single AWS Glue 6.0 job that reads orders.csv and processes it through the bronze, silver, and gold layers. The steps are:
Prerequisites: AWS account, AWS Identity and Access Management (IAM) role, and S3 bucket.
Set up sample data: create orders.csv and upload it to Amazon S3.
Build the pipeline files (the spark-pipeline.yml specification plus the three transformation files).
Package the pipeline into a zip and upload it to Amazon S3.
Create the database: a Data Catalog database with an S3 location.
Configure the job: create the AWS Glue 6.0 job with the SDP flag.
Validate: run in dry-run mode to verify the graph.
Run the pipeline to materialize all datasets.
Query results: inspect the tables with Amazon Athena.
Clean up: delete the resources you created.
Step 1 – Prerequisites
To follow along, you need:
An AWS account with access to AWS Glue 6.0.
A dedicated IAM role trusted by glue.amazonaws.com (set up in the following section).
A private, encrypted Amazon S3 bucket with Block Public Access enabled.
The AWS CLI configured with credentials for a non-production account.
IAM role for the pipeline
Create a role that AWS Glue can assume, with the following trust policy:
Attach the AWS managed policy AWSGlueServiceRole, which grants the AWS Glue Data Catalog and Amazon CloudWatch Logs access the job needs. Then add an inline policy that scopes Amazon S3 access to your bucket, covering the input data, the pipeline zip, the pipeline storage (state) path, and the warehouse location:
Set the following variables, replacing the example values (us-east-1, amzn-s3-demo-bucket, the account ID 111122223333, and the role name) with your own:
Upload the file to the input/ location under your project prefix, which is where the bronze layer reads it (the ORDERS_PATH in 01_bronze.py, shown in Step 3). Use the variables you exported in Step 1:
The file includes one invalid order (O-1003, a negative amount), which the silver layer filters out to demonstrate the validation step. The AMER and EMEA regions each have two completed orders, so the gold layer’s order_count and average_order_value are meaningful aggregations rather than single-row passthroughs.
Step 3 – Build the pipeline files
The pipeline project uses the structure introduced earlier: a transformations/ folder holding the three layer definitions (01_bronze.py, 02_silver.py, 03_gold.sql), plus the spark-pipeline.yml specification. The following screenshot shows this layout in a code editor.
Figure 4: The pipeline project layout in a code editor.
The complete contents of each file follow.
3a. spark-pipeline.yml
The specification names the pipeline, points to the Data Catalog database, configures state storage, and discovers transformation files. As with the transformation files, it uses the __DATABASE__, __BUCKET__, and __PREFIX__ tokens, which you substitute at packaging time in Step 4:
Bronze preserves the raw source as strings. No coercion, no filtering:
"""Bronze layer: preserve source order records as strings."""
from pyspark import pipelines as dp
from pyspark.sql import DataFrame, SparkSession
from pyspark.sql.types import StringType, StructField, StructType

spark = SparkSession.active()

ORDERS_PATH = "s3://__BUCKET__/__PREFIX__/input/orders.csv"

ORDERS_SCHEMA = StructType([
    StructField("order_id", StringType(), True),
    StructField("customer_id", StringType(), True),
    StructField("region", StringType(), True),
    StructField("amount", StringType(), True),
    StructField("status", StringType(), True),
    StructField("order_ts", StringType(), True),
])


@dp.materialized_view(comment="Raw orders loaded from CSV")
def bronze_orders() -> DataFrame:
    return (
        spark.read
        .schema(ORDERS_SCHEMA)
        .option("header", "true")
        .csv(ORDERS_PATH)
    )
The path uses the tokens __BUCKET__ and __PREFIX__ rather than hardcoded values. AWS Glue reads these files from the packaged zip at runtime, so shell variables like ${BUCKET} are not expanded inside them. You substitute the tokens with your real values when you package the project in Step 4, which keeps every file consistent with the variables you exported in Step 1.
3c. transformations/02_silver.py
Silver casts types, filters to complete orders with positive amounts, and derives an amount_band classification:
Silver reads bronze with spark.table("bronze_orders"), so SDP infers the dependency and runs bronze first. Two details matter here:
The to_timestamp call passes an explicit format, "yyyy-MM-dd'T'HH:mm:ss'Z'". The source timestamps are ISO 8601 with a Z suffix. Giving the format treats Z as a literal and produces the same wall-clock value regardless of the job’s session time zone, which keeps the result deterministic.
The transformation runs in two projections: the first casts and filters, and the second derives amount_band from the already-typed amount column. Deriving columns with .select(...) rather than a separate .withColumn(...) step keeps SDP’s reference to bronze_orders resolvable as a pipeline dependency. This way, SDP consistently orders the bronze layer before the silver layer. The order matters here too. Spark 4.1 enables ANSI mode by default, so comparing the raw string amount against a number would fail. amount_band therefore reads the already-cast amount.
3d. transformations/03_gold.sql
The gold layer aggregates order metrics by region using SQL:
CREATE MATERIALIZED VIEW gold_sales_summary
COMMENT 'Completed-order metrics by region'
AS
SELECT
  region,
  COUNT(*) AS order_count,
  CAST(ROUND(SUM(amount), 2) AS DECIMAL(10, 2)) AS total_sales,
  CAST(ROUND(AVG(amount), 2) AS DECIMAL(10, 2)) AS average_order_value
FROM silver_orders
GROUP BY region;
Step 4 – Package the project
Substitute the __BUCKET__, __PREFIX__, and __DATABASE__ tokens with the values you exported in Step 1. Then package spark-pipeline.yml and the transformations/ folder into a zip with both at the zip root. Because AWS Glue reads these files from the zip at runtime, the substitution has to happen now, at packaging time, not through shell variables at run time:
# Render the tokens into a build/ copy, leaving your source files untouched
rm -rf build/package && mkdir -p build/package/transformations

sed -e "s|__BUCKET__|${BUCKET}|g" \
    -e "s|__PREFIX__|${PREFIX}|g" \
    -e "s|__DATABASE__|${DATABASE}|g" \
    spark-pipeline.yml > build/package/spark-pipeline.yml

sed -e "s|__BUCKET__|${BUCKET}|g" \
    -e "s|__PREFIX__|${PREFIX}|g" \
    transformations/01_bronze.py > build/package/transformations/01_bronze.py
cp transformations/02_silver.py transformations/03_gold.sql build/package/transformations/

# Zip with the spec and transformations at the zip root
(cd build/package && zip -r -q ../simple-sdp-demo.zip spark-pipeline.yml transformations)

# Upload
aws s3 cp build/simple-sdp-demo.zip "s3://${BUCKET}/${PREFIX}/pipeline/simple-sdp-demo.zip" --region "${AWS_REGION}"
Only spark-pipeline.yml and 01_bronze.py carry tokens, so the other files are copied as-is. The uploaded object is named simple-sdp-demo.zip, which is the same name the job references in Step 6.
Step 5 – Create the database
The database named in spark-pipeline.yml must already exist in the AWS Glue Data Catalog, with an S3 location URI, before the pipeline runs. SDP does not create it automatically:
Uses the AWS Glue Data Catalog as the Spark Hive metastore, so the pipeline’s output tables register in the catalog
ScriptLocation
Points to the pipeline zip, not a .py file
Table 2: Key arguments for the create-job command.
The create-job command sets ScriptLocation to the pipeline zip. You can also point it to an Amazon S3 prefix: upload the unzipped spark-pipeline.yml and transformations/ to a prefix and set ScriptLocation to that prefix (with a trailing /). No other change is needed, and the --enable-spark-declarative-pipeline flag stays the same. The zip keeps the upload to a single object.
Step 7 – Validate (dry run)
Run the job in validation mode first to verify the dependency graph without materializing data:
Validation analyzes the project structure, dependency graph, and SQL and Python compilation without creating tables, executing transforms, or writing data. Confirm that the database has no tables after validation completes.
On AWS Glue, validation runs as a job (jobMode=VALIDATE), so you create the job in Step 6 and then validate it here. If you develop locally with the open source spark-pipelines CLI, you can run its dry-run against the project before packaging and uploading.
After the run, the AWS Glue console shows the three output tables in the simple_sdp_demo_db database. The database’s Location is the warehouse path you configured, s3://amzn-s3-demo-bucket/simple-sdp-demo/warehouse/, and each table stores its data under that prefix. The following screenshot shows the database properties and the three tables (bronze_orders, silver_orders, and gold_sales_summary), each registered in the AWS Glue Data Catalog.
Figure 5: The three output tables in the AWS Glue Data Catalog.
Step 9 – Query results
Query the tables with Amazon Athena. If this is your first time using Athena in this Region, set an Amazon S3 query-results location for your workgroup first (Athena console, Settings). Also make sure your identity can read the simple_sdp_demo_db tables in the Data Catalog and the underlying S3 data.
-- Bronze preserves all 6 source rows
SELECT * FROM simple_sdp_demo_db.bronze_orders ORDER BY order_id;

-- Silver retains the 5 complete orders with positive amounts
SELECT * FROM simple_sdp_demo_db.silver_orders ORDER BY order_id;

-- Gold aggregates by region
SELECT * FROM simple_sdp_demo_db.gold_sales_summary ORDER BY region;
Expected gold result:
region
order_count
total_sales
average_order_value
AMER
2
1000.00
500.00
APAC
1
320.25
320.25
EMEA
2
210.50
105.25
Table 3: Gold layer aggregation results by region.
Running the query in the Amazon Athena console returns the aggregated result. The following screenshot shows the gold query and its three result rows (AMER, APAC, and EMEA), matching the values in the preceding table.
Figure 6: The gold table results in the Amazon Athena console.
Cost considerations
AWS Glue 6.0 bills ETL jobs by the data processing unit (DPU)-hour, per second, with a 1-minute minimum per run. AWS Glue 6.0 is also priced 30 percent lower per DPU-hour than AWS Glue 5.1, with no change to your workload, so the same job costs less to run on 6.0. This walkthrough runs on 2 G.1X workers (2 DPUs), reads a 6-row CSV, and completes each run in about 2 minutes. It produces three tables in one AWS Glue Data Catalog database.
To estimate the cost of a run, multiply the 2 DPUs by the run time in hours by your Region’s AWS Glue 6.0 DPU-hour rate. You can find that rate on the AWS Glue pricing page, and rates differ by AWS Region. The Amazon S3 objects created are the 6-row CSV, the pipeline zip, and the three tables’ data. To stop further charges, delete the resources when you finish, as shown in the next step.
Step 10 – Clean up
To avoid ongoing charges, delete the resources you created:
# Delete the AWS Glue job
aws glue delete-job --job-name "${JOB_NAME}" --region "${AWS_REGION}"

# Delete the Data Catalog database and its table metadata
aws glue delete-database --name "${DATABASE}" --region "${AWS_REGION}"

# Remove the S3 objects
aws s3 rm "s3://${BUCKET}/${PREFIX}/" --recursive --region "${AWS_REGION}"
What’s next
You now have a single pipeline that turns raw order records into validated, aggregated analytics tables, without writing orchestration logic. From here you can:
Extend: Add transformation stages (additional @dp.materialized_view functions) and connect them by referencing upstream tables. The pipeline picks up the new dependency automatically.
Scale: This walkthrough uses materialized views throughout, so every layer fully recomputes on each run (materialized views don’t support incremental refresh). To process only new data as it arrives, convert the bronze layer to a streaming table, which maintains state across runs with checkpoints. For that cross-run state to persist, a streaming table’s data and checkpoint state must not be stored locally. Hive or AWS Glue managed tables require the database’s LocationUri to point to an Amazon S3 path, while Apache Iceberg tables manage their table metadata themselves.
Govern: Protect the Data Catalog tables SDP produces with AWS Lake Formation fine-grained access control. It enforces table-, row-, column-, and cell-level permissions on read queries in AWS Glue Spark jobs (Glue 5.0 and later, for Hive and Iceberg tables). Because this enforcement covers batch reads, it applies to SDP’s materialized views but not to streaming tables, which read through Spark Structured Streaming.
Automate: Store the pipeline project in source control. Have your continuous integration and continuous delivery (CI/CD) pipeline package and upload it to Amazon S3 so each job run maps to a known build. Version the zip by object key, or upload the unzipped project to an S3 prefix and turn on Amazon S3 bucket versioning.
Monitor: Use Amazon CloudWatch metrics and AWS Glue job run insights for pipeline observability, latency tracking, and failure alerting.
Conclusion
In this post, you used Spark Declarative Pipelines, the declarative alternative to explicitly orchestrated ETL, now available in AWS Glue 6.0. Two decorated Python functions and one SQL file define the bronze, silver, and gold datasets, and SDP resolves the dependencies and manages execution order for you.
With SDP, you declare what each dataset should contain and the declarative framework handles ordering and execution. A three-layer pipeline that would otherwise need separate transform and orchestration logic runs as one job that you can ship and maintain.
Enterprise data today is scattered across specialized systems, each with its own tools and expertise. Querying a database requires SQL. Accessing batch data on Amazon Simple Storage Service (Amazon S3) requires compute engines such as Amazon Athena and Trino. Consuming real-time streams from Amazon Kinesis requires streaming expertise. Each software as a service (SaaS) application has its own API, authentication model, and query language. Today, only data engineers can navigate this landscape, and business users file tickets, wait for reports, or rely on dashboards that answer yesterday’s questions. When a leader needs a one-time answer spanning multiple systems, they’re back in the ticket queue.
Consider a streaming media company: customer profiles, content catalogs, and ad campaign performance are stored as batch data on Amazon S3. Viewership telemetry such as device type, stream quality, watch duration, and buffering events flows in real time through Amazon Kinesis. Subscriber management and support tickets live in a relational customer relationship management (CRM) database. Leaders routinely ask questions like:
Which titles drove the most subscriber growth last quarter?
How does marketing spend correlate with viewing completion rates?
Is churn spiking among users who haven’t engaged with new content?
Answering these questions faces two challenges:
The data silo problem. The data lives in multiple places with batch stores on S3, real-time streams in Kinesis, and an online transaction processing (OLTP) database, each with its own access patterns, query language, and authentication model. Organizations traditionally solve this by building data lakes or adopting a data mesh, but both require significant data engineering investment and ongoing maintenance.
The access gap. The expertise to navigate the enterprise systems is concentrated in the hands of few data engineers, creating a bottleneck that no dashboard or business intelligence (BI) tool fully resolves. Every new one-time requirement means more engineering work, and it’s not self-service.
A fundamentally different approach is emerging: instead of moving all data to one place or building bespoke integrations for each source, let AI agents talk directly to the systems where data lives. Model Context Protocol (MCP) makes this possible, an open protocol that standardizes how AI applications connect to external data sources and tools. MCP servers wrap diverse systems behind a uniform interface for tool discovery, invocation, and response handling. Any user can ask a question in natural language and the agent reaches the right data without knowing which system holds it, what API to use, or what query language is required.
In this post, we propose reference architectures for accessing data stored in different systems and datastores using MCP and Amazon Bedrock AgentCore. The patterns apply to enterprises with mixed data sources, but we ground the narrative in our streaming media company example described earlier to make the problem concrete.
Solution overview
Our solution is a federated data foundation for a streaming media company. It supports real-time and batch analytics using MCP servers and Amazon Bedrock AgentCore, and it makes analytics accessible across the organization. The following reference architecture shows the complete picture from data ingestion through governance and compute layers to the generative AI layer where agents orchestrate across MCP servers. The demo uses synthetic data: batch datasets are generated with Python scripts, and streaming telemetry is produced by AWS Lambda. The complete source code is available in the accompanying GitHub repository, so you can deploy and try it yourself.
Figure 1: Reference architecture for federated data access across batch, streaming, and relational sources
Walkthrough
This section covers the prerequisites and then walks through how a user request flows end to end through the reference architecture.
User request: A user submits a natural-language question through a React application served by Amazon CloudFront with static assets on Amazon S3.
Authentication: Amazon Cognito authenticates the user and issues an identity token that travels with the request to the agent layer.
Agent orchestration: The request reaches a Strands agent running on AgentCore runtime, a capability of Amazon Bedrock AgentCore. The agent reasons over the question and determines which data sources to query.
Gateway routing: Amazon Bedrock AgentCore Gateway, a capability of Amazon Bedrock AgentCore, aggregates all three MCP servers behind a single endpoint, handling tool discovery, authentication, and routing.
MCP server execution: The agent routes the query to the appropriate MCP server(s), each running on Amazon Bedrock AgentCore runtime behind Amazon Bedrock AgentCore Gateway. The Data Processing MCP server queries AWS Glue Data Catalog and Amazon Athena for batch and streaming data on S3, the Amazon Aurora MCP server translates tool calls into SQL against the Amazon Aurora MySQL CRM database, and the AWS Documentation MCP server provides AWS service context.
Data sources: The architecture deliberately spans multiple storage systems to reflect how enterprise data is typically fragmented across teams and technologies. Batch data (customer profiles, content titles, and ad campaigns) is generated by AWS Lambda on an Amazon EventBridge schedule and lands as Parquet files on Amazon S3. Streaming viewership telemetry (what users watch, when they pause, where they drop off) flows through Amazon Kinesis Data Streams and Amazon Data Firehose to S3. CRM records (subscriber plans, support tickets, account status) live in an Amazon Aurora MySQL database. AWS Glue Data Catalog registers the S3-based sources under a unified metadata layer, and AWS Lake Formation enforces fine-grained access policies across the catalog. This mix of batch, streaming, and relational sources is what makes federated access essential. No single query engine can reach all datasets natively.
Response: Results flow back through Amazon Bedrock AgentCore Gateway to the agent, which composes a natural-language answer and delivers it to the user through the front end.
For deploying our reference architecture, follow the instructions in the code repository.
Design patterns for federated data access
Within our architecture, we propose three design patterns for federated data access, each on a spectrum between centralized governance and direct access flexibility.
Pattern 1: Catalog-first access
AWS Glue Data Catalog registers all S3 sources under a unified metadata layer: schemas, business context, data quality metrics, and lineage. The AWS Data Processing MCP server, hosted on Amazon Bedrock AgentCore runtime, wraps AWS Glue Catalog metadata and Amazon Athena query capabilities behind standard MCP tool calls. So when a user asks “Which ad campaigns drove the most subscriber activations last quarter?”, the agent discovers tables through catalog tools and resolves business terms from column metadata. It then executes the join through Athena without ever calling a Glue API directly.
The following diagram traces how a single user request flows through the federated data access architecture: from the agent, through the MCP server, and down to the data in Amazon S3.
Figure 2: Request flow for the catalog-first access pattern
Internally, our agent built using Strands Agent framework has three components: a system prompt, a large language model (LLM), and a set of MCP tools. We use Claude Haiku 4.5 powered by Amazon Bedrock as the foundation LLM with tools discovered through the Amazon Bedrock AgentCore Gateway. The system prompt teaches the agent how to use those tools not by listing every column in every table, but by providing intent-based routing rules and a mandatory schema discovery workflow. Here’s an extract from the system prompt:
TOOL DISCOVERY & ROUTING:

You access tools via the MCP Gateway. Use x_amz_bedrock_agentcore_search
to find the right tool by keyword when unsure.

Routing by intent:
- Telemetry/streaming/viewing data → Glue catalog tools, then Athena query tools
- CRM/support tickets/ratings → MySQL tools (run_query, get_table_schema)
- AWS service questions → documentation search tools

SCHEMA DISCOVERY (MANDATORY before writing SQL):

Before writing any Athena query, retrieve the table schema:
→ Use manage_aws_glue_tables with operation='get-table',
database_name='acme_telemetry', table_name='<table>'

This returns all columns, data types, partition keys, and storage details.
To see this in action, consider what happens when a user asks “How many streaming events in February 2026 by event type?”:
The agent’s routing rules match “streaming events” to the AWS Glue Catalog and Athena query path. If unsure which tool to use, the Gateway’s semantic search discovers tools by keyword rather than requiring exact names.
The agent calls manage_aws_glue_tables exposed by the Data Processing MCP server to retrieve the full schema: column names and types, partition keys (year, month, day, hour), and storage format.
With the schema in hand, the agent writes Presto/Trino SQL with partition filters (WHERE year='2026' AND month='02').
The agent executes the query, retrieves results, and composes a natural-language answer. The user never sees SQL, Glue APIs, or partition strategies.
This discover-then-query workflow is what makes the pattern self-service. The Amazon Bedrock AgentCore Gateway provides unified tool discovery as new MCP servers appear without updating routing logic. The AWS Glue Data Catalog provides a live metadata layer for new tables and columns to appear immediately.
This pattern isn’t unique to AWS. Other platforms adopt the same model. For example, Databricks offers managed MCP servers for Unity Catalog, letting agents discover and query governed datasets, AI models, and functions registered in Unity Catalog. The common trade-off across all of them: all data must be cataloged before agents can access it, which can bottleneck rapidly changing environments.
Figure 3: Catalog-first access with AWS Glue Data Catalog and Amazon Athena
Pattern 2: Direct source access
Agents access source systems directly through dedicated MCP servers (no intermediate catalog). The Aurora MCP server, hosted on Amazon Bedrock AgentCore runtime, queries the Amazon Aurora CRM database directly. Therefore, a question like “How many open support tickets from premium subscribers?” routes to the MCP server, which translates the tool call into SQL against Aurora. The agent never constructs a database connection or manages credentials. The MCP server handles authentication through AWS Secrets Manager and exposes only two tools: run_query for SQL execution and get_table_schema for schema inspection.
Figure 4: Direct source access to the Amazon Aurora CRM database
Internally, the same agent architecture as Pattern 1 applies: a system prompt, an LLM, and a set of MCP tools. We use Claude Haiku 4.5 powered by Amazon Bedrock as the foundation LLM with tools discovered through the Amazon Bedrock AgentCore Gateway. There’s no catalog layer to query first. The system prompt provides lightweight schema hints: table names and key enum values needed for WHERE clauses so the agent can route correctly and write valid filters without a round trip:
MYSQL CRM DATA (Aurora MySQL via RDS Data API):

Database: acme_crm

Tables:
- support_tickets: status (open|in_progress|resolved|closed),
  priority (low|medium|high|critical),
  category (billing|technical|content|account)
- content_ratings: rating (1-5), review_text

Use get_table_schema to verify full column details before complex queries.
Use run_query(sql='SELECT...') to execute. Default to read-only SELECT.
Use standard MySQL syntax (not Presto/Trino).
For straightforward queries, the agent writes SQL directly from these hints. For complex queries such as multi-table joins or unfamiliar columns, the agent calls get_table_schema first to verify the full schema, mirroring the discover-then-query discipline from Pattern 1 but against the source database rather than a catalog. To see this in action, consider “Show me open critical support tickets by category”:
The agent’s routing rules match “support tickets” to the MySQL CRM path and call run_query with a SELECT against support_tickets filtered by status='open' and priority='critical'.
The Aurora MCP server translates this into a query against Amazon Aurora through the RDS Data API.
Results return through the AgentCore Gateway and the agent composes a formatted answer with ticket counts, categories, and so on.
The direct access pattern trades catalog governance for simplicity. There’s no metadata registration step. The MCP server queries the database as-is, which means schema changes in Aurora are immediately visible. This makes it ideal for operational databases where the schema is stable and well-understood, and where the overhead of cataloging every table would slow down access without adding value.
Earlier this year, the AWS MCP Server became generally available. It’s part of the Agent Toolkit for AWS, a suite of tooling that includes the MCP Server, skills, and plugins that help coding agents build more effectively and efficiently on AWS. Rather than exposing a fixed set of per-service tools, the server provides generic AWS API access: aws___run_script executes Python in a sandboxed environment with credentialed access to the AWS APIs, authenticated with SigV4 and authorized by your existing AWS Identity and Access Management (IAM) policies. Because that reaches most of AWS APIs, you can connect your agents to relational data in Aurora through the RDS Data API or to real-time streaming data in Kinesis Data Streams, using boto3 calls such as GetShardIterator and GetRecords.
Pattern 3: Hybrid access
In practice, most organizations won’t pick only one pattern because the data landscape is too diverse. That’s exactly the case for our streaming media company: batch and streaming data on S3 benefits from catalog-first governance (Pattern 1), while the Aurora CRM database is better served by direct access (Pattern 2). Our reference architecture combines both patterns under a single orchestrator agent. Governed sources route through the catalog. Operational sources are accessed directly and both paths coexist behind the same agent. The key insight: both paths use the same protocol. Amazon Bedrock AgentCore runtime hosts the MCP servers, and AgentCore Gateway handles tool discovery, authentication, and routing. Organizations can start with whichever pattern fits their current data maturity and grow into unified access as they onboard more sources.
Validate the deployment
Access the CloudFront URL from the stack outputs, log in with your test user credentials, and try these queries:
Query 1 – Customer analytics with visualization:
“Build a chart on customer breakup by subscription type?”
The agent queries the customers table in Athena and generates bar and pie charts showing the distribution across subscription tiers.
Figure 5: Customer distribution across subscription tiers
Query 2 – CRM operational breakdown:
“Show me the breakdown of support tickets by category and priority.”
This routes entirely to the MySQL MCP server, querying the Aurora CRM database for ticket distribution without touching S3 or Athena.
Figure 6: Support ticket breakdown by category and priority
Query 3 – Federated cross-source query:
“What are the top five highest-rated titles and how many streaming hours do they have?”
This requires the agent to query content_ratings from Aurora for ratings, then correlate with streaming_events and titles in Athena.
Figure 7: Top five highest-rated titles and their streaming hours
Things to consider
Consider these additional factors when you deploy the preceding architecture patterns to production:
Application security: Our architecture patterns use Amazon Cognito for identity access and control. However, you should carefully review the identity used by the agent to interact with backend systems.
Data lineage and access control: Consider using AWS Lake Formation for data governance, authentication, and authorization of data assets in the agentic AI application.
Semantic layer for agents: Agentic response quality can be improved by providing agents with the right business context and building an independent semantic layer. AWS has recently announced support for business context and semantic search. This can help the agent discover and understand data by semantic meaning, improve response quality and avoid hallucination, and many other issues.
Clean up
To avoid ongoing charges, destroy both AWS Cloud Development Kit (AWS CDK) stacks (agent stack first, then data stack) and remove any orphaned resources such as Kinesis streams and Amazon CloudWatch log groups. For detailed clean-up instructions, visit the repository’s README.
Conclusion
Enterprise data stays locked behind silos and an access gap. Every one-time question routes through a handful of data engineers while the insight goes stale. MCP flips the model. Instead of centralizing data or wiring bespoke integrations, you deploy MCP servers that wrap each source behind a standardized protocol and let AI agents query them on behalf of the user. Whether you choose catalog-first access, direct access, or both unified behind a single agent, the agent navigates the complexity so the user doesn’t have to. Adding a new data source means deploying a new MCP server, not redesigning the pipeline.
Open questions remain, for example, data lineage across agent-composed outputs, identity and authorization when agents are the primary data consumers, and audit trails that capture not only what an agent accessed but why. This landscape is growing fast: AWS Labs MCP Servers, AWS MCP documentation, and the MCP Gateway Registry.
Deploy the reference architecture, experiment with the patterns, and contribute back what you learn.
Acknowledgements
We would like to thank Yadgiri Pottabathini for his effort in testing the repository.
In Part 1 of this guide, we examined two common incident scenarios: cross-account Amazon Simple Storage Service (Amazon S3) data deletion with ransomware implications, and cryptocurrency mining deployed through AWS CloudFormation using exposed AWS Management Console credentials. We also introduced key incident response terminology and investigative frameworks for analyzing AWS CloudTrail events.
In this second part, we explore a more complex, multi-stage attack: how a web application vulnerability can cascade into credential harvesting and unauthorized access to Amazon Bedrock services across multiple AWS Regions. We also cover additional investigation techniques and hardening steps to strengthen your security posture.
Scenario 3: SSRF to IMDSv1 credential harvesting with multi-Region Amazon Bedrock service misuse
This scenario examines how a web application vulnerability can cascade into a multi-Region event targeting Amazon Bedrock services. The investigation demonstrates how threat actors chain together multiple techniques, using Amazon Elastic Compute Cloud (Amazon EC2) Instance Metadata Service version 1 (IMDSv1) through server-side request forgery (SSRF) and cross-Region pivoting to access Amazon Bedrock.
Your security team receives multiple alerts: failed AWS Identity and Access Management (IAM) operations in the us-east-1 Region, successful console sign-ins without multi-factor authentication (MFA), and unusual Amazon Bedrock API calls from us-east-2. Initially, these might seem like unrelated events across different services and Regions. However, as our Security Incident Response Team (SIRT) discovered, they represent a carefully orchestrated event chain that began with a web application vulnerability and culminated in unauthorized access to your organization’s AI infrastructure.
Architecture and progression
The architecture in figure 1 maps a multi-stage attack that exploits the trust relationship between Amazon Elastic Compute Cloud (Amazon EC2) instances and AWS services. A threat actor identified a server-side request forgery (SSRF) vulnerability in a web application running on an EC2 instance that had an attached webdev IAM role. Rather than attempting to escalate privileges directly, the threat actor used this foothold to reach the Instance Metadata Service version 1 (IMDSv1) endpoint and retrieve the temporary credentials issued to the webdev role. Because IMDSv1 returns credentials in response to a basic request with no session token, an SSRF flaw is enough to harvest them, which is why these credentials became the pivot point for everything that followed. The attack unfolded in five stages. Each stage is numbered in figure 1 so you can follow the progression from the initial web request through to the cross-Region Amazon Bedrock activity:
Initial access: The threat actor exploited the SSRF vulnerability in the web application to make server-side requests on the instance’s behalf.
Credential harvesting: Those requests reached the IMDSv1 endpoint and returned the temporary credentials for the webdev role.
Permission testing: Using the harvested credentials, the threat actor attempted IAM operations to probe the boundaries of what the role could do.
Service pivoting: When IAM actions were denied, the threat actor shifted focus to Amazon Bedrock, a service the role could reach.
Region hopping: The threat actor moved operations from us-east-1 to us-east-2, likely to evade Region-specific monitoring and access controls.
Figure 1: Scenario 3 architecture
CloudTrail evidence and structured extractions
In this section, we walk through the CloudTrail evidence that documents the attack from start to finish. Each of the four events that follow maps to one or more stages in the progression described previously, and together they trace how the threat actor moved from harvested credentials to active misuse of Amazon Bedrock. For each event, we present the relevant portion of the CloudTrail log record, highlight the fields that matter most for the investigation, and include a forensic legend that explains what each highlighted field reveals.
We cover the following events:
Permission boundary testing (15:53:49 UTC): A failed CreateUser call in us-east-1 that reveals the compromised role and the IMDSv1 credential source.
Console access establishment (15:59:29 UTC): A successful console sign-in without MFA, showing the pivot from programmatic to interactive access.
Bedrock service reconnaissance (17:20:00 UTC): A ListFoundationModels call in us-east-2 that marks the Region hop and the shift to AI services.
Active model exploitation (17:25:48 UTC): A Converse call that invokes the Amazon Nova Pro model, confirming unauthorized usage.
As you read each event, focus on how the fields connect one stage to the next. The same webdev role, the same source IP address, and the recurring ec2RoleDelivery value are the threads that tie these otherwise separate events into a single attack chain.
Event 1: Permission boundary testing (15:53:49 UTC): The first suspicious activity appeared as a failed CreateUser API call in us-east-1. The CloudTrail log records an AssumedRole session attempting to create an IAM user named adm1n but receiving an AccessDenied error. The webdev role is visible in the userIdentity field, readOnly is false (indicating a write operation attempt), and the user-agent shows AWS Command Line Interface (AWS CLI) on Windows, suggesting programmatic access from the harvested credentials.
Event 2: Console access establishment (15:59:29 UTC): Six minutes later, the threat actor successfully signed in to the AWS Management Console using the same credentials. The ConsoleLogin event records that MFA wasn’t used (MFAUsed: No), and the source IP (75.3.231.105) provides attribution data. The user agent indicates Chrome browser on Windows 10.
Event 3: Amazon Bedrock service reconnaissance (17:20:00 UTC): Nearly two hours later, the threat actor pivoted to Amazon Bedrock, making a ListFoundationModels API call in us-east-2. This event exhibits several patterns: a Region change from us-east-1 to us-east-2 (potential defense evasion), a shift from IAM to AI services, readOnly: true (reconnaissance rather than modification), and sessionCredentialFromConsole: “true”, which ties the call to the console session established in Event 2 rather than a fresh IMDSv1 credential retrieval.
 {
  "eventVersion": "1.11",
  "userIdentity": {
    "type": "AssumedRole",
    "arn": "arn:aws:sts::XXXXXXXXXXXX:assumed-role/webdev/i-0123456789abcdef0"
  },
  "eventTime": "2025-09-22T17:20:00Z",
  "eventSource": "bedrock.amazonaws.com",  ◄── ❶ Pivoted to cloud AI services
               ‾‾‾‾‾‾‾‾‾‾‾‾‾‾‾‾‾‾‾‾‾‾‾‾
  "eventName": "ListFoundationModels",  ◄── ❷ AI model reconnaissance
               ‾‾‾‾‾‾‾‾‾‾‾‾‾‾‾‾‾‾‾‾‾‾
  "awsRegion": "us-east-2",  ◄── ❸ Region hop (evasion technique)
               ‾‾‾‾‾‾‾‾‾‾‾
  "sourceIPAddress": "75.3.231.105",
  "readOnly": true,
  "tlsDetails": {
    "clientProvidedHostHeader": "bedrock.us-east-2.amazonaws.com"  ◄── ❹ Intentional alternate region targeting
                               ‾‾‾‾‾‾‾‾‾‾‾‾‾‾‾‾‾‾‾‾‾‾‾‾‾‾‾‾‾‾‾‾‾
  },
  "sessionCredentialFromConsole": "true"
}

───────────────────────────────────────────────────────────────────
  FORENSIC LEGEND
───────────────────────────────────────────────────────────────────
❶ eventSource: "bedrock.amazonaws.com"→ Attacker pivoted from IAM to managed AI services
❷ eventName: "ListFoundationModels"→ Reconnaissance: enumerating available AI models
❸ awsRegion: "us-east-2"→ Region hop from us-east-1 (defense evasion)
❹ clientProvidedHostHeader: "bedrock.us-east-2..."  → Confirms intentional targeting of alternate region endpoint
───────────────────────────────────────────────────────────────────
Event 4: Active model exploitation (17:25:48 UTC): Five minutes after the reconnaissance call, the threat actor moved from enumeration to active exploitation, invoking the Amazon Nova Pro model through the Converse API in us-east-2. The additionalEventData field quantifies the unauthorized usage at 944 input tokens and 126 output tokens, confirming that the threat actor successfully prompted the model and received a response.
 {
  "eventVersion": "1.11",
  "userIdentity": {
    "type": "AssumedRole",
    "arn": "arn:aws:sts::XXXXXXXXXXXX:assumed-role/webdev/i-0123456789abcdef0"
  },
  "eventTime": "2025-09-22T17:25:48Z",
  "eventSource": "bedrock.amazonaws.com",
  "eventName": "Converse",  ◄── ❶ Active model invocation (recon → exploitation)
               ‾‾‾‾‾‾‾‾‾‾
  "awsRegion": "us-east-2",
  "requestParameters": {
    "modelId": "amazon.nova-pro-v1:0",  ◄── ❷ Specific model being misused
               ‾‾‾‾‾‾‾‾‾‾‾‾‾‾‾‾‾‾‾‾‾‾
    "inferenceConfig": { "maxTokens": 1024 }
  },
  "responseElements": null,
  "additionalEventData": { "inputTokens": 944, "outputTokens": 126 }  ◄── ❸ Unauthorized usage quantified
                           ‾‾‾‾‾‾‾‾‾‾‾‾‾‾‾‾‾‾‾‾‾‾‾‾‾‾‾‾‾‾‾‾‾‾‾‾‾‾
}

───────────────────────────────────────────────────────────────────
  FORENSIC LEGEND
───────────────────────────────────────────────────────────────────
❶ eventName: "Converse"                → Attacker transitioned from reconnaissance to active exploitation
❷ modelId: "amazon.nova-pro-v1:0"      → Identifies the specific foundation model being misused
❸ inputTokens: 944, outputTokens: 126  → Quantifies unauthorized usage (financial cost + data exfiltration exposure)
───────────────────────────────────────────────────────────────────
Notable event fields to track
As you review the event logs, a handful of fields do most of the investigative work in this scenario. Understanding what each one reveals, and why it matters, is what turns a collection of individual log records into a coherent attack narrative.
The userIdentity field is the starting point for attribution. In this scenario it carries the EC2 instance ID as the session name, which is what let us trace the harvested credentials back to a specific compromised instance rather than a human user. Whenever you see an assumed-role session, this field answers the first question of any investigation: whose credentials are these, and where did they come from?
The readOnly field reveals the intent behind an action. A value of true marks reconnaissance, such as the ListFoundationModels call the threat actor used to enumerate available models, while false marks an attempt to change or use something, such as the CreateUser call or the Converse invocation. Sorting events by this field quickly separates the threat actor’s information gathering from the actions that caused actual impact.
The awsRegion field is easy to overlook, but in this scenario it exposed the threat actor’s evasion strategy. The shift from us-east-1 to us-east-2 wasn’t incidental; threat actors move between Regions because monitoring, alerting, and access controls are often configured inconsistently across them. Watching this field helps you spot activity that has deliberately moved away from where your detection is strongest.
Finally, the userIdentity.invokedBy field identifies when an AWS service, rather than a user or a set of harvested credentials, made the request on your behalf. CloudTrail populates it only when the caller is an AWS service, such as through a service-linked role, a service role, or a forward access session. It doesn’t appear in the events for this scenario because the threat actor called Amazon Bedrock directly with the harvested webdev credentials. That absence is itself informative: it confirms the requests came from a principal acting on its own rather than from a legitimate service-driven workflow. As agent-based and service-integrated Amazon Bedrock workloads become more common, checking this field separates expected service activity from credentials driven directly by a threat actor.
Investigation priorities
With the full attack chain mapped, from SSRF through credential harvesting to Amazon Bedrock service misuse, the investigation turned to a harder question: what did each stage actually cost us, and what would stop it from happening again? A few priorities shaped that work.
The first was figuring out where the credentials came from and how far the exposure reached. It was clear the threat actor had valid credentials for the webdev role, but the more useful question was why a web application role could reach Amazon Bedrock at all. The customer confirmed there was no business reason for it, so we needed to understand whether that permission was a deliberate misconfiguration or an oversight, and then look for other EC2 instances carrying the same role attachment. One compromised instance is an incident; a fleet of instances with the same over-scoped role is a much bigger problem waiting to happen.
Next, we wanted to know what the threat actor did after they got into Amazon Bedrock. Reconnaissance and active use carry very different consequences, so we traced which foundation models were touched and whether any were actually invoked or only enumerated. That distinction matters for scoping the damage, and it signals whether data exfiltration is a concern. Unusual model usage, unexpected prompt volume, or output patterns that don’t match any legitimate workload are the signals that reconnaissance has turned into something worse.
The Region hop was its own line of inquiry. The move from us-east-1 to us-east-2 was almost certainly deliberate, and the investigation focused on understanding what the threat actor gained by it. In practice, that meant comparing the two Regions: were the monitoring and access controls in us-east-2 weaker than in us-east-1, and what else did the threat actor reach in the secondary Region once they were there? Inconsistent controls across Regions are one of the most common ways activity slips past detection.
Tying it all together was the timeline, which shows how quickly the threat actor moved through the chain:
17:25:48: Active model invocation (Converse call) (us-east-2)
Following the credentials across those events fills in the rest of the story. IMDSv1 handed the threat actor temporary credentials for the webdev role, and the same role appears in every event that followed, which confirms the credentials were reused rather than replaced. Nowhere in that sequence was MFA required, and that single gap is what let one harvested credential stay useful across two hours, two Regions, and two very different services.
Incident response checklist
The following checklist captures the actions needed to contain the incident, remediate the vulnerability, and assess the scope of unauthorized AI service usage. Each item names where to look and what a finding looks like, so the checklist stays usable under the time pressure of a live incident.
Contain and remediate the entry point:
Identify the specific web application feature that made the outbound request (URL fetchers, webhook callbacks, PDF or image renderers, and link-preview generators are the usual culprits), then confirm it can reach http://169.254.169.254.
Audit the rest of the application for the same pattern, because one unvalidated URL parameter usually means others exist.
Enforce IMDSv2 on the affected instance and across the fleet with aws ec2 modify-instance-metadata-options --http-tokens required --http-put-response-hop-limit 1. Setting --http-tokens required means credentials are only returned when the caller presents a session token it obtained through a PUT request, which a basic SSRF cannot do. Setting the hop limit to 1 keeps the metadata response on the instance itself, so a request coming from a container or proxy an extra hop away never receives it.
Scope the Bedrock usage:
List the foundation models the webdev role could reach by reviewing its IAM policy and any resource-based policies, so you know the full set of models that were exposed, not only the one that was invoked.
Determine what was sent to and returned by the model. CloudTrail records the Converse call and the token counts, but only Amazon Bedrock model invocation logging captures the input prompts and model responses. If it was enabled, pull the log entries for the session; if it wasn’t, note that the prompt and response content can’t be recovered and enable it now.
Flag any compliance exposure based on what those prompts and responses contained. Unauthorized processing of regulated data (such as personally identifiable information (PII), protected health information (PHI), or cardholder data) through the model might trigger notification obligations.
Check for wider compromise and persistence:
Query CloudTrail across all Regions and services—not only Amazon Bedrock—for every event tied to the webdev role’s session, to confirm what else the same credentials touched.
Correlate the CloudTrail timestamps with VPC Flow Logs and application logs for source IP 75.3.231.105 to build the network-level picture around each API call.
Search for IAM write events from the session (CreateUser, CreateRole, CreateAccessKey, and AttachRolePolicy) that indicate an attempt to establish persistence beyond the temporary credentials. The failed adm1nCreateUser call is the known starting point; confirm nothing similar succeeded.
Watch for ongoing or hidden impact:
Review Amazon Bedrock usage in CloudWatch and your billing data for invocation spikes or unexpected token consumption that fall outside normal workload patterns.
Inspect the invocation logs for signs of sensitive data being processed or extracted through the model.
Check the same logs for prompt injection attempts, where the input tries to override the model’s instructions or extract system prompts.
Key takeaways
This scenario reveals how a single application vulnerability can cascade into broad unauthorized access when multiple security controls are missing. The following takeaways highlight the key defensive gaps and hardening priorities.
Least-privilege IAM for workload roles:The webdev role’s access to Amazon Bedrock across multiple Regions had no business justification for a web application workload, which the customer confirmed during the investigation. Apply least-privilege principles to EC2 instance roles by scoping permissions to only the services and actions the application requires. Use AWS IAM Access Analyzer to identify unused permissions and tighten policies proactively. Overly permissive roles transform a single application vulnerability into broad lateral movement across unrelated services.
IMDSv1 compared to IMDSv2: Organizations must immediately switch to IMDSv2 and disable IMDSv1 across their entire cloud infrastructure. The ec2RoleDelivery: “1.0" field in the logs explicitly confirms the use of IMDSv1, which permits credential retrieval without an authentication token. This architectural weakness makes SSRF-based credential theft trivial, because a web application flaw that can make an outbound request is enough to read the role’s temporary credentials with no further authentication. Transitioning to IMDSv2 mitigates this attack surface by enforcing local, session-based tokens, effectively breaking the threat actor’s exploitation chain. In this scenario, IMDSv2 alone would have stopped the attack at its first step.
Region-based defense evasion signals a deliberate operator: The shift from us-east-1 to us-east-2 for Amazon Bedrock access wasn’t incidental. Threat actors move between Regions because monitoring, alerting, and access controls are often configured inconsistently across them, and activity in a secondary Region is more likely to go unnoticed. This kind of cross-Region movement is a marker of operational security awareness rather than opportunistic access, and it should raise the priority of an investigation. Treat consistent detection coverage across all Regions, including the ones you do not actively use, as a baseline requirement.
Interface switching and permission probing reveal the threat actor’s method: This event chain reveals a threat actor comfortable moving between AWS interfaces and testing boundaries before committing. The failed CreateUser attempt was systematic probing to understand the scope of the harvested credentials, and when IAM actions were denied, the threat actor pivoted to a service the role could actually reach. The combination of programmatic access through the AWS CLI and interactive console access demonstrates the same adaptability. Recognizing this pattern of probe, adapt, and pivot helps responders anticipate the next move instead of reacting to each event in isolation.
AI services need visibility beyond CloudTrail: Amazon Bedrock and other AI services are high-value targets, and CloudTrail alone doesn’t capture the whole story. CloudTrail records who called Amazon Bedrock and whether the call succeeded, but not what was asked or answered. Enable Amazon Bedrock model invocation logging to capture full prompts and responses for compliance auditing. For agent-based workloads, Amazon Bedrock AgentCore Observability, built on AWS Distro for OpenTelemetry (ADOT), provides session-level traces showing tool execution order and latency. Consider also enabling Amazon GuardDuty AI Protection, which analyzes Amazon Bedrock-related CloudTrail activity to detect anomalous invocations, cost harvesting, and prompt injection attempts. Correlating these signals—CloudTrail, Model Invocation Logging, and agent telemetry—gives investigators the complete picture. For implementation guidance, see Monitoring and Auditing AI Workloads on AWS.
Advanced forensic indicators and evasion techniques
Beyond the specific attack patterns in this scenario, investigators should be aware of several evasion techniques that threat actors use to confuse defenders and blend into legitimate activity. The top three that we observe across incident response with customers are:
Root user compared to IAM user named root: When you first create an AWS account, you begin with a single sign-in identity that has complete access to all AWS services and resources in the account. This identity is called the AWS account root user. In some previous investigations, threat actors have also created IAM users in an AWS account named root. The difference is visible in the type field of the userIdentity element of the CloudTrail log record, which indicates the type of user that logged the record.
Role and user name imitation: Threat actors attempt defense evasion by creating names for IAM users and roles that imitate those reserved for use by AWS. For example, the service-linked role AWSServiceRoleForSupport is a unique IAM role linked directly to AWS Support. Threat actors have created roles with the name AWSServiceRoIeforSupport (note the use of an upper-case letter I instead of a lower-case letter l in Role) in an attempt to trick users into thinking actions taken by this role have been performed by AWS Support.
Users named HIDDEN_DUE_TO_SECURITY_REASONS: The userName field contains the string HIDDEN_DUE_TO_SECURITY_REASONS when the recorded event is a console sign-in failure caused by incorrect user name input. CloudTrail doesn’t record the contents in this case because the text could contain sensitive information. However, threat actors have used this string as an actual username to trick investigators into thinking the name has been obfuscated. This technique is usually associated with a corresponding CreateUser or CreateRole CloudTrail event.
Conclusion and next steps
CloudTrail event fields help security teams identify identities with unintended access, track threat actor actions, and remediate affected resources. Understanding fields like userIdentity, eventName, and sourceIPAddress improves incident investigation and threat detection. Implementing best practices such as enabling comprehensive logging, using Amazon Athena for analysis, securing logs, and automating responses helps ensure that CloudTrail serves as a robust forensic and incident response tool.
If you suspect unauthorized activity in your AWS environment, AWS Security Incident Response is available to help. The service continuously monitors and triages findings from Amazon GuardDuty and third-party security tools integrated through AWS Security Hub, automatically filtering alerts to surface the most relevant events. In addition to proactive triage, customers can initiate security cases through the service. You can choose to handle these cases internally or receive support from the Security Incident Response Team (SIRT), a dedicated group of security experts available at all times to assist with investigation, containment, and recovery throughout the incident lifecycle.
Additional resources
The following resources provide further guidance on securing your AWS environment and strengthening your investigative capabilities.
If you have feedback about this post, submit comments in the Comments section below.
The collective thoughts of the interwebz
Manage Consent
To provide the best experiences, we use technologies like cookies to store and/or access device information. Consenting to these technologies will allow us to process data such as browsing behavior or unique IDs on this site. Not consenting or withdrawing consent, may adversely affect certain features and functions.
Functional
Always active
The technical storage or access is strictly necessary for the legitimate purpose of enabling the use of a specific service explicitly requested by the subscriber or user, or for the sole purpose of carrying out the transmission of a communication over an electronic communications network.
Preferences
The technical storage or access is necessary for the legitimate purpose of storing preferences that are not requested by the subscriber or user.
Statistics
The technical storage or access that is used exclusively for statistical purposes.The technical storage or access that is used exclusively for anonymous statistical purposes. Without a subpoena, voluntary compliance on the part of your Internet Service Provider, or additional records from a third party, information stored or retrieved for this purpose alone cannot usually be used to identify you.
Marketing
The technical storage or access is required to create user profiles to send advertising, or to track the user on a website or across several websites for similar marketing purposes.